246
Historical Reporting Manual OMEGAMON II ® for CICS Version 520 GC32-9243-00 October 2001 Candle Corporation 201 North Douglas Street El Segundo, California 90245

Historical Reporting ManualOMEGAMON II® for CICS
Version 520
GC32-9243-00
October 2001
Candle Corporation201 North Douglas Street
El Segundo, California 90245

2 OMEGAMON II for CICS Historical Reporting Guide, Version 520
Registered trademarks and service marks of Candle Corporation: AF/OPERATOR, AF/PERFORMER, AF/REMOTE, Availability Command Center, Candle, Candle Command Center, Candle Direct logo, Candle Electronic Customer Support, Candle logo, Candle Management Server, Candle Management Workstation, Candle Technologies, CL/CONFERENCE, CL/SUPERSESSION, CommandWatch, CT, CT/Data Server, CT/DS, DELTAMON, eBA*ServiceMonitor, eBA*ServiceNetwork, ETEWatch, IntelliWatch, IntelliWatch Pinnacle, MQSecure, MQView, OMEGACENTER, OMEGAMON, OMEGAMON/e, OMEGAMON II, OMEGAMON Monitoring Agent, OMEGAVIEW, OMEGAVIEW II, PQEdit, Solutions for Networked Applications, Solutions for Networked Businesses, and Transplex.Trademarks and service marks of Candle Corporation: Alert Adapter, Alert Adapter Plus, Alert Emitter, AMS, Amsys, AutoBridge, AUTOMATED FACILITIES, Availability Management Systems, Candle Alert, Candle Business Partner Logo, Candle Command Center/SentinelManager, Candle CommandPro, CandleLight, CandleNet, CandleNet 2000, CandleNet Command Center, CandleNet eBP, CandleNet eBP Access, CandleNet eBP Administrator, CandleNet eBP Broker Access, CandleNet eBP Configuration, CandleNet eBP Connector, CandleNet eBP File Transfer, CandleNet eBP Host Connect, CandleNet eBP Object Access, CandleNet eBP Object Browser, CandleNet eBP Secure Access, CandleNet eBP Service Directory, CandleNet eBP Universal Connector, CandleNet eBP Workflow Access, CandleNet eBusiness Assurance, CandleNet eBusiness Exchange, CandleNet eBusiness Platform, CandleNet eBusiness Platform Administrator, CandleNet eBusiness Platform Connector, CandleNet eBusiness Platform Connectors, CandleNet eBusiness Platform Powered by Roma Technology, CandleNet eBusiness Platform Service Directory, CandleNet Portal, CCC, CCP, CEBA, CECS, CICAT, CL/ENGINE, CL/GATEWAY, CL/TECHNOLOGY, CMS, CMW, Command & Control, Connect-Notes, Connect-Two, CSA ANALYZER, CT/ALS, CT/Application Logic Services, CT/DCS, CT/Distributed Computing Services, CT/Engine, CT/Implementation Services, CT/IX, CT/Workbench, CT/Workstation Server, CT/WS, �DB Logo, �DB/DASD, �DB/EXPLAIN, �DB/MIGRATOR, �DB/QUICKCHANGE, �DB/QUICKCOMPARE, �DB/SMU, �DB/Tools, �DB/WORKBENCH, Design Network, DEXAN, e2e, eBA, eBAA, eBAAuditor, eBAN, eBANetwork, eBAAPractice, eBP, eBusiness Assurance, eBusiness Assurance Network, eBusiness at the speed of light, eBusiness at the speed of light logo, eBusiness Exchange, eBusiness Institute, eBX, End-to-End, ENTERPRISE, Enterprise Candle Command Center, Enterprise Candle Management Workstation, Enterprise Reporter Plus, EPILOG, ER+, ERPNet, ESRA, ETEWatch Customizer, HostBridge, InterFlow, Candle InterFlow, Lava Console, MessageMate, Messaging Mastered, Millennium Management Blueprint, MMNA, MQADMIN, MQEdit, MQEXPERT, MQMON, NBX, NetGlue, NetGlue Extra, NetMirror, NetScheduler, OMA, OMC Gateway, OMC Status Manager, OMEGACENTER Bridge, OMEGACENTER Gateway, OMEGACENTER Status Manager, OMEGAMON Management Center, OSM, PC COMPANION, Performance Pac, PowerQ, PQConfiguration, PQScope, Response Time Network, Roma, Roma Application Manager, Roma Broker, Roma BSP, Roma Connector, Roma Developer, Roma FS/A, Roma FS/Access, RomaNet, Roma Network, Roma Object Access, Roma Secure, Roma WF/Access, Roma Workflow Access, RTA, RTN, SentinelManager, Somerset, Somerset Systems, Status Monitor, The Millennium Alliance, The Millennium Alliance logo, The Millennium Management Network Alliance, TMA2000, Tracer, Unified Directory Services, Volcano and ZCopy.Trademarks and registered trademarks of other companies: AIX, DB2, MQSeries and WebSphere are registered trademarks of International Business Machines Corporation. SAP is a registered trademark and R/3 is a trademark of SAP AG. UNIX is a registered trademark in the U.S. and other countries, licensed exclusively through X/Open Company Ltd. HP-UX is a trademark of Hewlett-Packard Company. SunOS is a trademark of Sun Microsystems, Inc. All other company and product names used herein are trademarks or registered trademarks of their respective companies.
Copyright © October 2001, Candle Corporation, a California corporation. All rights reserved. International rights secured.
Threaded Environment for AS/400, Patent No. 5,504,898; Data Server with Data Probes Employing Predicate Tests in Rule Statements (Event Driven Sampling), Patent No. 5,615,359; MVS/ESA Message Transport System Using the XCF Coupling Facility, Patent No. 5,754,856; Intelligent Remote Agent for Computer Performance Monitoring, Patent No. 5,781,703; Data Server with Event Driven Sampling, Patent No. 5,809,238; Threaded Environment for Computer Systems Without Native Threading Support, Patent No. 5,835,763; Object Procedure Messaging Facility, Patent No. 5,848,234; End-to-End Response Time Measurement for Computer Programs, Patent No. 5,991,705; Communications on a Network, Patent Pending; Improved Message Queuing Based Network Computing Architecture, Patent Pending; User Interface for System Management Applications, Patent Pending.
NOTICE: This documentation is provided with RESTRICTED RIGHTS. Use, duplication, or disclosure by the Government is subject to restrictions set forth in the applicable license agreement and/or the applicable government rights clause.This documentation contains confidential, proprietary information of Candle Corporation that is licensed for your internal use only. Any unauthorized use, duplication, or disclosure is unlawful.

Contents 3
Tables . . . . . . . . . . . . . . . . . . . . . . . . . . . . . . . . . . . . . . . . . . . . . . . . . . . . . . . . . . . . . .7
Figures . . . . . . . . . . . . . . . . . . . . . . . . . . . . . . . . . . . . . . . . . . . . . . . . . . . . . . . . . . . . . .9
Preface . . . . . . . . . . . . . . . . . . . . . . . . . . . . . . . . . . . . . . . . . . . . . . . . . . . . . . . . . . . . .11About This Book . . . . . . . . . . . . . . . . . . . . . . . . . . . . . . . . . . . . . . . . . . . . . . . . . . . . . .12Adobe Portable Document Format . . . . . . . . . . . . . . . . . . . . . . . . . . . . . . . . . . . . . . . .14Documentation Conventions. . . . . . . . . . . . . . . . . . . . . . . . . . . . . . . . . . . . . . . . . . . . .15
What’s New . . . . . . . . . . . . . . . . . . . . . . . . . . . . . . . . . . . . . . . . . . . . . . . . . . . . . . . . . . . . .17New Features and Enhancements . . . . . . . . . . . . . . . . . . . . . . . . . . . . . . . . . . . . . . . . .18
Chapter 1. Introduction . . . . . . . . . . . . . . . . . . . . . . . . . . . . . . . . . . . . . . . . . . . . . . . . . . .21Historical Reporting Process . . . . . . . . . . . . . . . . . . . . . . . . . . . . . . . . . . . . . . . . . . . . .22SAS Reporting Considerations . . . . . . . . . . . . . . . . . . . . . . . . . . . . . . . . . . . . . . . . . . .24Interval Record Analysis . . . . . . . . . . . . . . . . . . . . . . . . . . . . . . . . . . . . . . . . . . . . . . . .25
Chapter 2. Collecting and Storing Historical Data . . . . . . . . . . . . . . . . . . . . . . . . . . . . . . .27Background. . . . . . . . . . . . . . . . . . . . . . . . . . . . . . . . . . . . . . . . . . . . . . . . . . . . . . . . . .28Initializing the CICS and OMEGAMON II Address Spaces . . . . . . . . . . . . . . . . . . . . . . .30Collecting Data . . . . . . . . . . . . . . . . . . . . . . . . . . . . . . . . . . . . . . . . . . . . . . . . . . . . . . .31Preparing for Conversion . . . . . . . . . . . . . . . . . . . . . . . . . . . . . . . . . . . . . . . . . . . . . . .32
Chapter 3. Converting SMF Data. . . . . . . . . . . . . . . . . . . . . . . . . . . . . . . . . . . . . . . . . . . .35Customize the Job to Unload the SMF Dataset . . . . . . . . . . . . . . . . . . . . . . . . . . . . . . .36Customize the Job to Select and Convert SMF Data . . . . . . . . . . . . . . . . . . . . . . . . . . .37Submit the Job to Unload and Convert SMF Data . . . . . . . . . . . . . . . . . . . . . . . . . . . .40Sample Job Output . . . . . . . . . . . . . . . . . . . . . . . . . . . . . . . . . . . . . . . . . . . . . . . . . . . .41
Chapter 4. Requesting Reports . . . . . . . . . . . . . . . . . . . . . . . . . . . . . . . . . . . . . . . . . . . . . .45REPORT and SET Commands . . . . . . . . . . . . . . . . . . . . . . . . . . . . . . . . . . . . . . . . . . .46REPORT and SET Command Options . . . . . . . . . . . . . . . . . . . . . . . . . . . . . . . . . . . . .47Other Commands . . . . . . . . . . . . . . . . . . . . . . . . . . . . . . . . . . . . . . . . . . . . . . . . . . . . .65Samples for Batch Submission . . . . . . . . . . . . . . . . . . . . . . . . . . . . . . . . . . . . . . . . . . .67
Contents

4 OMEGAMON II for CICS Historical Reporting Guide, Version 520
Chapter 5. Sample Reports . . . . . . . . . . . . . . . . . . . . . . . . . . . . . . . . . . . . . . . . . . . . . . . .69Response Time Reports. . . . . . . . . . . . . . . . . . . . . . . . . . . . . . . . . . . . . . . . . . . . . . . . .70Transaction Reports. . . . . . . . . . . . . . . . . . . . . . . . . . . . . . . . . . . . . . . . . . . . . . . . . . . .74Terminal Reports . . . . . . . . . . . . . . . . . . . . . . . . . . . . . . . . . . . . . . . . . . . . . . . . . . . . . .78User ID Reports. . . . . . . . . . . . . . . . . . . . . . . . . . . . . . . . . . . . . . . . . . . . . . . . . . . . . . .80File Reports . . . . . . . . . . . . . . . . . . . . . . . . . . . . . . . . . . . . . . . . . . . . . . . . . . . . . . . . . .82Database Reports . . . . . . . . . . . . . . . . . . . . . . . . . . . . . . . . . . . . . . . . . . . . . . . . . . . . .84Program Reports . . . . . . . . . . . . . . . . . . . . . . . . . . . . . . . . . . . . . . . . . . . . . . . . . . . . . .86System Reports . . . . . . . . . . . . . . . . . . . . . . . . . . . . . . . . . . . . . . . . . . . . . . . . . . . . . . .88List Reports . . . . . . . . . . . . . . . . . . . . . . . . . . . . . . . . . . . . . . . . . . . . . . . . . . . . . . . . . .90Umbrella Options in Reports . . . . . . . . . . . . . . . . . . . . . . . . . . . . . . . . . . . . . . . . . . . . .92Field Headings . . . . . . . . . . . . . . . . . . . . . . . . . . . . . . . . . . . . . . . . . . . . . . . . . . . . . . .94
Chapter 6. Interval Record Collector and Problem Reporter . . . . . . . . . . . . . . . . . . . . . . .101Interval Record Collection . . . . . . . . . . . . . . . . . . . . . . . . . . . . . . . . . . . . . . . . . . . . . .102Problem Reporter . . . . . . . . . . . . . . . . . . . . . . . . . . . . . . . . . . . . . . . . . . . . . . . . . . . .105Sample Report . . . . . . . . . . . . . . . . . . . . . . . . . . . . . . . . . . . . . . . . . . . . . . . . . . . . . .106
Chapter 7. SAS Historical Reporting . . . . . . . . . . . . . . . . . . . . . . . . . . . . . . . . . . . . . . . .121Requirements . . . . . . . . . . . . . . . . . . . . . . . . . . . . . . . . . . . . . . . . . . . . . . . . . . . . . . .122Using SAS . . . . . . . . . . . . . . . . . . . . . . . . . . . . . . . . . . . . . . . . . . . . . . . . . . . . . . . . . .123Overview of the SAS Historical Reporting Process. . . . . . . . . . . . . . . . . . . . . . . . . . . .124Preparing to Run the Sample SAS Reports . . . . . . . . . . . . . . . . . . . . . . . . . . . . . . . . .126Installation Procedures . . . . . . . . . . . . . . . . . . . . . . . . . . . . . . . . . . . . . . . . . . . . . . . .127Customization Procedures . . . . . . . . . . . . . . . . . . . . . . . . . . . . . . . . . . . . . . . . . . . . . .128How the SAS Code Maps the SMF 110 Record. . . . . . . . . . . . . . . . . . . . . . . . . . . . . .130Running the Daily Collection Jobs. . . . . . . . . . . . . . . . . . . . . . . . . . . . . . . . . . . . . . . .132Producing Reports from the SAS DETAIL Dataset . . . . . . . . . . . . . . . . . . . . . . . . . . . .137Producing Reports from the SAS DAILY Dataset . . . . . . . . . . . . . . . . . . . . . . . . . . . . .156Producing Reports through the Generalized Report Writer . . . . . . . . . . . . . . . . . . . . .175Building Response Time Transaction Groups. . . . . . . . . . . . . . . . . . . . . . . . . . . . . . . .184
Appendix A. Reporter Commands . . . . . . . . . . . . . . . . . . . . . . . . . . . . . . . . . . . . . . . . . . .193
Appendix B. Internal Macros and Programs . . . . . . . . . . . . . . . . . . . . . . . . . . . . . . . . . . . .199
Appendix C. Coding User-Defined Exits . . . . . . . . . . . . . . . . . . . . . . . . . . . . . . . . . . . . . . .201Exit Code Examples . . . . . . . . . . . . . . . . . . . . . . . . . . . . . . . . . . . . . . . . . . . . . . . . . .202
Appendix D. Fields Contained in CICSTRAN . . . . . . . . . . . . . . . . . . . . . . . . . . . . . . . . . . .205
Appendix E. Fields Contained in DBD . . . . . . . . . . . . . . . . . . . . . . . . . . . . . . . . . . . . . . . .215
Appendix F. Fields Summarized in the DAILY Dataset . . . . . . . . . . . . . . . . . . . . . . . . . . . .217
Appendix G. Copying SMF Records to a Journal . . . . . . . . . . . . . . . . . . . . . . . . . . . . . . . .221

Contents 5
Appendix H. Guide to Candle Customer Support . . . . . . . . . . . . . . . . . . . . . . . . . . . . . . . .229Base Maintenance Plan . . . . . . . . . . . . . . . . . . . . . . . . . . . . . . . . . . . . . . . . . . . . . . . .230Enhanced Support Services . . . . . . . . . . . . . . . . . . . . . . . . . . . . . . . . . . . . . . . . . . . .234Customer Support Contact Information. . . . . . . . . . . . . . . . . . . . . . . . . . . . . . . . . . . .235
Index . . . . . . . . . . . . . . . . . . . . . . . . . . . . . . . . . . . . . . . . . . . . . . . . . . . . . . . . . . . .237

6 OMEGAMON II for CICS Historical Reporting Guide, Version 520

Tables 7
Table 1. Symbols in Command Syntax . . . . . . . . . . . . . . . . . . . . . . . . . . . . . . . . . . . . . . . . . . . .16Table 2. Initializing the CICS and OMEGAMON II Address Spaces . . . . . . . . . . . . . . . . . . . . . . .30Table 3. Data Collection Options . . . . . . . . . . . . . . . . . . . . . . . . . . . . . . . . . . . . . . . . . . . . . . . .31Table 4. Generating a Dictionary Record From An Active CICS Region . . . . . . . . . . . . . . . . . . .32Table 5. Generating a Dictionary Record from an Off-Line Utility . . . . . . . . . . . . . . . . . . . . . . . .33Table 6. Report Type Options . . . . . . . . . . . . . . . . . . . . . . . . . . . . . . . . . . . . . . . . . . . . . . . . . . .48Table 7. Date and Time Options . . . . . . . . . . . . . . . . . . . . . . . . . . . . . . . . . . . . . . . . . . . . . . . . .49Table 8. DDnames for Batch Reporting. . . . . . . . . . . . . . . . . . . . . . . . . . . . . . . . . . . . . . . . . . . .67Table 9. Report Request Commands. . . . . . . . . . . . . . . . . . . . . . . . . . . . . . . . . . . . . . . . . . . . .193
Table 10. Report Type Options . . . . . . . . . . . . . . . . . . . . . . . . . . . . . . . . . . . . . . . . . . . . . . . . . .193Table 11. Report Date Options . . . . . . . . . . . . . . . . . . . . . . . . . . . . . . . . . . . . . . . . . . . . . . . . . .194Table 12. Report Date Option. . . . . . . . . . . . . . . . . . . . . . . . . . . . . . . . . . . . . . . . . . . . . . . . . . .195Table 13. Groups Using the SET Command . . . . . . . . . . . . . . . . . . . . . . . . . . . . . . . . . . . . . . . .195Table 14. SET and REPORT Command Options and Defaults . . . . . . . . . . . . . . . . . . . . . . . . . .195Table 15. Options Available for each Report Type. . . . . . . . . . . . . . . . . . . . . . . . . . . . . . . . . . . .196Table 16. Fields Available in CICSTRAN . . . . . . . . . . . . . . . . . . . . . . . . . . . . . . . . . . . . . . . . . .205Table 17. Fields Available in DBD. . . . . . . . . . . . . . . . . . . . . . . . . . . . . . . . . . . . . . . . . . . . . . . .215Table 18. Transaction Summary Information and SAS Variables. . . . . . . . . . . . . . . . . . . . . . . . .217
Tables

8 OMEGAMON II for CICS Historical Reporting Guide, Version 520

Figures 9
FIGURE 1. Historical Reporting Process Flow . . . . . . . . . . . . . . . . . . . . . . . . . . . . . . . . . . . . . . . . .22FIGURE 2. Sample Job for Unloading and Converting SMF Data . . . . . . . . . . . . . . . . . . . . . . . . . .36FIGURE 3. Sample Output Job Using Converted SMF Data . . . . . . . . . . . . . . . . . . . . . . . . . . . . . .41FIGURE 4. Sample PAGESEP Output. . . . . . . . . . . . . . . . . . . . . . . . . . . . . . . . . . . . . . . . . . . . . . .66FIGURE 5. Response Time Detail Report . . . . . . . . . . . . . . . . . . . . . . . . . . . . . . . . . . . . . . . . . . . .71FIGURE 6. Daily Response Time Graph . . . . . . . . . . . . . . . . . . . . . . . . . . . . . . . . . . . . . . . . . . . . .72FIGURE 6. Daily Response Time Graph (continued) . . . . . . . . . . . . . . . . . . . . . . . . . . . . . . . . . . . .73FIGURE 7. Transaction Detail Report . . . . . . . . . . . . . . . . . . . . . . . . . . . . . . . . . . . . . . . . . . . . . . .75FIGURE 8. Daily Transaction Volume Graph . . . . . . . . . . . . . . . . . . . . . . . . . . . . . . . . . . . . . . . . .76FIGURE 8. Daily Transaction Volume Graph (continued) . . . . . . . . . . . . . . . . . . . . . . . . . . . . . . . .77FIGURE 9. Terminal Detail Report . . . . . . . . . . . . . . . . . . . . . . . . . . . . . . . . . . . . . . . . . . . . . . . . .79
FIGURE 10. User ID Detail Report . . . . . . . . . . . . . . . . . . . . . . . . . . . . . . . . . . . . . . . . . . . . . . . . . .81FIGURE 11. File Requests By Transaction Detail Report . . . . . . . . . . . . . . . . . . . . . . . . . . . . . . . . . .83FIGURE 12. Database Requests By Transaction Detail Report. . . . . . . . . . . . . . . . . . . . . . . . . . . . . .85FIGURE 13. Program Detail Report. . . . . . . . . . . . . . . . . . . . . . . . . . . . . . . . . . . . . . . . . . . . . . . . . .87FIGURE 14. System Detail Report. . . . . . . . . . . . . . . . . . . . . . . . . . . . . . . . . . . . . . . . . . . . . . . . . . .89FIGURE 15. List Report . . . . . . . . . . . . . . . . . . . . . . . . . . . . . . . . . . . . . . . . . . . . . . . . . . . . . . . . . .91FIGURE 16. Transaction Detail Report . . . . . . . . . . . . . . . . . . . . . . . . . . . . . . . . . . . . . . . . . . . . . . .93FIGURE 17. Interval Recording Pop-up Window. . . . . . . . . . . . . . . . . . . . . . . . . . . . . . . . . . . . . . .102FIGURE 18. Control Interval Recording Collector Panel . . . . . . . . . . . . . . . . . . . . . . . . . . . . . . . . .103FIGURE 19. Problem Report Title Page. . . . . . . . . . . . . . . . . . . . . . . . . . . . . . . . . . . . . . . . . . . . . .106FIGURE 20. Problem Report Groups Report. . . . . . . . . . . . . . . . . . . . . . . . . . . . . . . . . . . . . . . . . .108FIGURE 21. Problem Report Response Time History Graph . . . . . . . . . . . . . . . . . . . . . . . . . . . . . .109FIGURE 22. Problem Report Bottleneck Analysis Graph . . . . . . . . . . . . . . . . . . . . . . . . . . . . . . . . .110FIGURE 23. Problem Report Exception Report . . . . . . . . . . . . . . . . . . . . . . . . . . . . . . . . . . . . . . . .111FIGURE 24. Problem Report CPU Subanalysis . . . . . . . . . . . . . . . . . . . . . . . . . . . . . . . . . . . . . . . .112FIGURE 25. Problem Report Paging Subsystem Subanalysis. . . . . . . . . . . . . . . . . . . . . . . . . . . . . .112FIGURE 26. Problem Report DSA Subanalysis for CICS/ESA 3.3 . . . . . . . . . . . . . . . . . . . . . . . . . .113FIGURE 27. Problem Report DSA Subanalysis for CICS 4.1 . . . . . . . . . . . . . . . . . . . . . . . . . . . . . .114FIGURE 28. Problem Report DLI Subanalysis. . . . . . . . . . . . . . . . . . . . . . . . . . . . . . . . . . . . . . . . .115FIGURE 29. Problem Report Temporary Storage Subanalysis . . . . . . . . . . . . . . . . . . . . . . . . . . . . .115FIGURE 30. Problem Report Class Max Tasks Subanalysis . . . . . . . . . . . . . . . . . . . . . . . . . . . . . . .115FIGURE 31. Problem Report VSAM Subanalysis. . . . . . . . . . . . . . . . . . . . . . . . . . . . . . . . . . . . . . .116FIGURE 32. Problem Report CICS Enqueue Subanalysis . . . . . . . . . . . . . . . . . . . . . . . . . . . . . . .116FIGURE 33. Problem Report CICS File Subanalysis . . . . . . . . . . . . . . . . . . . . . . . . . . . . . . . . . . . .117FIGURE 34. Problem Report Journal Control Subanalysis . . . . . . . . . . . . . . . . . . . . . . . . . . . . . . .117FIGURE 35. Problem Report Destination Queue Subanalysis . . . . . . . . . . . . . . . . . . . . . . . . . . . . .118FIGURE 36. Problem Report I/O Subsystem Subanalysis . . . . . . . . . . . . . . . . . . . . . . . . . . . . . . . .118FIGURE 37. SAS Historical Reporting Process . . . . . . . . . . . . . . . . . . . . . . . . . . . . . . . . . . . . . . . .125FIGURE 38. Standard SMF 110 Record Layouts. . . . . . . . . . . . . . . . . . . . . . . . . . . . . . . . . . . . . . .130
Figures

10 OMEGAMON II for CICS Historical Reporting Guide, Version 520
FIGURE 39. Response Time Statistics by Transaction . . . . . . . . . . . . . . . . . . . . . . . . . . . . . . . . . . .139FIGURE 40. Response Time Statistics by Interval . . . . . . . . . . . . . . . . . . . . . . . . . . . . . . . . . . . . . .140FIGURE 41. Transaction Detail Report . . . . . . . . . . . . . . . . . . . . . . . . . . . . . . . . . . . . . . . . . . . . . .141FIGURE 42. Service Level Report by Transaction Report . . . . . . . . . . . . . . . . . . . . . . . . . . . . . . . .142FIGURE 43. Service Level Report by Interval Report . . . . . . . . . . . . . . . . . . . . . . . . . . . . . . . . . . .143FIGURE 44. Response Time Graphs . . . . . . . . . . . . . . . . . . . . . . . . . . . . . . . . . . . . . . . . . . . . . . . .144FIGURE 44. Response Time Graphs (continued). . . . . . . . . . . . . . . . . . . . . . . . . . . . . . . . . . . . . . .145FIGURE 44. Response Time Graphs (continued). . . . . . . . . . . . . . . . . . . . . . . . . . . . . . . . . . . . . . .145FIGURE 44. Response Time Graphs (continued). . . . . . . . . . . . . . . . . . . . . . . . . . . . . . . . . . . . . . .145FIGURE 45. Response Time and VSAM/DB Activity by Transaction Report . . . . . . . . . . . . . . . . . .146FIGURE 46. Response Time and VSAM/DB Activity by Interval Report . . . . . . . . . . . . . . . . . . . . .147FIGURE 47. Response Time Distribution by Transaction Report . . . . . . . . . . . . . . . . . . . . . . . . . . .148FIGURE 48. Storage Utilization Statistics Report . . . . . . . . . . . . . . . . . . . . . . . . . . . . . . . . . . . . . . .148FIGURE 49. Region Summary Report. . . . . . . . . . . . . . . . . . . . . . . . . . . . . . . . . . . . . . . . . . . . . . .149FIGURE 50. Database/File Response Time Statistics by Transaction Report . . . . . . . . . . . . . . . . . .150FIGURE 51. Chart of Average Response Time by Interval Report . . . . . . . . . . . . . . . . . . . . . . . . . .151FIGURE 52. Chart of Average User CPU Time by Interval . . . . . . . . . . . . . . . . . . . . . . . . . . . . . . .152FIGURE 53. Chart of Average Response Time by Interval within Group . . . . . . . . . . . . . . . . . . . . .153FIGURE 54. Chart of Total User CPU Time by Interval . . . . . . . . . . . . . . . . . . . . . . . . . . . . . . . . . .154FIGURE 55. Chart of Total User CPU Time by Interval within Group . . . . . . . . . . . . . . . . . . . . . . .155FIGURE 56. Response Time Statistics by Transaction Report . . . . . . . . . . . . . . . . . . . . . . . . . . . . .158FIGURE 57. Response Time Statistics by Hour Report . . . . . . . . . . . . . . . . . . . . . . . . . . . . . . . . . .159FIGURE 58. Service Level Report by Transaction Report . . . . . . . . . . . . . . . . . . . . . . . . . . . . . . . .160FIGURE 59. Service Level Report by Hour Report . . . . . . . . . . . . . . . . . . . . . . . . . . . . . . . . . . . . .161FIGURE 60. Response Time Graphs . . . . . . . . . . . . . . . . . . . . . . . . . . . . . . . . . . . . . . . . . . . . . . . .162FIGURE 61. Response Time Graphs (continued). . . . . . . . . . . . . . . . . . . . . . . . . . . . . . . . . . . . . . .163FIGURE 61. Response Time Graphs (continued). . . . . . . . . . . . . . . . . . . . . . . . . . . . . . . . . . . . . . .163FIGURE 62. Response Time and VSAM/DB Activity by Transaction Report . . . . . . . . . . . . . . . . . .164FIGURE 63. Response Time and VSAM/DB Activity by Hour Report . . . . . . . . . . . . . . . . . . . . . . .165FIGURE 64. Region Summary Report. . . . . . . . . . . . . . . . . . . . . . . . . . . . . . . . . . . . . . . . . . . . . . .166FIGURE 65. Chart of Average Response Time by Hour . . . . . . . . . . . . . . . . . . . . . . . . . . . . . . . . .167FIGURE 66. Chart of Average Response Time by Hour within Group. . . . . . . . . . . . . . . . . . . . . . .168FIGURE 67. Chart of Total CPU Time by Hour . . . . . . . . . . . . . . . . . . . . . . . . . . . . . . . . . . . . . . . .170FIGURE 68. Chart of Total User CPU Time by Hour within Group . . . . . . . . . . . . . . . . . . . . . . . . .171FIGURE 69. Chart of Average Response Time by Day . . . . . . . . . . . . . . . . . . . . . . . . . . . . . . . . . .173FIGURE 70. Chart of Average Response Time by Day within Group. . . . . . . . . . . . . . . . . . . . . . . .174FIGURE 71. Abend Code Summary Report . . . . . . . . . . . . . . . . . . . . . . . . . . . . . . . . . . . . . . . . . .180FIGURE 72. Umbrella Transaction Report . . . . . . . . . . . . . . . . . . . . . . . . . . . . . . . . . . . . . . . . . . . .181FIGURE 73. TRP3 Equivalent Report . . . . . . . . . . . . . . . . . . . . . . . . . . . . . . . . . . . . . . . . . . . . . . .183FIGURE 74. Response Time Profile for Transactions by CICS Region . . . . . . . . . . . . . . . . . . . . . . .187FIGURE 74. Response Time Profile for Transactions by CICS Region (continued). . . . . . . . . . . . . .188FIGURE 74. Response Time Profile for Transactions by CICS Region (continued). . . . . . . . . . . . . .189FIGURE 75. Parameter Definitions List . . . . . . . . . . . . . . . . . . . . . . . . . . . . . . . . . . . . . . . . . . . . . .190FIGURE 75. Parameter Definitions List (continued). . . . . . . . . . . . . . . . . . . . . . . . . . . . . . . . . . . . .191FIGURE 76. Journal Record General Format . . . . . . . . . . . . . . . . . . . . . . . . . . . . . . . . . . . . . . . . .227

Preface 11
Preface
The book discusses the OMEGAMON II® for CICS historical reporting feature and describes the numerous reports that you can obtain. It explains how to produce the reports and provides examples of them. This reporting feature enables you to generate information on you system that includes
� Response Time Reports
� Transaction Reports
� Terminal Reports
� User ID Reports
� File Reports
� Database Reports
� List Reports
� Program Reports
� System Reports
This book also covers the use of SAS historical reporting, user-defined exits, and internal macros and programs.
P

About This Book
12 OMEGAMON II for CICS Historical Reporting Guide, Version 520
About This BookThis guide shows you how to use the SMF records created by OMEGAMON II for CICS
(hereafter referred to as OMEGAMON II) to produce historical reports.
In addition, this guide documents the SAS sample reports that Candle® provides, as well as the SMF and SAS database record layouts.
For information about how to use OMEGAMON II and how to set monitoring options, see the OMEGAMON II for CICS User’s Guide.
Who should read this bookThis guide is written for those who are interested in producing reports or graphs of network usage and activity over selected time periods. This audience includes network performance analysts, network capacity planners, and network designers.
Documentation set information� OMEGAMON II for CICS Configuration and Customization Guide, V520, C251-6363.
� OMEGAMON II for CICS User’s Guide, V520, C254-6312.
� OMEGAMON II for CICS Reference Manual, V520, Volume I, C253-6313.
� OMEGAMON II for CICS Reference Manual, V520, Volume II, C253-6314.
� OMEGAMON II for CICS Historical Reporting Manual, V520, C299-6313.
� Message Manual, OMEGAMON II/OMEGAVIEW, WO52-6238, W052-6239, WO52-6240.
� OMEGAMON II for CICS Problem Determination Manual, V520, C257-6315.
� OMEGAMON II for CICS Quick Reference Manual, V520, C299-6370.
� End-to-End Response Time Feature (ETE), V500, ET53-5586.
Where to look for more informationFor more information related to this product, please see the
� technical documentation CD-ROM that came with your product
� technical documentation information available at www.candle.com
� online help provided with this product
Ordering additional documentationTo order additional product manuals, contact your Candle Customer Support representative.

Preface 13
About This Book
We would like to hear from youCandle welcomes your comments and suggestions for changes or additions to the documentation set. A user comment form, located at the back of each manual, provides simple instructions for communicating with the Candle Information Development department.
You can also send email to [email protected]. Please include "OMEGAMON II® for CICS Historical Reporting Guide” in the subject line.

Adobe Portable Document Format
14 OMEGAMON II for CICS Historical Reporting Guide, Version 520
Adobe Portable Document Format
Printing this bookCandle supplies documentation in the Adobe Portable Document Format (PDF). The Adobe Acrobat Reader will print PDF documents with the fonts, formatting, and graphics in the original document. To print a Candle document, do the following:
1. Specify the print options for your system. From the Acrobat Reader Menu bar, select File > Page Setup… and make your selections. A setting of 300 dpi is highly recommended as is duplex printing if your printer supports this option.
2. To start printing, select File > Print... on the Acrobat Reader Menu bar.
3. On the Print pop-up, select one of the Print Range options for� All� Current page� Pages from: [ ] to: [ ]
4. (Optional). Select the Shrink to Fit option if you need to fit oversize pages to the paper size currently loaded on your printer.
Printing problems?The print quality of your output is ultimately determined by your printer. Sometimes printing problems can occur. If you experience printing problems, potential areas to check are:� settings for your printer and printer driver. (The dpi settings for both your driver and
printer should be the same. A setting of 300 dpi is recommended.)� the printer driver you are using. (You may need a different printer driver or the Universal
Printer driver from Adobe. This free printer driver is available at www.adobe.com.)� the halftone/graphics color adjustment for printing color on black and white printers (check
the printer properties under Start > Settings > Printer). For more information, see the online help for the Acrobat Reader.
� the amount of available memory in your printer. (Insufficient memory can cause a document or graphics to fail to print.)
For additional information on printing problems, refer to the documentation for your printer or contact your printer manufacturer.
Contacting AdobeIf additional information is needed about Adobe Acrobat Reader or printing problems, see the Readme.pdf file that ships with Adobe Acrobat Reader or contact Adobe at www.adobe.com.

Preface 15
Documentation Conventions
Documentation Conventions
IntroductionCandle documentation adheres to accepted typographical conventions for command syntax. Conventions specific to Candle documentation are discussed in the following sections.
Panels and figuresThe panels and figures in this document are representations. Actual product panels may differ.
Revision barsRevision bars (|) may appear in the left margin to identify new or updated material.
Variables and literalsIn examples of command syntax, uppercase letters are actual values (literals) that the user should type; lowercase letters are used for variables that represent data supplied by the user. Default values are underscored.
LOGON APPLID (cccccccc)
In the above example, you type LOGON APPLID followed by an application identifier (represented by cccccccc) within parentheses.
Note: In ordinary text, variable names appear in italics.

Documentation Conventions
16 OMEGAMON II for CICS Historical Reporting Guide, Version 520
SymbolsThe following symbols may appear in command syntax:
Table 1. Symbols in Command Syntax
Symbol Usage
| The “or” symbol is used to denote a choice. Either the argument on the left or the argument on the right may be used. Example:
YES | NOIn this example, YES or NO may be specified.
[ ] Denotes optional arguments. Those arguments not enclosed in square brackets are required. Example:
APPLDEST DEST [ALTDEST]In this example, DEST is a required argument and ALTDEST is optional.
{ } Some documents use braces to denote required arguments, or to group arguments for clarity. Example:
COMPARE {workload} -REPORT={SUMMARY | HISTOGRAM}
The workload variable is required. The REPORT keyword must be specified with a value of SUMMARY or HISTOGRAM.
_ Default values are underscored. Example:
COPY infile outfile - [COMPRESS={YES | NO}]In this example, the COMPRESS keyword is optional. If specified, the only valid values are YES or NO. If omitted, the default is YES.

What’s New 17
What’s New
This section details the new features and enhancements incorporated into OMEGAMON II for CICS Version 520.
HighlightsOMEGAMON II for CICS Version 520 includes the following new features and enhancements:
� Allows printing a SNAPSHOT of a CICS region.
� Added the Exchange Logname Status exception.
� Added Transaction Server 1.3 Task Monitoring Data and Statistics
� Enhanced RLIM Interval Settings
� Added User Defined Event Monitoring
� Enhanced ADABAS statistics reporting
� Added support for ADABAS 7.1
The following features are no longer supported by OMEGAMON II for CICS Version 520:
� Support for CICS/ESA Version 3.x.x
� Documentation for BookManager no longer supported
W

New Features and Enhancements
18 OMEGAMON II for CICS Historical Reporting Guide, Version 520
New Features and Enhancements
Print SNAPSHOT of CICS regionThe SNAP facility is composed of a sequence of pre-defined OMEGAMON II screens which contain every OMEGAMON Classic command you can use to report on the state and content of your CICS region.
This facility is now accessible in the C2/CUA interface to OMEGAMON II for CICS product. A new item was added to the Options/Controls pulldown which upon selection will route the output to the JES print queue under the common interface (Menu System) Job JCL.
Exchange Logname status exceptionExchange Logname status is a new OMEGAMON II for CICS exception added to the list of existing ones under the MRO/ISC. Once enabled the MRO/ISC light will alert users when the Exchange Log Name or XLN is 'Notdone' between two, APPC type connected, CICS systems.
Online Global facilityThe Online Global Facility is introduced to eliminate the requirement for re-assembly and linking of the product global data area module(s). Using the C2/CUA interface, this facility will enable users to SAVE the currently running global module to the library defined by the RKC2GLBL DD statement.
Using the Candle Installation/Configuration Assistance Tool (CICAT), users can edit and verify any of the existing global data area modules. Note that utilities are provided to migrate the previous versions of the global data area to the new format in V520. Refer to the OMEGAMON II for CICS Configuration and Customization Guide for more information.
Transaction Server 1.3 task monitoring data and statisticsThe OMEGAMON II for CICS product has been enhanced to support the new performance monitoring data and statistics introduced in Transaction Server release 1.3. Non-3270 statistics such as WEB Send and Receive request counts are now displayable in active transactions as well as the Online History (ONDV) component.
The Task Time Analysis screens have been enhanced to include the newly introduced performance monitoring data such as JVM elapsed and suspend times, IMS(DBCTL) wait time, DB2 wait times, Socket I/O wait time, Global ENQ delay, among others. In addition, the Task Timings panels have been redesigned to display a categorical view of Timings attributed to a transaction or task.

What’s New 19
New Features and Enhancements
Resource Limiting (RLIM) Interval settingsThe Resource Limiting feature of OMEGAMON II for CICS product has been enhanced to introduce a set of user defined intervals. This enhancement will allow users to activate the previously defined rules based on a user modifiable interval. The new RLIM interval may be set in three different ways:
� by TIME
� by the number of EXEC CICS calls made by a task
� by the number of Database calls made by a task
User Defined Event MonitoringThe User Defined Event Monitoring (USREVNT1) describes a way for application programmers to clock and count the number of requests being made to an in-house database, program or procedure. Similar to other Third Party Products such as ADABAS, DATACOM, IDMS and SUPRA, this facility may be enabled from the Options pulldown in the C2/CUA interface under the CICS File/Database collection option.
ADABAS statistics reportingADABAS statistics in the OMEGAMON II for CICS product have been traditionally based on DB ID and File number. With the specification of a new operand in the product's global data area module, users may request OMEGAMON to collect statistics based on DB ID, File number, and Command Code.
Support for ADABAS V7.1The new release of ADABAS V7.1 supports DB IDs greater than 255. The relevant OMEGAMON II for CICS product panels were enhanced to display a 5-digit database ID.
Online documentationWith version 520, Candle Corporation has moved OMEGAMON II for CICS manuals from IBM BookMaster to Adobe FrameMaker. This move was made to better enable us to address our customers’ needs by providing tools that enhance productivity.
One of the results of the move is that it is no longer possible to create BookManager versions of the OMEGAMON II for CICS manuals. However, the manuals remain available online in the Adobe PDF version on CD-ROM and are also available on the Candle Corporation website at www.Candle.com.
The documentation CD being provided with this release has robust and easy-to-use search capabilities. You can search for information in multiple volumes, multiple versions, and across products. The CD also provides easy setup of search indexes with a single click of the mouse.
If you want to order printed copies of the documentation, please contact your Candle Support Services representative.

New Features and Enhancements
20 OMEGAMON II for CICS Historical Reporting Guide, Version 520

Introduction 21
Introduction
OverviewThe OMEGAMON II historical reporter enables you to collect and analyze data about the historical performance of your CICS™ subsystem. The data is collected while CICS is running; the reports are produced in a batch environment to minimize the impact on your system.
The collected data consists of a record for each completed transaction or conversation within a task, as well as general system data gathered at CICS start and stop times.
Using the collected data, you can generate historical reports that analyze the following areas of performance and capacity:
� response time
� transaction volume and resource use
� file request types by transaction
� database usage by transaction
� program usage
� CICS environmental data
� usage by terminal
� usage by user ID
When you request a report, you can select from options that allow you to produce reports customized to the performance monitoring and/or capacity planning needs of your company. Detail and summary data are available for every type of report, and you can produce response time and transaction reports in graphic as well as numeric format. You can limit output by time period or other selection criteria (for example, resource thresholds).
Chapter Contents
Historical Reporting Process . . . . . . . . . . . . . . . . . . . . . . . . . . . . . . . . . . . . . . . . . . . . .22
SAS Reporting Considerations . . . . . . . . . . . . . . . . . . . . . . . . . . . . . . . . . . . . . . . . . . .24Interval Record Analysis . . . . . . . . . . . . . . . . . . . . . . . . . . . . . . . . . . . . . . . . . . . . . . . .25
1

Historical Reporting Process
22 OMEGAMON II for CICS Historical Reporting Guide, Version 520
Historical Reporting ProcessOMEGAMON II and the CICS monitoring facility collect performance data from your CICS regions and write the data to an SMF dataset. You then unload the data to a sequential file and use the OMEGAMON II conversion utility to convert the data to a format usable by the reporter. At this point the historical reporter can use the data to produce reports.
Alternatively, you can write to a CICS journal. For more information, see “Customer Support Contact Information” on page 235.
“Historical Reporting Process Flow” on page 22 graphically represents this process in detail.
FIGURE 1. Historical Reporting Process Flow
The remainder of this document explains how to perform the activities shown in this flow diagram.
+--------------------+-+--------------------+-+--------------------+-+----------------------+| CICS monitoring | | OMEGAMON II | | CICS monitoring | | OMEGAMON II || facility collects | | collects additional| | facility collects | | collects performance || performance and | | performance data | | performance and | | data and CICS data || optional user data | | for CICS/ESA. | | optional user data | | for CICS/MVS. || for CICS/ESA. | | | | for CICS/MVS. | | |+--------------------+ +--------------------+ +--------------------+ +----------------------+
| | | || | | |+-----------------| +--------+ |
| | |+--------------------+ +--------------------+| CICS monitoring | | OMEGAMON II writes || facility writes | | CICS/MVS data to || performance data to| | SMF dataset from || SMF dataset (type | | CICS/MVS. || 110 records). | | |+--------------------+ +--------------------+
| || |+--------------------------------------------+
|+-----------------------+| IBM or user utility || unloads SMF data to a |---------+| sequential file. | || | |+-----------------------+ |
| |+-----------------------+ || OMEGAMON II conversion| |
+------------| utility converts |---------|| | unloaded SMF data to | || | reporter format. | || +-----------------------+ || || || || |
+-----------------------+ +---------------------+| Historical reporter | | User-written || produces reports. | | programs produce || (Does not include | | reports. || optional user data.) | | |+-----------------------+ +---------------------+

Introduction 23
Historical Reporting Process
Note: Before you can use SMF to store historical data, you must perform some SMF-related customization operations to OMEGAMON II. The OMEGAMON II for CICS Configuration and Customization Guide provides the information you need to customize OMEGAMON II.
The data collection process takes place in the CICS and OMEGAMON II address spaces. You must activate both address spaces before collection can begin.
As Figure 1 on page 22 shows, CICS and OMEGAMON II collect a record for each CICS transaction (and, optionally, each conversation). Most historical reports focus on these transaction records. Basic MVS and CICS data for system reports is also collected. Additionally, you can collect your own data to be stored on the user extension of the SMF record.
SAS Reporting Considerations
24 OMEGAMON II for CICS Historical Reporting Guide, Version 520
SAS Reporting ConsiderationsAs an alternative to SLR or the Historical Reporter for reporting SMF data, the SAS support package allows you to use the OMEGAMON II historical component to generate historical reports based on your CICS performance data. These reports can help you identify potential performance problems and test the effects of your changes to CICS performance parameters. Daily, weekly, and monthly reports display your data at varying levels of detail. This facility is especially useful for reporting CICS performance to upper management and for making long-range CICS tuning decisions.

Introduction 25
Interval Record Analysis
Interval Record AnalysisThe interval record analysis feature collects task response time and bottleneck and resource information in one-minute interval records, which are written to SMF. You can analyze this information by using a batch job supplied with OMEGAMON II or using a report writer such as SAS. This feature is described in “Interval Record Collector and Problem Reporter” on page 101.

Interval Record Analysis
26 OMEGAMON II for CICS Historical Reporting Guide, Version 520

Collecting and Storing Historical Data 27
Collecting and Storing Historical Data
OverviewBefore you can convert data to a format that the historical reporter can use to produce historical reports of your system’s performance, you must collect and store the data you plan to convert. This chapter explains the three parts of this process:
� initializing the CICS and OMEGAMON II address spaces
� collecting the data
� preparing the data for conversion
“Converting SMF Data” on page 35 describes the actual conversion process.
Chapter Contents
Background. . . . . . . . . . . . . . . . . . . . . . . . . . . . . . . . . . . . . . . . . . . . . . . . . . . . . . . . . .28
Initializing the CICS and OMEGAMON II Address Spaces . . . . . . . . . . . . . . . . . . . . . . .30Collecting Data . . . . . . . . . . . . . . . . . . . . . . . . . . . . . . . . . . . . . . . . . . . . . . . . . . . . . . .31Preparing for Conversion . . . . . . . . . . . . . . . . . . . . . . . . . . . . . . . . . . . . . . . . . . . . . . .32
2

Background
28 OMEGAMON II for CICS Historical Reporting Guide, Version 520
BackgroundAs Figure 1 on page 22 shows, CICS and OMEGAMON II collect data for each transaction or, optionally, each conversation. After the transaction or conversation completes, the data may be sent to the OMEGAMON II address space for Online Data Viewing (ONDV). It may also be written to SMF for subsequent processing by a reporting program or system or both. Settings in the global data area (described in the OMEGAMON II for CICS Configuration and Customization Guide) determine the actions OMEGAMON II takes.
Defining record typesDifferent types of data can be collected and written to SMF. The converter and reporter programs supplied by OMEGAMON II use three types of records:
� system records
� performance records
� dictionary records
System records
System records are written at OMEGAMON II initialization and termination in a CICS region. These records contain MVS performance data and copies of CICS control blocks, such as the CSA and SIT. These records are written to SMF with a default record type of 255. This record type can be changed by customizing the global data area. Refer to the OMEGAMON II for CICS Configuration and Customization Guide for more information.
Performance records
A performance record is produced for each execution of a transaction (or conversation). These records are collected in a buffer and written when the buffer fills. These records contain performance data gathered during the execution of the transaction and include items such as start and end times, CPU consumption, and clocks and counters for accesses to CICS resources. These records are always SMF type 110 records. OMEGAMON II for CICS Configuration and Customization Guide does not support journal-written CICS/MVS™ performance records.
Note: If CICS or OMEGAMON II terminate abnormally, buffered data may be lost.
Dictionary records
Dictionary records describe the layout of data stored in performance records. Any program which processes SMF type 110 performance records must first read a dictionary record to allow it to determine the location of data items in the performance record. Dictionary records are always SMF type 110 records.
Other records
OMEGAMON II (default type 255) records may be produced that are not used by the converter or reporter programs supplied by OMEGAMON II. Refer to the OMEGAMON II for CICS Configuration and Customization Guide for more information.

Collecting and Storing Historical Data 29
Background
Data collection processThe data collection process occurs in the CICS and OMEGAMON II address spaces. The process of collection and storage consists of
� initializing the CICS and OMEGAMON II address spaces
� collecting SMF data

Initializing the CICS and OMEGAMON II Address Spaces
30 OMEGAMON II for CICS Historical Reporting Guide, Version 520
Initializing the CICS and OMEGAMON II Address SpacesThe first step in data collection and storage is to prepare CICS and OMEGAMON II to receive data. The following table shows you how to initialize their address spaces.
Note: The nn variable in CANSOCnn designates an address space from 00–55 in which to run the started task. For example, CANSOC03 specifies 03 as the address space.
Table 2. Initializing the CICS and OMEGAMON II Address Spaces
Address Space Action Refer to the…
CICS � Run the KOCOME00 program in the PLTPI or
� Issue an OMEG INIT command
OMEGAMON II for CICS Configuration and Customization Guide
CICS/ESA Add the Candle User Event Monitoring Points to the MCT
OMEGAMON II for CICS Configuration and Customization Guide
OMEGAMON II Include a member in the RKANPAR dataset that� is modeled after the CANSOCnnmember
which Candle supplies in RKANPAR� has the same name as your OMEGAMON II
started task or job� contains the EXEC KOCXMIT command
OMEGAMON II for CICS Configuration and Customization Guide
Both Specify YES to the following parameters in the USER_EVENT_MONITORING parameter of the global data area:� SMFCICS2=YES for CICS/MVS� CICSESA_SMF_RECORDS=YES for
CICS/ESA
OMEGAMON II for CICS Configuration and Customization Guide

Collecting and Storing Historical Data 31
Collecting Data
Collecting DataOMEGAMON II automatically collects and stores data if you have correctly initialized the OMEGAMON II address space and OMEGAMON II components in the CICS address space. OMEGAMON II comes with the USER_EVENT_MONITORING parameter SMFCICS and CICSESA_SMF_RECORDS parameters set to YES in the global data area for CICS/ESA™ and NO for CICS/MVS, as described in the OMEGAMON II for CICS Configuration and Customization Guide. Unless you change the parameter to NO in CICS/ESA, data statistics always will be automatically collected and written to SMF.
Some users may need to collect data for response time analysis or use the online viewing component without writing the data to SMF. If you do not intend to perform batch reporting on SMF data, change the SMFCICS2 and SMFCICS3 parameters to NO. Collection will still occur; however, the data will not be written to SMF.
Collection commandsIf you are using CICS/ESA, you may enter one of the following master terminal commands from your terminal to control collection:
� CEMT SET MON (ON) or (OFF)
� CEMT SET MON PER|NOPER
Collection summaryUse this table to determine the extent of data collection depending on your initialization and parameter choices at initialization.
Table 3. Data Collection Options
IF you did… AND you specified… THEN data will…
not initialize the address spaces
NO within the parameter not be collected nor written to SMF
initialize the address spaces NO within the parameter be collected but not written to SMF
initialize the address spaces YES within the parameter be collected and written to SMF

Preparing for Conversion
32 OMEGAMON II for CICS Historical Reporting Guide, Version 520
Preparing for ConversionThis section explains how to ensure SMF data is complete so that it can be converted into a format that the historical reporter can process. Converting the SMF record data requires you to either:
� make sure the first record you read occurred at or before CICS was initialized, or
� generate a dictionary record
Generating a dictionary recordBefore processing any Type 110 performance records, the converter needs to have read a dictionary record, which describes the format of the performance records.
You can generate a dictionary record either from
� an active CICS region or
� an off-line utility
Generating from an active CICS region
The table below explains the times at which a dictionary record is generated from an active CICS region.
Table 4. Generating a Dictionary Record From An Active CICS Region
IF your records are... THEN, the record is generated...
CICS/MVS and OMEGAMON-produced
� When KOCOME00 is run in the PLTPI� When the OMEG INIT command is issued
CICS/ESA At initialization, if CMF performance recording is enabled in the SIT (see the System Definition Guide for your site’s CICS release)� After initialization, if performance monitoring is not
enabled in the SIT but KOCOME00 is run- in the PLTPI - by issuing the OMEG INIT command
� After initialization, by issuingCEMT SET MON PER ON(if performance monitoring was previously off)

Collecting and Storing Historical Data 33
Preparing for Conversion
Generating from an off-line utility
Review the references below to generate a dictionary record from an off-line utility.
Once the dictionary record has been generated, concatenate it in front of the SMF records being processed by a conversion job (see “Converting SMF Data” on page 35 for more information about running a conversion job).
Procedure for CICS-produced CICS/MVS records
Follow these steps to create and extract a dictionary record for a CICS/MVS region when CICS produces the performance records:
Next stepThe next part of the historical reporting process is converting data in the SMF dataset to the format used by the historical reporter. This discussion appears in the next chapter,“Converting SMF Data” on page 35.
Table 5. Generating a Dictionary Record from an Off-Line Utility
IF your performance records are Refer to the…
CICS/MVS and OMEGAMON-produced KOCSMFDI member in the TKANSAM dataset
CICS/MVS and CICS-produced See “Procedure for CICS-produced CICS/MVS records” on page 33.
CICS/ESA The DFHMNDUP facility as described in the CICS Operations Guide.
Step Action
1 If you do not normally write CICS/MVS SMF data to a user journal, define and initialize a user journal, and define the journal in the CICS Journal Control Table (JCT). (See the CICS Operations Guide.)The JCT entry for the journal should specify:
JTYPE=DISK1,FORMAT=SMF
2 Modify the Monitoring Control Table (MCT) to direct the monitoring performance data to this journal for the run of CICS used to produce the dictionary record.
3 Initialize CICS using the modified MCT and JCT and with performance monitoring active, and then shut down CICS.
4 Run the KC2EXTRT member in the TKANSAM dataset to extract the dictionary record to its own dataset.
This member invokes the DFHJUP utility, which is described in the CICS Operations Guide.

Preparing for Conversion
34 OMEGAMON II for CICS Historical Reporting Guide, Version 520

Converting SMF Data 35
Converting SMF Data
OverviewThis chapter explains how to use the OMEGAMON II conversion utility to convert data in the SMF dataset to the format used by the OMEGAMON II historical reporter.
The OMEGAMON II conversion utility does not read directly from the active SMF dataset. The SMF data must first be unloaded to a sequential DASD or tape file, where it can be used as input to the conversion utility.
The Candle distribution tape includes two jobs you can use to convert your SMF data:
� Job KOCZSMFU both unloads the SMF data to a sequential file and converts the data to the format required by the historical reporter.
� If you already use your own SMF-unload utility, use job KOCZSMFC just to convert the unloaded SMF data to historical reporter format.
Both jobs are contained in the thilev.TKANSAM dataset.
The unload-conversion process consists of the following three steps.
1. Customize the job to unload the SMF dataset to a sequential file.
2. Customize the job to select and convert the SMF data.
3. Submit the job to unload, select, and convert the SMF data.
Chapter ContentsCustomize the Job to Unload the SMF Dataset . . . . . . . . . . . . . . . . . . . . . . . . . . . . . . . . . . . . . . . . .36Customize the Job to Select and Convert SMF Data . . . . . . . . . . . . . . . . . . . . . . . . . . . . . . . . . . . . .37Submit the Job to Unload and Convert SMF Data . . . . . . . . . . . . . . . . . . . . . . . . . . . . . . . . . . . . . .40Sample Job Output. . . . . . . . . . . . . . . . . . . . . . . . . . . . . . . . . . . . . . . . . . . . . . . . . . . . . . . . . . . . . .41
3

Customize the Job to Unload the SMF Dataset
36 OMEGAMON II for CICS Historical Reporting Guide, Version 520
Customize the Job to Unload the SMF DatasetThe first section of job KOCZSMFU in the thilev.TKANSAM dataset unloads the SMF data to a sequential file. Figure 2 on page 36 shows the JCL used to unload and convert SMF data.
Note: If you used your own utility to unload the SMF dataset, skip this section and go directly to “Customize the Job to Select and Convert SMF Data” on page 37.
FIGURE 2. Sample Job for Unloading and Converting SMF Data
The //STEP1 line begins the unload process. The information below will help you customize the DD statements in this section.
Statement Description
//STEP1 The PGM parameter calls the standard IBM utility IFASMFDP to unload the SMF dataset.
//INPUT Replace SYS1.MANx with the name of the SMF dataset to unload.
//OUTPUT If you choose to keep the output dataset, change the parameters DSN, DISP, and VOL.
//SYSIN The TYPE parameter selects only performance (type 110) and system (type 255) data from the SMF dataset. CICS performance records default to type 110. System records are whatever the user specified during installation in the GLOBAL_OPTIONS parameter for the SMFID parameter in the global data area. Valid values for system record types are between 128 and 255. (See the OMEGAMON II for CICS Configuration and Customization Guide for details.)
//CONVERT JOB//STEP1 EXEC PGM=IFASMFDP//INPUT DD DSN=SYS1.MANx,DISP=SHR,AMP=(‘BUFSP=65536’)//OUTPUT DD DSN=&&TEMP,DISP=(NEW,PASS),UNIT=SYSDA,// VOL=SER=USER01,SPACE=...//SYSPRINT DD SYSOUT=A//SYSIN DD *
INDD(INPUT,OPTIONS(DUMP))OUTDD(OUTPUT,TYPE(110,255))
/*//STEP2 EXEC PGM=KOCSMF31//STEPLIB DD DSN=rhilev.RKANMOD,DISP=SHR//INPUT DD DSN=dictionaryrecorddsn,DISP=SHR// DD DSN=&&TEMP,DISP=(OLD,DELETE),UNIT=SYSDA//OUTPUT DD DSN=hilev.CICS.HISTORIC.DATA,DISP=(NEW,CATLG),
SPACE=(CYL,(5,2)),UNIT=3380,VOL=SER=USER01,DCB=(RECFM=VB,BLKSIZE=23476)
//SYSOUT DD SYSOUT=A//SYSPRINT DD SYSOUT=A//SYSIN DD *COMPRESS YESGMTOFF WEST,8INCLUDE APPLID=xxxxxxxx,xxxxxxxx,...DATE START=mm/dd/yy,STOP=mm/dd/yyTIME START=hh:mm,STOP=hh:mmSYSTYPE 255PERFTYPE 200BASICID xxxxxxxDLIID xxxxxxxDB2ID xxxxxxx/*
Converting SMF Data 37
Customize the Job to Select and Convert SMF Data
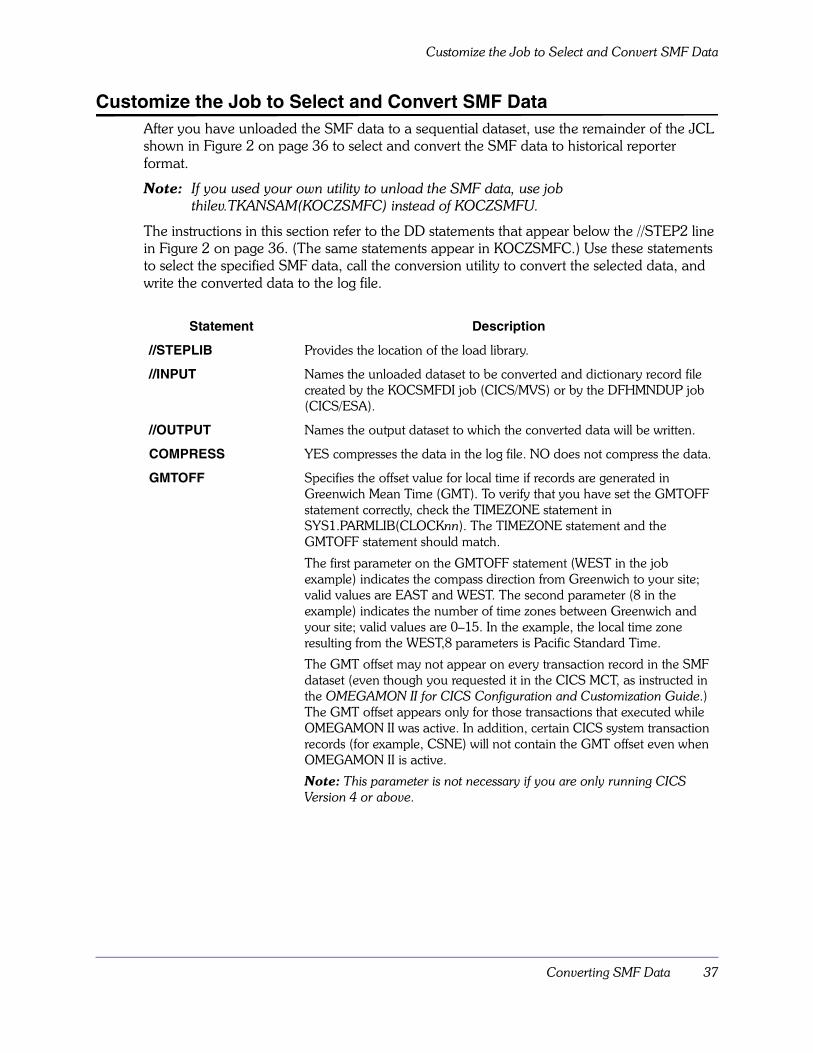
Customize the Job to Select and Convert SMF DataAfter you have unloaded the SMF data to a sequential dataset, use the remainder of the JCL shown in Figure 2 on page 36 to select and convert the SMF data to historical reporter format.
Note: If you used your own utility to unload the SMF data, use job thilev.TKANSAM(KOCZSMFC) instead of KOCZSMFU.
The instructions in this section refer to the DD statements that appear below the //STEP2 line in Figure 2 on page 36. (The same statements appear in KOCZSMFC.) Use these statements to select the specified SMF data, call the conversion utility to convert the selected data, and write the converted data to the log file.
Statement Description
//STEPLIB Provides the location of the load library.
//INPUT Names the unloaded dataset to be converted and dictionary record file created by the KOCSMFDI job (CICS/MVS) or by the DFHMNDUP job (CICS/ESA).
//OUTPUT Names the output dataset to which the converted data will be written.
COMPRESS YES compresses the data in the log file. NO does not compress the data.
GMTOFF Specifies the offset value for local time if records are generated in Greenwich Mean Time (GMT). To verify that you have set the GMTOFF statement correctly, check the TIMEZONE statement in SYS1.PARMLIB(CLOCKnn). The TIMEZONE statement and the GMTOFF statement should match.
The first parameter on the GMTOFF statement (WEST in the job example) indicates the compass direction from Greenwich to your site; valid values are EAST and WEST. The second parameter (8 in the example) indicates the number of time zones between Greenwich and your site; valid values are 0–15. In the example, the local time zone resulting from the WEST,8 parameters is Pacific Standard Time.
The GMT offset may not appear on every transaction record in the SMF dataset (even though you requested it in the CICS MCT, as instructed in the OMEGAMON II for CICS Configuration and Customization Guide.) The GMT offset appears only for those transactions that executed while OMEGAMON II was active. In addition, certain CICS system transaction records (for example, CSNE) will not contain the GMT offset even when OMEGAMON II is active.
Note: This parameter is not necessary if you are only running CICS Version 4 or above.

Customize the Job to Select and Convert SMF Data
38 OMEGAMON II for CICS Historical Reporting Guide, Version 520
INCLUDE/EXCLUDE If you use an INCLUDE statement, only those records that satisfy the criteria stated here are selected from the SMF dataset. The default is to include all records. The only parameter permitted on this statement is APPLID. APPLID is the generic VTAM APPLID of the CICS region that you want to include or exclude.
If you use an EXCLUDE statement, all records are selected except those that satisfy the criteria stated here.
The INCLUDE and EXCLUDE statements are mutually exclusive. If you use an INCLUDE statement, you cannot use an EXCLUDE statement, and vice versa.
DATE If no date is entered, record selection begins with the first (or earliest) record in the input and ends with the last (or most recent) record in the input.
TIME If no time is entered, start time will be 00:00 and end time will be 24:00.
Note: Multiple transaction records may accumulate before they are written to an SMF record. Date and time selections are made according to the date-time stamp on the SMF header record. As a result, remember the following two points:� Though the date and time on the SMF record meet your selection
criteria, some transaction records within the SMF record may not exactly meet these criteria.
� Date/time selections should be entered in local time (the time used on the SMF header record.)
RANGE/BAND BAND selects data from the start time to the end time, separately for each specified date range. RANGE, the default, selects data from the start time and date straight through to the end time and date. BAND and RANGE are mutually exclusive.
SYSTYPE This statement gives the type for the system records. It is the same number used above in the //STEP1 //SYSIN statement.
Note: SYSTYPE and PERFTYPE should have different values.
PERFTYPE (CICS/MVS) This statement provides a way of renumbering type 110 performance records. In the example above, the statement PERFTYPE=200 will process type 200 records as though they were type 110. See the OMEGAMON II for CICS Configuration and Customization Guide for more information.
Note: SYSTYPE and PERFTYPE should have different values.

Converting SMF Data 39
Customize the Job to Select and Convert SMF Data
Note: Include the following three statements only if:
� during installation, you changed the default entry names of the BASIC, DLI, and DB2® sections in the USER_EVENT_MONITORING parameter definition and
� you are using CICS/ESA version 3 or above
BASICID The parameter on this statement must be whatever you specified during installation on the BASIC_SECTION parameter in the USER_EVENT_MONITORING parameter.
DLIID The parameter on this statement must be whatever you specified during installation on the DLI_SECTION parameter in the USER_EVENT_MONITORING parameter.
DB2ID The parameter on this statement must be whatever you specified during installation on the DB2_SECTION parameter in the USER_EVENT_MONITORING parameter.

Submit the Job to Unload and Convert SMF Data
40 OMEGAMON II for CICS Historical Reporting Guide, Version 520
Submit the Job to Unload and Convert SMF DataAfter you have finished customizing job KOCZSMFU or KOCZSMFC, submit the job. When you submit either job for batch processing, you generate two output files: the log file containing the converted data (named on the OUTPUT statement) and a message log (named on the SYSPRINT statement).
If the conversion utility detects that you have excluded data that usually appears on reports, a message is written to the message log stating this fact.
Note: The conversion utility requires a CICS monitoring facility dictionary record at the top of the SMF input file in order to perform its processing. If no dictionary record is present, the conversion utility will produce an error message, ignore processing of performance records, and indicate on the termination report the number of ignored performance records. We recommend that you maintain a file that contains only a dictionary record. Then you can concatenate this file in front of your sequential, unloaded SMF file used as input to KOCSMF31. See Figure 2 on page 36.
See “Generating a dictionary record” on page 32 for instructions on creating a dictionary record.

Converting SMF Data 41
Sample Job Output
Sample Job OutputThis section describes the format of the output you can expect when you run the conversion job illustrated in Figure 2 on page 36.
FIGURE 3. Sample Output Job Using Converted SMF Data
The sample output shown in Figure 2 on page 36 provides the following information:
TOTAL SMF RECORDS READ IN
The total number of SMF records read in from an IFASMFDP job (see Figure 2 on page 36) plus any dictionary records you may have concatenated with this data.
CICS/OMEGAMON MONITOR RECORDS
The total number of CICS and/or OMEGAMON monitoring records, which include accounting, exception, and performance records. Both OMEGAMON II and CICS CMF block multiple logical records into a single physical monitor record.
*************************************************************** TOTAL SMF RECORDS READ IN . . . . . . . . . : 44
* CICS/OMEGAMON MONITOR RECORDS . . . . : 42
* OMEGAMON SYSTEM RECORDS . . . . . . . : NOT SELECTED
* OTHER RECORDS . . . . . . . . . . . . : 2*************************************************************** DICTIONARY DATA SECTIONS READ . . . . . . . : 1
* PERFORMANCE DATA SECTIONS READ . . . . . . . : 220
* PERFORMANCE DATA SECTIONS SELECTED . . . . . : 220
* PERFORMANCE DATA SECTIONS REJECTED . . . . . : 0
* REJECTED BY START DATE/TIME . . . . . : 0
* REJECTED BY END DATE/TIME . . . . . . : 0
* REJECTED BY CICS APPLID . . . . . . . : 0
* REJECTED BECAUSE NO DICTIONARY READ. . : 0*************************************************************** TOTAL OMEGAMON SYSTEM RECORDS SELECTED . . . : 0
* TOTAL OMEGAMON SYSTEM RECORDS REJECTED . . . : 0
* REJECTED BY START DATE/TIME . . . . . : 0
* REJECTED BY END DATE/TIME . . . . . . : 0
* REJECTED BY CICS APPLID . . . . . . . : 0*************************************************************** TOTAL RECORDS WRITTEN (COMPRESSED) . . . . . : 0
* TOTAL RECORDS WRITTEN (UNCOMPRESSED) . . . . : 220
* TOTAL SYSTEM RECORDS WRITTEN . . . . . . . . : 0**************************************************************
Sample Job Output
42 OMEGAMON II for CICS Historical Reporting Guide, Version 520
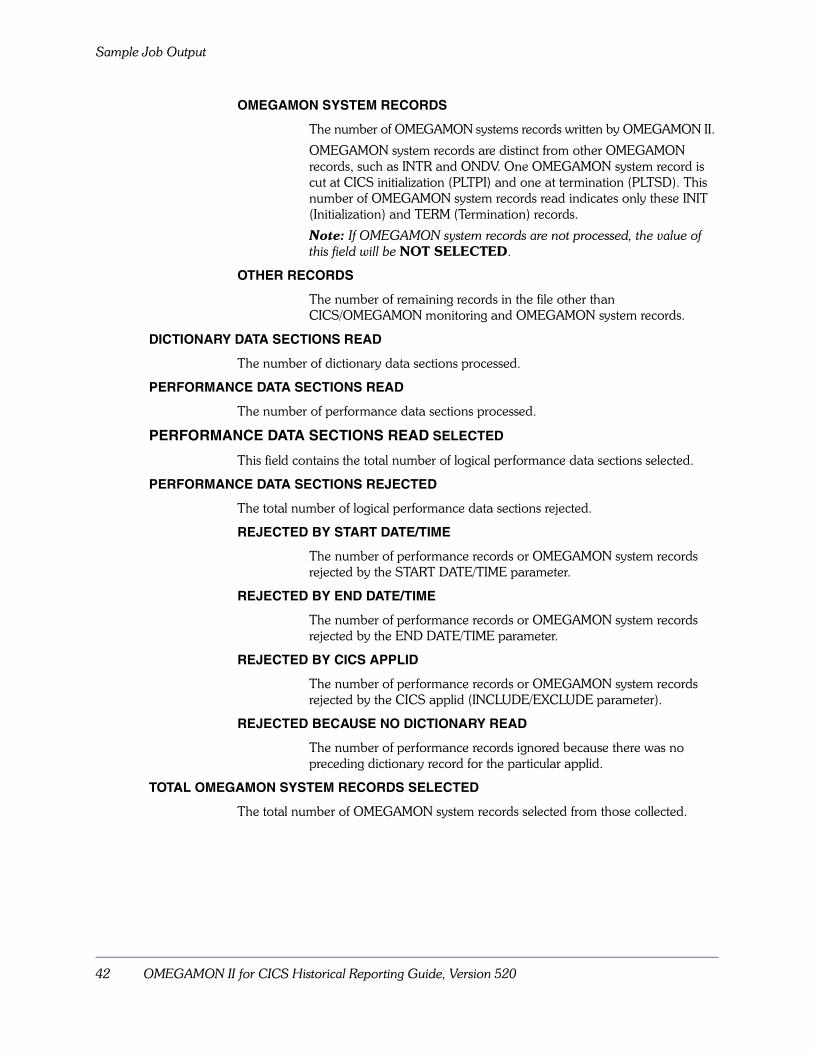
OMEGAMON SYSTEM RECORDS
The number of OMEGAMON systems records written by OMEGAMON II.
OMEGAMON system records are distinct from other OMEGAMON records, such as INTR and ONDV. One OMEGAMON system record is cut at CICS initialization (PLTPI) and one at termination (PLTSD). This number of OMEGAMON system records read indicates only these INIT (Initialization) and TERM (Termination) records.
Note: If OMEGAMON system records are not processed, the value of this field will be NOT SELECTED.
OTHER RECORDS
The number of remaining records in the file other than CICS/OMEGAMON monitoring and OMEGAMON system records.
DICTIONARY DATA SECTIONS READ
The number of dictionary data sections processed.
PERFORMANCE DATA SECTIONS READ
The number of performance data sections processed.
PERFORMANCE DATA SECTIONS READ SELECTED
This field contains the total number of logical performance data sections selected.
PERFORMANCE DATA SECTIONS REJECTED
The total number of logical performance data sections rejected.
REJECTED BY START DATE/TIME
The number of performance records or OMEGAMON system records rejected by the START DATE/TIME parameter.
REJECTED BY END DATE/TIME
The number of performance records or OMEGAMON system records rejected by the END DATE/TIME parameter.
REJECTED BY CICS APPLID
The number of performance records or OMEGAMON system records rejected by the CICS applid (INCLUDE/EXCLUDE parameter).
REJECTED BECAUSE NO DICTIONARY READ
The number of performance records ignored because there was no preceding dictionary record for the particular applid.
TOTAL OMEGAMON SYSTEM RECORDS SELECTED
The total number of OMEGAMON system records selected from those collected.

Converting SMF Data 43
Sample Job Output
TOTAL OMEGAMON SYSTEM RECORDS REJECTED
The total number of OMEGAMON system records rejected based on the following criteria specified on the conversion job:‘� START DATE/TIME parameter� END DATE/TIME parameter� CICS Applid
TOTAL RECORDS WRITTEN (COMPRESSED)
The total number of performance records written by OMEGAMON II if you selected the COMPRESS YES SYSIN parameter in the //STEP2 section of the conversion job.
TOTAL RECORDS WRITTEN (UNCOMPRESSED)
The total number of performance records written by OMEGAMON II if you selected the COMPRESS NO SYSIN parameter in the //STEP2 section of the conversion job.
TOTAL SYSTEM RECORDS WRITTEN
Each OMEGAMON system record is broken into four separate records for historical reporting. The number of records written is four times the total OMEGAMON system records selected.

Sample Job Output
44 OMEGAMON II for CICS Historical Reporting Guide, Version 520

Requesting Reports 45
Requesting Reports
OverviewThis chapter explains how to format reporter commands and submit a report request job.
To produce reports, you must submit a batch job. You can include as many report requests as you like in one job. In fact, combining multiple report requests in a single job is more efficient than executing them separately.
For each report, specify a report type, along with the desired options to control the report form and contents. Default options are used for any options you do not specify. You can establish your own defaults for the job, or accept the established system defaults.
Along with your report requests, you can also request miscellaneous information about the product version installed and maintenance applied.
This chapter is organized as follows:
� “REPORT and SET Commands” on page 46 explains the basic commands you use to establish job defaults and request reports.
� “REPORT and SET Command Options” on page 47 explains the various options you can include in report requests and/or set with the SET command.
� “Other Commands” on page 65 explains the other commands available in report jobs.
� “Samples for Batch Submission” on page 67 explains the files required to submit a report request job.
A summary of commands and options you can use to request a batch report appears in “Reporter Commands” on page 193.
Chapter Contents
REPORT and SET Commands . . . . . . . . . . . . . . . . . . . . . . . . . . . . . . . . . . . . . . . . . . . . . . . . . . . . .46
REPORT and SET Command Options . . . . . . . . . . . . . . . . . . . . . . . . . . . . . . . . . . . . . . . . . . . . . . .47Other Commands . . . . . . . . . . . . . . . . . . . . . . . . . . . . . . . . . . . . . . . . . . . . . . . . . . . . . . . . . . . . . . .65Samples for Batch Submission . . . . . . . . . . . . . . . . . . . . . . . . . . . . . . . . . . . . . . . . . . . . . . . . . . . . .67
4

REPORT and SET Commands
46 OMEGAMON II for CICS Historical Reporting Guide, Version 520
REPORT and SET CommandsTwo basic commands, REPORT and SET, are used in all report request jobs.
� REPORT produces a report.
You must follow this command with a report type option. You can also include options to further control the form and contents of the report, or you can accept the current defaults.
� SET establishes default option values for use in report requests.
The defaults you set with this command apply to all subsequent reports in the job for which you do not specify another value for the option. You must use this command in order to create groups. (See “Group selection” on page 55 for information about groups.) The current defaults are defined with the SET command or, in the absence of any SET, are system-assigned. The default settings for each option are explained under the option definition in this chapter. They are also included in the summary tables in “Reporter Commands” on page 193. You can specify all other options either with this command or in the individual report request with the REPORT command.

Requesting Reports 47
REPORT and SET Command Options
REPORT and SET Command OptionsThree basic types of command options are available:
� Selection options.
� Report type options.
These options allow you to select the type of report. They are used only with the REPORT command. These options allow you to select your reports by time period; by groups of CICS regions; by program, terminal, or transaction group; or by other conditional criteria. You can use them with either the REPORT or SET commands. These options allow you to control different aspects of the report form or presentation. You can use them with either the REPORT or SET commands.
� Presentation options.
The following sections describe each option. For a summary of the default settings for each option, see “Reporter Commands” on page 193.
Report command syntaxUse the following syntax to execute the REPORT command:
REPORT cccc{aaaa bbbb}
where
For example:
REPORT TRANSACTION TODAY DETAIL UMBRELLA(TRANSACTION)
generates a report containing umbrella transactions where
cccc is the report type option, which is required. You can have only one report type.
aaaa represents the selection options, which are optional. You can have multiple selection options, separated by a blank.
bbbb represents the presentation options, which are optional. You can have multiple presentation options, separated by a blank.
TRANSACTION is a report type option
TODAY is a selection option
DETAIL and UMBRELLA(TRANSACTION)
are presentation options

REPORT and SET Command Options
48 OMEGAMON II for CICS Historical Reporting Guide, Version 520
Report type OptionsThis section describes each report type. For examples of reports, see “Sample Reports” on page 69.
Table 6. Report Type Options
Report Type Produces a . . . Example
DBASE database report See OMEGAMON II for CICS Reference Manual
FILE file report See “File Reports” on page 82.
LIST list report of transaction detail records
See “List Reports” on page 90.
PROGRAM program usage report See “Program Reports” on page 86. The short forms of this option are PROG and PGM.
RESPONSE transaction response time report
See “Response Time Reports” on page 70. The short form of this option is RESP.
SYSTEM CICS system report See “System Reports” on page 88. The short form of this option is SYS.
Notes: If you have a job that combines a REPORT SYSTEM command with other REPORT requests, you will get better performance if you put the REPORT SYSTEM request after the other REPORT commands.
TERMINAL terminal usage report See “Terminal Reports” on page 78. The short form of this option is TERM.
TRANSACTION transaction ID report See “Transaction Reports” on page 74. For an example of a TRANSACTION report with the UMBRELLA transactions option in effect, see “Umbrella Options in Reports” on page 92. The short form of this option is TRAN.
USERID user ID usage report See “User ID Reports” on page 80. The short form of this option is UID.

Requesting Reports 49
REPORT and SET Command Options
Selection optionsHistorical reporter commands have options that let you select report output by
� time period
� CICS region; program, terminal, transaction, or user ID groups
� conditional criteria
You can use these options with a REPORT command to select records for an individual report, or you can use them with a SET command to set defaults for a group of reports.
Date and time selection
The following table describes the time and date options and keywords. Following the table is an explanation of the entry formats for these options and some examples of how the different options interact.
Table 7. Date and Time Options
Option Short Description Keywords
BAND BAND Selects data from the start time to the end time, separately for each specified date range. BAND and RANGE are mutually exclusive.
DATEFORM DATE Controls the format in which dates are interpreted and displayed. The default is MMDDYY.
MMDDYY
YYMMDD
DDMMYY
DAYOFWK DAY Selects data only for the specified days. You can abbreviate the operands used with this keyword to an unambiguous short form. For example, you can abbreviate WEDNESDAY to WED or just to W, but you cannot shorten SATURDAY to S, because it could also refer to SUNDAY.
ALL
WEEKDAY or WKDAY
WEEKEND or WKEND
MONDAY
TUESDAY
WEDNESDAY
THURSDAY
FRIDAY
SATURDAY
SUNDAY
ENDDATE EDATE Specifies the end date of the report. If you do not specify an ENDDATE, all data is selected up to the most recent record in the input stream.

REPORT and SET Command Options
50 OMEGAMON II for CICS Historical Reporting Guide, Version 520
ENDTIME ETIME Specifies the end time of the report. If you do not specify an ENDTIME, all data is selected for the specified ENDDATE with a time of 23:59.
LASTMONTH LMN Selects data from the first day to the last day of the previous month.
LASTWEEK LWK Selects data from Monday to Sunday of the previous week.
LASTYEAR LYR Selects data from the first day to the last day of the previous year.
RANGE RANGE (Default) Selects data from the start time and date straight through to the end time and date. BAND and RANGE are mutually exclusive. (The default range is January 1, 1943–December 31, 2042.)
STARTDATE SDATE Specifies the start date of the report. If you specify no STARTDATE, all data is selected up to any ENDDATE and/or ENDTIME.
STARTTIME STIME Specifies the start time of the report. If you specify no STARTTIME, all data is selected from any time on the STARTDATE up to any ENDDATE and/or ENDTIME.
TIMEZONE Displays report time in local or Greenwich Mean Time.
LOCAL
GMT
THISMONTH TMN Selects data from the first day of the current month to the most recent record in the incoming data.
THISWEEK TWK Selects data from the first day (Monday) of the current week to the most recent record in the incoming data.
Table 7. Date and Time Options (continued)
Option Short Description Keywords

Requesting Reports 51
REPORT and SET Command Options
You can enter the dates in either Julian or Gregorian format. The Julian format is yyddd, where yy is the year, and ddd is any number from 00–366 for the day of the year.
Set the Gregorian format that you want to use with the DATEFORM option. DATEFORM determines the format in which dates appear in reports. It is advisable to use DATEFORM only on a SET command, and to specify it as the first keyword, in order to avoid confusing or conflicting data specifications.
DATEFORM also determines the form in which the reporter interprets all six-character selection dates you enter in your job. For example, if you SET DATEFORM to DDMMYY, enter STARTDATE and ENDDATE dates in the same form. However, regardless of what DATEFORM option you set, you can enter any selection date in Julian, five-character form yyddd).
You can also select and display time in either LOCAL time (the default) or Greenwich Mean Time (GMT). The Greenwich Mean Time option can help you correlate activity at sites in different time zones.
You must enter the time in 24-hour format (for example, 1300 instead of 1:00 PM), and you can abbreviate it as follows:
The following examples show how the time-period keywords interact:
REPORT... SDATE(6/14/99) DAY(MON,THUR) STIME(0900) ETIME(1300) -
BAND
THISYEAR TYR Selects data from the first day of the current year to the most recent record in the incoming data.
TODAY TDAY Selects data from the beginning of the current day to the most recent record in the database.
YESTERDAY YDAY Selects data from the beginning of the previous day to the last record of the previous day.
h One-digit hour without a leading zero
hh Two-digit hour
hmm or h:mm Hours and minutes without a leading zero
hhmm or hh:mm Hours and minutes
Table 7. Date and Time Options (continued)
Option Short Description Keywords

REPORT and SET Command Options
52 OMEGAMON II for CICS Historical Reporting Guide, Version 520
This command selects data collected on Mondays and Thursdays from 9:00AM until 1:00PM. The report selects data collected on or after June 14, 1999, and continues reporting until you stop collection, reporting each day separately.
REPORT.... SDATE(99011) STIME(0900) -
EDATE(99018) ETIME(1700) RANGE
This command selects data from 9:00AM on January 11, 1999 until 5:00PM on January 18, 1999.
Relative date and time values
You can specify relative dates and times with the STARTDATE, STARTTIME, ENDDATE, and ENDTIME options. To specify relative dates and times, include a plus sign (+) or a minus sign (-) before the expression to be evaluated. For example, to enter a start date thirty days before the current date, type:
STARTDATE(-30)
You can independently assign a relative value to each unit within a time or date expression. For example:
STARTDATE(-1/+1)
specifies a start date one month before tomorrow. (The -1 in the month position means subtract 1 from the current month; the +1 in the day position means add one to the current day.)
If you enter no sign before a unit, it is assumed to be absolute rather than relative. For example:
STARTDATE(-1/15)
specifies a start date of the 15th day of the previous month.
An entry of +0 or -0 defaults to the current value. For example:
STARTTIME(+0:+15)
specifies a start time of 15 minutes after the current hour.
The relative date and time values provide a great deal of flexibility. However, it is advisable to avoid using several relative values in the same command, because a relative value in one unit can cause a change that 'wraps around' and increments (or decrements) the value of the next unit. For example, if you enter the following start date on March 15,
STARTDATE(-1/-15)
the wrap-around effect results in a start date of January 31.
Follow these guidelines for the use of relative values:
� Relative date values are evaluated in the following order: year, month, day. Relative time values are evaluated in hour, minute, second order.
� A value is considered absolute if it is not preceded by a plus or minus sign.

Requesting Reports 53
REPORT and SET Command Options
� A +0 or -0 entry defaults to the current value (current day, current hour, and so on). If you enter a 0 that is not preceded by a plus or minus sign, it is interpreted as an absolute value.
� You must enter values that are valid for the unit they represent. The valid values are
� Values entered in the same keyword will 'wrap around' if they are found to be outside allowed boundaries. The wrap-around feature does not apply to values entered with different keywords.
You can specify the time period for a given report by entering the date and time options with the REPORT command, or you can set default time periods with the SET command.
Date and time keyword recommendations
The historical reporter has powerful capabilities for filtering data based on date and time using the following keywords: STARTDATE, STARTTIME, ENDDATE, ENDTIME, BAND, and RANGE. There are two key issues.
1. The reporter uses a starting date and time and an ending date and time. If you fail to provide any of these values via keyword input, the reporter will use default values.The default values are STARTDATE(01/01/43), STARTTIME(00:00), ENDDATE(12/31/42), and ENDTIME(23:59). This defines a span of time from January 1, 1943 through December 31, 2042.
2. When the RANGE keyword is in effect, either by default or by specification, the end time value is used only when the end date is reached.
Consider the following scenarios:
1. You want to produce a series of reports for the peak hours for a particular day, for example 09:00 through 16:00 on June 7, 1999. Your input dataset contains all of the data collected for the month of June, 1999. To generate reports for these times, use the following input commands:SET SDATE(06/07/99) STIME(09:00) EDATE(06/07/99) ETIME(16:00)
REPORT TRAN DETAIL
REPORT RESPONSE DETAIL
REPORT FILE DETAIL
REPORT SYSTEM DETAIL
Years 1–99
Months 1–12
Days 1–31
Hours 0–23
Minutes 0–59

REPORT and SET Command Options
54 OMEGAMON II for CICS Historical Reporting Guide, Version 520
The following input commands would not produce the required reports:
SET SDATE(06/07/99) STIME(09:00) ETIME(16:00)
REPORT TRAN DETAIL
REPORT RESPONSE DETAIL
REPORT FILE DETAIL
REPORT SYSTEM DETAIL
You would receive reports that contained data from 09:00 on June 7 through the most recent record in the file. Because you did not specify an end date, the reporter defaults to the no-end-date limit. Because the RANGE option was used by default, the reporter ignores the end time value.
This command stream would generate much unnecessary paper, which could be avoided by adding EDATE(06/07/99) to the SET command.
2. Using the same input dataset as in the previous scenario, you want to produce a series of reports for the peak hours for Monday through Friday, June 7 through June 11, 1999.The proper input commands are
SET BAND SDATE(06/07/99) EDATE(06/11/99) STIME(09:00) ETIME(16:00)
REPORT TRAN DETAIL
REPORT RESPONSE DETAIL
REPORT FILE DETAIL
REPORT SYSTEM DETAIL
The reporter generates the reports you want for times from 9:00a.m. until 4:00p.m., Monday through Friday, June 7 through June 11, 1999.
The following input commands would not produce the required reports:
SET SDATE(06/07/99) EDATE(06/11/99) STIME(09:00) ETIME(16:00)
REPORT TRAN DETAIL
REPORT RESPONSE DETAIL
REPORT FILE DETAIL
REPORT SYSTEM DETAIL
You would receive reports that contain data from 09:00 on June 7th through 16:00 on June 11th.
Because RANGE is the default, the reporter would use the start time for only the first day selected (06/07/99) and the end time for only the last day selected (06/11/99).
If you added the keyword BAND to the SET command, the reporter would generate data for 09:00 through 16:00 on Monday, 09:00 through 16:00 on Tuesday, and so on through the end of the week.

Requesting Reports 55
REPORT and SET Command Options
Group selection
The historical reporter allows you to define groups of CICS regions, programs, terminals, transactions, and/or user IDs to use in report data selection. To define a group, you must use the SET command. Then the REPORT command lets you select the groups you want to report on.
The format for defining a group is as follows:
SET ccccc (nn,bbb,bbb,bbb, -
bbb...)
where
Group types
You can define the following five group types:
� CICSGROUP
� PROGRAMGROUP
� TERMINALGROUP
� TRANSACTIONGROUP
� USERGROUP
These group types are described in detail below.
CICSGROUP: The CICSGROUP group type (which you can also specify as CICSGRP or CGRP) associates a list of CICS job names or VTAM applids with a group identifier.
For SYSTEM reports, the list of names represents CICS job names. For all other reports, the list of names represents the VTAM applids of the CICS regions.
ccccc is the option identifying the group type. The group types are listed and explained in the next section.
nn is the group ID number. You can define one group with each SET command and a total of 30 groups.
bbb is a group value. You can include as many different values as you like in one group. Place a comma after each value (except the last). An asterisk (*) in a pattern acts as a wildcard representing any character. If you include an asterisk as the last character, it can replace any number of characters. You can also include nonprintable values.
minus (-) is a continuation character that extends a line or text string beyond the length of a single line. You must insert a blank space before the continuation character.
Note: Do not leave unnecessary continuation characters at the end of a line. They can cause unexpected concatenations and interrupt the dialog.

REPORT and SET Command Options
56 OMEGAMON II for CICS Historical Reporting Guide, Version 520
For example, the following command stream produces a SYSTEM report for the CICS regions whose job names are CICSJB01 and CICSJB02 and all CICS regions whose job names begin with CICST. In addition, it produces a transaction detail report for all CICS regions whose VTAM applids are CICSVT01, CICSVT02, and CICSVT03; and all CICS regions whose VTAM applids start with CICST.
SET CICSGRP(1,CICSJB01,CICSJB02,CICST*)
SET CICSGRP(2,CICSVT01,CICSVT02,CICSVT03,CICST*)
REPORT SYSTEM CICSGRP(1)
REPORT TRANSACTION DETAIL CICSGRP(2)
PROGRAMGROUP: The PROGRAMGROUP group type (which you can also specify as PROGGRP, PGMGRP, or PGRP) associates a list of program IDs with a group identifier.
If you request umbrella transaction program IDs with the UMBRELLA option, the program group will represent umbrella data areas. See “Umbrella Options in Reports” on page 92.
TERMINALGROUP: The TERMINALGROUP group type (which you can also specify as TERMGRP or TEGRP) associates a list of terminal IDs or LU groups with a group identifier. When you use this option, you must define five parameters in the following format:
SET TERMINALGROUP (nn,(aaaa,b,cccccccc,dddd), ...)
where
If you want to include more than one terminal subsystem in a single group, surround the four subsystem parameters with parentheses. For example:
SET TERMINALGROUP (4,(SYSA,*,L610*,*),(SYS*,*,*,P*))
TRANSACTIONGROUP: The TRANSACTIONGROUP group type (which you can also specify as TRANGRP or TRNGRP) associates a list of transaction IDs with a group identifier. The format of the TRANSACTIONGROUP option is:
SET TRANSACTIONGROUP(nn,aaaa, ...)
where
nn is the group ID.
aaaa is the originating SMF ID of the operating system.
b must be an asterisk (*).
cccccccc is the VTAM LU name.
dddd is the CICS terminal ID.
nn is the group ID.
aaaa is a transaction ID. Separate multiple transaction IDs with a comma.

Requesting Reports 57
REPORT and SET Command Options
Specify multiple lines of transaction IDs with the continuation character (-). You can specify the continuation character anywhere after the last transaction ID on the first line, but it must be at least one space away from the separating comma and not past column 71. For example:
If you request umbrella transactions with the UMBRELLA option, and the umbrella ID field contains an entry other than zero, umbrella transaction IDs will be used for report breaks. Otherwise, CICS transaction IDs will be used.
USERGROUP: The USERGROUP group type (which you can also specify as USERGRP) associates a list of user IDs with a group identifier. The 8-character logon ID is used, if present. The operator ID appears left-justified in the 8-byte field.
Group selection considerations
To select data for a given group in a report, follow the REPORT command with the appropriate group type option, and the group ID in parentheses. For example,
REPORT FILE USERGROUP (1) CICSGROUP (3,4)
will produce a file report that includes any transactions that belong to user group 1, as well as to CICS group 3 or 4.
In a report request, you can select multiple groups of a single type, and/or different types. When you include more than one group of a single type, any transaction that belongs to any of the groups qualifies for the report. (In Boolean logic terms, including multiple groups of the same type represents an OR function.)
When you include more than one type of group in a report request, a transaction must belong to one of the groups of each type to be selected for the report. (In Boolean logic terms, including multiple groups of different types represents an AND function.)
To include a nonprintable value for a group definition, use hex characters in the form of X’xxxxxxxx’ where the xxxxxxxx represents hex digits, that is,
SET USERGRP(1,TDO*,TS*,X’020203’)
You can also include an asterisk (*) as a wildcard in hex values.
Other conditional selection options
Several other options are available, allowing you to further select the records included in your report. You can use them with either SET or REPORT.
� SELECTIF selects records based on threshold conditions.
----+----1----+----2----+----3----+----4----+----5----+----6----+----7--SET TRANGRP(nn,aaaa,aaaa,aaaa,aaaa,aaaa,aaaa,aaaa,aaaa,aaaa,aaaa, -aaaa,aaaa,aaaa,aaaa,aaaa,aaaa,aaaa,aaaa,aaaa,aaaa,aaaa, -
aaaa,aaaa,aaaa)

REPORT and SET Command Options
58 OMEGAMON II for CICS Historical Reporting Guide, Version 520
This option enables you to select records that satisfy criteria you specify concerning performance and resource usage. The format for the SELECTIF option is:
SELECTIF (cccccccc(annnnb),cccccccc,NOcccccccc...)
where:
cccccccc is one of the selection keywords described below. Some keywords (for example, CPU) require threshold values, and are followed by the annnnb parameters. Others (for example, CANCEL) are entered without additional parameters and cause only those records for which the condition is true to be selected. To exclude records for which the condition is true, the keyword is prefaced with a NO (for example, NOCANCEL).
a is > for greater than, or < for less than.
nnnn is a threshold value for the keyword. It can be any value from 0–9999. Values can include up to four figures to the left of the decimal point, and three to the right. Omit the decimal point for whole numbers.
b is used to specify the units used with nnnn. Unit specifiers can be:
S seconds
M minutes
H hours
K 1024 bytes of storage
This parameter is omitted when nnnn represents a simple number, such as a count.

Requesting Reports 59
REPORT and SET Command Options
These are the available selection keywords for the cccccccc parameter of SELECTIF:
You can specify as many selection keywords as you like with SELECTIF. Use a comma to separate keywords. To be included in a report, records must match the conditions for all keywords you include (Boolean AND). Here is an example:
SELECTIF (CPU(>4.5s),IOBR(>10),NOCANCEL)
In this example, the report includes records that had a CPU utilization greater than 4.5 seconds, had more than 10 browse requests, and that terminated normally.
CANCEL Selects transactions that terminated abnormally. NOCANCEL selects transactions that completed normally.
Valid short forms of CANCEL are CAN and ABEND. Valid short forms of NOCANCEL are NOCAN and NOABEND.
CPUTIL CPU utilization. Use the S, M, or H unit specifier with this keyword to specify seconds, minutes, or hours.
The short form of this keyword is CPU.
GETMAIN The number of GETMAINs issued by the transaction.
The short form of this keyword is GETM.
IOADD The number of file control add requests.
The short form of this keyword is IOAD.
IOBROWSE The number of file control browse requests.
The short form of this keyword is IOBR.
IODELETE The number of file control delete requests.
The short form of this keyword is IODL.
IOGET The number of file control get requests.
The short form of this keyword is IOGT.
IOPUT The number of file control put requests.
The short form of this keyword is IOPT.
IOTOTAL The total number of file control requests for a transaction.
The short form of this keyword is IOTL.
RESPONSE Elapsed wall clock time for a transaction response. Use the S, M, or H unit specifier with this keyword to specify seconds, minutes, or hours.
The short form of this keyword is RESP.
STORAGE High-water mark storage acquired below the 16M line (DSA). Use the K unit specifier with this keyword to specify kilobytes.
The short form of this keyword is STOR.
STORAGEX High-water mark storage acquired above the 16M line (XA only). Use the K unit specifier with this keyword to specify kilobytes.
The short form of this keyword is STOX.

REPORT and SET Command Options
60 OMEGAMON II for CICS Historical Reporting Guide, Version 520
The short form of this option is SIF.
� USERREC controls whether or not user records are included in a report.
Note: This option can be used only when reading data that was created by releases of OMEGAMON Version 451 and below.
This option requires one of these arguments:
The short form of this option is UREC.
� WORSTCASE controls the inclusion of worst case information at report breaks.
To include worst case information at each subtotal break, as well as at grand totals, enter the WORSTCASE option as follows:
WORSTCASE(YES)
Use NOWORSTCASE to include worst case information only at grand totals in reports. NOWORSTCASE is the default.
The short form of this option is WORST.
Presentation optionsUse the following options to control the overall layout, scope, and detail level of a report.
� COMBINE alters the report time units for a report.
The COMBINE option is valid only with the REPORT command, not with the SET command, and it is used only for the response time report. It changes the time units in which a report is normally displayed. The COMBINE and GRAPH options are mutually exclusive.
COMBINE is entered in the format
COMBINE nnc
where
IGNORE All user records in the data stream are ignored. They do not appear in reports, and they are not included in the count of records processed.
INCLUDE All user transaction records in the data stream are included if they are marked compatible. Any other user records are ignored.
nn is the combine value
c specifies the units. It can be any of the following:
C calendar months
D days
H hours
M minutes
S seconds

Requesting Reports 61
REPORT and SET Command Options
For example, the following command changes the default reporting units for a response time report from 1-hour to 8-hour shifts.
REPORT RESPONSE COMBINE(8h)
The short form of the COMBINE option is CMB.
You can use the following options with either the SET or the REPORT command.
� DETAIL displays detailed data for each record in a report.
This option is available with all report types except LIST, and is used to request full detailed data for each record included in the report. If not specified, this option defaults to SUMMARY. DETAIL and SUMMARY are mutually exclusive.
The short form of DETAIL is DET.
� GRAPH produces a report in vertical bar graph form.
This option is available with the response time and transaction type reports. It accepts these arguments:
DAILY, WEEKLY, and MONTHLY are mutually exclusive.
For example,
REPORT RESPONSE GRAPH(WEEKLY)
produces a weekly response time report in graph form.
If the time range for the report is greater than a week, a separate plot is produced to display each week of coverage. Similarly, if you request a daily or monthly graph, and the time range is greater than one plot, the reporter generates separate plots for each period.
All graphic representations are produced with standard printer characters, so no special printer facilities are required for this option.
� MAXSCALE determines the scaling factor for GRAPH format reports.
This option applies only to transaction and response time reports for which the GRAPH option has been requested. It sets the scaling factor as a threshold displayed as the high point of the graph. The graph can display higher figures if they are warranted by the data, and the page has sufficient space. It will display at least the minimum amount of data specified.
DAILY daily plots
MONTHLY monthly plots
VBAR report in vertical bar graph form. VBAR is optional and the default for graph reports.
WEEKLY weekly plots broken down into 3 daily 8-hour shifts: 00:00–7:59, 8:00–15:59, and 16:00–23:59. These 8-hour shifts are fixed and cannot be changed.

REPORT and SET Command Options
62 OMEGAMON II for CICS Historical Reporting Guide, Version 520
The format of MAXSCALE is as follows:
MAXSCALE(cccccccS)
where ccccccc is the scale value, and S is used only with response time graphs to identify the value as seconds.
MAXSCALE has the following defaults:
If you want to compare different graphs, use the same MAXSCALE value. When data exceeds the scale of the graph, the column is displayed as full height, but is represented with + symbols instead of with the usual X symbols.
The short form of MAXSCALE is MAXS.
� MERGE controls the merging of all transactions with the same Unit Of Work ID (UOWID), including CSMc transactions.
The MERGE(YES) argument merges all transactions with the same UOWID or token, including CSMc transaction data (where c is I, 1, 3, or 5). NOMERGE is the default.
You can initiate the transactions on the same machines (MRO or ISC) or on different machines (ISC). The data is identified by the presence of a CSMc transaction with the same CICS token as the originating transaction. (The sync-point count of the token is not used in the comparison.)
The CSMc data, which includes fields for CPU time, storage, GETMAINs,and file requests, is added to the data in the corresponding fields in the original record. If the CSMc transaction terminates abnormally, the termination data overrides the data in the original transaction record in order to identify the abnormal termination in the reports.
For better performance, combine multiple REPORT requests in a single job step, instead of executing separate jobs. This is important when you use the MERGE option to produce reports that combine information from common datasets.
MERGE and NOSORT are mutually exclusive.
The short form of this option is MRO.
� SCAN checks job syntax.
It reads and validates the syntax of the input control stream. No actual processing takes place, but all controls are validated. The job log is generated to show the controls, defaults, and messages.
In SCAN mode, no data records are processed, so the item counts in the job log contain zeroes. Make the first control statement in your job either SET SCAN or REPORT ccccc SCAN:, where ccccc is the report type. For example:
REPORT FILE SCAN
MAXSCALE(20000) daily transaction graph
MAXSCALE(150000) weekly transaction graph
MAXSCALE(1000000) monthly transaction graph
MAXSCALE(10.0S) response time graph

Requesting Reports 63
REPORT and SET Command Options
� SORT controls the sorting of data from the log file.
Enter the SORT option in this format:
SORT (cccc)
where cccc is the sort program name. The default is the IBM sort program, which you can explicitly request with the entry SORT(SORT). If you select a sort program other than the IBM SORT program, it must conform to the dynamic invocation of the IBM SORT program and it must support E15 and E35 exits.
NOSORT prevents a sort. Use NOSORT only if you want to produce a detail report of raw data in the same order in which it appears in the file, or if you have already sorted the data for other reports and preserved the sorted file.
The reporter requires data to be sorted in order to conduct a merge. The reporter does not allow the combination of MERGE and NOSORT.
� SORTSIZE controls the amount of memory used by the sort program.
You can use this option to request a smaller SORTSIZE, thereby reducing paging. The trade-off is increased I/O and CPU usage during the sort procedure.
Enter one of the following:
The short form of this option is SORTS.
� SUMMARY displays summary data for each record in a report.
This option is available with all report types except LIST, and is used to request summary rather than detailed data for each record included in your report. SUMMARY is the default. DETAIL and SUMMARY are mutually exclusive.
The short form of this option is SUM.
� TITLE produces a title line.
This option enables you to request a 1–72-character title line on reports. The data you specify for the title begins on the second line of the report following the line that reads ‘OMEGAMON II for CICS.’
Enclose the title line data in single quotes. To request multiple-line titles, repeat the TITLE option as many times as required. For example:
TITLE ‘ACME WIDGETS, INC.’
TITLE ‘SALES DIVISION’
produces a two-line, single-spaced title.
SORTSIZE(nnnnK)
the memory amount in kilobytes
SORTSIZE(MAX) the default (maximum amount of memory available)
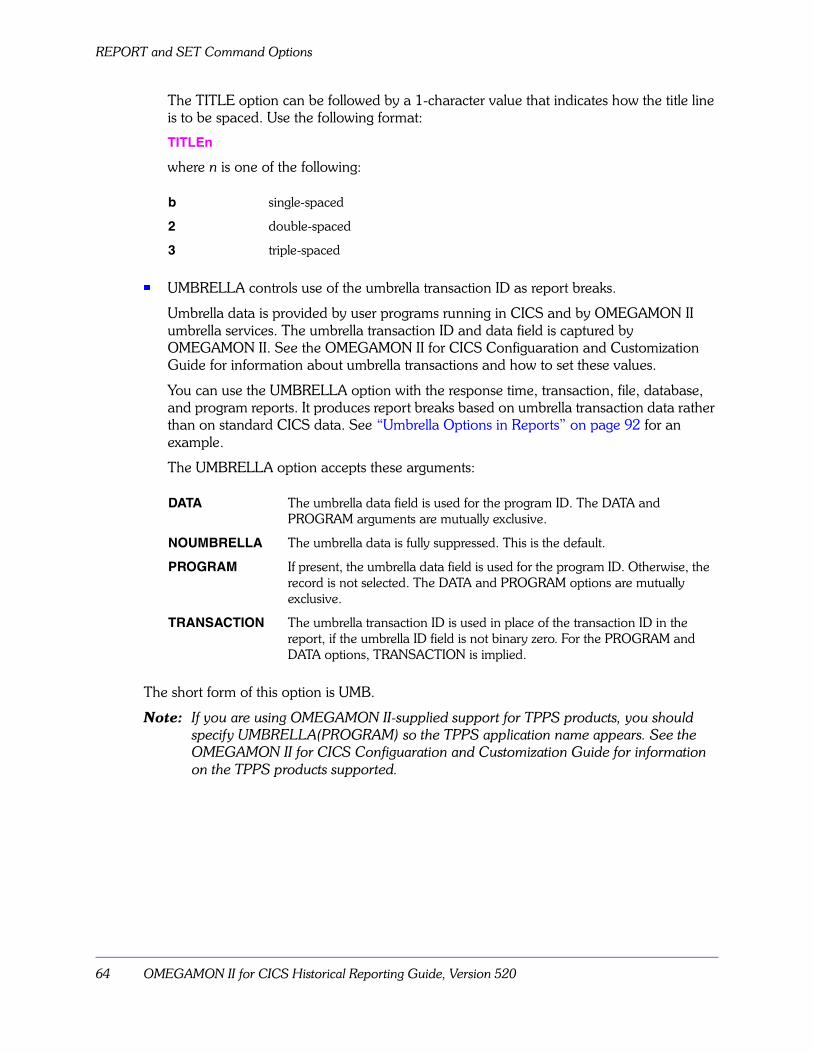
REPORT and SET Command Options
64 OMEGAMON II for CICS Historical Reporting Guide, Version 520
The TITLE option can be followed by a 1-character value that indicates how the title line is to be spaced. Use the following format:
TITLEn
where n is one of the following:
� UMBRELLA controls use of the umbrella transaction ID as report breaks.
Umbrella data is provided by user programs running in CICS and by OMEGAMON II umbrella services. The umbrella transaction ID and data field is captured by OMEGAMON II. See the OMEGAMON II for CICS Configuaration and Customization Guide for information about umbrella transactions and how to set these values.
You can use the UMBRELLA option with the response time, transaction, file, database, and program reports. It produces report breaks based on umbrella transaction data rather than on standard CICS data. See “Umbrella Options in Reports” on page 92 for an example.
The UMBRELLA option accepts these arguments:
The short form of this option is UMB.
Note: If you are using OMEGAMON II-supplied support for TPPS products, you should specify UMBRELLA(PROGRAM) so the TPPS application name appears. See the OMEGAMON II for CICS Configuaration and Customization Guide for information on the TPPS products supported.
b single-spaced
2 double-spaced
3 triple-spaced
DATA The umbrella data field is used for the program ID. The DATA and PROGRAM arguments are mutually exclusive.
NOUMBRELLA The umbrella data is fully suppressed. This is the default.
PROGRAM If present, the umbrella data field is used for the program ID. Otherwise, the record is not selected. The DATA and PROGRAM options are mutually exclusive.
TRANSACTION The umbrella transaction ID is used in place of the transaction ID in the report, if the umbrella ID field is not binary zero. For the PROGRAM and DATA options, TRANSACTION is implied.

Requesting Reports 65
Other Commands
Other CommandsYou can use the following additional commands in your reports to display information and to control miscellaneous aspects of your report output:
� CONTROL controls printer functions.
The CONTROL command controls whether lowercase characters are folded to upper case, and the number of lines that print on a page. It accepts these arguments:
You can include both the LINES argument and the FOLDON or FOLDOFF argument with a single CONTROL command entry.
The short form of this command is CNTL.
� PAGESEP produces separator pages between reports.
The PAGESEP command allows you to design and print page separators between the reports in a job. To use it, include any or all of these options:
You can use TITLEn and BLOCK options with the same PAGESEP command.
The following PAGESEP example produces the page separator shown in Figure 4 on page 66 (It will appear 3 times after each report.)
PAGESEP DUP(3) BLOCK(‘ROOM 1’) TITLE3(‘SPECIAL REPORT’) -
TITLE(‘TO THE DIRECTOR’)
FOLDOFF Lowercase characters do not fold to upper case.
FOLDON Lowercase characters fold to upper case. This is the default for folding.
LINES(nn) nn lines print per page. The default setting for nn is 60. The minimum is 24; the maximum is 32767. If you specify a number smaller than 24, the reporter will use 24.
BLOCK(‘cc..cc’) Formats cc..cc as a report title in 5” X 7” block letters. cc..cc can be any 1- to 12-character string.
TITLEn(‘cc..cc’) Formats cc..cc as a single-spaced, double-spaced, or triple-spaced report title to appear after the block title on each separator page. cc..cc can be any 1- to 72-character string.
DUPLICATE(n) Specifies n separator pages after each report, where n is any number from 1–9. The default number of separator pages is 1. DUP is an acceptable short form for this option.

Other Commands
66 OMEGAMON II for CICS Historical Reporting Guide, Version 520
FIGURE 4. Sample PAGESEP Output
The short form of the PAGESEP command is PAGE.
� PRODUCTS displays product information.
The PRODUCTS command includes the OMEGAMON II version number in the job log at the beginning of your report output.
***************************************************************************** ** ** **** *** *** * * * ** * * * * * * ** ** ** ** * * * * * * * * * * * ** **** * * * * * * * ** * * * * * * * * * ** * * * * * * * * * ** * * *** *** * * ***** ** ** ** SPECIAL REPORT ** TO THE DIRECTOR ** ** *****************************************************************************

Requesting Reports 67
Samples for Batch Submission
Samples for Batch SubmissionCandle Corporation provides a number of sample batch jobs that you can modify to request historical reports customized for your installation. These sample jobs are all contained in members beginning with KOCZJ in thilev.TKANSAM. The jobs invoke the procedure KOCZPROC contained in the same library. The following table shows the ddnames necessary to run a batch report:
Table 8. DDnames for Batch Reporting
DDname Function Notes
BGREPT Defines the file to which the reports will be written.
BGMSG Defines the file to which a log of reporter messages and commands will be written.
SYSOUT Defines the file to which the sort program will write its messages.
At your discretion, you can change this name to DD DUMMY to eliminate the sort output.
INPUT Defines the converted SMF input file.
May be concatenated.
SORTWKnn Defines the sort work files. Check your sort product’s manual for appropriate number of work files and dataset characteristics.
BGTRAN Defines a temporary work file. Use only with the MERGE option. If you use the NOMERGE option for all reports in a single job, the BGTRAN intermediate dataset is not created, and can be coded as DD DUMMY in the reporter JCL.
BGSYS Defines a temporary work file.
SYSUDUMP Defines the system error diagnostic file.
BGSYSIN Defines the file that contains the input report request commands.

Samples for Batch Submission
68 OMEGAMON II for CICS Historical Reporting Guide, Version 520

Sample Reports 69
Sample Reports
OverviewThis chapter illustrates and explains each type of report you can produce with the OMEGAMON II historical reporter. Field headings for the reports are described in the section “Field Headings” on page 94.
You can produce the following reports: Response Time, Transaction, Terminal, User ID, File, Database, Program, System, List
Reports are available in the following formats: Detail version, Summary version, Numeric, Graphic
A worst case analysis is printed at the bottom of each report. The analysis includes the worst CPU usage, response time, file requests, storage, and GETMAINs. You can specify that this worst case analysis appear at each report break. For explanations of each of the fields included in worst case analysis, see “Worst case analysis fields” on page 98. All selection and modification options are explained in “Requesting Reports” on page 45.
The sample reports in this chapter were run against data collected under this release of the OMEGAMON II historical reporter. Fields for which data is not collected contain zeros, blanks, or N.
Chapter ContentsResponse Time Reports. . . . . . . . . . . . . . . . . . . . . . . . . . . . . . . . . . . . . . . . . . . . . . . . . . . . . . . . . . .70Transaction Reports . . . . . . . . . . . . . . . . . . . . . . . . . . . . . . . . . . . . . . . . . . . . . . . . . . . . . . . . . . . . .74Terminal Reports. . . . . . . . . . . . . . . . . . . . . . . . . . . . . . . . . . . . . . . . . . . . . . . . . . . . . . . . . . . . . . . .78User ID Reports. . . . . . . . . . . . . . . . . . . . . . . . . . . . . . . . . . . . . . . . . . . . . . . . . . . . . . . . . . . . . . . . .80File Reports. . . . . . . . . . . . . . . . . . . . . . . . . . . . . . . . . . . . . . . . . . . . . . . . . . . . . . . . . . . . . . . . . . . .82Database Reports . . . . . . . . . . . . . . . . . . . . . . . . . . . . . . . . . . . . . . . . . . . . . . . . . . . . . . . . . . . . . . .84Program Reports . . . . . . . . . . . . . . . . . . . . . . . . . . . . . . . . . . . . . . . . . . . . . . . . . . . . . . . . . . . . . . . .86System Reports . . . . . . . . . . . . . . . . . . . . . . . . . . . . . . . . . . . . . . . . . . . . . . . . . . . . . . . . . . . . . . . . .88List Reports. . . . . . . . . . . . . . . . . . . . . . . . . . . . . . . . . . . . . . . . . . . . . . . . . . . . . . . . . . . . . . . . . . . .90Umbrella Options in Reports . . . . . . . . . . . . . . . . . . . . . . . . . . . . . . . . . . . . . . . . . . . . . . . . . . . . . . .92Field Headings . . . . . . . . . . . . . . . . . . . . . . . . . . . . . . . . . . . . . . . . . . . . . . . . . . . . . . . . . . . . . . . . .94
5
Response Time Reports
70 OMEGAMON II for CICS Historical Reporting Guide, Version 520
Response Time ReportsResponse time reports give transaction response time information on an hour-by-hour basis for the time period you select. Use the response time report to
� determine how CICS throughput varies over a given period
� isolate problem periods
� identify transactions or applications with poor performance
The detail version of the response time report provides response time figures for each transaction during each reporting period, with transactions listed alphabetically. The summary version totals response time figures for each reporting period. The graph display shows the summary data in a bar chart format. You can also change the default hourly reporting basis for the report to a shorter or longer period.
The response time report breaks down each period by
� start date and time
� stop date and time
� transaction name
� transaction counts
� average response time
� CPU usage figures (based on the total of selected transactions only)
� storage violation
� abend counts
Note: Storage violations are reported as 0 for all releases of CICS except version 2.1.2.

Sample Reports 71
Response Time Reports
The following example shows a sample response detail time report. You can generate a similar report at your installation with the following command:
REPORT RESPONSE DETAIL
FIGURE 5. Response Time Detail Report
You can request response time graph displays for daily, weekly, or monthly periods. Graphs are always preceded by a start and stop time summary on page 1 of the report; the graph begins on page 2. When the data for any period exceeds the user-established scale of the graph, the reporter replaces the X symbols with + symbols.
OMEGAMON II for CICSRun Date: February 9, 1993 Response Time Detail Report Page 1
Data Processed: 02/03/93 09:14 to 02/03/93 14:02
--------Date and Time--------- ----Tran---- Avg ------CPU------- Stor Abend----Start----- -----Stop----- Name Count Resp Avg Total Viol Count-----------------------------------------------------------------------------------------------02/03/93 09:00 02/03/93 10:00 CCMF 4 .014 .003 .033 0 0
CSGM 2 .022 .014 .022 0 0CSMI 1 2.289 .000 .000 0 0CSNE 2 .009 .000 .011 0 0CSSN 4 .122 .012 .045 0 0TRN1 70 .967 .075 5.485 0 1TRN2 19 .659 .006 .154 0 0
-----------------------------------------------------------------------------------------------Total 102 .819 .055 5.756 0 1
. . . . . . .
. . . . . . .
. . . . . . .
. . . . . . .
02/03/93 13:00 02/03/93 14:00 2 .014 .000 .011 0 0AAFM 1 .023 .000 .000 0 0CCMF 120 .044 .000 .945 0 0CEMT 6 .567 .023 .141 0 0CRSR 29 .012 .000 .141 0 0CSGM 49 .149 .011 .563 0 0CSKP 1 1.021 .023 .020 0 0CSMI 258 .569 .000 1.299 0 0CSNE 113 .056 .000 .854 0 0CSPQ 6 .067 .000 .022 0 0CSSF 8 .132 .010 .092 0 0CSSN 70 .358 .017 .888 0 0TRN1 2368 9.756 .129 4:51.333 0 62TRN2 802 11.589 .000 7.100 0 22LOGO 22 .122 .012 .265 0 0XCE1 1 .012 .000 .000 0 0
------------------------------------------------------------------------------------------------Total 385 6 8.463 .072 5:03.713 0 84------------------------------------------------------------------------------------------------Grand Totals 20995 2.469 .035 12:20.383 0 344
--------------------------------------------------------------------------------------------------| Worst Tran Value Date Time CICS Netname Abend V ---Umbrella--- || CPU - TRN1 43.396 02/03/93 09:40:23 CICSPR1 L614A29 || Response- TRN1 19:37.304 02/03/93 10:06:30 CICSPR1 L614A11 || File Req- TRN1 4 02/03/93 10:23:27 CICSPR1 L615A68 || Storage - CSMI 2M 02/03/93 10:04:39 CICSPR1 || GETMAINs- TRN1 5134 02/03/93 12:04:05 CICSPR1 R104A11 |--------------------------------------------------------------------------------------------------

Response Time Reports
72 OMEGAMON II for CICS Historical Reporting Guide, Version 520
An example of a daily response time graph for a single-day period follows. You can generate a similar report at your installation with the following comment:
REPORT RESPONSE GRAPH(VBAR,DAILY)
FIGURE 6. Daily Response Time Graph
OMEGAMON II for CICSRun Date: February 9, 1993 Daily Response Time Graph Page 1
Data Processed: 02/04/93 00:00 to 02/04/93 23:59
SMF Process CICS -------Start------- -----Stop-------- Abend CPU Missing TranID Network Jobname Date Time Date Time Code Used Data Count
------------------------------------------------------------------------------------------------SYSB LANODE CISCPR1 02/04/93 00:00:00 02/04/93 23:59:00 40:30.19 162536------------------------------------------------------------------------------------------------Total CISCPR1 EXECs=1 Abnormal Completions= 0 40:30.19 162536
------------------------------------------------------------------------------------------------Grand Totals EXECs=1 Abnormal Completions= 0 40:30.19 162536
-----------------------------------------------------------------------------------------------| Worst Tran Value Date Time CICS Netname Abend V ---Umbrella--- || CPU - TRN4 43.392 02/04/93 09:40:23 CISCPR1 L614A29 || Response- TRN4 47:23.304 02/04/93 09:40:23 CISCPR1 L614A11 || File Req- TRN1 2 02/04/93 10:23:27 CISCPR1 L615A68 || Storage - TRN4 2M 02/04/93 09:40:23 CISCPR1 || GETMAINs- TRN4 5134 02/04/93 09:40:23 CISCPR1 L615A29 |-----------------------------------------------------------------------------------------------

Sample Reports 73
Response Time Reports
FIGURE 6. Daily Response Time Graph (continued)
OMEGAMON II for CICSRun Date: February 9, 1993 Daily Response Time Graph Page 2
Data Processed: 02/04/93 00:00 to 02/04/93 23:59
10.2 ++10.0 ++9.8 ++9.6 ++9.4 ++9.2 ++9.0 ++8.8 ++8.6 ++8.4 ++8.2 ++8.0 ++
R 7.8 ++E 7.6 ++S 7.4 ++P 7.2 ++O 7.0 ++N 6.8 ++S 6.6 ++E 6.4 ++
6.2 ++T 6.0 ++I 5.8 ++ XXM 5.6 ++ XXE 5.4 ++ XX XX
5.2 ++ XX XXI 5.0 ++ XX XXN 4.8 ++ XX XX
4.6 ++ XX XXS 4.4 ++ XX XXE 4.2 ++ XX XXC 4.0 ++ XX XX XXO 3.8 ++ XX XX XXN 3.6 ++ XX XX XX XXD 3.4 ++ XX XX XX XX XXS 3.2 ++ XX XX XX XX XX
3.0 ++ XX XX XX XX XX2.8 ++ XX XX XX XX XX XX2.6 ++ XX XX XX XX XX XX2.4 XX ++ XX XX XX XX XX XX2.2 XX ++ XX XX XX XX XX XX2.0 XX ++ XX XX XX XX XX XX XX1.8 XX XX ++ XX XX XX XX XX XX XX1.6 XX XX ++ XX XX XX XX XX XX XX1.4 XX XX XX ++ XX XX XX XX XX XX XX XX1.2 XX XX XX ++ XX XX XX XX XX XX XX XX1.0 XX XX XX ++ XX XX XX XX XX XX XX XX.8 XX XX XX XX XX ++ XX XX XX XX XX XX XX XX XX.6 XX XX XX XX XX XX ++ XX XX XX XX XX XX XX XX XX XX.4 XX XX XX XX XX XX XX XX ++ XX XX XX XX XX XX XX XX XX XX XX XX.2 XX XX XX XX XX XX XX XX XX ++ XX XX XX XX XX XX XX XX XX XX XX XX XX
----------------------------------------------------------------------------------------------------00 01 02 03 04 05 06 07 08 09 10 11 12 13 14 15 16 17 18 19 20 21 22
24-Hour Clock

Transaction Reports
74 OMEGAMON II for CICS Historical Reporting Guide, Version 520
Transaction ReportsThe transaction report provides information about the use of each transaction on your system. Use the report to
� compare the transaction activity and resource usage by transaction ID
� identify problem CICS transactions
The detail version of the transaction report separates each transaction by CICS region. The summary version totals all occurrences of each transaction. The graph display shows the summary data in a bar chart format.
The transaction reports breaks down each transaction by
� network
� CICS region
� transaction name
� transaction count
� umbrella transaction name
� average response time
� CPU usage figures
� storage violations
� abend counts
If you specify the UMBRELLA option, the pseudo-transaction is shown in addition to the CICS transaction ID. If, however, the transaction invoked is an application generator or a fourth generation language, the report displays the application generator program/function name as the transaction sub-ID. This allows further detailing of large multifunction transactions.
Note: Storage violations are reported as 0 for all releases of CICS except version 2.1.2.

Sample Reports 75
Transaction Reports
The following example shows a sample transaction detail report. You can generate a similar report at your installation with the following command:
REPORT TRANSACTION DETAIL
FIGURE 7. Transaction Detail Report
OMEGAMON II for CICSRun Date: February 9, 1993 Transaction Detail Report Page 1
Data Processed: 02/03/93 09:14 to 02/03/93 14:02
------Process----- --------Tran------------- Avg --------CPU-------- Stor AbendNetwork CICS Name Count Sub-ID Resp Avg Total Viol Count
----------------------------------------------------------------------------------------------
NETWORK1 CICS161 ABCD 110 UMBTABCD .256 .010 1.146 0 0----------------------------------------------------------------------------------------------Total Tran ABCD 110 .256 .010 1.146 0 0
NETWORK1 CICS17B ABCD 3 2.716 .027 .081 0 06 UMBTABCD 2.194 .026 .156 0 0
----------------------------------------------------------------------------------------------Total Tran ABCD 9 2.368 .026 .237 0 0
NETWORK1 CICS161 BCDA 1 4.093 .194 .194 0 0----------------------------------------------------------------------------------------------Total Tran BCDA 1 4.093 .194 .194 0 0
NETWORK1 CICS17B BCDA 2 8.415 .008 .016 0 0----------------------------------------------------------------------------------------------Total Tran BCDA 2 8.415 .008 .016 0 0
NETWORK1 CICS161 CDAB 10 BTUM 7.530 .766 7.66 0 0----------------------------------------------------------------------------------------------Total Tran CDAB 10 7.530 .766 7.66 0 0
NETWORK1 CICS17B CDAB 2 BTUM 8.415 .008 .016 0 0----------------------------------------------------------------------------------------------Total Tran CDAB 2 8.415 .008 .016 0 0
NETWORK1 CICS161 DABC 11 .811 .009 .104 0 1----------------------------------------------------------------------------------------------Total Tran DABC 11 .811 .009 .104 0 1
NETWORK1 CICS17B DABC 21 .972 .040 .831 0 0----------------------------------------------------------------------------------------------Total Tran DABC 21 .972 .040 .831 0 0----------------------------------------------------------------------------------------------Grand Totals 166 1.156 .061 10.204 0 1
-------------------------------------------------------------------------------------------------| Worst Tran Value Date Time CICS Netname Abend V ---Sub-ID--- || CPU - CDAB 4:25.966 02/03/93 13:59:58 CICS161 NETIL01 BUSERFUM BTUM || Response- BCDA 4.093 02/03/93 13:59:58 CICS161 NETIL02 || File I/O- CDAB 1246 02/03/93 13:59:58 CICS161 NETIL01 RFUMBUSE BTUM || Storage - BCDA 28M 02/03/93 13:59:58 CICS161 NETIL02 || GETMAINs- BCDA 444 02/03/93 13:59:58 CICS161 NETIL02 |-------------------------------------------------------------------------------------------------

Transaction Reports
76 OMEGAMON II for CICS Historical Reporting Guide, Version 520
You can request transaction volume graph displays for daily, weekly, or monthly periods. Graphs are always preceded by a start and stop times summary; the graph itself begins on page 2 of the report. When the data for any period exceeds the user-established scale of the graph, the reporter replaces the X symbols with + symbols.
An example of a daily transaction graph follows. You can generate a similar report at your installation with the following command:
REPORT TRANSACTION GRAPH(VBAR,DAILY)
FIGURE 8. Daily Transaction Volume Graph
OMEGAMON II for CICSRun Date: February 9, 1993 Daily Transaction Volume Graph Page 1
Data Processed: 02/04/93 00:00 to 02/04/93 23:59
SMF Process CICS ------Start------- ------Stop------- Abend CPU Missing TranID Network Jobname Date Time Date Time Code Used Data Count------------------------------------------------------------------------------------------------SYSB LANODE CISCPR1 02/04/93 00:00:00 02/04/93 23:59:00 40:30.19 162536------------------------------------------------------------------------------------------------Total CISCPR1 EXECs=1 Abnormal Completions= 0 40:30.19 162536
------------------------------------------------------------------------------------------------Grand Totals EXECs=1 Abnormal Completions= 0 40:30.19 162536
--------------------------------------------------------------------------------------------| Worst Tran Value Date Time CICS Netname Abend V -- Sub-ID -- || CPU - TRN4 43.392 02/04/93 09:40:23 CISCPR1 L614A29 || Response- TRN4 47:23.304 02/04/93 09:40:23 CISCPR1 L614A11 || File Req- TRN1 2 02/04/93 10:23:27 CISCPR1 L615A68 || Storage - TRN4 2M 02/04/93 09:40:23 CISCPR1 || GETMAINs- TRN4 5134 02/04/93 09:40:23 CISCPR1 L615A29 |--------------------------------------------------------------------------------------------

Sample Reports 77
Transaction Reports
FIGURE 8. Daily Transaction Volume Graph (continued)
OMEGAMON II for CICSRun Date: February 9, 1993 Daily Transaction Volume Graph Page 2
Data Processed: 02/04/93 00:00 to 02/04/93 24:00
2550025000245002400023500230002250022000215002100020500200001950019300
T 18500R 18000A 17500 XXN 17000 XXS 16500 XXA 16000 XX XXC 15500 XX XX XXT 15000 XX XX XXI 14500 XX XX XX XXO 14000 XX XX XX XXN 13500 XX XX XX XX XXS 13000 XX XX XX XX XX
12500 XX XX XX XX XXP 12000 XX XX XX XX XX XXE 11500 XX XX XX XX XX XXR 11000 XX XX XX XX XX XX XX
10500 XX XX XX XX XX XX XXH 10000 XX XX XX XX XX XX XX XXO 9500 XX XX XX XX XX XX XX XXU 9300 XX XX XX XX XX XX XX XX XXR 8500 XX XX XX XX XX XX XX XX XX XX
8000 XX XX XX XX XX XX XX XX XX XX7500 XX XX XX XX XX XX XX XX XX XX XX7000 XX XX XX XX XX XX XX XX XX XX XX6500 XX XX XX XX XX XX XX XX XX XX XX XX6000 XX XX XX XX XX XX XX XX XX XX XX XX5500 XX XX XX XX XX XX XX XX XX XX XX XX5000 XX XX XX XX XX XX XX XX XX XX XX XX4500 XX XX XX XX XX XX XX XX XX XX XX XX XX4000 XX XX XX XX XX XX XX XX XX XX XX XX XX3500 XX XX XX XX XX XX XX XX XX XX XX XX XX3000 XX XX XX XX XX XX XX XX XX XX XX XX XX XX2500 XX XX XX XX XX XX XX XX XX XX XX XX XX XX XX2000 XX XX XX XX XX XX XX XX XX XX XX XX XX XX XX XX XX1500 XX XX XX XX XX XX XX XX XX XX XX XX XX XX XX XX XX1000 XX XX XX XX XX XX XX XX XX XX XX XX XX XX XX XX XX XX XX500 XX XX XX XX XX XX XX XX XX XX XX XX XX XX XX XX XX XX XX XX XX XX XX
----------------------------------------------------------------------------------------------------00 01 02 03 04 05 06 07 08 09 10 11 12 13 14 15 16 17 18 19 20 21 22
24-Hour Clock

Terminal Reports
78 OMEGAMON II for CICS Historical Reporting Guide, Version 520
Terminal ReportsThe terminal report provides information about CICS usage at each terminal in your system.
Use the terminal report to identify the usage of your terminals and printers. The detail version of the terminal report provides information about individual user IDs, whereas the summary report combines all user ID usage at a single terminal.
The terminal report displays the following data for each terminal:
� originating system’s SMF ID originating CICS region
� terminal netname
� terminal ID
� user ID
� transaction count
� average response time
� CPU usage figures
� messages statistics
If data for nonterminal activity is included in the report, it appears as the first detailed line for a given origin network and CICS group, with a blank for the terminal ID.

Sample Reports 79
Terminal Reports
The following example shows a sample terminal detail report. You can generate a similar report at your installation with the following command:
REPORT TERMINAL DETAIL
FIGURE 9. Terminal Detail Report
OMEGAMON II for CICSRun Date: February 10, 1993 Terminal Detail Report Page 1
Data Processed: 02/03/93 09:14 to 02/03/93 14:02
-----Origin------ ---Terminal--- User Tran Avg -----CPU------ Msgs Avg Msgs AvgSMFID CICS Netname ID ID Count Resp Avg Total In Len Out Len-----------------------------------------------------------------------------------------------
CICSPROD AACLS019 C30A 72 .652 .000 .642 8 21 80 467-----------------------------------------------------------------------------------------------Total 72 .652 .000 .642 8 21 80 467
SYSA CICSPR1 AACLS021 C30C 13 .422 .015 .130 5 18 25 302-----------------------------------------------------------------------------------------------Total 13 .422 .015 .130 5 18 25 302
SYSA CICSPR4 AACLS025 C310 4 .523 .022 .102 2 43 4 150SYSB CICSTEST L510 20 .506 .027 .540 18 57 16 200-----------------------------------------------------------------------------------------------Total 4 .509 .025 .642 2 43 20 176
SYSA CICSPR4 AACLS029 C380 59 1.569 .064 4.123 4 8 63 247-----------------------------------------------------------------------------------------------Total 59 1.569 .064 4.123 4 8 63 247
SYSA CICSPR1 AACLS030 C381 38 1.996 .000 .363 5 16 38 57-----------------------------------------------------------------------------------------------Total 38 1.996 .000 .363 5 16 38 57
. . . . . . . . . . .
. . . . . . . . . . .
. . . . . . . . . . .
SYSA CICSPROD R200A12 20AC 19 .288 .031 .643 5 29 38 159-----------------------------------------------------------------------------------------------Total 19 .288 .031 .643 5 29 38 159
SYSA CICSTEST R202A11 22AB 3 .534 .011 .043 2 3 3 1002-----------------------------------------------------------------------------------------------Total 3 .534 .011 .043 2 3 3 1002
SYSA CICSPR1 R202A19 22B3 4 .351 .017 .053 3 5 12 750-----------------------------------------------------------------------------------------------Total 4 .351 .017 .053 3 5 12 750
SYSA CICSPR4 R202A30 22BE 4 .822 .032 .132 2 9 1 93-----------------------------------------------------------------------------------------------Total 4 .822 .032 .132 2 9 1 93-----------------------------------------------------------------------------------------------Grand Totals 20995 2.469 .033 12:20.383 2882 94 1742 659
--------------------------------------------------------------------------------------------| Worst Tran Value Date Time CICS Netname Abend V --Umbrella-- || CPU - TRN1 43.396 02/03/93 09:40:23 CICSPR1 L614A29 || Response- TRN1 19:37.304 02/03/93 10:06:30 CICSPR1 L614A11 || File Req- TRN1 4 02/03/93 10:39:38 CICSPR1 AACLS032 || Storage - CSMI 2M 02/03/93 10:04:39 CICSPR1 || GETMAINs- TRN1 5134 02/03/93 12:04:05 CICSPR1 R104A11 |--------------------------------------------------------------------------------------------

User ID Reports
80 OMEGAMON II for CICS Historical Reporting Guide, Version 520
User ID ReportsThe user ID report provides information about CICS usage by user ID. It can provide you with an audit trail and serve as a basis for billing. The detail version of the user ID report separates each ID’s usage by each CICS region accessed. The summary version combines all CICS usage for each ID.
The user ID report displays the following data for each user:
� network
� CICS region
� user ID
� transaction count
� average response time
� average and total CPU figures
� storage violations
� abend counts
For regions running CICS versions earlier than CICS/ESA 4.1, this report displays the 8-character logon ID, if it is present, in the User ID column. Otherwise, the 3-character OPR ID field is displayed in the User ID column.
For CICS/ESA 4.1 and later versions, the entry in the User ID column is left blank if the 8-character logon ID is not present.
Note: Storage violations are reported as 0 for all releases of CICS except version 2.1.2.

Sample Reports 81
User ID Reports
The following example shows a sample user ID detail report. You can generate a similar report at your installation with the following command:
REPORT USERID DETAIL
FIGURE 10. User ID Detail Report
OMEGAMON II for CICSRun Date: February 11, 1993 User ID Detail Report Page 1
Data Processed: 02/03/93 09:14 to 02/03/93 14:02
-----Process----- User Tran Avg --------CPU-------- Stor AbendNetwork CICS ID Count Resp Avg Total Viol Count
---------------------------------------------------------------------------------CICSPR1 20819 2.467 .030 12:17.543 0 339
---------------------------------------------------------------------------------Total 20819 2.467 .030 12:17.543 0 339
CICSPR1 BJE 34 .337 .022 .785 0 0---------------------------------------------------------------------------------Total BJE 34 .337 .022 .785 0 0
CICSPR1 CLB 1 .069 .000 .000 0 0---------------------------------------------------------------------------------Total CLB 1 .069 .000 .000 0 0
CICSPR1 DAC 22 .178 .018 .437 0 2---------------------------------------------------------------------------------Total DAC 22 .178 .018 .437 0 2
CICSPR1 DLS 32 .231 .011 .352 0 0---------------------------------------------------------------------------------Total DLS 32 .231 .011 .352 0 0
CICSPR1 LSR 22 .481 .024 .591 0 0---------------------------------------------------------------------------------Total LSR 22 .481 .024 .591 0 0
CICSPR1 MSH 59 .865 .000 .580 0 3---------------------------------------------------------------------------------Total MSH 59 .865 .000 .580 0 3
CICSPR1 RHB 6 .431 .012 .061 0 0---------------------------------------------------------------------------------Total RHB 6 .421 .012 .061 0 0---------------------------------------------------------------------------------Grand total 20995 2.469 .033 12:20.388 0 344
--------------------------------------------------------------------------------------------| Worst Tran Value Date Time CICS Netname Abend V --Umbrella-- || CPU - TRN1 43.396 02/03/93 09:40:23 CICSPR1 L614A29 || Response- TRN1 19:37.304 02/03/93 10:06:30 CICSPR1 L614A11 || File Req- TRN1 4 02/03/93 10:39:38 CICSPR1 AACLS032 || Storage - CSMI 2M 02/03/93 10:04:39 CICSPR1 || GETMAINs- TRN1 5134 02/03/93 12:04:05 CICSPR1 R104A11 |--------------------------------------------------------------------------------------------

File Reports
82 OMEGAMON II for CICS Historical Reporting Guide, Version 520
File ReportsThe file report provides file request information by transaction and request type. Use the file report to identify transactions with poor response time caused by excessive file requests. The detail version of the file report separates each CICS region accessed, while the summary version gives total figures for each transaction.
The file report displays the following data for each transaction:
� network
� CICS region
� transaction name
� request type
� request count
� average and total file requests
� average transaction response time
� average and total CPU usage figure
A file request to CICS does not always result in a file I/O. No file I/O is performed if the record is located in a VSAM LSR pool, or if the request is invalid.

Sample Reports 83
File Reports
The following example shows a sample file detail report. You can generate a similar report at your installation with the following command:
REPORT FILE DETAIL
FIGURE 11. File Requests By Transaction Detail Report
OMEGAMON II for CICSRun Date: February 10, 1993 File Requests By Transaction Detail Report Page 1
Data Processed: 02/03/93 09:14 to 02/03/93 14:02
------Process------ Tran ----------Requests----------Network CICS Name Type Count Avg
----------------------------------------------------------------------CICSPR1 CRSQ GETR 0 0.0
GETU 0 0.0PUT 0 0.0BROW 0 0.0ADD 0 0.0DEL 0 0.0
----------------------------------------------------------------------------------------------------Totals: Transactions=1 Requests=0 Avg Req=0.0 Avg Tran Resp=.023 Avg CPU=.000 Total CPU=.000
CICSPR1 CSMI GETR 993 .2GETU 0 .0PUT 357 .1BROW 0 0.0ADD 0 0.0DEL 0 0.0
----------------------------------------------------------------------------------------------------Totals: Transactions=3225 Requests=1350 Avg Req=.4 Avg Tran Resp=.487 Avg CPU=.000 Total CPU=15.731
. . . . .
. . . . .
. . . . .CICSPR1 TRN1 GETR 1094 .0
GETU 0 .0PUT 718 .1BROW 0 0.0ADD 0 0.0DEL 0 0.0
----------------------------------------------------------------------------------------------------Totals: Transactions=6443 Requests=1767 Avg Req=.3 Avg Tran Resp=4.391 Avg CPU=.093 Total CPU=10:24.651----------------------------------------------------------------------------------------------------Grand Totals Trans=20995 Requests=3117 Avg Req=.1 Avg Tran Resp=2.469 Avg CPU=.030 Total CPU=12:20.388
----------------------------------------------------------------------------------------------| Worst Tran Value Date Time CICS Netname Abend V ---Umbrella--|| CPU - TRN1 43.396 02/03/93 09:40:23 CICSPR1 L614A29 || Response- TRN1 19:37.300 02/03/93 10:06:30 CICSPR1 L614A11 || File Req- TRN1 4 02/03/93 10:23:27 CICSPR1 L615A68 || Storage - CSMI 2M 02/03/93 10:04:39 CICSPR1 || GETMAINs- TRN1 5134 02/03/93 12:04:05 CICSPR1 R104A11 |----------------------------------------------------------------------------------------------

Database Reports
84 OMEGAMON II for CICS Historical Reporting Guide, Version 520
Database ReportsThe database report provides DL/I and third party database information by transaction and request type. Use the database report to identify transactions that use DL/I and third party database products, and to monitor the use of the database by a particular transaction. The detail version of the database report provides statistics for each transaction by each CICS region accessed, while the summary version provides total figures for each transaction.
For each transaction that issues a database request, the database report breaks down each transaction by
� network
� CICS region
� transaction name
� umbrella transaction (if specified)
� DL/I request type
� DL/I request count
� average DL/I requests
� total transaction count
For all other database products, the report lists the following:
� request count
� average database requests
� total elapsed time

Sample Reports 85
Database Reports
The following example shows a sample database detail report. You can generate a similar report at your installation with the following command:
REPORT DBASE DETAIL
FIGURE 12. Database Requests By Transaction Detail Report
1 OMEGAMON FOR CICS/ESARUN DATE: APRIL 6, 1995 DATABASE REQUESTS BY TRANSACTION DETAIL REPORT PAGE 1
DATA PROCESSED: 03/28/95 11:36 TO 03/28/95 11:38
---------- DL/I ------------------ AVERAGE --------
PSB ---------DL/I---------- --------- OTHER -------------- PROCESS ---- TRAN SCHED ------- REQUESTS------- OTHER ------- REQUESTS --------NETWORK CICS NAME TIME TYPE COUNT AVG DATABASE COUNT AVG-----------------------------------------------------------------------------------------------TDOCS33 TDOCS33 CEDA 00.000 GET UNIQ 0 .00 NONE
GET NEXT 0 .00GET NP 0 .00GET HU 0 .00GET HN 0 .00GET HNP 0 .00INSERT 0 .00REPLACE 0 .00DELETE 0 .00
-----------------------------------------------------------------------------------------------TOTALS TRAN COUNT: 7 00.000 0 .00 0 .00
OTHER DB TOTAL ELAPSED TIME: .000
TDOCS33 TDOCS33 WD30 02.988 GET UNIQ 0 .00 NONEGET NEXT 0 .00GET NP 0 .00GET HU 1 1.00GET HN 0 .00GET HNP 0 .00INSERT 0 .00REPLACE 0 .00DELETE 0 .00
-----------------------------------------------------------------------------------------------TOTALS TRAN COUNT: 1 02.988 1 1.00 0 .00
OTHER DB TOTAL ELAPSED TIME: .000-----------------------------------------------------------------------------------------------
GRAND TOTALS TRAN COUNT: 8 00.374 1 .12 0 .00OTHER DB TOTAL ELAPSED TIME: .000
-------------------------------------------------------------------------------------------------| WORST TRAN VALUE DATE TIME CICS NETNAME ABEND V ---UMBRELLA--- || CPU - CEDA .127 03/28/95 11:37:00 TDOCS33 ATERM488 || RESPONSE- WD30 9.769 03/28/95 11:38:10 TDOCS33 ATERM488 DHAI || FILE-I/O- CEDA 932 03/28/95 11:37:00 TDOCS33 ATERM488 || STORAGE - CEDA 44096 03/28/95 11:37:30 TDOCS33 ATERM488 || GETMAINS- CEDA 863 03/28/95 11:37:00 TDOCS33 ATERM488 |-------------------------------------------------------------------------------------------------

Program Reports
86 OMEGAMON II for CICS Historical Reporting Guide, Version 520
Program ReportsThe program report provides information about program usage for each transaction. Use the program report to identify resident program lists. The detail version of the program report separates program usage by transaction by CICS region. The summary version totals all program usage for each transaction.
The program report breaks down each transaction by
� CICS region
� program name
� transaction name
� transaction count
� average response time
� average and total CPU usage figures
Program usage is determined by the first program invoked by the transaction. Calls to subsequent programs, such as a target of LINK, or XCTL, are not counted. If you specify the UMBRELLA option, the reporter substitutes the user-provided field for the CICS program name. This allows further detailing of large multifunction transactions.

Sample Reports 87
Program Reports
The following example shows a sample program detail report. You can generate a similar report at your installation with the following command:
REPORT PROGRAM DETAIL
FIGURE 13. Program Detail Report
OMEGAMON II for CICSRun Date: February 10, 1993 Program Detail Report Page 1
Data Processed: 02/03/93 09:14 to 02/03/93 14:02
Process Program ------Tran-------- Avg ----------CPU---------CICS Name Name Count Resp Avg Total
--------------------------------------------------------------------------CICSPR1 ACFAEMTP ACFM 49 .078 .011 .563
ACFAEUSP CSGM 157 .133 .012 1.783CSSF 24 .132 .011 .287CSSN 230 .298 .011 2.827LOGO 99 .087 .013 1.176
CMDRIVE TRN1 6443 4.391 .092 10:24.654. . . . . .. . . . . .. . . . . .
DFHAKP CSKP 3 .859 .023 .080DFHCCMF CCMF 575 .027 .000 4.539DFHCRP TRN2 9191 2.332 .000 1:21.562DFHCRQ CRSQ 1 .019 .000 .002DFHCRS CRSR 383 .006 .000 1.933DFHEMTP CEMT 30 .273 .010 .465DFHMIR CSMI 3225 .486 .000 15.735DFHTPQ CSPQ 28 .034 .000 .111DFHTPR CSPG 39 3.452 .001 .333DFHTPS CSPS 64 .027 .000 .437DFHZNAC CSNE 337 .047 .000 2.313DPINMENU DPIN 19 .447 .020 .476DPINUPD1 DPI1 6 .473 .039 .182DPINUPD2 DPI2 6 .549 .033 .191DPINUPD3 DPI3 6 .448 .022 .178DPINUPD4 DPI4 6 .054 .017 .076
--------------------------------------------------------------------------Total 20995 2.469 .037 12:20.386--------------------------------------------------------------------------Grand Totals 20995 2.469 .037 12:20.386
--------------------------------------------------------------------------------------------| Worst Tran Value Date Time CICS Netname Abend V --Umbrella-- || CPU - TRN1 43.396 02/03/93 09:40:23 CICSPR1 L614A29 || Response- TRN1 19:37.304 02/03/93 10:06:30 CICSPR1 L614A11 || File Req- TRN1 4 02/03/93 10:23:27 CICSPR1 L615A68 || Storage - CSMI 2M 02/03/93 10:04:39 CICSPR1 || GETMAINs- TRN1 5134 02/03/93 12:04:05 CICSPR1 R104A11 |--------------------------------------------------------------------------------------------

System Reports
88 OMEGAMON II for CICS Historical Reporting Guide, Version 520
System ReportsThe system report provides information about the CICS and MVS environment. Use the system report to identify
� unscheduled CICS outages
� CICS and MVS environmental factors
� effects of changes on system performance
The system report breaks down each system by
� SMF ID
� network
� CICS jobname
� CICS start date and time
� CICS stop date and time
� abends
� CPU time used (based on the total of all TCBs and SRBs in the CICS address space)
� Missing data indicator
� transaction count
Additionally, the detail version of the report shows the following:
� SIT parameters
� SIT overrides
� table suffixes
� CICS and MVS parameters captured at initialization
When there is missing data for any period of time, as indicated on the report, the reporter also produces a Missing Data Report following the system report. See the report term Missing Data in the section “Report fields” on page 95 for information about missing data records.
The system report is the only report that does not include the worst case analysis. It is excluded from this report because worst case information is transaction-oriented, and this report gives system, rather than transaction, information.

Sample Reports 89
System Reports
The following example shows a sample system detail report. You can generate a similar report at your installation with the following command:
REPORT SYSTEM DETAIL
FIGURE 14. System Detail Report
OMEGAMON II for CICSRun Date: August 30, 1994 System Detail Report
Data Processed: 08/30/94 13:55 to 08/30/94 13:57
SMF Process CICS --------Start------- --------Stop-------- Abend CPU Missing TranID Network Jobname Date Time Date Time Code Used Data Count
----------------------------------------------------------------------------------------------------SYSG TDOCS50 TDOCS50 08/30/94 13:55:59 08/30/94 13:57:35 3.571 N 0
SIT Overrides (JCL SYSPARM)
START=AUTO,XRF=NO,,APPLID=TDOCS50,GRPLIST=OCLIST,,CICSSVC=235,SRBSVC=227,JCT=NA,SYSIDNT=CICS,MCT=XA,AUXTR=OFF,PLI=NO,PLISHRE=NO,PLTPI=PI,PLTSD=SD,DLI=NO,TCT=XA,ISC=YES,DCT=XA,JCT=MC,FCT=XA,,
Table Suffixes
BFP= DBP=1$ DCT=XA DIP=NO DLI=NO DSB= FCT=XA HPO=.. IIP= ISC= JCT=MC M32= MCP=MCT=XA PBP= RLR= SRT=1$ TCP= TCT=XA TPP= TST=NO :rk.XLT=NO:erk.PLTSD=SD PLTPI=PI
----------------------------------------------------------------------------------------------------CICS Parameters At Capture Initialization
MAXT=32 :rk.EXIT INTERVAL=:erk. RUNAWAY TIMER= .26 SCAN DELA Y= .33:rk.DSA PAGES=0:erk. :rk.CUSHION PAGES= 0:erk.
SIT Parameters
ABDUMP=NO AUXTR=NO COBOL 2 =NO DIP=NO DL1 IN LPA=YES DL1 MONITOR=YES CSA COLD=YESDBRC=NO IRLM=NO DL1 PAGE FIX=YES COLD START=YES UNALIGNED DDS=YESDTB=NO AUTO DUMPEXTERNAL SECURITY=NO HPO=NO ICP COLD=NO IRCSTRT=NO VTAM LOGON DATA TO TRAN=NOCICS MODULES IN LPA=NO MESSAGE LEVEL 1 PROGRAM ISOLATION FOR DL/1=YESPL/1 SUPPORT=NO PL/1 SHARED LIBRARY SUPPORT=NO DL/1 PSB SECURITY CHECKING=NOSUPPORT FOR CICS SYSTEM SPOOLER=NO TCAM SUPPORT=NO TRACE=YESVTAM SUPPORT=YES VTAM HPO SUPPORT=NO
MVS Parameters At Capture Initialization
MVS VERSION 3.1.X CPUID=8253237CICS START TIME:08/30/94(13:55:59) ELAPSED TIME: 1:36.182REGION: BOTTOM OF PRIVATE=5000 TOP OF REGION=414FFF REGION LIMIT=410000 BOTTOM OF LSQA=7CA000TOP OF PVT=7FFFFFSTORAGE ISOLATION VALUES (IN K): ACTUAL= 5332FIXED FRAME COUNT=39DISPATCH: TYPE=ROTATE DOMAIN=6 DISPATCH PRIORITY=49 I/O DISPATCH PRIORITY=48 PERFORMANCE GROUP=531----------------------------------------------------------------------------------------------------
* NO MISSING DATA RECORDS FOUND

List Reports
90 OMEGAMON II for CICS Historical Reporting Guide, Version 520
List ReportsThe list report provides a listing of transaction detail records. The record listing includes most of the data stored in the input file. If you request the list report with conditional selection criteria, you can use it for problem determination to identify worst case information and other exceptional conditions.
The list report displays the following information for all transactions:
� originating CICS region
� VTAM terminal netname
� CICS terminal ID
� CICS user ID or operator code
� processing CICS
� transaction name
� umbrella data (if any)
� task number
� task start and stop times
� CPU time
� total file requests
� abend codes
� storage GETs
� storage violations
� storage usage
� average storage use
� average response time
� average and total CPU usage figures
Totals and averages for all transactions are displayed preceding the worst case summary report.

Sample Reports 91
List Reports
The following shows a sample list report. You can generate a similar report at your installation with the following command:
REPORT LIST
Note: The list report is produced in one pass. That is, information on the input data processed for the report is unavailable until all records have been read. Therefore, the report produced after this command is issued will show a date and time range in the line beneath the title (as shown in Figure 15 on page 91) only if it is not the first report that has been produced.
FIGURE 15. List Report
OMEGAMON II for CICSRun Date: February 10, 1993 List Report
Data Processed: 02/03/93 09:14 to 02/03/93 14:02
-Origin- -Terminal-- User Process Tran -Umbrella--Task- -Task Time -CPU- File- -Abend -Storage-CICS Netname ID ID CICS Name ID Data Number Start Stop Time Reqs Code GETs Viol Used---------------------------------------------------------------------------------------------------CICSPR1 L614A09 6409 CICSPR1 TRN1 2608 09:14:56 09:14:56 .032 0 28 13648CICSPR1 L616A10 660A CICSPR1 TRN1 3134 09:14:56 09:14:57 .032 0 15 4288CICSPR1 L614A20 6414 CICSPR1 TRN1 3107 09:14:58 09:15:00 .088 0 90 35248CICSPR1 CICSPR1 CCMF 3175 09:15:00 09:15:00 .000 0 6 3184CICSPR1 L616A42 662A CICSPR1 TRN1 3141 09:14:58 09:15:01 .430 0 352 204000CICSPR1 R101A00 01A0 CICSPR1 TRN1 2482 09:15:03 09:15:03 .039 0 39 16928CICSPR1 AACLS017 C308 CICSPR1 TRN1 2580 09:15:03 09:15:03 .011 2 AKCT 17 3824
. . . . . . . . . . . .
. . . . . . . . . . . .
. . . . . . . . . . . .CICSPR1 R101A12 01AC CICSPR1 TRN2 6768 14:01:38 14:01:39 .011 0 AKCT 3 432CICSPR1 R101A12 01AC CICSPR1 TRN1 7036 14:01:39 14:01:39 .003 0 6 611856CICSPR1 SR3 CICSPR1 CSMI 7035 14:01:38 14:01:40 .011 0 2 192CICSPR1 R101B03 01B3 CICSPR1 TRN2 6930 14:01:40 14:01:41 .000 0 0CICSPR1 R101A12 01AC CICSPR1 TRN1 7037 14:01:42 14:01:42 .024 2 13 27424CICSPR1 SR3 CICSPR1 CRSR 7038 14:01:42 14:01:42 .000 0 5 2768CICSPR1 SR3 CICSPR1 CSMI 7040 14:01:42 14:01:42 .000 1 11 4896CICSPR1 SR3 CICSPR1 CSMI 7040 14:01:42 14:01:42 .000 0 1 991216CICSPR1 SR3 CICSPR1 CSMI 7040 14:01:42 14:01:42 .000 0 2 336CICSPR1 L610A40 6028 CICSPR1 CEMT 7034 14:01:42 14:01:42 .028 0 0CICSPR1 R101A12 01AC CICSPR1 TRN2 7039 14:01:42 14:01:43 .011 0 3 4336CICSPR1 R108B03 08B3 CICSPR1 TRN2 6822 13:56:53 14:01:43 .011 0 ATCH 3 432CICSPR1 L6EA L6EA CICSPR1 TRN2 6374 14:01:40 14:01:43 .000 0 0CICSPR1 R101A05 01A5 CICSPR1 TRN2 6873 14:01:52 14:01:55 .000 0 0CICSPR1 L6EA L6EA CICSPR1 TRN2 6374 14:01:50 14:01:56 .000 0 0CICSPR1 L610A40 6028 CICSPR1 CEMT 7034 14:01:56 14:01:56 .000 0 0CICSPR1 CICSPR1 CSNE 7043 14:01:56 14:01:56 .000 0 6 6528CICSPR1 R103B05 03B5 CICSPR1 TRN2 6392 14:01:56 14:01:56 .000 0 0CICSPR1 R101A05 01A5 CICSPR1 TRN2 6873 14:01:56 14:01:57 .000 0 0----------------------------------------------------------------------------------------------------Grand Totals Avg Resp= 2.469 Avg CPU= .033 Total CPU=12:20.385 Total File Reqs= 3117 Avg Storage=32K
-------------------------------------------------------------------------------------------| Worst Tran Value Date Time CICS Netname Abend V ---Umbrella-|| CPU - TRN1 43.396 02/03/93 09:40:23 CICSPR1 L614A29 || Response- TRN1 19:37.304 02/03/93 10:06:30 CICSPR1 L614A11 || File Req- TRN1 4 02/03/93 10:23:27 CICSPR1 L615A68 || Storage - CSMI 2M 02/03/93 10:04:39 CICSPR1 || GETMAINs- TRN1 5134 02/03/93 12:04:05 CICSPR1 R104A11 |-------------------------------------------------------------------------------------------

Umbrella Options in Reports
92 OMEGAMON II for CICS Historical Reporting Guide, Version 520
Umbrella Options in ReportsIn a CICS installation, an application may be defined to CICS/VS via a single transaction with a single ID, even though it performs many different functions and provides diverse application services. This transaction acts as an umbrella over the lower-level services it provides. Application generators, fourth generation languages, and financial systems are three such examples.
CICS components recognize only one identifier for each umbrella transaction. This is also true of the services provided by CEMT, CECI, CEDF, and so on. You can make no distinction based on the sub service in progress; only the CICS PCT-defined ID is used.
OMEGAMON II for CICS provides a way to uniquely qualify these lower-level services through the umbrella transaction services feature. See the OMEGAMON II for CICS Configuration and Customization Guide for more information about umbrella transaction support.

Sample Reports 93
Umbrella Options in Reports
The following shows an example of a transaction report containing umbrella transactions. You can generate a similar report at your installation with the following command:
REPORT TRANSACTION DETAIL UMBRELLA(TRANSACTION)
FIGURE 16. Transaction Detail Report
OMEGAMON II for CICSRun Date: February 9, 1993 Transaction Detail Report Page 1
Data Processed: 02/03/93 09:14 to 02/03/93 14:02
------Process----- --------Tran------------- Avg --------CPU-------- Stor AbendNetwork CICS Name Count Sub-ID Resp Avg Total Viol Count
----------------------------------------------------------------------------------------------
NETWORK1 CICS161 ABCD 110 UMBTABCD .256 .010 1.146 0 0----------------------------------------------------------------------------------------------Total Tran ABCD 110 .256 .010 1.146 0 0
NETWORK1 CICS17B ABCD 3 2.716 .027 .081 0 06 UMBTABCD 2.194 .026 .156 0 0
----------------------------------------------------------------------------------------------Total Tran ABCD 9 2.368 .026 .237 0 0
NETWORK1 CICS161 BCDA 1 4.093 .194 .194 0 0----------------------------------------------------------------------------------------------Total Tran BCDA 1 4.093 .194 .194 0 0
NETWORK1 CICS17B BCDA 2 8.415 .008 .016 0 0----------------------------------------------------------------------------------------------Total Tran BCDA 2 8.415 .008 .016 0 0
NETWORK1 CICS161 CDAB 10 BTUM 7.530 .766 7.66 0 0----------------------------------------------------------------------------------------------Total Tran CDAB 10 7.530 .766 7.66 0 0
NETWORK1 CICS17B CDAB 2 BTUM 8.415 .008 .016 0 0----------------------------------------------------------------------------------------------Total Tran CDAB 2 8.415 .008 .016 0 0
NETWORK1 CICS161 DABC 11 .811 .009 .104 0 1----------------------------------------------------------------------------------------------Total Tran DABC 11 .811 .009 .104 0 1
NETWORK1 CICS17B DABC 21 .972 .040 .831 0 0----------------------------------------------------------------------------------------------Total Tran DABC 21 .972 .040 .831 0 0----------------------------------------------------------------------------------------------Grand Totals 166 1.156 .061 10.204 0 1
-------------------------------------------------------------------------------------------------| Worst Tran Value Date Time CICS Netname Abend V ---Sub-ID--- || CPU - CDAB 4:25.966 02/03/93 13:59:58 CICS161 NETIL01 BUSERFUM BTUM || Response- BCDA 4.093 02/03/93 13:59:58 CICS161 NETIL02 || File I/O- CDAB 1246 02/03/93 13:59:58 CICS161 NETIL01 RFUMBUSE BTUM || Storage - BCDA 28M 02/03/93 13:59:58 CICS161 NETIL02 || GETMAINs- BCDA 444 02/03/93 13:59:58 CICS161 NETIL02 |-------------------------------------------------------------------------------------------------

Field Headings
94 OMEGAMON II for CICS Historical Reporting Guide, Version 520
Field HeadingsThis section explains all of the field headings that appear in the reports. It does not include standard IBM terminology. The field headings are organized into three subsections:
� The report options log fields. This log always appears as page 0 in front of all reports to identify the options and defaults used to produce the report.
� The report fields.
� The worst case analysis fields. This analysis appears at the end of every report, except the system report, to identify the worst case records. If you request it as a report option, it can also appear at report breaks.
Within each section below, all main fields are listed and defined alphabetically. Whenever a field has one definition as a line item and another in summaries or totals, it is defined twice.
When the contents of a field are too large to be handled by our background reports, those contents will appear as asterisks.
Figures on detail lines are rounded to the least significant digit, but total lines are always computed from the actual values and rounded at the end. Detail lines, therefore, may not always appear to add up to the exact totals.
Report options log fieldsThese fields appear in the report options log:
Data Processed The range of time and date stamps on the incoming transaction log. The user-specified START/END dates for the report may be different. If the report calls for a different time span than that of the incoming records, the report may not generate any data.
Default The defaults that apply to this report. These are the defaults set by the system, or with the SET command.
Options The options you selected for the report or defined with the SET command, which are different from the system defaults.
Report The report type.
Run Date The date the batch job that produced the report was run. This date is not related to either the data range (Data Processed, above) or the report date/time ranges.
Selected If you have established groups with the SET command, and you requested groups with this report, this line displays the groups that you have used as transaction selection criteria.
Sort Sequence The fields used to sort the data. Different REPORT and SET options cause the historical reporter to use different fields in the record for sorting, and the sort input exit is used to build a record extension for sorting and work area. You cannot run your own sort to feed data to the historical reporter. The sort information here serves only as a guideline for you if you are writing your own reporting programs.

Sample Reports 95
Field Headings
Report fieldsThese fields appear in the main body of the reports:
Abend/Abend Code The first abend code for the transaction.
Abend Count The number of transactions that terminated abnormally.
Abends The first and last abend codes for the transaction, as retained by CICS.
Above The total number of bytes of storage acquired above the 16M line.
Avg On a detail line, this is the average for the transaction data on the line. On a total line, this is the average of all the transactions on the detail lines. Included change from I.M.30339612NOV93KRL
Avg Len The average length of a message, which is the sum of the total length of all recorded messages divided by the number of recorded messages. The length is stored in the terminal output CICS exit. Be aware that the CICS output exit is not driven for LU6.2 and APPC, so data for these devices is not available. If other exits run after OMEGAMON II., and those exits modify the actual message length (for example, compression), OMEGAMON II will not be able to collect accurate values. In this case, be sure that the OMEGAMON II exit is running after those exits.
Avg Resp The average response time of the transactions accounted for, which is the sum of all the response times divided by the number of transactions.
Avg Storage The amount of storage owned by the transaction as a high-water mark. See field headings Above and Below for a breakdown of the storage values.
Below Storage acquired (in bytes) from the DSA in the task storage subpool.
Cond Code This gives the user or system abend code when a CICS abnormal termination occurs. When no abend occurs, this field is blank.
CPU The average CPU time or accumulated total CPU time. For reports dealing with transactions or programs, this is the TCB time used by the task in CICS, excluding management module overhead.
CPU Used The total CPU time used. This is the accumulation of the TCB and SRB times used by CICS.
DL/I Request Count The number of DL/I requests.
DL/I Request Type The type of DL/I request. The nine types of DL/I requests are: insert, replace, delete, get next, get unique, get next in parent, get hold unique, get hold next, and get hold next in parent.
File Reqs The calls made to the CICS file control program. It does not include calls made via other mechanisms, such as calls to databases (for example, direct operating system calls).
Grand Totals The sum of all transactions accounted for in the report detail lines.
ID The CICS ID field for either the user or the terminal, as identified by the accompanying heading.
I/O Wait Time Amount of time elapsed as a result of waiting for I/O completion, as well as for the dispatcher.

Field Headings
96 OMEGAMON II for CICS Historical Reporting Guide, Version 520
Missing Data Missing data fields appear in system reports whenever the OMEGAMON II collector identifies lost data, probable lost data, or an unresolved data situation. Lost data can occur for any one of the following reasons:� collector not started at PLTPI� collector not stopped at PLTSD� CICS abending or shut down without PLTSD processing� logging function cannot process data due to a situation such as a disk
problem� collector manually stopped� collector abendIn lost data situations, OMEGAMON II attempts to keep a running count of transactions, CPU time, and so on, and to build a record to be delivered to the logging function as soon as possible.
Msgs In The number of messages received by the CICS terminal control program. Messages received from LU6.2 and APPC devices are not counted as the CICS exit is not driven for these devices.
Msgs Out The number of messages sent by the CICS terminal control program. Messages sent to LU6.2 and APPC devices are not counted as the CICS exit is not driven for these devices.
Name The CICS transaction name. If you are using umbrella transaction services, this may be the name supplied to the OMEGAMON II collector instead of the actual CICS transaction name. In this case, the name is not necessarily any value known to CICS. Rather, it is a value the umbrella services code provides.
Netname Identifies the LU name in a VTAM network.
Origin CICS This name is assigned at attach time and identifies the source of the originating transaction. If the transaction originates from a VTAM terminal, this is the LU name. If it originates from a non-VTAM terminal, this is the generic APPLID.
Origin Network The network name of the CICS region where the transaction originated.
Other DB Total Elapsed Time
Total amount of time spent by the transaction issuing and waiting for completion of third-party database requests.
Process CICS The APPLID of the CICS that performed work for the transaction. This is different from the origin CICS for MRO/ISC activity.
Process Network For a SYSTEM report, the VTAM network name associated with the CICS region that did the work and generated a transaction record for the collector.
For an individual transaction report, the first eight bytes of the CICS token field.
Program Count Each transaction or conversation in CICS uses the PCT to locate the first program to invoke. A counter in the PCT is incremented; this value reports program usage. In CICS, you can also invoke programs directly from an application; however, these counts are not included in this field.

Sample Reports 97
Field Headings
Program Name The name of the program as found in the CICS PPT. If you are using umbrella transaction services, this may be a name that either you or the sample code provides. With umbrella services, this value doesn’t need to be defined to CICS.
PSB Sched Time Amount of time for the program specification block (PSB) to be scheduled.
Requests File I/O requests made to the CICS file control program (FCP). These requests may not generate any actual I/O activity if VSAM local shared resources (LSR) are used. LSR is available for all supported releases of CICS, and is the default.
Request Avg The average number of file requests made by the listed transactions.
Request Type Identifies the type of file request.
SMF ID The System Management Facility (SMF) ID.
Start The time the transaction or CICS started. The value in the record is a STCK double word.
Stop The time the transaction or CICS terminated. The value in the record is a STCK double word.
Stor Viol The number of detected storage violations. CICS detects storage violations when it encounters a storage accounting area that has been corrupted. It does not indicate the source of the corruption. The task owning the corrupted storage is identified by CICS, but that task may not be the source of the problem.
Note: Storage violations are reported as 0 for all releases of CICS except version 2.1.2.
Storage GETs The total number of storage GETMAIN requests issued by the transaction.
Storage Used The high-water mark storage used above and below the 16M line.
Terminal ID The ID of the terminal where the transaction originated. If the transaction started as a result of a trigger level, this will be the name of the transient data queue that originated the transaction. For transactions that are neither terminal-attached nor initiated via transient data queues, this field will be blank.
For users of the CICS auto-install feature, this field will contain the name assigned by your site’s install code. The name assigned may vary for multiple accesses by the same terminal.
Terminal Netname The name by which the terminal is known to VTAM.
Totals Subtotal lines.
Tran Count The number of transactions.
Tran Name The transaction name. When umbrella services are used, it can also identify the umbrella transaction.
Tran Sub-ID The umbrella transaction ID or the application generator program/function name. If both are present in the record, the application generator program/function name is used in this field.
Umb Identifies the umbrella services data.

Field Headings
98 OMEGAMON II for CICS Historical Reporting Guide, Version 520
Worst case analysis fieldsThe worst case analysis area at the bottom of each report can serve as a guide to potential problem areas in your system. These fields appear in the worst case analysis area:
Umbrella Identifies the umbrella services data.
Umbrella Data This is an 8-byte data field. For user-generated records and online records, this field may be processed by the reporter. (See UMBRELLA option in “Requesting Reports” on page 45.)
Umbrella Tran This 8-byte data field is the pseudo-transaction ID provided by user calls to pass the data. This allows flexibility in tracking third-party databases, application generators, and your own applications.
Umbrella Program You can use this field as the program ID by selecting the UMBRELLA(PROGRAM) or UMBRELLA(DATA) report option.
User ID The 8-character logon ID if it is present. Otherwise, the 3-character operator ID is displayed.
Abend The first abend code found for the listed transaction. Each record includes the first and last abend for a transaction as detected by CICS.
CICS The jobname of the CICS region that executed the transaction.
CPU The transaction that used the most CPU.
Date The date on which the listed transaction terminated. All reporting is based on transaction end date and time.
File Requests The transaction with the most file I/O requests.
GETMAINs The transaction with the most storage GETMAINs. This total value is the sum of requests made for storage either above or below the 16M line. It represents the count of requests, not the amount of storage acquired. See the field header “Storage” for the transaction with the most storage. Note that requests consume CPU time, independent of the amount of storage needed.
Netname The transaction with the longest internal response time. The internal time is measured from the time the transaction arrives in CICS to the time that its response departs from CICS.
Storage The transaction that owned the largest amount of storage at one time. This is the total amount of storage owned both above and below the 16M line. This value is different than the GETMAINs field, which is based on the count of GETMAINs.
Sub-ID The worst umbrella transaction ID or the application generator program/function name. If both are present in the record, the application generator program/function name is used in this field.
Time The time of day when the listed transaction terminated. You can use this value in a subsequent report to get a detailed record of the transaction that had problems, or to get a range of transactions in the minutes before termination time to see what caused the problem.

Sample Reports 99
Field Headings
Tran The transaction ID.
Umbrella A pair of columns showing the contents of the umbrella data field and the umbrella transaction ID field. If you are using umbrella services to break down your transactions into finer monitoring detail, this allows you to see the subsection of the transaction that was active when it became the worst transaction in the listing class.
V Indicates that a CICS storage violation was detected for the transaction. CICS increments the storage violations counter in the transactions PCTE when it finds a violation, not when a violation occurs.
To isolate the offending transaction, find the earliest violation in the CICS run, and then identify all transactions running at the same time.
Note: Any storage violation implies the possible loss of the integrity of your data and/or of CICS itself.
Value The units of measure of the listed transaction class. For example, if the line is for CPU time, the value is expressed in seconds and fractions of a second to three decimal places (milliseconds). If the listed class is for File requests, it is the number of requests made to CICS file control.

Field Headings
100 OMEGAMON II for CICS Historical Reporting Guide, Version 520

Interval Record Collector and Problem Reporter 101
Interval Record Collectorand Problem Reporter
OverviewThe interval record collector analyzes a CICS region as often as you specify, collecting response time, bottleneck, and resource information. This data is then formatted and written to SMF for later analysis.
Candle supplies a batch job that produces problem reports from these SMF records. When the report program finds SMF records (or a particular interval record), it prints both a banner and title page and then analyzes the response time records. When a group’s average response time exceeds the group threshold, this job generates formatted information that you can use to diagnose the problem. (For more information about groups, see “Groups report” on page 108 and the OMEGAMON II for CICS Configuration and Customization Guide.
The interval record collector and problem reporter are explained further in the sections that follow. “Sample Report” on page 106 contains examples of the types of problem reports you can create with this feature.
Chapter Contents
Interval Record Collection. . . . . . . . . . . . . . . . . . . . . . . . . . . . . . . . . . . . . . . . . . . . . . . . . . . . . . . .102
Problem Reporter . . . . . . . . . . . . . . . . . . . . . . . . . . . . . . . . . . . . . . . . . . . . . . . . . . . . . . . . . . . . . .105Sample Report . . . . . . . . . . . . . . . . . . . . . . . . . . . . . . . . . . . . . . . . . . . . . . . . . . . . . . . . . . . . . . . .106
6

Interval Record Collection
102 OMEGAMON II for CICS Historical Reporting Guide, Version 520
Interval Record CollectionTo start interval record collection, bottleneck analysis and response time analysis must be activated. By default, all collectors are turned on by OMEGAMON II with options provided by the global data area module. For information on how the interval record collector options are defined in the global data area module, see the section on the INTERVAL_COLLECTOR parameter in the OMEGAMON II for CICS Configuration and Customization Guide.
If using the CUA interfaceIn addition to ensuring that the internal bottleneck and response time collectors are active before you can activate the interval record collector in the CUA interface, you must initialize OMEGAMON II in CICS. Issue the CICS transaction OMEG INIT or add program KOCOME00 to the PLTPI before you recycle CICS.
To check whether the interval record collector is active for your session, select Interval Recording from the Collection Controls pop-up menu, which is accessed through the Options pull-down, then press Enter. The Interval Recording pop-up displays as shown in the following figure.
FIGURE 17. Interval Recording Pop-up Window
To change the status of the interval record collector from inactive to active, select F4 at the New Subtask Status field and press Enter. The word Active appears in the field.
Note: Changing the status of the interval record collector affects the writing of all interval records for the current region.
The Depth of Analysis field indicates the size of the collector internal I/O table. Set this value to the maximum number of DASD devices that may be allocated to the current CICS region. The value ranges from 0—99.
To specify the interval for the writing of interval records, enter a number from 1–255 in the Recording Interval field, then press Enter. The number you specified then displays in the field.
+----------------------------------------------------------------------------+| KC2QINR Interval Recording || || Type any changes, then press Enter. || || Current subtask status : Active || Subtask start time . . : 2:38:17 Subtask start date . . : 08/26/93 || Last function performed: Report Reason for termination : n/a || SMFID . . . . . . . . : 255 Initialize performed . : Yes || Records since activate : 1741 Records since initialize: 402 || Last record time . . . : 9:54:03 || || New subtask status . . . Active__ + (Active/Inactive) || || Depth of analysis . . . 50 DASD devices || Recording interval . . . 1 min (1-255) || || F1=Help F4=Prompt F5=Refresh F12=Cancel F18=Default ||----------------------------------------------------------------------------|| | | || | Journals OK TranData OK | XRF CRIT |+----------------------------------------------------------------------------+F1=Help F3=Exit F4=Prompt F5=Refresh F6=Console F10=Action Bar F11=Print
Actions GoTo Index Options Help

Interval Record Collector and Problem Reporter 103
Interval Record Collection
OMEGAMON II writes records to SMF at the end of the interval value you specify in this field. If you do not specify an interval OMEGAMON II supplies a default interval of 1 minute. If you change the recording interval OMEGAMON II discards the previously collected SMF data and begins collecting new data at the interval you specify.
If using the menu systemAlternatively, if you are using the OMEGAMON II menu system, select the INTR Control option (K) on the Control path or enter fast path O.K to access the interval record collector.
You can change the status of the interval record collector by entering the new status directly following INTR on the Control Interval Recording Collector panel. This panel is shown in the following figure.
FIGURE 18. Control Interval Recording Collector Panel
To activate the collector, type START after INTR, then press Enter. The word Active appears in the Status field.
To change the recording interval, type the following after INTR:
SET,INTERVAL=nn
where nn is a number from 1–255. Then press Enter. The number you specified appears in the Recording Interval field. If you do not specify an interval, OMEGAMON II supplies a default interval of 1 minute.
All changes made take effect immediately, except for changes to the DEPTH value. The DEPTH value regulates the size of the collector’s internal I/O table and requires that the collector be stopped for the new value to become effective.
________________ ZCISET VTM TDOCS60 V300.00 SYSG 06/12/95
> PF1 Help PF3 Back
> A-RTA On B-RTA Off C-RTA Status D-RTA Intervals E-RTA Scaling> F-ONDV On G-ONDV Off H-ONDV Status I-Bottleneck Ctl J-Wait Reasons> K-INTR Ctl L-IANL On M-IANL Off N-IANL Settings O-IANL Groups> P-Collection Q-Shutdown R-RLIM On S-RLIM Off T-RLIM Status===============================================================================> CONTROL INTERVAL RECORDING COLLECTOR
> Current collector status displays below. To change the interval record> collector status, enter after INTR:
> - START Starts the collector.> - STOP Stops the collector.> - DEBUG Displays diagnostic information if the collector abends.> - SET,DEPTH=nn Specifies the depth of analysis> - SET,INTERVAL=nn Specifies the SMF recording interval
INTR+ Interval Recording Control Information+ Status . . . . . . . . : Active+ Activation time . . . . : 15:32:57 Activation date . . . . : 06/12/95+ Initialize performed. . : No Last function performed : None+ Reason for termination : n/a SMFID . . . . . . . . . : 243+ Depth of analysis . . . : 50 Recording interval . . : 1+ Records since activate : 0 Last record time . . . : None+ Records since initialize: 0===============================================================================

Interval Record Collection
104 OMEGAMON II for CICS Historical Reporting Guide, Version 520
Record typesOnce you have started it, interval record collection writes data to SMF that consists of the following six types of records:
� header� group� response time� bottlenecks� fixed resources� variable resources
Explanation of record typesEach type of record is explained below.
Each record created by the interval record collector contains a timestamp (E#STTIME) that uniquely associates the record with that run, so that the records can be sorted together.
If there is a change to any of the group thresholds while the interval record collector is active, another record is written.
Header Contains information that is used to produce the first page of a report (mainly SIT parameters).
Groups Lists all the groups and all the transactions, programs, terminals, and LUs that are in the groups. The problem reporter uses this information to analyze response time and bottleneck records.
Response Time Contains an entry for every transaction, program, terminal, or LU that has had some activity in the previous minute.
Bottleneck Contains an entry for every resource name and type that bottleneck analysis has counted over the previous minute.
Fixed Resource Contains the following:� exception status for SOS and MAXT� CICS system information (CPU and paging subanalysis)� storage information� DLI information� temporary storage information� class max task information owing analyses:
Variable Resource Contains the following:� program control table summary� enqueue summary� VSAM file summary� file control table summary� journals summary� transient data queue summaryI/O subanalysis

Interval Record Collector and Problem Reporter 105
Problem Reporter
Problem ReporterThe problem reporter consists of a batch job and a program. There is a sample batch job in member KOCREPT in thilev TKANSAM.
The batch job has three steps:
1. Uses the SMF batch utility to download the SMF interval record collector records to a temporary dataset. The SMF batch utility captures only the interval record collector records. You can bypass this step if you have already downloaded the records to your own site’s dataset.
2. Uses DFSORT to sort them by start time. You can replace this step with your own sort program, provided that it performs the same sorting procedure.
3. Executes the report program to produce the problem reports.The problem reporter accepts the following two parameters:
SMFID=nnn,TOTAL_RESPONSE_THRESHOLD=mm
For nnn, specify the OMEGAMON II for CICS SMFID. This must match the SMFID parameter of the global definition parameter. For a complete description of the global definition parameter, see the OMEGAMON II for CICS Configuration and Customization Guide For the TOTAL_RESPONSE_THRESHOLD parameter, mm specifies the bottleneck analysis threshold. For a description of the bottleneck analysis report, see “Bottleneck analysis graph (phase II analysis)” on page 110
If you are generating your own problem reports, you can use the recording interval that has been added to the INTR header in the SMF record. The record layouts can be found in the thilev TKANSAM dataset, and are as follows:
� KOCINT2 (COBOL)
� KOCPINTR (PL/I)
� KOCSINTR (SAS)
� KOCAINTR (Assembler)

Sample Report
106 OMEGAMON II for CICS Historical Reporting Guide, Version 520
Sample ReportThe problem reporter provides several types of analytical data helpful in diagnosing CICS response time problems. This section describes the report format, explains the types of data that appear on the report, and through the use of report samples, suggests a methodology for using the data to improve your CICS system’s performance.
The report contains a title page and followed by four phases of analysis:
Title pageThe title page contains important information about the status of the CICS system being monitored. The following figure is a sample title page.
FIGURE 19. Problem Report Title Page
The top line of the page includes the report title, the OMEGAMON II version number, and the page number. The next line gives date and time information, as well as the job and step names from the CICS JCL. This information is needed to identify which CICS system is being reported if OMEGAMON II is used to monitor more than one CICS system.
Phase I Response Time History Graph
Phase II Bottleneck Analysis Graph
Phase III Exception Analysis Messages
Phase IV Resource Subanalysis Reports
OMEGAMON LOGGING FACILITY REPORT V520. PAGE 001
4/18/91 14:24:02 JOBNAME=TDOCS01 PROC=CICSC311 STEP=TDOCS01
MAXT=32 AMAXT=10 CMXT=(4,4,4,4,4,4,4,4,4,4)RUNAWAY= 20000 PRTY AGE=1 SCAN DELAY= 100 EXIT INTERVAL= 1000
. . .
. . .
. . .
SYSTEM INITIALIZATION PARAMETERS:
CUSHION= 16384 EXTENDED CUSHION= 16834 DSA= 3538K EDSA= 1572K#TD I/P - (BUFFERS=3,STRINGS=3) #TS AUX - (BUFFERS=3,STRINGS=3)
PROGRAM/TABLE SUFFIXES:
DCT=XA FCT=01 JCT=XA MCT=22 PLTPI=PI PLTSD=SDSIT=6$ SRT=1$ TCT=XA TST=3B XLT=NO
MONITOR STATUS: OFF MONITOR CLASSES ACTIVE: ( NONE )

Interval Record Collector and Problem Reporter 107
Sample Report
Lines three and four report information about the CICS limit parameters. The CICS limit parameters reported are:
The next information that appears on the report title page is the storage cushion size. This is the amount of storage reserved for CICS in case of a short-on-storage condition. The value is in bytes, and is taken from the SIT.
Following the cushion size is the size of the CICS trace table, expressed in number of entries.
The OSCOR value is reported next, expressed in number of bytes.
The START option used to initialize CICS is also reported. The START options that can be reported are WARM, (WARM, ALL), COLD, (COLD, ALL), EMER, or (EMER, ALL).
The line following the START option shows the transient data and temporary storage buffers and strings selected. Following the transient data/temporary storage line are several lines of information showing the suffixes of many CICS control programs and tables. This helps you determine which version of a CICS table was used for this execution of CICS.
If CICS Monitoring is used, the active monitoring classes appear.
Information about the size of the dynamic storage area is also reported on the title page. This information is important because all CICS task storage requests are allocated from this area. If the dynamic storage area is too small, short-on-storage conditions can occur.
MAXT The maximum number of tasks that can execute concurrently.
AMAXT Maximum number of tasks that CICS will consider dispatching on each scan of active task chain (does not apply to CICS 4.1).
CMXT Maximum number of tasks that can exist concurrently in each of the transaction classes (does not apply to CICS 4.1).
RUNAWAY ICVR value in the SIT in seconds. This value is a loop protection facility for application tasks. This timer starts when control is passed to a CICS transaction, and is reset when the transaction gives control back to the task dispatcher, generally through issuance of a CICS macro or command. If this time expires, the transaction is assumed to be looping and is terminated with an AICA abend.
STALL ICVS value in the SIT in seconds. This is the amount of time that must elapse before CICS is considered stalled due to SOS or MAXTASK.Once this interval expires, CICS starts purging tasks in an attempt to alleviate the stall.
SCAN DELAY ICVTSD value in the SIT. This is a built-in delay, applicable to BTAM lines, to allow for line reset or turnaround time. For VTAM, the scan delay value specifies the maximum delay between a VTAM work element queued and CICS processing it.
EXIT INTERVAL ICV value in the SIT indicating the maximum amount of time for which CICS will relinquish control to the operating system when there are no ready tasks.

Sample Report
108 OMEGAMON II for CICS Historical Reporting Guide, Version 520
Groups reportThis report contains the group definitions that apply to the following Phase I and Phase II analyses. For more information about groups, see the OMEGAMON II for CICS Configuration and Customization Guide. The following figure shows a sample group definitions report.
FIGURE 20. Problem Report Groups Report.
This report describes each group, the average response time threshold and the transaction, program, terminal, or LU elements contained within it. The threshold is the average response time at which exception analysis shows a warning message that the ID group is suffering from poor response time.
Response time history graph (phase I analysis)Phase I information accumulates for the life of the interval before being written.
When an ID group exceeds its threshold, the problem reporter formats response time information for that group. This information is shown in a graph of response time history over 10 minutes. The following figure is a sample Phase I report.
GROUP DEFINITIONS:
GROUP# GROUP NAME THRESHOLD - TRANSACTIONS / PROGRAMS / TERMINALS --------- ------------ ----------- -----------------------------------------
1 TRAN GRP A* 6.0 SEC A*2 TRAN GRP B* 6.0 SEC B*3 TRAN GRP C* 6.0 SEC C*4 TRAN GRP D* 6.0 SEC DCPU,DEGG,DEGS,DEGT,DEGV,DLCL,EIPT,EIST,ENQ1
ENQ2,ENQ3,MISC,D*
. . .
. . .
. . .

Interval Record Collector and Problem Reporter 109
Sample Report
FIGURE 21. Problem Report Response Time History Graph
The vertical axis of the graph is the average response time in seconds. The maximum value shown on the vertical axis (in this case 12.0 seconds) is automatically set to twice the defined threshold. In this case, the defined threshold is 6.0 seconds, so the maximum response time shown is 2(6.0) seconds, or 12.0 seconds.
There are ten points on the vertical axis, starting with a low of 1/10 of the scale value (in this case 1.2 seconds), and incrementing by multiples of 1/10 of the scale value.
The horizontal axis of the graph is the intervals scale (for the recording interval), progressing from the average response time for the group 9 minutes ago, as shown on the left, to the average response time for the last minute, as shown on the right above the 0 minute column. In this figure, the average response time for this group has varied over the last 10 minutes from a low of less than 1.2 seconds 8 minutes ago (no * appears in column -8), to a high of 6.0 seconds 1 minute ago.
The line of dashes, shown at 6.0 seconds on the vertical axis, marks the threshold for this group. This allows you to more easily see where the average response time was in relation to the threshold set for the group. The threshold value also appears in the title just above the graph.
With this 10-minute graph, you can easily spot response time trends. If the graph shows low values on the left and steadily higher values to the right, response time is getting worse. If the values are high on the left and getting lower towards the right, response time is improving.
In addition, the following message appears on this report when you have changed the recording interval dynamically in either the CUA interface or the menu system:
RESET DUE TO INTERVAL / DEPTH OF ANALYSIS CHANGE
If you reset the recording interval, data accumulated for the current interval (but not yet written to SMF) is discarded.
_______________________|10 INTERVAL RESPONSE || TIME HISTORY (SEC) |
SECS |>THRESHOLD= 6.0 SEC< |---- |---------------------|12.0 | |10.8 | |9.6 | |8.4 | |7.2 | |6.0 |- - - - - - - - - -*-|4.8 | * * |3.6 | * * * * * * * * |2.4 | * * * * * * * * * |1.2 | * * * * * * * * * |
|_____________________|-8 -6 -4 -2 0
INTERVALSRECORDING INTERVAL= 2 MIN
> > P H A S E I < <

Sample Report
110 OMEGAMON II for CICS Historical Reporting Guide, Version 520
Bottleneck analysis graph (phase II analysis)Phase II information accumulates for the life of the interval before being written.
Beside each transaction group’ response time graph is a graph of the response time degradation for the group. The information is supplied by the bottleneck analysis subtask, which periodically analyzes the CICS task chains to see why the tasks are waiting. The data is collected on a statistical sampling basis to reduce overhead without sacrificing detail.
Following is an example of a bottleneck analysis graph.
FIGURE 22. Problem Report Bottleneck Analysis Graph
The bottleneck analysis subtask counts which tasks are waiting by wait reason; the problem reporter uses this count to compute the percentages and time component values in the bottleneck analysis graph.
Within the box is the wait reason, a percent component that shows how much of the total wait count was caused by that wait reason, and a time component that shows how much of the average response time for the last minute can be attributed to that wait reason.
In this example, 100% of response time (6.9 seconds) is spent waiting on interval control. Typically, this wait could occur for a group whose transactions issue EXEC CICS DELAY requests.
The time component is computed by multiplying the wait percent value by the average response time for the last minute. The time component gives you an estimate of how much you can improve response time, if tuning efforts are successful in eliminating the time spent waiting for a particular resource.
To limit the reporting of wait reasons that do not represent a significant cause of response time degradation, the problem reporter does not report a wait category whose percent component is below a specified threshold. The threshold is supplied with the THRESH parameter in the problem reporter batch job.
For information about the THRESH parameter, see “Problem Reporter” on page 105
In addition, the following message appears on this report when you have changed the recording interval dynamically in either the CUA interfaceor the menu system:
RESET DUE TO INTERVAL / DEPTH OF ANALYSIS CHANGE
If you reset the recording interval, data accumulated for the current interval (but not yet written to SMF) is discarded.
_________________________________________________________| RESPONSE TIME COMPONENTS FOR LAST INTERVAL ||-------------------------------------------------------|| WAIT REASON | PERCENT COMPONENT | TIME COMPNT ||------------------|----------1---50--100|--------------||ICWAIT ******** | 100% ==========>| 6.9 SEC||ICWAIT 0A22 | 100% ---------->| 6.9 SEC||_______________________________________________________|
TASKS SAMPLED=7 AVERAGE RESPONSE= 6.9 SEC
> > P H A S E I I A N A L Y S I S < <

Interval Record Collector and Problem Reporter 111
Sample Report
Exception reports (phase III analysis)Phase III information is a snapshot taken while the SMF record is being written.
After all Phase I and Phase II reports are generated for groups over their thresholds, the problem reporter shows the exceptional condition messages. When the problem reporter produces a response time and bottleneck analysis graph for an ID group, it checks the CICS CSA information in the fixed resource record to see if CICS was in a short-on-storage or max task condition. If either of these conditions exists, the problem reporter formats the appropriate message. Following is an example of an exception report.
FIGURE 23. Problem Report Exception Report
Note: If you reset the recording interval, data accumulated for the current interval (but not yet written to SMF) is discarded.
Resource subanalysis reports (phase IV analysis)Phase IV information is a snapshot taken while the SMF record is being written.
The fixed and variable resource records contain analyses of the following areas:
� CPU usage
� paging performance
� DSA and, for CICS/ESA, EDSA information
� DLI bottlenecks
� temporary storage queues
� class max task information
� VSAM files
� CICS enqueues
� CICS files
� journals
� transient data queues
� DASD I/O
Note: If you reset the recording interval, data accumulated for the current interval (but not yet written to SMF) is discarded.
Each report is explained in the sections that follow.
> > P H A S E I I I A N A L Y S I S < <
************************************************ SYSTEM IS AT MAX TASK **
**********************************************

Sample Report
112 OMEGAMON II for CICS Historical Reporting Guide, Version 520
CPU subanalysis
The CPU subanalysis report shows CPU utilization, MVS dispatching priority, and SRM performance group. The CPU utilization is broken down into CICS CPU usage (TCB) and MVS services time on behalf of CICS (SRB). Following is an example of a CPU subanalysis report.
FIGURE 24. Problem Report CPU Subanalysis
Paging Subsystem Subanalysis
The Paging Subsystem Subanalysis report provides paging performance information. Private and common area page-in rates are shown. The private area working set size, fixed frame count, ASM queue depth, and average milliseconds per page transfer rate are shown.
If storage isolation is implemented in the system, these values for both the CICS region (private area) and the CSA (common service area) are shown. This includes the maximum, minimum, and target values you specify for working set sizes and page-in rates, and the actual working set size and page-in rates. Following is an example of a paging subsystem subanalysis report.
FIGURE 25. Problem Report Paging Subsystem Subanalysis
CPU-TCB ( .1%), SRB( .0%); Prio( 49); PerfGrp=510
--- Paging Subsystem Subanalysis ---
Fixed Frames=65; ASM Queue Depth=0; MS/Page=0
Private Area StatisticsPage-in count . . . . . : 2532 Page-out count . . . . : 0Page-in time units . . : CPU Page-in rate/second . . : 1600.00PPGRT(R) minimum . . . : None PPGRT(R) maximum . . . : NoneTarget working set size : None Real working set size . : 592KExpand working set size : 40K Actual working set size : 632KMinimum working set size: None Maximum working set size: None
Common Area StatisticsPage-in count . . . . . : 88 Page-in rate/second . . : 0CPGRT minimum . . . . . : 2 CPGRT maximum . . . . . : 4Target working set size : 17608K Actual working set size : 8492KMinimum working set size: 200K Maximum working set size: 8192G

Interval Record Collector and Problem Reporter 113
Sample Report
Dynamic Storage Area (DSA) Subanalysis for CICS/ESA 3.3
The Dynamic Storage Area (DSA) Subanalysis report shows DSA information, for several types of DSAs and OSCOR summary. Following is an example of a DSA subanalysis report that reflects CICS/ESA Version 3.3.
FIGURE 26. Problem Report DSA Subanalysis for CICS/ESA 3.3
--- DSA Subanalysis for CICS 3.3 ---
CDSA Summary
CDSA size . . . . . . . : 512K Cushion size . . . . . : 64KCurrent free space . . : 236K Largest free area . . . : 180KCurrent tasks suspended : 0 Total tasks suspended . :Currently SOS . . . . . : No Total times SOS . . . . : 0
UDSA SummaryUDSA size . . . . . . . : 512K Cushion size . . . . . : 64KCurrent free space . . : 236K Largest free area . . . : 180KCurrent tasks suspended : 0 Total tasks suspended . : 0Currently SOS . . . . . : No Total times SOS . . . . : 0
ECDSA SummaryECDSA size . . . . . . : 3072K Cushion size . . . . . : 128KCurrent free space . . : 960K Largest free area . . . : 952KCurrent tasks suspended : 0 Total tasks suspended . : 0Currently SOS . . . . . : No Total times SOS . . . . : 0
EUDSA SummaryEUDSA size . . . . . . : 1024K Cushion size . . . . . : 64KCurrent free space . . : 1024K Largest free area . . . : 180KCurrent tasks suspended : 0 Total tasks suspended . : 0Currently SOS . . . . . : No Total times SOS . . . . : 0
ERDSA SummaryERDSA size . . . . . . : 3072K Cushion size . . . . . : 256KCurrent free space . . : 508K Largest free area . . . : 508KCurrent tasks suspended : 0 Total tasks suspended . : 0Currently SOS . . . . . : No Total times SOS . . . . : 0
OSCOR SummaryTotal free . . . . . . : 1567K Largest free . . . . . : 148KPrivate area size . . . : 7148K Region size . . . . . . : 32768K

Sample Report
114 OMEGAMON II for CICS Historical Reporting Guide, Version 520
Dynamic Storage Area (DSA) Subanalysis for CICS/ESA 4.1
The following report reflects CICS/ESA 4.1.
FIGURE 27. Problem Report DSA Subanalysis for CICS 4.1
--- DSA Subanalysis for CICS 4.1 ---
CDSA Summary
CDSA size . . . . . . . : 512K Cushion size . . . . . : 64KCurrent free space . . : 236K Largest free area . . . : 180KCurrent tasks suspended : 0 Total tasks suspended . : 0Currently SOS . . . . . : No Total times SOS . . . . : 0
UDSA SummaryUDSA size . . . . . . . : 0K Cushion size . . . . . : 64KCurrent free space . . : 0K Largest free area . . . : 180KCurrent tasks suspended : 0 Total tasks suspended . : 0Currently SOS . . . . . : No Total times SOS . . . . : 0
SDSA SummarySDSA size . . . . . . . : 256K Cushion size . . . . . : 64KCurrent free space . . : 252K Largest free area . . . : 252KCurrent tasks suspended : 0 Total tasks suspended . : 0Currently SOS . . . . . : No Total times SOS . . . . : 0
RDSA SummaryRDSA size . . . . . . . : 256K Cushion size . . . . . : 64KCurrent free space . . : 120K Largest free area . . . : 120KCurrent tasks suspended : 0 Total tasks suspended . : 0Currently SOS . . . . . : No Total times SOS . . . . : 0
ECDSA SummaryECDSA size . . . . . . : 3072K Cushion size . . . . . : 128KCurrent free space . . : 960K Largest free area . . . : 952KCurrent tasks suspended : 0 Total tasks suspended . : 0Currently SOS . . . . . : No Total times SOS . . . . : 0
EUDSA SummaryEUDSA size . . . . . . : 1024K Cushion size . . . . . : 0KCurrent free space . . : 1024K Largest free area . . . : 1024KCurrent tasks suspended : 0 Total tasks suspended . : 0Currently SOS . . . . . : No Total times SOS . . . . : 0
ESDSA SummaryESDSA size . . . . . . : 0K Cushion size . . . . . : 64KCurrent free space . . : 0K Largest free area . . . : 180KCurrent tasks suspended : 0 Total tasks suspended . : 0Currently SOS . . . . . : No Total times SOS . . . . : 0
ERDSA SummaryERDSA size . . . . . . : 3072K Cushion size . . . . . : 256KCurrent free space . . : 508K Largest free area . . . : 508KCurrent tasks suspended : 0 Total tasks suspended . : 0Currently SOS . . . . . : No Total times SOS . . . . : 0
OSCOR SummaryTotal free . . . . . . : 1567K Largest free . . . . . : 1484KPrivate area size . . . : 7148K Region size . . . . . . : 32768K

Interval Record Collector and Problem Reporter 115
Sample Report
DLI Subanalysis
The DLI Subanalysis report concentrates on memory resource bottlenecks, within the CICS/DLI interface, and shows the total number of threads and average number of threads in use. The pool utilization portion of the report shows the pool ID, the size of the pool, the amount of the pool in use, and the percentage of pool utilization.
Note: For IMS 1.3, if IRLM is active (DLIRLM=YES in the SIT), there are no ENQ pool statistics, because the IRLM address space contains the ENQ pool.
Following is an example of a DLI subanalysis report.
FIGURE 28. Problem Report DLI Subanalysis
Temporary Storage Subanalysis
The Temporary Storage Subanalysis report shows main and auxiliary storage used by temporary storage management. This report shows the number of control intervals (CIs) in use and percentage used, number of records put in main storage and auxiliary storage, and the current and maximum amount of main storage used. Following is an example of a temporary storage subanalysis report.
FIGURE 29. Problem Report Temporary Storage Subanalysis
Class Max Tasks Subanalysis
The Class Max Tasks subanalysis report shows information you can use to identify problems with tasks by class. The report shows the current and high water mark (HWM) count of tasks in each class. Following is an example of a class max tasks subanalysis report.
Note: This report is not generated for CICS Version 4.1.
FIGURE 30. Problem Report Class Max Tasks Subanalysis
--- DLI Subanalysis ---
DL/1 Threads: Total=5, Average in use=0Pool ID Size In Use Utilization(%)
DMB 8192 0 .0PSB 8192 0 .0ENQ 4096 0 .0
Temp. Stor. CIs in use=1(1%); #Records(Main/Aux)=0/1Virtual Storage usage (current/maximum)=0/0
--- Class Max Tasks Subanalysis ---Tasks by Class (Current/HWM):
1-( 0/ 0); 2-( 0/ 0); 3-( 0/ 0); 4-( 0/ 0); 5-( 0/ 0)6-( 0/ 0); 7-( 0/ 0); 8-( 0/ 0); 9-( 0/ 0); 10-( 0/ 0)

Sample Report
116 OMEGAMON II for CICS Historical Reporting Guide, Version 520
VSAM Subanalysis
The VSAM Subanalysis report shows all VSAM files allocated to the CICS region. For each VSAM filename, the report shows the current and total number of string waits, the number of data exceptions, and the control interval and control area splits. Following is an example of a VSAM subanalysis report.
FIGURE 31. Problem Report VSAM Subanalysis
CICS Enqueue Subanalysis
The CICS Enqueue Subanalysis report shows all currently enqueued resources with a transaction waiting on them. All transactions waiting for the resource are shown with their task number. Following is an example of an enqueue subanalysis report.
FIGURE 32. Problem Report CICS Enqueue Subanalysis
File File Current Total Data Data DataName Status Str Wts Str Wts Excps CI Split CA Split-------- -------- -------- -------- -------- -------- --------DFHLCD No FCT n/a n/a n/a 4 0DFHGCD No FCT n/a n/a n/a 74 0DFHRSD No FCT n/a n/a n/a 0 0DFHJACD No FCT n/a n/a n/a n/a n/aDFHTEMP Tmp Stor 0 0 n/a n/a n/aDFHINTRA Trn Data 0 0 n/a n/a n/a
--- VSAM Subanalysis ---
--- CICS Enqueue Subanalysis ---Enqueue Data Data Owning Owning WaitingResource Type Length Tran ID Task No. Tasks------------------ -------- -------- -------- ----------------FRED Variable 4 CECI 76 1

Interval Record Collector and Problem Reporter 117
Sample Report
CICS File Subanalysis
The CICS File Subanalysis report shows all files defined to CICS. This report is used in conjunction with the I/O report to determine high use datasets or DASD volume contention. The following figure shows a sample file subanalysis report.
FIGURE 33. Problem Report CICS File Subanalysis
Journal Control Subanalysis
This Journal Control Subanalysis report shows all journals and their status. The following figure shows a sample journal control report.
FIGURE 34. Problem Report Journal Control Subanalysis
Note: This report is not available if you are using CICS/ESA 5.1.
--- CICS File Subanalysis ---
File File File Data Share Active RemoteID Access Status Format Control Strings System-------- -------- -------- -------- -------- --------
--------ABCD001 VSAM Dis Clo FB Lsrpool2 0 n/aABCD002 VSAM Ena Clo VB Lsrpool4 0 n/aABCD003 VSAM Ena Clo VB Lsrpool5 0 n/aBDAMFILE BDAM Dis Clo Undef n/a 0 n/aDEG VSAM Ena Clo VB Lsrpool8 0 n/aDFHCSD VSAM Ena Clo VB Lsrpool1 0 n/aEFGH001 VSAM Dis Clo FB Lsrpool2 0 n/aEFGH002 VSAM Ena Clo VB Lsrpool7 0 n/aEFGH003 VSAM Ena Clo VB Lsrpool6 0 n/aFILEA VSAM Ena Clo FB Lsrpool4 0 n/aFILEB VSAM Ena Clo FB Lsrpool6 0 n/a
. . . . . . . .
. . . . . . . .
. . . . . . . .
--- Journal Control Subanalysis ---
Journal Journal I/O Journal Current Switch ErrorID Type Type Status Extent Options Options-------- -------- -------- -------- -------- -------- --------01 Disk/2 Input Open DFHJ01B Auto Crucial02 Disk/1 Input Open DFHJ02A Pause Crucial03 Disk/2 Output Open DFHJ03A None Crucial04 Disk/1 Output Closed DFHJ04A None Crucial05 SMF Output Open None None Crucial

Sample Report
118 OMEGAMON II for CICS Historical Reporting Guide, Version 520
Destination Queue Subanalysis
This Destination Queue Subanalysis report shows all transient data queues. For each queue, the report shows the destination ID and type, status, indirect queue ID, automatic transaction initiation (ATI) facility and transaction ID, and trigger level. The following figure shows a sample destination queue subanalysis report.
FIGURE 35. Problem Report Destination Queue Subanalysis
I/O Subsystem Subanalysis
The I/O Subsystem Subanalysis report provides DASD device I/O counts. If RMF is active in the system, the report provides comprehensive long-term DASD device utilization statistics.
For a DASD device allocated to the CICS region, this report shows total systemwide and CICS I/Os per second, percent device busy, average IOS queue length, average total device response time in milliseconds, average IOS queuing time in milliseconds, and average device service time in milliseconds. The following figure shows a sample I/O subsystem subanalysis report.
FIGURE 36. Problem Report I/O Subsystem Subanalysis
--- Destination Queue Subanalysis ---
Dest Dest Dest Indirect ATI ATITriggerID Type Status Queue Facility Tran ID
Level-------- -------- -------- -------- -------- --------
--------CADL Indirect n/a CSSL n/a n/a
n/aCDBC Indirect n/a CSSL n/a n/a
n/aCDUL Indirect n/a CSSL n/a n/a
n/aCPLD Indirect n/a CPLI n/a n/a
n/aCPLI Extra Ena Ope n/a n/a n/a
n/aCRDI Indirect n/a CSSL n/a n/a
n/a. . . . . . .. . . . . . .. . . . . . .
--- I/O Subsystem Subanalysis ---
Volume I/O Per Second Util% Avg.Q Resp = IOSQ + Pend + Conn + Disc---------- Total CICS ----- ----- ------ ------ ------ ------------0161 SYSXX5 .0 .0 .0 .00 .0 .0 .0 .0 .00164 CAN001 2.7 .0 1.2 .00 3.8 .0 .5 1.4 1.80302 OMON28 .0 .0 .1 .00 10.5 .0 .1 2.3 8.00303 OMON29 .0 .0 .0 .00 22.0 .0 .0 3.0 19.00316 OMON24 .0 .0 .0 .00 11.0 .0 .0 1.0 10.00319 OMON35 .0 .0 .4 .00 69.0 .0 24.5 19.4 25.0031A PPSMPE .2 .0 1.3 .00 21.8 .0 .5 6.6 14.60323 PPSMP3 .0 .0 .0 .00 .0 .0 .0 .0 .00329 IMS100 .0 .0 .0 .00 .0 .0 .0 .0 .0032E OMON33 .0 .0 .0 .00 .0 .0 .0 .0 .00338 OMON20 .0 .0 .0 .00 .0 .0 .0 .0 .0

Interval Record Collector and Problem Reporter 119
Sample Report
Problem reporter messagesFor input that does not match the SMFID parameter of the global definition parameter (as expected from a standard interval record collector run), the following messages apply:
REPT: TITLE RECORD MISSING OR OUT OF SEQUENCE
This message appears when the problem reporter finds a record with a specific timestamp, but it has not found a title record. These records are ignored until the problem reporter finds a valid title record. This can happen if an SMF switch has occurred while the interval record collector was running.
REPT: GROUP RECORD MISSING OR OUT OF SEQUENCE
This message appears if the record immediately following a title record is not another title record or a group record. The record is ignored until the problem reporter finds a valid group or title record.
REPT: BOTTLENECK ANALYSIS RECORD MISSING OR OUT OF SEQUENCE
This message appears when an interval record is analyzed and shows response problems but the next record is not a title, group, or bottleneck record. The record is ignored.
REPT: FOUND RECORD WITH WRONG TIMES
This message appears when a record is read that has a different timestamp than the previous record, but the previous record was not a termination record. The record is ignored, unless it is a title record. If your site runs its reports while the interval record collector is reporting for two or more CICS regions, you may see this message frequently. It will also appear if there is an SMF write failure or the OMEGAMON IIcommon interface (CI) is shut down.

Sample Report
120 OMEGAMON II for CICS Historical Reporting Guide, Version 520

SAS Historical Reporting 121
SAS Historical Reporting
OverviewSAS supplements the existing Historical Reporter component of OMEGAMON II and provides
� an alternative reporting mechanism if you prefer to use SAS.
� sample SAS reports that you may adapt to local requirements.
� a means to generate one-off reports without you having in-depth knowledge of SAS.
� a means to generate response time group definitions that you can imbed into your global data area module (GLOBAL_OPTIONS).
For more information, see “Customer Support Contact Information” on page 235.
Chapter ContentsRequirements . . . . . . . . . . . . . . . . . . . . . . . . . . . . . . . . . . . . . . . . . . . . . . . . . . . . . . . . . . . . . . . . .122Using SAS. . . . . . . . . . . . . . . . . . . . . . . . . . . . . . . . . . . . . . . . . . . . . . . . . . . . . . . . . . . . . . . . . . . .123Overview of the SAS Historical Reporting Process . . . . . . . . . . . . . . . . . . . . . . . . . . . . . . . . . . . . .124Preparing to Run the Sample SAS Reports . . . . . . . . . . . . . . . . . . . . . . . . . . . . . . . . . . . . . . . . . . .126Installation Procedures . . . . . . . . . . . . . . . . . . . . . . . . . . . . . . . . . . . . . . . . . . . . . . . . . . . . . . . . . .127Customization Procedures. . . . . . . . . . . . . . . . . . . . . . . . . . . . . . . . . . . . . . . . . . . . . . . . . . . . . . . .128How the SAS Code Maps the SMF 110 Record . . . . . . . . . . . . . . . . . . . . . . . . . . . . . . . . . . . . . . .130Running the Daily Collection Jobs . . . . . . . . . . . . . . . . . . . . . . . . . . . . . . . . . . . . . . . . . . . . . . . . .132Producing Reports from the SAS DETAIL Dataset. . . . . . . . . . . . . . . . . . . . . . . . . . . . . . . . . . . . . .137Producing Reports from the SAS DAILY Dataset . . . . . . . . . . . . . . . . . . . . . . . . . . . . . . . . . . . . . . .156Producing Reports through the Generalized Report Writer . . . . . . . . . . . . . . . . . . . . . . . . . . . . . . .175Building Response Time Transaction Groups . . . . . . . . . . . . . . . . . . . . . . . . . . . . . . . . . . . . . . . . .184
7
Requirements
122 OMEGAMON II for CICS Historical Reporting Guide, Version 520
RequirementsThe following requirements apply:
� You should have some knowledge of SAS if you intend to customize any of the SAS code that Candle supplies.
Note: The code described herein was tested under SAS 6.08.

SAS Historical Reporting 123
Using SAS
Using SASThrough SAS you can
� allocate a sequential SAS DETAIL dataset that contains a complete day’ worth of collected data.
� allocate a sequential SAS DAILY dataset that contains 31 days of summarized, aged information from the DETAIL dataset.
� use a Generalized Report Writer to produce custom reports on any collected data.
� use the Response Time Transaction Group Build program to analyze the collected SAS data and build response time group parameter entries. You can then insert these parameters into the OMEGAMON II global data area module (GLOBAL_OPTIONS).

Overview of the SAS Historical Reporting Process
124 OMEGAMON II for CICS Historical Reporting Guide, Version 520
Overview of the SAS Historical Reporting ProcessThe flowchart in Figure 37 on page 125 shows each step in the SAS historical reporting process, from OMEGAMON II data collection to SAS report creation.
Note: To collect performance data, SMF recording must be enabled for OMEGAMON II. You can enable SMF recording during product customization. For more information, see the chapter on SMF considerations in the OMEGAMON II for CICS Configuration and Customization Guide.
Number key for the flowchartThe following table explains the numbers that appear in the flowchart in Figure 37 on page 125.
Stage Description
1 OMEGAMON II collects performance data using additional event monitoring points defined in the MCT and clocks and counters information defined in the GLOBAL_OPTIONS module. CICS or OMEGAMON II writes performance data as SMF 110 records and, optionally, clocks and counters information as SMF user records.
2 SAS creates a DETAIL dataset and, using job KC2SMFJ, populates it with collected SMF data.
3 SAS uses data in the SAS DETAIL dataset (through job KC2REPTJ) to generate Candle-supplied reports and charts (KC2TRPn and KC2TCHn).
4 You can generate user-defined reports by using the Candle-supplied Generalized Report Writer job KC2GRWJ.
5 You can generate response time group definitions by using the Candle-supplied transaction group build job KC2TRXJ.
6 At the end of the day, SAS summarizes the DETAIL dataset to the DAILY dataset and archives the DETAIL dataset to cartridge (through job KC2DLYJ) for post processing purposes.
7 SAS uses data in the SAS DAILY dataset (through job KC2REPTJ) to generate Candle-supplied reports and charts (KC2DRPn and KC2DCHn).
8 Ad hoc reports may be produced directly from the SMF dataset using job KC2ADHCJ.

SAS Historical Reporting 125
Overview of the SAS Historical Reporting Process
FIGURE 37. SAS Historical Reporting Process

Preparing to Run the Sample SAS Reports
126 OMEGAMON II for CICS Historical Reporting Guide, Version 520
Preparing to Run the Sample SAS ReportsThis chapter provides the steps you follow to prepare to run the sample SAS reports that Candle supplies. The preparatory steps are as follows:
1. Create and populate the SAS runtime JCL and macro libraries.
2. Allocate the sequential SAS datasets.
3. Customize SAS macros.
4. Run the daily collection jobs to populate the SAS DETAIL and DAILY datasets.For details on these steps see the sections that immediately follow. Also see “Coding User-Defined Exits” on page 201 for additional SAS code that is used internally.
Location of the SAS codeAll the SAS code described in this chapter is distributed through the OMEGAMON II thilev.TKANSAM target library.

SAS Historical Reporting 127
Installation Procedures
Installation ProceduresThe following sections describe the installation procedures you can perform. Perform installation only once.
Create and populate the SAS runtime JCL and macro librariesTo allocate and populate the SAS system files, edit and submit the JCL in the TKANSAM library member KC2SASJB. The IEBGENER job allocates two PDS files—KC2SJCL and KC2SPROG—and copies specific members into them from the TKANSAM library. The purpose of these files is as follows:
Important: Any further customization that you perform should be done on the members in the KC2SJCL and KC2SPROG PDS files. Do not make changes directly to members in the TKANSAM library because it is an SMP/E library that could change due to Candle maintenance.
Allocate the sequential SAS datasets—DETAIL and DAILYTo create the DETAIL and DAILY SAS datasets, edit and submit the supplied job KC2ALOCJ, located in the KC2SJCL dataset. SAS requires that a standard sequential dataset be allocated for use as the repository for all the data collected from OMEGAMON II. The purpose of these datasets is as follows:
� The DETAIL dataset contains one or two data files:
– The CICSTRAN data file consisting of one record for each logical SMF 110 record; that is, one per CICS transaction. This information is gathered daily from the SMF datasets. Each stored record is approximately 2259 bytes.
– An optional DBD data file that contains database clocks and counters information for each transaction collecting DBCOL information from the global data area (GLOBAL_OPTIONS). Each stored record is approximately 76 bytes.
� The optional DAILY dataset comprises data files (one per day) that contain summarized information gathered from the DETAIL dataset and aged over a number of days. As supplied, 31 days of information is retained. Each stored record is approximately 824 bytes.
If you do not want to produce summarized data, do not create the DAILY dataset.
KC2SJCL Contains JCL procedures to allocate and maintain the SAS database and run the sample SAS reports.
KC2SPROG Contains SAS system macros and the sample programs.

Customization Procedures
128 OMEGAMON II for CICS Historical Reporting Guide, Version 520
Customization ProceduresThis section describes the customization procedures you can perform. You perform customization only once.
Customize SAS macros and programsReview and customize the following SAS macro members in the order indicated. These members are located in the KC2SPROG dataset.
1. Customize KC2GRP and KC2GRF with group definitions and names. KC2GRP allows you to group transactions for reporting purposes. Transactions defined in Group 0 are “overhead” transactions and can be excluded from any report. The sample KC2GRP member contains entries for some sample groups.KC2GRF defines names for the groups created in the KC2GRP macro.
2. Customize KC2CMPY with your company name. This name appears in the title of all reports produced.
3. Customize KC2SHFT with shift times if you want reporting by shift; otherwise, skip this step.
4. The default shifts are 8 a.m. to 5 p.m. (day shift), 5 p.m. to midnight (evening shift), and midnight to 8 a.m. (night shift).
5. Customize KC2WEEK to define the first day of the week at your site.
6. The default first day of the week is Sunday.
7. Review SAS macros for SMF record mappings. Candle supplies the SMF mappings listed below. These mappings are equivalent to complete SMF 110 records; no fields have been excluded. For more information on the SMF 110 records, see “How the SAS Code Maps the SMF 110 Record” on page 130.
KC2V212 Provides the mapping of the CICS-produced SMF 110 record for CICS Version 2.1.2.
KC2VOM2 Provides the mapping of the OMEGAMON®-produced SMF 110 record for CICS Version 2.1.2.
KC2V311 Provides the mapping of the CICS-produced SMF 110 record for CICS Version 3.1.1.
KC2V321 Provides the mapping of the CICS-produced SMF 110 record for CICS Version 3.2.1.
KC2V330 Provides the mapping of the CICS-produced SMF 110 record for CICS Version 3.3.0. ‘
KC2V410 Provides the mapping of the CICS-produced SMF 110 record for CICS Version 4.1.
KC2V41A Provides the mapping of the CICS-produced SMF 110 record for the CICS Version 4.1 AOR sample supplied by IBM.
KC2V41C Provides a sample mapping to accommodate a user-defined event monitoring point (EMP) located immediately after the CICS data.

SAS Historical Reporting 129
Customization Procedures
If you exclude fields from the MCT, you must modify the SMF 110 mapping accordingly. To do so, create a new member name, then copy to it the appropriate mapping that corresponds to the CICS release. You should then comment out redundant fields that were excluded. If you use CICS Version 3.x and above, job KC2DICTJ is supplied to print the dictionary records.
Note: KC2DICTJ reads and reports the structure of the dictionary record and assists you in determining the format of your SMF 110 records.
8. If user-defined mappings are created as a result of the previous step, review and customize KC2PICK to invoke the new mapping. The SAS code located in KC2PICK demonstrates how to select a specific mapping according to the CICS release or applid.
Note: SMF 110 record layouts differ across CICS releases. You may have different SMF mappings for CICS systems at the same release level due to MCT field exclusions. The main SMF converter program, KC2SMFR, invokes KC2PICK to determine which SMF 110 mapping to use. The actual SMF mappings are retained in separate members.
9. Review KC2BSC. This SAS macro, used within the SMF converter program KC2SMFR, provides a mapping of the 132-byte OMEGBSC EMP that Candle supplies.(See “Running the Daily Collection Jobs” on page 132 for more information on KC2SMFR.)If you have excluded fields from the default OMEGBSC supplied by Candle, you must modify this member accordingly.
Caution: Be sure you specify the length of the customized OMEGBSC correctly.
In Version 300 of OMEGAMON II, you can control the size of the OMEGBSC data area. The sample KC2BSC member demonstrates how to select a specific mapping according to the CICS applid. The sample shows how to define a mapping to be used by a CICS system, ”NODBCICS”, that excludes the eight 4-byte database clocks and counters fields. This exclusion reduces the size of the OMEGBSC from 132 bytes–100 bytes. All other CICS systems use the standard 132-byte definition supplied by Candle. This accommodates those users who may have customized their OMEGBSC EMP differently for separate CICS systems.
For more information on the mapping of the SMF 110 record, see “How the SAS Code Maps the SMF 110 Record” on page 130.
KC2V41F Provides the mapping of the CICS-produced SMF 110 record for the CICS Version 4.1 FOR sample supplied by IBM.
KC2V41T Provides the mapping of the CICS-produced SMF 110 record for the CICS Version 4.1 TOR sample supplied by IBM.
KC2V510 Provides the mapping of the CICS-produced SMF 110 records for CICS Version 5.1.

How the SAS Code Maps the SMF 110 Record
130 OMEGAMON II for CICS Historical Reporting Guide, Version 520
How the SAS Code Maps the SMF 110 RecordThis section explains how the SAS code attempts to map the SMF 110 record.
Note: The supplied SAS code does not use the CICS SMF 110 dictionary record.
Standard CICS recordsWhen either of the following situations exists, the SAS sample programs work without customization:
� OMEGAMON II is generating SMF type 110 records for your CICS Version 2.1.2 environment.
� You have not added or excluded any fields from your CICS MCT, except for event monitoring points (EMPs) required by OMEGAMON II, as directed in the OMEGAMON II for CICS Configuration and Customization Guide.
If either of the above situations is true, you have a standard CICS record, which is illustrated in the following figure.
FIGURE 38. Standard SMF 110 Record Layouts
The EMPs that Candle supplies are assumed to be in the order stated in the OMEGAMON II for CICS Configuration and Customization Guide.
Important: If an additional EMP not created by OMEGAMON II exists at the end of the record, this EMP is ignored if all three OMEGAMON II EMPs are present. In other cases where outside EMPs exist, they may be mistaken for OMEGAMON II data and results will be unpredictable. Therefore, it is recommended that you locate all non-Candle EMPs immediately after the CICS data, then copy the appropriate record layout for the CICS

SAS Historical Reporting 131
How the SAS Code Maps the SMF 110 Record
release or applid, and add a “filler” statement. For details on the SMF record mappings that Candle supplies, see “Customize SAS macros and programs” on page 128.
How the KC2SMFR converter program reads SMF 110 recordsThe KC2SMFR converter program reads the beginning of each SMF record to determine the release of CICS. The exit program, KC2PICK, determines which member of the SAS sample library contains the record layout for that release or applid of CICS.
This record layout usually contains just the portion of the SMF record supplied by CICS. Once the CICS data is read, the program compares the amount of data left in the record to the length of an OMEGBSC EMP. (The OMEGBSC EMP must exist if OMEGAMON II is active in the CICS region, since its absence prevents a number of features of OMEGAMON II from working.) The exit program, KC2BSC, determines which OMEGBSC mapping to use for the release or applid of CICS. If enough data is left, the OMEGBSC EMP data is read. After this point the amount of remaining data is compared to the length of the OMEGDLI (92 bytes) and OMEGDB2 (100 bytes) EMPs. Since each of these record portions has a unique length, both EMPs do not need to be present in order to read the record successfully.
SMF 110 records generated from CICS Version 2In CICS Version 2, OMEGAMON II can generate a pseudo-SMF type 110 record. This allows you to generate transaction performance statistics without incurring the overhead of turning on CICS monitoring (CMF). Generation of this data is controlled by the SMFCICS2 parameter in the GLOBAL_OPTIONS parameter (see the OMEGAMON II for CICS Configuration and Customization Guide for more information). KC2PICK recognizes this record due to its unique size and invokes KC2VOM2 to read the entire record. Any other CICS Version 2 record presented to the program is assumed to be produced by CICS and contains all fields from Version 2, and KC2PICK invokes KC2V212 to read the CICS data.
Mapping the dictionary records in CICS/ESA environmentsIf you are unsure of the type of data your CICS/ESA (Version 3 and above) regions are generating, Candle provides a SAS sample utility to map out the dictionary records in the CICS/ESA environments. Member KC2DICT contains the JCL and SAS program necessary to report on the dictionary record. Member KC2MPOT contains sample report output from KC2DICT.
If you exclude fields from the SMF recordDespite the version of CICS that you use, if you customize your MCT to exclude fields from the SMF record, see steps 5 and 6 on page 129, which describe how to customize the record layouts that Candle supplies.

Running the Daily Collection Jobs
132 OMEGAMON II for CICS Historical Reporting Guide, Version 520
Running the Daily Collection JobsThe last steps that you perform before you run the sample SAS reports are to populate the DETAIL and DAILY datasets.
Populating the DETAIL dataset
Note: See stage 2 shown in Figure 37 on page 125
To extract the SMF records, customize and run the supplied job, KC2SMFJ, located in the KC2SJCL dataset. You may run this job periodically during the day to populate the SAS DETAIL dataset. By the end of the day the DETAIL dataset contains the full day’s worth of SMF CICS data. Alternatively, if you already have procedures in place to gather daily SMF data into one single dataset, you may run this job just once at the end of the day KC2SMFJ does the following:
1. runs the IFASMFDP program supplied by IBM to unload the SMF data to a sequential dataset.
2. runs the SAS program KC2SMFR located in the KC2SPROG dataset, to create a temporary SAS dataset using the input from step 1 (see “Using the KC2SMFR converter program” on page 132 below for details).
3. runs a SAS procedure to append the temporary dataset created in step 2 to the DETAIL dataset.
Using the KC2SMFR converter program
KC2SMFR is the SAS SMF converter program that decodes the SMF 110 records and, optionally, the SMF 255 records. This program creates the SAS data files CICSTRAN and DBD on the DETAIL dataset.
The CICSTRAN and DBD data files created by KC2SMFR contain fields for all the current releases of CICS. For information on these fields, see “Fields Contained in DBD” on page 215 and “Fields Summarized in the DAILY Dataset” on page 217.
KC2SMFR provides the following parameters. Defaults are underlined:
TRAN=YES,NO
Determines whether the CICSTRAN datafile is generated.
DBD=NO,YES
Determines whether the DBD data file that contains clocks and counters information is generated.
DBSMF=255,nnn
Specifies the SMF user record containing clocks and counters information
CICS= ALL,xxxxxxxx
Determines whether SMF records relating to all or a specific or generic CICS applid are processed. For example, CICS=PROD restricts processing to all CICS applids beginning with PROD. Alternatively, you may specify CICS=ALL and use the EXIT= option to accommodate more specific processing.

SAS Historical Reporting 133
Running the Daily Collection Jobs
Running the DETAIL reports and chartsNote: See stage 3 shown in Figure 37 on page 125.
After the DETAIL dataset is populated, you can run DETAIL reports and charts against this dataset using the KC2REPTJ job, located in the KC2SJCL dataset. KC2REPTJ executes the SAS procedure that specifies which of the Candle supplied reports to produce (reports from both the DETAIL and DAILY datasets can be produced by this job). You can see examples of these reports starting on page page 139.
C2SMF=110,nnn
(CICS Version 2). Allows you to specify the same user record number that you specified in the SMFCICS2 parameter of the USER_EVENT_MONITORING parameter (located in GLOBAL_OPTIONS) for the OMEGAMON II-generated subset of the SMF type 110 record.
GMTOFF=99,nn
A value of 99 signifies that the GMT offset in the OMEGBSC should be applied. Candle recommends, however, that you specify an override containing the actual GMT offset; for example, GMTOFF=+8, as not all transactions have an OMEGBSC segment. An example is transactions that started before OMEGAMON II initialized.
UMB=YES,NO
When set to YES, this parameter specifies that if the umbrella program and/or transaction ID are present, they are used in preference to the actual CICS program and/or transaction ID.
For more information, see the chapter on umbrella transaction services in the OMEGAMON II for CICS Configuration and Customization Guide.
EXIT=NO,xxxxxxxx
Specifies the name of a user-written exit program that allows greater selection criteria. For example, to limit the size of the DETAIL file, you may omit specific transactions. An example of the kind of program you would write to exclude records for a particular region and exclude all CICS transactions appears below:
IF SMFMNPRN = “PRODACCT” THEN DELETE; /*drop records for this region*/ IF TRAN =: “C” THEN DELETE; /*and drop ‘CICS’ trans */
For more information on user-written exits, see “Fields Contained in CICSTRAN” on page 205.
DBDEXIT=NO,xxxxxxxx
Specifies the name of a user-written exit program to be applied to the DBD component of the DETAIL file.
For more information on user-written exits, see “Fields Contained in CICSTRAN” on page 205.
STOP=NO,nnn
When set to a numeric value, restricts processing to a specified number of input records for debugging purposes.
DEBUG=NO,YES
When set to YES, this parameter switches debugging on.

Running the Daily Collection Jobs
134 OMEGAMON II for CICS Historical Reporting Guide, Version 520
JCL Example to Specify DETAIL and DAILY Reports
An example of the JCL you enter to specify reports appears below:
Populating the DAILY dataset
Note: See stage 6 shown in Figure 37 on page 125.
Customize and run the supplied job KC2DLYJ, located in the KC2SJCL dataset. This job does the following:
� invokes the KC2SUMD program, located in the KC2SPROG dataset, which takes as input the DETAIL dataset and summarizes its contents into the DAILY dataset (see “Using the KC2SUMD program” on page 135 for details). The DAILY dataset is aged over a user-defined period (the default aging period is 31 days).
� runs a SAS procedure to copy the contents of the DETAIL dataset to a cartridge for archiving. You can produce DETAIL reports directly from this cartridge.
� reallocates the DETAIL dataset to make it available for the next day’s processing.
You can run this job at the end of the day. As explained below, you can then either
� produce reports from an archived copy of the DETAIL dataset.
� produce reports directly from the DAILY dataset.
Important: Although this is an optional procedure, it is one which Candle recommends that you perform.
//STEP01 EXEC SAS608,SASAUTO=&OHILEV.KC2SPROG,// OPTIONS=’MACRO MAUTOSOURCE S=72 S2=72 DQUOTE’//DETAIL DD DISP=SHR,DSN=&OHILEV.SAS.DETAIL//DAILY DD DISP=SHR,DSN=&OHILEV.SAS.DAILY//****************************************************************// PLACE YOUR REPORT OPTIONS AFTER THE SYSIN STATEMENT ALONG WITH*// ANY ADDITIONAL KEYWORD SELECTION CRITERIA. *//****************************************************************//SYSIN DD *%KC2TRP1;%KC2TRP2;%KC2TRP3 (EXIT=MYEXIT); /* ONLY REPORT ON ABENDED */
/* TRANSACTIONS VIA AN EXIT */%KC2TCH1;%KC2DRP7 (DAILYLO=1,DAILYHI=7,SUMBY=WEEK);
%KC2DCH5 (DAILYLO=1,DAILYHI=7);
//MYEXIT DD *IF ABCODEO =: “00”X THEN DELETE; /* DROP TRANS THAT HAVEN’T ABENDED*/

SAS Historical Reporting 135
Running the Daily Collection Jobs
Using the KC2SUMD program
KC2SUMD is the SAS code that summarizes and ages the contents of the DAILY dataset from the DETAIL dataset. Transaction data is summarized by region name, month, week, day, hour, userid, LU name, and transaction ID.
The DAILY dataset occupies significantly less space than the DETAIL dataset and allows long-term summary reports to be produced.
KC2SUMD provides the following parameters. Defaults are underlined:
KC2SUMD does not summarize every field found in the DETAIL dataset. For information on the summarized fields, see “Copying SMF Records to a Journal” on page 221.
The DETAIL dataset archive
Once summarizing and aging have occurred, the DETAIL dataset is archived automatically to cartridge and cleared, ready for the next day’s propagation phase. After the DETAIL dataset has been cleared, you cannot report against it directly. You can, however, report directly against the archived copy using the KC2REPTJ job. In your JCL, just indicate the cartridge that contains the dataset.
Running the DAILY reports and charts
Note: See stage 7 shown in Figure 37 on page 125.
After summarizing and aging have occurred to populate the DAILY dataset, you can produce reports on the DAILY file by using the KC2REPTJ job, located in the KC2SJCL dataset. KC2REPTJ executes the SAS procedure that specifies which Candle supplied reports to produce (reports from both the DETAIL and DAILY datasets can be produced by this job). You can see examples of the DAILY reports starting on page page 158.
DAYS=31,nn
The number of days of data to retain in the DAILY dataset. This assumes that KC2SUMD is run daily. You can determine your own requirements, bearing in mind the overall DASD storage requirements.
EXIT=NO,xxxxxxxx
Specifies the name of a user-written exit program to allow greater selection criteria. For more information on user-written exits, see the section titled “Fields Contained in CICSTRAN” on page 205.
STOP=NO,nnn
When set to a numeric value, this parameter restricts processing to a specified number of input records for debugging purposes.
DEBUG=NO,YES
When set to YES, this parameter switches debugging on.

Running the Daily Collection Jobs
136 OMEGAMON II for CICS Historical Reporting Guide, Version 520
Producing reports directly from SMF data
Note: See stage 8 shown in Figure 37 on page 125.
The job KC2ADHCJ, located in the KC2SJCL dataset, allows you to produce reports without creating a permanent DETAIL dataset. You can produce ad hoc reports directly from the unloaded SMF data, and may specify any number of reports. This job performs the following steps:
1. It runs the IFASMFDP program supplied by IBM to unload the SMF data to a sequential dataset.
2. It runs KC2SMFR, located in the KC2SPROG dataset, to create a temporary SAS dataset that uses the input from step 1. See “Using the KC2SMFR converter program” on page 132 for the parameters.An example of the JCL you could enter appears below.
JCL example to produce reports from SMF data
In the JCL, you can add report statements to the SYSIN DD statement following KC2SMFR. For example, you could enter:
//DETAIL EXEC SAS608,SASAUTO=&OHILEV..KC2SPROG,OPTIONS=’MACRO MAUTOSOURCE S=72 S2=72 DQUOTE’
//DETAIL DD DISP=(,PASS),DSN=&DETAIL,UNIT=SYSDA,// SPACE=(CYL,(50,10))//SMF DD DISP=OLD,DSN=&&SMF//SYSIN DD *
/*THE FOLLOWING STATEMENT READS IN SMF DATA FROM THE SMF DD *//*AND WRITES THE SAS DATA TO THE DETAIL DD Temporary dataset */%KC2SMFR (CICS=ALL,GMTOFF=+8,DBD=YES,DBSMF=255);/* ENTER THE REPORTS YOU WISH TO PRODUCE. */%KC2TRP1;%KC2TRP2;%KC2TRP3;/*

SAS Historical Reporting 137
Producing Reports from the SAS DETAIL Dataset
Producing Reports from the SAS DETAIL DatasetThis section describes the sample SAS reports you can produce from the SAS DETAIL dataset. Report programs KC2TRxx and charts KC2TCHx are provided as samples.
Note: You may customize these programs, but Candle Support Services does not provide assistance for SAS reports that customers create or modify.
Examples of reports run against the DETAIL dataset start on page page 139. Where necessary within each section for the report examples (but not on the report example itself), the title of the report is shortened so that it fits on one line.
Running the sample SAS reportsTo run the supplied sample SAS reports, do one of the following:
� Customize and run the supplied KC2REPTJ job, located in the KC2SJCL dataset, at any time. This job runs the sample SAS reports on either the current SAS DETAIL dataset (or its archived copy) or the summarized DAILY dataset.
� Customize and run the supplied KC2ADHCJ job at any time to report directly against the SMF dataset.
Parameters for the DETAIL reports and chartsThe following parameters are available to the DETAIL sample reports-TRP1 through TRnn and charts TCH1 through TCHnn. Defaults are underlined. Additional parameters for specific reports are listed in the sections describing those reports.
CICS=ALL,xxxxxxxx
Determines whether SMF records relating to all or a specific or generic CICS applid are processed. For example, CICS=PROD restricts processing to all CICS applids beginning with PROD. Alternatively, you may specify CICS=ALL and use the EXIT= option to accommodate more specific processing.
LUNAME=ALL,xxxxxxxx
Processes all VTAM LUs and allows you to restrict processing to a specific or generic LUNAME.
GROUP=ALL,WORKLOAD,nn
Processes transactions that belong to all GROUPS defined in KC2GRP. Allows you to restrict processing to a specific group of transactions. If you specify GROUP=WORKLOAD, then all transactions belonging to GROUP 0 are ignored from all processing.
SHIFT=ALL,nn
Restricts the selection criteria to a specific shift as defined in KC2SHFT.
TERM=ALL,xxxx
Restricts the selection criteria to specific or generic terminal IDs.
TRAN=ALL,xxxx
Restricts the selection criteria to a specific or generic transaction ID.
USERID=ALL,xxxxxxxx

Producing Reports from the SAS DETAIL Dataset
138 OMEGAMON II for CICS Historical Reporting Guide, Version 520
Restricts the selection criteria to a specific or generic userid.
LODATE=NO,mm/dd/yy
Restricts the selection criteria to a specific start date.
LOTIME=NO,hh:mm:ss
Restricts the selection criteria to a specific start time.
HIDATE=NO,mm/dd/yy
Restricts the selection criteria to a specific end date.
HITIME=NO,hh:mm:ss
Restricts the selection criteria to a specific end time.
EXIT=NO,xxxxxxxx
Specifies the name of the exit program you write to allow greater selection criteria. For more information on user-written exits, see “Fields Contained in CICSTRAN” on page 205.
HDR=cc..cc
Allows you to specify an optional heading to be generated as part of the report title.
STOP=NO,nnn
When set to a numeric value, restricts processing to a specified number of input records for debugging purposes.
DEBUG=NO,YES
When set to YES, this parameter switches debugging on.

SAS Historical Reporting 139
Producing Reports from the SAS DETAIL Dataset
KC2TRP1-Response Time Statistics by Transaction report
This report has no additional parameters.
FIGURE 39. Response Time Statistics by Transaction
1 !CANDLE CORPORATION 08:27 Monday, September 18, 1995 1TRANSACTION RESPONSE TIME STATISTICS - KC2TRP1
DATA FROM 14SEP95:07:01:19 TO 14SEP95:14:54:40
------------------------------------------------------- CICS*Region=PROD --------------------------------------------------------
Average Maximum Minimum 90TH Percentile 95TH PercentileTran Transaction Response Response Response Standard Response Time Response TimeID Count (Secs) (Secs) (Secs) Deviation (Secs) (Secs)
AADD 9 0.007 0.016 0.005 0.003 0.016 0.016ABRW 364 0.301 5.795 0.004 0.465 0.579 0.946AC2A 1 0.386 0.386 0.386 . 0.386 0.386AC20 1 0.182 0.182 0.182 . 0.182 0.182AC22 1 0.271 0.271 0.271 . 0.271 0.271AC28 2 0.224 0.321 0.128 0.137 0.321 0.321AINQ 4 0.419 0.823 0.171 0.282 0.823 0.823AMNU 5 0.023 0.048 0.007 0.020 0.048 0.048AUPD 14 0.227 0.570 0.010 0.183 0.528 0.570DEGA 22 4.038 54.939 0.004 11.933 9.397 15.008DEGC 45 0.986 4.639 0.004 1.060 2.304 2.895DEGE 1 0.210 0.210 0.210 . 0.210 0.210DEGG 4 0.527 1.784 0.029 0.845 1.784 1.784DEGS 8 0.265 0.801 0.004 0.317 0.801 0.801DEGT 18 2.124 7.056 0.032 2.246 5.004 7.056DEGV 62 2.280 11.694 0.005 2.535 5.379 7.112INIT 3 0.440 0.685 0.310 0.213 0.685 0.685LSRW 1 0.091 0.091 0.091 . 0.091 0.091QMNU 43 0.109 4.158 0.005 0.633 0.016 0.046RAID 1 0.013 0.013 0.013 . 0.013 0.013STAT 1 0.327 0.327 0.327 . 0.327 0.327STR1 3 0.102 0.114 0.089 0.013 0.114 0.114VADD 1 0.027 0.027 0.027 . 0.027 0.027VAD1 1 0.412 0.412 0.412 . 0.412 0.412VBRW 3 1.092 3.052 0.062 1.698 3.052 3.052VBR1 2 0.311 0.467 0.155 0.221 0.467 0.467VSEX 32 7.870 24.343 0.231 8.315 22.303 24.294VSTR 1 0.078 0.078 0.078 . 0.078 0.078WD80 3 0.195 0.241 0.138 0.053 0.241 0.241TOTAL 656 1.062 54.939 0.004 3.463 2.848 4.387
OPTIONS: CICS=PROD GROUP=WORKLOAD

Producing Reports from the SAS DETAIL Dataset
140 OMEGAMON II for CICS Historical Reporting Guide, Version 520
KC2TRP2-Response Time Statistics by Interval report
This report program provides the following additional parameter. This parameter allows you to override the default reporting interval.
FIGURE 40. Response Time Statistics by Interval
INTERVAL=60,nn
Defines the reporting interval period in minutes.
1 !CANDLE CORPORATION 08:33 Monday, September 18, 1995 160 MINUTE INTERVAL RESPONSE TIME STATISTICS - KC2TRP2
DATA FROM 14SEP95:07:01:19 TO 14SEP95:14:54:40
------------------------------------------------------- CICS*Region=PROD --------------------------------------------------------
Interval Average Maximum Minimum 90TH Percentile 95TH PercentileStart Transaction Response Response Response Standard Response Time Response TimeTime Count (Secs) (Secs) (Secs) Deviation (Secs) (Secs)
8:00:00 127 0.973 24.343 0.004 3.422 1.259 4.3329:00:00 189 0.675 24.064 0.004 2.318 1.172 2.848
10:00:00 89 1.508 15.008 0.004 2.457 4.387 5.37911:00:00 98 1.036 54.939 0.006 5.576 1.172 3.18412:00:00 47 1.280 9.397 0.005 1.997 4.206 6.26413:00:00 6 7.378 24.294 2.908 8.314 24.294 24.29414:00:00 100 1.055 22.303 0.005 3.185 3.091 4.079
TOTAL 656 1.062 54.939 0.004 3.463 2.848 4.387
OPTIONS: CICS=PROD GROUP=WORKLOAD

SAS Historical Reporting 141
Producing Reports from the SAS DETAIL Dataset
KC2TRP3-Transaction Detail report
This report program provides the following additional parameter. Use this parameter to set a specific response time threshold.
FIGURE 41. Transaction Detail Report
THRESH=NO,nn
Limits selection to a specific response time threshold in seconds-for example, THRESH=1 or THRESH=0.5.
1 !CANDLE CORPORATION 08:47 Monday, September 18, 1995 1AVERAGE RESPONSE TIME BY 15 MINUTE INTERVALS - KC2TCH1
DATA FROM 14SEP95:07:01:19 TO 14SEP95:14:54:40
----------------------------------------------- CICS*Region=PROD DATE=09/14/95 ---------------------------------------------------
Response*Time Mean
5.000 + ****| ****| ****| ****| ****
4.000 + ****| **** ****| **** ****| **** ****| **** ****
3.000 + **** ****| **** ****| **** ****| **** **** ****| **** **** **** ****
2.000 + **** **** **** ****| **** **** **** **** ****| **** **** **** **** **** **** **** ****| **** **** **** **** **** **** **** ****| **** **** **** **** **** **** **** **** ****
1.000 + **** **** **** **** **** **** **** **** **** **** ****| **** **** **** **** **** **** **** **** **** **** **** ****| **** **** **** **** **** **** **** **** **** **** **** **** **** ****| **** **** **** **** **** **** **** **** **** **** **** **** **** **** **** ****| **** **** **** **** **** **** **** **** **** **** **** **** **** **** **** **** **** ****---------------------------------------------------------------------------------------------------------------
8:30 8:45 9:15 9:30 9:45 10:00 10:30 10:45 11:00 11:15 11:30 12:00 12:15 12:30 12:45 14:00 14:30 14:45
TIME
OPTIONS: CICS=PROD GROUP=WORKLOAD

Producing Reports from the SAS DETAIL Dataset
142 OMEGAMON II for CICS Historical Reporting Guide, Version 520
KC2TRP4-Service Level Report by Transaction report
This report has no additional parameters.
FIGURE 42. Service Level Report by Transaction Report
1 !CANDLE CORPORATION 08:41 Monday, September 18, 1995 1TRANSACTION SERVICE LEVEL REPORT - KC2TRP4
DATA FROM 14SEP95:07:01:19 TO 14SEP95:14:54:40
------------------------------------------------------ CICS*Region=PROD ----------------------------------------------------------
Average Maximum Average Maximum Total Percent of Percent of Percent ofTran Transaction Response Response CPU Time CPU Time CPU Time Transactions Transactions Transactions AbendID Count (Secs) (Secs) (Secs) (Secs) (Secs) < 1 Second < 2 Seconds < 5 Seconds Count
AADD 9 0.007 0.016 0.0048 0.0072 0.0430 100.0 100.0 100.0 0ABRW 364 0.301 5.795 0.1138 0.5251 41.4303 95.33 98.63 99.73 0AC2A 1 0.386 0.386 0.0191 0.0191 0.0191 100.0 100.0 100.0 0AC20 1 0.182 0.182 0.0204 0.0204 0.0204 100.0 100.0 100.0 0AC22 1 0.271 0.271 0.0182 0.0182 0.0182 100.0 100.0 100.0 0AC28 2 0.224 0.321 0.0188 0.0188 0.0376 100.0 100.0 100.0 0AINQ 4 0.419 0.823 0.1276 0.1321 0.5106 100.0 100.0 100.0 0AMNU 5 0.023 0.048 0.0067 0.0120 0.0335 100.0 100.0 100.0 0AUPD 14 0.227 0.570 0.0922 0.1551 1.2905 100.0 100.0 100.0 0DEGA 22 4.038 54.939 1.3909 19.4331 30.5991 77.27 81.82 86.36 0DEGC 45 0.986 4.639 0.0844 0.1504 3.8001 57.78 84.44 100.0 0DEGE 1 0.210 0.210 0.0180 0.0180 0.0180 100.0 100.0 100.0 0DEGG 4 0.527 1.784 0.3721 1.2050 1.4882 75.00 100.0 100.0 0DEGS 8 0.265 0.801 0.1741 0.4809 1.3931 100.0 100.0 100.0 0DEGT 18 2.124 7.056 1.4712 4.3031 26.4823 38.89 61.11 88.89 0DEGV 62 2.280 11.694 1.1843 3.4877 73.4256 46.77 58.06 85.48 0INIT 3 0.440 0.685 0.1328 0.1479 0.3985 100.0 100.0 100.0 3LSRW 1 0.091 0.091 0.0145 0.0145 0.0145 100.0 100.0 100.0 0QMNU 43 0.109 4.158 0.0073 0.0591 0.3152 97.67 97.67 100.0 0RAID 1 0.013 0.013 0.0074 0.0074 0.0074 100.0 100.0 100.0 0STAT 1 0.327 0.327 0.0196 0.0196 0.0196 100.0 100.0 100.0 0STR1 3 0.102 0.114 0.0082 0.0114 0.0247 100.0 100.0 100.0 3VADD 1 0.027 0.027 0.0116 0.0116 0.0116 100.0 100.0 100.0 0VAD1 1 0.412 0.412 0.2404 0.2404 0.2404 100.0 100.0 100.0 1VBRW 3 1.092 3.052 0.0079 0.0106 0.0236 66.67 66.67 100.0 0VBR1 2 0.311 0.467 0.0299 0.0469 0.0597 100.0 100.0 100.0 2VSEX 32 7.870 24.343 2.1192 9.1537 67.8152 9.38 9.38 68.75 0VSTR 1 0.078 0.078 0.0122 0.0122 0.0122 100.0 100.0 100.0 0WD80 3 0.195 0.241 0.1229 0.1382 0.3686 100.0 100.0 100.0 3TOTAL 656 1.062 54.939 0.3810 19.4331 249.9209 82.16 87.80 96.19 12
OPTIONS: CICS=PROD GROUP=WORKLOAD

SAS Historical Reporting 143
Producing Reports from the SAS DETAIL Dataset
KC2TRP5-Service Level Report by Interval report
To override the default reporting interval, this report has the following additional parameter.
FIGURE 43. Service Level Report by Interval Report
INTERVAL=60,nn
Defines the reporting interval period in minutes.
1 !CANDLE CORPORATION 08:41 Monday, September 18, 1995 160 MINUTE SERVICE LEVEL REPORT - KC2TRP5
DATA FROM 14SEP95:07:01:19 TO 14SEP95:14:54:40
------------------------------------------------------ CICS*Region=PROD ----------------------------------------------------------
Interval Average Maximum Average Maximum Total Percent of Percent of Percent ofStart Transaction Response Response CPU Time CPU Time CPU Time Transactions Transactions Transactions AbendTime Count (Secs) (Secs) (Secs) (Secs) (Secs) < 1 Second < 2 Seconds < 5 Seconds Count
8:00:00 127 0.973 24.343 0.2783 8.3972 35.3412 87.40 91.34 96.06 79:00:00 189 0.675 24.064 0.2495 8.4602 47.1519 89.95 93.65 97.88 010:00:00 89 1.508 15.008 0.6145 4.4282 54.6883 58.43 75.28 92.13 011:00:00 98 1.036 54.939 0.4101 19.4331 40.1925 88.78 91.84 97.96 012:00:00 47 1.280 9.397 0.4110 3.3105 19.3155 70.21 85.11 93.62 013:00:00 6 7.378 24.294 1.7430 8.7031 10.4578 0.00 0.00 83.33 014:00:00 100 1.055 22.303 0.4277 9.1537 42.7738 86.00 86.00 97.00 5
TOTAL 656 1.062 54.939 0.3810 19.4331 249.9209 82.16 87.80 96.19 12
OPTIONS: CICS=PROD GROUP=WORKLOAD

Producing Reports from the SAS DETAIL Dataset
144 OMEGAMON II for CICS Historical Reporting Guide, Version 520
KC2TRP7-Response Time Graphs reports
This report provides the following additional parameters.
The following graphs are shown below:
� response time by user-defined interval
� response time by transaction ID
� response time by VTAM LU
� response time by program
FIGURE 44. Response Time Graphs
INTERVAL=15,nn
Defines the reporting interval period in minutes.
RPTINT=YES,NO
Specifies whether the Interval Response report is produced.
RPTTRAN=YES,NO
Specifies whether the Transaction Response report is produced
RPTLU=YES,NO
Specifies whether the LU Response report is produced.
RPTPGM=YES,NO
Specifies whether the Program Response report is produced.
1 !CANDLE CORPORATION 08:42 Monday, September 18, 1995 1INTERVAL RESPONSE REPORT - KC2TRP7
DATA FROM 14SEP95:07:01:19 TO 14SEP95:14:54:40OPTIONS: CICS=PROD GROUP=WORKLOAD
CICS APPLID=PROD0 Tran Average Average Response Time (Secs) --------- AVERAGE --------- ---------- TOTAL ----------Date Time Count Response CPU Wait Time I/O Req CPU Disp Time I/O Req
(m:ss) .........1.........2.........3 (m:ss) (m:ss) (m:ss) (m:ss)009/14/95 8:30:00 81 0:00.594 =====> 0:00.1787 0:00.2742 210 0:14.4759 0:25.8900 17035
8:45:00 46 0:01.642 ================> 0:00.4536 0:00.7426 752 0:20.8652 0:41.3676 345799:15:00 63 0:00.473 ====> 0:00.2342 0:00.1023 278 0:14.7522 0:23.3238 175379:30:00 4 0:01.121 ===========> 0:00.1008 0:00.0143 4 0:00.4031 0:04.4253 179:45:00 46 0:01.547 ===============> 0:00.3970 0:00.5834 611 0:18.2631 0:44.3072 2811510:00:00 76 0:00.291 ==> 0:00.1807 0:00.0428 301 0:13.7336 0:18.8826 2284310:30:00 25 0:00.517 =====> 0:00.2450 0:00.1718 563 0:06.1246 0:08.6211 1407010:45:00 34 0:01.518 ===============> 0:00.4432 0:00.2131 977 0:15.0687 0:44.3639 3323311:00:00 30 0:02.323 =======================> 0:01.1165 0:00.6132 1056 0:33.4950 0:51.2923 3168111:15:00 2 0:03.787 =============================* 0:02.3968 0:00.4995 2501 0:04.7937 0:06.5751 500211:30:00 73 0:01.041 ==========> 0:00.4454 0:00.4724 221 0:32.5144 0:41.5010 1615212:00:00 23 0:00.782 =======> 0:00.1254 0:00.0035 5 0:02.8844 0:17.9072 11912:15:00 23 0:01.759 =================> 0:00.5666 0:00.7235 1050 0:13.0316 0:23.8176 2414112:30:00 5 0:00.257 ==> 0:00.0191 0:00.0686 0 0:00.0953 0:00.9444 012:45:00 19 0:00.970 =========> 0:00.3257 0:00.4603 616 0:06.1887 0:09.6808 1171214:00:00 6 0:07.378 =============================* 0:01.7430 0:04.1353 3039 0:10.4578 0:19.4539 1823614:30:00 38 0:02.149 =====================> 0:00.7305 0:00.7842 1142 0:27.7575 0:51.8664 4337914:45:00 62 0:00.384 ===> 0:00.2422 0:00.0057 310 0:15.0163 0:23.4508 19196

SAS Historical Reporting 145
Producing Reports from the SAS DETAIL Dataset
FIGURE 44. Response Time Graphs (continued)
FIGURE 44. Response Time Graphs (continued)
FIGURE 44. Response Time Graphs (continued)
1 !CANDLE CORPORATION 08:42 Monday, September 18, 1995 2TRANSACTION RESPONSE REPORT - KC2TRP7
DATA FROM 14SEP95:07:01:19 TO 14SEP95:14:54:40OPTIONS: CICS=PROD GROUP=WORKLOAD
0 Tran Average Average Response Time (Secs) --------- AVERAGE --------- ---------- TOTAL ----------Tran Region Count Response CPU Wait Time I/O Req CPU Disp Time I/O ReqID (m:ss) .........1.........2.........3 (m:ss) (m:ss) (m:ss) (m:ss)
0AADD PROD 9 0:00.007 > 0:00.0048 0:00.0005 0 0:00.0430 0:00.0626 0ABRW PROD 364 0:00.301 ===> 0:00.1138 0:00.0148 5 0:41.4303 1:44.2468 1889AC2A PROD 1 0:00.386 ===> 0:00.0191 0:00.0853 0 0:00.0191 0:00.3006 0AC20 PROD 1 0:00.182 => 0:00.0204 0:00.0636 0 0:00.0204 0:00.1187 0AC22 PROD 1 0:00.271 ==> 0:00.0182 0:00.0518 0 0:00.0182 0:00.2189 0AC28 PROD 2 0:00.224 ==> 0:00.0188 0:00.0712 0 0:00.0376 0:00.3061 0AINQ PROD 4 0:00.419 ====> 0:00.1276 0:00.0160 1 0:00.5106 0:01.6105 4AMNU PROD 5 0:00.023 > 0:00.0067 0:00.0035 0 0:00.0335 0:00.0952 0AUPD PROD 14 0:00.227 ==> 0:00.0922 0:00.0191 1 0:01.2905 0:02.9137 14DEGA PROD 22 0:04.038 =============================* 0:01.3909 0:01.9941 0 0:30.5991 0:44.9627 0DEGC PROD 45 0:00.986 =========> 0:00.0844 0:00.6552 1 0:03.8001 0:14.9071 38DEGE PROD 1 0:00.210 ==> 0:00.0180 0:00.0074 0 0:00.0180 0:00.2028 0DEGG PROD 4 0:00.527 =====> 0:00.3721 0:00.0004 0 0:01.4882 0:02.1048 0DEGS PROD 8 0:00.265 ==> 0:00.1741 0:00.0251 0 0:01.3931 0:01.9202 0DEGT PROD 18 0:02.124 =====================> 0:01.4712 0:00.0004 0 0:26.4823 0:38.2168 0DEGV PROD 62 0:02.280 ======================> 0:01.1843 0:00.2656 3419 1:13.4256 2:04.9036 211955INIT PROD 3 0:00.440 ====> 0:00.1328 0:00.0251 0 0:00.3985 0:01.2450 0LSRW PROD 1 0:00.091 > 0:00.0145 0:00.0063 0 0:00.0145 0:00.0848 0QMNU PROD 43 0:00.109 => 0:00.0073 0:00.0951 0 0:00.3152 0:00.6103 0RAID PROD 1 0:00.013 > 0:00.0074 0:00.0039 0 0:00.0074 0:00.0094 0STAT PROD 1 0:00.327 ===> 0:00.0196 0:00.0026 0 0:00.0196 0:00.3245 0STR1 PROD 3 0:00.102 => 0:00.0082 0:00.0895 0 0:00.0247 0:00.0365 0VADD PROD 1 0:00.027 > 0:00.0116 0:00.0077 0 0:00.0116 0:00.0190 0VAD1 PROD 1 0:00.412 ====> 0:00.2404 0:00.0405 0 0:00.2404 0:00.3715 0VBRW PROD 3 0:01.092 ==========> 0:00.0079 0:01.0174 0 0:00.0236 0:00.2224 0VBR1 PROD 2 0:00.311 ===> 0:00.0299 0:00.0577 0 0:00.0597 0:00.5068 0VSEX PROD 32 0:07.870 =============================* 0:02.1192 0:04.2279 3848 1:07.8152 1:56.5612 123147VSTR PROD 1 0:00.078 > 0:00.0122 0:00.0053 0 0:00.0122 0:00.0732 0WD80 PROD 3 0:00.195 => 0:00.1229 0:00.0237 0 0:00.3686 0:00.5152 0
1 !CANDLE CORPORATION 08:42 Monday, September 18, 1995 3LOGICAL UNIT RESPONSE REPORT - KC2TRP7
DATA FROM 14SEP95:07:01:19 TO 14SEP95:14:54:40OPTIONS: CICS=PROD GROUP=WORKLOAD
0 Tran Average Average Response Time (Secs) --------- AVERAGE --------- ---------- TOTAL ----------Region LU Count Response CPU Wait Time I/O Req CPU Disp Time I/O Req
(m:ss) .........1.........2.........3 (m:ss) (m:ss) (m:ss) (m:ss)0PROD
1 !CANDLE CORPORATION 08:42 Monday, September 18, 1995 4PROGRAM RESPONSE REPORT - KC2TRP7
DATA FROM 14SEP95:07:01:19 TO 14SEP95:14:54:40OPTIONS: CICS=PROD GROUP=WORKLOAD
0 First Tran Average Average Response Time (Secs) --------- AVERAGE --------- ---------- TOTAL ----------Region Program Count Response CPU Wait Time I/O Req CPU Disp Time I/O Req
(m:ss) .........1.........2.........3 (m:ss) (m:ss) (m:ss) (m:ss)0PROD CMRAIDI0 1 0:00.013 > 0:00.0074 0:00.0039 0 0:00.0074 0:00.0094 0
DEGCICS 159 0:01.994 ===================> 0:00.8628 0:00.5662 1333 2:17.1884 3:47.0153 211993DEGE 1 0:00.210 ==> 0:00.0180 0:00.0074 0 0:00.0180 0:00.2028 0DFH$AALL 27 0:00.182 => 0:00.0683 0:00.0124 1 0:01.8441 0:04.5869 18DFH$ABRW 364 0:00.301 ===> 0:00.1138 0:00.0148 5 0:41.4303 1:44.2468 1889DFH$AMNU 5 0:00.023 > 0:00.0067 0:00.0035 0 0:00.0335 0:00.0952 0DFH0VOPN 1 0:00.271 ==> 0:00.0182 0:00.0518 0 0:00.0182 0:00.2189 0DFH0VPRT 2 0:00.224 ==> 0:00.0188 0:00.0712 0 0:00.0376 0:00.3061 0DFH0VSAS 1 0:00.386 ===> 0:00.0191 0:00.0853 0 0:00.0191 0:00.3006 0DFH0VT1 1 0:00.182 => 0:00.0204 0:00.0636 0 0:00.0204 0:00.1187 0LSRWAIT 1 0:00.091 > 0:00.0145 0:00.0063 0 0:00.0145 0:00.0848 0QMMENU 43 0:00.109 => 0:00.0073 0:00.0951 0 0:00.3152 0:00.6103 0STATSTRT 1 0:00.327 ===> 0:00.0196 0:00.0026 0 0:00.0196 0:00.3245 0STRWAIT 1 0:00.078 > 0:00.0122 0:00.0053 0 0:00.0122 0:00.0732 0STRWAIT1 3 0:00.102 => 0:00.0082 0:00.0895 0 0:00.0247 0:00.0365 0VSAMADD 1 0:00.027 > 0:00.0116 0:00.0077 0 0:00.0116 0:00.0190 0VSAMADD1 1 0:00.412 ====> 0:00.2404 0:00.0405 0 0:00.2404 0:00.3715 0VSAMBRW 3 0:01.092 ==========> 0:00.0079 0:01.0174 0 0:00.0236 0:00.2224 0VSAMBRW1 2 0:00.311 ===> 0:00.0299 0:00.0577 0 0:00.0597 0:00.5068 0VSAMEXCP 32 0:07.870 =============================* 0:02.1192 0:04.2279 3848 1:07.8152 1:56.5612 123147WKDL8DI0 3 0:00.195 => 0:00.1229 0:00.0237 0 0:00.3686 0:00.5152 0WKDL90

Producing Reports from the SAS DETAIL Dataset
146 OMEGAMON II for CICS Historical Reporting Guide, Version 520
KC2TRP8-Response Time and VSAM/DB Activity by Transaction report
This report has no additional parameters.
FIGURE 45. Response Time and VSAM/DB Activity by Transaction Report
1 !CANDLE CORPORATION 18:27 Monday, September 18, 1995 1TRANSACTION RESPONSE TIME and VSAM/DB ACTIVITY - KC2TRP8
DATA FROM 14SEP95:07:01:19 TO 14SEP95:14:54:40
------------------------------------------------------ CICS*Region=PROD ----------------------------------------------------------
Average AverageAverage File DB2
Average Maximum Average Maximum File Control Average Request AverageTran Transaction Response Response CPU Time CPU Time Control Wait Time DB2 Wait Time DL/1ID Count (Secs) (Secs) (Secs) (Secs) Requests (Secs) Requests (Secs) Requests
AADD 9 0.007 0.016 0.0048 0.0072 0.00 0.000 0.00 0.000 0.00ABRW 364 0.301 5.795 0.1138 0.5251 5.19 0.004 0.00 0.000 0.00AC2A 1 0.386 0.386 0.0191 0.0191 0.00 0.000 0.00 0.000 0.00AC20 1 0.182 0.182 0.0204 0.0204 0.00 0.000 0.00 0.000 0.00AC22 1 0.271 0.271 0.0182 0.0182 0.00 0.000 0.00 0.000 0.00AC28 2 0.224 0.321 0.0188 0.0188 0.00 0.000 0.00 0.000 0.00AINQ 4 0.419 0.823 0.1276 0.1321 1.00 0.014 0.00 0.000 0.00AMNU 5 0.023 0.048 0.0067 0.0120 0.00 0.000 0.00 0.000 0.00AUPD 14 0.227 0.570 0.0922 0.1551 1.00 0.019 0.00 0.000 0.00DEGA 22 4.038 54.939 1.3909 19.4331 0.00 0.000 0.00 0.000 0.00DEGC 45 0.986 4.639 0.0844 0.1504 0.84 0.001 0.00 0.000 0.00DEGE 1 0.210 0.210 0.0180 0.0180 0.00 0.000 0.00 0.000 0.00DEGG 4 0.527 1.784 0.3721 1.2050 0.00 0.000 0.00 0.000 0.00DEGS 8 0.265 0.801 0.1741 0.4809 0.00 0.000 0.00 0.000 0.00DEGT 18 2.124 7.056 1.4712 4.3031 0.00 0.000 0.00 0.000 0.00DEGV 62 2.280 11.694 1.1843 3.4877 3418.63 0.007 0.00 0.000 0.00LSRW 1 0.091 0.091 0.0145 0.0145 0.00 0.000 0.00 0.000 0.00QMNU 43 0.109 4.158 0.0073 0.0591 0.00 0.000 0.00 0.000 0.00TOTAL 605 0.724 54.939 0.2991 19.4331 353.55 0.004 0.00 0.000 0.00
Average Average Average Average AverageDL/1 ADABAS DATACOM IDMS SUPRARequest Average Request Average Request Average Request Average Request
Tran Wait Time ADABAS Wait Time DATACOM Wait Time IDMS Wait Time SUPRA Wait TimeID (Secs) Requests (Secs) Requests (Secs) Requests (Secs) Requests (Secs)
AADD 0.000 0.00 0.000 0.00 0.000 0.00 0.000 0.00 0.000ABRW 0.000 0.00 0.000 0.00 0.000 0.00 0.000 0.00 0.000AC2A 0.000 0.00 0.000 0.00 0.000 0.00 0.000 0.00 0.000AC20 0.000 0.00 0.000 0.00 0.000 0.00 0.000 0.00 0.000AC22 0.000 0.00 0.000 0.00 0.000 0.00 0.000 0.00 0.000AC28 0.000 0.00 0.000 0.00 0.000 0.00 0.000 0.00 0.000AINQ 0.000 0.00 0.000 0.00 0.000 0.00 0.000 0.00 0.000AMNU 0.000 0.00 0.000 0.00 0.000 0.00 0.000 0.00 0.000AUPD 0.000 0.00 0.000 0.00 0.000 0.00 0.000 0.00 0.000DEGA 0.000 0.00 0.000 0.00 0.000 0.00 0.000 0.00 0.000DEGC 0.000 0.00 0.000 0.00 0.000 0.00 0.000 0.00 0.000DEGE 0.000 0.00 0.000 0.00 0.000 0.00 0.000 0.00 0.000DEGG 0.000 0.00 0.000 0.00 0.000 0.00 0.000 0.00 0.000DEGS 0.000 0.00 0.000 0.00 0.000 0.00 0.000 0.00 0.000DEGT 0.000 0.00 0.000 0.00 0.000 0.00 0.000 0.00 0.000DEGV 0.000 0.00 0.000 0.00 0.000 0.00 0.000 0.00 0.000LSRW 0.000 0.00 0.000 0.00 0.000 0.00 0.000 0.00 0.000QMNU 0.000 0.00 0.000 0.00 0.000 0.00 0.000 0.00 0.000TOTAL 0.000 0.00 0.000 0.00 0.000 0.00 0.000 0.00 0.000
OPTIONS: CICS=PROD GROUP=WORKLOAD EXIT=MYEXIT

SAS Historical Reporting 147
Producing Reports from the SAS DETAIL Dataset
KC2TRP9-Response Time and VSAM/DB Activity by interval report
This report provides the following additional parameter.
FIGURE 46. Response Time and VSAM/DB Activity by Interval Report
INTERVAL=60,nn
Defines the reporting interval period in minutes.
1 !CANDLE CORPORATION 08:42 Monday, September 18, 1995 160 MINUTE INTERVAL RESPONSE TIME and VSAM/DB ACTIVITY - KC2TRP9
DATA FROM 14SEP95:07:01:19 TO 14SEP95:14:54:40
------------------------------------------------------- CICS*Region=PROD----------------------------------------------------------
Average AverageAverage File DB2
Interval Average Maximum Average CPU Maximum CPU File Control Average Request AverageStart Transaction Response Response Time Time Control Wait Time DB2 Wait Time DL/1Time Count (Secs) (Secs) (Secs) (Secs) Requests (Secs) Requests (Secs) Requests
8:00:00 127 0.973 24.343 0.2783 8.3972 406.41 0.351 0.00 0.000 0.029:00:00 189 0.675 24.064 0.2495 8.4602 362.50 0.159 0.00 0.000 0.0010:00:00 89 1.508 15.008 0.6145 4.4282 887.46 0.001 0.00 0.000 0.0011:00:00 98 1.036 54.939 0.4101 19.4331 217.07 0.005 0.00 0.000 0.0012:00:00 47 1.280 9.397 0.4110 3.3105 762.83 0.001 0.00 0.000 0.0013:00:00 6 7.378 24.294 1.7430 8.7031 3039.33 4.145 0.00 0.000 0.0014:00:00 100 1.055 22.303 0.4277 9.1537 625.75 0.293 0.00 0.000 0.04
TOTAL 656 1.062 54.939 0.3810 19.4331 513.79 0.197 0.00 0.000 0.01
Average Average Average Average AverageDL/1 ADABAS DATACOM IDMS SUPRA
Interval Request Average Request Average Request Average Request Average RequestStart Wait Time ADABAS Wait Time DATACOM Wait Time IDMS Wait Time SUPRA Wait TimeTime (Secs) Requests (Secs) Requests (Secs) Requests (Secs) Requests (Secs)
8:00:00 0.000 0.00 0.000 0.00 0.000 0.00 0.000 0.00 0.0009:00:00 0.000 0.00 0.000 0.00 0.000 0.00 0.000 0.00 0.000
10:00:00 0.000 0.00 0.000 0.00 0.000 0.00 0.000 0.00 0.00011:00:00 0.000 0.00 0.000 0.00 0.000 0.00 0.000 0.00 0.00012:00:00 0.000 0.00 0.000 0.00 0.000 0.00 0.000 0.00 0.00013:00:00 0.000 0.00 0.000 0.00 0.000 0.00 0.000 0.00 0.00014:00:00 0.000 0.00 0.000 0.00 0.000 0.00 0.000 0.00 0.000
TOTAL 0.000 0.00 0.000 0.00 0.000 0.00 0.000 0.00 0.000
OPTIONS: CICS=PROD GROUP=WORKLOAD

Producing Reports from the SAS DETAIL Dataset
148 OMEGAMON II for CICS Historical Reporting Guide, Version 520
KC2TR13-Response Time Distribution by Transaction report
This report has no additional parameters.
FIGURE 47. Response Time Distribution by Transaction Report
KC2TR14-Storage Utilization Statistics report
This report has no additional parameters.
FIGURE 48. Storage Utilization Statistics Report
1 !CANDLE CORPORATION 08:44 Monday, September 18, 1995 1TRANSACTION RESPONSE TIME DISTRIBUTION - KC2TR13
DATA FROM 14SEP95:07:01:19 TO 14SEP95:14:54:40OPTIONS: CICS=PROD GROUP=WORKLOAD
0Tran Tran CICS <-----------------------------Distribution Range (Secs)------------------------------------------>ID Count Region 0-0.5 0.5-1 1-2 2-3 3-4 4-5 5-10 10-15 15-30 30-60 GT 60.0
0 *TOTAL* 656 PROD Avg Resp= 1.062 Max Resp= 54.939 Min Resp= 0.004 Std Dev= 3.463 Total Abends= 120 Count 487 52 37 21 21 13 14 1 9 1 0
% of Total 74.23% 7.92% 5.64% 3.20% 3.20% 1.98% 2.13% 0.15% 1.37% 0.15% 0.00%Cumulative % 74.23% 82.16% 87.80% 91.00% 94.20% 96.18% 98.32% 98.47% 99.84% 100.00% 100.00%
0AADD 9 PROD Avg Resp= 0.007 Max Resp= 0.016 Min Resp= 0.005 Std Dev= 0.003 Total Abends= 00 Count 9 0 0 0 0 0 0 0 0 0 0
% of Total 100.00% 0.00% 0.00% 0.00% 0.00% 0.00% 0.00% 0.00% 0.00% 0.00% 0.00%Cumulative % 100.00% 100.00% 100.00% 100.00% 100.00% 100.00% 100.00% 100.00% 100.00% 100.00% 100.00%
0ABRW 364 PROD Avg Resp= 0.301 Max Resp= 5.795 Min Resp= 0.004 Std Dev= 0.465 Total Abends= 00 Count 322 25 12 3 1 0 1 0 0 0 0
% of Total 88.46% 6.86% 3.29% 0.82% 0.27% 0.00% 0.27% 0.00% 0.00% 0.00% 0.00%Cumulative % 88.46% 95.32% 98.62% 99.45% 99.72% 99.72% 100.00% 100.00% 100.00% 100.00% 100.00%
0AC2A 1 PROD Avg Resp= 0.386 Max Resp= 0.386 Min Resp= 0.386 Std Dev= . Total Abends= 00 Count 1 0 0 0 0 0 0 0 0 0 0
% of Total 100.00% 0.00% 0.00% 0.00% 0.00% 0.00% 0.00% 0.00% 0.00% 0.00% 0.00%Cumulative % 100.00% 100.00% 100.00% 100.00% 100.00% 100.00% 100.00% 100.00% 100.00% 100.00% 100.00%
0AC20 1 PROD Avg Resp= 0.182 Max Resp= 0.182 Min Resp= 0.182 Std Dev= . Total Abends= 00 Count 1 0 0 0 0 0 0 0 0 0 0
% of Total 100.00% 0.00% 0.00% 0.00% 0.00% 0.00% 0.00% 0.00% 0.00% 0.00% 0.00%Cumulative % 100.00% 100.00% 100.00% 100.00% 100.00% 100.00% 100.00% 100.00% 100.00% 100.00% 100.00%
0AC22 1 PROD Avg Resp= 0.271 Max Resp= 0.271 Min Resp= 0.271 Std Dev= . Total Abends= 00 Count 1 0 0 0 0 0 0 0 0 0 0
% of Total 100.00% 0.00% 0.00% 0.00% 0.00% 0.00% 0.00% 0.00% 0.00% 0.00% 0.00%Cumulative % 100.00% 100.00% 100.00% 100.00% 100.00% 100.00% 100.00% 100.00% 100.00% 100.00% 100.00%
0AC28 2 PROD Avg Resp= 0.224 Max Resp= 0.321 Min Resp= 0.128 Std Dev= 0.137 Total Abends= 00 Count 2 0 0 0 0 0 0 0 0 0 0
% of Total 100.00% 0.00% 0.00% 0.00% 0.00% 0.00% 0.00% 0.00% 0.00% 0.00% 0.00%Cumulative % 100.00% 100.00% 100.00% 100.00% 100.00% 100.00% 100.00% 100.00% 100.00% 100.00% 100.00%
0AINQ 4 PROD Avg Resp= 0.419 Max Resp= 0.823 Min Resp= 0.171 Std Dev= 0.282 Total Abends= 00 Count 3 1 0 0 0 0 0 0 0 0 0
% of Total 75.00% 25.00% 0.00% 0.00% 0.00% 0.00% 0.00% 0.00% 0.00% 0.00% 0.00%Cumulative % 75.00% 100.00% 100.00% 100.00% 100.00% 100.00% 100.00% 100.00% 100.00% 100.00% 100.00%
1 !CANDLE CORPORATION 08:45 Monday, September 18, 1995 1STORAGE UTILIZATION STATISTICS - KC2TR14
DATA FROM 14SEP95:07:01:19 TO 14SEP95:14:54:40OPTIONS: CICS=PROD GROUP=WORKLOAD
0Region=PROD CICS Version=0330Tran Tran Resp Resp Stor <-------USER STORAGE-------><---------------------- PROGRAM STORAGE ---------------------->ID Cnt Avg Max Type UDSA Max CDSA Max UDSA Max CDSA Max SDSA Max RDSA Max
-AADD 9 0.007 0.016 <16M 942 960 144 144 2.9K 2.9K 918 968>16M 560 560 0 0 0 0 0 0 0 0
0ABRW 364 0.301 5.795 <16M 1.0K 1.0K 144 144 2.5K 2.5K 563 1.0K>16M 560 560 0 0 0 0 0 0 0 0
0AC2A 1 0.386 0.386 <16M 0 0 176 176 0 0 0 0>16M 560 560 0 0 0 0 8.1K 8.1K 0 0
0AC20 1 0.182 0.182 <16M 0 0 176 176 0 0 0 0>16M 560 560 0 0 0 0 8.1K 8.1K 0 0
0AC22 1 0.271 0.271 <16M 0 0 176 176 0 0 0 0>16M 560 560 0 0 0 0 8.1K 8.1K 0 0
0AC28 2 0.224 0.321 <16M 0 0 176 176 0 0 0 0>16M 560 560 0 0 0 0 8.1K 8.1K 0 0
0AINQ 4 0.419 0.823 <16M 928 928 144 144 2.9K 2.9K 968 968>16M 560 560 0 0 0 0 0 0 0 0
0AMNU 5 0.023 0.048 <16M 416 416 144 144 224 224 520 520>16M 560 560 0 0 0 0 0 0 0 0
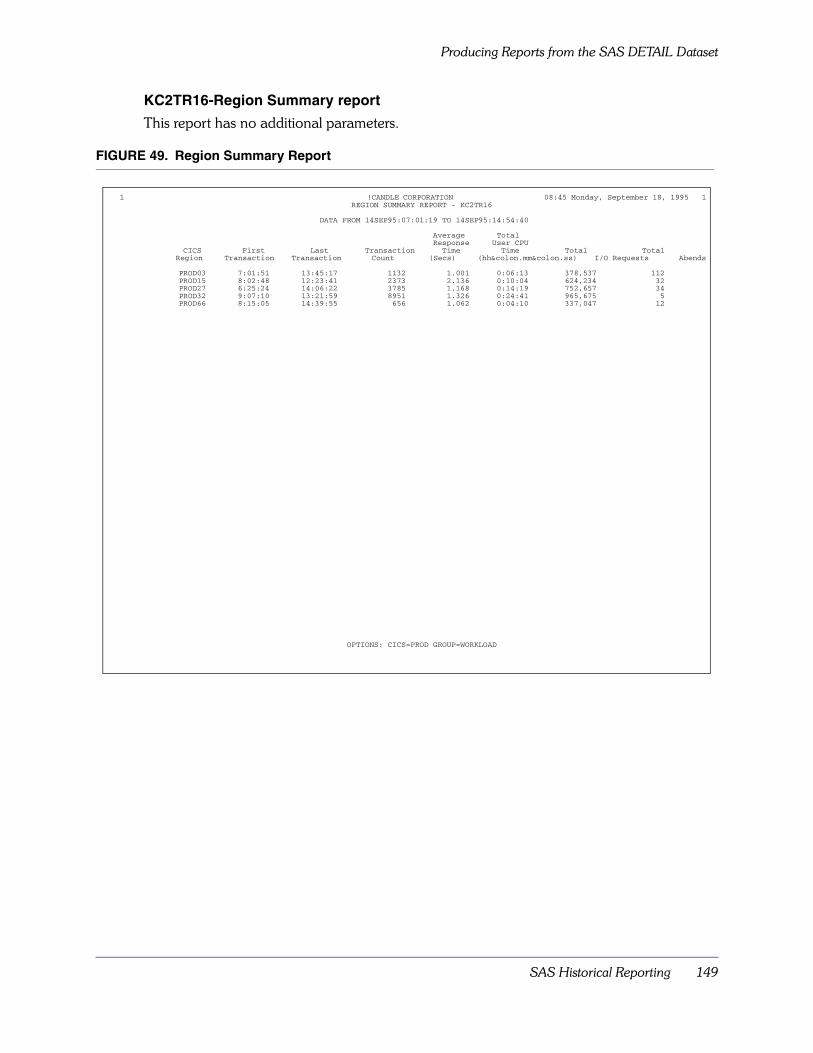
SAS Historical Reporting 149
Producing Reports from the SAS DETAIL Dataset
KC2TR16-Region Summary report
This report has no additional parameters.
FIGURE 49. Region Summary Report
1 !CANDLE CORPORATION 08:45 Monday, September 18, 1995 1REGION SUMMARY REPORT - KC2TR16
DATA FROM 14SEP95:07:01:19 TO 14SEP95:14:54:40
Average TotalResponse User CPU
CICS First Last Transaction Time Time Total TotalRegion Transaction Transaction Count (Secs) (hh&colon.mm&colon.ss) I/O Requests Abends
PROD03 7:01:51 13:45:17 1132 1.001 0:06:13 378,537 112PROD15 8:02:48 12:23:41 2373 2.136 0:10:04 624,234 32PROD27 6:25:24 14:06:22 3785 1.168 0:14:19 752,657 34PROD32 9:07:10 13:21:59 8951 1.326 0:24:41 965,675 5PROD66 8:15:05 14:39:55 656 1.062 0:04:10 337,047 12
OPTIONS: CICS=PROD GROUP=WORKLOAD

Producing Reports from the SAS DETAIL Dataset
150 OMEGAMON II for CICS Historical Reporting Guide, Version 520
KC2TR17-Database/File Response Time Statistics report
KC2TR17 is a report of database/file response time statistics by transaction. To produce this report, clocks and counters data must have been collected by KC2SMFR using the parameter DBD=YES.
FIGURE 50. Database/File Response Time Statistics by Transaction Report
KC2TCH1-Chart of average response time by interval parameters
This chart provides the following additional parameters.
INTERVAL=15,nn
Specifies the response time graph interval.
SPLIT=
You may specify the keyword ‘CICSGRP’ if you need it to produce charts by transaction group.
TYPE=V,H
Determines the type of chart to be produced-vertical or horizontal.
1 !CANDLE CORPORATION 08:45 Monday, September 18, 1995 1DATABASE/FILE RESPONSE STATISTICS BY TRANSACTION - KC2TR17
DATA FROM 14SEP95:07:01:19 TO 14SEP95:14:54:40
---------------------------------------------------- CICS*Region=PROD -----------------------------------------------------Total Average Maximum Total
DB/File File Tran Transaction Average Maximum Total Request Request RequestName Type ID Count Requests Requests Requests Time Time Time
DFHSAM05 DLI WD80 3 1.0 1 3 0.000 0.000 0.000DFHSAM05 DLI TOTAL 3 1.0 1 3 0.000 0.000 0.000FILEA VSAM ABRW 318 5.7 6 1824 0.024 5.632 7.676FILEA VSAM AINQ 4 1.0 1 4 0.015 0.035 0.061FILEA VSAM AUPD 10 1.4 2 14 0.028 0.116 0.280FILEA VSAM DEGC 38 1.3 2 51 0.003 0.029 0.101FILEA VSAM DEGV 55 3599.1 10001 197951 1.599 10.140 87.956FILEA VSAM VSEX 32 4928.7 18237 157718 8.129 22.740 260.119FILEA VSAM TOTAL 457 782.4 18237 357562 0.779 22.740 356.193
OPTIONS: CICS=PROD GROUP=WORKLOAD

SAS Historical Reporting 151
Producing Reports from the SAS DETAIL Dataset
Two examples are shown: a response time chart and a chart of average user CPU time.
FIGURE 51. Chart of Average Response Time by Interval Report
CHARTVAR=RESPTIME,xxxxxxxx
Although this is by default a response time chart, you may specify another field here; for example, USRCPUTM, to obtain a chart of User CPU Time. See “Fields Contained in DBD” on page 215 for valid field names.
HDR=AVERAGE RESPONSE TIME,cccc..ccc
Allows a user-defined header to be specified.
SCALE=5,nn,0.n
Determines the maximum scale to use for the graph axis.
1 !CANDLE CORPORATION 08:47 Monday, September 18, 1995 1AVERAGE RESPONSE TIME BY 15 MINUTE INTERVALS - KC2TCH1
DATA FROM 14SEP95:07:01:19 TO 14SEP95:14:54:40
----------------------------------------------- CICS*Region=PROD DATE=09/14/95---------------------------------------------------
Response*Time Mean
5.000 + ****| ****| ****| ****| ****
4.000 + ****| **** ****| **** ****| **** ****| **** ****
3.000 + **** ****| **** ****| **** ****| **** **** ****| **** **** **** ****
2.000 + **** **** **** ****| **** **** **** **** ****| **** **** **** **** **** **** **** ****| **** **** **** **** **** **** **** ****| **** **** **** **** **** **** **** **** ****
1.000 + **** **** **** **** **** **** **** **** **** **** ****| **** **** **** **** **** **** **** **** **** **** **** ****| **** **** **** **** **** **** **** **** **** **** **** **** **** ****| **** **** **** **** **** **** **** **** **** **** **** **** **** **** **** ****| **** **** **** **** **** **** **** **** **** **** **** **** **** **** **** **** **** ****---------------------------------------------------------------------------------------------------------------
8:30 8:45 9:15 9:30 9:45 10:00 10:30 10:45 11:00 11:15 11:30 12:00 12:15 12:30 12:45 14:00 14:30 14:45
TIME
OPTIONS: CICS=PROD GROUP=WORKLOAD

Producing Reports from the SAS DETAIL Dataset
152 OMEGAMON II for CICS Historical Reporting Guide, Version 520
FIGURE 52. Chart of Average User CPU Time by Interval
KC2TCH2-average response time by interval parameters
KC2TCH2, which is a chart of average response time by interval within a group, provides the following additional parameters.
INTERVAL=15,nn
Specifies the response time graph interval.
SPLIT=
You may specify the keyword ‘CICSGRP’ to produce charts by transaction group.
TYPE=V,H
Determines the type of chart to be produced- vertical or horizontal.
CHARTVAR=RESPTIME,xxxxxxxx
Although this is a chart of transaction response time, you may produce a chart using a different variable. See “Fields Contained in DBD” on page 215 for valid field names.
1 !CANDLE CORPORATION 10:30 Monday, September 18, 1995 1AVERAGE USER CPU TIME BY 15 MINUTE INTERVALS - KC2TCH1
DATA FROM 14SEP95:07:01:19 TO 14SEP95:14:54:40
----------------------------------------------- CICS*Region=PROD DATE=09/14/95 ---------------------------------------------------
CPU*Time Mean
5.000 +||||
4.000 +||||
3.000 +||| ****| ****
2.000 + ****| **** ****| **** ****| **** ****| **** **** ****
1.000 + **** **** ****| **** **** **** ****| **** **** **** **** ****| **** **** **** **** **** **** **** **** **** ****| **** **** **** **** **** **** **** **** **** **** **** **** **** **** **** **** ****---------------------------------------------------------------------------------------------------------------
8:30 8:45 9:15 9:30 9:45 10:00 10:30 10:45 11:00 11:15 11:30 12:00 12:15 12:30 12:45 14:00 14:30 14:45
TIME
OPTIONS: CICS=PROD GROUP=WORKLOAD

SAS Historical Reporting 153
Producing Reports from the SAS DETAIL Dataset
FIGURE 53. Chart of Average Response Time by Interval within Group
KC2TCH3-chart of total user CPU time by Interval parmeters
This chart provides the following additional parameters:
HDR=AVERAGE RESPONSE TIME,cccc..ccc
Allows a user-defined header to be specified when requesting a different CHARTVAR variable.
SCALE=5,nn,0.n
Determines the maximum scale to use for the graph axis.
INTERVAL=15,nn
Specifies the graph interval.
SPLIT=
You may specify the keyword ‘CICSGRP’ to produce charts by transaction group.
TYPE=V,H
Determines the type of chart to be produced-vertical or horizontal.
1 !CANDLE CORPORATION 08:48 Monday, September 18, 1995 1AVERAGE RESPONSE TIME BY 15 MINUTE INTERVAL WITHIN GROUP - KC2TCH2
DATA FROM 14SEP95:07:01:19 TO 14SEP95:14:54:40
------------------------------------------------ CICS*Region=PROD DATE=09/14/95 ---------------------------------------------------
Response*Time Mean
5.000 + *** * ** * *| *** * ** * *| *** * ** * *| *** * ** ** *| *** * ** ** *
4.000 + *** * ** ** **| *** * ** ** **| *** * ** * ** **| *** * ** * ** **| *** * ** * ** **
3.000 + *** * ** ** ** **| *** * ** ** ** **| *** * ** ** ** **| *** * ** ** ** **| *** * ** ** ** *** *
2.000 + *** * ** ** ** *** *| *** * ** ** ** *** * *| *** * ** ** ** * **** * * *| *** * ** ** ** * **** * * *| * *** * ** ** ** * * ***** * * *
1.000 + * *** * ** ** ** * * ***** * * *| * * *** * ** ** ** * * ***** * * *| ** * *** * ** *** ** * ******* * * **| * ** * *** * ** *** ** * ******* * * **|******* ***** ** *** * ** *** ** * * ******* * * **-----------------------------------------------------------------------------------------------------------------------
1111111111111 1111111111111 1111111111111 1111111111111 1111111111111 TIME889990001112222444 889990001112222444 889990001112222444 889990001112222444 889990001112222444:::::::::::::::::: :::::::::::::::::: :::::::::::::::::: :::::::::::::::::: ::::::::::::::::::341340340130134034 341340340130134034 341340340130134034 341340340130134034 341340340130134034055050050500505005 055050050500505005 055050050500505005 055050050500505005 055050050500505005
|--- PROD CIMS --| |--- ACCTS PAY --| GENERAL LEDGER |-- RECEIVABLES -| |----- OTHER ----| CICSGRP
OPTIONS: CICS=PROD GROUP=WORKLOAD

Producing Reports from the SAS DETAIL Dataset
154 OMEGAMON II for CICS Historical Reporting Guide, Version 520
FIGURE 54. Chart of Total User CPU Time by Interval
KC2TCH4-Total User CPU Time by Interval within Group parameters
This chart provides the following additional parameters:
CHARTVAR=USRCPUTM,xxxxxxxx
Although this is a chart of user CPU time, you may produce a chart using a different variable. See “Fields Contained in DBD” on page 215 for valid field names.
HDR=USER CPU TIME,cccc..ccc
Allows a user-defined header to be specified when you are requesting a different CHARTVAR variable.
SCALE=5,nn,0.n
Determines the maximum scale to use for the graph axis.
INTERVAL=15,nn
Specifies the graph interval
1 !CANDLE CORPORATION 08:48 Monday, September 18, 1995 1TOTAL USER CPU TIME BY 15 MINUTE INTERVAL - KC2TCH3
DATA FROM 14SEP95:07:01:19 TO 14SEP95:14:54:40
------------------------------------------------ CICS*Region=PROD DATE=09/14/95 ---------------------------------------------------
CPU*Time Mean
5.000 +||||
4.000 +||||
3.000 +||| ****| ****
2.000 + ****| **** ****| **** ****| **** ****| **** **** ****
1.000 + **** **** ****| **** **** **** ****| **** **** **** **** ****| **** **** **** **** **** **** **** **** **** ****| **** **** **** **** **** **** **** **** **** **** **** **** **** **** **** **** ****---------------------------------------------------------------------------------------------------------------
8:30 8:45 9:15 9:30 9:45 10:00 10:30 10:45 11:00 11:15 11:30 12:00 12:15 12:30 12:45 14:00 14:30 14:45
TIME
OPTIONS: CICS=PROD GROUP=WORKLOAD

SAS Historical Reporting 155
Producing Reports from the SAS DETAIL Dataset
FIGURE 55. Chart of Total User CPU Time by Interval within Group
SPLIT=
You may specify the keyword ‘CICSGRP’ to produce charts by transaction group.
TYPE=V,H
Determines the type of chart to be produced-vertical or horizontal.
CHARTVAR=USRCPUTM,xxxxxxxx
Although this is a chart of user CPU time, you may produce a chart using a different variable. See “Fields Contained in DBD” on page 215 for valid field names
HDR=USER CPU TIME,cccc..ccc
Allows a user-defined header to be specified when you are requesting a different CHARTVAR variable.
SCALE=5,nn,0.n
Determines the maximum scale to use for the graph axis.
1 !CANDLE CORPORATION 08:48 Monday, September 18, 1995 1TOTAL USER CPU TIME BY 15 MINUTE INTERVAL WITHIN GROUP - KC2TCH4
DATA FROM 14SEP95:07:01:19 TO 14SEP95:14:54:40
----------------------------------------------- CICS*Region=PROD DATE=09/14/95 ---------------------------------------------------
CPU*Time Mean
5.000 + *| *| *| * *| * *
4.000 + * *| * *| * *| ** *| ** *
3.000 + * ** *| * * ** *| * * ** *| * * ** *| *** * ** *
2.000 + *** * ** ** *| *** ** ** ** **| *** * ** ** ** **| *** * ** ** ** **| *** * ** ** ** ** *
1.000 + *** * ** ** ** ** *| *** * ** ** ** *** * *| *** * ** ** ** * *** * *| *** * ** *** ** ******* * * **|* *** ** * * *** * ** *** ** ******* * * **-----------------------------------------------------------------------------------------------------------------------
1111111111111 1111111111111 1111111111111 1111111111111 1111111111111 TIME889990001112222444 889990001112222444 889990001112222444 889990001112222444 889990001112222444:::::::::::::::::: :::::::::::::::::: :::::::::::::::::: :::::::::::::::::: ::::::::::::::::::341340340130134034 341340340130134034 341340340130134034 341340340130134034 341340340130134034055050050500505005 055050050500505005 055050050500505005 055050050500505005 055050050500505005
|--- PROD CIMS --| |--- ACCTS PAY --| GENERAL LEDGER |-- RECEIVABLES -| |----- OTHER ----| CICSGRP
OPTIONS: CICS=PROD GROUP=WORKLOAD

Producing Reports from the SAS DAILY Dataset
156 OMEGAMON II for CICS Historical Reporting Guide, Version 520
Producing Reports from the SAS DAILY DatasetThis section describes sample SAS reports produced from the SAS DAILY dataset. Report program KC2DRxx and charts KC2DCHx are provided to run against the summarized SAS DAILY dataset.
Note: You may customize these programs, but Candle Support Services does not provide assistance for SAS reports that customers create or modify.
Examples of reports run against the DAILY dataset start on page page 158. Where necessary within each section for the report examples (but not on the report example itself), the title of the report is shortened so that it fits on one line.
Running the sample SAS reports against the DAILY datasetTo run the supplied sample SAS reports, customize and run the supplied KC2REPTJ job, located in the KC2SJCL dataset, at any time. This job runs the sample SAS reports on either the current SAS DETAIL dataset (or its archived copy) or the summarized DAILY dataset.
Parameters for the DAILY reports and chartsThe following parameters are available to the DAILY sample reports: DRP1 through DRnn and charts DCH1 through DCHnn. Defaults are underlined. Additional parameters for specific reports are listed in the sections describing those reports.
DAILYHI=DAILYLO value,nn
Determines the highest (oldest) daily file to be used. DAILYLO and DAILYHI determine the range of history data to be reported. If you enter only DAILYLO, DAILYHI assumes that same value. If you enter DAILYLO and inadvertently enter DAILYHI with a lower value (error situation), DAILYHI again assumes the DAILYLO value.
CICS=ALL,xxxxxxxx
Determines whether SMF records relating to all or a specific or generic CICS applid are processed. For example, CICS=PROD restricts processing to all CICS applids beginning with PROD. Alternatively, you may specify CICS=ALL and use the EXIT= option to accommodate more specific processing.
HRLO=00,nn
Determines the start time of data reported.
HRHI=23,nn
Determines the end time of data reported.
LUNAME=ALL,xxxxxxxx
Processes all VTAM LUs and allows you to restrict processing to a specific or generic LUNAME.
GROUP=ALL,WORKLOAD,nn
Processes transactions that belong to all GROUPS defined in KC2GRP. Allows you to restrict processing to a specific group of transactions. If you specify GROUP=WORKLOAD, then all transactions belonging to GROUP 0 are ignored from all processing.

SAS Historical Reporting 157
Producing Reports from the SAS DAILY Dataset
SHIFT=ALL,nn
Restricts the selection criteria to a specific shift as defined in KC2SHFT.
SUMBY=DAY,WEEK,MONTH
Determines how a report is summarized. For example, you can create a report by day for 7 days by specifying DAILYLO=1, DAILYHI=7, SUMBY=DAY, or by week by specifying DAILYLO=1, DAILYHI=7, SUMBY=WEEK.
KC2DCH1, a Response Time Chart by Hour, is summarized by week as follows:
DAILYLO=1,DAILYHI=7,LOTIME=09:00:00,HITIME=12:00:00,SUMBY=WEEKThis would graph the response time distribution for the 3-hour period over the week.
Note: This parameter is not valid for reports KC2DCH5, KC2DCH6, and KC2DRP7.
TRAN=ALL,xxxx
Restricts the selection criteria to a specific or generic transaction ID.
USERID=ALL,xxxxxxxx
Restricts the selection criteria to a specific or generic userid.
EXIT=NO,xxxxxxxx
Specifies the name of the exit program you write to allow greater selection criteria. For more information on user-written exits, see “Fields Contained in CICSTRAN” on page 205.
STOP=NO,nnn
When set to a numeric value, restricts processing to a specified number of input records for debugging purposes.
DEBUG=NO,YES
When set to YES, this parameter switches debugging on.

Producing Reports from the SAS DAILY Dataset
158 OMEGAMON II for CICS Historical Reporting Guide, Version 520
KC2DRP1-Response Time Statistics by Transaction report
This report has no additional parameters.
FIGURE 56. Response Time Statistics by Transaction Report
1 !CANDLE CORPORATION 09:06 Monday, September 18, 1995 1TRANSACTION RESPONSE TIME STATISTICS - KC2DRP1
DATA FROM 14SEP95:07:01:19 TO 14SEP95:14:54:40
------------------------------------------------ CICS*Region=PROD Month=9 Day=14 ---------------------------------------------------
Average Maximum AverageAverage Maximum Minimum CPU CPU File
Tran Transaction Response Response Response Time Time ControlID Count (Secs) (Secs) (Secs) (Secs) (Secs) Requests
AADD 9 0.007 0.016 0.005 0.0050 0.0070 0.000ABRW 364 0.301 5.795 0.004 0.1140 0.5250 5.190AC2A 1 0.386 0.386 0.386 0.0190 0.0190 0.000AC20 1 0.182 0.182 0.182 0.0200 0.0200 0.000AC22 1 0.271 0.271 0.271 0.0180 0.0180 0.000AC28 2 0.224 0.321 0.128 0.0190 0.0190 0.000AINQ 4 0.419 0.823 0.171 0.1280 0.1320 1.000AMNU 5 0.023 0.048 0.007 0.0070 0.0120 0.000AUPD 14 0.227 0.570 0.010 0.0920 0.1550 1.000DEGA 22 4.038 54.939 0.004 1.3910 19.4330 0.000DEGC 45 0.986 4.639 0.004 0.0840 0.1500 0.844DEGE 1 0.210 0.210 0.210 0.0180 0.0180 0.000DEGG 4 0.527 1.784 0.029 0.3720 1.2050 0.000DEGS 8 0.265 0.801 0.004 0.1740 0.4810 0.000DEGT 18 2.124 7.056 0.032 1.4710 4.3030 0.000DEGV 62 2.280 11.694 0.005 1.1840 3.4880 3418.629INIT 3 0.440 0.685 0.310 0.1330 0.1480 0.000LSRW 1 0.091 0.091 0.091 0.0140 0.0140 0.000QMNU 43 0.109 4.158 0.005 0.0070 0.0590 0.000RAID 1 0.013 0.013 0.013 0.0070 0.0070 0.000STAT 1 0.327 0.327 0.327 0.0200 0.0200 0.000STR1 3 0.102 0.114 0.089 0.0080 0.0110 0.000VADD 1 0.027 0.027 0.027 0.0120 0.0120 0.000VAD1 1 0.412 0.412 0.412 0.2400 0.2400 0.000VBRW 3 1.092 3.052 0.062 0.0080 0.0110 0.000VBR1 2 0.311 0.467 0.155 0.0300 0.0470 0.000VSEX 32 7.870 24.343 0.231 2.1190 9.1540 3848.344VSTR 1 0.078 0.078 0.078 0.0120 0.0120 0.000WD80 3 0.195 0.241 0.138 0.1230 0.1380 0.000TOTAL 656 1.062 54.939 0.004 0.3810 19.4330 513.791
OPTIONS:DAILYLO=1 DAILYHI=1 CICS=PROD GROUP=WORKLOAD SUMBY=DAY

SAS Historical Reporting 159
Producing Reports from the SAS DAILY Dataset
KC2DRP2-Response Time Statistics by Hour report
This report has no additional parameters.
FIGURE 57. Response Time Statistics by Hour Report
1 !CANDLE CORPORATION 09:07 Monday, September 18, 1995 1HOURLY RESPONSE TIME STATISTICS - KC2DRP2
DATA FROM 14SEP95:07:01:19 TO 14SEP95:14:54:40
----------------------------------------------- CICS*Region=PROD Month=9 Day=14 -------------------------------------------------
AverageAverage Maximum Minimum Average CPU Maximum CPU File
Transaction Response Response Response Time Time ControlHour Count (Secs) (Secs) (Secs) (Secs) (Secs) Requests
8 127 0.973 24.343 0.004 0.2783 8.3972 406.4099 189 0.675 24.064 0.004 0.2495 8.4602 362.497
10 89 1.508 15.008 0.004 0.6145 4.4282 887.46111 98 1.036 54.939 0.006 0.4101 19.4331 217.07112 47 1.280 9.397 0.005 0.4110 3.3105 762.83013 6 7.378 24.294 2.908 1.7430 8.7031 3039.33314 100 1.055 22.303 0.005 0.4277 9.1537 625.750
TOTAL 656 1.062 54.939 0.004 0.3810 19.4331 513.791
OPTIONS:DAILYLO=1 DAILYHI=1 CICS=PROD GROUP=WORKLOAD SUMBY=DAY
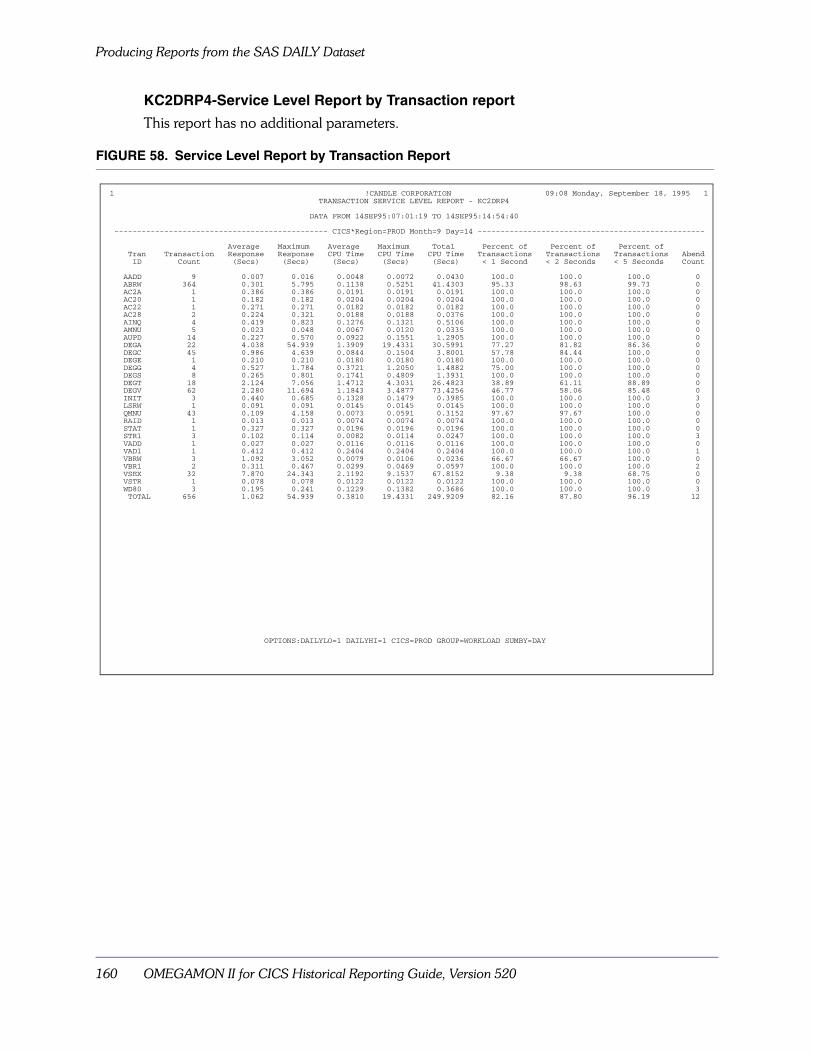
Producing Reports from the SAS DAILY Dataset
160 OMEGAMON II for CICS Historical Reporting Guide, Version 520
KC2DRP4-Service Level Report by Transaction report
This report has no additional parameters.
FIGURE 58. Service Level Report by Transaction Report
1 !CANDLE CORPORATION 09:08 Monday, September 18, 1995 1TRANSACTION SERVICE LEVEL REPORT - KC2DRP4
DATA FROM 14SEP95:07:01:19 TO 14SEP95:14:54:40
----------------------------------------------- CICS*Region=PROD Month=9 Day=14 --------------------------------------------------
Average Maximum Average Maximum Total Percent of Percent of Percent ofTran Transaction Response Response CPU Time CPU Time CPU Time Transactions Transactions Transactions AbendID Count (Secs) (Secs) (Secs) (Secs) (Secs) < 1 Second < 2 Seconds < 5 Seconds Count
AADD 9 0.007 0.016 0.0048 0.0072 0.0430 100.0 100.0 100.0 0ABRW 364 0.301 5.795 0.1138 0.5251 41.4303 95.33 98.63 99.73 0AC2A 1 0.386 0.386 0.0191 0.0191 0.0191 100.0 100.0 100.0 0AC20 1 0.182 0.182 0.0204 0.0204 0.0204 100.0 100.0 100.0 0AC22 1 0.271 0.271 0.0182 0.0182 0.0182 100.0 100.0 100.0 0AC28 2 0.224 0.321 0.0188 0.0188 0.0376 100.0 100.0 100.0 0AINQ 4 0.419 0.823 0.1276 0.1321 0.5106 100.0 100.0 100.0 0AMNU 5 0.023 0.048 0.0067 0.0120 0.0335 100.0 100.0 100.0 0AUPD 14 0.227 0.570 0.0922 0.1551 1.2905 100.0 100.0 100.0 0DEGA 22 4.038 54.939 1.3909 19.4331 30.5991 77.27 81.82 86.36 0DEGC 45 0.986 4.639 0.0844 0.1504 3.8001 57.78 84.44 100.0 0DEGE 1 0.210 0.210 0.0180 0.0180 0.0180 100.0 100.0 100.0 0DEGG 4 0.527 1.784 0.3721 1.2050 1.4882 75.00 100.0 100.0 0DEGS 8 0.265 0.801 0.1741 0.4809 1.3931 100.0 100.0 100.0 0DEGT 18 2.124 7.056 1.4712 4.3031 26.4823 38.89 61.11 88.89 0DEGV 62 2.280 11.694 1.1843 3.4877 73.4256 46.77 58.06 85.48 0INIT 3 0.440 0.685 0.1328 0.1479 0.3985 100.0 100.0 100.0 3LSRW 1 0.091 0.091 0.0145 0.0145 0.0145 100.0 100.0 100.0 0QMNU 43 0.109 4.158 0.0073 0.0591 0.3152 97.67 97.67 100.0 0RAID 1 0.013 0.013 0.0074 0.0074 0.0074 100.0 100.0 100.0 0STAT 1 0.327 0.327 0.0196 0.0196 0.0196 100.0 100.0 100.0 0STR1 3 0.102 0.114 0.0082 0.0114 0.0247 100.0 100.0 100.0 3VADD 1 0.027 0.027 0.0116 0.0116 0.0116 100.0 100.0 100.0 0VAD1 1 0.412 0.412 0.2404 0.2404 0.2404 100.0 100.0 100.0 1VBRW 3 1.092 3.052 0.0079 0.0106 0.0236 66.67 66.67 100.0 0VBR1 2 0.311 0.467 0.0299 0.0469 0.0597 100.0 100.0 100.0 2VSEX 32 7.870 24.343 2.1192 9.1537 67.8152 9.38 9.38 68.75 0VSTR 1 0.078 0.078 0.0122 0.0122 0.0122 100.0 100.0 100.0 0WD80 3 0.195 0.241 0.1229 0.1382 0.3686 100.0 100.0 100.0 3TOTAL 656 1.062 54.939 0.3810 19.4331 249.9209 82.16 87.80 96.19 12
OPTIONS:DAILYLO=1 DAILYHI=1 CICS=PROD GROUP=WORKLOAD SUMBY=DAY

SAS Historical Reporting 161
Producing Reports from the SAS DAILY Dataset
KC2DRP5-Service Level Report by Hour report
This report has no additional parameters.
FIGURE 59. Service Level Report by Hour Report
1 !CANDLE CORPORATION 09:09 Monday, September 18, 1995 1HOURLY SERVICE LEVEL REPORT - KC2DRP5
DATA FROM 14SEP95:07:01:19 TO 14SEP95:14:54:40
----------------------------------------------- CICS*Region=PROD Month=9 Day=14 -------------------------------------------------
Average Maximum Average Maximum Total Percent of Percent of Percent ofTransaction Response Response CPU Time CPU Time CPU Time Transactions Transactions Transactions Abend
Hour Count (Secs) (Secs) (Secs) (Secs) (Secs) < 1 Second < 2 Seconds < 5 Seconds Count
8 127 0.973 24.343 0.2783 8.3972 35.3412 87.40 91.34 96.06 79 189 0.675 24.064 0.2495 8.4602 47.1519 89.95 93.65 97.88 010 89 1.508 15.008 0.6145 4.4282 54.6883 58.43 75.28 92.13 011 98 1.036 54.939 0.4101 19.4331 40.1925 88.78 91.84 97.96 012 47 1.280 9.397 0.4110 3.3105 19.3155 70.21 85.11 93.62 013 6 7.378 24.294 1.7430 8.7031 10.4578 0.00 0.00 83.33 014 100 1.055 22.303 0.4277 9.1537 42.7738 86.00 86.00 97.00 5
TOTAL 656 1.062 54.939 0.3810 19.4331 249.9209 82.16 87.80 96.19 12
OPTIONS:DAILYLO=1 DAILYHI=1 CICS=PROD GROUP=WORKLOAD SUMBY=DAY

Producing Reports from the SAS DAILY Dataset
162 OMEGAMON II for CICS Historical Reporting Guide, Version 520
KC2DRP7-Response Time Graphs
This report has the following additional parameters.
The following graphs are shown in the figure:
� response time by interval� response time by transaction ID� response time by VTAM LU
FIGURE 60. Response Time Graphs
RPTINT=YES,NO
Specifies whether the Interval Response report is produced.
RPTTRAN=YES,NO
Specifies whether the Transaction Response report is produced.
RPTLU=YES,NO
Specifies whether the LU Response report is produced.
1 !CANDLE CORPORATION 09:09 Monday, September 18, 1995 1INTERVAL RESPONSE REPORT - KC2DRP7
DATA FROM 14SEP95:07:01:19 TO 14SEP95:14:54:40OPTIONS:DAILYLO=1 DAILYHI=1 CICS=PROD GROUP=WORKLOAD SUMBY=DAY
CICS APPLID=PROD0 Tran Average Average Response Time (Secs) --------- AVERAGE --------- ---------- TOTAL ----------Date Hour Count Response CPU Wait Time I/O Req CPU Disp Time I/O Req
(m:ss) .........1.........2.........3 (m:ss) (m:ss) (m:ss) (m:ss)009/14/95 8 127 0:00.973 =========> 0:00.2783 0:00.4439 406 0:35.3412 1:07.2576 51614
9 189 0:00.675 ======> 0:00.2495 0:00.1936 362 0:47.1519 1:30.9390 6851210 89 0:01.508 ===============> 0:00.6145 0:00.3364 887 0:54.6883 1:44.2773 7898411 98 0:01.036 ==========> 0:00.4101 0:00.3629 217 0:40.1925 1:05.9833 2127312 47 0:01.280 ============> 0:00.4110 0:00.5474 763 0:19.3155 0:34.4427 3585313 6 0:07.378 =============================* 0:01.7430 0:04.1353 3039 0:10.4578 0:19.4539 1823614 100 0:01.055 ==========> 0:00.4277 0:00.3015 626 0:42.7738 1:15.3172 62575

SAS Historical Reporting 163
Producing Reports from the SAS DAILY Dataset
FIGURE 61. Response Time Graphs (continued)
FIGURE 61. Response Time Graphs (continued)
1 !CANDLE CORPORATION 09:09 Monday, September 18, 1995 2TRANSACTION RESPONSE REPORT - KC2DRP7
DATA FROM 14SEP95:07:01:19 TO 14SEP95:14:54:40OPTIONS:DAILYLO=1 DAILYHI=1 CICS=PROD GROUP=WORKLOAD SUMBY=DAY
0 Tran Average Average Response Time (Secs) --------- AVERAGE --------- ---------- TOTAL ----------Tran Region Count Response CPU Wait Time I/O Req CPU Disp Time I/O ReqID (m:ss) .........1.........2.........3 (m:ss) (m:ss) (m:ss) (m:ss)
0AADD PROD 9 0:00.007 > 0:00.0048 0:00.0005 0 0:00.0430 0:00.0626 0ABRW PROD 364 0:00.301 ===> 0:00.1138 0:00.0148 5 0:41.4303 1:44.2468 1889AC2A PROD 1 0:00.386 ===> 0:00.0191 0:00.0853 0 0:00.0191 0:00.3006 0AC20 PROD 1 0:00.182 => 0:00.0204 0:00.0636 0 0:00.0204 0:00.1187 0AC22 PROD 1 0:00.271 ==> 0:00.0182 0:00.0518 0 0:00.0182 0:00.2189 0AC28 PROD 2 0:00.224 ==> 0:00.0188 0:00.0712 0 0:00.0376 0:00.3061 0AINQ PROD 4 0:00.419 ====> 0:00.1276 0:00.0160 1 0:00.5106 0:01.6105 4AMNU PROD 5 0:00.023 > 0:00.0067 0:00.0035 0 0:00.0335 0:00.0952 0AUPD PROD 14 0:00.227 ==> 0:00.0922 0:00.0191 1 0:01.2905 0:02.9137 14DEGA PROD 22 0:04.038 =============================* 0:01.3909 0:01.9941 0 0:30.5991 0:44.9627 0DEGC PROD 45 0:00.986 =========> 0:00.0844 0:00.6552 1 0:03.8001 0:14.9071 38DEGE PROD 1 0:00.210 ==> 0:00.0180 0:00.0074 0 0:00.0180 0:00.2028 0DEGG PROD 4 0:00.527 =====> 0:00.3721 0:00.0004 0 0:01.4882 0:02.1048 0DEGS PROD 8 0:00.265 ==> 0:00.1741 0:00.0251 0 0:01.3931 0:01.9202 0DEGT PROD 18 0:02.124 =====================> 0:01.4712 0:00.0004 0 0:26.4823 0:38.2168 0DEGV PROD 62 0:02.280 ======================> 0:01.1843 0:00.2656 3419 1:13.4256 2:04.9036 211955INIT PROD 3 0:00.440 ====> 0:00.1328 0:00.0251 0 0:00.3985 0:01.2450 0LSRW PROD 1 0:00.091 > 0:00.0145 0:00.0063 0 0:00.0145 0:00.0848 0QMNU PROD 43 0:00.109 => 0:00.0073 0:00.0951 0 0:00.3152 0:00.6103 0RAID PROD 1 0:00.013 > 0:00.0074 0:00.0039 0 0:00.0074 0:00.0094 0STAT PROD 1 0:00.327 ===> 0:00.0196 0:00.0026 0 0:00.0196 0:00.3245 0STR1 PROD 3 0:00.102 => 0:00.0082 0:00.0895 0 0:00.0247 0:00.0365 0VADD PROD 1 0:00.027 > 0:00.0116 0:00.0077 0 0:00.0116 0:00.0190 0VAD1 PROD 1 0:00.412 ====> 0:00.2404 0:00.0405 0 0:00.2404 0:00.3715 0VBRW PROD 3 0:01.092 ==========> 0:00.0079 0:01.0174 0 0:00.0236 0:00.2224 0VBR1 PROD 2 0:00.311 ===> 0:00.0299 0:00.0577 0 0:00.0597 0:00.5068 0VSEX PROD 32 0:07.870 =============================* 0:02.1192 0:04.2279 3848 1:07.8152 1:56.5612 123147VSTR PROD 1 0:00.078 > 0:00.0122 0:00.0053 0 0:00.0122 0:00.0732 0WD80 PROD 3 0:00.195 => 0:00.1229 0:00.0237 0 0:00.3686 0:00.5152 0
1 !CANDLE CORPORATION 09:09 Monday, September 18, 1995 3LOGICAL UNIT RESPONSE REPORT - KC2DRP7
DATA FROM 14SEP95:07:01:19 TO 14SEP95:14:54:40OPTIONS:DAILYLO=1 DAILYHI=1 CICS=PROD GROUP=WORKLOAD SUMBY=DAY
0 Tran Average Average Response Time (Secs) --------- AVERAGE --------- ---------- TOTAL ----------Region LU Count Response CPU Wait Time I/O Req CPU Disp Time I/O Req
(m:ss) .........1.........2.........3 (m:ss) (m:ss) (m:ss) (m:ss)0PROD

Producing Reports from the SAS DAILY Dataset
164 OMEGAMON II for CICS Historical Reporting Guide, Version 520
KC2DRP8-Response Time and VSAM/DB Activity by Transaction report
This report has no additional parameters.
FIGURE 62. Response Time and VSAM/DB Activity by Transaction Report
1 !CANDLE CORPORATION 11:15 Tuesday, September 19, 1995 1TRANSACTION RESPONSE TIME and VSAM/DB ACTIVITY - KC2DRP8
DATA FROM 14SEP95:07:01:19 TO 14SEP95:14:54:40
----------------------------------------------- CICS*Region=PROD Month=9 Day=14 ------------------------------------------------
Average Average AverageAverage File DL/1 DB2
Average Maximum Average Maximum File Control Average Request RequestTran Transaction Response Response CPU Time CPU Time Control Wait Time DL/1 Wait Time Wait TimeID Count (Secs) (Secs) (Secs) (Secs) Requests (Secs) Requests (Secs) (Secs)
AADD 9 0.007 0.016 0.0048 0.0072 0.00 0.000 0.00 0.000 0.000ABRW 364 0.301 5.795 0.1138 0.5251 5.19 0.004 0.00 0.000 0.000AC2A 1 0.386 0.386 0.0191 0.0191 0.00 0.000 0.00 0.000 0.000AC20 1 0.182 0.182 0.0204 0.0204 0.00 0.000 0.00 0.000 0.000AC22 1 0.271 0.271 0.0182 0.0182 0.00 0.000 0.00 0.000 0.000AC28 2 0.224 0.321 0.0188 0.0188 0.00 0.000 0.00 0.000 0.000AINQ 4 0.419 0.823 0.1276 0.1321 1.00 0.014 0.00 0.000 0.000AMNU 5 0.023 0.048 0.0067 0.0120 0.00 0.000 0.00 0.000 0.000AUPD 14 0.227 0.570 0.0922 0.1551 1.00 0.019 0.00 0.000 0.000DEGA 22 4.038 54.939 1.3909 19.4331 0.00 0.000 0.00 0.000 0.000DEGC 45 0.986 4.639 0.0844 0.1504 0.84 0.001 0.00 0.000 0.000DEGE 1 0.210 0.210 0.0180 0.0180 0.00 0.000 0.00 0.000 0.000DEGG 4 0.527 1.784 0.3721 1.2050 0.00 0.000 0.00 0.000 0.000DEGS 8 0.265 0.801 0.1741 0.4809 0.00 0.000 0.00 0.000 0.000DEGT 18 2.124 7.056 1.4712 4.3031 0.00 0.000 0.00 0.000 0.000DEGV 62 2.280 11.694 1.1843 3.4877 3418.63 0.007 0.00 0.000 0.000LSRW 1 0.091 0.091 0.0145 0.0145 0.00 0.000 0.00 0.000 0.000QMNU 43 0.109 4.158 0.0073 0.0591 0.00 0.000 0.00 0.000 0.000TOTAL 605 0.724 54.939 0.2991 19.4331 353.55 0.004 0.00 0.000 0.000
Average Average Average AverageADABAS IDMS DATACOM SUPRA
Average Average Request Average Request Average Request Average RequestTran DB2 ADABAS Wait Time IDMS Wait Time DATACOM Wait Time SUPRA Wait TimeID Requests Requests (Secs) Requests (Secs) Requests (Secs) Requests (Secs)
AADD 0.00 0.00 0.000 0.00 0.000 0.00 0.000 0.00 0.000ABRW 0.00 0.00 0.000 0.00 0.000 0.00 0.000 0.00 0.000AC2A 0.00 0.00 0.000 0.00 0.000 0.00 0.000 0.00 0.000AC20 0.00 0.00 0.000 0.00 0.000 0.00 0.000 0.00 0.000AC22 0.00 0.00 0.000 0.00 0.000 0.00 0.000 0.00 0.000AC28 0.00 0.00 0.000 0.00 0.000 0.00 0.000 0.00 0.000AINQ 0.00 0.00 0.000 0.00 0.000 0.00 0.000 0.00 0.000AMNU 0.00 0.00 0.000 0.00 0.000 0.00 0.000 0.00 0.000AUPD 0.00 0.00 0.000 0.00 0.000 0.00 0.000 0.00 0.000DEGA 0.00 0.00 0.000 0.00 0.000 0.00 0.000 0.00 0.000DEGC 0.00 0.00 0.000 0.00 0.000 0.00 0.000 0.00 0.000DEGE 0.00 0.00 0.000 0.00 0.000 0.00 0.000 0.00 0.000DEGG 0.00 0.00 0.000 0.00 0.000 0.00 0.000 0.00 0.000DEGS 0.00 0.00 0.000 0.00 0.000 0.00 0.000 0.00 0.000DEGT 0.00 0.00 0.000 0.00 0.000 0.00 0.000 0.00 0.000DEGV 0.00 0.00 0.000 0.00 0.000 0.00 0.000 0.00 0.000LSRW 0.00 0.00 0.000 0.00 0.000 0.00 0.000 0.00 0.000QMNU 0.00 0.00 0.000 0.00 0.000 0.00 0.000 0.00 0.000TOTAL 0.00 0.00 0.000 0.00 0.000 0.00 0.000 0.00 0.000
OPTIONS:DAILYLO=2 DAILYHI=2 CICS=PROD GROUP=WORKLOAD SUMBY=DAY EXIT=MYEXIT

SAS Historical Reporting 165
Producing Reports from the SAS DAILY Dataset
KC2DRP9-Response Time and VSAM/DB Activity by Hour report
This report has no additional parameters.
FIGURE 63. Response Time and VSAM/DB Activity by Hour Report
1 !CANDLE CORPORATION 09:10 Monday, September 18, 1995 1HOURLY RESPONSE TIME and VSAM/DB ACTIVITY REPORT - KC2DRP9
DATA FROM 14SEP95:07:01:19 TO 14SEP95:14:54:40
----------------------------------------------- CICS*Region=PROD Month=9 Day=14 --------------------------------------------------
Average Average AverageAverage File DL/1 DB2
Average Maximum Average CPU Maximum CPU File Control Average Request RequestTransaction Response Response Time Time Control Wait Time DL/1 Wait Time Wait Time
Hour Count (Secs) (Secs) (Secs) (Secs) Requests (Secs) Requests (Secs) (Secs)
8 127 0.973 24.343 0.2783 8.3972 406.41 0.351 0.02 0.000 0.0009 189 0.675 24.064 0.2495 8.4602 362.50 0.159 0.00 0.000 0.00010 89 1.508 15.008 0.6145 4.4282 887.46 0.001 0.00 0.000 0.00011 98 1.036 54.939 0.4101 19.4331 217.07 0.005 0.00 0.000 0.00012 47 1.280 9.397 0.4110 3.3105 762.83 0.001 0.00 0.000 0.00013 6 7.378 24.294 1.7430 8.7031 3039.33 4.145 0.00 0.000 0.00014 100 1.055 22.303 0.4277 9.1537 625.75 0.293 0.04 0.000 0.000
TOTAL 656 1.062 54.939 0.3810 19.4331 513.79 0.197 0.01 0.000 0.000
Average Average Average AverageADABAS IDMS DATACOM SUPRA
Average Average Request Average Request Average Request Average RequestDB2 ADABAS Wait Time IDMS Wait Time DATACOM Wait Time SUPRA Wait Time
Hour Requests Requests (Secs) Requests (Secs) Requests (Secs) Requests (Secs)
8 0.00 0.00 0.000 0.00 0.000 0.00 0.000 0.00 0.0009 0.00 0.00 0.000 0.00 0.000 0.00 0.000 0.00 0.00010 0.00 0.00 0.000 0.00 0.000 0.00 0.000 0.00 0.00011 0.00 0.00 0.000 0.00 0.000 0.00 0.000 0.00 0.00012 0.00 0.00 0.000 0.00 0.000 0.00 0.000 0.00 0.00013 0.00 0.00 0.000 0.00 0.000 0.00 0.000 0.00 0.00014 0.00 0.00 0.000 0.00 0.000 0.00 0.000 0.00 0.000
TOTAL 0.00 0.00 0.000 0.00 0.000 0.00 0.000 0.00 0.000
OPTIONS:DAILYLO=1 DAILYHI=1 CICS=PROD GROUP=WORKLOAD SUMBY=DAY

Producing Reports from the SAS DAILY Dataset
166 OMEGAMON II for CICS Historical Reporting Guide, Version 520
KC2DR16-Region Summary report
This report has no additional parameters.
FIGURE 64. Region Summary Report
KC2DCH1-Chart of Average Response Time by Hour parameters
This chart provides the following additional parameters.
SPLIT=
You may specify the keyword ‘CICSGRP’ to produce charts by transaction group.
TYPE=V,H
Determines the type of chart to be produced- vertical or horizontal.
1 !CANDLE CORPORATION 09:12 Monday, September 18, 1995 1REGION SUMMARY REPORT - KC2DR16
DATA FROM 14SEP95:07:01:19 TO 14SEP95:14:54:40
Average TotalTask Task Response User CPU
CICS Start End Transaction Time Time Total TotalRegion Timestamp Timestamp Count (Secs) (hh:mm:ss) I/O Requests Abends
PROD03 14SEP1995:07:01:51.123 14SEP1995:13:45:17.421 1132 1.001 0:06:13 378,537 112PROD15 14SEP1995:08:02:48.542 14SEP1995 12:23:41.652 2373 2.136 0:10:04 624,234 32PROD27 14SEP1995:06:25:24.143 14SEP1995 14:06:22.124 3785 1.168 0:14:19 752,657 34PROD32 14SEP1995:09:07:10.331 14SEP1995 13:21:59.231 8951 1.326 0:24:41 965,675 5PROD66 14SEP1995:08:15:05.354 14SEP1995:14:39:54.936 656 1.06 0:04:10 337,047 12
OPTIONS:DAILYLO=1 DAILYHI=1 CICS=PROD GROUP=WORKLOAD SUMBY=DAY

SAS Historical Reporting 167
Producing Reports from the SAS DAILY Dataset
FIGURE 65. Chart of Average Response Time by Hour
CHARTVAR=RESPTIME,xxxxxxxx
Although this is by default a response time chart, you may specify another field here; for example, USRCPUTM, to obtain a chart of user CPU time. See “Copying SMF Records to a Journal” on page 221 for valid field names.
HDR=AVERAGE RESPONSE TIME,cccc..ccc
Allows a user-defined header to be specified.
SCALE=5,nn,0.n
Determines the maximum scale to use for the graph axis.
1 !CANDLE CORPORATION 09:13 Monday, September 18, 1995 1AVERAGE RESPONSE TIME BY HOUR - KC2DCH1
DATA FROM 14SEP95:07:01:19 TO 14SEP95:14:54:40
---------------------------------------------- CICS*Region=PROD Month=9 Day=14 -------------------------------------------------
Response*Time Mean
5.000 +||||
4.000 +|| *****| *****| *****
3.000 + *****| *****| *****| *****| ***** *****
2.000 + ***** *****| ***** *****| ***** ***** *****| ***** ***** *****| ***** ***** ***** *****
1.000 + ***** ***** ***** ***** ***** *****| ***** ***** ***** ***** ***** *****| ***** ***** ***** ***** ***** ***** *****| ***** ***** ***** ***** ***** ***** *****| ***** ***** ***** ***** ***** ***** *****--------------------------------------------------------------------------------------------
8 9 10 11 12 13 14
Hour
OPTIONS:DAILYLO=1 DAILYHI=1 CICS=PROD GROUP=WORKLOAD SUMBY=DAY

Producing Reports from the SAS DAILY Dataset
168 OMEGAMON II for CICS Historical Reporting Guide, Version 520
KC2DCH2-Average Response Time by Hour within Group
KC2DCH2, which produces a chart of average response time by hour within each group, has the following additional parameters.
FIGURE 66. Chart of Average Response Time by Hour within Group
TYPE=V,H
Determines the type of chart to be produced- vertical or horizontal.
CHARTVAR=RESPTIME,xxxxxxxx
Although this is by default a chart of response time, you may specify another field here; for example, USRCPUTM, to obtain a chart of user CPU time. See “Copying SMF Records to a Journal” on page 221 for valid field names.
HDR=AVERAGE RESPONSE TIME,cccc..ccc
Allows a user-defined header to be specified.
SCALE=5,nn,0.n
Determines the maximum scale to use for the graph axis.
1 !CANDLE CORPORATION 09:14 Monday, September 18, 1995 1AVERAGE RESPONSE TIME - BY HOUR WITHIN GROUP - KC2DCH2
DATA FROM 14SEP95:07:01:19 TO 14SEP95:14:54:40
----------------------------------------------- CICS*Region=PROD Month=9 Day=14 --------------------------------------------------
Response*Time Mean
5.000 +||||
4.000 + **| **| ** ** ** **| ** ** ** **| ** ** ** **
3.000 + ** ** ** **| ** ** ** ** **| ** ** ** ** **| ** ** ** ** **| ** ** ** ** **
2.000 + ** ** ** ** ** ** **| ** ** ** ** ** ** ** **| ** ** ** ** ** ** ** **| ** ** ** ** ** ** ** ** ** **| ** ** ** ** ** ** ** ** ** ** **
1.000 + ** ** ** ** ** ** ** ** ** ** ** ** ** ** **| ** ** ** ** ** ** ** ** ** ** ** ** ** ** **| ** ** ** ** ** ** ** ** ** ** ** ** ** ** ** ** ** ** ** ** **| ** ** ** ** ** ** ** ** ** ** ** ** ** ** ** ** ** ** ** ** ** ** ** ** ** ** ** **| ** ** ** ** ** ** ** ** ** ** ** ** ** ** ** ** ** ** ** ** ** ** ** ** ** ** ** ** ** ** ** ** ** ** **-----------------------------------------------------------------------------------------------------------------------
8 9 10 11 12 13 14 8 9 10 11 12 13 14 8 9 10 11 12 13 14 8 9 10 11 12 13 14 8 9 10 11 12 13 14 HOUR
|---- PROD CIMS ---| |---- ACCTS PAY ---| |- GENERAL LEDGER -| |--- RECEIVABLES --| |------ OTHER -----| CICSGRP
OPTIONS:DAILYLO=1 DAILYHI=1 CICS=PROD GROUP=WORKLOAD SUMBY=DAY

SAS Historical Reporting 169
Producing Reports from the SAS DAILY Dataset
KC2DCH3-Chart of Total User CPU Time by Hour parameters
This chart provides the following additional parameters
SPLIT=
You may specify the keyword ‘CICSGRP’ to produce charts by transaction group.
TYPE=V,H
Determines the type of chart to be produced- vertical or horizontal.
CHARTVAR=USRCPUTM,xxxxxxxx
Although this is by default a chart of user CPU time, you may specify another field here. See “Copying SMF Records to a Journal” on page 221 for valid field names.
HDR=USER CPU TIME,cccc..ccc
Allows a user-defined header to be specified.

Producing Reports from the SAS DAILY Dataset
170 OMEGAMON II for CICS Historical Reporting Guide, Version 520
FIGURE 67. Chart of Total CPU Time by Hour
1 !CANDLE CORPORATION 09:14 Monday, September 18, 1995 1TOTAL USER CPU TIME BY HOUR - KC2DCH3
DATA FROM 14SEP95:07:01:19 TO 14SEP95:14:54:40
----------------------------------------------- CICS*Region=PROD Month=9 Day=14 --------------------------------------------------
CPU*Time Sum
||
50.000 +||||
40.000 + *****| *****| ***** *****| ***** *****| ***** *****
30.000 + ***** ***** ***** *****| ***** ***** ***** *****| ***** ***** ***** *****| ***** ***** ***** *****| ***** ***** ***** *****
20.000 + ***** ***** ***** ***** ***** *****| ***** ***** ***** ***** ***** *****| ***** ***** ***** ***** ***** *****| ***** ***** ***** ***** ***** *****| ***** ***** ***** ***** ***** *****
10.000 + ***** ***** ***** ***** ***** ***** *****| ***** ***** ***** ***** ***** ***** *****| ***** ***** ***** ***** ***** ***** *****| ***** ***** ***** ***** ***** ***** *****| ***** ***** ***** ***** ***** ***** *****--------------------------------------------------------------------------------------------
8 9 10 11 12 13 14
Hour
OPTIONS:DAILYLO=1 DAILYHI=1 CICS=PROD GROUP=WORKLOAD SUMBY=DAY

SAS Historical Reporting 171
Producing Reports from the SAS DAILY Dataset
KC2DCH4-Total User CPU Time by Hour within Group parameters
KC2DCH4, which produces a chart of total user CPU time by hour within each group, has the following additional parameters.
FIGURE 68. Chart of Total User CPU Time by Hour within Group
TYPE=V,H
Determines the type of chart to be produced- vertical or horizontal.
CHARTVAR=USRCPUTM,xxxxxxxx
Although this is by default a chart of user CPU time, you may specify another field here. See “Copying SMF Records to a Journal” on page 221 for valid field names.
HDR=USER CPU TIME,cccc..ccc
Allows a user-defined header to be specified.
1 !CANDLE CORPORATION 09:14 Monday, September 18, 1995 1TOTAL USER CPU TIME BY HOUR WITHIN GROUP - KC2DCH4
DATA FROM 14SEP95:07:01:19 TO 14SEP95:14:54:40
----------------------------------------------- CICS*Region=PROD Month=9 Day=14 --------------------------------------------------
CPU*Time Sum
||
50.000 +||||
40.000 + OOOOO| OOOOO| OOOOO OOOOO| OOOOO OOOOO| OOOOO OOOOO
30.000 + OOOOO OOOOO OOOOO OOOOO| OOOOO OOOOO OOOOO OOOOO| AAAAA OOOOO OOOOO GGGGG| AAAAA OOOOO OOOOO GGGGG| AAAAA OOOOO OOOOO GGGGG
20.000 + OOOOO AAAAA OOOOO OOOOO OOOOO AAAAA| AAAAA AAAAA GGGGG OOOOO OOOOO AAAAA| AAAAA PPPPP GGGGG OOOOO OOOOO AAAAA| AAAAA PPPPP GGGGG GGGGG OOOOO AAAAA| AAAAA PPPPP GGGGG GGGGG OOOOO AAAAA
10.000 + AAAAA PPPPP GGGGG PPPPP OOOOO AAAAA AAAAA| PPPPP PPPPP GGGGG PPPPP OOOOO AAAAA PPPPP| PPPPP PPPPP GGGGG PPPPP OOOOO AAAAA PPPPP| PPPPP PPPPP GGGGG PPPPP OOOOO AAAAA PPPPP| PPPPP PPPPP PPPPP PPPPP PPPPP AAAAA PPPPP--------------------------------------------------------------------------------------------
8 9 10 11 12 13 14
Hour
Symbol CICSGRP Symbol CICSGRP Symbol CICSGRP Symbol CICSGRP Symbol CICSGRP
P PROD CIMS A ACCTS PAY G GENERAL LEDGER R RECEIVABLES O OTHER
OPTIONS:DAILYLO=1 DAILYHI=1 CICS=PROD GROUP=WORKLOAD SUMBY=DAY

Producing Reports from the SAS DAILY Dataset
172 OMEGAMON II for CICS Historical Reporting Guide, Version 520
KC2DCH5-Chart of Average Response Time by Day
This chart provides the following additional parameters.
Note: KC2DCH5 uses a default value of 7 for the DAILYHI parameter rather than the usual default of 1. Using this higher value, you can produce a report of daily response time for a 7-day period.
SPLIT=
You may specify the keyword ‘CICSGRP’ to produce charts by transaction group.
TYPE=V,H
Determines the type of chart to be produced- vertical or horizontal.
CHARTVAR=RESPTIME,xxxxxxxx
Although this is by default a chart of response time, you may specify another field here. See “Copying SMF Records to a Journal” on page 221 for valid field names.
HDR=RESPONSE TIME STATISTICS,cccc..ccc
Allows a user-defined header to be specified.
SCALE=5,nn,0.n
Determines the maximum scale to use for the graph axis.
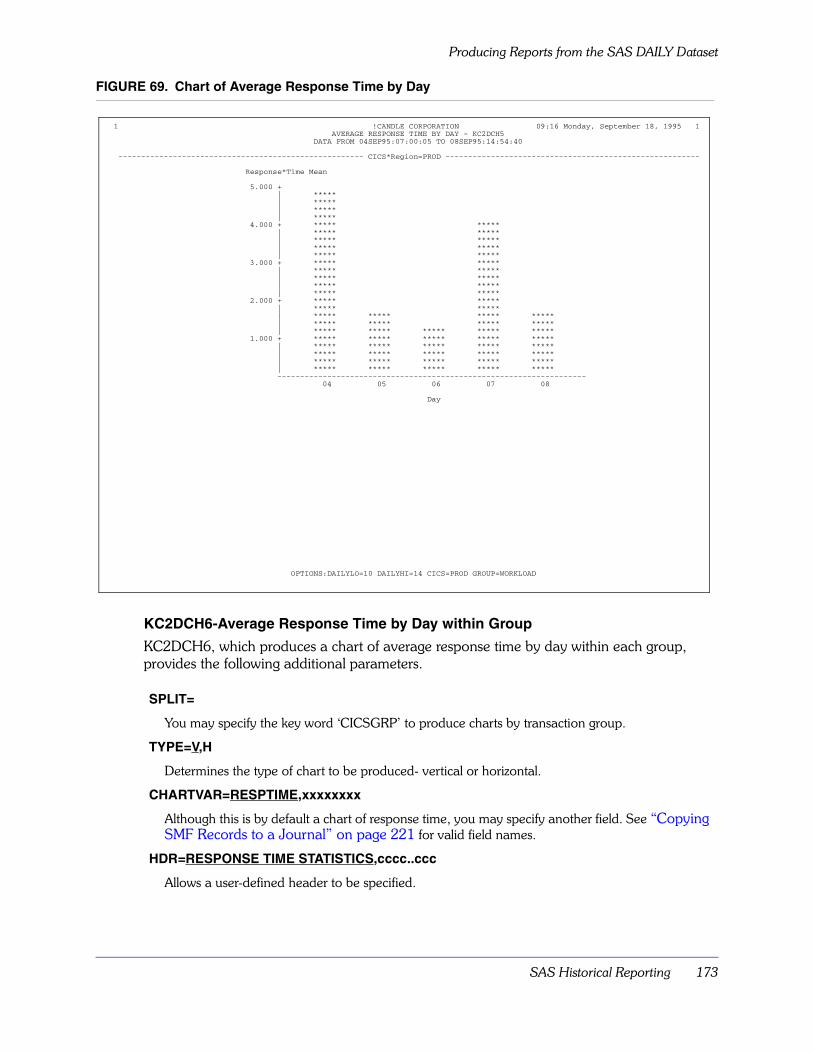
SAS Historical Reporting 173
Producing Reports from the SAS DAILY Dataset
FIGURE 69. Chart of Average Response Time by Day
KC2DCH6-Average Response Time by Day within Group
KC2DCH6, which produces a chart of average response time by day within each group, provides the following additional parameters.
SPLIT=
You may specify the key word ‘CICSGRP’ to produce charts by transaction group.
TYPE=V,H
Determines the type of chart to be produced- vertical or horizontal.
CHARTVAR=RESPTIME,xxxxxxxx
Although this is by default a chart of response time, you may specify another field. See “Copying SMF Records to a Journal” on page 221 for valid field names.
HDR=RESPONSE TIME STATISTICS,cccc..ccc
Allows a user-defined header to be specified.
1 !CANDLE CORPORATION 09:16 Monday, September 18, 1995 1AVERAGE RESPONSE TIME BY DAY - KC2DCH5
DATA FROM 04SEP95:07:00:05 TO 08SEP95:14:54:40
------------------------------------------------------ CICS*Region=PROD --------------------------------------------------------
Response*Time Mean
5.000 +| *****| *****| *****| *****
4.000 + ***** *****| ***** *****| ***** *****| ***** *****| ***** *****
3.000 + ***** *****| ***** *****| ***** *****| ***** *****| ***** *****
2.000 + ***** *****| ***** *****| ***** ***** ***** *****| ***** ***** ***** *****| ***** ***** ***** ***** *****
1.000 + ***** ***** ***** ***** *****| ***** ***** ***** ***** *****| ***** ***** ***** ***** *****| ***** ***** ***** ***** *****| ***** ***** ***** ***** *****--------------------------------------------------------------------
04 05 06 07 08
Day
OPTIONS:DAILYLO=10 DAILYHI=14 CICS=PROD GROUP=WORKLOAD

Producing Reports from the SAS DAILY Dataset
174 OMEGAMON II for CICS Historical Reporting Guide, Version 520
FIGURE 70. Chart of Average Response Time by Day within Group
SCALE=5,nn,0.n
Determines the maximum scale to use for the graph axis.
1 !CANDLE CORPORATION 09:17 Monday, September 18, 1995 1AVERAGE RESPONSE TIME BY DAY WITHIN GROUP - KC2DCH6
DATA FROM 04SEP95:07:00:05 TO 08SEP95:14:54:40
----------------------------------------------------- CICS*Region=PROD ---------------------------------------------------------
Response*Time Mean
5.000 +||||
4.000 +| **| ** **| ** ** **| ** ** **
3.000 + ** ** ** ** **| ** ** ** ** ** **| ** ** ** ** ** **| ** ** ** ** ** **| ** ** ** ** ** **
2.000 + ** ** ** ** ** **| ** ** ** ** ** **| ** ** ** ** ** **| ** ** ** ** ** ** **| ** ** ** ** ** ** ** ** **
1.000 + ** ** ** ** ** ** ** ** **| ** ** ** ** ** ** ** ** ** ** ** ** **| ** ** ** ** ** ** ** ** ** ** ** ** ** ** ** **| ** ** ** ** ** ** ** ** ** ** ** ** ** ** ** ** ** ** ** ** **| ** ** ** ** ** ** ** ** ** ** ** ** ** ** ** ** ** ** ** ** ** ** ** **-----------------------------------------------------------------------------------------------------------------------
04 05 06 07 08 04 05 06 07 08 04 05 06 07 08 04 05 06 07 08 04 05 06 07 08 DAY
|--- PROD CIMS --| |--- ACCTS PAY --| GENERAL LEDGER |-- RECEIVABLES -| |----- OTHER ----| CICSGRP
OPTIONS:DAILYLO=10 DAILYHI=14 CICS=PROD GROUP=WORKLOAD

SAS Historical Reporting 175
Producing Reports through the Generalized Report Writer
Producing Reports through the Generalized Report WriterYou can create your own custom reports from the DETAIL dataset, using the Generalized Report Writer. This facility allows you to supply the report field names, using the SAS LET command, and the summarization criteria and output format that you require. A list of field names is contained in member KC2LABL, which is used in the KC2SMFR program. For more information on KC2LABL, see “Coding User-Defined Exits” on page 201.
Reports can be list or summary type reports, depending on the parameters you define. First, familiarize yourself with the control statements used to generate custom reports, then see “Tips for producing list and summary reports” on page 178 for helpful hints.
Using the KC2TGRW programKC2TGRW is the SAS code that performs the Generalized Report Writer function. Whenever you want user-defined reports, invoke the KC2TGRW program by customizing and running the supplied KC2GRWJ job, located in the KC2SJCL dataset, against the SAS DETAIL dataset (or its archived copy).
This code provides the following parameters. Defaults are underlined:
CICS=ALL,xxxxxxxx
Determines whether SMF records relating to all or a specific or generic CICS applid are processed. For example, CICS=PROD restricts processing to all CICS applids beginning with PROD. Alternatively, you may specify CICS=ALL and use the EXIT= option to accommodate more specific processing.
LUNAME=ALL,xxxxxxxx
Processes all VTAM LUs and allows you to restrict processing to a specific or generic LUNAME.
GROUP=ALL,WORKLOAD,nn
Processes transactions that belong to all GROUPS defined in KC2GRP. Allows you to restrict processing to a specific group of transactions. If you specify GROUP=WORKLOAD, then all transactions belonging to GROUP 0 are ignored from all processing.
SHIFT=ALL,nn
Restricts the selection criteria to a specific shift as defined in KC2SHFT.
TERM=ALL,xxxx
Restricts the selection criteria to specific or generic terminal IDs.
TRAN=ALL,xxxx
Restricts the selection criteria to a specific or generic transaction ID.
USERID=ALL,xxxxxxxx
Restricts the selection criteria to a specific or generic userid.
LODATE=NO,mm/dd/yy
Restricts the selection criteria to a specific start date.

Producing Reports through the Generalized Report Writer
176 OMEGAMON II for CICS Historical Reporting Guide, Version 520
Running the generalized report writerCustomize and run the supplied KC2GRWJ job, located in the KC2SJCL dataset, against the SAS DETAIL dataset (or its archived copy) when you want user-defined reports.
Merging of the SAS DETAIL data filesSince the SAS DETAIL dataset comprises two data files, CICSTRAN and the optional DBD data file, the Generalized Report Writer must merge the files for reporting purposes when the KEEPDBD parameter specifies at least one field. The two files are merged based upon their internal CICS unit-of-work token and transaction ID. Any mismatches are dropped from the report.
Control statements for generating custom reportsUse the following 14 control statements in KC2GRWJ to generate custom reports:
Note: All control statements must be present and each statement terminated with;
LOTIME=NO:,hh:mm:ss
Restricts the selection criteria to a specific start time.
HIDATE=NO,mm/dd/yy
Restricts the selection criteria to a specific end date.
HITIME=NO,hh:mm:ss
Restricts the selection criteria to a specific end time.
EXIT=NO,xxxxxxxx
Specifies the name of the exit program you write to allow greater selection criteria. For more information on user-written exits, see “Fields Contained in CICSTRAN” on page 205.
STOP=NO,nnn
When set to a numeric value, restricts processing to a specified number of input records for debugging purposes.
HDR=User Defined Report,cc..cc
Allows you to specify a heading to be generated as part of the report title.
DEBUG=NO,YES
When set to YES, this parameter switches debugging on.
KEEP=field1 field2 field3 field4..;
Assigns all the fields from the CICSTRAN data file within the DETAIL dataset that you require to produce the report. At least one field must be present.
KEEPDBD=field1 field2 field3 field4..;
Assigns any optional fields from the DBD data file within the DETAIL dataset that you require to produce the report. If no fields are required, you must define this parameter as KEEPDBD=; If you do so, the data files (from the SAS DETAIL dataset) are not merged.

SAS Historical Reporting 177
Producing Reports through the Generalized Report Writer
This definition provides averages, totals, maximums and minimums of transaction CPU and response times.
Note: The presence of variables defined to the SUMVARS control statement determines whether a list or summary report is produced. See “Tips for producing list and summary reports” on page 178 for more information.
SORTBY=field1 field2 field3..;
Assigns all the fields you sort by.
SUMVARS=field1 field2 field3..;
Specifies the field names to be summarized. The output from the summarization process generates summarized variables in the order matching the SUMVARS statement; for example,
SUMVARS=USRCPUTM RESPTIME
Caution
For each field defined in the SUMVAR control statement, you must define a corresponding field in each of the AVER, TOTAL, MAX and MIN control statements. Therefore, you may need to define dummy fields for fields you do not need.
If you do not require any output variables of a certain type, you can specify a null value; for example, MIN=.;.
AVER=useravgfield1 useravgfield2..;
Defines the user-specified fields for averages, for each field defined in the same order as specified in the SUMVARS statement.
TOTAL=usertotfield1 usertotfield2..;
Defines the user-specified fields for totals, for each field defined in the same order as specified in the SUMVARS statement.
MAX=usermaxfield1 usermaxfield2..;
Defines the user-specified field for maximums, for each field defined in the same order as specified in the SUMVARS statement.
MIN=userminfield1 userminfield2..;
Defines the user-specified field for minimums, for each field defined in the same order as specified in the SUMVARS statement.
PRINTBY=field1,userfieldx..;
Defines the print control break. For example, if you want a report of transaction counts by CICS region, you can first sort by region (SMFMNPRN) and transaction ID (TRAN), summarize to get the total transaction count, and then use the PRINTBY statement to force a break at every new region name.
PRINTID=field1;
Specifies the first field to appear on each line of the report. This parameter also prevents SAS from numbering each line of the report.

Producing Reports through the Generalized Report Writer
178 OMEGAMON II for CICS Historical Reporting Guide, Version 520
Tips for producing list and summary reportsIf you require a list report, leave SUMVARS, AVER, TOTAL, MAX and MIN set to nulls; for example, specify MIN=;. You may then report on any field defined in the KEEP list.
1. If you require a summary report, follow these steps:
2. Specify the required fields in the KEEP list.
3. In the SORTBY list, specify the fields you want to sort and summarize.In the SUMVARS list, specify the fields for which you want summary information.
If you require averages, totals, minimums, or maximums, then specify fields in the AVER, TOTAL, MAX, and MIN parameters, respectively. You may now report on the fields specified in the parameters SORTBY, AVER, TOTAL, MAX and MIN.
Examples of custom reportsThis section contains examples of code you can write to produce custom reports through the Generalized Report Writer. It also contains examples of the reports produced from this code.
Read the report definition examples for explanations of how the control statements are used.
PRINT=field1 userfieldx..;
Defines the fields that you want to appear on the report, including user-defined fields specified in the AVER, TOTAL, MAX and MIN statements.
HEADING=userfield1=heading1 userfield2=heading2;
User-defined fields specified in AVER, TOTAL, MAX and MIN, which are to be written to the report, can have headings defined. For example, HEADING=TRAN_CT=Total Transaction*Count;..
FORMAT=field1 field2 format..;
Defines the format in which a field is to be printed using standard SAS notation. For example, to print User CPU Time and the Dispatch Wait Time as 8-character fields to four decimal places, specify the following:
FORMAT USRCPUTM DISPWTTM 8.4In addition, an internal format exists (IN_K.) to display count fields in units of thousands. For example, to print a File Control I/O Requests field, specify:
FORMAT FCTOTCT IN_K.;
This field reports as nnn for values less than 1000 and nnnK for values in excess of 1000.
If FORMAT is left to default, the fields print in accordance with their internal SAS format.
KC2TGRW
The SAS macro that invokes the Generalized Report Writer.
The JCL supplied for KC2TGRW, KC2GRWJ, contains sample custom reports that you can customize.
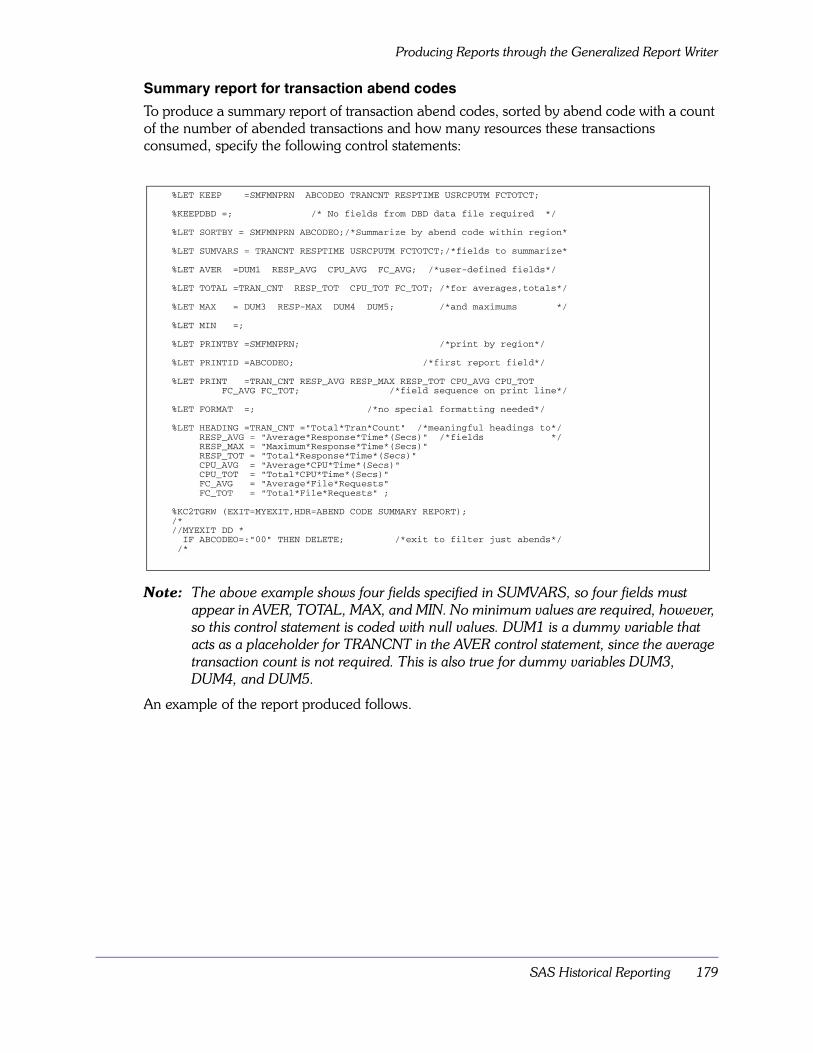
SAS Historical Reporting 179
Producing Reports through the Generalized Report Writer
Summary report for transaction abend codes
To produce a summary report of transaction abend codes, sorted by abend code with a count of the number of abended transactions and how many resources these transactions consumed, specify the following control statements:
Note: The above example shows four fields specified in SUMVARS, so four fields must appear in AVER, TOTAL, MAX, and MIN. No minimum values are required, however, so this control statement is coded with null values. DUM1 is a dummy variable that acts as a placeholder for TRANCNT in the AVER control statement, since the average transaction count is not required. This is also true for dummy variables DUM3, DUM4, and DUM5.
An example of the report produced follows.
%LET KEEP =SMFMNPRN ABCODEO TRANCNT RESPTIME USRCPUTM FCTOTCT;
%KEEPDBD =; /* No fields from DBD data file required */
%LET SORTBY = SMFMNPRN ABCODEO;/*Summarize by abend code within region*
%LET SUMVARS = TRANCNT RESPTIME USRCPUTM FCTOTCT;/*fields to summarize*
%LET AVER =DUM1 RESP_AVG CPU_AVG FC_AVG; /*user-defined fields*/
%LET TOTAL =TRAN_CNT RESP_TOT CPU_TOT FC_TOT; /*for averages,totals*/
%LET MAX = DUM3 RESP-MAX DUM4 DUM5; /*and maximums */
%LET MIN =;
%LET PRINTBY =SMFMNPRN; /*print by region*/
%LET PRINTID =ABCODEO; /*first report field*/
%LET PRINT =TRAN_CNT RESP_AVG RESP_MAX RESP_TOT CPU_AVG CPU_TOTFC_AVG FC_TOT; /*field sequence on print line*/
%LET FORMAT =; /*no special formatting needed*/
%LET HEADING =TRAN_CNT ="Total*Tran*Count" /*meaningful headings to*/RESP_AVG = "Average*Response*Time*(Secs)" /*fields */RESP_MAX = "Maximum*Response*Time*(Secs)"RESP_TOT = "Total*Response*Time*(Secs)"CPU_AVG = "Average*CPU*Time*(Secs)"CPU_TOT = "Total*CPU*Time*(Secs)"FC_AVG = "Average*File*Requests"FC_TOT = "Total*File*Requests" ;
%KC2TGRW (EXIT=MYEXIT,HDR=ABEND CODE SUMMARY REPORT);/*//MYEXIT DD *
IF ABCODEO=:"00" THEN DELETE; /*exit to filter just abends*//*

Producing Reports through the Generalized Report Writer
180 OMEGAMON II for CICS Historical Reporting Guide, Version 520
FIGURE 71. Abend Code Summary Report
List report of transactions using umbrella services
To produce a list report of transactions that use OMEGAMON II umbrella transaction services, specify the following control statements. This report shows the umbrella transaction ID, program name, and the 32-byte user work area. Only those transactions with an umbrella transaction ID or program name are reported.
1 !CANDLE CORPORATION 12:20 Monday, September 18, 1995CICS GENERALIZED REPORT WRITER - KC2TGRW
ABEND CODE SUMMARY REPORTDATA FROM 14SEP95:07:01:19 TO 14SEP95:14:54:40
------------------------------------------------------- CICS*Region=PROD ---------------------------------------------------
Average Maximum Total Average TotalTotal Response Response Response CPU CPU Average Total
Original Tran Time Time Time Time Time File FileAbend Code Count (Secs) (Secs) (Secs) (Secs) (Secs) Requests Requests
AEIA 1 975.106 975.106 975.106 31.3336 31.3336 0.0 0AEIL 6 0.223 0.467 1.339 0.0541 0.3248 0.0 0AEXY 5 43.517 63.709 217.586 0.1015 0.5074 1.6 8AEY9 1 0.106 0.106 0.106 0.0194 0.0194 0.0 0AJCG 2 485.399 942.786 970.798 13.2978 26.5956 0.0 0AKC3 1 56.792 56.792 56.792 0.0100 0.0100 0.0 0ASRA 7 44.270 144.138 309.893 2.3119 16.1834 0.0 0ATSC 1 178.351 178.351 178.351 0.0149 0.0149 0.0 0DHTJ 6 0.318 0.685 1.906 0.1279 0.7671 0.0 0
OPTIONS: CICS=PROD GROUP=WORKLOAD EXIT=MYEXIT
%LET KEEP =SMFMNPRN TRANNUM TRAN PGMNAME START USRCPUTM RESPTIMEMUMBPTC MUMBUSR MUSRWRK;
%KEEPDBD =; no fields from DBD datafile required*/
%LET SORTBY = SMFMNPRN TRANNUM;
%LET SUMVARS =; /*denotes a LIST type report */
%LET AVER =; /*therefore AVER */
%LET TOTAL =; /* and TOTAL */
%LET MAX =; /* and MAX */
%LET MIN =; /* and MIN are not used so set to null*/
%LET PRINTBY = SMFMNPRN; /* print by region */
%LET PRINTID = TRANNUM; /* first report field */
%LET PRINT = TRAN PGMNAME START USRCPUTM RESPTIME MUMBPTCMUMBUSR MUSRWRK; /* field sequence on print line */
%LET FORMAT =; /*Use default formatting */
%LET HEADING =; /*no special heading requirements needed */
%KC2TGRW (CICS=TDOCS66,GROUP=WORKLOAD,HDR=UMBRELLA TRANSACTION REPORT,EXIT=UMBEXIT);
/*//UMBEXIT DD *IF MUMBPTC=:”00”X AND MUMBUSR=:”00”X THEN DELETE; /*our filter criteri/*

SAS Historical Reporting 181
Producing Reports through the Generalized Report Writer
An example of the report produced appears below.
FIGURE 72. Umbrella Transaction Report
1 !CANDLE CORPORATION 12:39 Monday, September 18, 1995 1CICS GENERALIZED REPORT WRITER - KC2TGRW
UMBRELLA TRANSACTION REPORTDATA FROM 12SEP95:05:03:25 TO 12SEP95:16:34:17
----------------------------------------------------- CICS*Region=PROD ---------------------------------------------------------
TaskTask Tran Program Start CPU Response Umbrella Umbrella Umbrella
Number ID Name Timestamp Time Time Tran ID Program Name User Work Area
117 INIT WKDL90 12SEP1995:09:25:53.341 0.124 0.310 INIT WKDL90280 TUMB TESTUMBR 12SEP1995:09:42:15.344 0.013 180.194 TEST SCREEN=SCT01,USER=DKJ1497 TUMB TESTUMBR 12SEP1995:11:33:53.580 0.010 180.780 TEST SCREEN=SGC03,USER=RJB11263 NTL1 NTL010 12SEP1995:12:39:52.745 0.148 0.685 NT10 INV=0128511264 INIT WKDL90 12SEP1995:12:39:54.611 0.126 0.325 INIT WKDL90
OPTIONS: CICS=PROD GROUP=WORKLOAD EXIT=UMBEXIT

Producing Reports through the Generalized Report Writer
182 OMEGAMON II for CICS Historical Reporting Guide, Version 520
Replication of the supplied SAS report KC2TRP3
You may use the Generalized Report Writer to replicate the supplied SAS report, KC2TRP3. Specify the following control statements:
An example of the report produced appears in Figure 73 on page 183.
%LET KEEP =SMFMNPRN TRAN START TRANNUM TTYPE TERM RESPTIMEUSRCPUTM FCTOTCT SUSPNDTM DISPWTTM ABCODEO;
%LET KEEPDBD =; /*no fields from DBD needed */
%LET SORTBY =SMFMNPRN START; /*by task start time in region*/
%LET SUMVARS =; /*this is a list report so */
%LET AVER =; /*none */
%LET TOTAL =; /*of */
%LET MAX =; /*these */
%LET MIN =; /*fields needed */
%LET PRINTBY =SMFMNPRN; /*print by region */
%LET PRINTID =TRAN; /*first field on the report */
%LET PRINT =START TRANNUM TRANTYPE TERM RESPTIME USRCPUTM FCTOTCTSUSPNDTM DISPWTTM ABCODEO; /*other fields in order */
%LET HEADING =TRANTYPE='Tran*Type'; /*Tran Type is our/*representation of TTYPE */
%LET FORMAT =SUSPNDTM DISPWTTM 8.3 FCTOTCT IN_K.USRCPUTM 8.4;
%KC2TGRW (HDR=TRP3 EQUIVALENT REPORT,EXIT=MYEXIT,GROUP=WORKLOAD);/*//MYEXIT DD *IF ABCODEO=: "00"X THEN DELETE;

SAS Historical Reporting 183
Producing Reports through the Generalized Report Writer
FIGURE 73. TRP3 Equivalent Report
1 !CANDLE CORPORATION 11:34 Monday, September 18, 1995 1CICS GENERALIZED REPORT WRITER - KC2TGRW
TRP3 EQUIVALENT REPORTDATA FROM 14SEP95:07:01:19 TO 14SEP95:14:54:40
------------------------------------------------------ CICS*Region=PROD ---------------------------------------------------------
TaskTran Start Task Tran Term Response CPU File Control Suspend Redispatch OriginalID Timestamp Number Type ID Time Time Requests Wait Time Wait Time Abend Code
VBR1 14SEP1995:08:18:47.052 77 ATI W/DATA 0.467 0.0469 0 0.089 0.012 AEILVAD1 14SEP1995:08:18:56.279 81 ATI W/DATA 0.412 0.2404 0 0.041 0.013 AEILSTR1 14SEP1995:08:19:04.872 85 ATI NODATA 0.102 0.0114 0 0.081 0.013 AEILSTR1 14SEP1995:08:19:04.872 86 ATI NODATA 0.114 0.0064 0 0.105 0.000 AEILSTR1 14SEP1995:08:19:04.899 87 ATI NODATA 0.089 0.0069 0 0.082 0.009 AEILOEN2 14SEP1995:08:19:30.936 100 ATI NODATA 63.709 0.0099 0 63.687 3.597 AEXYOEN2 14SEP1995:08:19:30.937 101 ATI NODATA 56.792 0.0100 0 56.672 56.588 AKC3WD80 14SEP1995:08:25:51.037 116 TERM ATCH M452 0.207 0.1146 0 0.034 0.001 DHTJINIT 14SEP1995:08:25:53.341 117 TERM ATCH M452 0.310 0.1243 0 0.023 0.001 DHTJLSR1 14SEP1995:09:05:38.781 353 ATI NODATA 42.726 0.1243 2 42.570 42.476 AEXYLSR1 14SEP1995:09:05:38.781 354 ATI NODATA 27.614 0.1190 2 27.475 27.364 AEXYLSR1 14SEP1995:09:05:38.782 355 ATI NODATA 32.377 0.1395 2 32.129 32.022 AEXYLSR1 14SEP1995:09:05:38.783 356 ATI NODATA 51.159 0.1146 2 51.022 50.909 AEXYMANT 14SEP1995:09:54:24.191 237 TERM ATCH M447 27.828 0.9692 0 0.220 0.011 ASRAQTDG 14SEP1995:11:10:19.144 604 TERM ATCH M439 34.182 1.6065 0 0.205 0.092 ASRAQTDG 14SEP1995:11:15:08.192 615 TERM ATCH M439 25.030 1.2745 0 0.084 0.050 ASRAMANT 14SEP1995:11:22:57.554 675 TERM ATCH M448 22.250 1.3091 0 0.062 0.016 ASRAMISC 14SEP1995:11:49:13.888 724 ATI W/DATA 975.106 31.3336 0 940.073 21.317 AEIAMISC 14SEP1995:11:49:24.623 726 TD TRIGGER 942.786 25.6809 0 914.642 15.202 AJCGMISC 14SEP1995:12:05:07.411 1032 TD TRIGGER 28.012 0.9147 0 27.083 1.394 AJCGQTDG 14SEP1995:12:07:53.310 1062 TERM ATCH M428 24.234 1.3268 0 0.143 0.021 ASRAIDMS 14SEP1995:12:13:22.940 1074 TERM ATCH M428 0.106 0.0194 0 0.054 0.002 AEY9MANT 14SEP1995:14:32:43.877 1153 TERM ATCH M428 32.231 1.2912 0 0.130 0.001 ASRAVBR1 14SEP1995:14:35:19.480 1243 ATI W/DATA 0.155 0.0128 0 0.026 0.001 AEILQTS2 14SEP1995:14:36:04.925 1256 ATI W/DATA 144.138 8.4060 0 54.988 2.185 ASRAQTDI 14SEP1995:14:36:07.758 1257 TERM ATCH M428 178.351 0.0149 0 178.306 177.503 ATSCWD80 14SEP1995:14:39:48.473 1261 TERM ATCH M427 0.241 0.1382 0 0.021 0.002 DHTJWD80 14SEP1995:14:39:50.915 1262 TERM ATCH M427 0.138 0.1159 0 0.016 0.000 DHTJINIT 14SEP1995:14:39:52.745 1263 TERM ATCH M427 0.685 0.1479 0 0.012 0.001 DHTJINIT 14SEP1995:14:39:54.611 1264 TERM ATCH M427 0.325 0.1262 0 0.040 0.000 DHTJ
OPTIONS: GROUP=WORKLOAD EXIT=MYEXIT

Building Response Time Transaction Groups
184 OMEGAMON II for CICS Historical Reporting Guide, Version 520
Building Response Time Transaction GroupsKC2TRXG, located in the KC2SPROG dataset, is the Response Time Transaction Group Build program. It analyzes the SAS DETAIL dataset and produces GROUP_DEFINITIONS and ID parameter for each CICS system for which transaction data is found. See OMEGAMON II for CICS Configuration and Customization Guide for more information on these parameters.
Group threshold valuesKC2TRXG can produce 15 groups (GROUP_DEFINITIONS parameters) with default thresholds of 1-10, 15, 20, 30, 45, and 60 seconds, respectively. Ascending threshold values are assigned to the groups. “Using the KC2TRXG program” on page 184 for more information on these groups.
You may override the default group thresholds, but ensure that you assign thresholds an ascending value for each group. If you have no requirement to use all 15 groups, assign the unused groups a value of zero.
Each analyzed transaction ID is assigned to one of the 15 groups. If a transaction cannot be assigned to a specific group, a warning message is provided. For example, a message may occur because the calculated response time threshold for a transaction exceeds the highest group threshold.
Using the KC2TRXG programKC2TRXG is the SAS program that performs the response time transaction group build function. To run the build function, customize and run the supplied job KC2TRXJ, located in the KC2SJCL dataset, to produce ID and GROUP_DEFINITIONS parameters. You can then insert these parameters into the global data area module (GLOBAL_OPTIONS).
This program has the following parameters. Defaults are underlined:
CICS=ALL,xxxxxxxx
Determines whether SMF records relating to all or a specific or generic CICS applid are processed. For example, CICS=PROD restricts processing to all CICS applids beginning with PROD. Alternatively, you may specify CICS=ALL and use the EXIT= option to accommodate more specific processing.
LUNAME=ALL,xxxxxxxx
Processes all VTAM LUs and allows you to restrict processing to a specific or generic LUNAME.
GROUP=ALL,WORKLOAD,nn
Processes transactions that belong to all GROUPS defined in KC2GRP. Allows you to restrict processing to a specific group of transactions. If you specify GROUP=WORKLOAD, then all transactions belonging to GROUP 0 are ignored from all processing.
SHIFT=ALL,nn
Restricts the selection criteria to a specific shift as defined in KC2SHFT.
TERM=ALL,xxxx
Restricts the selection criteria to specific or generic terminal IDs.

SAS Historical Reporting 185
Building Response Time Transaction Groups
TRAN=ALL,xxxx
Restricts the selection criteria to a specific or generic transaction ID.
USERID=ALL,xxxxxxxx
Restricts the selection criteria to a specific or generic userid.
LODATE=NO,mm/dd/yy
Restricts the selection criteria to a specific start date.
LOTIME=NO,hh:mm:ss
Restricts the selection criteria to a specific start time.
HIDATE=NO,mm/dd/yy
Restricts the selection criteria to a specific end date.
HITIME=NO,hh:mm:ss
Restricts the selection criteria to a specific end time.
EXIT=NO,xxxxxxxx
Specifies the name of the exit program you write to allow greater selection criteria. For more information, see “Fields Contained in CICSTRAN” on page 205.
STOP=NO,nnn
When set to a numeric value, restricts processing to a specified number of input records for debugging purposes.
GROUP1=10,nn
Determines the threshold (in 10ths of a second) to be applied to this group. This value is equivalent to the ELOG= parameter in the GROUP_DEFINITIONS parameter, as defined in the OMEGAMON II for CICS Configuration and Customization Guide.
GROUP2=20,nn
Determines the threshold (in 10ths of a second) to be applied to group 2.
GROUP3=30,nn
Determines the threshold (in 10ths of a second) to be applied to group 3.
GROUP4=40,nn
Determines the threshold (in 10ths of a second) to be applied to group 4.
GROUP5=50,nn
Determines the threshold (in 10ths of a second) to be applied to group 5.
GROUP6=60,nn
Determines the threshold (in 10ths of a second) to be applied to group 6.
GROUP7=70,nn
Determines the threshold (in 10ths of a second) to be applied to group 7.
GROUP8=80,nn
Determines the threshold (in 10ths of a second) to be applied to group 8.

Building Response Time Transaction Groups
186 OMEGAMON II for CICS Historical Reporting Guide, Version 520
Determining relevant thresholds for the local environmentKC2TRXG produces a report that shows the group and calculated threshold for each transaction found (see Figure 75 on page 190). You should review the report and determine whether the thresholds are relevant to the local environment. You may decide that the calculation method used is inappropriate and that a more realistic threshold may have to be applied manually. By default, the threshold used to determine the group into which a transaction is assigned is based on 3*Standard Deviation plus the Mean; that is, Sigma3. For further information on standard deviation and Sigma3, see an appropriate statistical analysis reference manual.
As an alternative to the default calculation, you may want to apply the 90th, 95th, or 99th percentile threshold. You can rerun the report as often as required using the alternative algorithms, until a more relevant result is achieved. You may find, however, that due to fluctuations in the analyzed data, discrepancies may occur that can only be addressed by local knowledge and manual adjustment. Therefore, you may want to run KC2TRXG against data for different days and compare the results before applying them.
For each transaction ID, KC2TRXG produces a corresponding ID parameter and rounds up the specific transaction threshold to the next tenth of a second. For example, a calculated response threshold of 0.461 is defined as THRESH=50 in the ID parameter.
GROUP9=90,nn
Determines the threshold (in 10ths of a second) to be applied to group 9
GROUP10=100,nn
Determines the threshold (in 10ths of a second) to be applied to group 10.
GROUP11=150,nn
Determines the threshold (in 10ths of a second) to be applied to group 11.
GROUP12=200,nn
Determines the threshold (in 10ths of a second) to be applied to group 12.
GROUP13=300,nn
Determines the threshold (in 10ths of a second) to be applied to group 13.
GROUP14=450,nn
Determines the threshold (in 10ths of a second) to be applied to group 14.
GROUP15=600,nn
Determines the threshold (in 10ths of a second) to be applied to group 15.
Note: Values must be assigned to groups using increasingly higher values. If you do not require a specific group, then set its value to zero.
CHKVALU=SIGMA3,PCT90,PCT95,PCT99
Determines the threshold to use when deciding to which response time group to allocate the transaction. (Sigma3 is equivalent to 3 * Standard Deviation + the Mean.

SAS Historical Reporting 187
Building Response Time Transaction Groups
Running the response time transaction group builderTo run the Response Time Transaction Group Builder, customize and run the supplied SAS macro KC2TRXJ, located in the KC2SJCL dataset, to produce the ID and GROUP_DEFINITIONS parameters. You can later insert these parameters into the global data area module (GLOBAL_OPTIONS).
Report example
An example of the report that is produced from KC2TRXG follows.
FIGURE 74. Response Time Profile for Transactions by CICS Region
1 !CANDLE CORPORATION 09:48 Wednesday, September 20, 1995 1RESPONSE TIME PROFILE FOR TRANSACTIONS BY CICS REGIONVALUE USED TO DETERMINE THRESHOLD CRITERIA IS SIGMA3
DATA FROM 14SEP95:07:01:19 TO 14SEP95:14:54:40
-------------------------------------------------- CICS*Region=PROD GROUP=. ------------------------------------------------------
Average MaximumResponse Response 90th Percentile 95th Percentile 99th Percentile Transactions
Tran DB Transaction Time Time Standard Response Time Response Time Response Time ExceedingID Type Count (Secs) (Secs) Deviation (Secs) (Secs) (Secs) Sigma3 SIGMA3
LSR1 4 38.469 51.159 10.553 51.159 51.159 51.159 70.128 0MIKE 2 180.487 180.780 0.414 180.780 180.780 180.780 181.730 0MISC 6 335.232 975.106 483.339 975.106 975.106 975.106 1785.249 0OEN2 3 60.192 63.709 3.460 63.709 63.709 63.709 70.572 0QTDI 8 23.211 178.351 62.702 178.351 178.351 178.351 211.316 0QTI1 2 3183.266 3297.134 161.033 3297.134 3297.134 3297.134 3666.365 0QTS2 5 52.492 144.138 71.081 144.138 144.138 144.138 265.735 0
-------------------------------------------------- CICS*Region=PROD GROUP=1 -------------------------------------------------------
Average MaximumResponse Response 90th Percentile 95th Percentile 99th Percentile Transactions
Tran DB Transaction Time Time Standard Response Time Response Time Response Time ExceedingID Type Count (Secs) (Secs) Deviation (Secs) (Secs) (Secs) Sigma3 SIGMA3
AADD 9 0.007 0.016 0.00348 0.016 0.016 0.016 0.018 0AC2A 1 0.386 0.386 0.00000 0.386 0.386 0.386 0.386 0AC20 1 0.182 0.182 0.00000 0.182 0.182 0.182 0.182 0AC22 1 0.271 0.271 0.00000 0.271 0.271 0.271 0.271 0AC28 2 0.224 0.321 0.13654 0.321 0.321 0.321 0.634 0AMNU 5 0.023 0.048 0.01957 0.048 0.048 0.048 0.081 0AUPD 14 0.227 0.570 0.18289 0.528 0.570 0.570 0.776 0DEGE 1 0.210 0.210 0.00000 0.210 0.210 0.210 0.210 0IDMS 1 0.106 0.106 0.00000 0.106 0.106 0.106 0.106 0LSRW 1 0.091 0.091 0.00000 0.091 0.091 0.091 0.091 0OAD1 3 0.022 0.029 0.01047 0.029 0.029 0.029 0.053 0OAID 3 0.045 0.072 0.03068 0.072 0.072 0.072 0.137 0OENQ 1 0.061 0.061 0.00000 0.061 0.061 0.061 0.061 0OICE 1 0.045 0.045 0.00000 0.045 0.045 0.045 0.045 0OIC1 1 0.357 0.357 0.00000 0.357 0.357 0.357 0.357 0OMEG 1 0.189 0.189 0.00000 0.189 0.189 0.189 0.189 0PAIN 3 0.304 0.392 0.07888 0.392 0.392 0.392 0.541 0RAID 1 0.013 0.013 0.00000 0.013 0.013 0.013 0.013 0STAT 1 0.327 0.327 0.00000 0.327 0.327 0.327 0.327 0STR1 3 0.102 0.114 0.01260 0.114 0.114 0.114 0.139 0VADD 1 0.027 0.027 0.00000 0.027 0.027 0.027 0.027 0VAD1 1 0.412 0.412 0.00000 0.412 0.412 0.412 0.412 0VBR1 2 0.311 0.467 0.22096 0.467 0.467 0.467 0.974 0VSTR 1 0.078 0.078 0.00000 0.078 0.078 0.078 0.078 0WD80 DLI 3 0.195 0.241 0.05257 0.241 0.241 0.241 0.353 0
OPTIONS: CICS=PROD GROUP=WORKLOAD

Building Response Time Transaction Groups
188 OMEGAMON II for CICS Historical Reporting Guide, Version 520
FIGURE 74. Response Time Profile for Transactions by CICS Region (continued)
1 !CANDLE CORPORATION 09:48 Wednesday, September 20, 1995 2RESPONSE TIME PROFILE FOR TRANSACTIONS BY CICS REGIONVALUE USED TO DETERMINE THRESHOLD CRITERIA IS SIGMA3
DATA FROM 14SEP95:07:01:19 TO 14SEP95:14:54:40
--------------------------------------------------- CICS*Region=PROD GROUP=2 ------------------------------------------------------
Average MaximumResponse Response 90th Percentile 95th Percentile 99th Percentile Transactions
Tran DB Transaction Time Time Standard Response Time Response Time Response Time ExceedingID Type Count (Secs) (Secs) Deviation (Secs) (Secs) (Secs) Sigma3 SIGMA3
ABRW 364 0.301 5.795 0.46534 0.579 0.946 2.546 1.697 6AINQ 4 0.419 0.823 0.28237 0.823 0.823 0.823 1.266 0DEGS 8 0.265 0.801 0.31743 0.801 0.801 0.801 1.217 0INIT DLI 3 0.440 0.685 0.21265 0.685 0.685 0.685 1.078 0
--------------------------------------------------- CICS*Region=PROD GROUP=3 ------------------------------------------------------
Average MaximumResponse Response 90th Percentile 95th Percentile 99th Percentile Transactions
Tran DB Transaction Time Time Standard Response Time Response Time Response Time ExceedingID Type Count (Secs) (Secs) Deviation (Secs) (Secs) (Secs) Sigma3 SIGMA3
QMNU 43 0.109 4.158 0.63253 0.016 0.046 4.158 2.007 1QTS1 7 0.538 2.228 0.81394 2.228 2.228 2.228 2.980 0
--------------------------------------------------- CICS*Region=PROD GROUP=4 ------------------------------------------------------
Average MaximumResponse Response 90th Percentile 95th Percentile 99th Percentile Transactions
Tran DB Transaction Time Time Standard Response Time Response Time Response Time ExceedingID Type Count (Secs) (Secs) Deviation (Secs) (Secs) (Secs) Sigma3 SIGMA3
DEGG 4 0.527 1.784 0.84537 1.784 1.784 1.784 3.063 0QTSA 10 0.916 2.218 0.98868 2.199 2.218 2.218 3.882 0
--------------------------------------------------- CICS*Region=PROD GROUP=5 ------------------------------------------------------
Average MaximumResponse Response 90th Percentile 95th Percentile 99th Percentile Transactions
Tran DB Transaction Time Time Standard Response Time Response Time Response Time ExceedingID Type Count (Secs) (Secs) Deviation (Secs) (Secs) (Secs) Sigma3 SIGMA3
DEGC 45 0.986 4.639 1.05991 2.304 2.895 4.639 4.166 1
--------------------------------------------------- CICS*Region=PROD GROUP=6 ------------------------------------------------------
Average MaximumResponse Response 90th Percentile 95th Percentile 99th Percentile Transactions
Tran DB Transaction Time Time Standard Response Time Response Time Response Time ExceedingID Type Count (Secs) (Secs) Deviation (Secs) (Secs) (Secs) Sigma3 SIGMA3
QTSM 15 1.304 3.808 1.40543 2.907 3.808 3.808 5.520 0
OPTIONS: CICS=PROD GROUP=WORKLOAD

SAS Historical Reporting 189
Building Response Time Transaction Groups
FIGURE 74. Response Time Profile for Transactions by CICS Region (continued)
1 !CANDLE CORPORATION 09:48 Wednesday, September 20, 1995 3RESPONSE TIME PROFILE FOR TRANSACTIONS BY CICS REGIONVALUE USED TO DETERMINE THRESHOLD CRITERIA IS SIGMA3
DATA FROM 14SEP95:07:01:19 TO 14SEP95:14:54:40
--------------------------------------------------- CICS*Region=PROD GROUP=7 ------------------------------------------------------
Average MaximumResponse Response 90th Percentile 95th Percentile 99th Percentile Transactions
Tran DB Transaction Time Time Standard Response Time Response Time Response Time ExceedingID Type Count (Secs) (Secs) Deviation (Secs) (Secs) (Secs) Sigma3 SIGMA3
VBRW 3 1.092 3.052 1.69814 3.052 3.052 3.052 6.186 0
--------------------------------------------------- CICS*Region=PROD GROUP=9 ------------------------------------------------------
Average MaximumResponse Response 90th Percentile 95th Percentile 99th Percentile Transactions
Tran DB Transaction Time Time Standard Response Time Response Time Response Time ExceedingID Type Count (Secs) (Secs) Deviation (Secs) (Secs) (Secs) Sigma3 SIGMA3
DEGT 18 2.124 7.056 2.24643 5.004 7.056 7.056 8.863 0QTDG 332 0.260 34.182 2.67009 0.015 0.021 0.211 8.270 3
--------------------------------------------------- CICS*Region=PROD GROUP=10 -----------------------------------------------------
Average MaximumResponse Response 90th Percentile 95th Percentile 99th Percentile Transactions
Tran DB Transaction Time Time Standard Response Time Response Time Response Time ExceedingID Type Count (Secs) (Secs) Deviation (Secs) (Secs) (Secs) Sigma3 SIGMA3
DEGV 62 2.280 11.694 2.53476 5.379 7.112 11.694 9.884 1
--------------------------------------------------- CICS*Region=PROD GROUP=14 -----------------------------------------------------
Average MaximumResponse Response 90th Percentile 95th Percentile 99th Percentile Transactions
Tran DB Transaction Time Time Standard Response Time Response Time Response Time ExceedingID Type Count (Secs) (Secs) Deviation (Secs) (Secs) (Secs) Sigma3 SIGMA3
DEGA 22 4.038 54.939 11.9333 9.397 15.008 54.939 39.838 1MANT 3 27.436 32.231 5.0019 32.231 32.231 32.231 42.442 0VSEX 32 7.870 24.343 8.3150 22.303 24.294 24.343 32.816 0
OPTIONS: CICS=PROD GROUP=WORKLOAD

Building Response Time Transaction Groups
190 OMEGAMON II for CICS Historical Reporting Guide, Version 520
A list of parameter definitions appears below:
FIGURE 75. Parameter Definitions List
*** DEFINITIONS FOR CICS REGION PROD*
GROUP_DEFINITIONS INITIALGROUP_DEFINITIONS ID,GRP=1,GTYP=TRAN, X
NAME='PROD GROUP1',ELOG=10GROUP_DEFINITIONS ID,GRP=2,GTYP=TRAN, X
NAME='PROD GROUP2',ELOG=20GROUP_DEFINITIONS ID,GRP=3,GTYP=TRAN, X
NAME='PROD GROUP3',ELOG=30GROUP_DEFINITIONS ID,GRP=4,GTYP=TRAN, X
NAME='PROD GROUP4',ELOG=40GROUP_DEFINITIONS ID,GRP=5,GTYP=TRAN, X
NAME='PROD GROUP5',ELOG=50GROUP_DEFINITIONS ID,GRP=6,GTYP=TRAN, X
NAME='PROD GROUP6',ELOG=60GROUP_DEFINITIONS ID,GRP=7,GTYP=TRAN, X
NAME='PROD GROUP7',ELOG=70GROUP_DEFINITIONS ID,GRP=8,GTYP=TRAN, X
NAME='PROD GROUP8',ELOG=80GROUP_DEFINITIONS ID,GRP=9,GTYP=TRAN, X
NAME='PROD GROUP9',ELOG=90GROUP_DEFINITIONS ID,GRP=10,GTYP=TRAN, X
NAME='PROD GROUP10',ELOG=100GROUP_DEFINITIONS ID,GRP=11,GTYP=TRAN, X
NAME='PROD GROUP11',ELOG=150GROUP_DEFINITIONS ID,GRP=12,GTYP=TRAN, X
NAME='PROD GROUP12',ELOG=200GROUP_DEFINITIONS ID,GRP=13,GTYP=TRAN, X
NAME='PROD GROUP13',ELOG=300GROUP_DEFINITIONS ID,GRP=14,GTYP=TRAN, X
NAME='PROD GROUP14',ELOG=450GROUP_DEFINITIONS ID,GRP=15,GTYP=TRAN, X
NAME='PROD GROUP15',ELOG=600GROUP_DEFINITIONS FINAL
*ID INITIAL,SCALE=2,WINDOW=10
*WARNING** TRANSACTION LSR1 COULD NOT BE PUT IN ANY GROUP*WARNING**WARNING** TRANSACTION MIKE COULD NOT BE PUT IN ANY GROUP*WARNING**WARNING** TRANSACTION MISC COULD NOT BE PUT IN ANY GROUP*WARNING**WARNING** TRANSACTION OEN2 COULD NOT BE PUT IN ANY GROUP*WARNING**WARNING** TRANSACTION QTDI COULD NOT BE PUT IN ANY GROUP*WARNING**WARNING** TRANSACTION QTI1 COULD NOT BE PUT IN ANY GROUP*WARNING**WARNING** TRANSACTION QTS2 COULD NOT BE PUT IN ANY GROUP*WARNING*

SAS Historical Reporting 191
Building Response Time Transaction Groups
FIGURE 75. Parameter Definitions List (continued)
ID ID,TRAN=AADD,GROUPS=(1),THRESH=1IDID ID,TRAN=AC2A,GROUPS=(1),THRESH=4ID ID,TRAN=AC20,GROUPS=(1),THRESH=2ID ID,TRAN=AC22,GROUPS=(1),THRESH=3ID ID,TRAN=AC28,GROUPS=(1),THRESH=7ID ID,TRAN=AMNU,GROUPS=(1),THRESH=1ID ID,TRAN=AUPD,GROUPS=(1),THRESH=8ID ID,TRAN=DEGE,GROUPS=(1),THRESH=3ID ID,TRAN=IDMS,GROUPS=(1),THRESH=2ID ID,TRAN=LSRW,GROUPS=(1),THRESH=1ID ID,TRAN=OAD1,GROUPS=(1),THRESH=1ID ID,TRAN=OAID,GROUPS=(1),THRESH=2ID ID,TRAN=OENQ,GROUPS=(1),THRESH=1ID ID,TRAN=OICE,GROUPS=(1),THRESH=1ID ID,TRAN=OIC1,GROUPS=(1),THRESH=4ID ID,TRAN=OMEG,GROUPS=(1),THRESH=2ID ID,TRAN=PAIN,GROUPS=(1),THRESH=6ID ID,TRAN=RAID,GROUPS=(1),THRESH=1ID ID,TRAN=STAT,GROUPS=(1),THRESH=4ID ID,TRAN=STR1,GROUPS=(1),THRESH=2ID ID,TRAN=VADD,GROUPS=(1),THRESH=1ID ID,TRAN=VAD1,GROUPS=(1),THRESH=5ID ID,TRAN=VBR1,GROUPS=(1),THRESH=10ID ID,TRAN=VSTR,GROUPS=(1),THRESH=1ID ID,TRAN=WD80,GROUPS=(1),THRESH=4ID ID,TRAN=ABRW,GROUPS=(2),THRESH=17ID ID,TRAN=AINQ,GROUPS=(2),THRESH=13ID ID,TRAN=DEGS,GROUPS=(2),THRESH=13ID ID,TRAN=INIT,GROUPS=(2),THRESH=11ID ID,TRAN=QMNU,GROUPS=(3),THRESH=21ID ID,TRAN=QTS1,GROUPS=(3),THRESH=30ID ID,TRAN=DEGG,GROUPS=(4),THRESH=31ID ID,TRAN=QTSA,GROUPS=(4),THRESH=39ID ID,TRAN=DEGC,GROUPS=(5),THRESH=42ID ID,TRAN=QTSM,GROUPS=(6),THRESH=56ID ID,TRAN=VBRW,GROUPS=(7),THRESH=62ID ID,TRAN=DEGT,GROUPS=(9),THRESH=89ID ID,TRAN=QTDG,GROUPS=(9),THRESH=83ID ID,TRAN=DEGV,GROUPS=(10),THRESH=99ID ID,TRAN=DEGA,GROUPS=(14),THRESH=399ID ID,TRAN=MANT,GROUPS=(14),THRESH=425ID ID,TRAN=VSEX,GROUPS=(14),THRESH=329ID FINAL
**END OF DEFINITIONS FOR PROD

Building Response Time Transaction Groups
192 OMEGAMON II for CICS Historical Reporting Guide, Version 520

Reporter Commands 193
Reporter Commands
This chapter provides a summary of the commands and options used to request batch reports. After you are fairly familiar with these commands, you may use this chapter as a quick reference. For more information about these commands and options, see “Requesting Reports” on page 45.
The following table summarizes the report request commands:
The historical reporting feature of OMEGAMON II provides nine batch reports. Each report can be selected by entering the appropriate report type with the REPORT command. The following table summarizes the report type options that you can select:
Table 9. Report Request Commands
Command Short Form Description
CONTROL CNTL Controls printer functions.
PAGESEP PAGE Produces separator pages between reports
PRODUCTS none Provides product information.
REPORT REP Produces a report.
SET none Establishes default option values for use in report requests.
Table 10. Report Type Options
Option Short Form Produces a . . .
DBASE none Database report
FILE none File request report
LIST none Detail list report
PROGRAM PROG
PGM
Program usage report
RESPONSE RESP Transaction response report
SYSTEM SYS CICS system report
TERMINAL TERM Terminal usage report
TRANSACTION TRAN Transaction ID report
A

194 OMEGAMON II for CICS Historical Reporting Guide, Version 520
For further information concerning the reports and the report term definitions, see “Sample Reports” on page 69 and “Report fields” on page 95.
The following table summarizes the date options available with the REPORT command.
USERID UID User ID usage report
Table 11. Report Date Options
Option Short Form Description
BAND none Selects data from the start time to the end time, separately for each specified day. BAND and RANGE are mutually exclusive.
DATEFORM DATE Controls the format in which dates are entered and displayed. The default format is MMDDYY.
DAYOFWK DAY Selects data only for the specified days. Keywords are: ALL, WEEKDAY or WKDAY, WEEKEND or WKEND, MONDAY, TUESDAY, WEDNESDAY, THURSDAY, FRIDAY, SATURDAY, or SUNDAY.
ENDDATE EDATE Specifies the end date of the report.
ENDTIME ETIME Specifies the end time of the report. Defaults to 23:59 on the specified ENDDATE.
LASTMONTH LMN Selects data from the first day to the last day of the previous month.
LASTWEEK LWK Selects data from Monday to Sunday of the previous week.
LASTYEAR LYR Selects data from the first day to the last day of the previous year.
RANGE none (Default) Selects data from the start time and date straight through to the end time and date. BAND and RANGE are mutually exclusive.
STARTDATE SDATE Specifies the start date of the report.
STARTTIME STIME Specifies the start time of the report.
THISMONTH TMN Selects data from the first day of the current month to the most recent record in the database.
THISWEEK TWK Selects data from the first day of the current week to the most recent record in the database.
THISYEAR TYR Selects data from the first day of the current year to the most recent record in the database.
TIMEZONE none Displays report time in LOCAL or GMT (Greenwich Mean Time). LOCAL is the default.
TODAY TDAY Selects data from the beginning of the current day to the most recent record in the database.
Table 10. Report Type Options (continued)
Option Short Form Produces a . . .
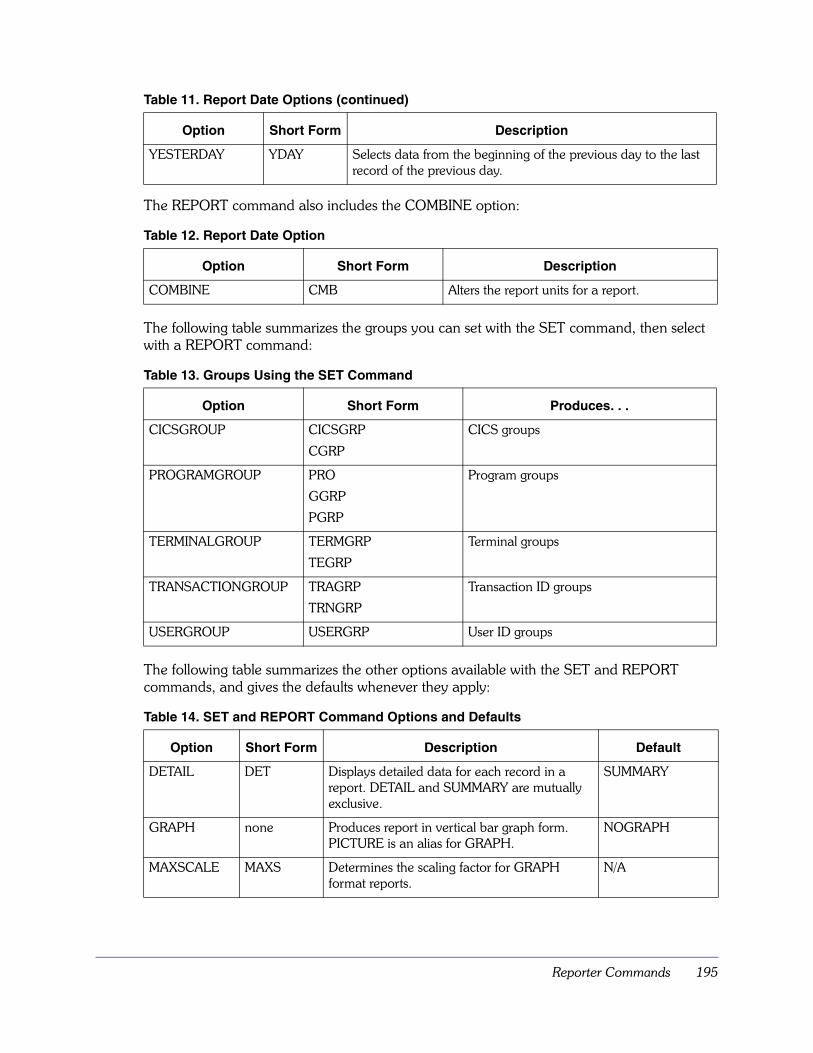
Reporter Commands 195
The REPORT command also includes the COMBINE option:
The following table summarizes the groups you can set with the SET command, then select with a REPORT command:
The following table summarizes the other options available with the SET and REPORT commands, and gives the defaults whenever they apply:
YESTERDAY YDAY Selects data from the beginning of the previous day to the last record of the previous day.
Table 12. Report Date Option
Option Short Form Description
COMBINE CMB Alters the report units for a report.
Table 13. Groups Using the SET Command
Option Short Form Produces. . .
CICSGROUP CICSGRP
CGRP
CICS groups
PROGRAMGROUP PRO
GGRP
PGRP
Program groups
TERMINALGROUP TERMGRP
TEGRP
Terminal groups
TRANSACTIONGROUP TRAGRP
TRNGRP
Transaction ID groups
USERGROUP USERGRP User ID groups
Table 14. SET and REPORT Command Options and Defaults
Option Short Form Description Default
DETAIL DET Displays detailed data for each record in a report. DETAIL and SUMMARY are mutually exclusive.
SUMMARY
GRAPH none Produces report in vertical bar graph form. PICTURE is an alias for GRAPH.
NOGRAPH
MAXSCALE MAXS Determines the scaling factor for GRAPH format reports.
N/A
Table 11. Report Date Options (continued)
Option Short Form Description

196 OMEGAMON II for CICS Historical Reporting Guide, Version 520
The following matrix table shows the options available with each report type. An X indicates that the report-type/command-option combination is valid:
MERGE MRO Controls merging of all transactions with the same UOWID, including CSMc transactions.
NOMERGE
SCAN none Checks job syntax. N/A
SELECTIF SIF Selects records based on threshold conditions. N/A
SORT none Controls sorting of historical data. IBM SORT NAME
SORTSIZE SORTS Controls the amount of memory used by the sort program.
MAX
SUMMARY SUM Displays summary data for each record in a report. DETAIL and SUMMARY are mutually exclusive.
SUMMARY
TITLEn none Produces a title line. N/A
UMBRELLA UMB Controls the use of umbrella transaction IDs as report breaks. NOUMBRELLA prevents umbrella-transaction-ID report breaks.
NOUMBRELLA
USERREC UREC Controls the presence of user records only if a report is run against data created by previous releases of OMEGAMON II’s historical reporter.
IGNORE
WORSTCASE WORST Controls inclusion of worst case information at report breaks. NOWORSTCASE prevents worst case analysis at report
NOWORSTCASE
Table 15. Options Available for each Report Type
Datab
ase
File
List
Pro
gram
Resp
on
se
System
Termin
al
Transactio
n
User ID
CICSGROUP X X X X X X X X X
COMBINE X
CONTROL X X X X X X X X X
DETAIL X X X X X X X X
GRAPH X X
MAXSCALE X X
MERGE X X X X X X X
SELECTIF X X X X X X X X
SORT X X X X X X X X X
SORTSIZE X X X X X X X X X
Table 14. SET and REPORT Command Options and Defaults (continued)
Option Short Form Description Default

Reporter Commands 197
SUMMARY X X X X X X X X
TERMINALGROUP
X X X X X X X X
Time/date options
X X X X X X X X X
TITLEn options X X X X X X X X X
TRANSACTIONGROUP
X X X X X X X X
UMBRELLA X X X X X X
USERGROUP X X X X X X X X
USERREC X X X X X
WORSTCASE X X X X X X X X X
Table 15. Options Available for each Report Type (continued)
Datab
ase
File
List
Pro
gram
Resp
on
se
System
Termin
al
Transactio
n
User ID

198 OMEGAMON II for CICS Historical Reporting Guide, Version 520

Internal Macros and Programs 199
Internal Macros and Programs
In addition to the SAS code that you can customize (see “Customize SAS macros and programs” on page 128), Candle supplies macros and programs that are used internally. Candle does not recommend that you customize the routines described below. This information is provided for your reference.
KC2DB2 This SAS macro is used within KC2SMFR to provide a mapping of the 100-byte OMEGDB2 event monitoring point.
KC2DLI This SAS macro is used within KC2SMFR to provide a mapping of the 92-byte OMEGDLI event monitoring point.
KC2FNT This SAS macro is used by the reports to provide a footnote line for each report. Any optional parameters defined to the report programs are printed in the footnote.
KC2INIT SAS code used within KC2SMFR to initialize each variable according to its format.
KC2KEEP SAS macro used within KC2SMFR that defines each variable to be retained in the SAS data files.
KC2LABL SAS macro used within KC2SMFR that defines a heading for each available variable as defined in KC2KEEP.
KC2PCT SAS code used within KC2SUMD and some of the report programs to determine percentage response time.
KC2TTYP SAS code used by some of the report programs to convert the internal CICS transaction type indicator to a text description.
B

200 OMEGAMON II for CICS Historical Reporting Guide, Version 520

Coding User-Defined Exits 201
Coding User-Defined Exits
The sample SAS reports allow you to refine the filtering criteria by writing SAS exit code. You can use exits when you
� populate the DETAIL dataset from KC2SMFR.
� populate the DAILY dataset from KC2SUMD.
� run sample reports from KC2REPTJ.
� run user-defined reports from KC2TGRW.
� run the response time transaction group build function from KC2TRXG.
C

Exit Code Examples
202 OMEGAMON II for CICS Historical Reporting Guide, Version 520
Exit Code ExamplesThe following sections contain examples of exit code you can write to:
� Limit the size of the SAS dataset DETAIL.CICSTRAN.
� Omit unwanted transaction data during SAS historical reporting.
The normal processing of SMF 110 records (the CICS performance data) is done in two steps:
1. First, macro KC2SMFR reads the input SMF records and writes the captured data to either a temporary or a permanent dataset(hilev.DETAIL).
2. This dataset (hilev.DETAIL) is then used as an input to report-producing macros such as KC2TRxx.
Limiting the size of DETAIL.CICSTRANMacro KC2SMFR populates the SAS dataset DETAIL.CICSTRAN. This is the best place to omit transaction data specific to one or more CICS applid(s). This method keeps the size of the SAS dataset to its minimum and reduces the time required to process transaction detail data for future reports.
If you are interested in keeping the transaction data for a specific CICS applid only, we recommend that you use the CICS= keyword of the KC2SMFR macro. For example:
//SYSIN DD *
%KC2SMFR (CICS=CICSPRD2,...);
If you are interested in keeping the transaction data for more than one CICS applid, we recommend that you code CICS=ALL and use the EXIT= keyword of KC2SMFR macro, if desired, to omit the unwanted transaction data specific to one or more CICS applid(s). For example:
//SYSIN DD *
%KC2SMFR (CICS=ALL,EXIT=SMFREXIT,...);
//SMFREXIT DD *
...
...
IF SMFMNPRN =: “CICST” THE DELETE;
IF SMFMNPRN = ‘CICSPRD1’ THEN DELETE;
/*

Coding User-Defined Exits 203
Exit Code Examples
Omitting unwanted transaction dataThe SAS macros provided for historical reporting read the input SAS dataset and parse the performance data section of each captured SMF 110 record. See “Fields Contained in DBD” on page 215 for a complete list of all CICSTRAN fields and their corresponding SAS variables.
An example of omitting transactions with specific transaction IDs follows:
//SYSIN DD *
...
%KC2TRP3 (EXIT=TRP3EXIT,...);
...
//TRP3EXIT DD *
IF TRAN = ‘PRNT’ THEN DELETE;
IF TRAN =: “C” THEN DELETE;
/*
An example of omitting transactions with no VSAM I/O activity follows:
//SYSIN DD *
...
%KC2TRP8 (EXIT=TRP8EXIT,...);
...
//TRP8EXIT DD *
IF FCTOTCT > 0;
/*
For more information on Candle-provided SAS macros, see the relevant macro in hilev.KC2SPROG. For JCL statements, see dataset hilev.KC2SJCL.
For more information on SAS coding, see the relevant SAS publication.

Exit Code Examples
204 OMEGAMON II for CICS Historical Reporting Guide, Version 520

Fields Contained in CICSTRAN 205
Fields Contained in CICSTRAN
The CICSTRAN data file, in the DETAIL dataset, contains the fields that appear in the following table for all current releases of CICS. (Note, however, that not all the fields are relevant for all releases of CICS.) The table also contains the SAS variable names and the CICS 110 DFH connector fields.
You can use the SAS variable names for reports you write or to modify reports supplied by Candle.
For a full description of each field, see the IBM CICS manual that describes the DFH connector fields.
Table 16. Fields Available in CICSTRAN
CICSTRAN Field SAS Variable CICS 110 DFH Connector Field
Current Abend Code ABCODEC DFHPROG-114
Original Abend Code ABCODEOL DFHPROG-113
Abend Count ABNDCNT calculated
BMS In Requests BMSINCT DFHMAPP-051
BMS Map Requests BMSMAPCT DFHMAPP-050
BMS Out Requests BMSOUTCT DFHMAPP-052
Total BMS Requests BMSTOTCT DFHMAPP-090
Day DAY derived
Redispatch Wait Count DISPWTCN DFHTASK-102
Redispatch Wait Time DISPWTTM DFHTASK-102
First Dispatch Delay Count DSPDELCN DFHTASK-125
First Dispatch Delay Time DSPDELTM DFHTASK-125
Enqueue Wait Count ENQDELCN DFHTASK-129
Enqueue Wait Time ENQDELTM DFHTASK-129
Exception Wait Count EXWAITCN DFHTASK-103
Exception Wait Time EXWAITTM DFHTASK-103
File Add Requests FCADDCT DFHFILE-039
D

206 OMEGAMON II for CICS Historical Reporting Guide, Version 520
File Access Method Count FCAMCT DFHFILE-070
File Browse Requests FCBRWCT DFHFILE-038
File Delete Requests FCDELCT DFHFILE-040
File Get Requests FCGETCT DFHFILE-036
File Wait Count FCIOWTCN DFHFILE-063
File Wait Time FCIOWTTM DFHFILE-063
File Put Requests FCPUTCT DFHFILE-037
File Control Total Requests FCTOTCT DFHFILE-093
Transaction Facility Name FCTYNAME DFHFILE-163
Hour HOUR derived
Interval Control Requests ICPUINCT DFHTASK-059
MRO Wait Count IRIOWTCN DFHTERM-100
MRO Wait Time IRIOWTTM DFHTERM-100
Journal Wait Count JCIOWTCN DFHJOUR-010
Journal Wait Time JCIOWTTM DFHJOUR-010
Journal Output Requests JCPUWRCT DFHJOUR-058
Logger Write Requests LOGWRTCT DFHJOUR-172
VTAM Luname LUNAME DFHTERM-111
LU6.1 Wait Count LU61DLCN DFHTASK-133
LU6.1 Wait Time LU61DLTM DFHTASK-133
LU6.2 Wait Count LU62DLCN DFHTASK-134
LU6.2 Wait Time LU62DLTM DFHTASK-134
Month MONTH derived
MXT Delay Count MXTDELCN DFHTASK-127
MXT Delay Time MXTDELTM DFHTASK-127
Operator ID OPR DFHCICS-003
Program Link Count PCLINKCT DFHPROG-055
Program Load Count PCLOADCT DFHPROG-057
Program Fetch Count PCLOADCN DFHPROG-115
Program Fetch Time PCLOADTM DFHPROG-115
Table 16. Fields Available in CICSTRAN (continued)
CICSTRAN Field SAS Variable CICS 110 DFH Connector Field

Fields Contained in CICSTRAN 207
Program Operation Count PCOPSCT calculated—sum of Link, Load, and XCTL
HWM Total Program Storage PCSTGHWM DFHSTOR-087
Program XCTL Count PCXCTLCT DFHPROG-056
HWM Program Storage<16M
PC24BHWM DFHSTOR-108
HWM Program Storage<16M CDSA
PC24CHWM DFHSTOR-143
HWM Program Storage<16M RDSA
PC24RHWM DFHSTOR-162
HWM Program Storage<16M SDSA
PC24SHWM DFHSTOR-160
HWM Program Storage<16M UDSA
PC24UHWM DFHSTOR-141
HWM Program Storage>16M CDSA
PC31CHWM DFHSTOR-142
HWM Program Storage>16M RDSA
PC31RHWM DFHSTOR-122
HWM Program Storage>16M SDSA
PC31SHWM DFHSTOR-161
HWM Program Storage>16M UDSA
PC31UHWM DFHSTOR-140
Performance Class Write Count
PERRECNT DFHCICS-131
Program Name PGMNAME DFHPROG-071 or OMEGAMON II umbrella value from MUMBUSR
Recovery Token RCVRYTKN DFHTASK-132
Response Time RESPTIME calculated
RMI Count RMICN DFHTASK-170
RMI Suspend Count RMISUSCN DFHTASK-171
RMI Suspend Time RMISUSTM DFHTASK-171
RMI Elapsed Time RMITM DFHTASK-170
RLS Wait Time RLSWAITM DFHFILE-174
RLS Wait Count RLSWAICN DFHFILE-174
WLM Report Class RPTCLSNM DFHCICS-168
Table 16. Fields Available in CICSTRAN (continued)
CICSTRAN Field SAS Variable CICS 110 DFH Connector Field

208 OMEGAMON II for CICS Historical Reporting Guide, Version 520
Remote Sysid RSYSID DFHCICS-130
Performance Record Type RTYPE DFHCICS-112
User Getmains>16M SCCGETCH DFHSTOR-120
User Getmains<16M SCCGETCT DFHSTOR-117
Getmain Count>16M SCGETG16 DFHSTOR-105
Getmain Count<16M SCGETL16 DFHSTOR-054
HWM User Storage>16M SCHWMG16 DFHSTOR-106
HWM User Storage<16M SCHWML16 DFHSTOR-033
User Storage Getmain Count SCUGETCT DFHSTOR-054
HWM of Storage Allocated SCUSRHWM DFHSTOR-033
Storage Occupancy>16M SCUSRSTH DFHSTOR-107
Storage Occupancy<16M SCUSRSTG DFHSTOR-095
HWM User Storage <16M CDSA
SC24CHWM DFHSTOR-116
Storage Occupancy<16M CDSA
SC24COCC DFHSTOR-118
HWM User Storage>16M ECDSA
SC31CHWM DFHSTOR-119
Storage Occupancy <16M ECDSA
SC31COCC DFHSTOR-121
Shared Storage Getmain Count<16M
SC24SGCT DFHSTOR-144
Shared Storage<16M SC24GSHR DFHSTOR-145
Shared Storage Freemained<16M
SC24FSHR DFHSTOR-146
Shared Storage Getmain Count>16M
SC31SGCT DFHSTOR-147
Shared Storage>16M SC31GSHR DFHSTOR-148
Shared Storage Freemained>16M
SC31FSHR DFHSTOR-149
Shift SHIFT derived
CICS Region SMFMNPRN SMF Header
CICS Version SMFMNRVN SMF Header Product Section
Table 16. Fields Available in CICSTRAN (continued)
CICSTRAN Field SAS Variable CICS 110 DFH Connector Field

Fields Contained in CICSTRAN 209
SMF ID SMFMNSID SMF Header Product Section
Syncpoint Requests SPSYNCCT DFHSYNC-060
Service Class Name SRVCLSNM DFHCICS-167
Task Start Time Stamp START DFHCICS-005
Task End Time Stamp STOP DFHCICS-006
Suspend Wait Count SUSPNDCN DFHTASK-014
Suspend Wait Time SUSPNDTM DFHSYNC-014
Syncpoint Request Time SYNCTM DFHSYNC-173
Syncpoint Request Count SYNCCN DFHSYNC-173
FEPI User Task Allocate Time Out Count
SZALLCTO DFHFEPI-157
FEPI Conversation Count SZALLOCT DFHFEPI-150
FEPI Characters Received SZCHRIN DFHFEPI-155
FEPI Characters Sent SZCHROUT DFHFEPI-154
FEPI Receive Requests SZRCVCT DFHFEPI-151
FEPI User Task Receive Time Out
SZRCVTO DFHFEPI-158
FEPI Send Requests SZSENDCT DFHFEPI-152
FEPI Start Requests SZSTRTCT DFHFEPI-153
FEPI Wait Count SZWAITCN DFHFEPI-156
FEPI Wait Time SZWAITTM DFHFEPI-156
Task Error Flags TASKFLAG DFHTASK-064
Allocate Requests TCALLOCT DFHTERM-069
Terminal Input No. Chars Primary
TCCHRIN1 DFHTERM-083
Terminal Input No. Chars Secondary
TCCHRIN2 DFHTERM-085
Terminal Output No. Chars Primary
TCCHROU1 DFHTERM-084
Terminal Output No. Chars Secondary
TCCHROU2 DFHTERM-086
Terminal I/O Count TCIOWTCN DFHTERM-009
Terminal I/O Time TCIOWTTM DFHTERM-009
Table 16. Fields Available in CICSTRAN (continued)
CICSTRAN Field SAS Variable CICS 110 DFH Connector Field

210 OMEGAMON II for CICS Historical Reporting Guide, Version 520
Transaction Class TCLASS DFHTASK-110
Transaction Class Wait Count TCLDELCN DFHTASK-126
Transaction Class Wait Time TCLDELTM DFHTASK-126
Transaction Class Name TCLSNAME DFHTASK-166
Terminal Input No. Msgs Primary
TCMSGIN1 DFHTERM-034
Terminal Input No. Msgs Secondary
TCMSGIN2 DFHTERM-067
Terminal Output No. Msgs Primary
TCMSGOU1 DFHTERM-035
Terminal Output No. Msgs Secondary
TCMSGOU2 DFHTERM-068
Terminal Storage TCSTG DFHSTOR-104
Transient Data Get Requests TDGETCT DFHDEST-041
Transient Data Wait Count TDIOWTCN DFHDEST-101
Transient Data Wait Time TDIOWTTM DFHDEST-101
Transient Data Purge Requests
TDPURCT DFHDEST-043
Transient Data Put Requests TDPUTCT DFHDEST-042
Terminal ID TERM DFHTERM-002
Terminal Session Connection Name
TERMCNNM DFHTERM-169
Terminal Info TERMINFO DFHTERM-165
Netname TOKEN1 DFHTASK-097
Unit of Work ID TOKEN2 DFHTASK-098
Transaction ID TRAN DFHTASK-001
Transaction Count TRANCNT calculated
Transaction Flags TRANFLAG DFHTASK-164
Task No. TRANNUM DFHTASK-031
Transaction Priority TRANPRI DFHTASK-109
Temporary Storage Get Requests
TSGETCT DFHTEMP-044
Table 16. Fields Available in CICSTRAN (continued)
CICSTRAN Field SAS Variable CICS 110 DFH Connector Field

Fields Contained in CICSTRAN 211
Temporary Storage I/O Wait Count
TSIOWTCN DFHTEMP-011
Temporary Storage I/O Wait Time
TSIOWTTM DFHTEMP-011
Temporary Storage Put Aux Requests
TSPUTACT DFHTEMP-046
Temporary Storage Put Main Requests
TSPUTMCT DFHTEMP-047
Temporary Storage Requests TSTOTCT DFHTEMP-092
Transaction Type TTYPE DFHTASK-004
Transaction Type (character format)
TRANTYPE derived from TTYPE above in SAS routine KC2TTPY) for reporting purposes
User ID USERID DFHCICS-089
CPU Time Count USRCPUCN DFHTASK-008
CPU Time USRCPUTM DFHTASK-008
User Dispatch Time Count USRDSPCN DFHTASK-007
User Dispatch Time USRDSPTM DFHTASK-007
WEEK derived
YEAR derived
The following fields are obtained from the OMEGBSC Event Monitoring Point for CICS Version 3 and above.
GMT Offset MGMTOF
Umbrella Tran ID MUMBPTC
Umbrella Program MUMBUSR
User Work Area MUSRWRK
Resource Name MDEXFIL
Resource Type MDEXTYP
IDMS Total Counts MIDMSN
IDMS Sum Wait Time MIDMST
ADABAS Total Counts MADABN
ADABAS Sum Wait Time MADABT
SUPRA Total Counts MSUPRN
Table 16. Fields Available in CICSTRAN (continued)
CICSTRAN Field SAS Variable CICS 110 DFH Connector Field

212 OMEGAMON II for CICS Historical Reporting Guide, Version 520
SUPRA Sum Wait Time MSUPRT
DATACOM Total Counts MDCOMN
DATACOM Sum Wait Time MDCOMT
The following fields are obtained from the OMEGDLI Event Monitoring Point for CICS Version 3 and above.
Schedule Count MISCHN
Schedule Time MISCHT
Terminate Count MITERN
Terminate Time MITERT
GU Count MIGUN
GU Time MIGUT
GN Count MIGNN
GN Time MIGNT
GNP Count MIGNPN
GNP Time MIGNPT
GHU Count MIGHUN
GHU Time MIGHUT
GHN Count MIGHNN
GHN Time MIGHNT
GHNP Count MIGPNN
GHNP Time MIGPNT
Insert Count MIINSN
Insert Time MIINST
Delete Count MIDELN
Delete Time MIDELT
Replace Count MIREPN
Replace Time MIREPT
The following fields are obtained from the OMEGDB2 Event Monitoring Point for CICS 3 and above.
Open Cursor Count MBOPNN
Open Cursor Time MBOPNT
Table 16. Fields Available in CICSTRAN (continued)
CICSTRAN Field SAS Variable CICS 110 DFH Connector Field

Fields Contained in CICSTRAN 213
Close Cursor Count MBCLON
Close Cursor Time MBCLOT
Fetch Count MBFETN
Fetch Time MBFETT
Select Count MBSELN
Select Time MBSELT
Insert Count MBINSN
Insert Time MBINST
Update Count MBUPDN
Update Time MBUPDT
Delete Count MBDELN
Delete Time MBDELT
Prepares Count MBPREN
Prepares Time MBPRET
Describes Count MBDESN
Describes Time MBDEST
Executes Count MBEXEN
Executes Time MBEXET
Exec Immediate Count MBEXIN
Exec Immediate Time MBEXIT
Misc Count MBMISN
Misc Time MBMIST
DLI Total Counts MDLIN Calculated from OMEGDLI field
DLI Sum Wait Time MDLIT Calculated from OMEGDLI field
DB2 Total Counts MDB2N Calculated from OMEGDB2 field
DB2 Sum Wait Time MDB2T Calculated from OMEGDB2 field
Table 16. Fields Available in CICSTRAN (continued)
CICSTRAN Field SAS Variable CICS 110 DFH Connector Field

214 OMEGAMON II for CICS Historical Reporting Guide, Version 520

Fields Contained in DBD 215
Fields Contained in DBD
The DBD data file, in the DETAIL dataset, contains the fields listed in the following table for all current releases of CICS. The table also contains the SAS variable names and the CICS 110 DFH connector fields. OMEGAMON II collects this information through the DATABASE_COLLECTION parameters in the global data area (GLOBAL_OPTIONS). See the OMEGAMON II for CICS Configuration and Customization Guide for more information on DATABASE_COLLECTION.
You can use the SAS variables for reports you write or to modify reports supplied by Candle.
Table 17. Fields Available in DBD
DBD Field SAS Variable CICS 110 DFH Connector Field
Total Request Wait Time FTIME
Total File Request Count FCOUNT
File Type DBTYPE 1='VSAM'2='DLI'
3='IDMS'
4='ADABAS'
5='SUPRA'
6='DATACOM'
File Name/DDname FNAME
Netname TOKEN1 DFHTASK-097
Unit of Work ID TOKEN2 DFHTASK-098
Unit of Work ID TOKEN2 DFHTASK-098
Transaction ID TRAN DFHTASK-001
CICS Region SMFMNPRN SMF Header
Date SMFMNDTE SMF Header
E
216 OMEGAMON II for CICS Historical Reporting Guide, Version 520

Fields Summarized in the DAILY Dataset 217
Fields Summarized in the DAILY Dataset
KC2SUMD does not summarize every field found in the DETAIL dataset. The DAILY summarized data file contains the fields shown in the following table. This table shows the transaction summary information that KC2SUMD captures, the associated SAS variable name, and the CICS 110 DFH connector field.
You can use the SAS variables for reports you write or to modify reports supplied by Candle.
For a full description of each field, see the IBM CICS manual that describes the connector fields.
Table 18. Transaction Summary Information and SAS Variables
Transaction Summary Information SAS Variable
CICS 110 DFH Connector Field
First Transaction Date/Time Stamp
START
Last Transaction Date/Time Stamp
STOP
Maximum CPU MAXCPUTM
Average CPU AVGCPUTM
Minimum Response Time MINRESP
Maximum Response Time MAXRESP
Mean Response Time AVGRESP
Totals by transaction ID for each of the following fields:
Abend Count ABNDCNT calculated
BMS In Requests BMSINCT DFHMAPP-051
BMS In Requests BMSINCT DFHMAPP-051
BMS Map Requests BMSMAPCT DFHMAPP-050
BMS Out Requests BMSOUTCT DFHMAPP-052
Total BMS Requests BMSTOTCT DFHMAPP-090
Redispatch Wait Count DISPWTCN DFHTASK-102
F

218 OMEGAMON II for CICS Historical Reporting Guide, Version 520
Redispatch Wait Time DISPWTTM DFHTASK-102
Exception Wait Count EXWAITCN DFHTASK-103
Exception Wait Time EXWAITTM DFHTASK-103
File Add Requests FCADDCT DFHFILE-039
File Access Method Count FCAMCT DFHFILE-070
File Browse Requests FCBRWCT DFHFILE-038
File Delete Requests FCDELCT DFHFILE-040
File Get Requests FCGETCT DFHFILE-036
File Wait Count FCIOWTCN DFHFILE-063
File Wait Time FCIOWTTM DFHFILE-063
File Put Requests FCPUTCT DFHFILE-037
File Control Total Requests FCTOTCT DFHFILE-093
Interval Control Requests ICPUINCT DFHTASK-059
MRO Wait Count IRIOWTCN DFHTERM-100
MRO Wait Time IRIOWTTM DFHTERM-100
Journal Wait Count JCIOWTCN DFHJOUR-010
Journal Wait Time JCIOWTTM DFHJOUR-010
Journal Output Requests JCPUWRCT DFHJOUR-058
Program Link Count PCLINKCT DFHPROG-055
Program Load Count PCLOADCT DFHPROG-057
Program XCTL Count PCXCTLCT DFHPROG-056
Response Time RESPTIME calculated
Getmain Count > 16M SCGETG16 DFHSTOR-105
Getmain Count < 16M SCGETL16 DFHSTOR-054
HWM User Storage > 16M SCHWMG16 DFHSTOR-106
HWM User Storage < 16M SCHWML16 DFHSTOR-033
User Storage Getmain Count
SCUGETCT DFHSTOR-054
HWM of Storage Allocated SCUSRHWM DFHSTOR-033
Storage Occupancy >16M SCUSRSTH DFHSTOR-107
Table 18. Transaction Summary Information and SAS Variables (continued)
Transaction Summary Information SAS Variable
CICS 110 DFH Connector Field

Fields Summarized in the DAILY Dataset 219
Storage Occupancy <16M SCUSRSTG DFHSTOR-095
Syncpoint Requests SPSYNCCT DFHSYNC-060
Suspend Wait Count SUSPNDCN DFHTASK-014
Suspend Wait Time SUSPNDTM DFHTASK-014
Allocate Requests TCALLOCT DFHTERM-069
Terminal Input No. Chars Primary
TCCHRIN1 DFHTERM-083
Terminal Input No. Chars Secondary
TCCHRIN2 DFHTERM-085
Terminal Output No. Chars Primary
TCCHROU1 DFHTERM-084
Terminal Output No. Chars Secondary
TCCHROU2 DFHTERM-086
Terminal I/O Count TCIOWTCN DFHTERM-009
Terminal I/O Time TCIOWTTM DFHTERM-009
Terminal Input No. Msgs Primary
TCMSGIN1 DFHTERM-034
Terminal Input No. Msgs Secondary
TCMSGIN2 DFHTERM-067
Terminal Output No. Msgs Primary
TCMSGOU1 DFHTERM-035
Terminal Output No. Msgs Secondary
TCMSGOU2 DFHTERM-068
Terminal Storage TCSTG DFHSTOR-104
Transient Data Get Requests
TDGETCT DFHDEST-041
Transient Data Wait Count TDIOWTCN DFHDEST-101
Transient Data Wait Count TDIOWTCN DFHDEST-101
Transient Data Wait Time TDIOWTTM DFHDEST-101
Transient Data Purge Requests
TDPURCT DFHDEST-043
Transient Data Put Requests
TDPUTCT DFHDEST-042
Transaction Count TRANCNT calculated
Table 18. Transaction Summary Information and SAS Variables (continued)
Transaction Summary Information SAS Variable
CICS 110 DFH Connector Field

220 OMEGAMON II for CICS Historical Reporting Guide, Version 520
Temporary Storage Get Requests
TSGETCT DFHTEMP-044
Temporary Storage I/O Wait Count
TSIOWTCN DFHTEMP-011
Temporary Storage I/O Wait Time
TSIOWTTM DFHTEMP-011
Temporary Storage Put Aux Requests
TSPUTACT DFHTEMP-046
Temporary Storage Put Main Requests
TSPUTMCT DFHTEMP-047
Temporary Storage Requests
TSTOTCT DFHTEMP-092
CPU Time Count USRCPUCN DFHTASK-008
CPU Time USRCPUTM DFHTASK-008
User Dispatch Time Count USRDSPCN DFHTASK-007
User Dispatch Time USRDSPTM DFHTASK-007
The following fields are obtained from the OMEGBSC Event Monitoring Point for CICS Version 3 and above.
IDMS Total Counts MIDMSN
IDMS Sum Wait Time MIDMST
ADABAS Total Counts MADABN
ADABAS Sum Wait Time MADABT
SUPRA Total Counts MSUPRN
SUPRA Sum Wait Time MSUPRT
DATACOM Total Counts MDCOMN
DATACOM Sum Wait Time MDCOMT
DLI Total Counts MDLIN calculated from OMEGDLI field
DLI Sum Wait Time MDLIT calculated from OMEGDLI field
DB2 Total Counts MDB2N calculated from OMEGDB2 field
DB2 Sum Wait Time MDB2T calculated from OMEGDB2 field
Table 18. Transaction Summary Information and SAS Variables (continued)
Transaction Summary Information SAS Variable
CICS 110 DFH Connector Field
Copying SMF Records to a Journal 221
Copying SMF Records to a Journal
Copying SMF Records to a Journal
Introduction
This feature provides a global exit program and a background task that copies CICS SMF records and OMEGAMON II for CICS database records to a CICS journal dataset. If you use this facility, you can process your CICS monitoring data from the journal without affecting your usual CICS SMF record processing.
This facility must be initialized prior to OMEGAMON II for CICS initialization in order to obtain the database detail records before OMEGAMON II for CICS processes them. You can start this facility immediately, or you can start it in a suspended state prior to OMEGAMON II for CICS initialization and then activate it at a later stage by issuing a CICS transaction. This gives you the ability to only record data to journals for selected time periods.
Required software
The following software is required to use this facility:
� CICS/ESA 3.1.1 or above
� Assembler H Version 2 or above
Objects Provided� Library hilev.TKANMAC contains:
� hilev.TKANSAM contains:
KOCJOCS Copybook describing clocks and counters segment.
KOCJOGWA Global work area dsect.
KOCJONDV Assembler macro to execute this facility.
KOCJO311 Assembly JCL for CICS release 3.1.1.
KOCJO321 Assembly JCL for CICS release 3.2.1.
KOCJO330 Assembly JCL for CICS release 3.3.0.
KOCJO410 Assembly JCL for CICS release 4.1.0.
KC2JOSMF SAS macro to convert resulting journal records to a SAS database.
G

222 OMEGAMON II for CICS Historical Reporting Guide, Version 520
� The default transaction code is OMJO.
The result of assembling and linkediting KOCJONDV using job KOCJOnnn is a module named KOCJOnnn., where nnn reflects the CICS release level.
Functions provided
Overview� This facility copies your CICS SMF data, before it is written to SMF, and writes it to a CICS
user journal.
� Both SMF 110 performance records and SMF 255 database records are copied.
� You can enable this facility with the PLTPI or with CICS transaction OMJO.
� There are no changes to OMEGAMON II for CICS.
Initialization functions provided� Verify that OMEGAMON II for CICS has not been initialized in the region.
� Verify that the specified CICS journal can be opened.
� Obtain data buffer storage.
� Enable the code to run at the global user exit point XMNOUT.
� Initialize the global work area.
� Perform a full initialization which starts a background transaction to process completed buffers.
� Perform a suspended initialization which does not start the background transaction or global user exit.
Termination functions provided� Disable all SMF to journal copy functions.
� Suspend copy activities and return to the suspended state.
Global exit functions provided� Copy CICS performance records to the buffers provided, ensuring that the OMEGBSC
section is completed.
� Copy SMF type 255 database records to the buffers provided.
� Optionally, suspend the operation of the monitoring domain exit until a buffer is available. This results in tasks not starting or finishing until a journal record is written and the exit is resumed.
Background task functions provided� Process each full buffer.
� Write the records in the buffer to the specified CICS journal.
� Ensure that the exit is resumed at the earliest opportunity.

Copying SMF Records to a Journal 223
Statistical function provided� Display operational and performance statistics for this facility.
SAS function provided� Convert the resulting journal data into the format expected by existing Candle-provided
SAS SMF sample programs.
Implementation procedures
Your responsibilities� You must not exclude fields 001, 037, 112, 097, or 098 from the CICS Monitoring
Control Table (MCT).� You must include the OMEGBSC segment in the MCT. Do not use the Data Reduction
SPE to eliminate fields from the SMF 110 record.� You assemble the Candle-provided macro at the correct CICS release level for your site
using the Candle-provided assembly JCL.� You manage your journal datasets and their archiving.
ImplementationTo implement this facility, perform the following steps:
1. Modify the following macro statement fields in the Candle-supplied JCL, KOCJOnnn, to meet your site’s requirements:
BUFSIZE Size of journal record buffer. Must be 1 kilobyte less than the maximum buffer size specified in the JCT entry by BUFSIZE. Specify a number ranging from 4–31 in kilobytes.
EXCLUDE List of specific or generic transaction codes to exclude from this facility. For example, EXCLUDE=(ABCD,DE*) excludes transaction ABCD and all transactions starting with the characters DE.
NUMBUFF Number of journal record buffers. Specify a number ranging from 2–16.
JOURNUM User journal dataset number on which to write SMF records. This facility must be the only user of the journal dataset. Specify a number ranging from 2–99.
PLTSTRT How to initialize when invoking through the PLT. Specify either ACTIVE or SUSPEND. Does not apply when invoked by transaction.
TRANSID When the facility is invoked through the PLT, the name of the transaction that the program uses to start the background task.
WAITOPT Whether to suspend operation of this facility until a journal buffer is available. Specify YES or NO.� YES —If no buffers are available, the exit code suspends the task until a buffer
is available. The number of buffer waits will be incremented. Note that since Since the task is suspended in the monitoring domain all tasks will wait, when they initialize or terminate, until a buffer is available
� NO—If no buffers are available, the record being processed is discarded and the number of records lost is incremented.

224 OMEGAMON II for CICS Historical Reporting Guide, Version 520
2. Assemble and linkedit the Candle-provided macro KOCJONDV using the Candle-provided JCL KOCJOnnn, where nnn is the CICS release level where this facility will execute.
3. Code the PLT entries if you want this facility to be initialized automatically at CICS startup and shutdown. Enter program KOCJOnnn in the PLT before the KOCOME00 entry.
4. Code the required JCT entries for the user journals used.
5. Invoke CEDA to define transaction OMJO and program KOCJOnnn, where nnn is the CICS release level. For CICS release 3.3 and above, specify TASKDATAKEY(CICS) for transaction OMJO and EXECKEY(CICS) for program KOCJOnnn.
6. Make the necessary changes to CICS to ensure correct journal archiving as described in the IBM CICS Operations Guide.
7. Initialize this facility as described in the following section.
Initialization
Choose from one of the following initialization procedures, as required for your site.
1. Fully initialize the facility with the startup PLT, specifying PLTSTRT=ACTIVE.
2. Initialize the facility in the suspended state with the startup PLT, specifying the PLTSTRT=SUSPEND keyword. Later while OMEGAMON II for CICS is active, enter transaction OMJO RESUME to complete initialization.
3. Fully initialize the facility by entering transaction OMJO INIT before OMEGAMON II for CICS is initialized.
Termination
Choose from one of the following termination procedures, as required for your site.
1. Shutdown all functions through the shutdown PLT. You will not be able to restart this facility until CICS is recycled.
2. Shutdown all functions by entering transaction OMJO SHUT. You will not be able to restart this facility if OMEGAMON II for CICS has been initialized.
3. Enter transaction OMJO SUSPEND, at any time, to suspend this facility. This allows you to resume at a later time.
Display statistics
To display operational and performance statistics for this facility:
� Enter transaction OMJO STATUS.
Journal input to SAS
This facility interfaces with SAS Historical Reporting. See “SAS Historical Reporting” on page 121. In order to use the journal data, you must first
� Copy member KC2JOSMF from hilev.TKANSAM into the KC2SPROG libraries created by the installation of the SAS Historical Reporting facility.

Copying SMF Records to a Journal 225
Before submitting SAS job KC2ADHCJ or KC2SMFJ (which read the SMF dataset and create a SAS database), you must modify the JCL to read the journal datasets. Perform the following steps.
1. Make copies of the JCL and modify the copies.
2. Remove STEP01 which extracts the SMF data.
3. Replace the //SMF DD statement with //JOURNAL DD DSN=your.journal.dataset,DISP=SHR
4. Replace %KC2SMFR with %KC2JOSMF.
Reference information
Keywords
You can use the following keywords with transaction OMJO:
Errors� Full and suspended initialization issues messages indicating their success or failure.� Any errors other than the specification of incorrect keywords cease this facility and
generate error messages on the system log. Incorrect keywords are reported to the terminal operator upon entry.
Performance
You can control the performance impact on your systems by changing the size and number of buffers obtained to store the data.
1. Modify the values of the BUFSIZE and NUMBUFF macro statement fields in the assembly JCL, KOCJOnnn.
2. Reassemble and linkedit module KOCJONDV using JCL KOCJOnnn.
Journal record formats
DFHJCR
The DFHJCR macro in CICS documentation describes the standard portions of the journal records:
� journal label record
� journal header
� system prefix
NIT Performs a full initialization.
RESUME Returns to a fully initialized state.
SHUT Terminates the facility.
STATUS Reports on buffer performance.
SUSPEND Goes to a suspended state.

226 OMEGAMON II for CICS Historical Reporting Guide, Version 520
User prefix
The user prefix follows the system prefix and has the following format:
NDV prefix
The NDV prefix follows the user prefix and precedes every SMF data portion of the journal record. The NDV prefix has the following format:
USERLL Two-byte binary user prefix length whose value is 14.
USRRELNO Four-byte character CICS release number.
USRAPLID Eight-byte character CICS generic application ID.
NDVLL Two-byte length whose value is 4.
NDVTYPE One-byte number indicating SMF record type:
X'01' CICS performance data (SMF 110).
X'02' ONDV database record (SMF 255 database).
NDVDBTYP One-byte number indicating database type:
X'00' Not a database record.
X'01' VSAM.
X'02' DLI.
X'03' IDMS
X'04' ADABAS.
X'05' SUPRA.
X'06' DATACOM.

Copying SMF Records to a Journal 227
Data portion
The data portion of the journal record follows the NDV prefix and contains the same data as an SMF 255 database or 110 record. For the format of the SMF 110 record, see the IBM CICS Customization Manual. For the format of the SMF 255 database record, see the hilev.TKANSAM library.
There may be multiple pairs of NDV prefix and data portion in one user journal record. There are as many pairs following the header, system prefix, and user prefix as can fit into the specified journal buffer size. The BUFSIZE macro statement field in the Candle-supplied assembly JCL, KOCJOnnn, specifies the journal buffer size.
General format
The following figure illustrates the general format of the user journal record created by this facility.
FIGURE 76. Journal Record General Format
+--------------------------------------------------------------------------------------------------+| | | | | | | | || Journal | System | User | NDV | SMF-like | . . . . . . .| NDV | SMF-like || Header | Prefix | Pfx | Pfx | data | | Pfx | data || | | | 1 | 1 | | n | n |+---------------------------------------------------------------------------~-----~----------------+

228 OMEGAMON II for CICS Historical Reporting Guide, Version 520

Guide to Candle Customer Support 229
Guide to CandleCustomer Support
IntroductionCandle Corporation is committed to producing top-quality software products and services. To assist you with making effective use of our products in your business environment, Candle is also committed to providing easy-to-use, responsive customer support.
Precision, speed, availability, predictability—these terms describe our products and Customer Support services.
Included in this Guide to Candle Customer Support is information about the following:
Base Maintenance Plan . . . . . . . . . . . . . . . . . . . . . . . . . . . . . . . . . . . . . . . . . . . . . . . . . 230– Telephone Support
– eSupport
– Description of Severity Levels
– Service-level objectives
– Recording and monitoring calls for quality purposes
– Customer Support Escalations
– Above and Beyond
Enhanced Support Services . . . . . . . . . . . . . . . . . . . . . . . . . . . . . . . . . . . . . . . . . . . . . . 234– Assigned Support Center Representative (ASCR)
– Maintenance Assessment Services (MAS)
– Multi-Services Manager (MSM)
Customer Support Contact Information . . . . . . . . . . . . . . . . . . . . . . . . . . . . . . . . . . . . . 235– Link to Worldwide Support Telephone and E-mail information
H

Base Maintenance Plan
230 OMEGAMON II for CICS Historical Reporting Guide, Version 520
Base Maintenance Plan
OverviewCandle offers a comprehensive Base Maintenance Plan to ensure that you realize the greatest value possible from your Candle software investments. We have more than 200 technicians providing support worldwide, committed to being responsive and to providing expedient resolutions to support requests. Technicians are available worldwide at all times during the local business day. In the event of an after-hours or weekend emergency, our computerized call management and forwarding system will ensure that a technician responds to Severity One situations within one hour. For customers outside of North America, after-hours and weekend support is provided in English language only by Candle Customer Support technicians located in the United States.
Telephone supportCandle provides consistently reliable levels of service—thanks to our worldwide support network of dedicated experts trained for specific products and operating systems. You will always work with a professional who truly understands your problem.
We use an online interactive problem management system to log and track all customer-reported support requests. We give your support request immediate attention by routing the issue to the appropriate technical resource, regardless of geographic location.
Level 0 Support is where your call to Candle Customer Support is first handled. Your support request is recorded in our problem management system, then transferred to the appropriate Level 1 support team. We provide Level 0 manual interaction with our customers because we support more than 170 products. We feel our customers would prefer personal interaction to a complex VRU or IVR selection menu.
Level 1 Support is the service provided for initial support requests. Our Level 1 team offers problem determination assistance, problem analysis, problem resolutions, installation assistance, and preventative and corrective service information. They also provide product usage assistance.
Level 2 Support is engaged if Level 1 cannot provide a resolution to your problem. Our Level 2 technicians are equipped to analyze and reproduce errors or to determine that an error is not reproducible. Problems that cannot be resolved by Level 2 are escalated to Candle’s Level 3 R&D support team.
Level 3 Support is engaged if a problem is identified in Candle product code. At Level 3, efforts are made to provide error correction, circumvention or notification that a correction or circumvention is not available. Level 3 support provides available maintenance modifications and maintenance delivery to correct appropriate documentation or product code errors.
eSupportIn order to facilitate the support process, Candle also provides eSupport, an electronic full-service information and customer support facility, using the World Wide Web at www.candle.com/support/. eSupport allows you to open a new service request and update

Guide to Candle Customer Support 231
Base Maintenance Plan
existing service requests, as well as update information in your customer profile. New and updated service requests are queued to a support technician for immediate action. And we can respond to your request electronically or by telephone—it is your choice.
eSupport also contains a continually expanding knowledge base that customers can tap into at any time for self-service access to product and maintenance information.
The Candle Web Site and eSupport can be accessed 24 hours a day, 7 days a week by using your authorized Candle user ID and password.
Description of Candle severity levelsResponses to customer-reported product issues and usage questions are prioritized within Candle according to Severity Code assignment. Customers set their own Severity Levels when contacting a support center. This ensures that we respond according to your individual business requirements.
Severity 1 Crisis
A crisis affects your ability to conduct business, and no procedural workaround exists. The system or application may be down.
Severity 2High
A high-impact problem indicates significant business effect to you. The program is usable but severely limited.
Severity 3Moderate
A moderate-impact problem involves partial, non-critical functionality loss or a reasonable workaround to the problem. A “fix” may be provided in a future release.
Severity 4Low
A low-impact problem is a “how-to” or an advisory question.
Severity 5Enhancement Request
This is a request for software or documentation enhancement. Our business units review all requests for possible incorporation into a future release of the product.

Base Maintenance Plan
232 OMEGAMON II for CICS Historical Reporting Guide, Version 520
Candle has established the following service-level objectives:
Recording and Monitoring Calls for Quality PurposesCandle is committed to customer satisfaction. To ensure that our customers receive high levels of service, quality and professionalism, we'll monitor and possibly record incoming and outgoing Customer Support calls. The information gleaned from these calls will help us serve you better. If you prefer that your telephone call with Candle Customer Support in North America not be monitored or recorded, please advise the representative when you call us at (800) 328-1811 or (310) 535-3636.
Customer Support EscalationsCandle Customer Support is committed to achieving high satisfaction ratings from our customers. However, we realize that you may occasionally have support issues that need to be escalated to Candle management. In those instances, we offer the following simple escalation procedure:
If you experience dissatisfaction with Candle Customer Support at any time, please escalate your concern by calling the Candle support location closest to you. Ask to speak to a Customer Support manager. During standard business hours, a Customer Support manager will be available to talk with you or will return your call. If you elect to hold for a manager, you will be connected with someone as soon as possible. If you wish a return call, please tell the Candle representative coordinating your call when you will be available. After contacting you, the Customer Support manager will develop an action plan to resolve your issue. All
Call StatusSeverity 1
GoalSeverity 2
GoalSeverity 3
GoalSeverity 4
GoalSeverity 5
Goal
First Call Time to Answer
90% within one minute
Level 1 Response
(Normal Business Hours)
90% within 5 minutes
90% within one hour
Level 2 Response
(Normal Business Hours)
Warm Transfer
90% within two hours
90% within eight hours
Scheduled follow-up (status update)
Hourly or as agreed
Daily or as agreed
Weekly or as agreed Notification is made when an enhancement is incorporated into a generally available product.
Notification is made when a fix is incorporated into a generally available product.
The above information is for guideline purposes only. Candle does not guarantee or warrant the above service levels. This information is valid as of October 1999 and is subject to change without prior notice.

Guide to Candle Customer Support 233
Base Maintenance Plan
escalations or complaints received about support issues are logged and tracked to ensure responsiveness and closure.
Above and BeyondWhat differentiates Candle's support services from our competitors? We go the extra mile by offering the following as part of our Base Maintenance Plan:
� Unlimited multi-language defect, installation and operations support
� eSupport using the World Wide Web
� Regularly scheduled product updates and maintenance provided at no additional charge
� Over 200 specialized technicians providing expert support for your Candle products

Enhanced Support Services
234 OMEGAMON II for CICS Historical Reporting Guide, Version 520
Enhanced Support Services
OverviewOur Base Maintenance Plan provides a high level of software support in a packaged offering. However, in addition to this plan, we have additional fee-based support services to meet unique customer needs.
The following are some examples of our added-value support services:
� Assigned Support Center Representative Services (ASCR)
– An assigned focal point for managing support escalation needs
– Proactive notification of available software fixes
– Proactive notification of product version updates
– Weekly conference calls with your ASCR to review active problem records
– Monthly performance reviews of Candle Customer Support service levels
– Optional on-site visits (extra charges may apply)
� Maintenance Assessment Service (MAS)
– On-site assessment services
– Advice about product maintenance and implementation
– Training your staff to develop efficient and focused procedures to reduce overall cost of ownership of your Candle software products
– Analysis of your Candle product environment: versions, updates, code correction history, incident history and product configurations
– Reviews to ensure that purchased Candle products and solutions are used effectively
� Multi-Services Manager (MSM)
Multi-Services Manager provides highly valued services to customers requiring on-site full time expertise to complement their technical resources.
– Dedicated on-site Candle resource (6 months or one year) at your site to help ensure maximum use and effectiveness of your Candle products
– Liaison for all Candle product support activities, coordination and assistance with implementation of all product updates and maintenance releases
– Works with your staff to understand business needs and systems requirements
– Possesses technical and systems management skills to enhance your staff’s knowledge and expertise
– Other projects as defined in Statement of Work for MSM services

Guide to Candle Customer Support 235
Customer Support Contact Information
Customer Support Contact Information
Link to Worldwide Support Telephone and E-mail informationTo contact Customer Support, the current list of telephone numbers and e-mail addresses can be found on the Candle Web site, www.candle.com/support/.
Select Support Contacts from the list on the left of the page.

Customer Support Contact Information
236 OMEGAMON II for CICS Historical Reporting Guide, Version 520

Index 237
Symbols(OPR) ID field 80//INPUT statement 36, 37//OUTPUT statement 40
Aabends
count field 95field 98
Above field 95activity 96ad hoc reports
KC2ADHCJ supplied job 136ADABAS V7.1 support 19add requests 67address space
initialization 30Adobe portable document format 14allocating and populating
SAS system fileKC2SJCL 127
SAS system filesKC2SJCL 127
altering time unitsreports 60
applicationgenerator 74
APPLID parameter 38arguments
USERRECIGNORE 60INCLUDE 60
arguments for report option 67ASCR
assigned support center representative 234assigned support center representative
ASCR 234asterisk (+) 55avg 95
field 95len filed 95resp field 95
BBAND option 49, 50, 53, 194BASCID statement 39BASIC keyword 39Basic keyword 39batch reports (Menu) 67
ddnamessample jobs 67
below field 95BLOCK option 65BookMaster 19browse requests 67
CCANCEL keyword 58, 59capacity planning 25CICSGROUP group type 55CICSGROUP option 195, 196CICSTRAN data file
fields for current CICS releases 132, 205class tasks
subanalysis report 115CMSc transactions 62COMBINE option 60, 195, 196commands (Menu)
options 47syntax 47
COMPRESS statement 37conditional selection 57CONTROL
arguments 65command 65, 193option 196
controlfile analysis (Menu)
request keywords 59CONTROL controls printer functions 65control statements for custom reports 176converting SMF data
dictionary record 40KOCZSMFC job
KOCZSMFU job 35sample JCL 37sample output 41
Index

238 OMEGAMON II for CICS Historical Reporting Guide, Version 520
CPU (Menu)field 95, 98subanalysis report 111, 112usage 69used field 95utilization 59
CPUTIL keyword 59creating
dataset creatingKC2ALOCJ supplied job 127
KC2ALOCJ supplied jobCICSTRAN data file
DBD data file 127custom
running 176custom reports 175, 176
examples 182producing list and summary 178start examples 178
custom reports fromKC2GRWJ supplied job 176
customer supportbase maintenance plan 230contact information 235enhanced support services 234eSupport 230severity levels 231telephone support 230
customizing SAS 130
Ddaily collection jobs, running 132, 133, 136
DAILY reports and charts 135to populate the DAILY dataset 134
DAILY dataset 134, 135, 156reports from 156summarized fields 135using KC2SUMD 135
dataconversion 21–24, 28, 35, 40processed field 94
DATA argument 64data collection 21, 31, 33
commands 31data collector 102database 84
reports 48, 64, 193date
field 98Julian or Gregorian format 51
date and time 38, 54GMTOFF statement
Greenwich Mean Time (GMT)TIMEZONE statement 37
Greenwich Mean Time (GMT) 51, 194keyword recommendations 53LOCAL keyword
Greenwich Mean Time (GMT) 50produce reports 53relative values 53
relative values 52, 53report options 49, 194stamp 38
on SMF header record 38time period keywords 51
DATE statement 38DATEFORM option 49, 51, 194DAYOFWK option 194DB2 (Menu)
keyword 39DB2ID statement 39DBASE option 48, 193DBD data file
fields for current CICS releases 132, 215Default field 94defining groups 55delete requests 59destination
queue subanalysis 118DETAIL dataset 127, 137, 176, 205, 215
analyzed by KC2TRXG 184archived
archived DETAIL dataset 135custom reports from 175
using KC2TGRW 175Generalized Report Writer
merging CICSTRAN and DBD data files 176populating 132reports from
KC2REPTJ supplied jobKC2ADHCJ supplied job 137
using KC2SMFR 132DETAIL option 61, 63, 195, 196detail reports 21
file 82list 193program 86response time 70system 88
REPORT command 88

Index 239
terminal 78transaction 74user ID 80
DETAIL reports and chartsKC2REPTJ supplied job 133
dictionary recordsgenerating 32generating from a CICS region 32generating from an off-line utility 33KC2DICTJ supplied job 129mapping in CICS/ESA environments 131
DL/I (Menu)request count/type field 95subanalysis report 115
DLIID statement 39double-spaced title line 63DUPLICATE option 65dynamic storage area
subanalysis report 113, 114
EENDATE option 194ENDDATE option 49, 52, 53ENDTIME option 50, 52, 53, 194enqueue (Menu)
subanalysis report 116EPILOG 28eSupport
customer support 230example
REPORT TRANSACTION DETAIL 74examples
REPORT LIST 90REPORT SYSTEM DETAIL 88
exception analysisreports
Phase III analysis 111EXCLUDE statement 38exit code 201explanation on
reportsexplanation on 70
Ffield 95, 97, 98field headings 94file 82file analysis (Menu) 59, 95, 97
I/O 82option 48, 193
reports 48, 64, 82request 98subanalysis report 117
file request (Menu)option 193
file request reportfile 82
FOLDOFF/ON argument 65fourth-generation language
applicationgeneration 92
Ggenerating
control statement for 176generating a dictionary record 32, 33get
requests 59GETMAIN
field 98keyword 59
globaldata area 36
GMT offset 37GMTOFF statement 37grand total fields 95graph displays
symbol 71, 76GRAPH option 60, 61, 195, 196Greenwich Mean Time (GMT)
GMTOFF 37LOCAL 50TIMEZONE 194
Gregorian or Julian date format 51group
report 108selection 55
group types 55
Hhexadecimal characters 57high-water mark storage 59historical data
data collection 28data conversion 27, 28
historical data collection 33historical reporter 28

240 OMEGAMON II for CICS Historical Reporting Guide, Version 520
II/O
file analysis (Menu) 97requests 97subanalysis report 118
IBMDFHMNDUP utility 40SORT option 196SORT program 63
ID 78, 95group 108groups 195reports 193transaction (Menu)
reports 48IGNORE argument 60INCLUDE
argument 60statement 38
initializing CICS and OMEGAMON II address spaces 30
INPUT ddname 67installing SAS 128
customizing SAS 128interval record analysis 25interval record collection 101Interval record collector 102interval record problem reporter 101interval recording
specifying the recording intervaldefault recording interval 102
Interval recording (CUA) 102interval recording (CUA)
activating collection 102activating collections 102requirements before activating 102
Interval sample report 106IOADD keyword 59IOBROWSE keyword 59IODELETE keyword 59IOGET keyword 59IOPUT keyword 59IOTOTAL keyword 59
Jjournal (Menu)
control subanalysis 117Julian or Gregorian data format 51
KKC2SMFJ supplied job
to populate the DETAIL dataset 132KOC2MFC job 37KOC2SMFU job 37KOCEPOPT macro 39KOCEPORT macro 39KOCGLOB macro 36KOCZSMFC job 37, 40KOCZSMFU job 35, 36, 37, 40
LLASTMONTH option 50, 194LASTWEEK option 50, 194LASTYEAR option 50, 194LINES arguments 65LIST option 48, 61, 63, 193list reports 48, 91LOCAL keyword 50local shared resources (Menu) 97logon
fieldoperator 80
(OPR) ID field 98
Mmaintenance assessment service
MAS 234MAS
maintenance assessment service 234MAXSCALE option 61, 195, 196MERGE option 62, 63, 196message log 40MICS 25minus sign(-) 52Missing Data
field 96report 88
Msgs In field 96Msgs Out field 96MSM
multi-services manager 234multiple REPORT requests 45, 48, 62multiple transaction records 38multi-services manager
MSM 234MXG 25

Index 241
Nname field
umbrella transaction services 96netname field
logical unitsname 96
VTAM (Menu)network name 98
NOCANCEL keyword 58, 59NOGRAPH option 61, 195NOMERCE option 62NOSORT option 62, 63NOUMBRELLA option 64NOWORSTCASE option 60
Oon SMF header record 38option
GMTlocal time 194
options 47BLOCK 65conditional selection 57default settings 46presentation 47, 60RANGE 49report type 46, 47, 48, 193, 196selection 47, 49
Options field 94options presentation 64origin
CICS field 96network field 96
other DB total elapsed time field 96outages
reporting 88
PPAG subanalysis report 112PAGESEP command 65–66, 193parameters 88PERTYPE statement 38PGM parameter 36PLTPI list 95plus sign (+) 52populating
KC2DLYJ supplied job 134preface 12presentation options 47, 60, 64
printing problems 14problem reporter 101
messages 119record problem reporter
report job 105process
CICS fieldMRO/ISC (Menu) 96
network field 96producing
reportsproducing 48
PRODUCTS command 66, 193PROGRAM
arguments 64option 48
programcount field 96groups 195name field 97reports 48, 64, 86usage reports 193
PROGRAM option 193PROGRAMGROUP group type 56pseudo-transaction ID 74PUT
requests 59
RRANGE option 49, 50, 53, 194RANGE/BAND statement 38relative date and time values 67
wrap-around feature 52, 53report 67REPORT command 49, 55, 60, 61, 74, 90, 193,
195examples 71, 80, 82, 84, 90, 92
REPORT PROGRAM DETAIL 86REPORT TERMINAL DETAIL 78REPORT TRANSACTION GRAPH (VBAR,
DAILY) 76REPORT DBASE DETAIL 84Report field 94REPORT FILE DETAIL 82report option arguments
DAILY 61FOLDOFF 65FOLDON 65IGNORE 60INCLUDE 60

242 OMEGAMON II for CICS Historical Reporting Guide, Version 520
LINES 65MERGE(YES) 62MONTHLY 61NOUMBRELLA 64PROGRAM 64TRANSACTION 64UMBRELLA (PROGRAM)
UMBRELLA (DATA) 98UMBRELLA option 64VBAR 61WEEKLY 61WORSTCASE 60
REPORT RESPONSE GRAPH (VBAR, DAILY) 71REPORT TRANSACTION DETAIL UMBRELLA
(TRANSACTION)DETAIL REPORTS 92
reportercommand options 47commands 193date and time defaults 53process flow 28selection options 49SET and REPORT commands 46
reports 48, 61, 70, 126, 136, 137, 139–154, 156, 173, 175, 176, 182, 201
altering time units 60batch 67
batch reports (Menu) 193custom
Generalized Report Writer 175DAILY dataset 156data collection 28database 48, 64
data base 84DETAIL dataset 137detail reports
database 84detailed 61field headings 95fields 95list 48log fields 94missing data 88multiple requests 45options log fields 94preparing 126presentation options 60printer functions 65product information 66
requesting 45, 57, 62multiple requests 48
response time (Menu) 64scaling factor 61
selection options 49separator pages 65–66sorting data 63system 48, 55, 88
VTAM (Menu)network name 96
terminal usage 48type options 46, 47, 48, 193, 196types 61worst case analysis 69, 94, 98
excluded 88REPORTS ESERID DETAIL 80reports from
KC2REPTJ supplied job 156parameters 137, 156
reports from SMF dataKC2ADHCJ supplied job 136
reports presentation options 64reqs field 95request
avg field 97reports 193type field 97
requesting report 57resources (Menu)
thresholds 21RESPONSE
keyword 59option 48, 193
response time (Menu) 48, 60, 61, 64, 70bottleneck analysis
bottleneck analysis (Menu)Phase II analysis
Phase II analysis 110history graph
Phase I analysis 108Phase III analysis
exception reports 111Phase IV analysis
resources (Menu)subanalysis reports
Phase IV analysis 111reports
explanation on 74response time transaction builder
using KC2TRXG 184response time transaction group builder 184, 187

Index 243
default group thresholds 184macros produced by 184Sigma3 formula
thresholds for the local environmentSigma3 formula 186
thresholds for the local environment 186Sigma3 formula 186
using KC2TRXG 184RTID
pseudo-transaction IDthird party databases 98
Run Date field 94running
KC2TRXJ supplied job 187running daily collection jobs
for DAILY reports and charts 135for reports from SMF data 136to populate the DAILY dataset 134to populate the DETAIL dataset 132
running reports and chartsKC2REPTJ supplied job 135
Ssample job output 41sample reports 69SAS 132, 134, 135, 136, 137, 156, 175, 184, 186
ad hoc 136benefits 121coding user-defined exist 201control statements for 176custom 175
Generalized Report WriterGeneralized report Writer facility 175
customizing 128DAILY dataset 156, 173DETAIL dataset 137, 139–154flowchart number key 124Generalized Report Writer 182historical reporting process flowchart 125historical reporting process, overview of 124installing
installing SAS 127system files
runtime JCL and macro libraries, creating and pop-ulating
SAS system and populatingKC2SJCL 127
KC2GRWJ supplied job 176location of code 126location of SAS code 126macro and programs 128
macros and programs 199mapping the SMF 110 record 130, 131preparing 126preparing to run sample reports 126running collection jobs
for DETAIL reports and charts 133runtime JCLL and macro libraries, and populating
127SAS code location 126sequential datasets, allocating
DAILY datasetDETAIL dataset 127
Statistical Analysis System 24system files 127
allocating and populating 127TKANSAM target library 126use requirements 122user-defined exits for 201
SAS code location 126SAS Historical Reporting 121SAS macro members
for SMF record mapping 128KC2BSC 129KC2CMPY 128KC2GRF 128KC2GRP
KC2CMPY 128KC2PICK 129KC2SHFT 128KC2WEEK 128location of 128
SAS macros and programscustomizing 128internal 199
SAS reports 176custom
Generalized Report Writer 175parameters 175
from SMF data 136from the DAILY dataset 156, 173
parameters 156running 156
from the DETAIL dataset 137, 139–154parameters 137running 137–155
Generalized Report Writer 182control statements for 176merging CICSTRAN and DBD data files 176running 176

244 OMEGAMON II for CICS Historical Reporting Guide, Version 520
preparing to run 126user-defined exits for 201
SAS runtime JCL and macro libraries, and creating populating 127
SAS system filesallocating and populating KC2SPROG 127
scaling factorreports 61
SCAN option 62, 196Selected field 94SELECTIF
keywords 58option 57, 196
selecting and converting SMF data 37selection options 47
group selection 55other conditional 57relative date and time 53SET command
date and time 49other conditional 60
SELECTTIFoption 196
sequential SAS datasets, allocatingDAILY dataset 127
SET command 49, 53, 55, 57, 60explanation 46presentation options 60, 64report request 193selection options
relative date and time 52, 53SET command groups 195severity levels
customer support 231SMF 110 records
generated from CICS Version 2 131read by KC2SMFR 131standard layouts 130
SMF record mappingKC2V212 128KC2V330 128
SMF record mappingsby SAS code for the 110 record 130invoking with KC2PICK 129KC2V321 128KC2V410 128KC2V41A 128KC2V41C 128KC2V41F 129KC2V41T 129
KC2V510 129KC2VOM2
KC2V311 128modifying
KC2DICTJ supplied job 129SMF records
copying to a journal 221SORT option 63, 196Sort Sequence field 94SORTISIZE 196
option 196SORTSIZE
default 63option 63
SORTWKnn ddname 67stamp
on SMF header record 38start field
transaction (Menu)start time 97
STARTDATE optiondefinition 194keywords 53relative values 52, 53, 54
STARTIME optiondefinition 194relative values 53
STARTTIME optionkeywords 53relative values 52, 53, 54
stop field 97Stor Viol field
storage (Menu)violation 97
storagefield 98used field
high-water mark storage 97storage (Menu)
GETs fieldGETMAIN
request 97storage field
transaction (Menu)storage 95
STORAGE keyword 59STORAGEX keyword 59sub-ID field
umbrellatransaction
ID 98SUMMARY option 63, 196, 197

Index 245
summary reports 80, 82, 84program 86response time 70terminal 78transactions 74
symbol 76SYSDUMP ddname 67SYSOUT ddname 67system
reports 48, 88transaction records 37
system initialization table (Menu)overrides
system initialization table (Menu) 88System Management Facility (SFM)
writing data to 32System Management Facility (SMF) 25, 35, 78
data conversion 35dictionary records 40header record 38ID 97SAS code mapping for the 110 record 130, 131selecting and converting data 37unloading and converting data 40unloading the SMF dataset 36
SYSTEM option 48, 193SYSTYPE statement 38
Ttelephone support
customer support 230temporary storage (Menu)
subanalysis report 115terminal (Menu)
field 97netname field 97reports 78usage reports 48, 193
TERMINAL option 48, 193TERMINALGROUP group type 56TERMINALGROUP option 195, 197THISMONTH option 50, 194THISWEEK option 50, 194THISYEAR option 51, 194thresholds for the local environment
response time transaction group builderSigma3 formula 186
timeand date options 197field 98
period keywords 51statement 38task control block (Menu)
time 95TIMEZONE 194
option 50statement 37
title line, producing 63TITLE option 196TITLEn option 63, 65TITTLEn option 197TKANSAM target library
location of SAS code 126TODAY option 51, 194totals field 97tran
count field 97field
transaction (Menu)ID 99
name field 97sub-ID field
umbrella 97TRANSACTION 92transaction
ID 97transaction (Menu) 48, 193, 195
argument 64ID
sub-ID 74option 48reports 61, 64, 74requests 59response reports 193
TRANSACTION option 193TRANSACTIONGROUP group type 56TRANSACTIONGROUP option 195, 197transient data
queue 97
Uumbrella
data field 98field 98
umbrellatransaction ID 99
program fieldumbrella
argument 98tran field 98

246 OMEGAMON II for CICS Historical Reporting Guide, Version 520
UMBRELLA option 56arguments 64definition 64, 196for report types 197in program reports 86in reports 92in transaction reports 74
UMBRELLA report breaksreports
response time (Menu) 64unit
specifiers 59, 60unloading SMF data 36, 40until
specifiers 58user ID 80
field 98reports 80usage reports 48, 194
user-defined exits, coding 201user-defined reports 175USERGROUP group type 57USERGROUP option 195USERGROUPS option 197USERID 194USERID option 48USERREC 60
option 196, 197USERREEC
option 60using KC2TRXG
KC2TRXJ supplied job 184
VV field 99value field 99version 520 changes 17–19VSAM
LR pool 82subanalysis report 116
VTAM (Menu)APPLID 38
Wwhat’s new, version 520 17–19worst case analysis
fields 94, 98report breaks 69
WORSTCASE(YES) argument 60keyword 60option 197
NOWORSTCASE option 196writing data to SMF 32
YYESTERDAY option 51, 195


