43


2
Historical Review of MajorAchievements 2003-2005
Sale of 57 Branches outside Quebec
B2B Trust Privatization
Sale of BLC - Edmond de Rothschild andDistribution Agreement with Industrial Alliance
2003
2004
2005

3
Highlights 2005 versus 2004
Performance Measure12 Months Period Ended
October 31, 20042005
12 Months Period Ended October 31, 2005
Actual Annual Target Actual
Return on Equity 7.8%
(6.4% from continuing operations)
Earnings per Share $2.26
($1.85 from continuing operations)
Total Revenue $466M $480M to $490M $502M
Efficiency Ratio 79.3% 79% to 77.5% 76.1%
Capital Ratios
- Tier 1 10.5% Min of 9.5% 10.2%
- Total 14.0% Min of 13.0% 12.3%
Credit Quality (PCL Ratio) 1 0.24% 0.25% to 0.22% 0.24%
4.5% to 5.5%
$1.30 to $1.60
4.6%
$1.33
(1) PCL ratio is calculated over Average Assets
4
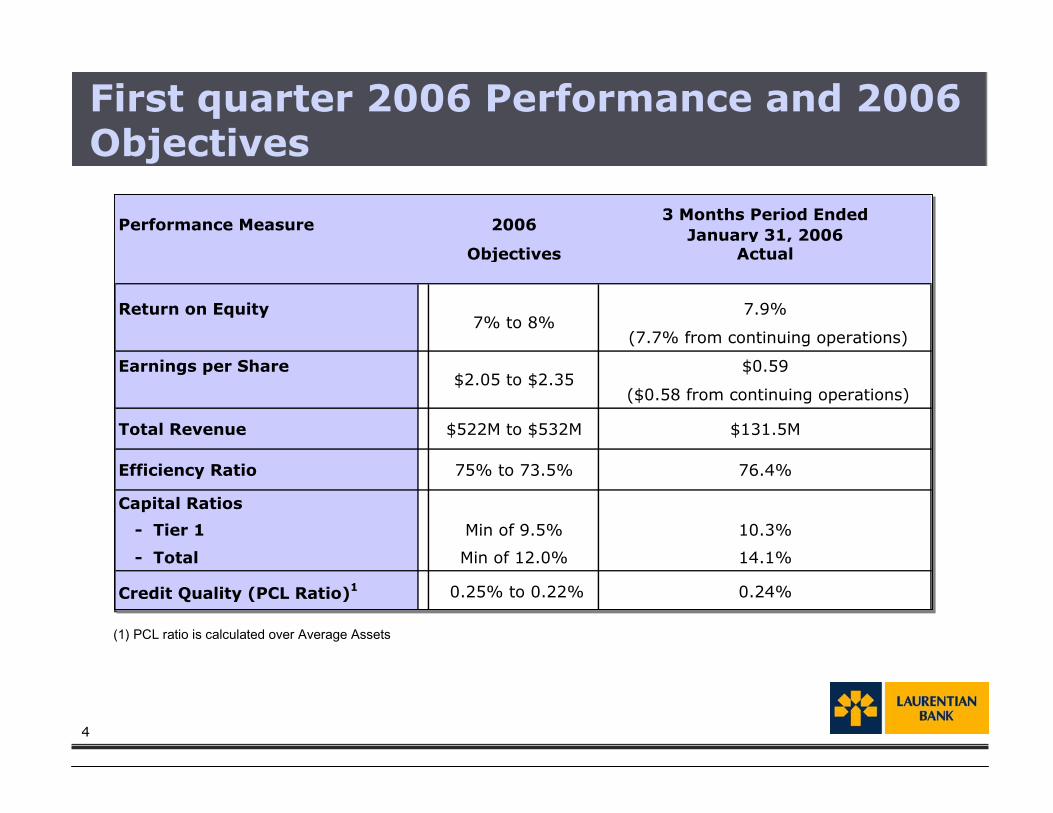
First quarter 2006 Performance and 2006Objectives
(1) PCL ratio is calculated over Average Assets
Performance Measure 20063 Months Period Ended
January 31, 2006Objectives Actual
Return on Equity 7.9%
(7.7% from continuing operations)
Earnings per Share $0.59
($0.58 from continuing operations)
Total Revenue $522M to $532M $131.5M
Efficiency Ratio 75% to 73.5% 76.4%
Capital Ratios
- Tier 1 Min of 9.5% 10.3%
- Total Min of 12.0% 14.1%
Credit Quality (PCL Ratio)1 0.25% to 0.22% 0.24%
7% to 8%
$2.05 to $2.35

5
For P&C NIM:Includes Retail & Commercial Services but not B2B Trust and is calculated on average assetsExcluding Scotia (reported numbers only based on average earnings assets)Excluding TD (only P&C average loans available)
Bank’s NIM Major Improvement
P&C Net Interest Margin
3.08%3.12%3.00%
2.46%2.51%2.77%2.80%2.87%
3.05%3.08%
2002 2003 2004 2005 Q1 06
Net Interest Margin
2.10%
1.82% 1.81%
1.99%
1.64%
2.00%1.89%
1.59%1.72%
1.85%
2002 2003 2004 2005 Q1 06
LBC
Avg 6BKS
LBC
Avg 4BKS

6
Efficiency Ratio Evolution
$592 M $622 M
$466 M$502 M
$407 M$370 M
$442 M$382 M
68.8%71.0%
79.3%76.1%
$0
$200
$400
$600
$800
2002 2003 2004 2005 2006E30%35%40%45%50%55%60%65%70%75%80%
Total Revenue Non-Interest Expenses Efficiency ratio
Sale of Ontario Branches
Target for 2006: 75% to 73.5%
Target for 2006: $522M to $532M
.

7
Gross and net impaired loans have evolved as follows:
Credit Quality
Impaired Loans(in millions of $)
227185
127 121 122
9 22
-13 -9 -3
2002 2003 2004 2005 Q1 06
Gross impaired loans Net impaired loans

8
Provision for Credit Losses
in millions of $ 2002 2003 2004 2005 Q1 06
Personal loans 23.2 26.3 25.6 25.1 6.6Residential mortgage loans 2.9 1.2 1.7 0.6 0.1Commercial mortgage loans 2.6 1.6 3.1 1.6 0.4Commercial and other loans 82.3 28.9 21.6 12.7 2.9Total - Provision for credit losses 111.0 58.0 52.0 40.0 10.0Reversal of general allowances 0.0 4.0 12.0 0.0 0Net losses 111.0 54.0 40.0 40.0 10.0

9
In January 2006, theBank issued $150M4,9% subordinateddebentures maturing inJanuary 2016
Strong Capital Ratios
As of January 31st, 2006
in % Rank
TD 11.9% 1stScotia 10.8% 2 nd
BMO 10.4% 3rd
LBC 10.3% 4th
RBC 9.5% 5th
NBC 9.5% 5th
CIBC 9.0% 6th
Aver. Big 6 10.2%
Tier 1 Capital Ratio As of January 31st, 2006
in % Rank
Scotia 9.0% 1stTD 8.8% 2 nd
BMO 8.1% 3rd
LBC 7.6% 4th
NBC 7.4% 5th
RBC 7.2% 6th
CIBC 6.5% 7th
Aver. Big 6 7.8%
Tangible Common Equity as a % of RWA
As of January 31st, 2006
in % Rank
LBC 14.1% 1stTD 13.8% 2 nd
CIBC 13.1% 3rd
Scotia 12.8% 4th
RBC 12.8% 4th
NBC 12.7% 5th
BMO 11.8% 6th
Aver. Big 6 12.8%
Total Capital Ratio

11
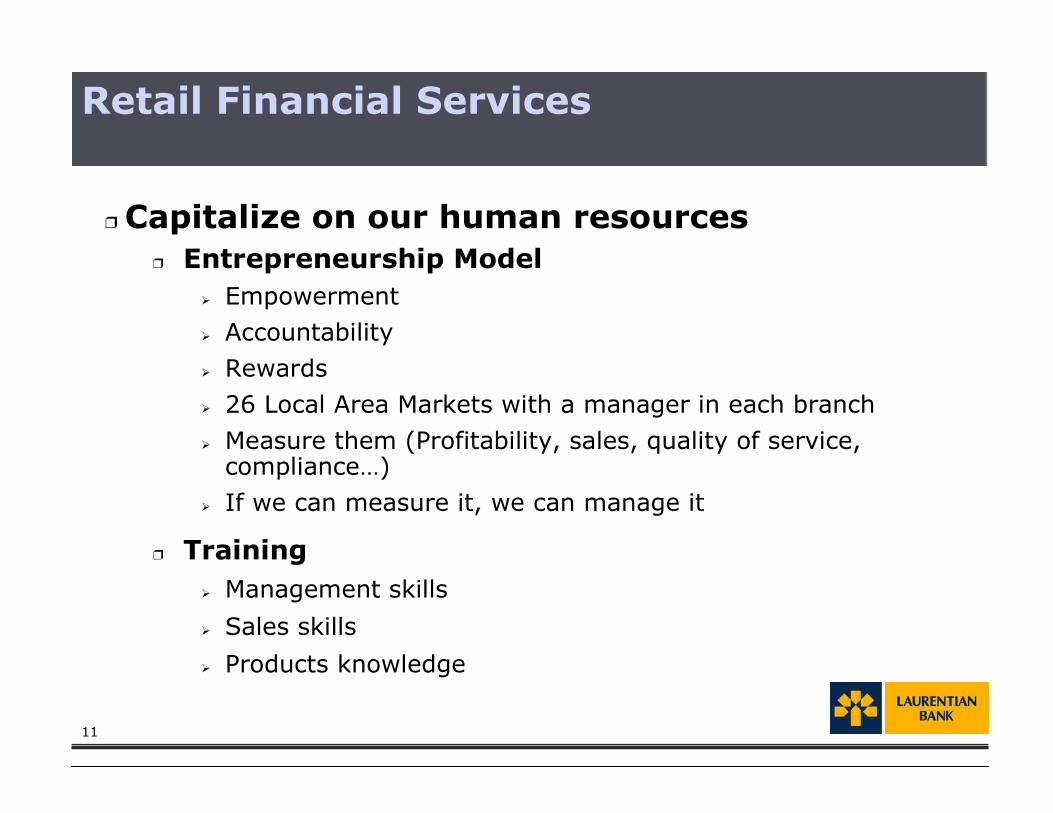
� Entrepreneurship Model� Empowerment� Accountability� Rewards� 26 Local Area Markets with a manager in each branch
� Measure them (Profitability, sales, quality of service,compliance…)
� If we can measure it, we can manage it
� Training� Management skills
� Sales skills
� Products knowledge
� Capitalize on our human resources
Retail Financial Services

12
� Increase the share of wallet of our customersFor the past 3 years, we have put in place a robust analytical CRMenvironment in order to better understand our customers andincrease the share of wallet …… and making sure that we are the main financial institution for ourcustomers day-to-day banking transactions
Product Penetration Increase among Customer Base
Credit Insurance VISA Card Personal Line ofCredit
+5.3%
+10.3% +10.4%
January 2006 versus October 2004
Retail Financial Services
Checking Accounts Net Growth Quebec Retail Branches
-15000
-10000
-5000
0
5000
10000
15000
2003 2004 2005

13
� Acquire new customers
In 2005:� Optimization of the Branch and ABMs Network is a continuous ongoing
process� Branch openings: opened 8 new branches with the Financial Services
Boutiques concept since November 2004� 15 major branch renovations and 2 branch relocations
� 20 new ABMs� Laurentian’s Bank Complicité Program
� Offered exclusively to the 550,000 FTQ members and their families
And during 2006:� Optimization of the Branch and ABMs Network is a continuous ongoing
process� 6 branch relocations� At least 10 new ABMs� 1 new branch opening� 2 major branch renovations� Signage change in 80% of our branches
Retail Financial Services

14
Loans and Credit Cards
In 2006, year-to-dateresults indicate that weare ahead of 2005 for the3 products.
Build the Laurentian Bank brand by differentiatingourselves
Mortgage Loans Volume Growth
3% 4%8%
2003 2004 2005
Line of Credit Volume Growth
21%
12%
6%
2003 2004 2005
Retail Financial Services
VISA Card Volume Growth
-1.52%
1.59%5.89%
2003 2004 2005
15
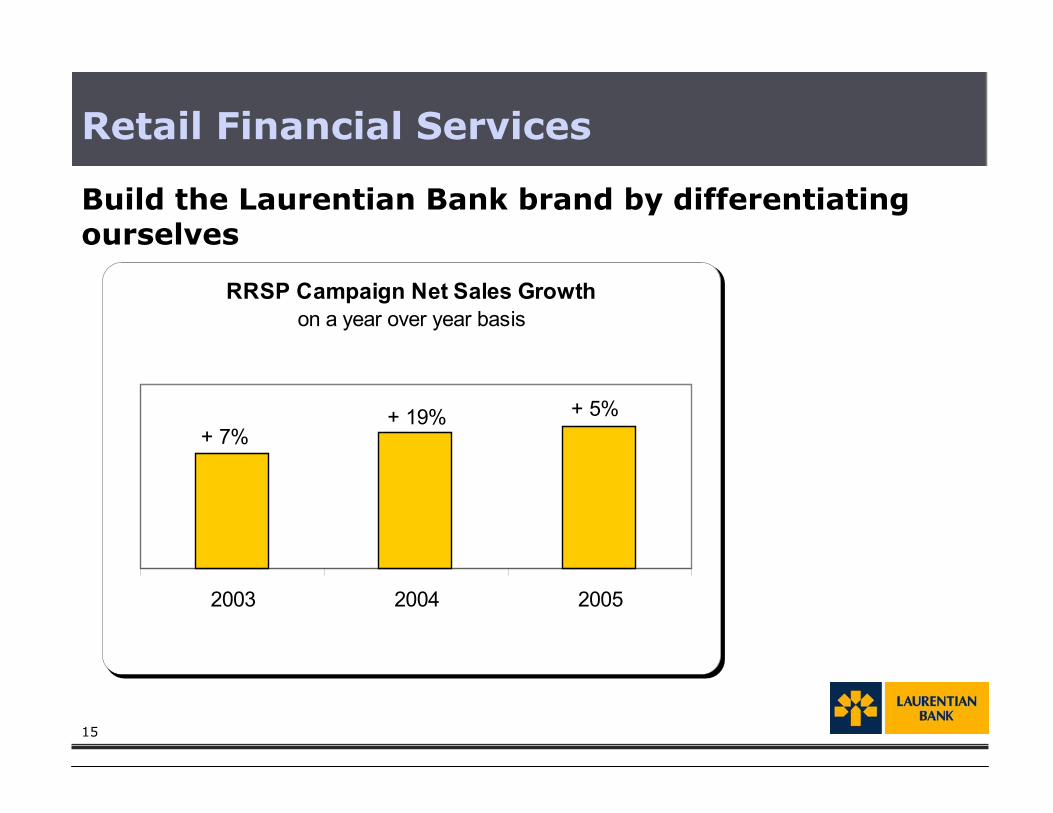
Build the Laurentian Bank brand by differentiatingourselves
Retail Financial Services
RRSP Campaign Net Sales Growthon a year over year basis
2003 2004 2005
+ 19%+ 7%
+ 5%
16
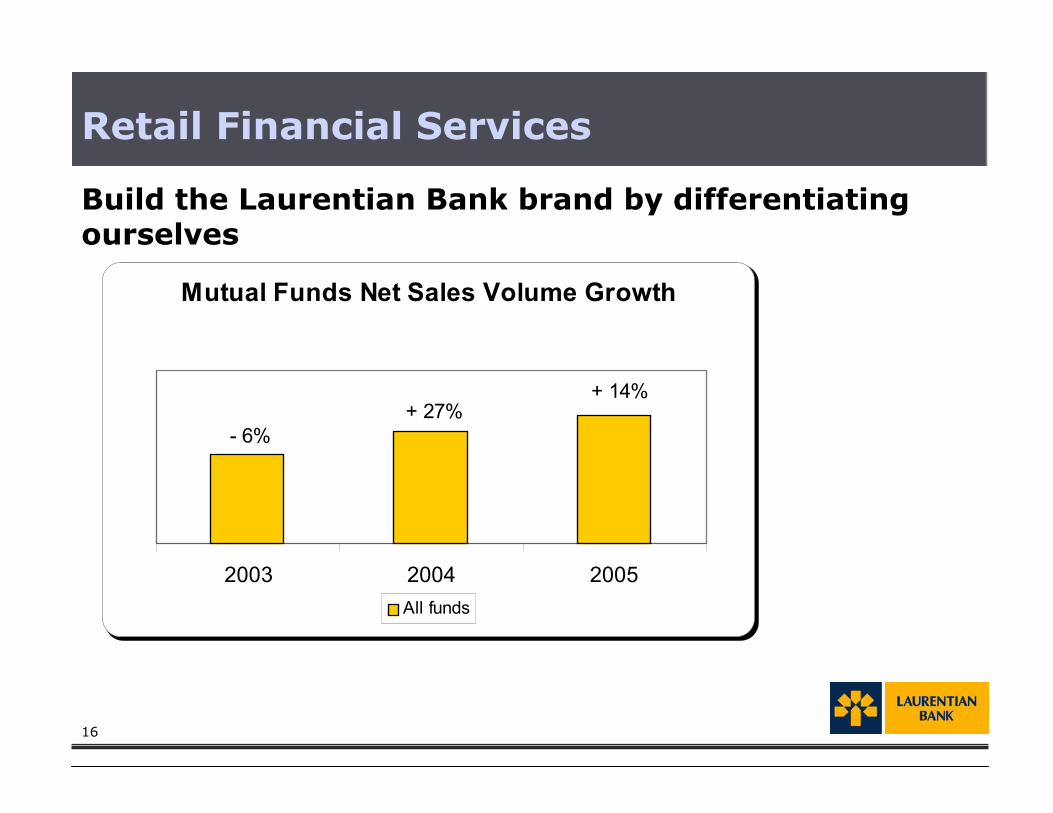
Build the Laurentian Bank brand by differentiatingourselves
Retail Financial Services
Mutual Funds Net Sales Volume Growth
2003 2004 2005All funds
+ 14%+ 27%
- 6%


18
2005 was the turnaroundStrategic moves to reduce risk AND actions to improve our
offering� Corporate Lending withdrawal is over� Reduce group and single name exposure� Reduce concentration limits� Improve underwriting and account follow-up� Regroup the SME offering in Quebec under one umbrella
Concentrating on our core activities� Focus on relationship approach instead of asset based approach� Real Estate is growing with new term lending offering� Mid-Market has stabilized� Farm Lending continues to grow� Sale of Brome Financial Corporation
Commercial Financial Services

19
We are seeing the results of our efforts
Growth based on average assets, except for Real Estate which is based on year-end balances
(1) Mid-Market Quebec: excluding micro business and corporate assets
Commercial Financial Services
Asset Growth
Farm lendingMid-Market Quebec 1
Real estateMid-Market Ontario
2004 2005
5%
- 6%
5%
- 12%
- 4%
6%
- 1%
10%

20
Priorities for 2006
� Develop synergies between business segments
� Further develop commercial mortgage securitizationactivities
� Continue to grow the small and medium sizedbusiness sector, as well as agriculture by loandevelopment activities
� Improve our product and service offering
Commercial Financial Services


22
2005 and first quarter of 2006
� Improved product offering
� New distribution agreements with new partners
� EASE platform improvement
� Straight-through RSP loan processingimplementation
B2B Trust deals with more than 14,000 financialprofessionals and has more than 40 distributionalliances for investment loans, RSP loans and bankingproducts
B2B Trust

23
Main portfolios are growing
2005 versus 2004
Portfolios Growth
Brokereddeposits
Brokeredmortgages
Lines ofcredit
Investmentloans
+ 2%
+ 5%
+ 10%
+ 12%
B2B Trust

24
Priorities for 2006
� Focus on primary markets
� 5 core distribution channels: mutual fundindustry, insurance industry, investmentindustry, mortgage brokerage and depositbrokerage
� Build a solid organizational foundation
� Sell by cultivating organic growth within highestprofit categories
� Evaluate new market opportunities
B2B Trust

26
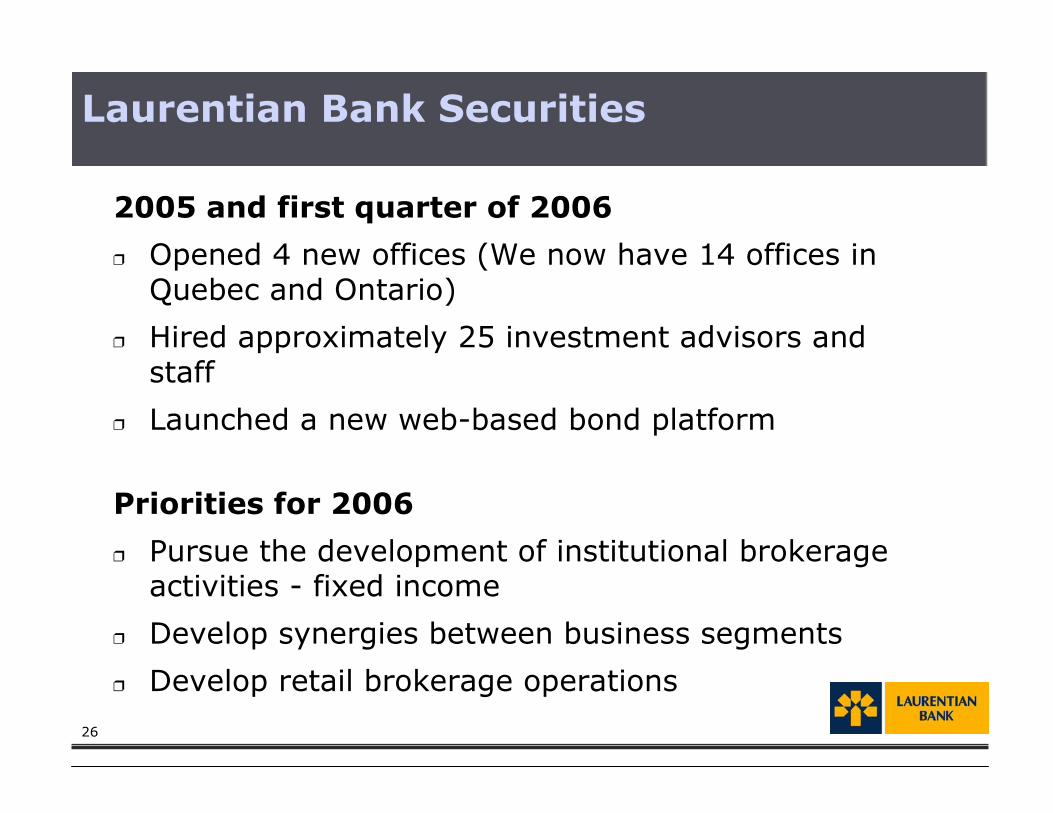
2005 and first quarter of 2006
� Opened 4 new offices (We now have 14 offices inQuebec and Ontario)
� Hired approximately 25 investment advisors andstaff
� Launched a new web-based bond platform
Priorities for 2006
� Pursue the development of institutional brokerageactivities - fixed income
� Develop synergies between business segments
� Develop retail brokerage operations
Laurentian Bank Securities
27
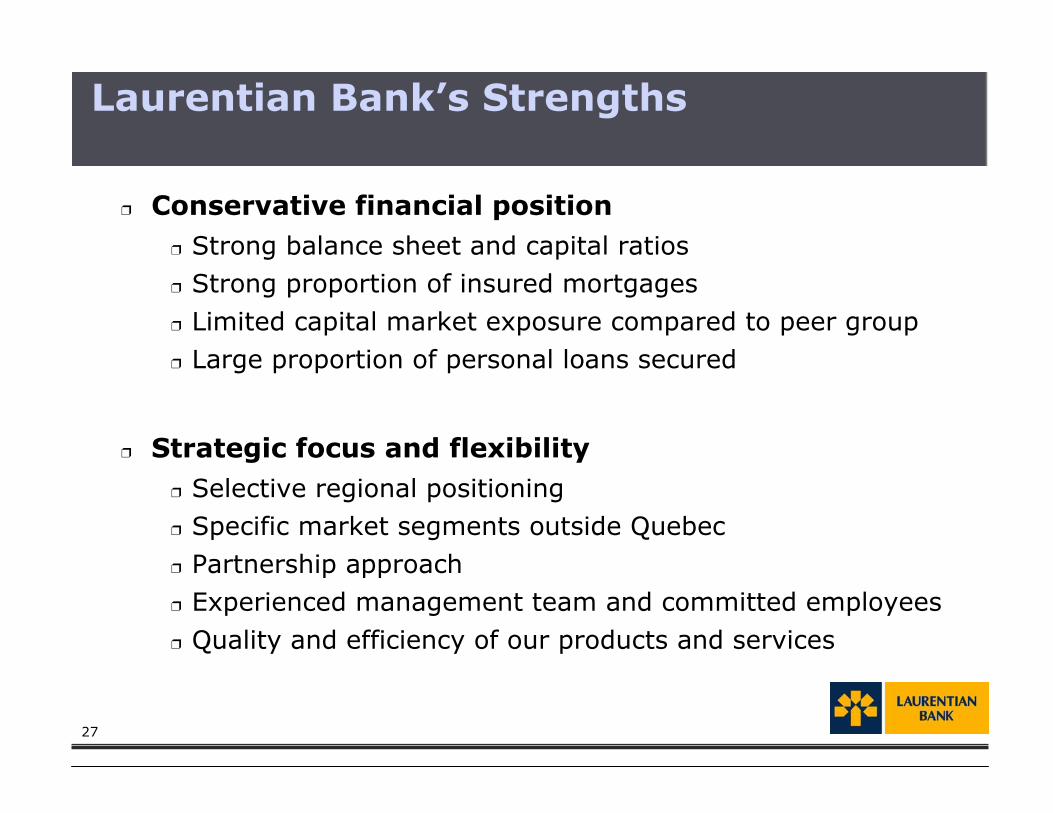
Laurentian Bank’s Strengths
� Conservative financial position� Strong balance sheet and capital ratios� Strong proportion of insured mortgages� Limited capital market exposure compared to peer group� Large proportion of personal loans secured
� Strategic focus and flexibility� Selective regional positioning� Specific market segments outside Quebec� Partnership approach� Experienced management team and committed employees� Quality and efficiency of our products and services
28
Conclusion
� Employees are committed and have fullybought into the plan
� A very focused strategy has proven tobe effective and we intend to continueto build on our accomplishments
� The Bank is being managed in aconservative manner with a long termvision

29
This presentation and related communications may contain forward-looking statements, includingstatements regarding the business and anticipated financial performance of Laurentian Bank. Theseforward looking-statements include, among others, statements regarding the business and objectivesfor the coming years, medium- and long-term strategies to achieve these objectives and statementswith respect to the Bank’s beliefs, plans, expectations, anticipations, estimates and intentions. Thesestatements typically use the conditional and words such as prospects, believe, estimate, forecast,project, should, could and would. By their very nature, forward-looking statements involve inherent risksand uncertainties, and it is possible that the forecasts, projections and other forward-looking statementswill not be achieved. The Bank cautions readers against placing undue reliance on these statementswhen making decisions, as the actual results could differ appreciably from the opinions, plans,objectives, expectations, forecasts, estimates and intentions expressed in such forward-lookingstatements due to various material factors. These factors include, among other things, capital marketactivity, changes in government monetary, economic and fiscal policies, changes in interest rates,inflation levels and general economic conditions, legislative and regulatory developments, competition,credit ratings, scarcity of human resource and technological change, as well as the Bank’s success atincreasing revenues and managing costs related to carrying out its business plan. The Bank cautionsthat the foregoing list of factors is not exhaustive. The Bank does not undertake to update any forward-looking statements, oral or written, made by itself or on its behalf.
For questions on this presentation, please contact:Gladys Caron, Vice-President, Public Affairs, Communications and Investor RelationsTel: (514) 284-4500, extension 7511Cel: (514) [email protected]
Forward Looking Statements

30

31
Laurentian Bank: an Overview
� Founded in 1846� 3rd largest financial institution in Quebec in terms of
number of branches� 7th largest Canadian Schedule 1 chartered bank� Balance sheet assets: $16.7 billion (as of January 31, 2006)
� Assets under administration: $14.8 billion (as of January 31,2006)
� Number of branches: 157� Number of full-time equivalent employees: 3,256

32
Raymond McManusPresident andChief Executive Officer�CEO at Laurentian Bank since 2002 and a
member of the Board of Directors since 1988
Robert CardinalSenior executive Vice-PresidentFinance, Administration and StrategicDevelopment and Chief Financial Officer�At Laurentian Bank since 1991
Réjean RobitailleSenior executive Vice-PresidentRetail and Commercial Financial Services�At Laurentian Bank since 1988
André ScottExecutive Vice-PresidentCommercial Financial Services�At Laurentian Bank since 1991
Lorraine PilonExecutive Vice-PresidentCorporate Affairs and HumanResources, and Secretary�At Laurentian Bank since 1990
Bernard PichéSenior Executive Vice-PresidentTreasury, Capital Markets and Brokerage�At Laurentian Bank since 1994
Management Committee

33
Laurentian Bank’s vision is to becomethe undisputed #3 banking institutionin Quebec and a performing player inspecific market segments elsewhere inCanada
Laurentian Bank’ Vision

34
� Laurentian Bank’s main market is Quebec
� With 157 retail, 20 commercial and 14 brokeragebranches, Quebec is LBC’s main market. All ourbusiness lines are active in this market.
� A performing player across Canada
� In the sectors and markets in which LBC excels and hasa competitive edge, that is B2B Trust, CommercialFinancial Services and our indirect points-of-salenetwork, Laurentian Bank Securities as well asmortgages and deposits through brokers.
�36% of LBC’s total loans are outside Quebec (as ofOctober 31st, 2005)
A Clear Geographical and Business Focus
35
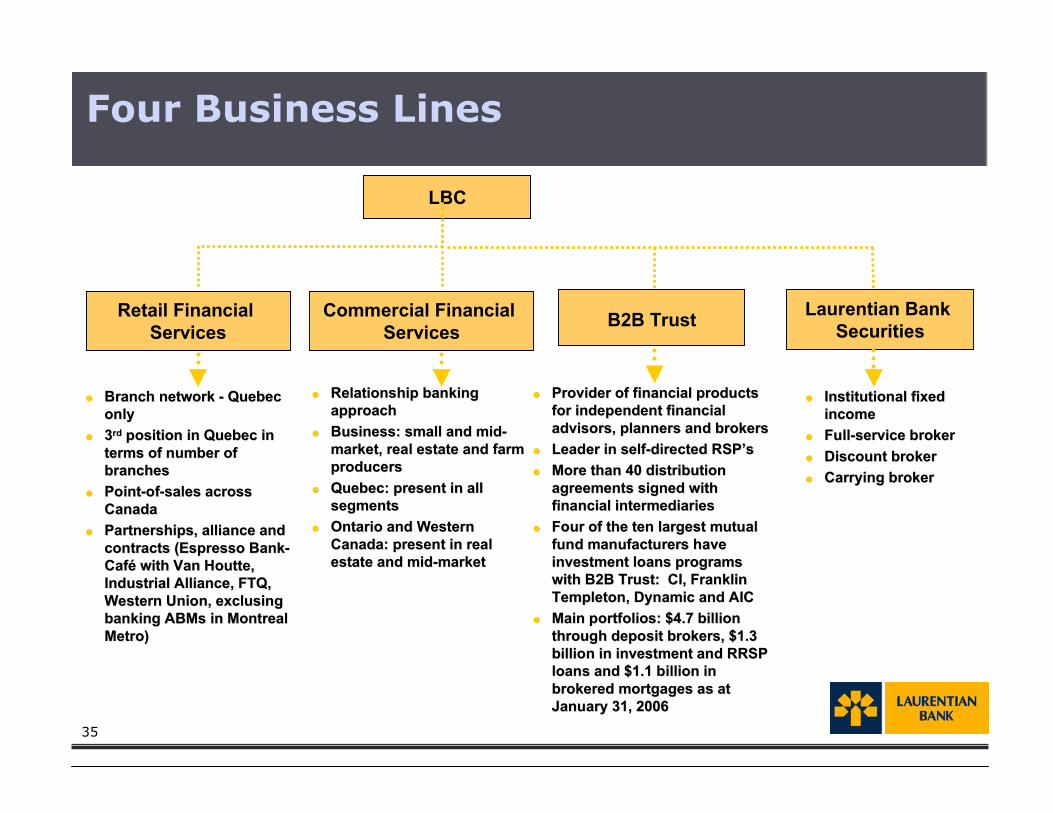
Four Business Lines
LBCLBC
Retail Financial Services
Retail Financial Services B2B TrustB2B TrustCommercial Financial
ServicesCommercial Financial
Services
�� Provider of financial productsProvider of financial productsfor independent financialfor independent financialadvisors, planners and brokersadvisors, planners and brokers
�� Leader in self-directed Leader in self-directed RSP’sRSP’s�� More than 40 distributionMore than 40 distribution
agreements signed withagreements signed withfinancial intermediariesfinancial intermediaries
�� Four of the ten largest mutualFour of the ten largest mutualfund manufacturers havefund manufacturers haveinvestment loans programsinvestment loans programswith B2B Trust: CI, Franklinwith B2B Trust: CI, FranklinTempletonTempleton, Dynamic and AIC, Dynamic and AIC
�� Main portfolios: $4.7 billionMain portfolios: $4.7 billionthrough deposit brokers, $1.3through deposit brokers, $1.3billion in investment and RRSPbillion in investment and RRSPloans and $1.1 billion inloans and $1.1 billion inbrokered mortgages as atbrokered mortgages as atJanuary 31, 2006January 31, 2006
�� Relationship bankingRelationship bankingapproachapproach
�� Business: small and mid-Business: small and mid-market, real estate and farmmarket, real estate and farmproducersproducers
�� QueQuebecbec: present in all: present in allsegmentssegments
�� Ontario and WesternOntario and WesternCanada:Canada: present in present in realrealestate and mid-marketestate and mid-market
�� Branch network - QuebecBranch network - Quebeconlyonly
�� 33rdrd position in position in QueQuebecbec in interms of number ofterms of number ofbranchesbranches
�� Point-of-sales acrossPoint-of-sales acrossCanadaCanada
�� Partnerships, alliance andPartnerships, alliance andcontracts (Espresso Bank-contracts (Espresso Bank-CafCaféé with Van with Van HoutteHoutte,,Industrial Alliance, FTQ,Industrial Alliance, FTQ,Western Union, Western Union, exclusingexclusingbanking ABMs in Montrealbanking ABMs in MontrealMetro)Metro)
Laurentian Bank Securities
Laurentian Bank Securities
�� Institutional fixedInstitutional fixedincomeincome
�� Full-service brokerFull-service broker�� Discount brokerDiscount broker�� Carrying brokerCarrying broker

36
Loan Portfolio Mix
At October 31st, 2005, 36% of our loan portfolio were originated from outside ofQuebec.
Our loan portfolio is diversified geographically and by loan types.
Loan Porfolio As of January 31, 2006
Personal Loans33%
Residential Mortgages
48%
Commercial Mortgages
5%
Commercial Loans and
BA's14%
Diversification of Loan Portfolio

37
Retail Financial Services Performance
Totalrevenue
Q1 06
Netincome
Q4 05
Q1 05 Q4 05
� Over the same period last year, average assets rose by 7% (Q1 2006vs Q1 2005)
� Net income was impacted by higher non-interest expense;variablecompensation as well as additional advertising and businessdevelopment activities
Q1 05
Per Year Per quarter
2004 2005
Q1 0620052004
Per quarterPer Year 2003
Total revenue as a % of avg assets
2003
2003
2004 2005 Q1 05 Q4 05 Q1 06
Per quarterPer Year
� In Q1 2006, 4% rise in totalrevenue over Q1 2005 comingmainly from higher average loanvolume which grew by $540Mfrom Q1 2005 to Q1 2006
8 7 .48 3 .7
3 4 0 .13 1 9 .4
3 6 9 .4
8 7 .8
13 .016 .822 .2
34 .5
8 .1 6 .5
4 .3 2 %4 .4 3 %4 .3 6 %
3 .3 6 %
4 .4 5 % 4 .4 0 %

38
Commercial Financial Services Performance
Totalrevenue
Q1 06
Netincome
� Sale of 51% stake in Brome Financial Corporation
� Lower provisions for credit losses more than offset higher non-interest expenses
� Average assets rose slightly over Q1 2005
Q1 05 Q4 05
Total revenue as a % of avg assets
2005 20042003
Q1 06 Q4 05Q1 05200520042003
3.80%3.85%
3.44%
3.76%3.84% 3.85%
Per quarterPer Year
Q1 06 Q4 05 Q1 05 2005 20042003
Per quarterPer Year
21.6
92.6 89.2 85.3
21.4 21.9
Per quarterPer Year
� Total revenue slightlyincreased in Q1 2006 versusQ1 2005 even as we reduceour corporate lending portfolioover the same period5.65.0
21.524.4
20.8
4.1

39
Commercial Financial Services
� Real Estate continues toperform very well
� Small and mid-marketcurrent accounts anddemand deposit baseare growing
� Farm lending groupcontinues to grow asaverage asset rose by12% since last year
Geographical Distribution - Q1-2006
Relative ContributionJanuary 31, 2006
Québec Ontario Western Cda
Real Estate 33% 55% 12%
Mid-Market 60% 40% -
Agriculture 100% - -
Corporate lending was transferred to treasury in Q1-2005
% of Net Income
Efficiency Ratio
Avg Assets
($M)
PCL (%)2
Real Estate 52% 30.3% 987 0.13%
Mid-Market Quebec1 17% 47.1% 573 0.44%
Mid-Market Ontario 28% 29.2% 460 0.61%
Agriculture 3% 60.3% 161 0.13%(1) Excludes small business lending and corporate lending
(2) PCL as of % of business lines average assets

40
B2B Trust Performance
Totalrevenue
Netincome
� Total revenue went up by 10% overQ1 2005 coming from higherinvestment loans, mortgages loansand deposits volume as well ashigher net interest margins
Total revenue as a % of avg assets
� Net income rose by 12% over the same quarter last year as higher totalrevenue more than offset higher PCLs and non-interest expenses
� In Q1 2006, average assets grew by 9% versus Q1 2005
Per Year Per quarter
2003 2004 2005 Q1 05 Q4 05 Q1 062003 2004 2005 Q1 05 Q4 05 Q1 06
2003 2004 2005 Q1 05 Q4 05 Q1 06
Per Year Per quarter
Per quarterPer Year
20.919.0
77.663.762.5
20.1
5.211.0 12.5
19.1
4.9 5.5
3.21%3.17%2.75%
2.37%
3.19% 3.16%

41
Laurentian Bank Securities Performance
TotalRevenue
NetIncome
� In Q1 2006, total revenueremain stable versus Q1 2005(excluding BLC-EdR)
� Net income decreased over thesame period due to higherdevelopment expenses
� LBS opened 2 new offices inQuebec during Q1 2006 withone in Chicoutimi and anotherone in Saint-Hyacinthe
� In Q1 2006, AUM have increasedby 9% for the full servicebrokerage and 20% for thediscount sector over Q4 2005
2004
Excluding a gain of $8.5M before taxes on the sale of TSX shares for2003
Excluding a $6.7M after-tax gain on the sale of TSX shares for 2003
Q1 05
RetailBrokerage
Q4 05 Q1 06 2005
Per Year Per quarter
Per Year Per quarter
2003
6 .05 .3
1 8 .22 1 .7 2 1 .6
5 .3
1.10 .8
2.2
4.13 .4
0 .7
Q1 06 Q4 05 Q1 05 2005 20042003
Full Service Discount
Q1 06 1,576 94 61
2005 1,440 78 50
2004 1,297 67 42
Assets under Management ($M)
# Financial Advisors

42
RETAIL FINANCIAL SERVICES REGIONS
Branch network Quebec
Mortgage through brokers Across Canada
Mortgage through builders Quebec
Point-of-sale financing Across Canada
VISA Across Canada
Deposit through brokers Across Canada
Small business Quebec
COMMERCIAL FINANCIAL SERVICES REGIONS
Commercial services Quebec and Ontario
Corporate lending Across Canada
Real estate lending Major citiesacross Canada
Farm lending Quebec
LAURENTIAN BANK SECURITIES REGIONS
Discount
Quebec, Ontario andBritish Colombia
B2B TRUSTAcross Canada
Highlights:
� 36% of total loans areoutside Quebec (as ofOctober 31, 2005)
As of January 31, 2006:
� 3,593 point of sales
� 157 branches
� more than 14,000independent advisors
Full Service
Quebec and Ontario
Institutional fixed income offering Across Canada
Distribution Network across Canada

43
$0.76 $0.76$0.90 $0.92 $0.92 $0.94
$1.06$1.16 $1.16 $1.16 $1.16
1995 1996 1997 1998 1999 2000 2001 2002 2003 2004 2005
Historical Dividend per Year


