+ All Categories
Home > Documents > Historical statistics of the United States, Colonial Times ...

Historical statistics of the United States, Colonial Times ...

Date post: 29-Nov-2021
Category:
Upload: others
View: 1 times
Download: 0 times
Share this document with a friend
32
chapter Z Colonial Statistics Z 1-405. General note. It would have been possible to distribute these series for the colonial period among the chapters covering each of the appropriate subject fields. It was felt, however, that a sepa rate chapter especially organized to cover this period would be more valuable in itself and would also provide a more suitable, less-exacting context for the statistics, many of which are rela tively roughhewn. In the past, statistics for the colonial period were largely dependent on compilations made during the 17th and 18th centuries by historians such as Whitworth and Macpherson. Present-day scholars, however, no longer solely rely upon such compilations. They are ferreting out statistical information from original records hitherto left unused in archives and reconstructing statistical series of their own from other sources. Only five of the tables presented here might be said to be old standbys. Twenty-two are the work of modern scholars, half reprinted as originally published, and half supplemented by reference to other data. Of those which never before have appeared in print, Stella H. Sutherland compiled series Z 1-19; Jacob M. Price, series Z 223-237 and part of series Z 238-240; J. R. House, series Z 267-273; Austin White, series Z 388-405; and Lawrence A. Harper (assisted by graduate students), the remainder. The Public Records Office in London (sometimes hereafter abbreviated PRO) contains many collections of records which throw light on commerce between England and the colonies and to some extent on the development of agriculture and man ufacturing in the colonies, particularly when considered with reference to the mercantilist laws passed by the mother coun try, as has been done here. The laws in question are cited at various points in the text below by reference to' their regnal year and chapter numbersfor example, 5 Geo. II c 22 (the fifth year of the reign of King George II, chapter 22). The collections in the Public Records Office in London, which are the original sources for much of the data presented here, are identified there by title and call numbers. For example, one collection is titled "American Inspector General's Ledgers" and is further identified as "PRO Customs 16/1." The most important of these collections or ledgers of imports and ex ports are the following: The English Inspector General's Ledgers (PRO Customs 3) ; the Scottish Inspector General's Ledgers (PRO Customs 14); the American Inspector General's Ledgers (PRO Customs 16/1) ; and the colonial naval office lists (usually found in C. 0. 5). The English, Scottish, and American Inspector Generals' Ledgers are conveniently arranged for statistical purposes, but are so voluminous that it is far more convenient to utilize contemporary tabulations drawn from them when such sec ondary sources are available. The lists kept by the naval officers of that period (for the purpose of helping to enforce the navigation laws) merely provide chronological data concern ing the ships which entered and cleared port, together with their cargoes and destinations. The task of using the naval office lists has in some instances been lightened by colonial newspapers, such as the South Caro lina Gazette, which published data taken from customhouse records. Also of general assistance in the preparation of many series presented in this chapter are the compilations from naval office lists prepared by a Works Progress Administra tion project conducted at the University of California, entitled "Trade and Commerce of the English Colonies in America," and referred to below as WPA compilations. Z 1-19. Estimated population of American Colonies, 1610- 1780. Source: Compiled by Stella H. Sutherland, Oakland City Col lege, Oakland City, Indiana, chiefly from the following sources: B. J. Brawley, A Short History of the American Negro, Mac- Millan, 1913; Elizabeth Donnan (editor), Documents Illustrative of the History of the Slave Trade to America, 4 vols., Carnegie Institution of Washington, D.C., 1930-35; Evarts B. Greene and Virginia D. Harrington, American Population Before the Feder al Census of 1790, Columbia University Press, New York, 1932; Stella H. Sutherland, Population Distribution in Colonial Amer ica, Columbia University Press, New York, 1936; E. R. Turner, "The Negro in Pennsylvania," Prize Essays of the American Historical Association, Washington, D.C., 1911; Bureau of the Census, A Century of Population Growth, 1909; Thomas J. Wertenbaker, The Planters of Colonial Virginia, Princeton, 1922; and George W. Williams, The History of the Negro Race in America From 1619 to 1880, 2 vols., New York, 1883. (Also, a wide variety of source material was consulted for general information.) The original data were obtained from the reports of the colonial officials to the Lords Commissioners of Trade and Plantations. Not infrequently a census supplied sworn evi dence of the number of inhabitants; for other reports, the militia or the tax lists or both were used, commonly accom panied by an estimate of the whole population as indicated by the rolls or lists. Estimates made by colonial officials and by other informed contemporaries who did not disclose the figures upon which their conclusions were based have occasion ally been included in these series. However, such estimates were selected in accordance with the general pattern of popula tion growth. The ratio of the militia to the whole population was generally 1 to 5%, but there were many exceptions. In Massachusetts, it was 1 to 6 in 1751 and 1 to 4 in 1763; in Connecticut, 1 to 6 in 1722 and 1756 and 1 to 7 in 1749, 1761, and 1774; it was 1 to 6 in Virginia and 1 to 7 in South Carolina at various times. No generalization can safely be made as to the ratio borne by the northern polls and ratables and by the southern taxables and tithables to the whole population of the Colonies. In every Province the figure was different. In the North, it ranged from 1 to 4 to 1 to 5% ; in Pennsylvania, it was 1 to 7 in the 1750's, but 1 to 5.8 was the more common figure; in Maryland and Virginia, where both male and female slaves appeared on the tax lists, the ratio was 1 to 3 or 3.5 in the 17th century and 1 to 2.4 or 2.6 in the 18th century. The North Carolina white taxables were multiplied by 4 and the Negro taxables by 2. The figures for Negroes for the 17th century, which are doubtlessly too low, are largely estimates based upon references 486910 O - 60 - 49 743
Transcript

chapter Z

Colonial Statistics

Z 1-405. General note.

It would have been possible to distribute these series for

the colonial period among the chapters covering each of the

appropriate subject fields. It was felt, however, that a sepa

rate chapter especially organized to cover this period would be

more valuable in itself and would also provide a more suitable,

less-exacting context for the statistics, many of which are rela

tively roughhewn.

In the past, statistics for the colonial period were largely

dependent on compilations made during the 17th and 18th

centuries by historians such as Whitworth and Macpherson.

Present-day scholars, however, no longer solely rely upon such

compilations. They are ferreting out statistical information

from original records hitherto left unused in archives and

reconstructing statistical series of their own from other sources.

Only five of the tables presented here might be said to be

old standbys. Twenty-two are the work of modern scholars,

half reprinted as originally published, and half supplemented

by reference to other data.

Of those which never before have appeared in print, Stella

H. Sutherland compiled series Z 1-19; Jacob M. Price, series

Z 223-237 and part of series Z 238-240; J. R. House, series

Z 267-273; Austin White, series Z 388-405; and Lawrence A.

Harper (assisted by graduate students), the remainder.

The Public Records Office in London (sometimes hereafter

abbreviated PRO) contains many collections of records which

throw light on commerce between England and the colonies and

to some extent on the development of agriculture and man

ufacturing in the colonies, particularly when considered with

reference to the mercantilist laws passed by the mother coun

try, as has been done here. The laws in question are cited

at various points in the text below by reference to' their

regnal year and chapter numbers—for example, 5 Geo. II

c 22 (the fifth year of the reign of King George II, chapter 22).

The collections in the Public Records Office in London, which

are the original sources for much of the data presented here,

are identified there by title and call numbers. For example,

one collection is titled "American Inspector General's Ledgers"

and is further identified as "PRO Customs 16/1." The most

important of these collections or ledgers of imports and ex

ports are the following: The English Inspector General's

Ledgers (PRO Customs 3) ; the Scottish Inspector General's

Ledgers (PRO Customs 14); the American Inspector General's

Ledgers (PRO Customs 16/1) ; and the colonial naval office

lists (usually found in C. 0. 5).

The English, Scottish, and American Inspector Generals'

Ledgers are conveniently arranged for statistical purposes, but

are so voluminous that it is far more convenient to utilize

contemporary tabulations drawn from them when such sec

ondary sources are available. The lists kept by the naval

officers of that period (for the purpose of helping to enforce

the navigation laws) merely provide chronological data concern

ing the ships which entered and cleared port, together with

their cargoes and destinations.

The task of using the naval office lists has in some instances

been lightened by colonial newspapers, such as the South Caro

lina Gazette, which published data taken from customhouse

records. Also of general assistance in the preparation of many

series presented in this chapter are the compilations from

naval office lists prepared by a Works Progress Administra

tion project conducted at the University of California, entitled

"Trade and Commerce of the English Colonies in America,"

and referred to below as WPA compilations.

Z 1-19. Estimated population of American Colonies, 1610-

1780.

Source: Compiled by Stella H. Sutherland, Oakland City Col

lege, Oakland City, Indiana, chiefly from the following sources:

B. J. Brawley, A Short History of the American Negro, Mac-

Millan, 1913; Elizabeth Donnan (editor), Documents Illustrative

of the History of the Slave Trade to America, 4 vols., Carnegie

Institution of Washington, D.C., 1930-35; Evarts B. Greene and

Virginia D. Harrington, American Population Before the Feder

al Census of 1790, Columbia University Press, New York, 1932;

Stella H. Sutherland, Population Distribution in Colonial Amer

ica, Columbia University Press, New York, 1936; E. R. Turner,

"The Negro in Pennsylvania," Prize Essays of the American

Historical Association, Washington, D.C., 1911; Bureau of the

Census, A Century of Population Growth, 1909; Thomas J.

Wertenbaker, The Planters of Colonial Virginia, Princeton,

1922; and George W. Williams, The History of the Negro Race

in America From 1619 to 1880, 2 vols., New York, 1883. (Also,

a wide variety of source material was consulted for general

information.)

The original data were obtained from the reports of the

colonial officials to the Lords Commissioners of Trade and

Plantations. Not infrequently a census supplied sworn evi

dence of the number of inhabitants; for other reports, the

militia or the tax lists or both were used, commonly accom

panied by an estimate of the whole population as indicated

by the rolls or lists. Estimates made by colonial officials and

by other informed contemporaries who did not disclose the

figures upon which their conclusions were based have occasion

ally been included in these series. However, such estimates

were selected in accordance with the general pattern of popula

tion growth.

The ratio of the militia to the whole population was generally

1 to 5%, but there were many exceptions. In Massachusetts,

it was 1 to 6 in 1751 and 1 to 4 in 1763; in Connecticut, 1

to 6 in 1722 and 1756 and 1 to 7 in 1749, 1761, and 1774;

it was 1 to 6 in Virginia and 1 to 7 in South Carolina at

various times. No generalization can safely be made as to

the ratio borne by the northern polls and ratables and by the

southern taxables and tithables to the whole population of the

Colonies. In every Province the figure was different. In the

North, it ranged from 1 to 4 to 1 to 5% ; in Pennsylvania,

it was 1 to 7 in the 1750's, but 1 to 5.8 was the more common

figure; in Maryland and Virginia, where both male and female

slaves appeared on the tax lists, the ratio was 1 to 3 or 3.5

in the 17th century and 1 to 2.4 or 2.6 in the 18th century.

The North Carolina white taxables were multiplied by 4 and

the Negro taxables by 2.

The figures for Negroes for the 17th century, which are

doubtlessly too low, are largely estimates based upon references

486910 O - 60 - 49

743

Z 20-75 COLONIAL STATISTICS

to purchase and sale, to laws governing slavery, and occasion

ally to reports of more or less exact numbers.

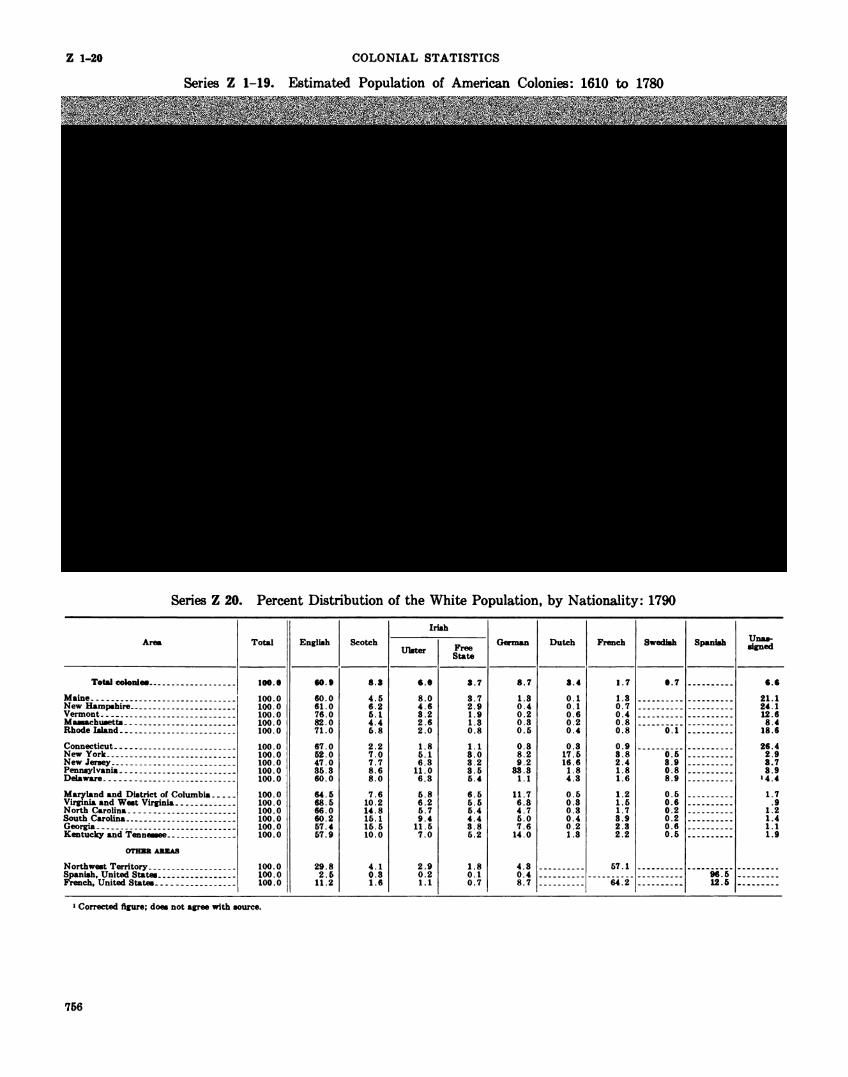
Z 20. Percent distribution of the white population, by nation

ality, 1790.

Source: American Council of Learned Societies, "Report of

Committee on Linguistic and National Stocks in the Population

of the United States" (based on studies by Howard F. Barker

and Marcus L. Hansen), Annual Report of the American His

torical Association, 1931, vol. I, Washington, D.C., 1932, p. 124.

Distribution was made primarily on the basis of family

names. For explanation of methods used, see source.

Z 21-34. Value of exports to and imports from England, by

American Colonies, 1697-1776.

Source: 1697-1773, Charles Whitworth, State of the Trade

of Great Britain in Its Imports and Exports Progressively from

the Year 1697, G. Robinson, London, 1776; 1774-1776, David

Macpherson, Annals of Commerce, Manufactures, Fisheries and

Navigation, vol. Ill, Mundell & Son, Edinburgh, 1805, pp. 564,

535, and 599.

The English Inspector General's Ledgers (Public Records

Office, London, Customs 2 and 3) provide the original source

for these figures. Unfortunately, Whitworth's erroneous title

has caused many to believe the figures relate to Britain rather

than to England but otherwise his volume has much value.

The source tables cover all countries and appear in two for

mats: One gives England's trade with any one country, an

nually; the other shows all the countries with which England

traded each year. Those interested in studying broader trends

will find value in the decennial averages in John Lord Sheffield,

Observations on the Commerce of the American States, 6th

edition, London, 1784. G. N. Clark's Guide to English Com

mercial Statistics, 1696-1782 (Royal Historical Society Guides

and Handbooks, No. 1, London, 1938) provides a valuable

history and analysis of the basic statistics and a useful ap

pendix which has a chronological list of statistical material for

1663-1783 and specifies where the data may be found.

Users of this material should note the basis on which the

values rest. Smuggling (which so often attracts greater atten

tion but which must always be considered commodity by com

modity, country by country) does not constitute a material

factor during the years under consideration. However, other

difficulties arise with respect to the question of the volume of

exports and the value of all the trade. The repeal of the

export duties on woolen manufactures in 1701 (11 W. Ill c 20)

and of the remaining export duties in 1721 (Geo. II c 15)

removed the penalty for false entries on exports, and some

merchants overstated their quantity for reasons of real or

fancied prestige—a practice which may have injected an ele

ment of error of about 4 percent (Clark, cited above, pp. 16,

27, and 35).

Another problem arose in determining the value of the

merchandise imported as well as exported. The authorities of

the early 18th century were greatly interested in the balance

of trade and at first tried to ascertain the real commercial

value of merchandise. However, the difficulties of doing so,

and the increasing recognition that there were intangible ele

ments which the records could not disclose, led to the abandon

ment of attempts to keep the values current by the end of

the second decade of the 18th century.

The so-called "official values" became stereotyped between

1705 and 1721 (Clark, cited above, pp. 17-23), a fact which

diminished their value for use in striking a balance of trade

but increased their usefulness as a rough-and-ready index of

the relative increase or decrease of the volume of trade.

See also general note for series Z 1-405.

Z 35-42. Value of exports to and imports from England by

New York, 1751-1775.

Source: Virginia D. Harrington, The New York Merchant

on the Eve of the Revolution, Columbia University Press, New

York, 1935, p. 354.

Foreign manufactures "In time" are those which could re

ceive a drawback (refund) of duties; "Out of time" are those

which could not. Outports are all ports in England other than

London.

Z 43-55. Tonnage capacity of ships and value of exports and

imports of American Colonies, by destination and origin,

1769 and 1770.

Source: David Macpherson, cited above in source for series

Z 21-34, vol. Ill, pp. 571-572.

The tonnage figures shown are those used commercially—

not those computed when the Royal Navy was purchasing

vessels (see text for series Z 56-75). The statistics given by

Macpherson are substantially the same as those given in Public

Records Office, London, Customs 16/1, except that Macpherson

put the 1769 inward-bound tonnage data for Southern Europe

in the West Indies column (and vice versa)—an error which

has been corrected here.

The value figures for 1769 provide only a rough-and-ready

index of the relationship among the different trades. Totals

include figures for the Islands of Newfoundland, Bahama, and

Bermuda (a factor which statistically makes only a minor dif

ference). These data are based on the official valuations used

in the customhouse which, according to Macpherson, consider

ably understate the true amount. This defect, however serious

for some purposes, does not destroy the value of the figures

for comparative purposes. Also, it must be remembered that

the value figures exclude the intercolonial coastwise trade

which the tonnage figures show to have been as large as any

other.

See also series Z 21-34, which provide a broader and more

representative base for studying the relative relationship of

the Thirteen Colonies' trade with England.

It should be noted that the use of these figures on volume

of the traffic for the various trades for estimating the amount

of shipping given full-time employment must allow for re

peated voyages of the same vessel.

Z 56-75. Number and tonnage capacity of ships outward and

inward bound, by destination and origin, 1714-1772.

Source: Compiled by Lawrence A. Harper, University of

California, from photographic copies of the naval office lists

in the British Public Records Office (C. O. 5), except for:

1714-1717, Boston, and 1715-18, New York City, E. B. O'Cal-

laghen, ed., Documents Relative to the Colonial History of

the State of New York, vol. V, Weed, Parsons, and Com

pany, Albany, 1855, p. 618; 1733 and 1734, Philadelphia,

Pennsylvania Gazette for those years; 1752, Port Hamp

ton, Francis C. Huntley, "The Seaborne Trade of Virginia in

Mid-Eighteenth Century: Port Hampton," Virginia Magazine

of History and Biography, vol. LIX, No. 3, July 1951, pp.

302-303; 1763 and 1764, New York, and 1765 and 1766, New

York, Boston, and Philadelphia, see source for series Z 35-42,

pp. 356-358; and 1768-1772, all ports, American Inspector Gen

eral's Ledgers, Public Records Office, London, Customs 16/1.

Where the classification in Documents Relative to the Co

lonial History . . . did not correspond to that used here, the

744

EXPORTS AND IMPORTS Z 76-125

necessary adjustments were made by reference to the Colonial

Naval Office lists (PRO C.0.5).

The colonial naval officers appointed to enforce the English

navigation laws as well as the collectors appointed by the

English Commissioners of Customs under the act of 1673

(25 Car. II c 7) were charged with reporting the entry and

clearance of ships as well as their cargoes. Many of the

copies of the naval office lists have survived from the 18th

century. When they have not, records of the names and

destinations of the ships (but not their tonnages) may be

obtained from the shipping news in the colonial newspapers.

Such data of entries and clearances provide the best rough-

and-ready index of the course of trade and its relative volume.

Although the figures concerning the entry of goods such as

molasses might be distorted by illicit trade, the severity of the

penalty (forfeiture) for failure to enter one's ship and the

difficulty of concealing the offense help to warrant the accu

racy of ship entry figures. Tonnage figures, however, present

a special problem. Ralph Davis in "Organization and Finance

of the English Shipping Industry in the Late Seventeenth

Century" (doctoral thesis, University of London, 1955) states

(pp. 476-479) that the tonnage as calculated when the English

Navy was contracting for the purchase of a vessel was 25 to

33 percent greater than the conventional "tons burden" re

corded in the customhouse books. Since the "tons burden"

figures for the same ship remain constant in the passbooks

and customs entries during the span of time here involved

(although not necessarily for all periods), the difference be

tween this purchase tonnage and the conventional tonnage will

ordinarily not affect use of the data shown here.

See also general note for series Z 1-405.

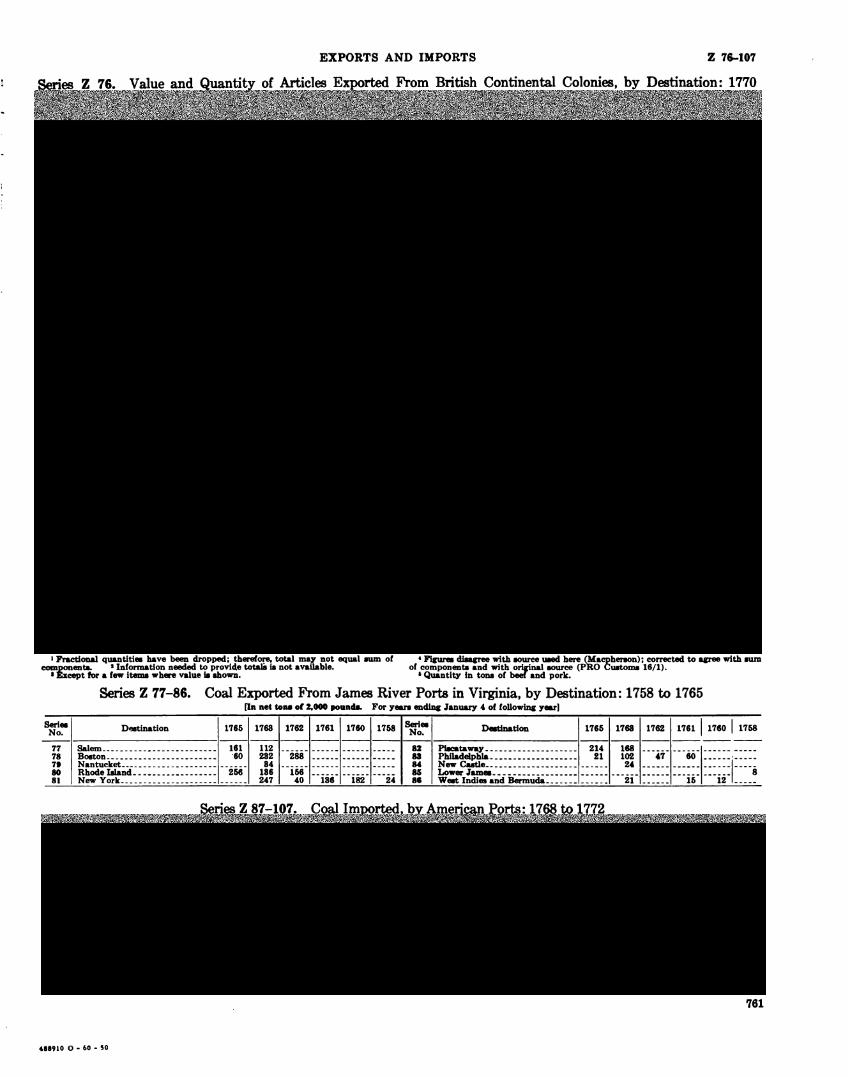
Z 76. Value and quantity of articles exported from British

Continental Colonies, by destination, 1770.

Source: David Macpherson, cited above in source for series

Z 21-34, vol. Ill, pp. 572-573, supplemented by American In

spector General's Ledgers, Public Records Office, London,

Customs 16/1.

Data do not include coastwise shipments as do the figures

in the American Inspector General's Ledgers (PRO Customs

16/1). Macpherson (see source for series Z 21-34) states

that he omitted fractional parts of the quantities but their

value is retained in the value column. Because of this and

an error which Macpherson saw but had no means of correct

ing, the value column may not be entirely comparable with

the quantity columns. The value figures are not the market

values (which Macpherson believes to have been higher) but

are the official customhouse values at the ports of exportation.

Customs 16/1 presents the quantities in all cases for a longer

time span, 1768-1772, but the data there are not so con

veniently totaled as in Macpherson.

See also general note for series Z 1-405.

Z 77-86. Coal exported from James River ports in Virginia,

by destination, 1758-1765.

Source: Howard N. Eavenson, The First Century and a

Quarter of American Coal Industry, Waverly Press, Inc., Balti

more, 1942, pp. 32-34, and WPA compilations (see general

note for series Z 1-405) of naval office lists at the University

of California.

These figures were compiled from the colonial naval office

lists by Eavenson. They represent only the years for which

records are complete in the case of both the Upper and Lower

James. Comparison with the colonial exports for 1768-1772

(compiled by Eavenson, p. 36, from PRO Customs 16/1) shows

that the James River shipments constituted the great bulk of

th° exports from the Thirteen Colonies. Out of a total of

2,798 net tons recorded, 1,220 net tons were shipped from the

Upper James, 180 from the Lower James, 1,100 from Nova

Scotia, 117 from New Hampshire, and only minor quantities

from other ports (which may have been used as ballast and

originally may have come from Great Britain).

Chaldrons were not converted into tons at the Newcastle

rate of 5,936 pounds equal to 2.97 net tons but on the

measure used after the Revolutionary War, a chaldron equaling

36 bushels or 1.44 net tons.

Z 87-107. Coal imported, by American ports, 1768-1772.

Source: American Inspector General's Ledgers, Public Rec

ords Office, London, Customs 16/1.

Chaldrons and bushels were converted to net tons as de

scribed in text for series Z 77-86.

The WPA compilations (see general note for series Z 1-405)

from the naval office lists show earlier entries of coal

in the several ports, from time to time. The great bulk came

from Britain, the remainder (except in the case of exports

from James River ports) apparently were transshipments, but

it is not until 1768 that records give a good cross section of

the traffic.

Z 108-121. Value of furs exported to England, by British

Continental Colonies, 1700-1775.

Source: Murray G. Lawson, "Fur—A study in English Mer

cantilism, 1700-1775," University of Toronto Studies, History

and Economics Series, vol. IX, University of Toronto Press,

Toronto, 1943, pp. 108-109.

As pointed out in the source, the fur trade is inextricably

interwoven with the manufacture of beaver hats. Thus, the

Hat Act of 1732 (5 Geo. II c 22) forbidding the exportation of

hats by any colony, combined with the enumeration of beaver

skins and furs in 1722 (8 Geo. I c 15), sought to protect the

English hat manufacturers. These series show the importance

to the English of their colonial supply of fur. Comparison of

these figures with those shown in series Z 21-34 will demon

strate the relative unimportance of fur in the colonial balance

of trade.

The source also specifies the different kinds and quantity of

fur England imported from the colonies and elsewhere, as well

as the quantity and value of the different markets of the

world—data given in even greater detail in the original tables

which Lawson has left with the WPA compilations at the

University of California in Berkeley.

See also general note for series Z 1-405.

Z 122-125. Indigo and silk exported from South Carolina and

Georgia, 1747-1775.

Source: Series Z 122-124, Lewis C. Gray, History of Agri

culture in the Southern United States to 1860, vol. II, Carnegie

Institution of Washington, D.C., 1933, p. 1024 (except 1766,

WPA compilations of colonial naval office lists, Public Records

Office, London, C. 0. 5; and 1768-1772, photographic copies

of the American Inspector General's Ledgers, Public Records

Office, London, Customs 16/1). Series Z 125, Lewis C. Gray,

cited above, vol. I, p. 187.

See also general note for series Z 1-405.

The data on indigo are reasonably complete. Although South

Carolina contemplated the production of indigo as early as

1672 little came of it, presumably because of the competition

from the British West Indies. When the British Islands began

to emphasize sugar rather than indigo, England had to depend

upon the French West Indies for her supplies of indigo until

South Carolina (thanks to the enterprise of Eliza Lucas) again

entered the field. The first successful crop in 1744 was

745

Z 126-222 COLONIAL STATISTICS

largely devoted to seed but South Carolina was soon exporting

in quantity. In due course, Georgia became a competitor but

British Florida did not enter the picture until late. Even

during the last 5 years of the colonial period British Florida's

production ranged only between 20,000 and 60,000 pounds

(Gray, cited above, vol. I, pp. 54 and 291-295).

The great bulk of indigo went to Britain (which wanted it

as a source of blue dye), not only because of its enumeration

in the act of 1660 (12 Charles II c 18), but also because of

the bounty England paid of 6 pence per pound (21 Charles

II c 30). However, Customs 16/1 and the WPA compilations

(see general note for series Z 1-405) show that minor quanti

ties went to other Continental Colonies. Gray's Carolina fig

ures, which were taken by him from an English source, appar

ently do not include coastwise shipments. This omission is

relatively unimportant since the coastwise figures for 1768-1773

(as shown in Customs 16/1) represented only 1.6 percent of the

total exports. The figures for Georgia (compiled by an Ameri

can customs official) include shipments coastwise as well as

to England—a matter of statistical significance as they con

stituted 5.1 percent of Georgia's total for 1768-1773.

Comparison of Gray's figures for 1747-1765 with those for

1768-1773 in Customs 16/1 suggests that Gray's figures are

not for Charleston and Savannah alone, as shown by his head

ings, but for South Carolina and Georgia. In the case of South

Carolina, the two series agree exactly in 1768, the one year

when we have figures from both sources. Since Gray's source

(British Museum, Kings Manuscripts, 206, f. 29) is the same

for the earlier years, 1747-1765, it seems probable that the

figures for these years also refer to South Carolina as a

whole.

Customs 16/1 does not conclusively answer the problem in

the case of Savannah. It shows for 1768-1772 that Savannah

was the only Georgia port exporting indigo except in 1772.

For this year, Gray's figures differ slightly from those shown

in Customs 16/1 for Savannah alone and also those for Georgia

as a whole. The decision to change the heading from Sa

vannah to Georgia rests upon the fact that Bernard Romans

(A Concise Natural History of East and West Florida, vol. I,

New York, 1775, p. 104) specifies Georgia rather than Sa

vannah.

Whether or not the figures are for Savannah or Georgia seems

statistically insignificant. In South Carolina, however, ports

other than Charleston provided 7.8 percent of that colony's

exports to England for 1768-1773. Whatever may be true of

Gray's figures, those given for 1768-1773 from Customs 16/1

do include all South Carolina ports and all of Georgia,

but the only figure available for South Carolina for 1766 (from

the WPA compilations) is for Charleston alone.

The figures on silk are from records compiled by the Georgia

Comptroller of Customs (Gray, cited above, vol. I, p. 187). See

also text for series Z 126-130.

Z 126-130. Silk exported and imported by North and South

Carolina, 1731-1755.

Source: Chapman J. Milling, ed., Colonial South Carolina,

University of South Carolina Press, Columbia, 1951, p. 104.

Despite vigorous efforts to encourage colonial silk produc

tion by both British and colonial governments, more silk moved

west than east across the Atlantic. Early figures gathered

by Gray (cited above for series Z 122-125, vol. I, pp. 184-187)

show that in 1654 Virginia reported the production of only

8 pounds; in 1656, 10 pounds (wound silk) ; in 1668, 300 pounds

(sent to Charles II, type unspecified) ; in 1730, 300 pounds

(raw), and that the Carolinas sent "several bales" to London

in 1710 and again in 1716. Georgia's first efforts succeeded

in sending only 20 pounds of silk to England in 1739. In

1741, she produced 600 pounds of cocoons (of which 16 pounds

made 1 pound of silk) as against 37 pounds of wound silk in

all the previous years of the colony. In 1749, the Salzburgers

(a religious colony of industrious peasants and artisans) alone

produced 762 pounds of cocoons and 50 pounds, 13 ounces, of

spun silk. In 1764, the Colonies' total product amounted to

15,212 pounds of cocoons. See also text for series Z 122-125.

The figures for the Carolinas (1731-1755) were taken from

British records and appear in Governor James Glen's Descrip

tion of South Carolina (Milling, cited above, p. 104).

Z 131-222. General note.

Iron was listed in colonial commerce as "pig iron" which

derived its name from the shape assumed by the molten iron

when poured from the furnace, after being separated from the

ore, and "bar iron" which consisted of malleable iron produced

in bloomeries or at the forge. Iron manufactures not specifi

cally described by name, such as anchors, axes, pots, nails,

scythes, etc., were listed as "cast iron" if poured into forms

and "wrought iron" if forged from malleable iron except in

the English Inspector General's records (PRO Customs 3)

where the term "wrought iron" seems to have included both

cast and malleable iron products.

The statistical picture of iron in the colonies can be recon

structed in part from data concerning iron works in the

colonies and in part from the records of colonial trade. The

beginning of this industry came early in the various American

colonies—in Virginia in 1622, Massachusetts in 1645, Connecti

cut in 1657, New Jersey in 1680, Maryland in 1715, Pennsyl

vania in 1716, and New York shortly before 1750. By 1775,

the colonies had at least 82 charcoal furnaces which produced

about 300 tons each, or a total of 24,600 tons, of pig iron and

more than 175 iron forges, some being bloomeries which made

bar iron directly from the ore. Most of them, however,

were refinery forges which used pig iron. Each of the 175

forges produced an average of 150 tons of bar iron a year,

or 26,250 tons in all. In addition, there were slitting mills

and other iron works.

Arthur C. Bining, in British Regulation of the Colonial Iron

Industry, cited below for series Z 131-135, p. 134, provides a

table comparing American production with the world total (see

text table I). These estimates include pig iron, cast iron

wares made at blast furnaces, and bar iron produced at

bloomeries directly from the ore.

Table I. Iron Production of American Colonies and the World

[In tang]

YearAmericanColonies

World

1800 45,00038,00030,00010,0001.500

400,000325.000210,000150,000100,000

1790 -._1775

1700

The figures shown in series Z 131-222 for the movement of

the various types of iron in commerce throw light on England's

efforts to encourage Americans to produce pig and bar iron

by freeing those products from import duties in England, and

to limit further manufacture by prohibiting the erection of

any new slitting or rolling mills, tilt hammer forges, or steel

furnaces (23 Geo. II c 29; 30 Geo. II c 16). Iron was not

added to the list of enumerated products which could only be

shipped to Britain (or another colony) until 1764 (4 Geo. Ill

c 15), and even then the law only forbade shipments to

Europe.

746

EXPORTS AND IMPORTS Z 131-222

Comparisons of colonial production with export figures will

help provide estimates of the home market, which can be re

duced to an approximate per capita base by reference to

series Z 1-19.

See also general note for series Z 1-405.

Z 131-135. Pig iron exported to England, by colony, 1723-

1776.

Source: 1723-1755, and, series Z 131 only, 1761-1776,

Arthur Cecil Bining, British Regulation of the Colonial Iron

Industry, University of Pennsylvania Press, Philadelphia, 1933,

pp. 126-133; 1756-1760, and series Z 132-135, 1761-1776,

English Inspector General's Ledgers, Public Records Office,

London, Customs 3.

Basically, all the figures come from the Inspector General's

accounts although Bining obtained his from House of Lords

MSS., No. 185, and Harry Scrivenor, Comprehensive History of

the Iron Trade, Longman, Brown, Green, and Longmans, Lon

don, 1841.

J. L. Bishop, A History of American Manufactures . . .,

cited below for series Z 153-158, p. 625, gives an earlier figure

when he states that the first iron sent to England from America

was from Nevis and St. Christopher, followed in 1718 by 3%

tons from Virginia and Maryland. Series Z 131 is that of

Bining and, where possible, footnotes explain the reasons for

differences between his totals and those of the extended figures.

The customs records were stated in terms of tons, hundred

weights, quarters, and pounds, but they have here been

rounded to tons.

Z 136-142. Pig iron exported from American Colonies, by des

tination and colony, 1768-1772.

Source: American Inspector General's Ledgers, Public Rec

ords Office, London, Customs 16/1.

The difference in total exports given in series Z 136 for

Great Britain and that in series Z 131 for England should

reflect trade with Scotland except for the variation in terminal

dates and the lapse of time required to cross the Atlantic.

The trade, however, seems to have been minor. J. L. Bishop,

A History of American Manufactures . . ., cited below for

series Z 153-158, p. 628, gives figures showing that the pig

iron exported to Scotland totaled only 264 tons in the 10 years

from 1739 to 1749 and 229 tons in the 6 years from 1750 to

1756.

No figures are available for pig iron imported from England

by the colonies. Such imports were probably negligible.

Z 143-152. Pig iron imported by American Colonies from

other Continental Colonies, 1768-1772.

Source : See source for series Z 136-142.

In addition to the colonies shown, these series also cover

New Hampshire, New Jersey, Georgia, and Florida. However,

these colonies imported no pig iron for 1768-1772.

Z 153-158. Bar iron imported from England, by American

Colonies, 1710-1750.

Source: 1710-1735, J. L. Bishop, A History of American

Manufactures From 1608 to 1860, vol. I, Edward Young & Co.,

Philadelphia, 1861, p. 629; 1750, English Inspector General's

Ledgers, Public Records Office, London, Customs 3.

Shipments of bar iron from England to the Colonies declined

sharply in the last quarter century before the Revolution.

Figures are not available for 1736-1749 to determine when

the decline first became evident.

Imports were relatively few after 1750. The English and

American Inspector Generals' Ledgers show that New England

imported 6 tons in 1764, and again in 1769, and 1,053 bars in

1773. South Carolina imported 19 bars in 1770 and 3 hundred

weight in 1773.

Z 159-164. Bar iron exported to England, by colony, 1718-1776.

Source: 1718-1755, and series Z 159, 1761-1776, Bining,

cited above for series Z 131-135, pp. 128-133; 1756-1760, and

series Z 160-164, 1761-1776, English Inspector General's

Ledgers, Public Records Office, London, Customs 3.

The original sources show data in tons, hundredweights,

quarters, and pounds, but they have here been rounded by

Lawrence A. Harper (University of California) to the nearest

ton.

The source indicates that no bar iron was exported during

1710-1717 and for years which have been omitted in these

series.

Z 165-178. Bar iron imported by American Colonies from

other Continental Colonies, 1768-1772.

Source : See source for series Z 136-142.

Z 179-188. Bar iron exported by American Colonies, by des

tination and colony, 1768-1772.

Source : See source for series Z 136-142.

The difference in total exports given in series Z 179 for

Great Britain and those in series Z 159 for England should

reflect exports to Scotland, except for the variation in terminal

dates and the lapse of time required to cross the Atlantic.

According to J. L. Bishop, these exports were minor—only

11 tons from 1739 to 1749 (see text for series Z 136-142).

Z 189-202. Cast iron imported and exported by American

Colonies, by origin and destination, 1768-1772.

Source : See source for series Z 136-142.

Additional information may be obtained concerning imports

from England in the English Inspector General's Ledgers (PRO

Customs 3) and in the WPA compilations (see general note

for series Z 1-405) of the colonial naval office lists. English

exports to the Colonies list, in addition to the generic heading

"cast iron," such items as ordnance, iron pots, melting pots,

and Flemish iron pots. The WPA compilations show an

active coastal trade in pots as well as a surprisingly large

quantity of sugar pots and sugar molds going to Kingston,

Jamaica, especially from Philadelphia.

The figures for 1769-1771 may include some shipments from

Scotland but the amounts probably are negligible.

Source also indicates additional minor quantities of cast iron

exported to Southern Europe, Wine Islands, and West Indies.

Z 203-210. Wrought iron imported from England by Ameri

can Colonies, 1710-1773.

Source: 1710-1735, Bishop, cited above for series Z 153-158,

p. 629; 1750-1764, and 1773, English Inspector General's

Ledgers, Public Records Office, London, Customs 3; 1769-1771,

see source for series Z 136-142.

The figures for 1769-1771 may include some shipments

from Scotland but the amounts probably are negligible.

The American Inspector General's figures for 1768-1772

(PRO Customs 16/1) disclose no exports of wrought iron from

the Colonies to England, but the figures do show some ship

ments to the West Indies.

Z 211-222. Selected iron products imported and exported by

American Colonies, 1768-1772.

Source : See source for series Z 136-142.

Figures are probably underestimated since the items in

cluded may have been listed under more general designations.

The colonists were not necessarily dependent upon importation

747

Z 223-253 COLONIAL STATISTICS

but may have manufactured their own nails and other articles

from bar iron which was either home-produced or imported.

Since colonial imports of axes and scythes came so pre

dominantly from the other colonies, and steel and nails from

Great Britain, no note has been taken of the negligible impor

tations of these items from other sources.

Z 223-253. General note.

Colonial statistics concerning production and consumption of

tobacco have not been developed yet, and perhaps they can

never advance beyond the rough estimate stage. For the

present, only general deductions from export statistics and

other evidence can be made.

Figures for trans-Atlantic shipments of tobacco in the 17th

century leave much to be desired (see text for series Z 238-

240) but those for the 18th century are reasonably satisfactory.

The 18th century statistics of English imports rest upon con

temporary compilations from customhouse entries. The fig

ures for Scotland are less exact and in the early years they

do not rise above mere estimates. However, Scotland's to

bacco imports were relatively minor in those years. Fortu

nately, as their relative importance grew, the Scottish statistics

became more reliable.

British imports represented virtually all the colonial exports.

The figures given in series Z 223-229 and Z 230-237 give the

landed weight in Britain. Due to the tobacco's loss of moisture

while crossing the Atlantic, the landed weight in Britain is

about 5 percent less than the shipping weight in America

(Arthur P. Middleton, Tobacco Coast, the Mariners' Museum,

Newport News, Va., 1953, p. 104; Rupert C. Jarvis, Customs

Letter-Books of the Port of Liverpool, 1711-1813, the Chetham

Society, Manchester, 1954).

Unfortunately, the English Inspector General's Ledgers of

Imports and Exports (PRO Customs 3) do not differentiate

between shipments from Virginia and Maryland as do the

Scottish (PRO Customs 14) and the American (PRO Customs

16/1).

The validity of British statistics as a reflection of the Amer

ican tobacco trade depends, of course, upon colonial obedience

to the regulations requiring shipment (with minor exceptions)

of colonial tobacco to England (Britain after 1707)—at first

by royal order and after 1660 by the Navigation Act of 12 Car.

II, c 18.

Until the English drove the Dutch from New Netherland

(first in 1664 and finally in 1674) great opportunities existed

for illicit trade in America. The rules also appear not to have

been consistently enforced in Europe (see text for series

Z 238-240). In the 1680's there was a flareup of illegal

shipments to Ireland but it reflected a sudden change in the

law. The offending vessels were apprehended and the great

bulk of the Irish trade thereafter seems to have followed

legal channels. There were lurid accounts of smuggling to

Scotland at the turn of the century but the quantity of tobacco

involved should be viewed in proportion to the trade as a

whole. One cannot reasonably expect the illegal shipments at

that time to exceed the shipments made a decade later with

full sanction of the law. In fact, the illegal shipments pre

sumably were much less because Scotland as a whole at the

end of the 17th century had only one-fourth of the shipping

it had within 5 years after direct trade was permitted. The

Clyde ports, which were most concerned with the American

trade, had only one-tenth of their later shipping (L. A.

Harper, The English Navigation Laws, Columbia University

Press, New York, 1939, pp. 260-261). In view of this differ

ence in the shipping available, the volume of illegal trade

would seem not to have been more than 250,000 pounds, and

a comparison with series Z 223-229 shows that it represented

at most 1 percent of the tobacco crossing the Atlantic lawfully.

During the 18th century there was undoubtedly some smug

gling of tobacco but it does not seem likely to impair the valid

ity of the colonial import statistics. The illicit trader's greatest

profit did not lie in evading the provisions of the Navigation

Act but in escaping the high taxes laid on tobacco in England.

The most effective technique consisted in importing the tobacco

and reexporting it legally to a nearby port (such as the Isle

of Man) whence small craft could "run" it ashore again duty

free (for details, see Jacob M. Price, The Tobacco Trade and

the Treasury, 1685-1733 : British Mercantilism in its Fiscal

Aspects, unpublished doctoral dissertation, Harvard University,

1954).

American historians have pointed to the small amount of the

"plantation duties" collected on intercolonial trade as evidence

of the breakdown of the laws. If the American colonists con

sumed the 5 pounds per capita of the Bermudians in the

early 18th century, the 2 pounds of the English at the beginning

of the 18th century, or even their 1 pound per capita at the

end of the 18th century (Alfred Rive, "The Consumption of

Tobacco Since 1600," Economic Journal Supplement, Economic

History Series, vol. I, Jan. 1926, p. 63; H. C. Wilkinson, Ber

muda in the Old Empire), Oxford University Press, London,

1950, p. 14), the colonies would have provided a sizable market

of 2,000,000 to 10,000,000 pounds at the time of the Revo

lution. But that is a figure which can and must be greatly

discounted. In the first place, it should be cut in half be

cause the southern colonies had about half the population

and provided their own source of supply. Similarly, allow

ance must be made for tobacco produced in the north

ern colonies. Pennsylvania, Delaware, New York, Rhode

Island, Connecticut, and Massachusetts all at one time or

another grew tobacco (George L. Beer, The Origins of the

British Colonial System, 1578-1660, Macmillan, New York,

1908, p. 88; J. B. Killebrew, Report on the Culture and Curing

of Tobacco in the United States, Department of the Interior,

Census Office, Washington, D.C., 1884, pp. 147 and 237;

Vertrees J. Wyckoff, Tobacco Regulation in Colonial Maryland,

Johns Hopkins University Studies in Historical and

Political Science, Extra Volumes, New Series, No. 22, Balti

more, 1936, pp. 37, 38, and 65). Philadelphia, Lewes, and New

Castle appear in the WPA compilations (see general note for

series Z 1-405) as suppliers to other ports like New York and

Boston. New York itself exported tobacco (and even more

snuff) coastwise as well as to England, and the exports from

New England continued large even into the 1750's. In the

1760's, Rhode Island tobacco crops provided surpluses sufficient

to warrant shipping 200,000 pounds to Surinam, a colony in

South America (James B. Hedges, The Browns of Providence

Plantations, Harvard University Press, Cambridge, 1952, pp.

30-40).

It need not be assumed that the colonists were averse to

violating the law. -It may be that violations on a significant

scale were not good business. The fact that the 200,000 pounds

of Rhode Island tobacco sent to Surinam went there illegally

means little. It was a type of tobacco not in general demand

and constituted less than one-third of one percent of the annual

legal trade.

748

EXPORTS AND IMPORTS Z 223-240

Z 223-229. Tobacco imported by England, by origin, 1697-

1775.

Source: Compiled by Jacob M. Price, the University of

Michigan.

The basic sources used by Price are the same as those

used by him for his doctoral dissertation (see below).

The English Inspector General's Ledgers (PRO Customs 3),

which are the original source of the data, distinguish between

entries in London and in the rest of the Kingdom (the out-

ports) but Price has combined them in the interest of saving

space.

Z 230-237. American tobacco imported and reexported by

Great Britain, 1697-1775.

Source: Jacob M. Price, The Tobacco Trade and the Treas

ury, 1685-1 7S3: British Mercantilism, in its Fiscal Aspects,

unpublished doctoral dissertation, Harvard University, 1954.

The basic sources of the data for England in Price's doctoral

dissertation were the Inspector General's Ledgers of Imports

and Exports (PRO Customs 2 and 3) except as follows (see

general note for series Z 1-405 for an explanation of the call

numbers which follow): 1703-1722, from PRO CO 390/5/47;

1717-1722, confirmed in PRO T. 1/281/18, BM Add. MS. 33,038

fol. 159; 1722 (London import only), from PRO T 64/276B/327;

1763-1769 (import only), from PRO T. 64/276B/328; 1770-

1773 (import only), from PRO T. 64/276B/332; 1770-1771 (ex

port), from PRO T. 64/276/330; 1772, 1774-1775 (import and

export), from PRO T. 17/1,3,4; 1773-1775 (export), from Adam

Anderson, An Historical and Chronological Deduction of the

Origin of Commerce, vol. IV, J. Walter, London, 1707-1709,

p. 447.

For Scotland, Price's data came from the Scottish Ledgers

of Imports and Exports (PRO Customs 14), except as follows:

1707-1711 (import and export), from PRO T. 1/39/29; 1715-

1717 (import and export), from PRO CO 390/5/13; 1721-

1724 (import and export), from PRO T. 1/282/23; 1725-1731,

1752-1754, 1763, 1769 (import and export), from PRO T.

36/13; 1738-1747 (import and export), from PRO T. 1/329 fol.

125.

Total imports and reexports for 1708-1731 and 1752-1754

were obtained by adding figures not strictly comparable with

each other. Scottish imports and reexports for 1708-1717 are

averages of estimates for several years.

Z 238-240. American tobacco imported by England, 1616-1693.

Source: 1616-1621, Vertrees J. Wyckoff, Tobacco Regulation

in Colonial Maryland, Johns Hopkins University Studies in

Historical and Political Science, Extra Volumes, New Series,

No. 22, Baltimore, 1936, pp. 20-36; 1622-1631, Neville Wil

liams, "England's Tobacco Trade in the Reign of Charles I,"

The Virginia Magazine of History and Biography, October

1957, pp. 403-449; 1637-1640, Stanley Gray and V. J. Wyckoff,

"The International Tobacco Trade in the Seventeenth Century,"

Southern Economic Journal, VII, July 1940, pp. 18-25; 1663-

1693, compiled by J. M. Price from PRO CO 388/2 ff.7,13

(1663, 1669), B. M. Sloane MS.1815 ff.34-7 (1683-1689),

PRO T.l/36/9 fo.50 (1689-1693), and Gray and Wyckoff, cited

above (1672-1682).

The figures here are not as satisfactory as those given in

series Z 223-229 and Z 230-237. The total imports for 1686

and 1688 were obtained by adding figures not strictly compar

able with each other. Imports of the outports (English ports

other than London) for 1682-1688 are averages of estimates

for several years. In a few instances the figures from Gray

and Wyckoff include minor quantities of Spanish and Brazilian

tobacco.

As indicated in the general note for series Z 223-253, the

figures shown prior to the time when the Dutch were driven

from New Netherland should not be relied upon too greatly.

Rive (cited in source above, pp. 57-75) suggests that the

doubling of the London import figures between 1637 and 1638

may have been due to better patrolling of the Channel. There

is much evidence to show that the laws restricting tobacco

importations to London and excluding Spanish tobacco were

disregarded at least in part (Beer, cited above in general

note for series Z 223-253, pp. 197 ff ; Williams, cited in source

above, pp. 419-420; Wyckoff, cited in source above, pp. 32-34).

An alternate approach to studying the import figures is to

consider the estimates of tobacco which might be produced

or purchased. English proposals for limitations on tobacco

importation included the following: 55,000 pounds in 1620;

200,000 pounds in 1625 and 1626; 250,000 pounds in 1627;

600,000 pounds in 1635; and 1,600,000 pounds in 1638 (Beer,

cited above in general note for series Z 223-253, pp. 120, 138,

154, and 158). Virginia meantime wanted the King in 1628

to take at least 500,000 pounds annually and by 1639 sought

to reduce the tobacco crop to 1,500,000 that year and 1,300,000

pounds for each of the next two years (Killebrew, cited above

in general note for series Z 223-253, pp. 215-216) .

Another weakness of the figures for these series lies in

their failure to show which colonies supplied the tobacco; how

ever, other data provide some opportunities to estimate the

quantity which the various colonies contributed. Virginia and

Bermuda ran neck and neck in 1620 at 50,000 to 55,000

pounds each. In 1628, Virginia's shipments were twice those of

Bermuda, and thereafter Virginia drew far ahead (Beer, cited

above in general note for series Z 223-253, p. 120; and Wil

liams, cited in source above, pp. 421-449). Her production had

risen from 20,000 pounds in 1619 and went on to 18,150,000

in 1688 and 18,295,000 pounds in 1704 (R. A. Brock, "A Suc

cinct Account of Tobacco in Virginia, 1607-1790," in J. B. Kille

brew, cited above in general note for series Z 223-253, p. 224).

Bermuda's production increased to 500,000 pounds at the most

in the 1680's (George L. Beer, The Old Colonial System,

1660-1754, vol. II, Macmillan, New York, 1912, p. 91). At

the end of the century, Bermuda's exports to England became

negligible, and by the first quarter of the 18th century Ber

muda was importing from Virginia some of the 20,000 pounds

consumed by her population, which was estimated at 3,600

whites and 5,000 slaves in the 1680's (H. C. Wilkinson,

Bermuda in the Old Empire, Oxford University Press, London,

1950, p. 14).

The West Indies were said to have begun growing tobacco

as early as 1625; by 1628, reports show the shipment of about

100,000 pounds, but by the middle of the century sugar began

to take over as the predominant crop (Beer, The Origins . . .,

cited above in general note for series Z 223-253, pp. 89-90).

Meanwhile Maryland, which probably had produced no more

than 100,000 pounds annually by 1639 (Wyckoff, cited in source

above, p. 49), so increased her output that she contributed

about 36 percent of the combined Virginia-Maryland total in

1688—a percentage she approximated at the turn of the 17th

century (Margaret Shove Morriss, Colonial Trade of Maryland,

1689-1715, Johns Hopkins University Studies in Historical and

Political Science, Series XXXII, No. 3, Baltimore, 1914, pp.

31-36) and during the period 1768 to 1773 (see series Z 248-

249).

In the Colonies further south, North Carolina was said to be

growing about 2,000 hogsheads, or 1,000,000 pounds, of tobacco

in the 1670's—an estimate which seems more generous than

the subsequent pattern of exports justifies (Beer, The Old

Colonial System, 1660-1754, cited above, vol. II, p. 195).

749

Z 241-280 COLONIAL STATISTICS

Z 241-253. American tobacco exported and imported, by origin

and destination, 1768-1772.

Source: Compiled by Lawrence A. Harper, University of

California, from American Inspector General's Ledger of Im

ports and Exports, Public Records Office, London, Customs

16/1.

Although they cover only a few years, these series provide

the only known comprehensive data which permit a complete

analysis of the pre-Revolutionary colonial tobacco trade.

In the source, some export figures for 1768 and 1770 for

Virginia, North Carolina, and South Carolina were shown in

hogsheads or barrels. When the weights of these units were

not indicated, they were converted to pounds by Harper, by

using the overage weights of these units as reflected in the

shipments to Great Britain from the respective colonies for

1768-1772.

Also, the source shows the South Carolina export to Great

Britain for 1771 as 433 hogsheads totaling 40,333 pounds.

This obviously is an erroneous ratio. Since the hogshead figure

is more comparable to other data shown here than the pounds

figure, the former is assumed to be correct. It has been

converted to pounds in the same manner as the 1770 export

figures mentioned above.

Z 254-261. Tea imported from England by American Colonies,

1761-1775.

Source: Compiled by Lawrence A. Harper, University of

California, from the English Inspector General's Ledgers, Public

Records Office, London, Customs 3.

Figures for tea imports shown in the American Inspector

General's Ledgers (PRO Customs 16/1) for 1768-1772 closely

approximate those shown here for the corresponding years

(O. M. Dickerson, The Navigation Acts and the American

Revolution, University of Pennsylvania Press, Philadelphia,

1951, pp. 99-100).

Z 262-280. General note.

Information on rice in the colonial period is limited primarily

to the material on the clean rice which entered commercial

trading. Presumably, the weight of this rice bore approxi

mately the same ratio to the rough rice of the plantation at

that time as it does now, that is, 100/162. There are no

known satisfactory statistics on rice production and only scat

tered data concerning domestic consumptipn. Lord Carteret

told the Board of Trade in 1715 that South Carolina "spent

in the country" one-third of the 3,000 tons of rice she was

producing at that time. By the pre-Revolutionary period,

comparison of total exports with net imports for 1769-1772

indicates that only 3 percent of total exports was consumed

in the nonrice-producing colonies.

The basic sources of statistics on clean rice in commerce

are the records of importations in the British Public Records

Office kept by the English Inspector General of Imports and

Exports (Customs 2 and 3, since 1696), by the Scottish In

spector General (Customs 14, since 1755), by the American In

spector General (Customs 16/1, 1768-1772), and the records

kept by the colonial naval officers (supplemented by those kept

by the deputies of the London Commissioners of Customs for

the comparatively few instances when these records have sur

vived).

Data from these basic sources appear in: Gray, History of

Agriculture . . ., cited above for series Z 122-125, pp. 1020-

1023; Francis Yonge, A View of the Trade of South Carolina,

London, 1722; C. J. Gayle, "The Nature and Volume of Ex

ports From Charleston, 1724-1774," The Proceedings of the

South Carolina Historical Association, Columbia, 1937, pp. 30-

31; G. K. Holmes, Rice Crop of the United States, 1712-1911

(Circular 34, Department of Agriculture, Bureau of Statistics,

1912) ; Francis Yonge, Narratives of the Proceedings of the

People of South Carolina, in B. R. Carroll, Historical Collec

tions of South Carolina, vol. II, Harper & Bros., New York,

1836, p. 156; The Case of the Province of South Carolina (Car

roll, vol. II, p. 265) ; Gov. James Glen, Description of South

Carolina (Carroll, vol. II, p. 26) ; "An Account of Sundry Goods

Imported and . . . Exported . . . From the First of November

1738 to the First of November 1739" (printed as a broadside

by P. Timothy, Charleston, 1739), Bernard Romans, Natural

History of East and West Florida, New York, 1775; and WPA

compilations from the Charleston Naval Office lists (see gen

eral note for series Z 1-405) .

Fortunately, the British records measure the quantities im

ported in hundredweights, but the American statistics usually

give only the number of barrels and other containers exported.

Where half-barrels were reported, the number was divided by

two and the result included in the barrel totals.

Miscellaneous units in the American figures have been con

verted to barrels. The term "cask" has been considered

synonymous with "barrel," following the usage of the American

Inspector General's Accounts for 1768, but the remaining

figures are rough approximations suggested by the weights of

other commodities as given in M. Postlethwayt, The Universal

Dictionary of Trade and Commerce, W. Strahan, London, 1774;

J. H. Alexander, Universal Dictionary of Weights and Meas

ures, D. Van Nostrand, New York, 1867, and the Oxford

English Dictionary. A tierce has been considered to equal

1% barrels; a hogshead, 2 barrels; a puncheon, 2% barrels;

a butt, 4 barrels; small barrels and small casks, Vz of a

barrel; seroons, boxes, and bags, % of a barrel; kegs, %;

and bushels, %. Colonial containers varied so greatly that

these estimates seldom, if ever, represented the exact relation

ship. When discussing weights and measures for other uses,

additional information should be obtained and corrections, as

may be necessary, should be made in the formulas employed

here. For present purposes, these maverick units constitute

such a negligible part of the whole that errors in estimating

their weight seem unlikely to exceed those involved in rounding.

The significant problem lies in determining the weight of the

barrel, the principal unit. Holmes (cited above, p. 4) stated

that it weighed 350 pounds in 1717; 400 pounds, 1718-1729;

and 500 pounds, 1730-1788, but as Gray (cited above, vol. II,

p. 1020) points out, these figures conflict with those given by

others. Although Governor Johnson of South Carolina stated

in 1719 that the average barrel contained about 350 pounds,

Francis Yonge, the collector at Charleston, gave the figure of

400 pounds for 1719-1721; a Savannah Rice Association study

declared it to be 325 pounds for 1720-1729; a contemporary

report in 1731 and Governor Glen of South Carolina in 1749

said the barrel contained 500 pounds, but other documents say

that it was 500-600 pounds in 1763; "something over 600

pounds in 1768-1769"; 550 pounds for 1764-1772; and 540

pounds net in 1772. O. M. Dickerson, The Navigation Acts and

the American Revolution (cited above in text for series Z 254-

261, p. 59) states that the formula used by the customs

service for converting barrels to hundredweight had each

barrel containing 4% hundredweight, or 504 pounds (but the

records do not disclose when the formula was calculated nor

how often it was revised) .

Fortunately, an examination of the surviving official statis

tics enables one to obtain averages calculated 'on broad bases.

The decennial totals for 1720-1729 and 1730-1739 (Gov. James

Glen, cited above) give both the number of barrels and the

750

EXPORTS AND IMPORTS Z 262-266

total weight shipped, showing the average barrel to weigh 373

pounds during the first decade and 448 pounds during the

second. Similarly, the naval office lists for 1756-1767, which

record both the number of barrels and pound weights shipped

to Southern Europe and the West Indies, give a weighted

average of about 525 pounds each for some 20,000 barrels.

Comparisons of the number of barrels shipped to Britain

from America with the weight recorded for the rice arriving

there provide another means of estimating the average weight

of the rice barrel. For present purposes, it can be assumed

to have been 350 pounds until 1720, and then to have risen 10

pounds a year until 1730, when it remained at a plateau of 450

pounds until after 1740; then it began to ascend at the rate

of 5 pounds a year until it reached its pre-Revolutionary peak

of 525 pounds in 1755. It must be remembered, however, that

the weight of the barrels might vary radically. New York's

Naval Office list for 1764 shows one shipment averaging 183%

pounds a barrel and another 698 pounds.

Z 262-266. Rice exported from producing areas, 1698-1774.

Source: Compiled by Lawrence A. Harper, University of

California, from references discussed below.

These series attempt to provide a comprehensive statistical

summary comparable to those available for the postcolonial

period. Barrels have been converted to pounds on the bases

described in the general note for series Z 262-280.

There was the problem of totaling the exports from the

three South Carolina ports (Charleston, Beaufort-Port Royal,

and Georgetown-Wynyaw) and those of Georgia. Shipments

from other colonies can be considered as having originated in

South Carolina and Georgia, except possibly those of North

Carolina, and even in this case most of the exports probably

went through South Carolina. In any event, North Carolina's

exports are grouped with South Carolina's shipments in the

English import figures, under the generic heading, "Carolinas."

Shipments to Scotland seem to have been infrequent and in

significant until the French and Indian War (1754-1763).

The Charleston figures, with the exceptions noted below, are

those compiled by Gayle (cited above in general note for series

Z 262-280) from the South Carolina Gazette, although his

figures for less than 12 months have been extended to full

year bases for 1750, 1756, 1757, 1763, and 1767. For 1698-

1724, the figures have been calculated on the assumption that

all American rice imports recorded in the English Inspector

General's Ledgers were equal to Vg of Charleston's total ex

ports, as suggested in 1719 by Francis Yonge, the customs

collector at Charleston, a conclusion corroborated by a com

parison of the WPA compilations of Charleston exports with

the English imports for 1717, 1718, 1719, and 1724, and by

Edward Randolph's remark in 1700 that Mo of Charleston's

exports went to the West Indies alone (Carroll, cited above

in general note for series Z 262-280). For 1731, the figures

come from the WPA compilations of the Charleston Naval

Office list (see general note for series Z 1-405), and for

1734 and 1758, directly from the South Carolina Gazette; for

1765, from the Charleston Year Book (1880) as copied by

Holmes (cited above in general note for series Z 262-280) ;

for 1766, from photographic copies of the Charleston Naval

Office list (PRO C. O. 5) ; for 1768-1772, from the American

Inspector General's Ledgers (PRO Customs 16/1); for 1773

and 1774, from Gray (cited above for series Z 122-125, p.

1022), although his partial figure for 1773 has been extended

to complete the year. The years terminate October 31 except

1698 (September 28); 1699-1724, 1731 (December 24); and

1768-1773 (January 4 of the following year).

Neither Beaufort-Port Royal nor Georgetown-Wynyaw (South

Carolina) seem to have had much importance until 1732. Al

though the former had its first collector in 1729, there was

a lapse of 2% years before his successor took over (PRO

AO 1/804/1038, AO 1/805/1039) ; and the latter appears to have

had its first collector in June 1732 (South Carolina Gazette,

June 24, 1732). Scattered naval office records show George

town exporting 385 barrels for the year 1734 and 509 for the

first quarter in 1735; and Beaufort, 342 during the first half

of 1736. In 1739, Georgetown exported 2,202 barrels and

Beaufort, 2,165 barrels (broadside, cited above, general note

for series Z 262-280), an approximate equality which also ex

isted in the period 1768-1772 (PRO Customs 16/1). For lack

of a better basis, their exports will be considered for present

purposes to have been equal from 1733 to 1768, when exact

figures are available and were used. In 1739, the exports of

the two together equalled GY2 percent of South Carolina's ex

ports—a percentage which dropped by 1769-1772 to 4.4 percent.

Thus, from 1739 to 1768, the Beaufort and Georgetown contri

butions have been assumed to be 5 percent of the total South

Carolina exports. A different formula was used for the years

prior to 1739, when their percentage was growing from the

2Y2 percent which they enjoyed in 1734 (calculated by doubling

the Georgetown figures which have survived for that year). On

the necessarily arbitrary assumption that the rate of increase

was uniform, the two ports each year from 1734 to 1739 added

0.7 percent to their share of South Carolina's exports. Ex

tending the same formula backwards, their share of the Caro

lina total was 1.8 percent in 1733 and 1.1 percent in 1732.

Romans, cited above, general note for series Z 262-280,

provides figures for Georgia for 1756-1767. A comparison

of his figures for Georgia's total exports with those of

receipts from Georgia in England (see series Z 274-280) for

the decade 1756-1765 shows a ratio of one barrel exported

for every 2.07 hundredweight received; and for 1740, 1742,

1750, and 1753-1755, the barrels shipped from Georgia have

been computed in accordance with that formula, on the basis

of English receipts (series Z 274-280). Figures for 1768-

1772 come from PRO Customs 16/1. In 1773 and 1774,

Georgia is assumed to have contributed 13.9 percent of the

total exports, as it did from 1768 to 1772. Years end Jan

uary 4 of the year following, except for the years for which

figures are calculated, as noted above. For those years, no

exact date can be assigned and the data are therefore not

strictly comparable.

The figures for 1768-1772 provide the best basis for the

later period, but for present purposes the 1768 list was not

included in the basic calculations described above because it

lacks data for coastwise exports; however, it provides the

best base for estimating the imports for that year. All that

need be assumed is that the ratio of the coastwise exports to

the other exports was the same in 1768 as the average of the

other four years.

The coastwise entries for 1769-1773 show both inward and

outward entries. Thus, to avoid duplications in the Carolina

and Georgia entries, only the net exports coastwise have been

included. This adjustment cannot be made prior to 1769, but

samples from the WPA compilations (see general note for

series Z 1-405) indicate that it is very minor.

The data for the various colonies are shown here, not because

the individual details are necessarily accurate, but in order

that scholars possessing more complete information may adjust

the figures wherever possible.

The object of presenting these series is to provide the best

possible pattern of the over-all development. The errors in

detail are as likely as not to offset one another. Except for

751

Z 267-297 COLONIAL STATISTICS

1713-1731, when the estimates of the size of the barrels

varied radically, the totals shown here should be within 5

percent of the true figure.

Z 267-273. Rice exported from Charleston, S.C., by destina

tion, 1717-1766.

Source: Compiled by J. R. House from the WPA compila

tions of naval office lists at the University of California,

Berkeley (see general note for series Z 1-405).

The differences in totals here and in series Z 262-266 may

result in part from the differences in year-ending dates, as shown

in the tabular headnotes.

Z 274-280. Rice exported to England, by origin, 1698-1776.

Source: Compiled by Lawrence A. Harper, University of

California, from English Inspector General's Ledgers of Imports

and Exports, Public Records Office, London, Customs 3 (except

1727, from PRO T.64/276B/323).

A large proportion of the exported rice was reexported by

England, not only to Northern but also to Southern Europe.

Z 281-303. General note.

The two basic sources for the study of the colonial Negro

are population statistics (see series Z 1-19) and commercial

statistics concerning slave importations. Although direct

knowledge of the colonial Negro's natural increase is scarce,

available evidence indicates that this increase must have been

considerable. It is reported in 1708 that about half of Boston's

400 Negro servants were born there, and Governor James Glen

of South Carolina stated in 1749 that the number of Negroes

in his colony increased rather than diminished during the nine

years when prohibitive taxes and war "prevented any from

being imported" (Elizabeth Donnan, ed., Documents Illustrative

of the History of the Slave Trade to America, Carnegie In

stitution of Washington, D.C., 1935, vols. Ill and IV, pp. 24

and 303, respectively). Otherwise, discrepancies between im

port and population figures (especially in later years) would

call for the existence of an illegal trade in Negroes of an

extent to which other evidence gives little support.

Donnan's Documents . . ., cited above, provides the greatest

single source on the subject of the slave trade. She supplies

references to many of the varied sources which provide such

knowledge as we have of the 17th century, most helpful of

which are the statistical reports prepared to help settle dis

putes between the Royal African Company and the separate

traders.

After the first quarter of the 18th century, data on the

slave trade usually rest upon the colonial naval office lists

(PRO C. O. 5). Colonial newspapers sometimes reported the

tallies which had been made in the customhouse; Donnan, Docu

ments . . ., cited above, reproduces the individual entries for

most of the lists which have survived, and the WPA compila

tions (see general note for series Z 1-405) give annual totals.

In preparing the series on slaves, photographic copies of the

naval office lists (PRO C. O. 5) were used when the Donnan

entries and the WPA compilations did not agree. It is im

portant to note, however, that the naval office lists report

importations by sea rather than overland movements of slaves.

Also, it is not always known how many of the Negroes sur

vived after their entry was recorded. The Virginia statistics

for 1710-1718 (Donnan, cited above, vol. IV, pp. 175-181) show

that of 4,415 Negro slaves entered, 231 died within the time

allowed to recover the duty and 103 were drawn back for

exportation—7.5 percent of the total importations.

In the case of the southern colonies, the statistics for Vir

ginia and South Carolina are reasonably complete; those for

Maryland and Georgia are spotty; and those for North Caro

lina are virtually nonexistent.

In New England the Negro population appears to have been

due to natural increase rather than extensive importations.

Governor Dudley of Massachusetts reported in 1708 that about

one-half of Boston's Negro servants were born there (Donnan,

cited above, vol. Ill, p. 24), and a comparison of the 1768-1773

trade figures (series Z 281-293) with the population figures

(series Z 1-19) suggests that natural increase had become

even more important than importations by the revolutionary

era.

In the middle colonies the first Negroes were probably

brought to New York from Spanish or Dutch prizes in 1625

or 1626. Dutch records are meager but show a consignment

of 5 in 1660 and another of 300 in 1664. After the English

conquest, New York for a time had an indeterminate trade in

slaves with the pirates of Madagascar (Donnan, cited above,

vol. Ill, pp. 405-406, 420, and 423). In Pennsylvania, the

number of slaves was always small and their entry often

discouraged by high taxes. Donnan (cited above, vol. Ill, pp.

408-409) believes that data about the slave trade there must

be sought in merchant's account books, newspaper advertise

ments, and items of ship news, some of which appear in Edward

R. Turner, "The Negro in Pennsylvania," Prize Essays of

American Historical Association, Washington, D.C., 1911. In

New Jersey, the slave trade centered in the eastern part of

the colony, but here too the number of slaves imported was

relatively small.

Z 281-293. Slave trade, by origin and destination, 1768-1772.

Source: Compiled by Lawrence A. Harper, University of

California, from the American Inspector General's Ledgers of

Imports and Exports, Public Records Office, London, Customs

16/1.

Z 294-297. Slave trade in Virginia, 1619-1767.

Source: 1619-1699, Elizabeth Donnan, ed., Documents Illus

trative of the History of the Slave Trade to America, Carnegie

Institution of Washington, D.C., 1935, vol. IV, pp. 4-6, 49-65,

and Philip A. Bruce, Economic History of Virginia in the

Seventeenth Century, vol. II, Macmillan, New York, 1895, pp.

66-85; 1700-1726, Donnan, Documents Illustrative . . ., vol.

IV, pp. 173-187; 1727-1767, Donnan, vol. IV, pp. 187-234, and

WPA compilations of colonial naval office lists (see general

note for series Z 1-405).

The title of these series refers to "slaves" because that

was the status of most Negroes listed, but it should be re

membered that until the middle of the 17th century Negroes

came as servants, not as slaves. Unless otherwise noted, these

figures show the total trade at all Virginia ports. When one

or more quarters of a port's naval office lists are missing, the

total for the full year has been estimated, the calculations

resting upon a chronological or geographic extension—which

ever involved the least element of conjecture. The totals de

pend upon such estimates in all years after 1726 except 1737-

1740, 1743-1745, 1750, 1758, 1761-1762, and 1764, when full

records exist for all the ports except Accomack, which can be

disregarded because of its lack of direct participation in the

slave trade. No figure is given in which the total includes

more than 20 percent estimate.

In the case of slaves exported, the highly variable nature of

this trade did not warrant estimative totals. Of the slaves

exported, 1,055 went to Maryland, 12 to North Carolina, 9 to

Rhode Island, 8 and a shipment (number unspecified) to Bar

bados, 3 to Madeira, 2 to Great Britain, 2 to Georgia, and 1

to Boston.

752

TIMBER—WHALING—WAGES—PRICES Z 298-335

Z 298-302. Slave trade in New York, 1701-1764.

Source: 1701-1718, E. B. O'Callaghan, ed., Documents Rela

tive to tht Colonial History of the State of New York, vol.

V, Weed, Parsons & Co., Albany, 1855, p. 814; 1719-1764,

Donnan, cited above for series Z 294-297, vol. Ill, pp. 462-

509, and WPA compilations of colonial naval office lists (see

general note for series Z 1-405) .

Figures for New York for 1731 were partially estimated, for

missing quarters, by Lawrence A. Harper, University of Cali

fornia. The estimates were derived by obtaining the ratio of

the number of slaves imported for each quarter to the number

annually imported. This ratio was based on figures covering a

period of eight years in which quarterly data were available.

Z 303. Slaves imported into Charleston, S.C., 1706-1773.

Source: 1706-1726, 1749-1751, Donnan, cited above for

series Z 294-297, vol. IV, pp. 255, 267, and 301-302; 1727-

1739, WPA compilations of the colonial naval office lists (see

general note for series Z 1-405) ; 1752, South Carolina Gazette,

Charleston, S.C., October 30, 1752; 1753-1772, O. M. Dicker-

son, The Navigation Acts and the American Revolution, Uni

versity of Pennsylvania Press, Philadelphia, 1951, p. 62; 1773,

Leila Sellers, Charleston Business on the Eve of the American

Revolution, University of North Carolina Press, Chapel Hill,

1934, p. 132.

Z 304-307. Pitch, tar, and turpentine exported from Charles

ton, S.C., 1725-1774.

Source: 1725-1755, 1760-1764, 1767-1771, Charles J. Gayle,

"The Nature and Volume of Exports from Charleston, 1724-

1774," The Proceedings of the South Carolina Historical As

sociation, Columbia, 1937, p. 31; 1756-1759, 1765, 1772-1774,

South Carolina Gazette, Charleston, S.C., various issues.

The basic source for these series has been the South Carolina

Gazette, which obtained the figures from the customhouse

books and ran them as cumulative totals from November 1st

of most years. The editorial policy of the Gazette was not

consistent, however; it did not always list the same commodities

each year, and sometimes it discontinued the cumulative totals

before October 31st.

The WPA compilations (see general note for series Z 1-405)

from the English copies of these same records (PRO C. O. 5)

provide an alternate source for some years. They also dis

tinguish in detail the destination of the various shipments.

Z 308-313. Timber and timber products exported from

Charleston (S.C.) and Savannah, 1754-1774.

Source: Series Z 308-310, 1754-1755, 1760-1764, 1767-1771,

Gayle, cited above for series Z 304-307, p. 31; 1756-1759,

1765, 1772-1774, South Carolina Gazette, Charleston, S.C, vari

ous issues. Series Z 311-313, Oliver M. Dickerson, cited above

for series Z 303, pp. 26-27.

The original figures for Savannah were compiled by the

Comptroller at that port. For discussion of Charleston figures,

see text for series Z 304-307.

Z 314-317. Number of vessels engaged in whaling, and quan

tity and value of oil acquired, Nantucket, Mass., 1715-1789.

Source: 1715-1785, Obed Macy, The History of Nantucket,

Hilliard, Gray & Co., Boston, 1835, pp. 54-55 and 232-233;

1787-1789, U.S. Congress, American State Papers, Class 4,

"Commerce and Navigation" (two volumes), vol. I, Gales and

Seaton, Washington, D.C., 1832, p. 16.

The figures shown on pp. 232-233 of the source are stated

to be from the Massachusetts Historical Society's Collections.

Those on pp. 54-55 cite no authority; however, the Macy

family descended from the first settlers and Obed Macy's data,

which are generally consistent with information from other

sources, provide the best figures now available.

The development of whaling in Nantucket followed the

process typical of all the colonies [Walter S. Tower, A

History of the American Whale Fishery (publications of the

University of Pennsylvania, series in Political Economy and

Public Law, No. 20), Philadelphia, 1907]. The early settlers

first processed drift whales, then they engaged in the offshore

fisheries which probably reached their height at Nantucket in

1726 when 86 whales were taken (Alexander Starbuck, The

History of Nantucket, C. E. Goodspeed & Co., Boston, 1924,

p. 356). The first deep-sea venture occurred about 1712 when

a strong wind blew an offshore vessel to sea where it caught

a spermaceti whale (Macy, cited above, p. 36). By 1746, Nan

tucket whalers were making their way to Davis Straits and

by 1774 they were sailing as far away as the coast of Brazil

(Macy, cited above, p. 54).

The figures for Nantucket may be viewed in better perspec

tive by noting that in 1730 the New England whaling fleet

totaled 1,300 tons, and in 1763 that of Massachusetts con

sisted of 180 sailing vessels. (Raymond McFarland, A History

of the New England Fisheries, D. Appleton and Company, New

York, 1911, p. 86.) At the time of the Revolution, New Eng

land had 304 whalers totaling 27,840 tons out of an estimated

American fleet of 360 vessels (Tower, cited above, p. 45; Star-

buck, cited above, p. 176).

Z 318-329. Daily wages of selected types of workmen, by

area, 1621-1781.

Source: 1621-1670 and 1776-1781, Richard B. Morris, Gov

ernment and Labor in Early America, Columbia University

Press, New York, 1946; 1710, Richard Walsh, The Charleston

Sons of Liberty, University of South Carolina Press, Columbia,

1959.

The figures do not represent actual payments, which may

have been higher, but they represent what the lawmakers

believed was the proper maximum wage rate. Figures are

payments to master craftsmen; journeymen received less (for

example, 20 pence instead of 2 shillings in 1641).

For New Haven there were two wage rates—one for the

summer, which is shown in these series, and one for the

winter. For each occupation the winter rate was 6 shillings

less in 1640 and 4 shillings less in 1641. Apparently the lower

rate for the winter was paid because of the shorter workday.

The legislative rates also throw light on other labor facts.

When New Haven set the rate for mowers in 1640, correlation

of the daily wage (2 s. 6 d.) with the rate for mowing an

acre of fresh marsh shows that they considered it a day's

work, although they believed that mowing a salt marsh would

take longer and be worth 3 shillings. The next year they

confessed the ratio was inadequate when they lowered the

daily wages without board to 20 d. and raised the rate for

mowing to 3 s. per acre for fresh marsh and 3 s. 6 d. for

salt marsh (Morris, cited above, pp. 79-80).

For discussion of the working day, see text for series

Z 330-335.

Z 330-335. Daily and monthly wages of agricultural laborers

in Maryland, 1638-1676.

Source: Manfred Jonas, "Wages in Early Colonial Maryland,"

Maryland Historical Magazine, vol. LI, March 1956, pp. 27-38.

The source also gives additional information on the cost of

living. Its basic data come from scattered items in the

Archives of Maryland (a series of annual volumes published

by the Maryland Historical Society, Baltimore).

753

Z 336-370 COLONIAL STATISTICS

In Maryland, during the first half of the 17th century, the

working month seems to have extended from 23 to 25 days

and the working day from 10 to 12 hours. The 3 winter

months were generally not included within the terms of labor

contracts. Persons hired by the day worked the same hours

and did not get lodging, but received at least 2 meals at the

job (Jonas, cited above, pp. 30 and 34-35). In the other

colonies the working day was probably much the same. New

Haven, for example, specified in 1640 that a day's work was

from 10 to 12 hours in summer and 8 hours in winter (Morris,

Government and Labor . . ., cited above for series Z 318-329,

pp. 59, 79, and 84).

Z 336. Index of wholesale prices estimated for the United

States, 1720-1789.

Source: U.S. Congress, Hearings Before the Joint Economic

Committee, 86th Congress, 1st session, Part II, Historical and

Comparative Rates of Production, Productivity, and Prices

(statement presented by Ethel D. Hoover, Bureau of Labor

Statistics) .

This index (which extends to 1958 in the source) was

obtained by combining and splicing index numbers constructed

by various investigators for different markets, to approximate

a continuous series. The annual indexes were calculated by

working forward and backward from the selected base period,

1850-59. No adjustments were made to the original series for

differences in coverage or in methods of calculation. How

ever, when wholesale prices in two or more markets were com

bined, the necessary conversions to a common base period

were made, and occasional estimates, as noted in other parts

of the source, were used.

For this series, weighted combinations were made of the

available index series for three major markets (Philadelphia,

New York, and Charleston), except for the years prior to 1732

and the Revolutionary War years. For these years, the esti

mates were based on Philadelphia prices only. The weights

used to combine markets were rough approximations, based

chiefly on estimates of the population and trade for each area

and on the representative character and adequacy of the avail

able indexes.

Z 337-356. Average annual wholesale prices of selected com

modities in Philadelphia, 1720-1775.

Source: Anne Bezanson, Robert D. Gray, and Miriam Hussey,

Prices in Colonial Pennsylvania, University of Pennsylvania

Press, Philadelphia, 1935, pp. 422-424.

The primary source of the original data was the list of

"prices current" which first appeared in 1719 in the American

Mercury and which was continued in that and other news

papers. Gaps were usually filled by reference to merchants'

account books and letterbooks (as discussed and listed in the

source cited, pp. 3-5, 351-354, and 434-438). The annual

averages were computed "by taking the arithmetic mean of the

12 average monthly prices in each year. When any monthly

price was missing the available data were averaged quarterly

and the annual figure derived from the quarterly averages.

. . . In some cases it was necessary to estimate a quarterly

price by averaging the last monthly quotation in the previous

quarter with the first monthly quotation in the following

quarter. No annual' price was estimated completely. . . ."

The source volume was sponsored by the International

Scientific Committee in Price History, as were a number of

other studies of colonial prices drawn together in A. H. Cole,

Wholesale Commodity Prices in the United States: 1700-1861,

Harvard University Press, Cambridge, 1938. In addition to dis

cussion and analyses of prices, this publication offers a statis

tical supplement of monthly prices for the principal commercial

centers. The tables in it, however, rest primarily upon the

Philadelphia prices until the 1750's. Prior to 1750, Boston has

only two series, wheat and molasses, which begin in 1720. Al

though there are gaps in the data, Charleston has series for

bread, corn, rice, rum, wine, molasses, and staves beginning

1732; sugar beginning 1744; beef, pork, and indigo in 1747;

and coffee, leather, and lumber in 1749. New York has series

for flour, bread, rice, sugar, salt, rum, and molasses beginning

1748; and for wheat, beef, and pork beginning 1749.

Price series for the following Philadelphia commodities are

shown in the source (not included here because of space

limitations) : Brown bread, white bread, London loaf sugar,

Pennsylvania loaf sugar, indigo, bar iron, pig iron, hogshead

staves, pipe staves, turpentine, and gunpowder. In addition

to the annual averages, the source contains average monthly

prices and monthly and annual indexes (both arithmetic and

geometric) of 20 commodities in Philadelphia.

The unit of measure of Madeira wine (pipe) consists of 110

gallons and hundredweights equal 112 pounds, except for to-

gallons. Barrels, in the case of beef and pork, consist of 31.5

bacco where it equals 100 pounds.

Z 357. Annual rate of exchange on London for Pennsylvania

currency, 1720-1775.

Source : See source for series Z 337-356, p. 432.

This series is derived from data in papers of Pennsylvania

merchants and the Minutes of the Provincial Council (1739),

supplemented in some years by Victor S. Clark, History of

Manufactures in the United States, 1893-1928, vol. Ill, Carnegie

Institution of Washington, D.C., 1916-1949, pp. 361-362.

Bezanson et al., in Prices . . ., cited above, p. 431, also give

monthly rates of exchanges during the same period.

Z 358. Annual price of an ounce of silver at Boston, 1700-

1749.

Source: A. H. Cole, Wholesale Commodity Prices in the

United States: 1700-1861, Harvard University Press, Cam

bridge, 1938, p. 119.

The original shilling prices were taken from the Suffolk

files by A. M. Davis, Currency and Banking in the Province

of Massachusetts Bay, vol. I, Macmillan, New York, 1901, pp.

368 and 370. Where more than one price was; given for a

year, the high and low figures were averaged to determine the

price for that year.

Z 359-370. Partial list of bills of credit and Treasury notes

issued by American Colonies, 1703-1775.

Source: B. U. Ratchford, American State Debts, Duke Uni

versity Press, Durham, 1941, pp. 26-27.

These series attempt to show the issues of bills of credit

and treasury notes emitted by the Colonies between 1703 and

1775. The £82,000 in bills issued by Massachusetts between

1690 and 1702 are not included, nor are the issues of Georgia,

which never had a large debt. Under the trustees, the princi

pal circulating medium in Georgia was the "sola" bills, issued

only in the original by the trustees. A total of £135,000 of

these bills of exchange were issued but only £1,149 remained

unredeemed in 1752. Thereafter, Georgia emitted at least two

issues of bills: One of £3,000 in 1756 and one of £7,410 in

1761 (Ratchford, cited above, p. 19).

Ratchford concedes that the list may be incomplete and

that many of the issues listed were not made at the time nor

in the exact amount stated. Sometimes the law authorizing

the issue constitutes the only evidence, and nothing indicates

"how, when, or to what extent the issue was actually made."

754

DIETS Z 371-405

The original source for 1737-1748 for Massachusetts is A.

M. Davis, cited above in text for series Z 358. Davis ex

pressed all issues in the terms of old tenor (the form of

bills which existed in February 1737). Ratchford did not

follow this procedure because he did not feel sufficiently

acquainted with the circumstances in each case to make the

conversion with assurance. For all other years, the data rest

upon a variety of sources cited in the footnotes of Ratchford's

first chapter, which provide a helpful bibliography for further

reference.

The footnotes to these series indicate the principal purposes

for which the larger issues were made. For years when several

issues appeared for different purposes, the footnotes indicate

the purpose for issuing the majority of the bills.

Z 371-382. Paper money outstanding in American Colonies,

1705-1775.

Source : See source for series Z 359-370, p. 28.

The original sources of the data are various monographs cited

in Ratchford's first chapter. Unfortunately, the authors of

these monographs did not always attempt to find or to make

estimates themselves. Some of the estimates are those of

legislative committees or public officials and, less frequently,

of contemporary writers. Many of the estimates for 1739 and

1748 come from William Douglass whose work is discussed in

Charles Bullock, Introduction, Economic Studies of the Amer

ican Economic Association, vol. II, No. 1. Georgia did not

warrant a separate series, the only estimate being one for

£5,500 for 1761.

For approximately a fifth of the figures, the actual year of

issuance differs from that indicated in this table by one or

two years ; for exact year of issuance, see source.

Z 383-387. Tax collections in America under the different

revenue laws, 1765-1774.

Source: O. M. Dickerson, cited above for series Z 303, p. 201.

Tax records have long been an untapped source of economic

data. Dickerson has gathered figures from the English Treas

ury Papers for both the revenues collected under the Naviga

tion Act of 1673 (25 Car. II c 7) and the new revenue measures

which followed the French and Indian War (1763). He es

timates (p. 202) that seizures (often highly technical) under

the new revenue program cost the Americans not less than

£60,956 "exclusive of fees, direct plunder, and costs of de

fending suits in the admiralty courts."

Z 388-405. Basic weekly diets in Britain and America, 1622-

1790.

Source: Compiled by Austin White (graduate student, Uni

versity of California) based on the following: Series Z 388,

M. S. Rose, A Laboratory Handbook for Dietetics, Macmillan,

New York, 1937. Series Z 389-405, 1622, see source for se

ries Z 43-55, vol. II, p. 318; 1632, E. M. Leonard, The

Early History of English Poor Relief, Cambridge University

Press, Cambridge, 1900, pp. 198-199; 1638, John Josselyn,

"An Account of Two Voyages to New England Made Dur

ing the Years 1638-1663," Massachusetts Historical Society

Collections, Third Series, III, 1833, pp. 220-221 ; 1676, Philip A.

Bruce, Institutional History of Virginia in the Seventeenth

Century . . ., vol. II, Putnam, New York, 1910, p. 87; first

half of 18th century, William Douglass, A Summary, Historical

and Political, of the First Planting, Progressive Improve

ment, and Present State of the British Settlements in North

America, vol. I, R & J Dodsley, London, 1760, p. 536; 1735,

Abbot Smith, Colonists in Bondage, University of North

Carolina Press, Chapel Hill, 1947, p. 212; 1744-1746, Howard

Chapin, The Tartar, the Armed Sloop of the Colony of Rhode

Island in King George's War, Providence, 1922, p. 17; 1747,

Isabel M. Calder, Colonial Captivities, Marches, and Journeys,

Macmillan, New York, 1935, p. 40; 1755, Basil Sollers, "The

Acadians (French Neutrals) Transported to Maryland,"

Maryland Historical Magazine, vol. Ill, March 1908, pp. 8-10;

1757, John Fitzpatrick, ed., The Writings of George Wash

ington, vol. II, U.S. Government Printing Office, Washington,

D.C., 1931, p. 72; 1761, "Brigade Order Books, Montreal, Sep

tember 29, 1761," Journals of the Hon. William Hervey, from

1755 to 1814, Paul and Mathew, Bury St. Edmunds, England,

1906, p. 154; about 1770, Walter Besant, London in the

Eighteenth Century, A & C Black, London, 1903, p. 556; 1775,

Fitzpatrick, cited above, vol. Ill, p. 409; 1776, "Journal of the

Committees of Observation of the Middle District of Frederick

County, Maryland," Maryland Historical Magazine, vol. XI,

December 1916, p. 310; 1780 (Continental Army), John W.

Wright, "Some Notes on the Continental Army," William and

Mary Quarterly, vol. XI, 1931, p. 105; 1780 (French prisoners),

Rupert C. Jarvis, ed., Customs Letter-Book of the Port of

Liverpool, Manchester, 1954, p. 106; about 1790, Fitzpatrick,

cited above, vol. XXXI, pp. 186-187; before 1861 (majority of

slaves), Kenneth Stampp, The Peculiar Institution, Alfred A.

Knopf, New York, 1956, p. 282.

The caloric contents of the weekly diet have been divided

by 7 for greater ease in comparing them with modern charts

which are usually stated in daily terms.

The data from The Writings of George Washington have

been calculated on the basis of the ratio for an adult male.

Women slaves referred to in Washington's diary were assumed

to require % of that of a man; children, %. A barrel of corn

was calculated as weighing 196 pounds; a barrel of fish, 290

pounds.

755

Z 1-20 COLONIAL STATISTICS

Series Z 1-19. Estimated Population of American Colonies: 1610 to 1780

Colony

WHITE AND NEGRO

Maine (counties)New HampshireVermont -PlymouthMassachui

Rhode Island .Connecticut. _New YorkNew Jersey. . .Pennsylvania.

Delaware

Maryland.Virginia

North Carolina.

South Carolina.GeorgiaKentuckyTennessee.

NEGRO

Total

Maine (counties) 1New Hampshire..VermontMassachusetts '..

Rhode Island .Connecticut. .New YorkNew JerseyPennsylvania .

DelawareMarylandVirginiaNorth Carolina.

South Carolina.GeorgiaKentuckyTennessee

1780

2.780,369

49,13387,80247,620

268,627!

52,946:206,701210,541139,627327,305

45,385245,474538,004270,133

180,00056,07145,00010,000

575,420

1770

2,148,076

31,25762,39610,000

1760

,593,625

39,093

45854160

4,822

'2,671•5.885

21,05410,4607,855

2,99680,515

220.58291,000

97,00020,8317,200|1,500;

235,308

58,196183,881162,920117,431240,057

35,496202 , 599447,016197,200

124,24423,37615,7001,000

459,822

222,600

45,471142.470117,18893.813183.703

33,250162.267339 . 726110,442

94,074

9,578

1750

27 , 605

188,000|

33,226111,28076,69671,393119,666

1740 1730 1720 1710

905.563 629,445 466, 185 331, 71 1 250, 888 210,372

1700 1690

23,256

151,613

25,25589 , 58063,66551,37385,637

10,765

114,116

16,95075,53048,59437,51051,707

9,375 5,681

91,008,

11,68058,83036,91929,81830,962

4,958

28,704 19,870 9,170 6,385141,073 116,093 91,113 66,133

231,0331180,440 114, OOOj 87,75772,984 51,760 30,000 21,270

325,806

47565425

4,754

3,7615,69819,1128,2205,761

1,83663,818187,605|69,600

75,17810,6252,500

200

600

64,0005,200

236,420

4,866

3,4683,78316,3406,5674,409

1,73349,004140,57033,554

67,3343,578

4,075,

3,3473,01011,0145,3542,872

1,49643,450101,45219,800

39,0001,000

45,000 30,000 17,0482,021

150,024 91 ,021

500 200

3,035 ~"2;780

2,4082,5988,9964,3662,055

1,03524,03160,00011,000

30,000

1,6481,4906,9563,0081,241

68,839

170,

2,150|

5431,0935,7402,3852,000

62,390

7,57339,450121,62519,87224,450

55,941

5.89425,97019,10714.01017,950

4,164

7,42449,504

4,22421,64513,9098,000

11,450

3,645 2,4701 1,48242,741 29.604 24,02478,281 58.560 53,04615,120 10,720 7,600

10,883

44.866

150

478! 70017,220 12,49930,000 26.6596,000, 3, 000|

20,000 12,000

1,310

375750

2,8111,3321,575

5007,945

23,118900

4,100

1680

151 ,507

2,047

6,40039,752

1670

,935

1,805

5,33330,000

1660

75,058

1 , 555!

3, 017| 2,15517,246 12,603

5,704

27,817

130

'800

300450

2,256840430

1353,22716,390

415

2,444

3,900

16,729

9,8303,400

680

1,00517,90443.5965,430

1,200

6,971

400

250200

1,670450270

822,1629,345

300

1,500

5,7541,000

1,980'20.082

1,53917,9804,936

1650

50.368|

1,0001,305

1,56614,037

7864,139

1640

9001.055

1,0208,932

3001,472

4,116 1.930 350

700 540 185.13.226 8,426 4.504 58335,309 27,020 18,731 10.442 2,5003,850 1,000

200

4,535

170

17550

1,20020025

551,6113,000

210j

20ol

65

"i60

116U

SO

401,190.2,000

150

8ol

2,920

50

"422

6525600

30758950211

4(1

295

2520500

16300405

597

3H

150

IE

20150

1 For 1660-1760, Maine Counties included with Massachusetts.' Plymouth became a part of the Province of Massachusetts in 1691.

* Includes some Indians.4 Includes 20 Negroes.

SeriesNo. Colony

514

WHITE AND NEGROPlymouthVirginia

1620

102•2,200

1610

350

Series Z 20. Percent Distribution of the White Population, by Nationality: 1790

Area Total English Scotch

Irish

Ulster FreeState

German Dutch French Swedish Spanish

Total

Maine.New Hampshire- —VermontMassachusetta --

Rhode Island

Connecticut -New YorkNew Jersey -Pennsylvania -

Delaware

Maryland and District of ColumbiaVirginia and West VirginiaNorth CarolinaSouth Carolina—Georgia —Kentucky and Tennessee.

OTHEI

Northwest Territory. .Spanish, United StatesFrench, United States .

100.0

100.0100.0100.0100.0100.0

100.0100.0100.0100.0100.0

100.0100.0100.0100.0100.0100.0

100.0100.0100.0

B0 9

60.061.076.082.071.0

67.052.047.035.360.0

64.568.566.060.257.467.9

29.82.611.2

8.3

4.66.25.14.46.8

2.27.07.78.68.0

7.610.214.816.116.610.0

4.10.31.6

6.0

8.04.63.22.62.0

1.85.16.311.06.3

5.86.25.79.411.57.0

2.90.21.1

3.7

8.72.91.91.30.8

1.13.03 23.56.4

6.55.55.44.43.86.2

1.80.10.7

8.7

0.88.29.2

33.31.1

11.76.34.75.07.614.0

4.30.48.7

3.4

0.317.516.61.84.3

0.60.30.30.40.21.3

1.7

1.30.70.40.80.8

0.93.82.41.81.6

2.2

67.1

64.2

0.7

0.1

0.53 90.88.9

96.512.5

1 Corrected figure; does not agree with source.

756

EXPORTS AND IMPORTS Z 21-34

Series Z 21-34. Value of Exports To and Imports From England, by American Colonies: 1697 to 1776

[In pounds sterling. For years ending December 24, except noted]

Year

1776 _.

1775 ""1774,..17731772

1771

1770176917681767..1766 __

176517641763 _.1762...1761

1760...175917581757 ""1756... "

17551754. ~"

175317521751

17501749174817471746.

1745..1744

174317421741

17401739173817371736.

17361734...17331732 _1781

1730

1729172817271726..

172617241723 _17221721

17201719171817171716

17151714171317121711

1710.1709170817071706

17051704170817021701

170016991698 «1697'

Total

Exports Imports

21 22

103.964!1,920,950!1,373,8461,369,2291,258,5151,339.840,

55,415196,162

2,590,4371,979,4123,012,6354,202.472

New England

Exports | Imports

23

1,015,535 1,925,5711,060,206 1,336,1221,251,454 2,157,2181,096,079 1,900,9231,043,958 1,804,333

1,151,6981,110,5721,106,170742,632847,892

761,099639.909670,720610,684659,356

939,5531,007,759972,740

1,004,182835,661

814,768668 , 524716,626660,715559 , 500

654,431667,524880,807659,227912,291

718,416754,276620,212775,382699,764

652,326611,350669,633519,036660,863

572,585576,282605,324637,135526,303

415,650462,681461,761437,696493,871

468,188463,054

'457,471'426,090'424,389

■297,246■395,774

'303,222'365,971'824,698

'249.814'324,534286,435284,798187,073

160,961321,972204,295835,788309,134

395,021255,397226,055279,852

1,944,1142,249,7101,631,9971.377,1601,652,078

2,611,7642,345,4531,712,8871,628,3481,852,178

1,112,9971,176,2791.452,9441.148,1271,233,168

1,313,0831,230,386830,433726,669755,926

635,253640,881829,273800,052885,492

818.382695,869751,270682,434677,624

668.664556,275548,890531,253536.266

536,860422,958617.861502,927653,297

649,693461,684411,590424,725331,905

319,702393,000'425,333'439,666'402,042

'452,366'388,443■284,556

'309,691'297,626

'298,659'269,596240,183413,244161,691

291,722176,088296,210186,809343,826

344,341403,614458,097140,129

762116,588112,248124,624126.265

24

55,050|71,626

562,476527,055824 , 830

160,381 1,420.119

148,011129,353148,375128,207141,733

145,81988,15774,81541,73346,225

37,80225,98530,20427 , 55647,359

59 , 53366,53883.39574,31363,287

48,45539,99929,74841,77138,612

38,94850,24863,18553,16660,052

72,38946,60459,11663.34766,788

72,89982.25261,98364.09549,048

54,70152.51264 , 68975,05263,816

72,02169,58559,33747,95550,483

49,20654,45261,59158,89869,595

66,55551,54149,90424,69926,415

81,11229.55949,63538.79322,210

22,79330,82333,53937.02632,656

41,48626,66031,25426,282

New York

Exports I Imports

25 26

394,451207,993419,7971406.081409,642

451.299459,765258,854247,385834,225

599,647527,067465,694363,404384,371

841,796329,433345,523273,340305,974

343,659238,286197,682210,640209,177

140,463143.982172,461148,899198,147

171,081220,378203,233223,923222 , 158

189,126146,460184,570216,600183,467

208,196161 , 102194.590187,277200,882

201,768168,507176,486183,722114,524

128,767125,317181,885132,001121,156

164.650121,288120,778128,105137.421

106.338120,349115.605120,63157,050

62.50474.896

69,60864,62586,322

91,918127,27993,51768,468

2,318 _187.018;80,00876,246

82,707i95,875,

69,88273,46687,11561,42267.020

54,95953,69753,99868,88248,648

21,12521,68414,26019.16824.073

28,05426.66350,55340,64842,363

35,63423,41312,35814,9928,841

14,08314,52715,06713,53621,142

21,49818.45916,22816.83317,944

14,15515,30711,6269,41120,756

8,74015,83321,14131,61788,307

24,97621,19127,99220,11815,681

16,83619,59627,33124,53421,971

21,31629,81014,428|12,46612,193

8,20312,25910,84714,2832,849

7,89310,6407,4717,96518,547

17,66716,8188,763

10,093

Pennsylvania

Exports I Imports

27

1,228437,937289,214343,970653,621

475,99174,918

482,930417.967330,829

382,349615.416238,560288.046289,570

480,106630,785356,555353,311250,426

151,071127.497277,864194.030248,941

267,180265,773143,811137,98486.712

54.957119,920135,487167,591140,430

118.777106,070133.438125,83386.000

80,40581,75865,41765.54066,116

64,35664,76081,63467,45284,866

70,65063,02063,01357,47850,754

87,89756,35562.96644,14062,173

54,62944,64346,47018,52428,856

81,475134,57726,89929,85531,688

27,90222,29417,56229,99181,910

49,41042,79225,27914,679

1.421175,96269.61136,65229 , 13331,615

28,10926,11159,40687,64126,851

25,14836,25838,22838,091S9,170i

22,75422.40421,38314 , 19020,095

32,33630,64938,52729,97823,870

28.19114,94412.3633,83215,779

10,1307,4469.5968,52717,158

15,0488,13411,91815,19820,786

21,91920,21714.7768,52412,786

10.5827,43415.23012,8235.960

11,9814,0578,3826,8828.037

7,9286,5645,5884,4996.193

6,4612,663

1781,471

1,277617

2,120786

4,210

1,3092,4306,1604,1465,220

4,6081,4772,7203,347

28

1625426507

728

184199432371

827

86S435284206204

70749826026H

200

144244245201190

217238758273

5462797591

6654615661

48544041

44

48293731ST

4230152621

2427222221

17

14178

19

856

1411

71199

12

1817102

Virginia andMaryland

Exports Imports

29 30

36536665244S909744

881909107830314

868191152199067

998

161953426169

456647644666917

713637330404699

280214340295010

751452450690

618

804392565698260

592799478979634

209324992397548

681068716505842

182927037464408

594881722365037

206819

899342003

529064704

997

73758612589528577

435361406437

461

606559642415455

504357454418337

489573632569460

508

434494492419

899402557427

677

841444391492380

394373403310408

846386413421324

214277287283

867

881332316296281

174280206297273

188261213207149

116264144274235

817198174227

226356030803404848

091892048926693

671408294709083

461228362881

769

668435574453085

618852619371

423709821769

109

997654814246163

995090198799502

174089588

767

780344997091812

482069576884

343

756470263941181

429668493625152

768112928782738

302115053

756

Carolina

Exports

31

Imports

32

1,921628,738328,904793.910920,3261

717,782488,362475,954437,628372,548

383,224515.192555,391417.599

546.350

605.882459,007438,471426,687834,897

286,157323.513356,776825.151347,027

349.419323,600252.624200,088282,645

197.799234,855'328.195264,1861248,582

281.428217,200258.860211,301204,794

220,381172,086186,177148,289171,278

150,931108,931171,092192.965186,981

195,884161,894123,853172,754;127,876|

110,717164.630191,925215,962179,599

199,274128,87376,304

134,583|91,535

127,63980,26879,061

237,90168,016

174,32260,458196,71372,391199,683

173,481205,078310,13568,796

13,668579,549432.302466.513425,923420,311

278,907387,114508,108395,027293 , 587

386,918841,727282,366181,695253,002

162,769206,534150,511130,889222,915

325,525807,238164,634288,264245,491

191,607150,499167,305107,50076.897

91.847192,594235,136154,607286,830

266 . 560286,192141,119187,758214,083

146,348120.466177.845126,207159.771

151,739113.32991,17596,05593,453

91,94290,50478,10379,65061,858

62,73650,37346,38541,27546,287

29,15881,29082,44929,39412,871

20,79320,43110,34023,3118,652

2,69814,06713,19711,87016,973

14,05812,3279,26512,374

Georgia

Exports

33

6,245378,116344,859449,610409,169

146,273306,600289,868244,093296,732

384,709305,808250,132194,170254 , 587

218,131215,255181.002213,949181,780

187.887149,215213,009150,777138,244

133,037164,085160,17295,529102,809

86,81679,141111,499127,063204,770

181,82194.44587,79358,986

101,147

117,83799,65870.46658,29871.145

64,78558.36633 , 06723,25443,934

39,18237,83942,24634,37417,703

18,29019,63015,84125.05827,272

16,63123,71223,96720,01520,406

19,61328,52111,99610,4924,001

19,7886,62112,42810,46013,908

11,00311,40118,4625,289

12 . 569103,47767,64785.39166.08363,810

65,53282,27042,40235.85653,074

34,18331,32514,4696,5225,764

12.1986,074

7,155

4,4373.2368,0671,626

555

1,94251

21,622

92423317

3,01018

203

Imports

' Corrected figures. Figures shown in source for 1709-1718 incorrectly presentedas totals of components.

' For years ending Sept. 28.

757

Z 35-55 COLONIAL STATISTICS

Series Z 35-42. Value of Exports To and Imports From England by New York: 1751 to 1775

[In pounds sterling. For years ending December 24. Foreign manufactures "In time" are those which could receive a drawback (refund) of duties; "Out of time" are thosewhich could not. Outports are all ports in England other than London]

Year

Between New York and London

Exportsto

London

35

Imports from London

Englishmanufac-

36

Manufactures of othernations

In time

37

Out of time

Between New York and outports

Exportsto

outports

Imports from outports

Englishmanufac

tures

Manufactures of othernations

In time Out of time

41

17751774177317721771.

17701769176817671766

17651764176317621761

17601759175817571766

17551754175317521751

95,10649,38154,47658,74372,895

65,19238,58650,51035.50245,683

38,23328,92229,97817,73016,721

6,32810,0123,4429,82813,136

17,98721,28945,86638,48536,997

1,140250,728127,433183,663893,345

284,97348,991

299,481258,012184,866

217,488336,352133,444216,16589,631

387,839483,952263,290228,378169,234

114,45187,499199,578124,329124 , 190

5561,90869,94230,80966,842

45,4943,900

96,38157,58618,940

20,28837,48630,09423,35725,851

42,12459,80430,13643,14931,753

17,09713,50125,76921,84625,530

10,6124,20510,24623,031

15,2482,3258,11117,70547,374

81,31299,03234,14028,0917,103

18.06558,82643,94637,5229,478

4,1917,845

24,95128,91648,177

91,91230,62721,77123,96422,981

14,69134,88136,60625,92121,338

16,72724,77624,01141,15231,927

14,79711,67310,8199,34010,937

10,0675,3744,6872,1645,867

108.27171,470111,175158,764

119,45116,32772,48475,24958,024

42,28534,25038,02419,96218,449

28,62823,90316,15484,78031,311

14,75613,60016,82513,11833,191

335,67316,1667,688

11,588

10,5553,2306,1809,06718,285

19,9097,8372,828

4728,927

2,9954,3002,7728,8648,253

5255,05210,4185,213

17,072

746

39052

272146293339

3.341

1,06845930

455

256620

51

325613780

Series Z 43-55. Tonnage Capacity of Ships and Value of Exports and Imports of American Colonies, by Destination

and Origin: 1769 and 1770

(Value of exports and imports in pounds sterling. For years ending January 4 of following year]

Year and destination or originTotal

NewHampshire

Massachusetts

RhodeIsland

Connecticut

NewYork

NewJersey

Pennsylvania

Maryland

VirginiaNorth

CarolinaSouth

CarolinaGeorgia

1770 TONNAGE

43 44 45 46 47 48 49 50 61 52 53 54 55

351,664 20,192 70,282 20.661 20,263 26,653 1,181 49,654 33,474 45.179 21,490 32,031 10.604

Great Britain and Ireland ■98,825

37,237'108,050107,552

1,910186

12,4195,678

18,7785,419

20,95730,128

956755

6,77912,172

426180

9,9239,734

7,3573,0187,0059,273

7,99911,39514,83915,421

17,9675,8375,1185,052

25.1233,682

7.393! 12.457 3,460320

5,1791,645

Southern Europe and Africa 6556,8936,649

6.2918,1945,089

British and foreign West IndiesAmerica, Bermuda, and Bahamas

648 10.0966,278533

VInward bound 331,942 15,362 65,271 18,667 19,223 25,539 1,018 50,901 30,477 44.803 20,963 29,804 9,914

Great Britain and Ireland 82,93437,717106,713104,578

1,200 . 13,9166,21319,91725,225

400101

7,12111,045

210 5,7223,3548,6957,768

7,91715,01015,88312,091

13,6935,0056,0936,686

21,2364.4039,5479,617

6,202440

5,9308,391

10.163 2.275Southern Europe and Africa 140 2,256

10,5886,797

7954,6182,226

British and foreign West IndiesAmerica, Bermuda, and Bahamas

10,3003,862

8,65610,357

365513

1769 TONNAGEOutward bound _ 339,302 19,744 63,666 17,775 17,966 26,859 1,093 42,986 30,996 52,008 23,113 33,855 9.241

Great Britain and Ireland 99,12142,60196,382101,198

2,822170

12,8783,874

14,044 640863

6,06010,312

580200

9,2017,986

6,4703,4835,466

11,440

7,21912,07011,95911,738

16,1166,2243,3585,298

24,5947,486

7,8061,0306,9457,333

15,9025,7736,3775,803

3,029200

4,6541,368

Southern Europe and Africa 5,10217,63226,988

British and foreign West Indies- .America, Bermuda, and Bahamas

555538

11,3978,531

332.146 16,446 66,451 16,836 18.016 26,632 936 45,028 30,688 47,237 23,076 31,107 9,693

Great Britain and Ireland - 90,71084,15194,916112,369

915480

9,5006,551

14,3406,59617,89827,618

415226

5,95810,237

150105

7.7909,971

5,2242,7306,96411,714

9,30910,74512,52112,453

15,4864,0964,6336,574

20,6524,60011,61210 373

6,415 15,281700! 3,325

6,702 6,8939,2691 5,608

2,523625

4,2882.357

Southern Europe and Africa 25257654

British and foreign West Indies.America, Bermuda, and Bahamas

1769 VALUEExports 2.852,441 550, 090 231,906 2,532 410,757 991 ,402 569,585 96,170

Southern Europe and Africa1,531,516673,015747,910

5611 86,503 ! 9,25540.431 123,894! 65,207

142 776 1 118.382

2,66779,395

52 , 19966,325 2;582

1,991

28.112204,313178,331

759,96166.5561 73,63522,3031 68,946

406,0153,3101 73,501

27,944) 59,815

82,270614

13,286

2,623,412 564,034 188,976 399,821 851,140 535,714 81,736

Great Britain 1,604,976228,682789,754

223,69621,9081 2,761165,387 66,840

75,98115,62597,420

204,98014,249

180,592

714,94410,083 16,46232,198 77,454

3272,01310,604

,084 58.34113,9879,408

Southern Europe and Africa 65248,529

26763,994

3271,664

130,34766,666West Indies

1 Figures disagree with source used here (Macpherson); corrected to agree with Bum of components and with original source (PRO Customs 16/1).

758

SHIPS Z 56-75

Series Z 56-75. Number and Tonnage Capacity of Ships Outward and Inward Bound, by Destination and Origin:

1714 to 1772

[Prior to 1768, for years ending December 24, except aa noted; 1768-1772, January 4 of following year. In some yeara, detail will not add to total aince ships \counted twice; see text]

Destination or origin

1772

Number

Tonnage

1771

Number

Tonnage

1770

Num- Ton-ber nage

1769

Number

Tonnage

1768

Number

Tonnage

1765-66,tonnage 1

1755

Num- Ton-ber I nage

1764

Number

Tonnage

1714-17'

Num- Ton-ber nage

Outward bound 845 42,506 794 38 , 995

Great BritainIrelandEurope _AfricaBahama IslandsBermuda IslandsCaribbeanThirteen ColoniesOther American Colonies .

Inward bound _

571

115

81

178443141

852

Great BritainIrelandEuropeAfricaBahama Luanda

Bermuda IslandsCaribbeanThirteen ColoniesOther American Colonies.

20

111

20442796

6,178,17055542021570

10,70817 , 5286,667

43,633

H 5,750'

224

121

136•139

125

821

1,11326732040

9,17116,7646,570

39,420

131464123

819

9,326

11343

7,502

i;055

74

23

34070

12,46914,7135,873

2196382143

21586

12,15612,8275,581

411

188422107

36 . 965 828 37,045 612 33,695 30,444 21,295 447 26 . 669 416 20,927

5,819

8134151100

8,24816,6384,932

38,360

661

20

46

1143

6,70760

1,081495175|20

8,995

6,428170

1,833

457 16,132ISO 8,880

40.483

6,830

1,640

11045

11,08814,1184,629

6!1

172480164

147 10,095281 11.45198 4,218

7,333100

2,129

16020

10,49514,2006,046

5,286436

1,07527660

2,975100

1,863

7,80611,9263,590

3133122HI

31.983 33,786

6,946220

1,871

160 10,811204 8,26691 3,869

5080

7,9454,8643,438

14,585

7,16380

2,018

3,040

851,963

16380

6,29614,37513,612

24814928

602,3915,6611,476

,510165,465

75|260

3,986

14915676

303

10,5217,0523,621

17,575

41 1245 124

191 10,897

11728 1

W

4,448110

2,763

345

7113911

4,4325,847

445

3,683891

(•)

1772 1771

Destination or originNo

Outward bound. 700

Great Britain.IrelandEuropeAfrica

Bahama ]Bermuda ]CaribbeanThirteen ColoniesOther American Colonies.

Inward bound.

391948

968

19982464

710

Great Britain .IrelandEuropeAfrica

611138

Bermuda IslandsCaribbeanThirteen ColoniesOther American Colonies -

116

20885224

Tonnage

28.574

4,2801,6102,4492608885

8,0768.8592,867

28,861

6,117915

2,480

268215

8,1709,2471,449

Number

524

4f,27404

76

19413467

557

631327

94

22018437

Tonnage

25 , 433

1770

Number

612

4,8302,4762,029

115135153

7,7084,9683,019

25,042

6,8501,4111,344

210105

8,1916,4161,615

462958284

18918888

391914

4111

22621789

Tonnage

26,653

4,6652,6922,920

9814496

7,0055,6658,879

25,539

4,0551,6673,124

23028430

8,6955,9411.613

1769

Number

787

473078

I28

12643062

725

411839142

17939447

Tonnage

26 , 859

3,9652,5158,27820585127

5,4669,0682,210

26,650

3,7851,4352,700

304290

6,9649,8841,720

1768

Number

480

563045247

16612566

462

79153129

816813926

Tonnage

1765-66,tonnage 1

23,566 19,862

5,1802,5222,360

8667172

6,9818,7542,545

21,847

2,8722,0853,190

29050

1908,3851,1291,721

18,214

7,1581,3871,500

130204116

6,3013,9521,100

4,8428807102957545

8,2652,460

662

1764,tonnage *

16,982

2,9521,8821,08714093

2307,8981,4961,205

16,750

4,0401,6472,385

103370

7,480646130

1763,tonnage 4

15,741

2,0791,4601,000

7035115

7,5072,4601,025

11.129

3,980550

1,89065

205200

4,124615

1754 < 1739 1735 1734 1783 1727 1726 1715-18'

SeriesNo.

Destination or originNumber

Tonnage

Number

Tonnage

Number

Tonnage

Number

Tonnage

Number

Tonnage

Number

Tonnage

Number

Tonnage

Number

Tonnage

56

NEW YORK—Con.

Great Britain

322 13,322 269 10,012 207 7,358 184 6,374 223 7,704 214 8,052 211 7,855 215 7,464

57586960•162636465

812819488

1805112

2,0861,6167251306076

6,3612,076

440

91621

795820

1,040

12317

838200904

829114

87705

645160475602090

2,7711,959278

966

690160

11 1,030 12 988 21 1,461

276 6 465 8 615 10136

104688

6304075107

3,6081.406

187

Bahama Luanda 13

1139710

2078

4,8382,461

505

31

95735

6046

2,8862,821

250

4 146168

8,6242,849

306

Caribbean6

103866

6104

1604,1492,138

89590

903,8782,761

155Other American Colonies862 110 6

66 266 10,921 261 9,738 196 6,759 213 7,442 217 7,438 215 7,672 202 7,716 (') (■)

676869707172737476

Great Britain 281025668

177287

2,475650

274

2,224860

1,320

26

826

1,648240

1,436

184

24

1,350216

1,571

24 1,823100

17 1,478 811

2,47080

6151,05620612080

22812 640 7 420 10

1Africa 1 12066

25Bahama Islands--- 1

141059311

20426

8,6432,069

321

2188847

40 6197871

145625

2,7071,866241

8169778

2119687

40Bermuda Islands 365

2,509882124

4268,2711,629

3068,7761,768

98569

2758,0721,452

Caribbean 6,020981280

Thirteen ColoniesOther American Colonies 6 6 6 204 8 135 6 149

1 Ending date of year unknown. For Boston, figures given in source for trade withthe remainder of Massachusetts do not follow pattern of other entries and are. therefore, not a component of total. Totals were not taken from source but represent sumof detail as shown in source.

* Annual averages for years ending June 23. For Boston, thenot equal the total shown since the total includes eni

1 Not available.4 For year ending January 4 of following year.

i of the detail does.tries for unknown ports.

759

Z 56-75 COLONIAL STATISTICS

Series Z 56-75. Number and Tonnage Capacity of Ships Outward and Inward Bound, by Destination and Origin:

1714 to 1772—Con.

SeriesNo.

Destination or originNumber

1772 1771

Tonnage

1770

Number

1769

Number

1768

Tonnage

1765-66,tonnage <

1734.number

1733,

"beT

PHILADELPHIA

Outward bound

Tonnage

Number

Number

Tonnage

Tonnage

66 759 44,822 741 43,029 . 40.871 641 36,944 39.262 191 18669

675869606162636465

2324881

114

26830733

3,1232,4918,415

20282125

15,67412,8721,820

2726793133

23033229

3,2223,4707,110

2549

3,2084,79110,940

3732136

1

4,0493,17012,040

SO

40 4,1343,4827,266

1.8304,8304.465

800317242

13,49410,8342,960

2116

1217201

3888 22

Africa. 90263

.25

Bahama Islands 102

12675

13,84212,3701,940

Bermuda Islands _ 65 820622937

10012,0198,1161,838

«74

28745

Caribbean 13,44913.6551,725

24328332

20224624

11,1149,0851,383

Thirteen Colonies- . 502Other American Colonies _ _ 2

66 730 42,300 719 41,740 750 47.489 698 | 42,333 528 34.970 36,872 210 190

676869707172737475

631288

7,7571,1268,120

711669

8.1671,5456,345

4226154

4,7052.26713,620

46 5,5042.9959,685

60

1563

6,9241,470

4,4554,1004,230

40405425

11,7249,6881.805

241117

268

16Africa

32108 6,001

Bahama Islands 102

247287

24770

126

208155

13,39711,058

875

111

15610Bermuda Islands 8 110 12

7968

107758

Caribbean 12,94711,0241,010

23229419

22127421

14,94610,6701.115

214248

11,7269,1603,263

139 11,677218 7,97830 1.810

Thirteen ColoniesOther American (Colonies 21 56

1

SeriesNo.

Destination ororigin

1772 1771 1770 1769 1768 1752 1739 1733 1731 1727

HAMPTON

Number

Tonnage

Number

Tonnage

Number

Tonnage

Number

Tonnage

Number

Tonnage

Number

Tonnage

Number

Tonnage

Number

Tonnage

Number

Ton-age

Number

Tonnage

56 Outward

bound 356 22,293 301 18,593 244 13,851 266 17.046 246 3,966 82 3,769 1*1 4,501 104 4,57715,776 156 8,008 98

6758696061626364

Great Britain 36 5,454 343

20

4,630360

1,790

272

16

3,184 291

4,110100

2,096

331

14

6,252200

1,209

20 2,285 6 745 11 1,110 16 1,633 22 2.046Ireland _ 270

1,405Europe 14 1,155 20 14118

1,1952515

2203,462

7 410 6 440 6 300 2 60AfricaBahama Islands-Bermuda Islands

810

206

60235

11,930

35

180

55123

9,450

312

141

30306

7,410

63

146

6568

8,136

67

148

115

Caribbean206

7,376 818

44240

1.6075

60140

1,6641363

3321,795

1941

4881.366

ThirteenColonies 88 3,459 66 2,285 42 1,156 59 2,396 87 1,369 31 806 83 964 10 415 14 441 20 622

65 Other AmericanColonies 2 90 2 75 1 50

66 Inwardbound 317 21,857 18,915 254 87 4,816 88332 23,966 282 281 19,843 19,673 169 10,557 102 5,746 5.009 94 4,023

6768697071727374

Great Britain...Ireland

621

11.623170

621

10

8,216ISO878

562

8,320195

591

16

8,532105

1,596

55 8,411 37 4,912 21 2,635 19 2,286 21 2,525 18 1.786

Europe. 10187

158

1,05015080

185

18158

132

1,08010355

198

9 1,065 10214

1,01514015

120

5 330 4 440 1 40 2 130Africa... 1 25

60181

1,769

Bahama Islands.Bermuda Islands

66

156

105150

8,532

7

9134

80236

7,575

33

134

3575

8,1529

40830

1,579

25

606

46127

1,760

11687

120421

1,273Caribbean 8,598 6,298 78 3,680Thirteen

75Colonies .

Other American88 4,025

85

77 3,846 64 2,656

10

50 1,425 60 1,935 37 775 29 1,122 10 861 16 667 20 294

Colonies. _- _ 2 1 6 295

1772 1771 1770 1769 1768 1735 1734 1732 1781

SeriesNo.

Destination or originNum-her

Tonnage

Number

Tonnage

Number

Tonnage

Number

Tonnage

Number

Tonnage

Number

Tonnage

Number

Tonnage

Number

Tonnage

Number

Tonnage

56

CHARLESTON (S.C.)

486 31.548 487 31,031 461 29,976 433 31,147 42S 31,551 247 14,530 219 12.841 183 10,322 198 12,366

575859606162636465

Great Britain... 115 15,610 ny 15,792 81 11,727 10! 14.681 121 16,878 88 7,919 81 7,330 73 6,234 94 8,424

Africa162

1,774290452323

5,7496,724

626

261

2,88230

497398

6,1314,875

426

63 6,291 66 5,778 *t 6,615 30 2,685 22 1,830 20 1,666 15 1.185

Bahama IslandsBermuda Islands

25 25 2111

1639824

690343

7,8748,012

539

168

113106

333205

5,8073,698

650

22i

345293

6,8082,862

865

41 582 281

38540

1,8691,897

2223333

24940

1,1341.000

231

3431

1

404

Caribbean11

129166

12163124

118 22661

6702,644

30

2869

201,2801.059Thirteen Coloniei

Other Americanl

21 17 25833S 14

66 Inward bound. . . 462 29,933 489 31,692 466 27,664 433 29,096 44J 34,449 232 13,220 226 13,278 174 9,504 191 12.101

•76869707172737475

Great Britain. 791124252214

12013819

10,9321,1102,6662,171

686386

6,1215,638

626

798

2111292016313281

11,878310

2,861993617606

8,2085,788

931

61 9,153440

115 14,551 13S11If

18,1251,0102,023

574

4,896820

63 5.122700

43 3,660204980495293230

2,2251,843

74

55 5,37574

870765264198

8,5012,030

74

Ireland C20

717

812

110Europe 2,266 13

212010

11410436

1,3102,216

245396

6,1233,0711,186

389

271

426716

8,13088545370

1,600645

445115

Africa 730

621

918Bahama Islands 22

1618411633

466895

9,563

4,2231,058

21 35627,3

8,2383.4101,015

Bermuda Islands ( 46064

74642

95542

Caribbean . 129 2,039 3,666Thirteen Colonies at 2,743

2542,826

56Other American Colonies 38 4 2 8

1 Ending date of year unknown.

760

EXPORTS AND IMPORTS Z 76-107

Series Z 76. Value and Quantity of Articles Exported From British Continental Colonies, by Destination:

[Value In pounds sterling, quantities in units as indicated. For year ending January 4 of following year. Includes Newfoundland. Bahamas, and Bermuda]

1770

Article

Total...

Foreign merchandise(mostlyfrom WestIndies)

Articlesshipped asAmericanproduce

Potash tons.Pearlash do.Spermaceti

candles—lb.Tallow

candles. ..do.

Coalchaldrons.

Castorium. - lbFish, dried

quintals.Fish,

pickled. _bbl.

Flaxseed bu.Indian com .do.

Oats doWheat doPeas and

beans do.Ginseng lbHemp cwt

Iron, pig ..tonsIron, bar doIron, cast ..doIron, wrought

tonsIndigo lb

Whale oil .tonsWhale fins, .lbLinseed oil

tonsCopper

ore doLead ore— do

Bread andflour do

Meal buPotatoes doBeef and

pork bbl

3,437,7151 (')

Value,total

Total'Great Ire

SouthWest

Britain landern

EuropeIndies

Africa

Value

81,555

3.356,160

35,19229,469

23,688

1,238

25

1,680

375.394

22,55135,16943,376

1,243131,467

10,0771,243

130

30,08936,961

33

167131,552

85,01319,121

488

854

(')

1,752,515 118.777 691,912 848,934 21,678

65.860 4,698 6,992 4,765

1, 686, 654'll4. 079:685, 920 844,179! 21,382

297

Quantity shipped '

1,178737

379,012

59,420

20

7,465

660,003

30,068312,612578,349

24,859•751,240

50,38374,604

86

6,017•2,470

2

8584,672

5,667112.971

168j

■11

504 , 553443127

66,035

45,868,4,430|3,382

(!)

1,173737

4,865

7.465'

22,086

1236,780

11,739

74,604;86

5,7472,102

584,593

5,202112,971

161

41

263

450

25305,083

150

14,167

1,630

351,625

57 , 550

20

431,386

307749 1

175,221

3,421149,985 588,561

1,046

26785

3,583

206,081

29 . 682

402^958

21.438955

49,337

175:

18,501

244

7,905

240

81

20

'273

2|

268

23,4494,430|3,382

1 2,870

72

439

Article

Butter lb

Cheese doNew England

rum ga!._Rice bbl..Rough rice .bu

loaflb

Raw silk —doSoap doShoes .pairs. .Ship stuff-.bbl.

Onions . .value.Pitch bbl.Tar,common.do. .

Tar, green -do .Turpentine -do.

Rosin. do.Oil of turpentine-]

doMasts, yards.

etc tons

Walnutwood ..value. .

Pine, oak, cedarboards ft. .

Pinetimber -tons..

Oaktimber—do. .

Housesframed

number . .Staves and

heading, -do. .Hoops do. .

21340

Value,total

,492933

BM693615

Shook hogsheads do

Cattle do. .Horses do.Sheep and

hogs do.Poultry—doz.

Furs value

Deer skins. .lb.Tobacco.value.Tallow and

lard lb.: do.

16

:m542

Id394

4952(10

427261

BOO

279

103

630

US

61X

405

Ml

3,260

7.14,60.

4,1 ,

9157

906

3s

Quantity shipped*

Total '

GreatBritain

10,6481541

86,5853.1497,964

(')9,144

81,422653

17.014

60074,073

541

H3532H

228

479177

4*675063 8

867426

41

3,045

m

42,756,306

11,011

3 , 874

1S3

20.546,3263,852,383

62,6783,184]6.692

12,7972,615

(')799,807

(')

185,143128,523

8,265

78,1161653

15,125

196

11

3,043

106

16,013,519

10,582

3,710

Ireland

7.931

9

329.741

60

10

4.921,020 2,828,76218,912

91,486799,622904,982

80062.794

SouthernEurope

45.310

36,296

600

650

7i327

117

486,078

64

10

1,680,4037,072

10,980

We»tIndies

167,31355,997

2.574• 40,932

8,200

8,548

Africa

300

292. 9B6

117

85,0353,14"

640

6,370

822

8,173

" 1,801

28

30

2

1,500

i'.bbb

35.922.168

315

144

50,629

163

116.141817.899

62.0993,1846,692

12.717

2,615

1,569

183,8931.820

57

134

8,500

30

K7

4502,400

1 Fractional quantities have been dropped; therefore, total may not equal sum ofmts. 1 Information needed to provide totals is not available,pt for a few items where value is shown.

* Figures disagree with source used here (Macpherson) ; corrected to agree with Iof components and with original source (PRO Customs 16/1).

* Quantity in tons of beef and pork.

Series Z 77-86. Coal Exported From James River Ports in Virginia, by Destination: 1758 to 1765

[In net tons of 2,000 pounds. For years ending January 4 of following year]

SeriesNo.

Destination 1765 1763 1762 1761 1760 1758SeriesNo.

Destination 1765 1763 1762 1761 1760 1758

7778788081

Salem . - 161 11223234136247

8283848586

Piscataway.. . 214 16810224

60 288 Philadelphia . 21 47 60Nantucket New Castle..

Rhode Island 256 15640

Lower James 8

New York 136 182 24 21 15 12

Series Z 87-107. Coal Imported, by American Ports: 1768 to 1772

[In net tons of 2.000 pounds. For years ending January 4 of following year]

No.

8788M9091

929394959697

Port

New HampshireFalmouthSalem and Marblehead..BostonRhode Island

New HavenNew LondonNew York

PhiladelphiaPatuxent

North Potomac.

Imports from Continental Colonies

1772

204

1771

50

18317413

87226122

1770

23

76

40

1768

130

101153

88

Imports from Great Britain

1771

627206

2,248

239316

1770

1688

162989208

69

8371,119

65

1769

1230

1,894159

37

1,5371,507

10765

No.

9899100101102

103104105106107

Port

RappahannockJames River—lower .James River—upper _York RiverRoanoke

BrunswickCharlestonSavannahSunburySt. Augustine .

ImportsfromContinental

Colonies,1771

2444

Imports fromGreat Britain

1771

96384

18119

46774

1770 1769

432

9016915

16081566

81,819

74

488910 O - 60 - 50

761

Z 108-135 COLONIAL STATISTICS

Series Z 108-121. Value of Furs Exported to England, by British Continental Colonies: 1700 to 1775

fin pounds sterling. For years ending December 24|

SeriesNo.

1775 1770 1765 1760 1750 17S9 > 1730 1725 1720 1710 1700

108

109110111112113114

115116117118119120121

Total, 53 , 709 47,758 49 , 293 19,985 22,817 25.196 22,348 23,541 19,377 16,284

Continental ColoniesCanadaCarolinaFlorida- -Georgia -Hudson's Bay

New England—NewfoundlandNew YorkNova ScotiaPennsylvania -- - - -Virginia and Maryland -

All other colonies -

51,05834,486

12810863

5,640

1,6421,9133.939

2102,866

632,651

44,39428,433

26689

9,213

2,453403

2,340132

1,148

45.92524,512

491

14,6371,930

20

17,491

'"it

22,536_

19,804

67

21,903

"46

19,128 5,165

"27

13,712

576

539,770

2,811648

5,56578

1,92770

3,368

8,321

946470

1,02324

1,87921

5.348

8,143

1,015420

5,710

13,452

2,481551

5,073

1,909282

5,326

329641

2,660

12,335

2,010500

2,611156

1,642493

2,544

11,180

1,862452

6,952

9,839

2,119457

5,393

1,595553

2,148

2,360

2,435223

4,962

923488

1,6

849467249

7542.675

7232,4332.572

the English customs records for 1740 are not complete, the records for 1739 were used.

Series Z 122-125. Indigo and Silk Exported From South Carolina and Georgia: 1747 to 1775

[For years ending January 4 of following year, except as noted]

Indigo (1,000 pounds)

Total

122

SouthCarolina

123

Georgia

124

Silk 1(pounds) Year

Indigo (1,000 pounds)

Total

122

SouthCarolina

123

Georgia

124

Silk'(pounds)

125

Year

Indigo,

SouthCarolina(1,000

pounds)

123

1775 '.1774 «..1773 >.1772.,1771. _

1770.1769.1768.1767.1766.1765.

' 759 . 8454.1

573.1416.6

"517.7

(')" 506.2351.9

1.122.2747.2720.6

• 746 . 7

434.2

550.8402.7

' 498.0

(')491.8335.8

8w13.119.9

22.313.9

» 19.712.914.416.0

»)

:•)

485438

290332541671

1,084711

1764.1763.1762.1761.

1760.1759.1758.1757.1756.1755.

543.2447.7264.4385.6

519.3696.2572.6894.5232.1308.0

529.1 14 2 898438.9 8.7 953255.3 9.1 380384.1 1.6 332

507.6 11.7 558695.7 0.6 734563.0 9.6 358876.4 18.2 358222.8 9.3 268303.5 4.5 438

1754...1753...1752 " .1751 " .

1750 ■' .

1749 " .1748 ".1747 >'_

129.628.53.819.9

63.1138.362.2

138 3

1 Savannah, Ga.f only. 1 For 6 H months ending Feb. 24.' Not available. * For 11 months ending Oct. 6.fi For year ending Nov. 11. s Plus 302 casks and 5 boxes.

' Plus 196 casks. 8 Plus 357 casks.» From Oct. 31, 1767, to Sept. 8, 1768, Charleston exported 530,092 pounds of indigo.

10 Figures given are for Charleston's exports, the only South Carolina port for whic*1data are available; other South Carolina porta averaged 7.8 percent of the colony's tot a

for 1768-1773.it For 9 1-2 months ending Jan. 5 of following year.a For year ending Mar. 24 of following year.

Series Z 126-130. Silk Exported and Imported by North and South Carolina: 1731 to 1755

[In pounds. For years ending December 24]

Year

Exportsof rawsilk

126

Imports of British silk manufactures

Silk,wrought

127

Silk with

128

Silk withinkle

129

Silk withgrosgrain

130

Year

Exportsof rawsilk

126

Imports of British silk manufactures

Silk,wrought

127

Silk withworsted

128

Silk withinkle

Silk withgrosgrain

Year

Importssilk mat

of British

Silk, Silk iwrought worsted

127 128

17551754..1753 ..1752..1751 ..

1750.1749.1748.1747.

6.5

.....

1184652

3,4162,6823,0273,3652,404

1,6191,7721,7721,313

2,6342,3002,2362,8601,933

1,2581,0661,6582,050

337374190218291

22374

155386

150

50

1746..1745..1744..1748..1742..1741..

18.5

341740.1739.

929544

1,0351,4271,5762,798

1,4541,273

590615

1,2961,2621,3502,452

1,492877

330184181122144440

340

1738.1737.1736.

1736.1734.1733.1732.1731.

1,111691

1,223

1,487943

1,015774970

1.177790516

9371,341892637

Series Z 131-135. Pig Iron Exported to England, by Colony: 1723 to 1776

[In tons of 2,240 pounds. For years ending December 24]

Year

1776.1775.1774.1773.1772.1771.

1770.1769.1768-1767.1766.

1765.1764.1763.1762.1761.1760.

1769.

1 IncludesNewfi

Total

'3162,996

'3,4522,938'3,725'5,303

4,2333,4022,9533,313'2,887

>3,2642,5542,666'1,7672,766•3,265

"1,596

VirginiaandMaryland

132

2081,4671,4581,5811,8792,624

1,5721,6161,718'2,0701,741

2,0711,8372,3251,7332,5123,1231,429

NewYork

133

431,0151,533984766778

1,031864620357648

564371108197651

103

Pennsylvania

385323209706

1,553

1,381634666786299

301307132

714961128

Other '

60130181isa364379

24828850

101

40

23

293012

Year

17581757175617551754175317521751

17501749174817471746

17451744174317421741

Total

'3,717'2,699'3,0113,4413,2452,7382,9793,210

2,9241,7592,1562,1571,861

2,2741,8623,0052,0753,457

VirginiaandMaryland

132

3,4482,4622,4682,1332,5912,3472,7622,950

2,5091,5752,0182,1191,729

2,1311,7482,8161,9263,261

NewYork

133

411157

201457116974133

7617221329

196

81

Pennsylvania

134

19580

234836513243156200

31816711526103

9TKM

S3144153

Other 1

25

'10815256120

27

21

2720

455

43

Year

1740.1789.1738.1737.1736.

1735.1734.1733.1732.1731.

1730.1729.1728.1727.1726.1725.1724.1723.

Total

275418359316729

5611M405333260

717132886484296137

VirginiaandMary-Land

132

2,0202,2422,1132,1202,458

2,3622,0422,3102,2262,081

1,527853643407263137202

Pennsylvania

Other I

159170228169271

19614795107169

1892742437733

9661827

iron exported from New England, Carolina, Barbados, Canada,

and Jamaica.

' Reason for discrepancy in total and sum of components is unknown.' 13 American Colonies only.

762

EXPORTS AND IMPORTS Z 136-164

Series Z 136-142. Pig Iron Exported From American Colonies, by Destination and Colony: 1768 to 1772

[In hundredweights. For years ending January 4 of following year]

Total

136

74,320610

22,688480

128,306

101,3161,280

'25,68030

Massachusetts

1,521

1,301

220

810

810

RhodeIsland

6,325

1,076

5,250

7,820

2,760

5,060

NewYork

139

26 , 755

15,585

11,170

15,770

10,300700

4,74030

Pennsylvania

9.408

8,840160

8400

30,886

29,986

900

Maryland

141

33 , 405

27,215150

6,040

45,245

30,005580

14,660

Virginia

142

20,684

20,304300

K0

27,455

Year anddestination

1770

Total .

Great Britain .IrelandContinental

ColoniesWest Indies...

1769

Total

Great Britain..IrelandContinental

Colonies

1768

Total . .

Great Britain.Continental

Colonies

Total

136

133,079

114,9445,350

12,72560

112,186

93,866930

17,390

' 71 , 194

•62,356

8,838

Massachusetts

137

I ,020

1,020

2.365

1.360370

635

1,077

1.077

RhodeIsland

138

6,957

8,697

3,260

5,980

2,310

3,670

2,220

1,820

400

NewYork

139

26,490

21,5151,250

3,725

23,795

14,96040

8,795

31,119

29,819

1,300

Pennsylvania

140

31,947

31,387560

21,896

21,676220

12,102

10,006

2,096

Maryland

141

35.150

25.8103,540

5,74060

24,830

20,240300

4,290

6.422

1,780

4,642

' Includes 320 hundredweights exported by Connecticut. 1 Includes 760 hundredweights exported by New Jersey.

Series Z 143-152. Pig Iron Imported by American Colonies From Other Continental Colonies: 1768 to 1772

[In hundredweights. For years ending January 4 of following year]

YearTotal

Massachusetts

RhodeIsland

Connecticut

NewYork

Pennsylvania

Maryland

VirginiaNorth

CarolinaSouth

Carolina

143 144 145 146 147 148 149 160 151 152

1772 25.76827,62514,12715,53512,447

5,6803,6402,7104,5551,654

9,6208,8753,4058,020

6201,4201,6401,340

4,7701,980740

8,2801.920

1605,5902,872

204. 528

4,91810,0402,7003,3203,660

1771 1,060 201770 - 60

17691768 360 430

Series Z 153-158. Bar Iron Imported From England, by American Colonies: 1710 to 1750

[In tons of 2,240 pounds. For years ending December 24]

Virginia

TotalNew

EnglandNewYork

Pennsylvania

andMaryland

Carolina

Year Year

163 154 155 156 157 158

1750.. 5 1 S321254

1 17181735 .. 218

363465488365

101263371413243

108905568

68

1717 .1734 17161733 2

36

2591732 1716

1731 102 11 17141713.

1730 . 250405

150338

9268

21

64

17121729 4 1710

Total

190207539

511419302326226

NewEngland

154

154141373

373279211282201

NewYork

155

343147

111984932

10

Pennsylvania

156

4910

82572

13

Virginia

M"arl- |Car°lina

land

157

27109

17

8852

Series Z 159-164. Bar Iron Exported to England, by Colony: 1718 to 1776

[In tons of 2,240 pounds. For years ending December 24]

Total

159

28916

'639'838'9662,222

1,7161,7801,9901,3261,258

1,079»1,069

•310

'110

NewEngland

946

7IS9

NewYork

361284498561

1,493

984861909401400

194241

89

Pennsylvania

114137

18

9820835734288

85272213

VirginiaandMaryland

163

28462244289382

709

598659712569744

689247234107

Other >

164

15

160133

Year

1761.1760.1759.1768.1757.1756.

1755.1754.1753.1752.1751.

1750.1748.1747.1746.1745.

Total

3912727335573181

89027124882

I

64831964

NewEngland

NewYork

161

192

127

Pennsylvania

162

329199101931

79110148

65

VirginiaandMaryland

163

3698

74341Sii48

2991549817

8

64

83193

4

Other 1

164

Year

1744.1741.1740.1736.1735.

1738.1780.1727.1726.1724.

1721.1720.1719.1718.

Total

159

5755

555

19817

15

413

VirginiaandMaryland

1 Includes bar iron exported from Antigua,as noted.

' Reason for discrepancy between total and' From Carolina.

Canada, Jamaica, Barbados, and others

sum of components is unknown.

4 From Pennsylvania.6 From New York.• From New England.

763

Z 165-202 COLONIAL STATISTICS

Series Z 165-178. Bar Iron Imported by American Colonies From Other Continental Colonies: 1768 to 1772

[In hundredweights. For years ending January 4 of following year]

YearTotal

NewHarnp-.shire

Massachusetts

RhodeIsland

Connecticut

NewYork

NewJersey

Pennsylvania

Maryland

VirginiaNorth

CarolinaSouth

CarolinaGeorgia noHd.

165 166 167 168 169 170 171 172 173 174 175 176 177 178

1772 33.15628,06428,33821,86016.905

4.1693,0793,7172,3901,500

14.36710,869

> 13,0528,6487,977

2,3042,2401,2401,1752,322

1,5882.3512,2951,734271

220880120710236

6 940494

1647

4,5402,4202,1051,546

71

1.7492,6041.1861,3521.401

2.7782,5903,9613,1271,775

352419324525317

127911771

1770 166530684

172281769 97

451768 145 161

> Plus 154 bars.

Series Z 179-188. Bar Iron Exported by American Colonies, by Destination and Colony: 1768 to 1772

[In hundredweight*. For years ending January 4 of following year]

Year and destinationTotal

Massachusetts

RhodeIsland

Connecticut

NewYork

NewJersey

Pennsylvania

Maryland

Virginia Other '

1772

179 180 181 182 183 184 185 186 187 188

Total 60,916 1,110 354 538 17,245 140 22,008 17.272 2.091 158

Continental Colonies - . .19,70835,8484,620

740

1,110 31440

50434

9,9304,8052.370

140

10040

90019,253'1,595

7,7978,875260340

1,081729281

158West IndiesOther. 260

1771

Total _.. 76,513 985 500 85 28.892 94 21.942 20,080 3,713 222

Great Britain 42,30029,3103,980

923

2 20320120

23,6503.607

935700

20019.4132.196

133

15.5314,207

30240

2,897489Continental Colonies - ... 983 65 14 212

West Indies 20 80 327Other 40 10

353

1770

Total. 78,168 1.029 686 180 33,569 108 22,967 14,823 4,453

Great Britain 42,04728,9495,4571,775

100929

40■606

40

25,9854,6741,6351,335

1,57718.776'2,594

20

10,5303,200

673420

3,815484154

Continental Colonies - 108 172181West Indies 180

Other

1769

75,869 1,009 641 556 24,358 230 21,805 17,965 9,184 (21

Great Britain 43,10526,3784,8261,560

124 98543

17,0905,2231,385660

4.41514,6282,652

110

12,9253,789

461790

8,453514217

Continental Colonies 885 446110

230 1201West Indies

1768

Total. 77,857 1,127 3,199 223 4,422 140 20,969 35,114 12,307 356

Great Britain 50,27124,4033,123

60

(')1.107

20

7392,400

3817114

•6,189

12.621• 2,159

'31,2653,714

135

•11,704 33620

West Indies8,874

548140 356

247Other _ 60 ('»)

1 Includes N.H., N.C., S.C.. Ga., and Fla. ■ Plus 10,627 bars exported to Great Britain and 166 bars to Ireland.

* Includes 40 cwt. exported through New Castle, Del. 7 Plus 730 bars.8 Plus 150 bars. ' Plus 11,664 bars.* Includes 134 cwt. exported through New Castle, Del. * Includes 45 cwt. exported through New Castle, Del. In addition to the 2,159 cwt.,1 Plus 42 bars. there were 2,125 bars exported.

10 Source states that 735 bars were exported to Southern Europe.

Series Z 189-202. Cast Iron Imported and Exported by American Colonies, by Origin and Destination: 1768 to 1772

[In hundredweights. For years ending January 4 of following year)

SeriesNo.

Origin or destination From other Continental Colonies

Imports

From Great Britain To other Continental Colonies

Exports

To West Indies

1772 1771 1770 1769 1768 1771 1770 1769 1772 1771 1770 1769 1768 1771 1770 1769

189

190

Total 4,936 4,884 4,039 3,824 4,733 968 969 2,621 5,231 5,503 fi.309 3,926 2,025 97 42 1(5

21712872

9641,773

40213897

2,3644221045

266290532313

5

172

> 1214044194

05 11

1,7142,795315206

2

18 291,9721,422

129142

188607114120

191192

43 8 0) 2,0702,538

77180

'2,029■1,206

■87

'61

25 1065Rhode Island 7 21

193194195196197198199200201

Connecticut ■1,150i 160

24'1,357

236347297192390

1,58131811615528539163367

256785

76New York. . (') 20

New JerseyPennsylvania • 58

280138

1,131142330

3591,496

651,06636327023

106'30626786069

'231'1,426

5286

3114

29039821287

3562,513

18795

1885199235

353

70

Virginia 733'178

88North Carolina 20

South Carolina 359■ 71

an 89Georgia '49

1 (')

4

202 Florida (')

■ In addition, the following number of pots were imported: From other Continental ' In addition, the following number of pots were exported: Maas.-510, R.I.-116,

Colonies, 1770, N. H.-4, Mass.-20, Conn.-103, N. Y.-52, Pa.-130; from Great Britain, Con.-20, N.Y.-104, and 35 potash kettles from Mass.1771, Md.-2,432, N. C.-169, Ga.-150, FU.-4; 1770, N. H.-187, Maas.-12 pots and 250 1 Includes figures for New Castle, Del., as follows: Imports from other Continental

pounds, Md.-107; 1769, N. Y.-100, Pa.-231. Md.-34, Ga.-71, Fla.-2. Colonies. 1770, 1 cwt.; 1771, 40 cwt. Exports to other Continental Colonies, 1771, 3cwt.

764

EXPORTS AND IMPORTS Z 203-229

Series Z 203-210. Wrought Iron Imported From England by American Colonies: 1710 to 1773

[In hundredweights. For years ending December 24 except 1769-1771, January 4 of following year]

Year

1773...1771...1770...1769...1764...1758...

17501735173417331732

Total

203

56,98859,18619,75633,68529,72035,549

29,50823,84523,15522,64322,800

NewEngland

2,6344,2092,250

■2.907

6,2903,455

7,8846,5446,1927,105

NewYork

205

5,97211,4973,860

6204,8836,280

4,3842,1372,2911,6102,380

Pennsylvania

19,652

176' 1 , 5655,3038,687

4,7652,1023,1502.4202,208

VirginiaandMaryland

207

12,55438,5467,664

21,7344,86610,128

8,6849,7098,6418,8157,446

Carolina

208

12,155'3,2124,393'5,7737,9936.849

3,7333.353

2,8812,6932,168

Georgia

209

1.8551,0681,402•878

385

160

58

Florida

2.166'654

11'208

Yearor period

Total

203

1731..1730..1729..1718..1717..1716..

1715..1714..1713..1712..1710-

1711

26,75320,60416,35713,09715,70515,571

17,80214,34311,17613,729

10,309

NewEngland

9,7277,3807,3943,1103,8195,398

5,7964,6334,8835,345

4,597

NewYork

205

2,6282,7751,9041,3961,1451.094

1,3801,137986639

567

Pennsylvania

206

2,9462,629

851887

1,147963

988924

1,040540

VirginiaandMaryland

207

9.6826,3904,8666,7358,7287,446

8,9476,5982,8606,654

3,014

Carolina

1,7701,4801,342969866670

6911,0611.4071,561

1.143

1 Plus 5 casks and 4 cases. '-' Plus 15 caskB and 1 case. ' Plus 41 casks and 13 packs. 1 Plus 1 cask. 1 Plus 49 packs. 1 Plus 11 packs. 7 Plus 7 packs.

Series Z 211-222. Selected Iron Products Imported and Exported by American Colonies: 1768 to 1772

Imports

Wrought iron

Exports

Axes

YearWrought

ironAnchors Scythes Nails' Steel i Axes

Othercolonies

WestIndies

Anchors ScythesOther

coloniesWestIndies

211 212 213 214 215 216 217 218 219 220 221 222

Cwt.351513

'256"1.289

(')

Number68

'109'126■12

Dozens494

'340297

'102

(')

Cwt. Cwt. Number5,6037.1446,0636,6655,568

Cwt.301391

■•103

" 1,101» 162

Cwt. Number'8070

11 156

Dozens454

•640

Number6,8007,5747,4835,6062,688

Number2,6732,3851,9614,059

(')

1772 (5)m 47

163167

1771 6,668■22,283

»3,161

1,599'1,578•2,126

1770 3774001769. (")

(")1768.. («) tt (•) 279 (*)

1 Imported from Great Britain. * No listing.1 Plus 36 to West Indies. * Plus, from Great Britain, 15 in 1771.* Plus,' from Great Britain, 129 bundles in 1771 and 46 bundles and 1 dozen in 1769.* 30 dozen to West Indies.7 Wrought iron entry coastwise in source includes 43 cwt. of anchors which may not

have been included in number of anchors. Also, 27 anchors were imported from GreatBritain.

8 Plus 1,993 casks in 1770 and 84 casks in 1769 from Great Britain and 102 barrelsin 1770 from other colonies.

• Plus 4,030 bars, 12.5 faggots, and 36 long steel in 1770, and 1 bundle and 41 faggots

in 1769.10 Includes 110 cwt of anchors which have also been included in the number of

anchors.11 Wrought iron entry coastwise included 363 cwt. of anchors which may not have

been included in the number of anchors.15 Anchors only.u 15 anchors to Africa. All the wrought iron entries this year consisted of anchors.

" In addition to coastwise exports listed under wrought iron, 1 anchor went to theWest Indies.

Series Z 223-229. Tobacco Imported by England, by Origin: 1697 to 1775

[In thousands of pounds. For years ending December 24, except as noted]

Year

1775.1774.1773.1772.1771.

1770.1769.1768.1767.1766.

1765.1764.1763.1762.1761.

1760.1759.1788.1757.1756.

1755.1764.1763.1762.1751.

1750.1749.1748.1747.1746.

1745.1744.1743.1742.1741.

1740.1739.1738.1737.1736.

Total

223

55,96856,06755,92951,60168,093

39,18833,79735,55539,14543,318

48,32054,43365,17944,11147,075

52,34734,78243,96942,23233,291

49,08458,86762,68657,25045,979

51,33944,64850,69551,28939,990

41,07341,43456,76743,46759,449

36,00246,72440,12050,20837,904

VirginiaandMaryland

224

54,45854,78554,91550,66756,888

38,98633 , 55235,45739,09643 , 193

47,60053.66264 , 50041,86246,818

51,28334,66243,62341,64282,943

48,61057,97761,91356,59146,745

50,78544,19049,64660,76539,567

40,89741,11955,66642,83859,007

35,37245,86639,86849,94637,682

Carolina

225

8341,191964684

1,136

1902038844

114

704765647

2,226796

989120273369289

24183645183

182

123213932M7

81

35515558

70

49552

108

Georgia

109

7150135

86

81

Pennsylvania

46

10450

104

NewEngland

228

57

1 (')

14 24635 28568 60567 4

34 44712266 319107 124228

166159 31830 (!)

221 7

427 48305226154100 (')

Other '

229

51010

(')1634

44194

12

132

271311

596

73321

68

21782

a

(')

6115

2716

114

1011856841144

106

1262214

Year

1736. .1734..1733..1732..1731..

1730..1729..1728..1727..1726..

1725..1724..1723..1722..1721..

1720..1719..1718..1717..1716..

1715..1714..1713..1712..1711..

1710..1709..1708..1707..1706..

1705..1704..1703..1702..1701 ..

1700..1699..1698 '.1698 «.1697 •_

Total

223

40,06935,66340,08530,89141,695

35,08039,95142,58843,27532,311

21,04626,63429,29728,54337,292

34,52633 , 68431,84029,60028.316

17,81029,26421,59830,62328,122

23,49834,54728,97528,08819,780

15.66134,86420,07687,20932,189

37,84031,2638,478

23,05235,632

VirginiaandMaryland

224

39,81835.21639,85430,84741,194

34,86039,78542,32843.02632,159

20,96826,61229,25928.38336,949

34.13833,50331.74029,45028,305

17,78329,24821,57330,50228,100

23,36134,46728,71627,68419,379

16,57334,66519,45136,74931,754

37,16630,6418.359

22,73835.329

Carolina

(»)68

47

814

n

Pennsylvania

226

2503381692190

78161155225

142

661323140254

365177941028

18

117651848394

4786

313304270

398656722118

NewEngland

227

14

p)

m

41

421

47

112

41

2

19217

99

1136744

2316

NewYork

228

246

21

465

1

123297

27

Other <

229

18

62

9309

131

6103249

129710

1

10i

(')l8

9

611615

26121077

280

329519386120

23349643

283156

1 Includes Portugal and Madeira Islands, rest of Europe, Turkey, Africa, EastIndies, Antigua, Barbados, Bermuda, Jamaica, St. Kitts, and others and prize.

2 Less than 600 lbs. ' For Sept. 29-Dec. 24.' For years ending Sept. 28.

765

Z 230-240 COLONIAL STATISTICS

Series Z 230-237. American Tobacco Imported and Reexported by Great Britain: 1697 to 1775

[In millions of pounds. For years ending December 24 unless otherwise noted. Leaders denote no satisfactory data available. Outports are English ports other than London]

Imports

Total

230

10297

10097

105

7870696873

81819K

7173

8550706046

64798778

6452

5552675368

415345

England

Total

231

5656565158

3934363943

4854654447

5235444233

4959635746

5145515140

4141574359

364740

5038

London

232

383643

2724232627

2937472227

2818242219

2733873326

2621282919

2224332441

1931253225

Outports

233

181515

129

121416

2017182220

2416202014

2226252420

2623232321

1917241919

1716151913

Scotland '

Reexports

4641454547

3936332929

3326332726

3215261812

15202421

1312

14111110

9

575

Total

7479979487

7359

6763

6885656266

6450434638

45737469

5249

4351585254

424337

England

4445505041

33243136

3954413637

4032262826

3453504939

3344433932

3342474446

3538334132

Scotland i

237

3034464446

4035362630

2931242529

2519171812

10

202320

Year

1735.1734.1733.1732.1731.

1730.1729.1728.1727.1726.

1725.1724.1723 .1722.1721.

1720.1719.1718.1717.1716..

1715..1714.1713.1712.1711.

1710.1709..1708..1707..1706..

1705..1704..1703..1702..1701..

1700..1699..1698'.1697

Total

20

30

253630

Total

4036403142

3540434332

2127292937

3534323028

1829223128

35292820

1635203732

38312336

Imports

England

London

232

2624272029

2427292820

14182119

1512

25

2521

25181026

Outports

10111211

12131310

Scotland i

234

Reexports

Total

235

34

3338353231

1628242530

2119

15

England

1 For 1721-1731 and 1762-1754, for years ending Sept. 28; 1755-1775, years ending Jan. 4 of following year.' For years ending Sept. 28.

Series Z 238-240. American Tobacco Imported by England: 1616 to 1693

[In thousands of pounds. For years ending September 28 except 1637-1640, unknown; 1672-1682, December 24; 1690-1693, November. Leaders denote no satisfactory data

available. Outports are English ports other than London]

YearTotal London Outports •

Year

Total London OutportsYear

Total London Outports

238 239 240 238 239 210 238 239 240

1693 19,866.013,423.514,830.5

1679 12,983.014,455.011,735.011,127.010,539.0

1629.. 178.7652.9876.9333.1

89.0420.1335.3213.3

89.7132.81692 1678 1628

1691... _ 1677 1627 41. «119.81676 1626

1690 12,638.014,392.614,890.514,072.014,641.5

1672 17,559.0 7,020.01689. 1625 131.8

203.0134.661.673 8

111.1187.3119.459.473.8

20.716.615 22.2

1688. 28,385.627,567.028,036.6

13,495.013,495.013,495.0

1669 9,037.37,371.11,257.01,346.08,134.0

16241687 1663 1623

1686 1640 1622

1639 16211684 13,495.0

18,495.08,807.0

16381683 1620... 119.0

46.849.718.82.6

118.045.849.518.8

1.01682. 21,399.0 12,592.0

14,472.011,943.0

1637 1,537.0209.7360.6

16191681.. . 1631 272.3

468.2

62.597.5

1618 0.21680... 1630 1617 _

1616 2.3 0.2

766

EXPORTS AND IMPORTS Z 241-266

Series Z 241-253. American Tobacco Exported and Imported, by Origin and Destination: 1768 to 1772

tin thousands of pounds. For years ending January 4 of following year]

Year and destinationTotal

NewHampshire

Massachusetts

RhodeIsland

Connecticut

NewYork

Pennsylvania

Maryland

VirginiaNorth

CarolinaSouth

CarolinaGeorgia Florida

iirz

241 242 243 244 245 246 247 248 249 260 251 252 253

ExportsGreat Britain

106,979.4106,574.0

2.0 23.7 14.0 1.7 58.6 26.4 33,909 233,902.0

2.54.7

70,632.870,449.4

147.035.9

1,604.81.673.4

11.819.6

527.6479.0

7.4

179.1170.2

West Indies 178.0194.433.0

»87.4

0.523.2

1.84.18.1

16.6

0.814

6.736.616.325.1

Southern Europe and AfricaImports, coastwise

Coastwise 2.0 '22 84.130.8

35.75.6

8.9

1771

18.7

58.0

0.6 0.1 C) 0.6

ExportsGreat Britain .

112,921.2112,508.6

4.4 11 4 5.0 48.2 4.4 38,963.038,931.4

15.316.3

71,468 771,268.7

160.539.5

1,886.61,872.2

2.012.4

436 6401.4

34.934.9

West Indies 181.7197.533.4141.5

4.4 55.62.4

39.3

9.91.5

2.92.1 29.1

19.166.7

1.01.12.314.8

27 :iSouthern Europe and Africa.

Imports, coastwise

1770

12.2

3.7

7.2 1.0

13.5

0.18.1

0.2

Exports..Great Britain.

89,744.389,321.4

165.4248.2

9.3158.7

20.9 0.4 34.6 6.5 27,272.027,266.8

8.12.1

61,048 560,811 1

145.691.8

1,097.31,084.7

2.410.2

233.2145.5

18.413.30.1

0.3

West Indies 10.8 3.421.9

Southern Europe and Africa.Imports, coastwise

Coastwise 8.7 20.9 0.4 2.79.3

72.6

6.5 87.7 0.8

1769

5.9 39.0

46.7

5.4

11.2

32.4

1.2

0.6 2.9

Exports. _Great Britain

84,207.383,945.2

102.3155.24.6

95.2

29.3 12.6 25.790.825,781.8

1.27.8

57,445.267,337.8

78.229.2

554.7649.63.41.00.71.0

310.4275.4

0.134.9

5.20.61.68.0

West Indies 0.345.5

2.36.62.3

13.916.4

1.310.6

Southern Europe and Africa -Imports, coastwise

Coastwise0.9

38.10.7

34.4

1.2

Exports

1768

69,683 169,519.1

139 2

10.6

11.8 3.1

1.2

23.2 6.0

'4.7

24,382.324,382.3

44,876.944,769.7

107.2

380.8867.1

6 4

0.2 5.0

Great BritainWest Indies 1.4

1.4n 3

23.2 1.0Coastwise 20.5

i a11.8 7.3

Imports, coastwise I 22.1

Southern Fnrnnp anH Africa

:i 7 __l ..1 10 0

4 0

5.5 0.8 0.7 1.4

1 Coastwise exports for 1772 include 14,589 lbs. exported by Delaware; coastwise 1 Plus 5 pigtails,imports for 1769 include 224 lbs. imported by the Jerseys. * 5 pigtails.

Series Z 254-261. Tea Imported From England by American Colonies: 1761 to 1775

[In pounds. For years ending December 24]

Virginia Virginia

YearTotal

NewEngland

NewYork

Pennsylvania

andMaryland

Carolina Georgia FloridaYear

TotalNew

EnglandNewYork

Pennsylvania

andMaryland

Carolina Georgia Florida

254 255 256 257 258 259 260 261 254 255 256 257 258 259 260 261

1775...1774...1773...1772...1771...1770...1769...1768...

22,19873,274

739,221264,882362,257110,386229,439873,744

8,00630,161206,312161,184282,85785,98586,004291,899

1,304208,385

6301,035269

4,282320,214

8,82531,27326.49178,11732,96118,27037,35541,944

4,33283,95922,91636,385

8,6616,07010,2655,4202,9804.4265,212

5,3682,643

8131,7423,1041,7672.6614.953

1767...1766...1765. _.1764...1768...1762...1761...

480,876361,001518.424489,252188,786161,58856,110

162,435'118,982175,889143,23437,62551,6186,992

177,111124,464226,232265,38583,87070,4603.837

87,74160,79654,53841,94918,2817,884

144

36,08829,17723,28018,24923,48112,77322,244

24,26120,11236,06718,37422,86017,85022,893

2,3256,7982,9181,9892,7681,003

416

208,191128495

672

81,729174,883

1,17612,98234.639

72

(In

Series Z 262-266. Rice Exported From Producing Areas: 1698 to 1774

except as indicated. Data are for various terminal dates, primarily December 24, January 4 (of the succeeding year), and

31; a

Total

Pounds

262

Barrels 1

263

Charleston,S.C.

Beaufortand

Georgia

266

Year

Total

262

Barrels '

263 264 265

Beaufortand

Georgetown,

266

1774..177817721771

17701769

176817671766

76,265,70081.476,32569,218,62581,755,100

83,708,62578,078,95077,284,20063,465,15048,396,600

66,710,57556,907,25061,959,45047,436,82558,480,276

1760 86,827,2501759 80,472,5761758 88,627,6501757 88,976,950

1 Number of pounds per

1765.1764.1763.1762.1761.

145,268156,193131,845156,724

159,446189,198147,208120,88692,184

126,163106,490118,01890,353111,391

67,29058,04373,38664,718

varied

118,482126,940104.821125,151

131,805115.582125,538104,12574,031

107.29291,960

104,80079,652101,889

60,80751,71867,46458,634

year to year; i

6,5946,6814,0765,209

6,5686,9007,0455,4803,896

6,6474,8406,6164,1926,336

3,2002,7223,5513,086

20 , 19221,67222,94825,364

22,07216,71614,62511,28114,257

12,2249,6907,7026,6094,666

3,2833,6032,3712,998

1756.

1755.1754.1753.1752.1751.

1750.1749.1748.1747.1746.

1745.1744.1748.1742.1741.

1740.

45,344,250

59,067,77549,179,62019,747,67542,245,85032,751,270

27,872,50021,381,03028,368,55027,643,06027,335,040

29,818,37539,963,63035,935,20022,706,06088,720,955

43,826,000

86,370

112,49194,67638,34682,83564,854

54,74643,19467,89566,99656,948

62,76585,02977,28049,36185,101

96,280

79,203

104,68288,57035,52378,20861,611

51 , 19041,03455,00054,14664,101

69,62780,77873,41646,19680,846

91,110

4,170

5,6104,6621,8704,1163,243

2,6942,1602,8952,8502,847

3,1384,2513,8642,4314,255

4,785

2,997

2,2991,344952611

861

734

767

Z 262-280 COLONIAL STATISTICS

Series Z 262-266. Rice Exported From Producing Areas: 1698 to 1772—Con.

[In barrels, except as indicated]

Year

1739.1788.1737.1736.

1735.1734.1733.1732.1731.

1780.1729.1728.1727.1726.1725.

Total

Pounds

32,167,80016,327,35020,201,40024,804,000

21,259,80013,991,85023,245,20016,866,00021,753,450

18,774,90014,248,96012,884,95011,291,2809,442,7107,093,600

Barrels 1

263

71,48436,28344,89255,120

47,24431,09351,65637,48048,341

41,72232,38429.96526,88423,03117,734

Charleston,S.C.

264

67,11734,32442,82752,971

45,73230,32350,72637,06848,341

41,72232,38429,96526,88423,03117,734

Beaufortand

Georgetown,

S.C.

4,3671,9592,0652,149

1,512770930412

Year

1724172317221721

17201719171817171716

1715171417131711

Total,pounds

262

8,654,4478,797,3049,732,3777,963,615

6,485,6624,001,2102,956,7272,881,3354,584,927

2,367,6053,139,3613,850,5331,181,430

Year

1710.1709.1708.1707.1706.

1704.1703-1702.1701.

1700-1699.1698'

Total,pounds

,600,983, 610 , 679675.327661 , 185267.309

769 . 536694 , 493612.646194,618

394, 130131,20710,407

1 Number of pounds per barrel varied from year to year; see text. ' Year ending Sept. 28; exports from Sept. 29 to Dec. 24, 1698, were 1,597 pounds.

Series Z 267-273. Rice Exported From Charleston, S.C, by Destination: 1717 to 1766

[In barrels. For 1717-1738, for years ending December 24; for 1758-1766. ending January 4 of following year]

ContinentalColonies

BritishWestIndies

ForeignWestIndies

Countriessouth of

ContinentalColonies

BritishWestIndies

Countriessouth of

YearTotal England Scotland

CapeFinisterre

YearTotal England Scotland

Finisterre

267 268 269 270 271 272 27S 267 268 269 270 271 273

1766.. 85,862103,46182,16951,037

39,46851,33533,21718,517

2,8623,7034,5739,359

3,29716,11710,921

11,73016,46620,2396,962

3,3691,4901,970490

25,13614,34011,23912,163

1735 44,418 28,34524,84926,76638,331

667605

1,4171,737

7131,0611,6041,872

14,69310,7889,2656,397

1763.. 1734 37,30338,94248,337

1762 17321759.. 4,546 1731

1758 61,50132,37237,89653,376

30,68727,33132,32238,158

7,214 4,611696511

6,432643594

12,5573,8024,469

1724. 19,90813,3578,42110,380

16,4528,4236,1877,257

2,1993,2101,0051,980

1,2571,6931,2291,143

1738 _. 1719 ... 311737 17181736 798 1,164 13,266 1717..

Series Z 274-280. Rice Exported to England, by Origin: 1698 to 1776

[In hundredweights. For years ending December 24, except as noted]

Total

274

6,342676,916425,988457,073479,226•452,664

280,847434,444481,891288.537■238,680

357,099320,734271 , 605148,754238,750

108,673109,596102,79474,741167,261

312,845276,935123,682267,210202,943

166,672122,401144,06886,01851,736

75,153196,968243,091136,117263,093313,671254,879128,337

Carolina

275

3,607452,822839,911378,291405,121375,727

222,656362,063380,720257,936193,915

319,164291 , 546251,476138,777224,964

95,773102,00195,74172,785156,279

306,720273,862120,221261,387196,863

164,378121,614143,51685,93950,202

73,792195,249241,820134,368261,110308,178263,380128,187

Georgia

276

2,835110,02069,38772,46964,07859,417

48,84671,48441,39827,53044,387

28,49520,3779,4947,7867,220

11,6286,358

m(•)

5,931

3,9462,7821,9701,047

1,783

<.*>W

8

1,518

m798

NewEngland

277

4,232870

349

8,18392

6,457193

88

5541,6311,537750164

481306

1,3751,359

342

62

1,8154,363

505748

791 ,094

381,32324462

3601,5971,360

149

NewYork

278

7,3125,6962,455360

7,666

66305565

1,65024

6,9164,6746,354408

4,562

309523

4,81967

8,621

1,837204225

1,387923

209

31715660

1,0061,874

106

Pennsylvania

2,5309,9803,8586,3219,399

1,196

5002,7191,072

176

1,6012,2773,6441,0331,840

958233

1,92961471

125

174794

639

344

1,006240888179618

1,624

Virginia

andMaryland

280

2,14652

32156

469329

1,2661,400

Year

1737173617351734173317321781

17301729172817271726

17251724172317221721

17201719

17181717

1716

1715171417181711

17101709170817071706

1704170317021701

170016991698 «...

Total

274

154,318151,234118,29580,263147,272101,838164,616

139,384119,202100,46689,94269,092

53,67063,38367,61376,03462,215

50,66931,25923,09722,50985,820

18,49724,52730,0839,231

12,50811,8025.2764,3852,089

5,9335,4264,7861,521

3,0791,025

81

Carolina

275

154,010150,797116,44179,448147,021101,387161,246

136,678117,65095,97389,94267,041

52,26869,88560,95272,23854,873

44,91526,23319,53017,48427,565

14,40622,26428,6178,678

12,26511,2746,2204,1202,058

5,5605,3204,5681,457

3,0371,018

81

Georgia

276

(!)

(»)1,444

NewEngland

128

286124401

1,784

1,3651,1201,986

C)499

7643,1165,7462,4576,574

6,4444,0352,3033,8225,709

2,0131,6201,393

174

12828949

173

21717

26

NewYork

309222

37

607232

1,918

(')1,466

586656488366620

176147

1,130641871

1,272210165870

105232

3

7962

21864

Pennsylvania

28

180437

97 4300 783 44

1,44850

922 12300

(«)

689•<«T"

87

63327425 2940 33

1,058 90

118 17813 31129 6439 128

1,424

807

261

433

1 Includes exports from Florida in 1766, 91 cwt.; 1771, 64 cwt.;1 Not available.

1772, 1,200 cwt. > Year ending Sept. 28. Data for Sept. 29 to Dec 24, 1698, were 11 cwt. for Carolina

and 2 cwt. for Virginia and Maryland.

768

SLAVE TRADE Z 281-297

Series Z 281-293. Slave Trade, by Origin and Destination: 1768 to 1772

(For years ending January 4 of following year]

NewHampshire

Massachusetts

RhodeIsland

Connecticut

NewYork

Pennsylvania

Maryland

VirginiaNorth

CarolinaSouth

CarolinaGeorgia Florida

282 283 284 285 286 287 288 289 290 291 292 293

4 4 2 23194

17586827

2,1041.27179439

165 7,2016,1452,027

29463

32811769142

11

169

4 2 145 19150

44

22

20105

4 20 5 463

12 9 22719427622

76213

744

827

3,1002,051

99851

2971

758489148121

20

756

8

1 5687

20

1 1 1 5 28

1 6 1 1 296

123

5 28

69672

53251714111

906631274

115 1,144 181176

1031219145

8142886

83

875126143 r

1 13 227

1 13 15

4 66

10 20318023

493234258

1

16936795456

4,8884,138

67575

2983

68744891148

2761198275

4

4

10

11

28

4 295 28

1212

705911348

26

1414

1919

80128813141

13

354354

19817028141

13

2491876239

1,00197130615

56

2781301481199227

1

1 39

Year and origin or destinationTotal

281

1772

ImportsAfricaWest Indies.Continental Colonies

Exports --West IndiesContinental Colonies

1771

Imports—Africa

West IndiesContinental Colonies

Exports

West Indies...Continental Colonies

1770

ImportsAfricaWest Indies- -.Continental Colonies

Exports-West IndiesContinental Colonies

1769

Imports —AfricaWest Indies-Continental Colonies

Exports— -West IndiesContinental Colonies

1768

Imports -West Indies 1 --Continental Colonies

ExportsWest Indies-Continental Colonies

10,1656,6383,146

381495

8492

4,9702,7542,020

196341

3338

8,0692,266

60020314427117

6,7365,1611,222353336

9327

2,4962,204

292282107175

1 Includes Africa.

Series Z 294-297.

[For years ending December 24, except 1619-1699, unknown,

Slave Trade in Virginia: 1619 to 1767

Italic figures do not purport to be complete. For 1619 and 1727-1767, leaders denote zero except as noted;1621-1726, indicate no data available]

Year

17671766

17651764176317621761

1760 «...175817571756

1755'-.1754 «...175317521751 '...

1750174917471746

17451744174317421741

17401789

1738

Imported

Total

294

61lit

66967

1,1951,8101,581

1,158

Africa

295

(0108

(')922

1,0801,7871,470

1,15243

i

h1

565 456399 249tl (')

3,515 '3,5161,194 982

1,010 8492,338 1,826

t8 (')1,61,7 1 ,299

664 512672 486

1,428 1,8201,529 1,095947 687

1,646 9341,710 1,6231,101 839

Elsewhere

296

61

i

66

4511S23

111

643

41

10915021

212

161612SI*

Si8

142186108434260

71287

262

(')

Exported

0)

10s

9228

(')

(')

(')

(')

6S36

Year

1737..1736 '.

1735..1734..1733 '_1732..1731..

1730.1729.1728.1727.1726.

1725.1724.1723.1722.1721.

172017191710-1718'.

1709.1708.1707-1706.

1705-1704.1703 _1702.

Imported

Total

294

2,1743,222

t.lOi1,4871,720l,t91

181,

'276

i26

735

662

Africa

295

2,0443,166

1,798t,Ml1,2452,CM

ISO

'276

(')n

2,149

781464694239

1,960

1,3681,842233

326693713

1,013

1,639987156481

Elsewhere

296

13056

30635647568Si

(')4t

735

319

Exported

297

2635t

(')

tl

Hi(')

(■)

42455

lit

Year

1701.

1700.1699 <1687.1685.1684.

1679.1678.1677.1674.

1665 «.1662 «.16561652 «_

1649 «.1648 «.1642 «_

1639 «_1638 <_1687 «.1636 <_1636 <_

1628..1623..1622..1621..1619..

Imported

Total

3i9

"til'

5980307

1718

1

4630287

26

100111

21

Africa

796

229

ltO'190

34

OSltO

'150>650

Elsewhere

296

21

1 Information lacking or too incomplete to calculate.' Figures have been extended on basis of partial data.'Annual average. Source alBO shows 72 Indian slaves imported; 231 slaves died

and 103 drawn back for exportation during the 9 years.

' Number of head rights granted.

' Number of Negroes shipped, not those actually arrived.

769

Z 298-307 COLONIAL STATISTICS

Series Z 298-302. Slave Trade in New York: 1701 to 1764

[For years ending December 24, except 1701-1718, unknown; 1754-1764, January 4 of following year]

1764176817541748

174317421741

17401739178817371736

17351734173317321731

1730172917281727

Imported

Total

3520565

■10

71455

5610011899"13

12152

257'139'309

165211130221

Africa

19665

100>0

'130

Continental

Colonies

2111

»2

71143

301

359

10

71248

5289649613

11961

156138

•177

168200126218

Exported

302

41'0

■0

'0'0

Year

172617251724172317221721

17201719171817171716

1715171417121711

1710

17051704170317021701

Imported

Total

1762116410196

205

7710451733462

55537755

53

248

1616536

Africa

59

ContinentalColonies

3268

1

117

7026fi43

38

7755

53

24

11

301

14414656

1009686

661044476819

1753

Exported

816

165

4'8

1 Partial year.' Figures have 1

1 Not available.i extended on basis of partial data.

Series Z 303. Slaves Imported Into Charleston, S.C.: 1706 to 1773

[For years ending: 1706-1724, unknown; 1725-1726, September 28; 1727-1751, December 24; 1752-1772, October 81; 1773,purport to be complete)

September 27. Italics indicate figures do not

Year Number Year Number Year Number Year Number Year Number Year Number

1773.1772.1771.

1770.1769.1768.1767.1766.

1765.

8,0504,8653,079

1494,612

■ 178

' 121 101

7,184

1764.1763.1762.1761.

1760.1759.1758.1757.1756.

8,057 17551,145 1754

602 17531,395 1752

3,4491751

1,879 17503,177 17491,438 17391,952 1738

1.4362,5321,3981,572

831

44272

9962,654

17371736

17851734173317321731

17271726

1,7813,176

2,5161,719

1901,0031,775

6581,751

17251724172317221721

17201719171817171716

433604436323165

60154152967867

17151714171317121711

17101709170817071706

8141915976170

131107

1 Prohibitive taxes limited importation.

Series Z 304-307. Pitch, Tar, and Turpentine Exported From Charleston, S.C.: 1725 to 1774

[In barrels. For years ending October 31. Leaders denote no data available!

Pitch

304

Tar

305

Turpentine

Tar(green)

307

YearPitch

304

TarTurpen

tine

306

Tar(green)

307

YearPitch

304

Tar

305

870821

4,1257,429

4,1335,2566,94812,339

8,7517,4596,0876,3156,626

5,7547,8132,521

1,1761,2362,7282,259

8271,2781,4542,232

2,1838,0931,2651 ,2441,438

8862,2361-.720

1 Data for only 4 months.1 Data for only 7 months.> Data for only 10 months.

1.3941,043864

1,363

1,3353,2015,7613,787

6531,6433,0421,4384,874

2,4201,333937

3962,9951,142

2,1113,849

39265

411

97405328

1757'1756 1

1755.1754.1753.1752.1751.

1750 '1749.1748.1747.1746.

1745.1744.1748.1742.1741.

4,9623,0585,86911,02515,22020,48311,441

11,1577,7965,521

13,73718,016

8,8237,6789,75515,80811,831

2,1032,7112,5962,2956,0082,6516,070

3,8583,7653,0754,4221,519

1,28617 , 5522,2063,1151,811

3371,1952,1715,3756,4966,2711,401

8121,5822,3975,1624,262

9881,2452,0121,9861,691

3971,070

547369

17401739173817371736

17351734173817321731

173017291728172717261725

* Data for only 11 months.' Data for only 9 months.

11,3777,89016,08811,98711,736

24,03628,87418,16532.5939,385

10,8258,8778,18613,65429,77657,422

2.4362,7226,4178,5011,491

5,6367,3366,6044,6751,725

2,0143,4412,26910,9508,3222,333

770

TIMBER—WHALING—WAGES Z 308-335

Series Z 308-313. Timber and Timber Products Exported From Charleston (S.C.) and Savannah: 1754 to 1774

[Charleston, (or years ending October 31; Savannah, unknown. Leaders indicate no data available]

Charleston (S.C.) Savannah Charleston (S.C.) Savannah

YearLumber(feet)

Shingles StavesTimber(feet)

Shingles Staves YearLumber(feet)

Shingles StavesTimber(feet)

Shingles Staves

308 309 310 311 312 313 30K 309 310 311 312 313

1774 1 119,923528.637647,047675.000

858,1001,313,5001.392,075

27,40079,875207,280101,228

1764. 948.121

647,112414.754610.952

1.553,3651,225.160896 , 500

1.354,500

228,016362,065163,990236,327

1.043.635917.384417,449307,690

2,061,1611.470.120685,265606,650

423,251594,356325.47750,969

1773 • 1763 «..

1772 > 2,163,5822.159.072

8,525,9302,224.598

988,471403.253

1762

1771 709,000 1761.

1770 697,393592,026760,125450,118

1,305,6252,072.9472,131,0001,717,800

117.860282.180

182,940240,813

1.805,9921,634,3311,787.2581,767,1991.101,466

2,896.9913,474,5883,669.4772,570,7252,036,947

466,276747,903806,609748,166787,898

1760... 545,8331,018,490639,012234,303202,316780,776764,607

1.354.6001,204,890724.000664,100522.420952,880822. 121)

135.992146,172145,52983,617109.890168,121102.290

1769 1759

1768 ' 1758 .1767 1 1757 '. ..

1766 1756 '1755.

1765 1 697,648 186,375 1,879,454 3.722,050 661,416 1754

1 Charleston data only for 4 months. * Charleston data only for 11 months.' Charleston data only for 7 months. 1 Charleston data only for 9 months.1 Charleston data only for 10 months.

Series Z 314-317. Number of Vessels Engaged in Whaling, and Quantity and Value of Oil Acquired, Nantucket,

Mass.: 1715 to 1789

[Year ending date unknown. Leaders indicate no data available]

NumberTons

burden,eachvessel

OilNumber

Tonsburden,eachvessel

OilNumber

Tonsburden,eachvessel

Oil

Yearor period

ofvessels Barrels

Value 'Year

ofvessels Barrels

Value 'Year

ofvessels Barrels

Value '

(£>(£) (£)

314 315 316 317 314 315 316 317 314 315 316 317

1787-1789 36162819

113 12,060 1770 •125

11975-110 "14,331

19,1401763... 60

7880

9,2389,44012,000

1785 0)6,4002,260

e> 1769 17621784... 14,500

16,2801768 ... •125

10875 '15,439

16,5611756 75 27,600

1783 1767 .1748 60

256

50-7538-50

38

11,2503.700

600

19,6483,200•1,100

1772-1775.. 15098115

90-180 30,0007.82512,754

167,000 1766 11810172

11.96911,51211,983

1730..1772.. 1765 17151771 1764

1 £, pound sterling. See source for value per ton. 1 Different figures are quoted by the source (p. 233) from the Massachusetts His-2 Ships still at sea at time of reporting. torical Society Collection.

* Includes the value of 11,000 pounds of whale bone.

Series Z 318-329. Daily Wages of Selected Types of Workmen, by Area: 1621 to 1781

[£, pound sterling; a., shilling; d.. pence. Pay in local currency; not comparable from colony to colony. Leaders indicate no data available]

Masonsand

bricklayers

With board furnished

Joiners Masonsand

bricklayers

Without board furnished

JoinersYear and area Carpenters and

riggersCoopers Tailors Laborers Carpenters and

riggersCoopers Tailors Laborers

318 319 320 321 322 323 324 32.-> 326 327 328 323

£s. d. £«. d. £ d. £«. d. £«. d. £*. d. £«. d. £«. d. £.. d. £». d. £«. d. £s. d.2-048-08-0

Virginia, 1781 5-072-0

5-073-0

5-0 5-01 17-0-0Providence, 1779 72-0

5-03 to 5-0

Rhode Island, 1776... '3-0 5-0 6-6 5-04-0

•2-8

2-02-6

South Carolina, 1710

2-08 to 5-0

2-02-02-62-04-0

6-02-02-02-6

5-01-8

(,) .1-8

New Haven, 1641 2-02-62-05-0

18New Haven, 1640

3

Massachusetts, 1633. 14 14 144-0

122-0

8

u 4^0Virginia, 1621 3-0 3-0 8-0 2-0 3-0

' Per suit. ' For 32-gal. barrel. • Is. 3d. to 2s.

Series Z 330-335. Daily and Monthly Wages of Agricultural Laborers in Maryland: 1638 to 1676

{»., shilling; d., pence. Leaders indicate no data available]

Daily wages Monthly wages Daily wages Monthly wages

In tobacco In tobacco In tobacco In tobacco

Year Pounds Priceper

pound

Sterling Pounds Priceper

pound

Sterling Year Poundsof

Priceper

pound

Sterling Poundsof

Price

pound

Sterlingof

tobaccoof

tobacco tobacco tobacco

330 331 332 333 334 335 330 331 332 333 334 335

1676I. >. d. s. .. d. s. «. d.

*'2.0'2.0

>. d.

300175320125150600

'1.0'1.61.61.51.50 6

25-021-10

1654 600600

100-0100-01670 1652

20 1.6 2-6 40-0 1649 101520

8.0'2.01.6

2-62-62-6

1669 ■ 15-818-9

1648 250170

'2.01.5

41-821-31669 > 1647

1667 26-01645 170

187167133100

1.5'1.2'1.2'1.2

21-823-4

20-1016-8

1662 266200260

12 26-8 1644 "... 10 >1.6 1-31660 " 1.0

1.0

16-820-10

16441660 1 1644 '-1656 15

2620

'2.02.02.0

2-64-2

1642 1620

0.6'1.2

9 0.6 5-01655 " 1641 2-01655 ' 3-4 1638 8-4

1 Estimate. 1 Source does not explain why 2 (or 3} sets of figures are given.

771

Z 336-356 COLONIAL STATISTICS

Series Z 336. Index of Wholesale Prices Estimated for the United States: 1720 to 1789

[1850-59=1001

Year Index I Year Index Year Index I Year Index f Year Index ! Year Index I Year

1789178817871786

17851784178317821781

1780

94.097.4103.9105.1

105.0112.7119.1139.6

5,085.8

10,544.1

1779177817771776

17751774177317721771

1770

2,969 1 1769598 1 1768329 6 1767108 0 1766

78 0 176584 3 176490 9 1763

98 2 176284 9 1761

80 0 1760

81 2 175980 7 175881 7 175781 7 1756

76 7 175577 2 175483 5 175383 4 175277 5 1751

81 5 1750

85 8 174973 9 174869 6 174769 5 1746

71 2 174571 4 174478 2 174375 6 174272 0 1741

73 9 1740

76 1 173974 3 173865 6 173755 0 1736

53 7 173557 1 173459 7 173369 7 173273 6 1731

59 6 1730

59 6 172969 4 172869 3 172762 6 1726

66 3 172567 0 172459 7 172358 0 172259 2 1721

66 6 1720

Index

62.963.166.368.7

65 760.457.355.553 4

58.6

Series Z 337-356. Average Annual Wholesale Prices of Selected Commodities in Philadelphia: 1720 to 1775

[In Pennsylvania currency; in shillings per unit of quantity indicated, except series Z 352, in pounds. Leaders indicate no data available)

Year

Corn WheatTobacco

Rice

340337 338 339

Bu. Bu. Cwt. 1 Cwt.1775 2 •ill 5.68 17.381774 2 88 6 93 16 921773 3 11 7 .12 18 341772 3 li!) 7.74 32 20 23 391771 3 60 6.78 32 50 16.86

1770.. 3 fid 5.92 28 711 16 291769 2 80 5.48 26 12 17.711768. 2 57 6 31 21 83 17.741767.. 2 98 6.25 21 17.541766 8 2>.l 5.73 20 42 16 69

1765.. 8 01 4.70 IS 18 14.341764 2 7-1 4.60 17 71 14.521763 3 TS 6.06 10 48 15 501762 3 48 5.66 21 ■12 13.901761 2 42 5.03 21 52 16.58

1760. 2 00 6.11 20 43 19.001759... 2 <.i'.< 4 96 20 421758 1 111 3 89 18 881757 1 72 3.79 17 74 14.841756 2 BO 4.34 15 88 14.50

1755. 2 16 4.49 15 IIS 16.501754 2 :)4 4.46 17 77 17 061753 2 :il 4.48 19 17 20 971752 2 :.fi 4 38 19 90 16.321751 2 79 4.28 20 19 17.29

1750 2 56 4.51 19 9S 20.631749. 2 68 5.66 17 10 18.981748 2 28 5.04 IK DO 15 831747... 1 92 3.29 16 88 11.401746. 1 82 2.87 13 93 6.99

1746 1 69 2.60 IS 05 10.001744 1 53 2.49 12 65 11.031743 2 11 2.84 16 25 11 961742.. 2 fi!l 3.58 17 65 16 171741 2 74 4.47 14 88 16 58

1740 1 511 3.25 18 92 12.751739 1 11 2.82 15 63 17.081738. 2 111 3.48 17 00 20.671737 2 OX 3 KK 17 41 17.441736 1 89 3.24 15 08 17.15

1735 1 58 3.85 16 65 18.501734... 2 02 3 551733 2 10 3 061732 1 SI 2.70 15 53

"ioioi1731 1 65 2.47 18 46

1730 1 98 3.681729 2 15 3.70 15 OS 18.741728 2 2fi 3.39 16 061727 2 02 3.27 17 871726. 2

2

13 3.82 17 22

1725 13 3.87 38 46 19.981724 2 12 3 36 14.561723... 1 86 2.73 14. 131722 1 73 2.97 10.25 13.921721 1 7fi 3.06 10 04 15.44

1720 1 73 3.08 13.79 16.92

Bread

Middling

ShipFlour

Cwt.

31 "0830.9331.2328.93

28.5325.4526.3827.4724.54

24.9223.8430 1828.8825.18

24.3622.1421.8421.2421 21

21 4221 6421.5221 9422.37

23 8226.3019 6716.4814.95|

13.0613.3214.3115.9619.58

13 5613.0116.7515 21

12.77

14.5813 7512 8511.9111.72

14.881 1 0013 7213.4614.08

12.7911.9211.6712.5413.00

13.31

342 343

Cwt.

"i4~5717.3019.9515.68

14.113.6515 9116 8015.44

13.8812.9517.8217.4912.67

13.4014 3313.9814.1613.65

14 5015.8913.8713.1714.20

15 2317 6013 8911 5310.15

8.818.479.0611.7715.83

10.319.6012.5811.7810.94

12.3310.9010 39

Beef

344

Cwt.15 3618.1218.9220.2617.50

15.7115.0416.8917.1614.81

13.5012.8116.9416.8214.82

14.9614.6912.2711.3112.76

13.7614.1112.8013.1312 34

13.1016 5915.4110.019.07

8.017.688.6910.9813.66

8.728.0311.1611.719.61

11.4710.518.848.178.02

11 5610 65

10.0211.4612.51

12.1210.958.808.938.83

9.26!

Bbl.

57.0054.3154.5857.0551.48

51.3955.2152.4155.3555.21

58.7560.0060.2958.0454.91

53.7248.6648,1846.4348.96

47.8545.1345.7051.0148.44

38.1737.3144.2940.5541.13

36.8841.9444.7536 6340.63

35 6335.7536.6736.0633.50

30.6130.56

36.31

Pork

Salt

Coarse Fine

345

36.72

30.1730.6530.5830.6730.00

30.00

Bbl.64.8869 5083.9793.4680.31

77,0480.2973.4371.7676.88

74.3698.2686.9585.6373.92

69.3069 1959.4960 9461.42

65.9461.1963 2072.3569.97

63.9960.1661 0457.6653.79

53.0260.4968.5254.1749.83

46.0454 SS59.5854.4441.72

37.5943.5847.5449.4165.97

59.2451.6559.1747.7948.58

39.2936.0040.4845.0045.00

46.46

347

Bu.2.131.881 691 861 66

1 631 481 fil1 61

1 70

1 70

1 922 21

2 si;

1 OS

2 H2 132 362 882 16

1 4!l

1 47

1 431 261 16

1 41

2 is

3 17

3 5K

3 76

2 6:1

2 05

1 0 1

2 0(1

2 47

1 67

1 241 35

1 221 56

1 56

~~i 05i SS

2 51

2 2;l2 051 10

1 46

2.31

Bu3.712.052.221 851.55

1 891.811.531.76

2.86

2 972.402.412.562 39

1.541.631.851.531.30

1.692.513.073 843.76

2.562.232.202.672 19

2.202.162.192.241 92

2.082.042.362 403.14

3 092.15

2.833.142.811.65|1.86!

2.31

Molasses

Sugar,muscovado

348 349

Gal.1.751.791.741.751.77

Cat.52 9655.5650.0249.1850.86

1.861.781 811.741 92

51 8052.7446.4249.4355.74

1 76 52.9448.7349.7952.1549.14

1.631.992.292.42

2.702.872 512.462 04

47.8545.1847.7047.9948.83

1.892.002 031.941.86

48.3950 8551 7048.0047.04

1.692 082 822.632.50

51.9846.8351.6355.0147.15

2.341.801.872.281 82

43 . 0249.9738.9440.9436 40

1.651.591.601.581.68

37.8838.0838.9835.6432.81

1.651.601.391.371.36

35 6429.2028.9433.3533.21

1.541 531.511.431.45

32 1335 0035.1732.6336.35

1.461.491.301 241.16

33.4429 4236.88

3J.8833.13

1.34 35.52

Rum

NewEng

land

350

Gal.

2 172 21

2 192 IS

2 192 1'2 252 OS

2 2:1

2 042 115

2 502 703 04

3 64:i 943 122 742 55

2 272 4 12 472 892 51

2 632 725 60

3 622 60

2 652 522 362 842 46

1 SI

WestIndies

Madeirawine

351

Gal.3.053.033.253.443.35

3 013 293 343 003.02

3.023 263.723.943.93

4.734.993.723.172.73

2 843.223 083.223.49

3.463.774.4.463.03

3.253.203.163.642.96

2.532.332.292.652.24

2.362.632.302.502.64

2.512.602.612.873.19

2.852.352.572.942.31

2.68

352

Pipe64 0655.1756 7554.0350.00

49.58•18.02

47.7350.9748.92

47 2950.5649.3460.7948 83

50.3145.2641 7739 4632 78

29 5628.9630.7030.1030.07

29.7428.7725.6024.4222.90

27.5027.8527.3824.3521.83

20.1721 5822.0020 SS21.58

21.47

Barrel

353

Mil.

72 5463 4971 8575.15

68 6861 3265 4779 6067.71

70.6364.9066.0490.8586.91

68.8260 6960.7350.8241.63

51.5455 9456.8753.2851 50

68 3668.7961.0656.0340.63

39 7940.0040 8547.8149.17

39.4244.5847.5646.3635.21

36 37

Pitch

Bbl.

22 50

20 50 22 5010 OS 22 50

17 09 22 50

15 1314.7014 5412 19

11.5411 9314 3416.1617.25

17.3315.2814.9313 47

14 06

14.4716.0715.1115.1913 93

14.9215 7116 0520 0621.66

18.9115.4114.7613 1911.42

13.5013 9014.2616.2117 54

14 2911.4211.3310.8512.25

12.8312.9217.1713.7514.31

15.0012.0813.1118.4019.19

18.4215.5012.6313.5012.00

14.17

1 Cwt. of tobacco was an exception to the rule that cwt. equaled 112 lbs.; it equaled only 100 lbs.

772

PUBLIC FINANCE Z 357-370

Series Z 357. Annual Rate of Exchange on London Series Z 358.

for Pennsylvania Currency: 1720 to 1775

(Pennsylvania currency for 100 tl sterling]

Annual Price of an Ounce of Silver

at Boston: 1700 to 1749

[In paper shillings. Base 1700]

Year

17751774177317721771

17701769176817671766

1765176417631762176117601759

Rate

166 04 1758169 74 1757165 80 1756161 21 1755

165 57 17541753

1SS 99 1752

158 81 1751166 36166 20 1750

166 35 17491748

171 58 1747172 38 1746173 18175 84 1745

174 12 1744160 30 1743154 71 1742

Year Rate 1

159 21 1741165 95 1740172 52 1739168 88 1738168 16 1737167 96 1736166 66

170 68 17351733

171 10 1732172 36 1731174 88184 66 1730

179 25 17291728

175 70 1727167 35 1722160 31 1721159 69 1720

Year Rate Year

145.18164.06170.00167 . 50167 50165.13

162.50165.00161.10163.13

151.69150.00160.00150.00133 33133 33133 33

174917471746

174517441741

1739173817371736

17351734173317321731

60.0055.0038.60

36.0030.0028.00

28.5027.0026.7526.75

27.5025.5022.0020.0018.75

1730.1729.1728.1727.1726.

1725.1724.1723.1722.1721.

1720.1719.1718.1717.1716.

Price

20 0020.5017.2516.0016.00

15.5016 2515.0014.2513.00

12.3312.0011.0010.0010 00

1715.1714.1713.1712.1711.

17101709.1708.1707.1706.

1705.1704.1703.1702.1701.1700.

Price

9.009.008 608.608.33

8.008.008.008.008.00

8.007.007.007.007.007.00

Series Z 359-370.

{In thousan

Partial List of Bills of Credit and

i of colonial pounds except for Maryland in 1769 and

Treasury Notes Issued by American Colonies: 1703 to 1775

1773. which are in thousands of dollars. Leaders indicate no data available]

Yearchusetts

Connecticut

NewHampshire

RhodeIsland

NewYork

Pennsylvania

NewJersey

Maryland

Delaware VirginiaNorth

CarolinaSouth

Carolina

359 360 361 362 363 364 365 366 367 368 369 370

1775 60 61622515

1773 '480 '36

1772 -.1771. 2 ' 120 80 •66

1770. 70'1071769 30 '318 10

1768 201767 2

1

201766. 65

1764. '7■10

"65•45

55 '25■10

'SO'25

1763.1762. '60

>7020

•20•13 1 20

1761 •20

•121760. . . '70•70

'30

'15"13'21'20»36

'27'2021

'60•100

'100

•100

'100•100

'100•85

'45•50

'60•40

'18

526289

180'35

•392

1759. . '211758. '12 •11

'15•4

1757 • 229

1756 "14

•240

•62

'63

'40 '2

1755 '62 '40 '15 •40 •60 331754. 10 '4 '40

1763 '31752 ■ 20

1751- "25

1748 ■400■348

"662

30'15'11

"21 '107

1747 _. '28'531746. •28 •60

'27

5 •16 '6 20 '210

1745 » 1,040■344

85117120

•40 «91744. . «19 "60 •10 '11743 1 '61742 _ •30

1741 16 ■1

'81740 80 "49 '2 "801739 •10 '80 '61738 26

8148

' 110301737. 10 '48

1736 •1 '210

1735 39307924

'531734 2 12 '121733 '30 '104

•60'40 90

1731 ■107

1730 13 1 '3 '20

1729 _. 20368825

6 '2 ■ 30 •12 '401728 4 '481727 __ 4 2

3'3 '25 ■ 20

1726 ■ 50

1725 7055404517

'2'2

71724 4 631723 2 2 ■46 • 40 '111722 4 •10 ■12

1721 ' 100

1720 165

15119

341719 41718..1717 '15

2

1

17

1716.. '111

44

6Year

Massachusetts

SouthCarolina

'15

'351715. '40

359 370'24

1714 '501425

1 28 1708. 32324418

881713 ; >22 1707 •8

•41712.. «248

1706 •52•71711.. '95

4446

105

6'7

•10 '5 17051710 1704 32

321709 '19 '3 13 '3 1703 '6

1 Reissues or exchanges.» War costs.4 Indicates years in which there 'from previous i

i issues of different tenor on a different basis

773

Z 371-405 COLONIAL STATISTICS

Series Z 371-382. Paper Money Outstanding in American Colonies: 1705 to 1775

[In thousands of colonial pounds. Leaders indicate no data available]

Massa-chusetts

Connecticut

NewHampshire

RhodeIsland

NewYork

Pennsylvania

NewJersey

DelawareMaryland

VirginiaNorth

CarolinaSouth

CarolinaYear

371 372 373 374 375 376 377 378 379 380 381 382

1775 27 120 42234443248684

295 80797550

1770 190248155

88303

4981766 2601760 212

1141752 340 60

1748 2.135305243309311

281 114SO

550 8585806969

38 60909090

21 1331744 141739.. 60 23

2227

340 80 602318

1720

535340

25017351730 320 107

1161725 3512301708928

27228

39 37 111720 12

241715 2720

617

367

5 7417101705

Series Z 383-387. Tax Collections in America Under the Different Revenue Laws: 1765 to 1774

[In pounds sterling]

New revenue measures

Navigation

act(1673)

New revenue measures

Navigationact

(1673)Sugaract

(1764, 1766)

Townshendrevenue act

(1767)

Sugar

(1764, 1766)

Stamp Townshendrevenue act

(1767)Year Total Year Total act

(1765)

383 384 386 387 383 384 386 386 387

1774 27,99542,10345.87031,76133,637

27,07439 , 53142,57027,08630,910

9212,5723,3004,6752,727

6722,5171,4901,4461,828

1769. 45,49937,86134,04126,69617,383

39,93824,65933,84426,69614,091

5,56113,202

197

1,2941.1601773 1768. .

1772 1767. 3,9057,8732.954

1771 1766..1770 1765 3,292

Series Z 388-405. Basic Weekly Diets in Britain and America: 1622 to 1790

tin

Year

Before 1861, majority of slaves inU.S

About 1790, slaves on Washington's plantation

1780, French prisoners returned toFrance and English repatriates. .

1780, Continental Army ration

1776, Tory prisoners in Maryland..1775, Continental Army rationAbout 1770, convicts sent to Va.,

Md., and Carolinas from England1761, British Army in Canada1757, Va. militia in the field

1755, Acadians sent to Md1747, English prisoners of French,

at Quebec

1744-1746, R. I. Armed Sloop1735, Ga. trustees, diet for passen

gersFirst half of 18th century, Mass.

Militia:Post allowanceMarching allowance

First half of 18th century, Mass.privateers

1676, Va. Militia1638, Josslyn voyage to New Eng

land, immigrants1632, children's hospital at Nor

wich, England

1622, British naval

Caloriesper day

388

4,187-5.287

3,752

3.2842,478-3,741

3,226-3,9173,032-4,058

2,0612,552-2,921

2,600

1,934

,934-2,2783,951

3,392

2,4802 . 6,HH

4,7484,156

4.527

2,754

4,737-5,459,

Biscuits

389

Bread

390

Flour

391

7 or 77 or 7

77

m

7

654

Oatmeal

Peas

I2:,

7k gal

3 pts1 3 pts

13 pts

U'/ipts■2qts|

1 pt

8H pts

1 qt

IK pts

Rice

394

1 pt

Corn-meal

1 peck

14.4

ltf Pts

1 qt< 1 pt

Fish

396

3.6

Beef Pork Bacon

399

3H or 3>$

71....7or6K

7 or 5J47 or 7 or 5Ji

7 or 4

lJ»or3^orlJi

IK

IKIK

SM

8SM

*7A

8■I

4

7

3K

Cheese Butter

400

ax

H

l'A

3s

H

14'/i oz

3K

Mo-

1 7 gillslJior'/u

VA lb

21 pts

2Jt777

Rum Other

'0.65

-T gills

■Mgill

'7

H

(•)

7 gills .

I" 3 pts

1 Meat.1 Vinegar.3 Peas or beans.* Kpint of rice or 1 pint of

• Gin. '

7 With pork ration only.* 10 M spoonfuls of oil, and 21 spoonfuls of vinegar, with fish only.

* Suet or plums.10 Vinegar and mustard; quantity unknown.

" Pottage.» Sailors received 1 of the 3 different diets.

774


Recommended