22


Historical Water Management Focus
Maintaining water supply security
• Can we obtain the water needed by the mine
• Will water supply meet the needs of the mine in
drought
Ensure compliance
• Will we have to discharge excess water
• What quality will it be and what are the compliance
issues
Usually studied during the design phase, but left to operational staff to manage as best as they can after startup
Increasing focus on proactive water management as part of the mine water management plan

Development of a Mine Water Inventory A mine water inventory attempts to define all the inflows and outflows to a mine, as well as the inventory of water stored or consumed on site.
The Inventory should be a site visit to the operating mine, documenting all the routes by which water enters and moves through the mine
Physically walking the pipelines and ponds can reveal a great many things not obvious from the planning documents
Water Inputs• Surface Water• groundwater
flows • Seawater• Third Party
Water Outputs• Surface Water• Groundwater• Seawater• Third Party• Other
Storage• Ponds and
Impoundments• Transient Storage• Recoverable
Bound Water
Diversions• Water actively
managed by the site but not used for any task within the facility

Development of a Mine Water Inventory
Very useful in understanding the needs of the mine and the movement of water across the site, but:
• Has difficulty defining flows which cannot be measured (i.e.
subsurface seepage)
• Cannot give a complete picture of all the flows at the site and
how they interact
• Difficulties in projecting into the future if the project changes
• Difficulties in extrapolating the impact of extreme climate

Development of a Mine Water Balance
The mine water balance takes the inventory and attempts to complete the picture and understand the interactions
• The inventory may be actual numbers in the case of an
operating mine, or they may be based on what we know of
the mine plan at this stage in the design process.
• Quantify unknown inflows or outflows based on known flows
and understanding of the physical system
i.e. calculating groundwater seepage losses from a reservoir based
on runoff, evaporation and measured transfer flows
• Develops operating rules to project current behavior into the
future to predict system performance
i.e. establish rules for when treatment system is engaged to
maintain desired levels in process ponds
Should be calibrated to historical records using a limited number of inputs (i.e. climate, ore tonnages). Calibration allows definition of difficult to define flows
Operating rules allow calibrated model to make reliable projections of future behavior

Development of a Mine Water Balance (cont’d)
• Addresses the dynamic nature of the mine water
management system and details how flows can be expected
to change through time
i.e. pit water inflows from dewatering may decrease as the regional
aquifer is depleted, but rainfall capture reporting to the pit bottom will
increase as the footprint grows
• Incorporates the uncertainties inherent in the understanding
of the mine water system when making projections
i.e. precipitation is highly variable and projecting into the future must
account for wet and dry periods when planning water management
infrastructure
“No Mine plan survives contact with a miner”
Not only should the water balance model the changing nature of a mine, it should be able to update frequently as the mine updates the mine plan.
Exploring the uncertainties of the mine water management system is critical. We have no control over climatic inputs, which is the single biggest variable in the system.

Using an Mine Water Balance
Using water balance and inventory methodology to identify process improvements
• Identify leaks or miss-reported flows• Water balance identifies open loops - reduce discharges and
water take, increase reuse and recycle• Evaluate impacts on water management from changes to
mine plan or mining processes
Pit Water Management Scenarios
Pit W
ater
Lev
el (f
t)
Calibration Period
Inventory reduction with current technology
Inventory reduction with Enhanced Evaporation Techniques
• Evaluate impacts of sourcing water from more reliable/less contentious sources
• Understand true cost of water• Collects all the inflows, outflows
and storage in one place for easy reporting

Mandatory and Voluntary Corporate Reporting Schemes
• Global Reporting Initiative• CDP Water• MCA Water Accounting Framework• Life Cycle Assessment
Corporate reporting schemes allow a company to demonstrate their commitment to sustainable water use
Many large mining firms proactively making their water use statistics publically available
Northey et al., 2014. Minerals Engineering, 69: 65-80.Northey et al., 2016. J. of Cleaner Production, 135: 1098-1116.
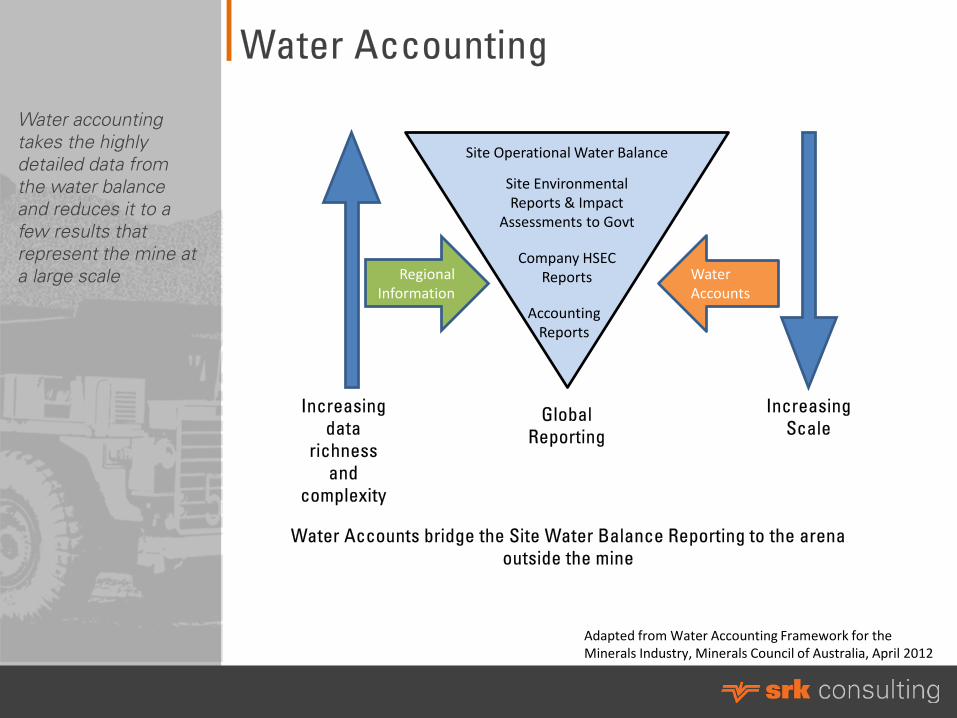
Water Accounting
Site Operational Water Balance
Site Environmental Reports & Impact
Assessments to Govt
Company HSEC Reports
Accounting Reports
Increasing data
richness and
complexity
Increasing Scale
Regional Information
Water Accounts
Water Accounts bridge the Site Water Balance Reporting to the arena outside the mine
Adapted from Water Accounting Framework for the Minerals Industry, Minerals Council of Australia, April 2012
Global Reporting
Water accounting takes the highly detailed data from the water balance and reduces it to a few results that represent the mine at a large scale

Use Water Resource Evaluations to Understand Regional Impacts
• Water supply studies• Mine dewatering impacts• Pre-development water quality vs discharge water quality
Hydrologic, hydrogeologic and geochemical characterization and modeling studies are used to define the source of water supply and region characteristics
Important to understand these components to secure the mine water supply and understand the system before it is impacted
Predicted groundwater discharge to creek prior to pumping (2011-2012)
Simulated groundwater discharge to creek during operations
Disc
harg
e to
Cre
ek (g
pm)

Improve Recognition of the Impacts That Occur Due to Mining
What can conventional studies miss?• Increasing trend to develop large scale mines (>100,00 tpd)
with low grades in arid regions -o Opening up potential for conflicto Creates vulnerable to activist campaign o Increased scale of impacts
• Increasingly stricter regulatory environment• Social media expands influence of NGOs
o Radical transparency expectedo Need to be proactive with Human, Environmental, Social,
and Community issues• Issues can be real and perceived• Increasing importance of water in social license issues• Communicating water use and impacts has become
necessary to maintain positive community relations
Several recent mine projects where solid science and engineering designs were able to obtain regulatory approval, yet failed to gain the social license needed to open the mine

Evolution of Water Impact Assessment
Water footprint quantifying impacts to environment• Measures freshwater appropriation• Spatial and temporal dimension• Actual, locally specific values• Always referring to full supply-chain• Focus on reducing own water footprint (water use units
are not interchangeable)
Mine Water Inventory
Mine Water Balance
Global Reporting Scheme
Water Resource Evaluation
Water Footprint
Regional and Global Water Stress Indexes
Mine Plan Water Sustainability Assessment
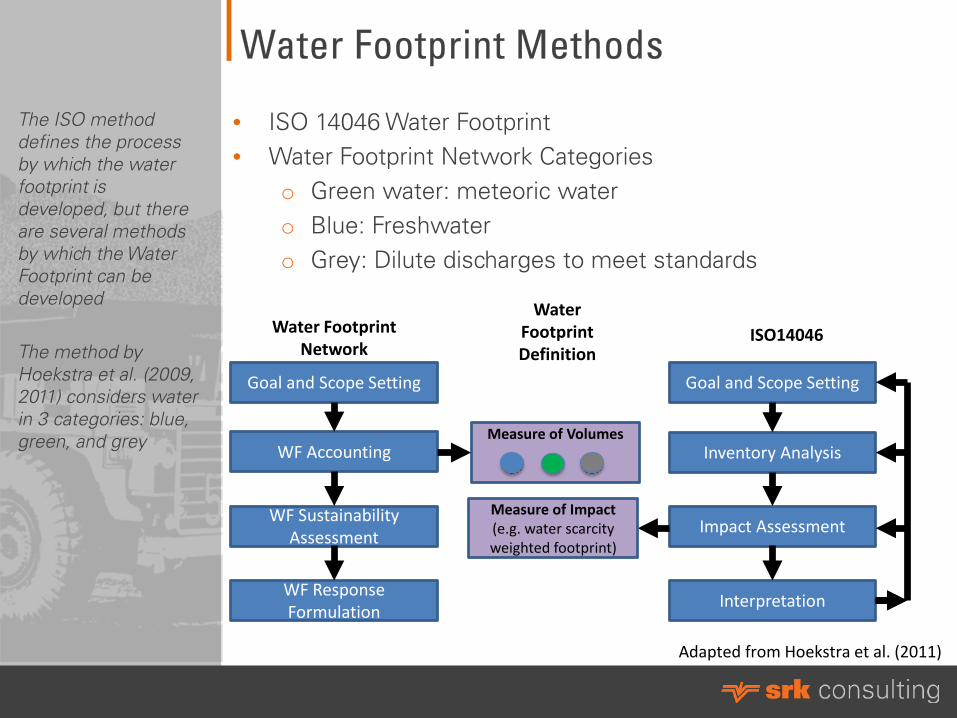
Water Footprint Methods
• ISO 14046 Water Footprint• Water Footprint Network Categories
o Green water: meteoric watero Blue: Freshwatero Grey: Dilute discharges to meet standards
The ISO method defines the process by which the water footprint is developed, but there are several methods by which the Water Footprint can be developed
The method by Hoekstra et al. (2009, 2011) considers water in 3 categories: blue, green, and grey Measure of Volumes
ISO14046Water Footprint Network
Goal and Scope Setting Goal and Scope Setting
WF Accounting Inventory Analysis
WF Sustainability Assessment Impact Assessment
WF Response Formulation Interpretation
Water Footprint Definition
Measure of Impact(e.g. water scarcity weighted footprint)
Adapted from Hoekstra et al. (2011)

Soil and Vegetation Ground and Surface Water
PrecipitationNon-production
RelatedEvapotranspiration
Production Related Evapotranspiration
Water Containedin Products
Green Water Blue Water
Run-off and Infiltration
Production Related Evapotranspiration
Water Transferto other
CatchmentsWater Contained
in Products
Run-off fromcatchment
Adapted from Hoekstra et al. (2011)
Water Footprint MethodsGrey
Water
Discharge from Site
Additional Run-off
Discharge and Run-off
meeting standards

Water Footprint Methods (Ridoutt and Pfister, 2013)
Consumptive Water Use Index• Reduction in water volume available in a store or
catchment• Water Stress Index (WSI) – measure of water availability• Adjusted for site by Regional WSI/Global WSI
Degradative Water Use Index• Impacts from changes in water quality• Water Quality Index – ReCiPe impact assessment
method• Adjusted for site by Regional WQI/Global WQI
The Water Footprint CUI and DUI takes the Water Footprint and Normalizes it to a Global Scale
Comparing a WF number from mines in different climates is now feasible

Water Footprint Methods (cont’d)(Ridoutt and Pfister, 2013)
Single-indicator water footprint• Consumptive Water Use Index - Degradative Water Use
Index• Adjusts water footprint to lessen footprint in areas of
low water stress or areas with poor quality background water
• Useful to inform corporate structures of how to compare different sites
• Understand the regional context of their operations• Can be communicated to internal and external
stakeholders to provide a comparative number on water impacts

Water Footprint
Factors affecting the water footprint• Climatic conditions - i.e. higher or seasonal rainfall or
greater evaporation potential• Site conditions (ability to divert watersheds, high
groundwater table, • Access to water sources• Ore mineralogy, geochemistry, processing method• Mine water management strategies• Waste disposal method (i.e. tailings vs dry stack)• Background water quality• Regional availability of water
Without regional adjustment, it can be very difficult to compare water footprints between two regions with different climates or water availability

Available Water Remaining (WULCA, 2015)
Blue Water Scarcity (Hoekstra et al., 2012)Water Stress Index (Pfister et al., 2009)
Water Depletion Index (Pfister et al., 2009)
Water Stress IndexWater Footprint can be corrected by the relative abundance or scarcity of water in the region compared to the global average

0.0
0.1
0.2
0.3
0.4
0.5
0.6
0.7
0.8
0.9
1.0
0 10 20 30 40 50 60 70 80 90 100
Wat
er St
ress
Inde
x (W
SI)
Cumulative Share of 2011 Mined Copper Production (%)
ChilePeru
China USAIn
done
sia
Aust
ralia
Zam
bia
Russ
iaCa
nada
Pola
nd
Kaza
khst
an
COPPERWeighted Average: 0.50Lower Quartile: 0.18Median: 0.62Upper Quartile: 0.74
Northey et al., 2014. Minerals Engineering, 69: 65-80.
Water Stress Index where Metals are Mined
0.0
0.1
0.2
0.3
0.4
0.5
0.6
0.7
0.8
0.9
1.0
0 10 20 30 40 50 60 70 80 90 100
Wat
er St
ress
Inde
x (W
SI)
Cumulative Share of 2011 Mined Gold Production (%)
ChinaAustralia
USA
Russia
Sout
h Af
rica
Peru
Cana
da
Indo
nesia
Uzb
ekist
an
Mex
ico
Gha
na
Papu
a New
Gui
nea
Braz
il
Arge
ntin
a
GOLDWeighted Average: 0.40Lower Quartile: 0.11Median: 0.40Upper Quartile: 0.62
0.0
0.1
0.2
0.3
0.4
0.5
0.6
0.7
0.8
0.9
1.0
0 10 20 30 40 50 60 70 80 90 100
Wat
er St
ress
Inde
x (W
SI)
Cumulative Share of 2011 Mined Nickel Production (%)
Indonesia
Philippines
RussiaCanada
Australia
New
Cal
edon
ia
Braz
il
Cuba
Chin
a
Colo
mbi
a
Sout
hAf
ricaNICKEL
Weighted Average: 0.24Lower Quartile: 0.10Median: 0.18Upper Quartile: 0.40
A large percentage of the worlds Copper is mined in areas with high Water Stress Indices, while Nickel is largely mined in areas with low Water Stress Indices

Regional Water Stress Index
When appropriate, the WSI can be developed on a regional scale, providing refined Water Footprints
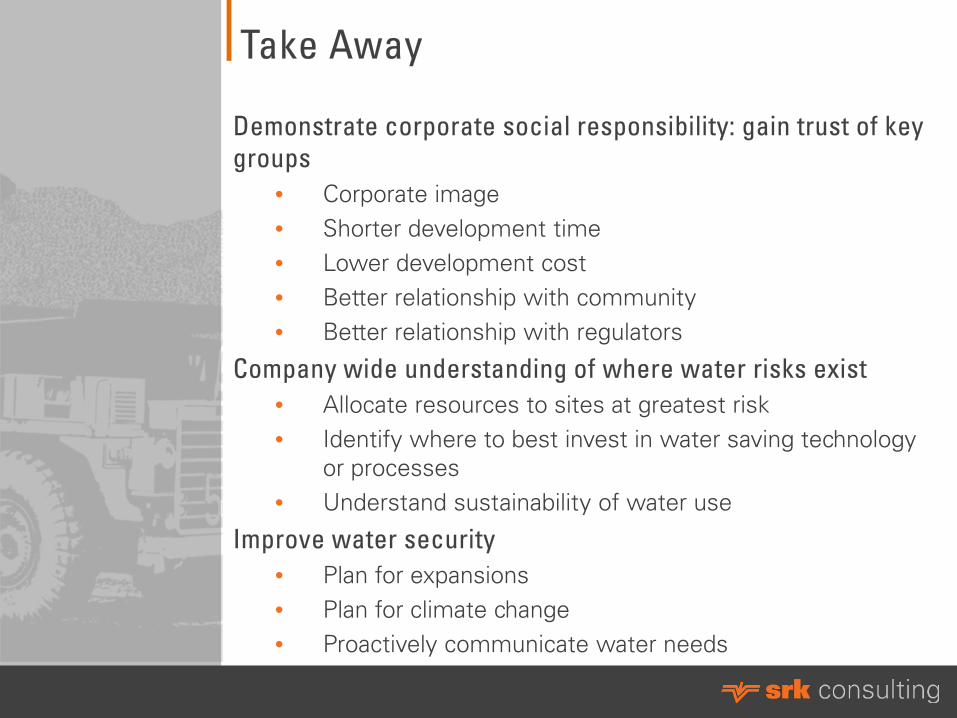
Take Away
Demonstrate corporate social responsibility: gain trust of key groups
• Corporate image• Shorter development time• Lower development cost• Better relationship with community• Better relationship with regulators
Company wide understanding of where water risks exist• Allocate resources to sites at greatest risk• Identify where to best invest in water saving technology
or processes• Understand sustainability of water use
Improve water security• Plan for expansions• Plan for climate change• Proactively communicate water needs
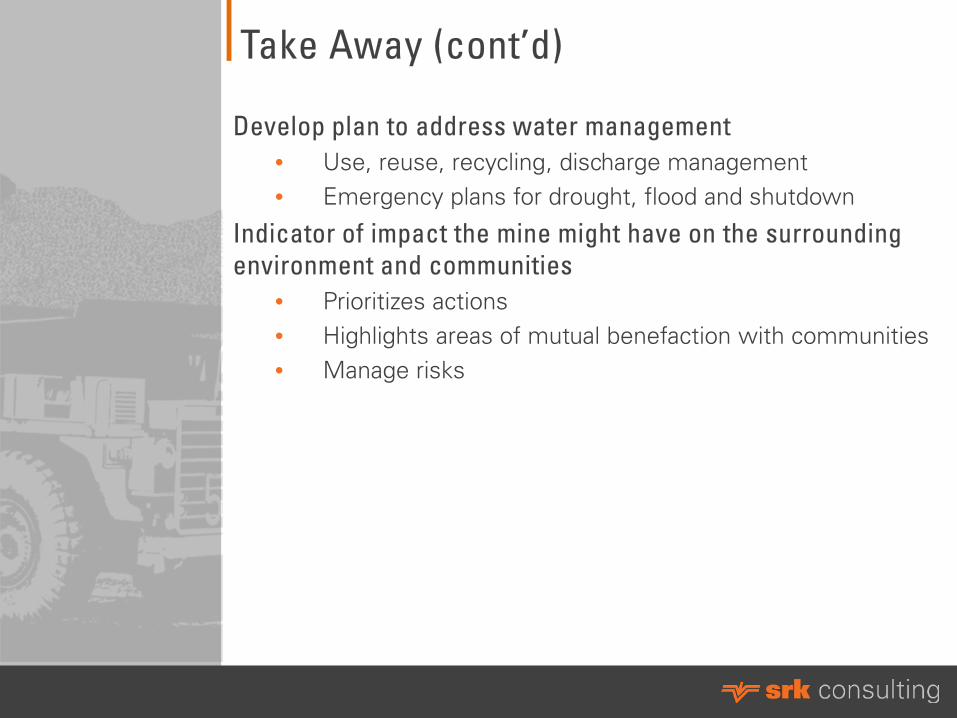
Take Away (cont’d)
Develop plan to address water management• Use, reuse, recycling, discharge management• Emergency plans for drought, flood and shutdown
Indicator of impact the mine might have on the surrounding environment and communities
• Prioritizes actions• Highlights areas of mutual benefaction with communities• Manage risks


