HISTORICAL WATER QUALITY AND ECOLOGICAL CHANGE IN RICE MARSH LAKE Joy M. Ramstack Hobbs Mark B. Edlund St. Croix Watershed Research Staon Science Museum of Minnesota 16910 152 nd Street North Marine on St. Croix, MN 55047 [email protected]; [email protected]; 651-433-5953 Final Report Submied to: Claire Bleser Riley Purgatory Bluff Creek Watershed District 14500 Marn Drive Suite 1500 Eden Prairie, MN 55344 [email protected]; 952-607-6512 Recommended citaon: Ramstack Hobbs, J.M. and M.B. Edlund. 2014. Historical water quality and ecological change in Rice Marsh Lake. Final report submied to Riley Purgatory Bluff Creek Watershed District. St. Croix Watershed Research Staon, Science Museum of Minnesota, Marine on St. Croix, Minnesota, 55047.
Transcript
HISTORICAL WATER QUALITY AND ECOLOGICAL CHANGE IN RICE MARSH LAKE
Joy M. Ramstack HobbsMark B. Edlund
St. Croix Watershed Research StationScience Museum of Minnesota
16910 152nd Street NorthMarine on St. Croix, MN 55047
Recommended citation: Ramstack Hobbs, J.M. and M.B. Edlund. 2014. Historical water quality and ecological change in Rice Marsh Lake. Final report submitted to Riley Purgatory Bluff Creek Watershed District. St. Croix Watershed Research Station, Science Museum of Minnesota, Marine on St. Croix, Minnesota, 55047.
Paleolimnology of Rice Marsh Lake Final Report January 2015
SUMMARY
1. In this project, paleolimnological techniques were used to reconstruct the trophic and sedimentation history of Rice Marsh Lake in Carver County, Minnesota.
2. A sediment core was collected from the lake, and lead-210 activity was analyzed to de-velop a dating model and determine the sediment accumulation rate over the past 150-200 years. Sediments were analyzed for inorganic, organic, and carbonate components using loss-on-ignition analysis; subfossil diatoms, algal pigments, and nitrogen isotopes in the sediments were analyzed to reconstruct changes in lake ecology and trophic state.
3. The sedimentation rate in Rice Marsh Lake doubles in the mid-1940s, and remains el-evated into the early 2000s. The most recent sample provides initial evidence that the sedimentation rate in the lake may be returning to the pre-settlement rate.
4. The sediment composition remains relatively uniform throughout the length of the core. There is a slight decrease in the relative amount of inorganic matter in the core in the most recent samples. This could indicate that the decrease in the sedimentation rate at the core top is due to a decrease in sediment load from upstream Lake Susan.
5. The biggest changes to the diatom community assemblage begin around the 1960s, co-inciding with the beginning of operation of the wastewater treatment plant. The shift in the community suggests a change from a mesotrophic assemblage to a eutrophic assem-blage. The two most recent diatom samples, dated at 2009 and 2014, suggest that the community is beginning to resemble that of pre-settlement times.
6. Analysis of the diatom community changes in conjunction with the MN diatom calibra-tion set suggests that TP is not the primary driver of change in the diatom community in Rice Marsh Lake; therefore, the TP reconstruction should be interpreted with caution. The reconstruction suggests a rise in TP at the time the wastewater treatment plant be-gan operation.
7. Algal pigments suggest a rise in overall algal production, including cyanobacteria, at the time the wastewater treatment plant began operations.
8. Overall, multiple lines of evidence suggest that Rice March Lake was a nutrient-enriched lake during the late 1800s through the mid-1900s; however, the lake became increasing-ly eutrophic at the time the wastewater treatment plant began operation. The change in the diatom community at the core top and decline in cyanobacteria production, coupled with a decrease in the sedimentation rate, suggest that recent management efforts on Rice Marsh Lake and Lake Susan are having positive effects.
4
Paleolimnology of Rice Marsh Lake Final Report January 2015
INTRODUCTION
Within the glaciated regions of the Upper Midwest, lakes feature prominently in the landscape and are a valued resource. Current and historical land and resource uses around the lakes in this region have raised concerns about the state of the lakes and how to best manage them in a future certain to bring change. To effectively develop management plans, knowledge of the natural state of a lake and an understanding of the timing and magnitude of historical ecological changes become critical components.
With any lake management plan it is important to have a basic understanding of natural fluctuations within the system. Reliable long-term data sets, on the order of 30 - 50 years, are generally not available for most regions of the country. Through the use of paleolimnological techniques and quantitative environmental reconstruction, we can estimate past conditions, natural variability, timing of changes, and determine rates of change and recovery. This type of information allows managers and researchers to put present environmental stresses into perspective with the natural variability of the ecosystem. It can also be used to identify response to, and recovery from, short-term disturbances. In this project, paleolimnological techniques were used to reconstruct the trophic and sedimentation history of Rice Marsh Lake in Carver County, Minnesota. Results provide a management foundation through the determination of the natural or reference condition of this lake and the reconstruction of ecological changes that have occurred in the lake during the last 150-200 years.
Rice Marsh Lake sits on the border between the towns of Chanhassen and Eden Prairie, MN, within the Riley Purgatory Bluff Creek Watershed District. It is part of the Riley Creek chain of lakes and is downstream of Lake Susan and upstream of Lake Riley. There is a long history of changes to Rice Marsh Lake and its watershed including post-settlement agriculture, transition of the watershed to suburban development, the introduction of carp, and the use of the lake and creek as a receiving water body for a wastewater treatment plant. The wastewater treatment plant began operation in 1959, and stopped operating in 1972 when wastewater was diverted to the Blue Lake treatment plant in Shakopee (Minnesota Department of Health 1964; J. Mulcahy, Metropolitan Council, personal communication). Rice Marsh Lake is currently impaired for total phosphorus (TP); the 2013 growing-season mean TP measurement was 110 µg/l, well above the state standard of 60 µg/l for lakes in the North Central Hardwood Forest ecoregion (http://www.rpbcwd.org/files/4413/9481/7695/Rice_Marsh_Lake_Fact_Sheet.pdf; October 8, 2014). This impairment has led to questions about whether the productivity of the lake has changed over time, and how best to set management goals.
The primary aim of this project was to use paleolimnological analysis of a dated sediment core from Rice Marsh Lake to reconstruct its ecological history using geochemistry, sediment accumulation, diatom-inferred total phosphorus (DI-TP), and diatoms and algal pigments as biological indicators. Analytical tools included radioisotopic dating of the cores to determine local sediment accumulation rates, geochemical analyses, and analysis of subfossil algal communities. Multivariate analyses, diatom-based transfer functions, and comparison of algal assemblages with an 89 Minnesota lake data set were used to relate changes in trophic conditions and algal communities to land use impacts in the watershed.
Diatoms have been widely used to interpret environmental conditions in lakes (Dixit and Smol 1994). Many species are sensitive to specific water conditions and are useful as bioindicators. Over the past 25 years, statistical methods have been developed to estimate quantitative environmental parameters from diatom assemblages. These methods are statistically robust and ecologically sound (Birks 1998). They have been used successfully in reconstructing a wide
Paleolimnology of Rice Marsh Lake Final Report January 2015
variety of environmental parameters including pH, total phosphorus (TP), and salinity (e.g. Fritz et al. 1991, 1999; Hall and Smol 1992; Ramstack et al. 2003). In the state of Minnesota, diatom analysis has been used as one line of evidence for developing lake nutrient criteria (Heiskary and Wilson 2008) and lake-specific nutrient standards (Edlund and Ramstack 2007).
In addition to diatoms, changes in whole lake algal communities were also characterized through time. While diatoms are an important component of the lake algae, other groups of algae can be ecologically important in eutrophic lakes (e.g. blue-green algae or cyanobacteria). The primary pigments (chlorophylls, carotenoids, and their derivatives) of lake algae are often reliably preserved in lake sediments over time (Leavitt and Hodgson 2001). The concentration of these pigments is directly proportional to the abundance of each algal group. Whereas the relative percent changes in diatom communities is an effective measure of water quality over time, whole lake algal changes can inform us about the absolute changes in algal production and the historical presence of nuisance algae, such as blue-green algae.
METHODS - SEDIMENT CORING
A piston core was collected from Rice Marsh Lake on May 1, 2014. The core was collected from a deep, flat area of the basin to provide a highly integrated sample of diatom community structure from the lake as a whole. The piston core was taken using a drive-rod piston corer equipped with a 6.5 cm diameter polycarbonate barrel (Wright 1991).
The coring location was at 44° 51.088’ N, 93° 31.199’ W, in 3.02 m of water. The piston core recovered 2.0 m of sediment; the core was returned to the laboratory and stored at 4°C.
METHODS - GEOCHEMISTRY
Weighed subsamples were taken from regular intervals throughout the core for loss-on-ignition (LOI) analysis to determine bulk and dry density and dry weight percent of organic, carbonate, and inorganic matter. Sediment subsamples were heated at 105°C to determine dry density, then sequentially heated at 550°C and 1000°C to determine organic and carbonate content from post-ignition weight loss, respectively (Dean 1974).
METHODS - LEAD-210 DATING
Sixteen core sections were analyzed for lead-210 activity to determine age and sediment accumulation rate for the past 150 years. Lead-210 was measured by lead-210 distillation and alpha spectrometry methods, and dates and sedimentation rates were determined according to the c.r.s. (constant rate of supply) model (Appleby and Oldfield 1978). Dating and sedimentation errors were determined by first-order propagation of counting uncertainty (Binford 1990).
Lead-210 dates prior to the 1870s were obtained by linear extrapolation of the model. These dates at the bottom of the core should be considered approximations, with large errors associated with the extrapolation.
METHODS - DIATOM AND NUMERICAL ANALYSES
Fifteen downcore samples were analyzed for diatoms. See Table 1 for a list of samples prepared for diatom analysis.
Diatom and chrysophyte cysts were prepared by placing approximately 0.25 cm3 of homogenized sediment in a 50 cm3 polycarbonate centrifuge tube, and adding 2-5 drops of 10% v/v HCl solution to dissolve carbonates. Organic material was subsequently oxidized by adding 10 ml
6
Paleolimnology of Rice Marsh Lake Final Report January 2015
of 30% hydrogen peroxide and heating for 3 hours in an 85°C water bath. After cooling, the samples were rinsed with distilled deionized water to remove oxidation biproducts. Aliquots of the remaining material, containing the diatoms, were dried onto 22x22 mm #1 coverglasses, which were then permanently attached to microscope slides using Zrax mounting medium. Diatoms were identified along random transects to the lowest taxonomic level under 1250X magnification (full immersion optics of NA 1.4). A minimum of 400 valves was counted in each sample. Abundances are reported as percent abundance relative to total diatom counts. Identification of diatoms used regional floras (e.g. Patrick and Reimer 1966, 1975; Camburn and Charles 2000) and primary literature to achieve consistent taxonomy.
A stratigraphy of predominant diatoms (species with greater than or equal to 5% relative abundance in one or more core depths) was plotted against core date. Relationships among diatom communities within the sediment core were explored using the unconstrained ordination method of Detrended Correspondence Analysis (DCA), in the software package R (R Core Development Team 2012). Core depths/dates were plotted in ordinate space and their relationships and variability used to identify periods of change, sample groups, and ecological variability among core samples. A general rule for interpreting a DCA is that samples that plot closer to one another have more similar diatom assemblages.
Downcore diatom communities were also used to reconstruct historical epilimnetic phosphorus levels. A transfer function for reconstructing historical logTP was developed earlier based on the relationship between modern diatom communities and modern environmental variables in 89 Minnesota lakes (Ramstack et al. 2003, Edlund and Ramstack 2006) using weighted averaging (WA) regression with inverse deshrinking and bootstrap error estimation (C2 software; Juggins 2003). The strength of the transfer function was evaluated by calculating the squared correlation coefficient (r2=0.83) and the root mean square error (RMSE=0.181) between the observed logTP with the model estimates of logTP for all samples. Bootstrapping was used in model validation to provide a more realistic error estimate (RMSEP, the root mean square error of prediction=0.208) because the same data are used to both generate and test the WA model (Fritz et al. 1999). Reconstructed estimates of logTP (diatom-inferred TP, or DI-TP) for each downcore sample were determined by taking the logTP optimum of each species, weighting it by its abundance in that sample, and determining the average of the combined weighted species optima. Data are presented as both logTP values and as backtransformed values, to TP in µg/l.
METHODS - ALGAL PIGMENT ANALYSES AND NITROGEN ISOTOPES
Fossil Pigments—Carotenoids, chlorophylls, and derivatives were extracted (4°C, dark, N2) from freeze-dried sediments according to Leavitt et al. (1989), measured on a Hewlett-Packard model 1050 high performance liquid chromatography system, and are reported relative to TOC (Hall et al. 1999).
Nitrogen Isotopes—Stable isotope ratios were determined on unacidified whole sediment samples using a ThermoQuest (F-MAT) DeltaPLUS XL isotope ratio mass spectrometer equipped with continuous flow (Con Flo II) unit, an automated Carlo Erba elemental analyzer as an inlet device, and following standard procedures of Savage et al. (2004). Stable N (δ15N) isotopic compositions were expressed in the conventional δ-notation in units of per mil (‰) deviation from atmospheric N2. Sample reproducibility was <0.25‰.
RESULTS AND DISCUSSION - GEOCHEMISTRY
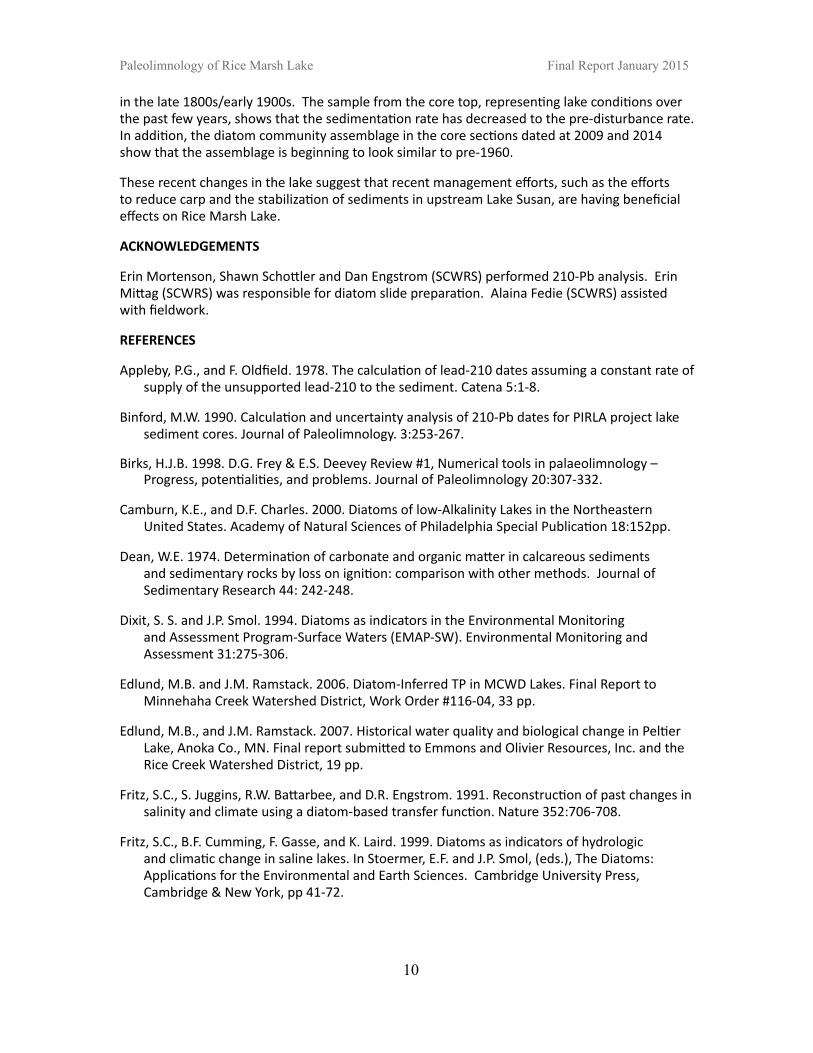
The sediment composition of the piston core from Rice Marsh Lake shows that the sediments are relatively uniform over the 200 cm length of the core (Figure 1). Throughout the core, the amount of organic matter fluctuates between 45 and 55%, the amount of inorganic matter
7
Paleolimnology of Rice Marsh Lake Final Report January 2015
fluctuates between 37 and 48%, and carbonates between 5 and 9%. The most notable changes in the core are the relative increases in the amount of organic matter and decreases in the amount of inorganic matter, occurring at both the core top (0-20 cm) and the core bottom (168-196 cm) (Figure 1).
RESULTS AND DISCUSSION - DATING AND SEDIMENTATION
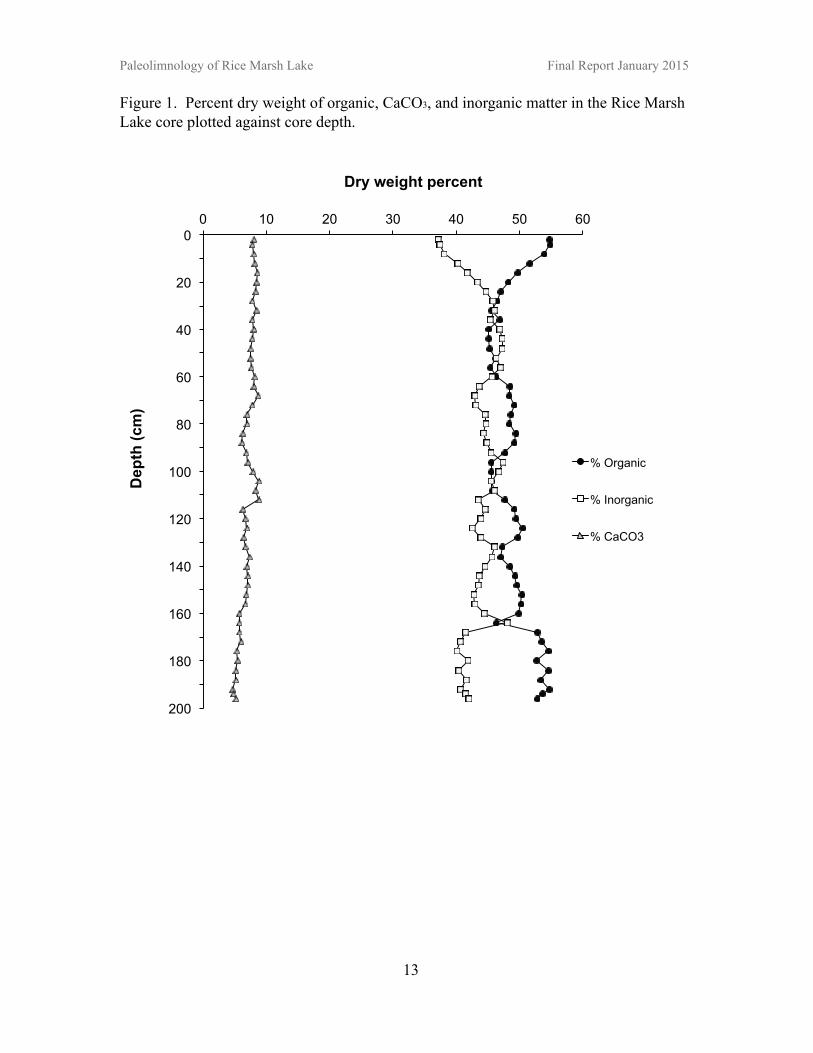
The unsupported lead-210 activity, the resulting lead-210 dating model, and the sediment accumulation rate for Rice Marsh Lake are shown in Figure 2. The lead-210 activity shows a large decline at the core top and an overall decline throughout the rest of the core (Figure 2a). The sediment accumulation rate is low from the mid 1800s until the 1930s, ranging from 0.07 to 0.08 g/cm2 yr (Figure 2c). The rate spikes to 0.16 g/cm2 yr in the mid-1940s and remains high upcore with two notable drops in sedimentation rate, one in the mid-1980s, and one at the core top (2014). The drop in sedimentation rate at the core top brings the rate back down to that of pre-settlement times (0.08 g/cm2 yr).
The drop in sedimentation rate at the core top corresponds to the relative decrease in inorganic matter, suggesting that the drop in the sedimentation rate in recent years could be driven by a decrease in inorganic sediment load from the watershed. This could be a decrease in sediment washing into Rice Marsh Lake from the watershed, or it could represent a decrease in the sediment load coming in from Lake Susan. The removal of carp and attempt to reestablish the native aquatic plant population in Lake Susan in 2012 and 2013 may be working to stabilize the sediments in Lake Susan and consequently lower the sediment load to Rice Marsh Lake.
RESULTS AND DISCUSSION - DIATOM STRATIGRAPHY AND ORDINATION
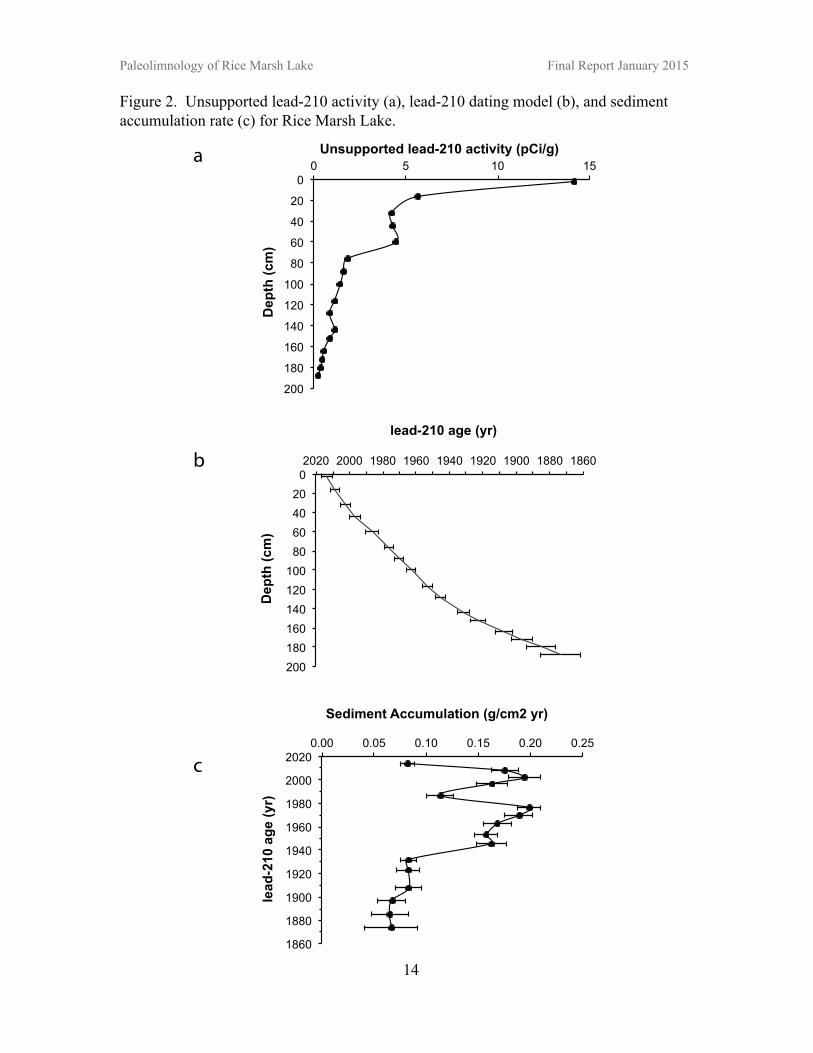
The ordination biplot from the detrended correspondence analysis (DCA) shows how the core samples cluster together based on similarity of diatom assemblage (Figure 3). The diatom community composition shows greater variation in samples from the 1960s to the present than it does prior to this time (Figure 3). Most of the change from the 1960s to the early 2000s is along Axis 1 of the DCA plot, although the change over the last decade is along Axis 2, suggesting that the lake may be experiencing different stressors over the past four decades. The diatom community composition of the most recent samples (2009 and 2014) has moved along a trajectory that shows they have some similarity to the samples from the core bottom.
The stratigraphic diagram shows the predominant diatoms that are driving the shifts in the community assemblages (Figure 4). From the mid-1800s through the 1950s, Rice Marsh Lake had a fairly diverse diatom assemblage, consisting of both planktonic and benthic species. Even though the diatom communities were diverse and supported a notable benthic population, the abundance of Aulacoseira ambigua, Aulacoseira granulata, and Stephanodiscus minutulus indicates that there was some nutrient enrichment in the lake. There is no distinct change in the diatom community that corresponds with the initial spike in sedimentation rate in the mid-1940s.
The first large shift in the community assemblage occurs in the sample dated at 1963, where there is a large spike in Cyclotella meneghiniana, and drop in the benthic Cocconeis species. In 1970, the spike in C. meneghiniana is replaced by a spike in Cyclostephanos tholiformis and Stephanodiscus minutulus, indicating an increase in nutrient levels at this time. These changes in the diatom community correspond with the dates of operation of the wastewater treatment plant, which was likely the source of increased nutrients during this time period.
The next three diatom samples (1986-2002) are characterized by extremely high abundances of Aulacoseria ambigua and Aulacoseira granulata; these Aulacoseira species are characteristic of
8
Paleolimnology of Rice Marsh Lake Final Report January 2015
nutrient-rich and turbid, wind-swept conditions.
In the two most recent samples (2009 and 2014), the abundance of Aulacoseira species drops off dramatically, and there is an increase in Nitzschia amphibia, and Cocconeis species, which were abundant prior to 1963. This begins a return to the ecology of the late 1800s/early 1900s and matches with the sharp decrease in the sedimentation rate at this time. This suggests that recent management efforts, such as the stabilization of sediments in Lake Susan, and the efforts to decrease carp in Rice Marsh Lake, may be helping to return Rice Marsh Lake to its previous condition.
RESULTS AND DISCUSSION - PHOSPHORUS RECONSTRUCTION
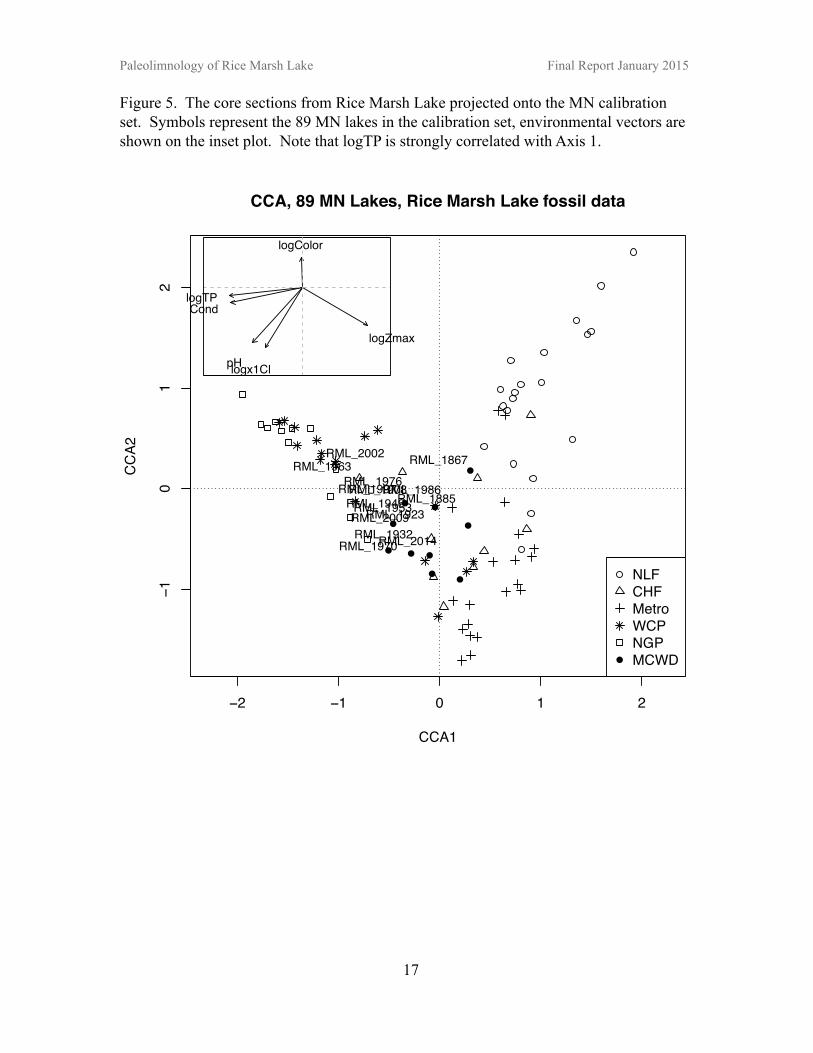
In order for a diatom-inferred total phosphorus (TP) reconstruction to be meaningful, changes in the diatom community assemblage over time must be primarily driven by changes in TP concentrations, as opposed to other factors that could drive community change such as pH, light penetration, and habitat availability. One way to evaluate TP as a driver of change in Rice Marsh Lake is to project the core sections on the MN calibration set (the model used to reconstruct TP) to determine if changes in the diatom assemblage in the core correlate with the TP gradient in the model (Juggins et al. 2013). This analysis results in a cloud of data points for the Rice Marsh Lake core, with no strong directional change (Figure 5). The lack of correlation with Axis 1/log TP suggests that nutrients are not the primary driver of the changes seen in the diatom community for the majority of the record. Alternative drivers include: habitat alterations, changes in turbidity due to sediment load, or other stressors that were not measured in the calibration set. It is possible that the drivers of ecological shifts change over time, meaning that TP is an important variable during certain periods.
Another way to evaluate the reconstruction is to determine the amount of variance in the diatom data that can be accounted for by the TP reconstruction. This can be calculated by the variance explained by the first axis of an ordination of the sediment assemblages constrained to diatom-inferred TP, divided by the variation explained by an unconstrained ordination of the sediment assemblages (Juggins et al. 2013). In Rice Marsh Lake, this analysis shows that the fraction of the maximum explainable variation in the diatom data that can be explained by TP is 0.28. The low score from this analysis, coupled with the lack of correlation with the logTP axis in the passive plot, suggests that TP is not a significant driver of diatom community change in this lake and therefore the TP reconstruction should be interpreted with caution.
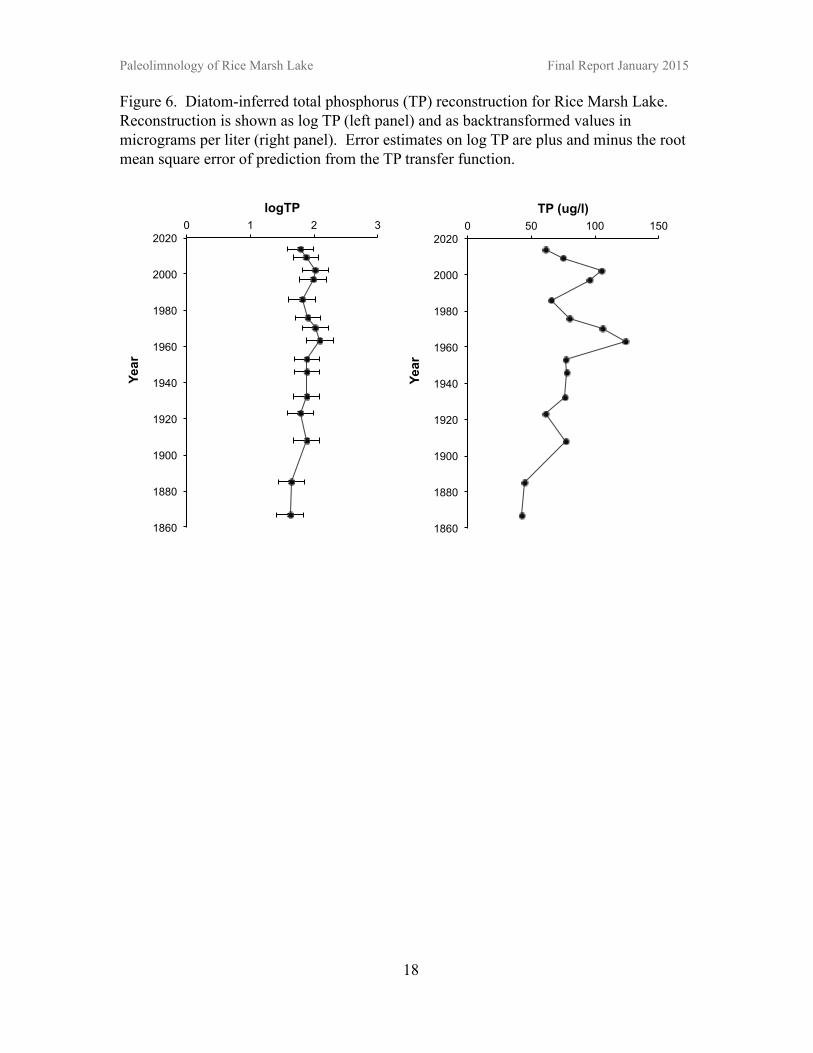
The TP reconstruction suggests that Rice Marsh Lake has always had elevated nutrient levels, with levels increasing in the early 1960s, coinciding with the beginning of operations at the wastewater treatment plant (Figure 6). Diatom-inferred TP also suggests a return to lower nutrient levels in recent decades.
RESULTS AND DISCUSSION - HISTORICAL ALGAL COMMUNITIES AND NITROGEN ISOTOPES
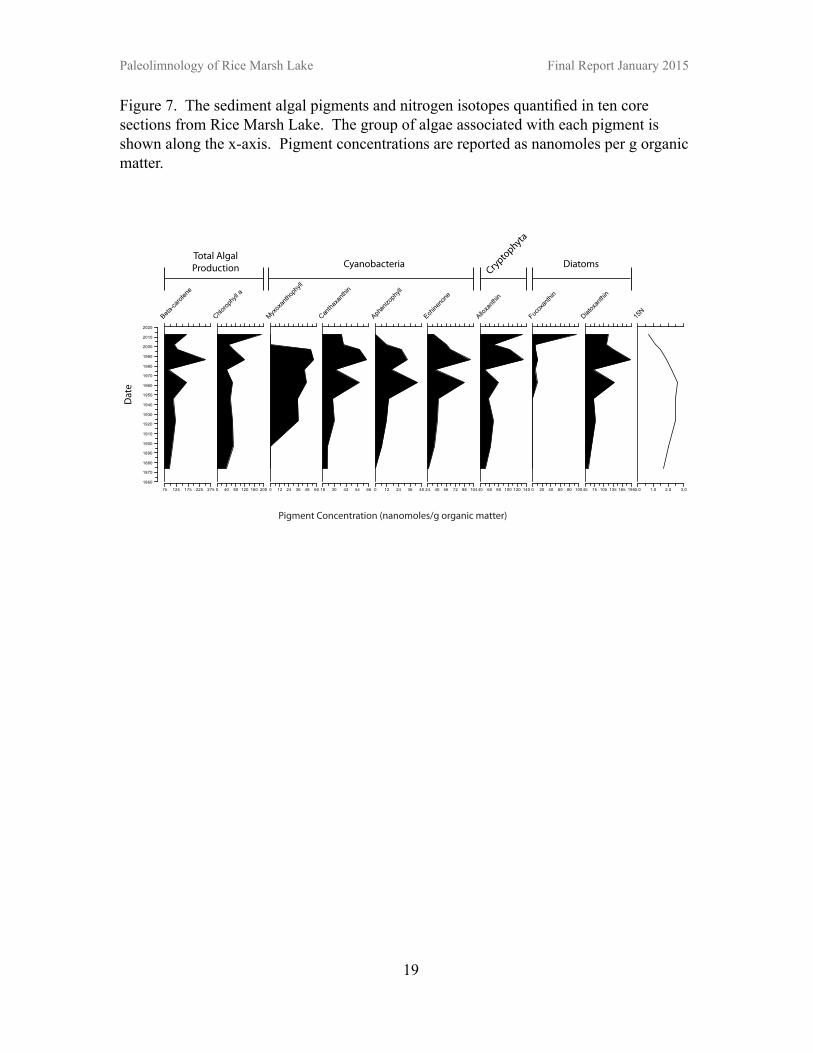
Algal pigments were quantified in ten core sections to give an idea of the historical concentration or production of different algal groups (Figure 7). The concentrations of beta-carotene and chlorophyll a represent total algal production, and suggest that production from the 1960s to the present has generally been higher than it was from the late 1800s to the mid-1900s.
These pigment data show that there was an increase in productivity in the early 1960s, coinciding with the operation of the wastewater treatment plant. This increase is seen in the cyanobacteria (blue-green algae), cryptophyta, and diatom groups. Cyanobacteria tend to flourish in nutrient-rich waters, further suggesting that there was an increase in nutrient levels in Rice Marsh Lake when the wastewater treatment plant began operations. Pigments from
9
Paleolimnology of Rice Marsh Lake Final Report January 2015
the cyanobacteria were broken down into different types, and there is evidence that potentially toxic forms (myxoxanthophyll) have been present in the lake, as well as nitrogen-fixing forms (aphanizophyll). The initial rise in myxoxanthophyll occurred in the 1920s, predating both the wastewater treatment plant and the initial spike in sediment accumulation rate. In addition, there were other cyanobacterial pigments found at low levels in the late 1800s and early 1900s. This suggests that there was some nutrient enrichment in the lake throughout the period of study.
There is an overall decrease in pigment concentration, as well as a decrease in most cyanobacterial groups, in the mid- to late-1970s, which could be a result of the wastewater treatment plant ending operations. This is followed by another increase in the 1980s (corresponding to the Aulacoseira spike in the diatom community) and a decrease in the most recent samples. The recent decrease could be due to management efforts to control carp in Rice Marsh Lake and to stabilize the sediments in upstream Lake Susan.
Overall, the algal pigments indicate that there has been some level of enrichment in Rice Marsh Lake over the period of study. Sediments entering Rice Marsh Lake from lakes upstream in the Riley chain are a likely source of nutrients. Even though Rice Marsh Lake was productive in the late 1800s and early 1900s, there was a noticeable in increase in productivity, especially in the cyanobacteria, at the time the wastewater treatment plant began operations. There is some evidence that recent management efforts may be reversing the trends in cyanobacterial production in recent years.
The nitrogen isotope data (quantified in ten core sections) shows a fairly stable sediment 15N signal from the late 1800s through the 1960s. In the late 1960s/early 1970s the d 15N becomes increasingly depleted. This depletion is likely due to a rise in nitrogen-fixing cyanobacteria, which rely on atmospheric N2 that is 0‰. This provides yet another line of evidence that algal communities and lake nutrient cycles are closely linked.
CONCLUSIONS
During the late 1800s and early 1900s, Rice Marsh Lake was likely a mesotrophic lake with a diverse diatom community assemblage and a stable sedimentation rate. The first notable change to the lake is seen in the 1940s, when the sedimentation rate doubles, and remains elevated into the early 2000s. There are no dramatic changes to the sediment composition at the time the sedimentation rate spikes, so it is difficult to discern if the increase in sediment is coming from the watershed or from changes to in-lake production.
Large changes in the diatom community assemblage, an increase in diatom-inferred TP and increases in overall algal production, begin around the 1960s. This is roughly two decades after the initial increase in the sedimentation rate, suggesting that the change in the sediment load to Rice Marsh Lake was not the driver of the change in the diatom community and increase in productivity. These changes do coincide with the beginning of operations of the wastewater treatment plant; the discharge from this plant was likely the cause of an increase in nutrients, which increased algal productivity. The wastewater treatment plant ended operations in 1972; there is a dip in algal productivity and diatom-inferred TP at this time, however both increase again in the 1980s, suggesting a new stressor to the lake at this time. From the 1960s into the early 2000s, the diatom assemblage suggests that overall Rice Marsh Lake was a eutrophic, turbid lake.
The sedimentation rate, diatom community assemblage, and diatom-inferred TP reconstruction suggest that Rice March Lake is showing signs of return to conditions that characterized the lake
10
Paleolimnology of Rice Marsh Lake Final Report January 2015
in the late 1800s/early 1900s. The sample from the core top, representing lake conditions over the past few years, shows that the sedimentation rate has decreased to the pre-disturbance rate. In addition, the diatom community assemblage in the core sections dated at 2009 and 2014 show that the assemblage is beginning to look similar to pre-1960.
These recent changes in the lake suggest that recent management efforts, such as the efforts to reduce carp and the stabilization of sediments in upstream Lake Susan, are having beneficial effects on Rice Marsh Lake.
ACKNOWLEDGEMENTS
Erin Mortenson, Shawn Schottler and Dan Engstrom (SCWRS) performed 210-Pb analysis. Erin Mittag (SCWRS) was responsible for diatom slide preparation. Alaina Fedie (SCWRS) assisted with fieldwork.
REFERENCES
Appleby, P.G., and F. Oldfield. 1978. The calculation of lead-210 dates assuming a constant rate of supply of the unsupported lead-210 to the sediment. Catena 5:1-8.
Binford, M.W. 1990. Calculation and uncertainty analysis of 210-Pb dates for PIRLA project lake sediment cores. Journal of Paleolimnology. 3:253-267.
Birks, H.J.B. 1998. D.G. Frey & E.S. Deevey Review #1, Numerical tools in palaeolimnology – Progress, potentialities, and problems. Journal of Paleolimnology 20:307-332.
Camburn, K.E., and D.F. Charles. 2000. Diatoms of low-Alkalinity Lakes in the Northeastern United States. Academy of Natural Sciences of Philadelphia Special Publication 18:152pp.
Dean, W.E. 1974. Determination of carbonate and organic matter in calcareous sediments and sedimentary rocks by loss on ignition: comparison with other methods. Journal of Sedimentary Research 44: 242-248.
Dixit, S. S. and J.P. Smol. 1994. Diatoms as indicators in the Environmental Monitoring and Assessment Program-Surface Waters (EMAP-SW). Environmental Monitoring and Assessment 31:275-306.
Edlund, M.B. and J.M. Ramstack. 2006. Diatom-Inferred TP in MCWD Lakes. Final Report to Minnehaha Creek Watershed District, Work Order #116-04, 33 pp.
Edlund, M.B., and J.M. Ramstack. 2007. Historical water quality and biological change in Peltier Lake, Anoka Co., MN. Final report submitted to Emmons and Olivier Resources, Inc. and the Rice Creek Watershed District, 19 pp.
Fritz, S.C., S. Juggins, R.W. Battarbee, and D.R. Engstrom. 1991. Reconstruction of past changes in salinity and climate using a diatom-based transfer function. Nature 352:706-708.
Fritz, S.C., B.F. Cumming, F. Gasse, and K. Laird. 1999. Diatoms as indicators of hydrologic and climatic change in saline lakes. In Stoermer, E.F. and J.P. Smol, (eds.), The Diatoms: Applications for the Environmental and Earth Sciences. Cambridge University Press, Cambridge & New York, pp 41-72.
11
Paleolimnology of Rice Marsh Lake Final Report January 2015
Hall, R.I and J.P. Smol. 1992. A weighted-averaging regression and calibration model for inferring total phosphorus concentration from diatoms in British Columbia (Canada) lakes. Freshwater Biology 27: 417-434.
Hall, R.I., P.R. Leavitt, R. Quinlan, A.S. Dixit, and J.P. Smol. 1999. Effects of agriculture, urbanization, climate on water quality in the northern Great Plains. Limnology and Oceanography 44:739-756.
Heiskary, S.A., and C.B. Wilson. 2008. Minnesota’s approach to lake nutrient criteria development. Lake and Reservoir Management 24:282-297.
Juggins, S. 2003. C2 version 1.3, Software for ecological and palaeoecological data analysis and visualization. University of Newcastle, Newcastle upon Tyne, NE17RU, United Kingdom.
Juggins, S., N.J. Anderson, J.M. Ramstack Hobbs, and A. Heathcote. 2013. Reconstructing epilimnetic total phosphorus using diatoms: statistical and ecological constraints. Journal of Paleolimnology. DOI 10.1007/s10933-013-9678-x.
Leavitt, P.R., S.R. Carpenter, and J.F. Kitchell. 1989. Whole-lake experiments: The annual record of fossil pigments and zooplankton. Limnology and Oceanography 34:400-717.
Leavitt, P.R. and D.A. Hodgson. 2001. Sedimentary pigments. In: Smol JP, Birks HJB, Last WM (eds) Tracking environmental change using lake sediments. Terrestrial, algal, and siliceous indicators, vol 3. Kluwer, Dortrecht, pp 155–202.
Minnesota Department of Health, Division of Environmental Sanitation, Section of Water Pollution Control. 1964. Census Data, Sewage Disposal Facilities, State of Minnesota.
Patrick, R. and C.W. Reimer. 1966. The diatoms of the United States, exclusive of Alaska and Hawaii, Volume 1-Fragilariaceae, Eunotiaceae, Achnanthaceae, Naviculaceae. Academy of Natural Sciences of Philadelphia Monograph No. 13, 699 pp.
Patrick, R. and C.W. Reimer. 1975. The diatoms of the United States, exclusive of Alaska and Hawaii, Volume 2, Part 1-Entomoneidaceae, Cymbellaceae, Gomphonemaceae, Epithemaceae. Academy of Natural Sciences of Philadelphia Monograph No. 13, 213 pp.
Ramstack, J.M., S.C. Fritz, D.R. Engstrom, and S.A. Heiskary. 2003. The application of a diatom-based transfer function to evaluate regional water-quality trends in Minnesota since 1970. Journal of Paleolimnology 29:79-94.
Savage, C., P. R. Leavitt, and R. Elmgren. 2004. Distribution and retention of sewage nitrogen in surface sediments of a coastal bay. Limnology and Oceanography 49:1503-1511.
Wright, H.E., Jr. 1991. Coring tips. Journal of Paleolimnology 6:37-49.
12
Paleolimnology of Rice Marsh Lake Final Report January 2015
Paleolimnology of Rice Marsh Lake Final Report January 2015
Figure 1. Percent dry weight of organic, CaCO3, and inorganic matter in the Rice Marsh Lake core plotted against core depth.
0
20
40
60
80
100
120
140
160
180
200
0 10 20 30 40 50 60
Dep
th (c
m)
Dry weight percent
% Organic
% Inorganic
% CaCO3
14
Paleolimnology of Rice Marsh Lake Final Report January 2015
Figure 2. Unsupported lead-210 activity (a), lead-210 dating model (b), and sediment accumulation rate (c) for Rice Marsh Lake.
0
20
40
60
80
100
120
140
160
180
200
0 5 10 15
Dep
th (c
m)
Unsupported lead-210 activity (pCi/g)
0 20 40 60 80
100 120 140 160 180 200
1860 1880 1900 1920 1940 1960 1980 2000 2020
Dep
th (c
m)
lead-210 age (yr)
1860
1880
1900
1920
1940
1960
1980
2000
2020 0.00 0.05 0.10 0.15 0.20 0.25
lead
-210
age
(yr)
Sediment Accumulation (g/cm2 yr)
a
c
b
15
Paleolimnology of Rice Marsh Lake Final Report January 2015
Figure 3. Detrended correspondence analysis (DCA) of diatom communities from Rice Marsh Lake.
−1.0 −0.5 0.0 0.5 1.0
−1.0
−0.5
0.0
0.5
1.0
DCA1
DC
A2
RML_2009
RML_2002
RML_1997
RML_1986
RML_1976
RML_1970
RML_1953RML_1946
RML_1932RML_1923
RML_1908
RML_1885RML_1867
RML_2014
RML_1963
16
Paleolimnology of Rice Marsh Lake Final Report January 2015
Figure 4. Downcore stratigraphy for predominant diatom taxa (greater than or equal to 5% relative abundance) in Rice Marsh Lake (1867-2014).
1860
1870
1880
1890
1900
1910
1920
1930
1940
1950
1960
1970
1980
1990
2000
2010
2020
0 20 40 60
Aulaco
seira
ambig
ua
0 20 40
Aulaco
seira
gran
ulata
0
Aulaco
seira
suba
rctica
0
Stepha
nodis
cus h
antzs
chii
0
Stepha
nodis
cus p
arvus
0 20
Stepha
nodis
cus m
inutul
us
0
Stepha
nodis
cus n
iagara
e
0
Cyclos
tepha
nos i
nvisit
atus
0 20
Cyclos
tepha
nos t
holifo
rmis
0 20
Cyclot
ella m
eneg
hinian
a
0
Cyclot
ella g
amma
1860
1870
1880
1890
1900
1910
1920
1930
1940
1950
1960
1970
1980
1990
2000
2010
2020
0 20
Fragila
ria ca
pucin
a v. m
esole
pta
0
Fragila
ria co
nstru
ens
0 20
Fragila
ria co
nstru
ens v
. bino
dis
0
Fragila
ria co
nstru
ens v
. ven
ter
0 20
Nitzsc
hia am
phibi
a
0 20
Cocco
neis
place
ntula
0 20
Cocco
neis
place
ntula
v. lin
eata
0
Achna
nthes
minu
tissim
a
0
Amphora
libyc
a
17
Paleolimnology of Rice Marsh Lake Final Report January 2015
Figure 5. The core sections from Rice Marsh Lake projected onto the MN calibration set. Symbols represent the 89 MN lakes in the calibration set, environmental vectors are shown on the inset plot. Note that logTP is strongly correlated with Axis 1.
−2 −1 0 1 2
−10
12
CCA1
CCA2
CCA, 89 MN Lakes, Rice Marsh Lake fossil data
●
●●
●●
●
●
●
●
●
●
NLFCHFMetroWCPNGPMCWD
RML_2014
RML_2009
RML_2002
RML_1997RML_1986RML_1976
RML_1970
RML_1963
RML_1953RML_1946
RML_1932RML_1923
RML_1908RML_1885
RML_1867
logTP
logZmax
pH
logColor
logx1Cl
Cond
18
Paleolimnology of Rice Marsh Lake Final Report January 2015
Figure 6. Diatom-inferred total phosphorus (TP) reconstruction for Rice Marsh Lake. Reconstruction is shown as log TP (left panel) and as backtransformed values in micrograms per liter (right panel). Error estimates on log TP are plus and minus the root mean square error of prediction from the TP transfer function.
1860
1880
1900
1920
1940
1960
1980
2000
2020 0 1 2 3
Year
logTP
1860
1880
1900
1920
1940
1960
1980
2000
2020 0 50 100 150
Year
TP (ug/l)
19
Paleolimnology of Rice Marsh Lake Final Report January 2015
Figure 7. The sediment algal pigments and nitrogen isotopes quantified in ten core sections from Rice Marsh Lake. The group of algae associated with each pigment is shown along the x-axis. Pigment concentrations are reported as nanomoles per g organic matter.