35


History of Design Air Voids Marshall Mix Design
Set up in late 1940s
Design voids set at 3 to 5%
Marshall Mix Compaction
“Standard” rolling train
Static Steel Wheel
Pneumatic tired
8% will densify under traffic to 4%
“Density at end of life = Design Density”

Superpave Mix Design “Marshall” concept carried forward
Design air voids fixed at 4%
Recommended compaction
Set at 92% Gmm

DENSITY AT END OF LIFE??
Compaction Caused by this

Typical As Constructed Density
NCHRP Report 573 Figure 4.6
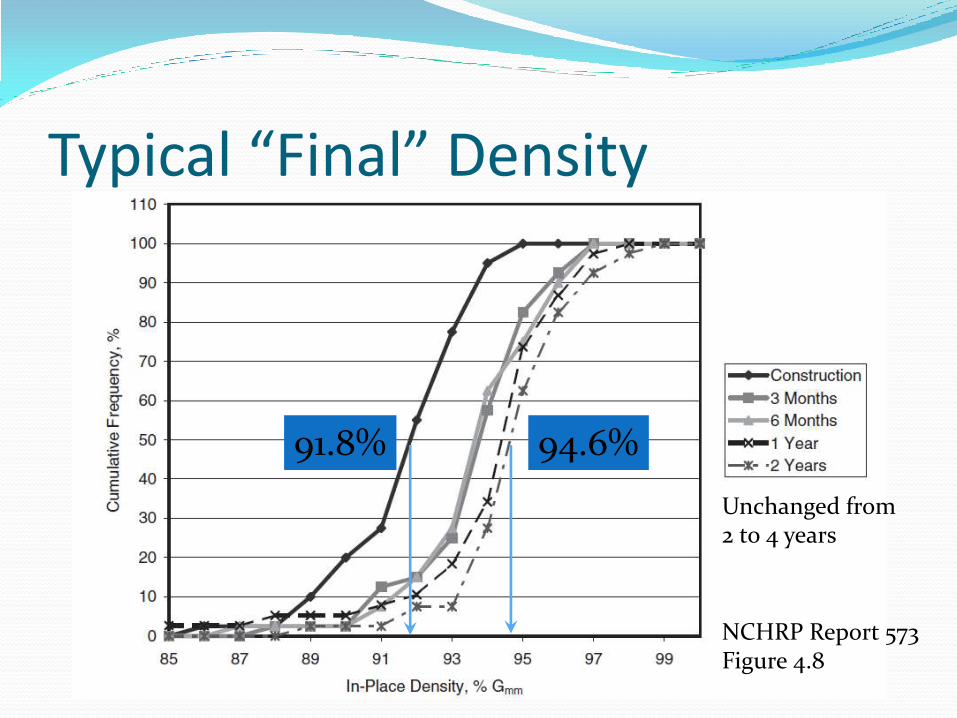
Typical “Final” Density
NCHRP Report 573 Figure 4.8
Unchanged from 2 to 4 years
91.8% 94.6%

Superpave 5 Concept Mix Design 5% air voids
Field Compaction 95% Gmm
Higher design air voids
5% instead of 4%
No change in asphalt content
Improve Durability
Lower air voids in the field

Purdue Experiment Three mix designs
9.5-mm (3-10 million)
9.5-mm (10-30 million)
19.0-mm (10-30 million)
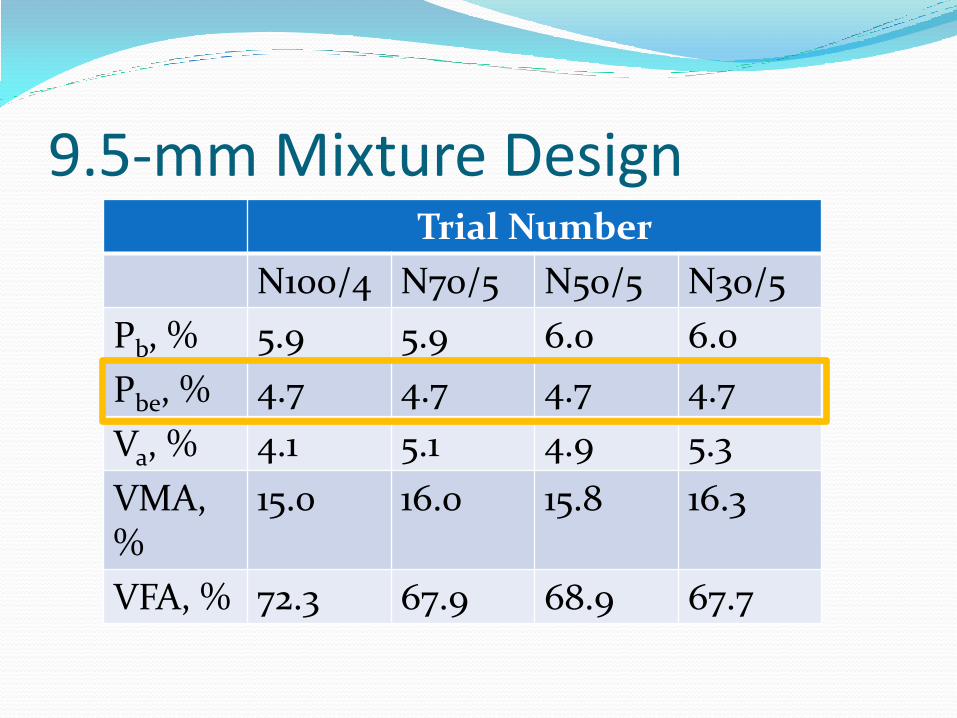
9.5-mm Mixture Design Trial Number
N100/4 N70/5 N50/5 N30/5
Pb, % 5.9 5.9 6.0 6.0
Pbe, % 4.7 4.7 4.7 4.7
Va, % 4.1 5.1 4.9 5.3
VMA, %
15.0 16.0 15.8 16.3
VFA, % 72.3 67.9 68.9 67.7

9.5-mm Mixture Gradations
0.0
20.0
40.0
60.0
80.0
100.0
Pe
rce
nt
Pa
ssin
g
Sieve Size raised to 0.45 power, mm
N100
Max Density Line

9.5-mm Mixture Gradations
0.0
20.0
40.0
60.0
80.0
100.0
Pe
rce
nt
Pa
ssin
g
Sieve Size raised to 0.45 power, mm
N100
N70
Max Density Line

9.5-mm Mixture Gradations
0.0
20.0
40.0
60.0
80.0
100.0
Pe
rce
nt
Pa
ssin
g
Sieve Size raised to 0.45 power, mm
N100
N70
N50
Max Density Line

9.5-mm Mixture Gradations
12.5 4.75 1.18 0.075 0.0
20.0
40.0
60.0
80.0
100.0
Pe
rce
nt
Pa
ssin
g
Sieve Size raised to 0.45 power, mm
N100
N70
N50
N30
Max Density Line

Rut Resistance Comparison
0
20
40
60
80
100
120
140
160
180
0 20 40 60 80 100 120
Flo
w N
um
be
r
Number of Gyrations

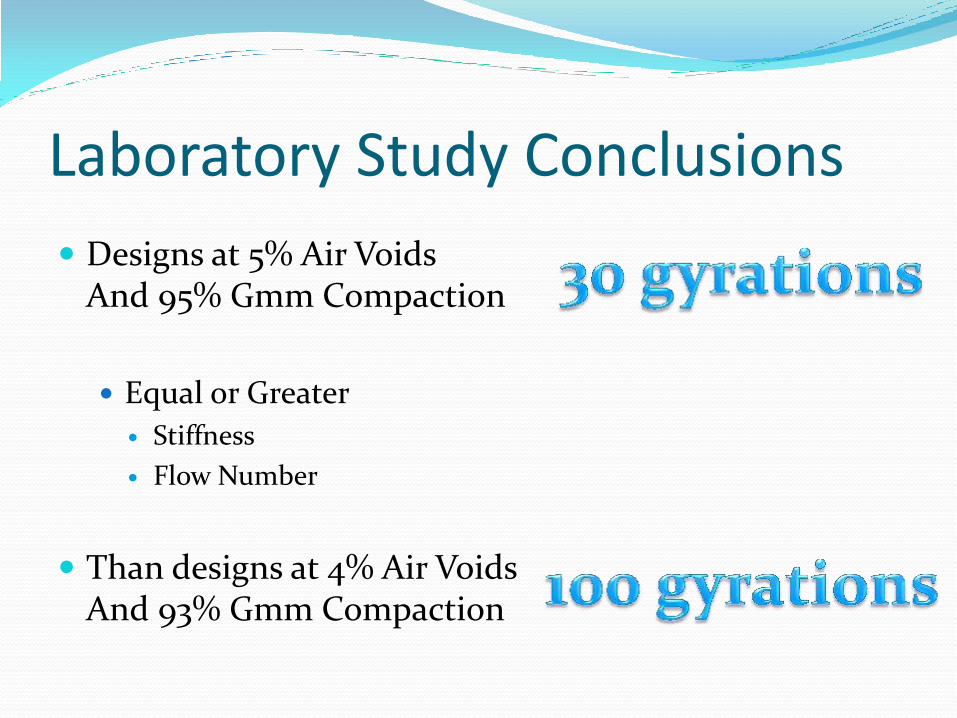
Laboratory Study Conclusions
Designs at 5% Air Voids And 95% Gmm Compaction
Equal or Greater
Stiffness
Flow Number
Than designs at 4% Air Voids And 93% Gmm Compaction

Georgetown Road
Georgetown Road Reconstruction and widening
Trial Mix
19 mm
330 lb/yd2 (3 inches)

Paving Train

Paving Train

N30 (5% Air Void) Mix

N30 (5% Air Void) Mix

N30 (5% Air Void) Mix

Field Density Control

N30 (5% Air Void) Mix

Plate Sample from Road for QA

Gradation (Plate Sample) Superpave5 (20141213) Superpave4 (20141212)
DMF Sublot 1 Sublot 2 DMF Sublot 1
25.0 100.0 100.0 100.0 100.0 100.0
19.0 95.2 97.9 97.7 95.3 98.2
12.5 80.5 84.5 91.4 82.1 86.3
9.5 68.8 73.8 82.5 73.0 76.2
4.75 42.1 48.0 54.7 47.0 51.6
2.36 30.1 33.7 37.9 32.6 35.3
1.18 20.6 22.8 25.5 20.8 22.6
0.600 14.5 15.9 17.6 13.9 15.3
0.300 9.5 10.4 11.2 9.4 10.0
0.150 6.8 7.1 7.8 6.9 7.0
0.075 5.8 5.3 6.0 5.7 5.4

QA Volumetric Properties Superpave5 Superpave4
DMF Sublot 1 Sublot 2 DMF Sublot 1
% Asphalt 4.8 4.44 4.76 4.6 4.68
Gmm 2.505 2.494 2.523
Gmb 1 2.366 2.368 2.411
Gmb 2 2.358 2.365 2.411
Air Voids 1 5.0 5.5 5.1 4.0 4.4
Air Voids 2 5.0 5.9 5.2 4.0 4.4
VMA 1 15.1 14.4 14.6 13.4 12.9
VMA 2 15.1 14.6 14.7 13.4 12.9
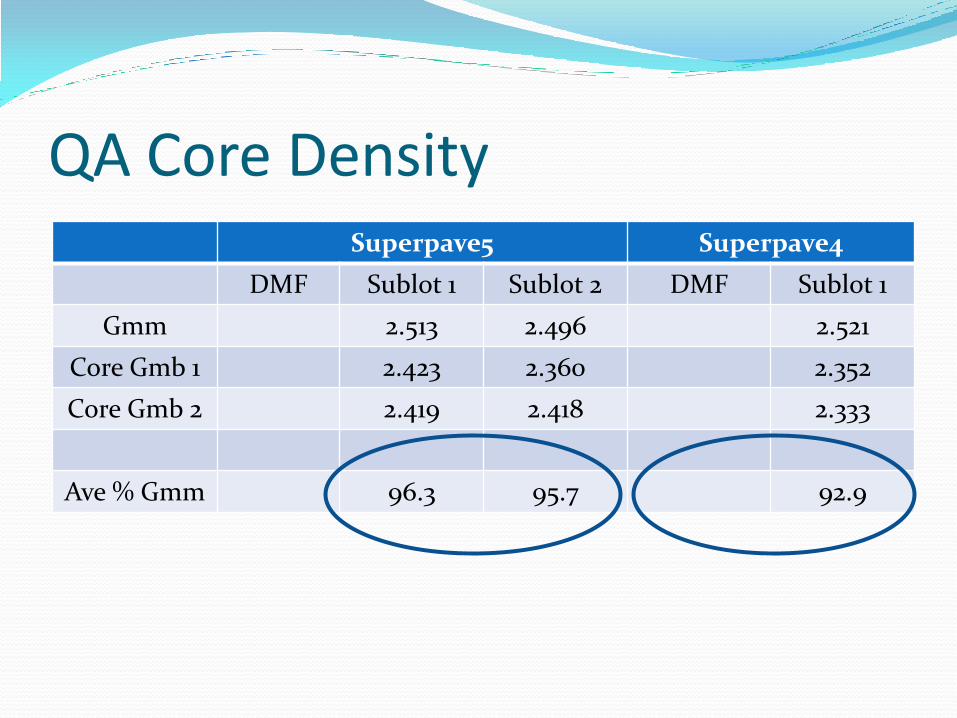
QA Core Density Superpave5 Superpave4
DMF Sublot 1 Sublot 2 DMF Sublot 1
Gmm 2.513 2.496 2.521
Core Gmb 1 2.423 2.360 2.352
Core Gmb 2 2.419 2.418 2.333
Ave % Gmm 96.3 95.7 92.9

Loose Research Samples

Research Cores

Research Samples
Testing Permeability
Hamburg Rut Testing
Short term aged
Long Term Aged
SCB
Short term aged
Long Term Aged

Next Step Superpave5 mix design set at 50 gyrations
Develop Trial Specification
Let project(s) with Superpave5 specifications
Determine Acceptance Tolerances
Air voids
VMA
Density

Thank You
Greetings from Billy Bob


