98 (1897); 5, 152 (1897). 18 H. Rubens and E. Aschkinass, Wied. Ann. 65, 241 (1898). 19 H. Rubens and H. Hollnagel, Berl. Ber., p. 26 (1910). 20 H. Rubens and H. von Wartenberg, Berl. Ber., p. 169 (1914) 21 T. Liebesch and H. Rubens, Berl. Ber., p. 198 (1919). 22 W. Weniger, J. Opt. Soc. Am. & Rev. Sci. Instrum. 7, 517 (1923). 23 T. H. Havelock, Proc. R. Soc. Lond. 84, 512 (1911); 86, 1 (1911). 24 H. Rubens and E. A. Ashkinass, Wied. Am. 67, 459 (1899). 25 H. Rubens and H. Hallnagel, Philos. Mag. 19, 76 (1910). 26 H. Rubens, Berl. Ber., p. 513 (1913). 27 H. Rubens and R. W. Wood, Philos. Mag. 21, 249 (1911). 28 H. Rubens and 0. von Baeyer, Berl. Ber., p. 339 (1911). 29 H. Rubens, Ann. Phys. (Leipz.) 18, 725 (1905). 30 W. Wien, Wied. Ann. 58, 662 (1896). 3t Lord Rayleigh, Philos. Mag. 49, 539 (1900). 32 H. Rubens and F. Kurlbaum, Berl. Ber., p. 929 (1900). 33 H. Rubens and F. Kurlbaum, Ann. Phys. (Leipz.) 4, 649 (1901). 34 M. Planck, Verh. Deut. Phys. Ges. 2, 237 (1900); Ann. Phys. (Leipz.) 4, 553 (1901). 35 H. Rubens and G. Michel, Berl. Ber., p. 590 (1921). 36E. Hagen and H. Rubens. Philos. Mag. 7, 157 (1904). 37 E. Hagen and H. Rubens, Berl. Ber., p. 478 (1909). 38 E. Hagen and H. Rubens, Ann. Phys. (Leipz.) 8, 1 (1902). 39 H. Rubens and E. Aschkinass, Astrophys. J. 8, 176 (1898). 40 H. Rubens and G. Hettner, Ver. Deut. Phys. Ges. 18, 154 (1916). 41 H. Rubens, Berl. Ber., p. 8 (1921). 42 H. Rubens and H. von Wartenberg, Z. Phys. 12, 1080 (1911). 43 N. Bjerrum, Nernst Festschrift, p. 90 (1912). 44 A. Eucken, Radioak. Elekt. 16, 361 (1919). 45 L. R. Blaine, J. Res. Natl. Bur. Stand. (U.S.) 67C, 207 (1963). 46 H. Rubens and K. Schwarzchild, Berl. Ber., p. 702 (1914). 47 H. Rubens, Wied. Ann. 56, 27 (1895). 48 H. duBois and H. Rubens, Ann. Phys. (Leipz.) 2, 84 (1900). 49 R. W. Wood, Philos. Mag. 20, 770 (1910). 50 H. M. Randall, Rev. Sci. Instrum. 3, 196 (1932). 51 E. F. Nichols and W. S. Day, Phys. Rev. 27, 225 (1908). 52 A. Trowbridge and B. J. Spence, Phys. Rev. 31, 61 (1910). 53 H. Witt, Z. Phys. 21, 374 (1920). 54 A. GLagolewa-Arkadiewa, Z. Phys. 24, 153 (1924). 55 E. F. Nichols and J. D. Tear, Phys. Rev. 21, 587 (1923); Astrophys. J. 61, 17 (1925). History of far-infrared research. II. The grating era, 1925-1960 Nathan Ginsburg Department of Physics, Syracuse University, Syracuse, New York 13210 (Received 22 December 1976) A short history of the development, after the early work by Rubens and collaborators, of grating spectroscopy in the far infrared begins with Czerny in 1925 and continues to the introduction of commercial instruments in about 1960. The spectral range was gradually extended to I mm wavelength, the resolution was increased primarily through the development of better detectors, and the ease of operation in the region was facilitated by modern electronics and sensitive recorders. This paper gives a short history of far-infrared (here- after FIR) spectroscopy during the years 1925-1960, ,,- with occasional overlaps. Particularly, it will trace \ r:MI7 the development of the use of gratings in FIR. The LAlJ i8I-- \ wavelength region that I consider FIR is from 40 ,um, where crystal quartz again starts to transmit radiation, j I 6 to 1 mm, where microwave techniques start to take j over. This is one of several papers covering the en- -_ _ __ __ __ __ __ _ tire area. Essentially all FIR work prior to 1920 was done in the laboratory of Professor Rubens. His last and high- est resolution spectrometer was described in 1921, 1 using a transmission grating as the dispersion element. The first grating instrument outside of his laboratory was that built by Witt, 2 a Rowland mount instrument us- ing a concave reflection grating. Witt had two such gratings available, one with a spacing of almost exactly 1.0 mm, the other 0. 52 mm, each with a radius of curvature of 59.7 cm. His published results show measurements from about 90 to 180 pum. In a sense, modern FIR grating spectroscopy began with Czerny, since he was able to apply quantum me- chanics to his measurements of the pure rotation spec- trum of HCl. 3 ' 4 The plan of his spectrometer and his measurement on HCl are shown in Fig. 1. He had two 865 J. Opt. Soc. Am., Vol. 67, No. 7, July 1977 0 .0 W 50 6S0 VVA 210 ,- I I 15 - 10 0S 04 Q S, S. 7' 8~ J, o (b) 60 70 60 .90 lOOpuA 10 I I I , T - I - 0- . 70 (c) FIG. 1. (a) Optical plan of the Czerny spectrometer. (b) Ro- tational spectrum of HCl, 30-70 gm. (c) Rotational spectrum of HCl, 60-100 pm. Copyright i 1977 by the Optical Society of America 865 (a)
Transcript
98 (1897); 5, 152 (1897).18 H. Rubens and E. Aschkinass, Wied. Ann. 65, 241 (1898).1 9H. Rubens and H. Hollnagel, Berl. Ber., p. 26 (1910).20 H. Rubens and H. von Wartenberg, Berl. Ber., p. 169 (1914)2 1T. Liebesch and H. Rubens, Berl. Ber., p. 198 (1919).22W. Weniger, J. Opt. Soc. Am. & Rev. Sci. Instrum. 7, 517
(1923).23T. H. Havelock, Proc. R. Soc. Lond. 84, 512 (1911); 86, 1
(1911).24H. Rubens and E. A. Ashkinass, Wied. Am. 67, 459 (1899).25H. Rubens and H. Hallnagel, Philos. Mag. 19, 76 (1910).26H. Rubens, Berl. Ber., p. 513 (1913).27H. Rubens and R. W. Wood, Philos. Mag. 21, 249 (1911).28H. Rubens and 0. von Baeyer, Berl. Ber., p. 339 (1911).29H. Rubens, Ann. Phys. (Leipz.) 18, 725 (1905).30W. Wien, Wied. Ann. 58, 662 (1896).3 tLord Rayleigh, Philos. Mag. 49, 539 (1900).32H. Rubens and F. Kurlbaum, Berl. Ber., p. 929 (1900).33 H. Rubens and F. Kurlbaum, Ann. Phys. (Leipz.) 4, 649
(1901).34M. Planck, Verh. Deut. Phys. Ges. 2, 237 (1900); Ann.
Phys. (Leipz.) 4, 553 (1901).35H. Rubens and G. Michel, Berl. Ber., p. 590 (1921).
36E. Hagen and H. Rubens. Philos. Mag. 7, 157 (1904).37 E. Hagen and H. Rubens, Berl. Ber., p. 478 (1909).38E. Hagen and H. Rubens, Ann. Phys. (Leipz.) 8, 1 (1902).39H. Rubens and E. Aschkinass, Astrophys. J. 8, 176 (1898).40H. Rubens and G. Hettner, Ver. Deut. Phys. Ges. 18, 154
(1916).41H. Rubens, Berl. Ber., p. 8 (1921).4 2H. Rubens and H. von Wartenberg, Z. Phys. 12, 1080 (1911).43 N. Bjerrum, Nernst Festschrift, p. 90 (1912).44A. Eucken, Radioak. Elekt. 16, 361 (1919).4 5L. R. Blaine, J. Res. Natl. Bur. Stand. (U.S.) 67C, 207
(1963).46H. Rubens and K. Schwarzchild, Berl. Ber., p. 702 (1914).4 7H. Rubens, Wied. Ann. 56, 27 (1895).48 H. duBois and H. Rubens, Ann. Phys. (Leipz.) 2, 84 (1900).49R. W. Wood, Philos. Mag. 20, 770 (1910).50H. M. Randall, Rev. Sci. Instrum. 3, 196 (1932).51E. F. Nichols and W. S. Day, Phys. Rev. 27, 225 (1908).52A. Trowbridge and B. J. Spence, Phys. Rev. 31, 61 (1910).53H. Witt, Z. Phys. 21, 374 (1920).54A. GLagolewa-Arkadiewa, Z. Phys. 24, 153 (1924).55E. F. Nichols and J. D. Tear, Phys. Rev. 21, 587 (1923);
Astrophys. J. 61, 17 (1925).
History of far-infrared research. II. The grating era, 1925-1960Nathan Ginsburg
Department of Physics, Syracuse University, Syracuse, New York 13210(Received 22 December 1976)
A short history of the development, after the early work by Rubens and collaborators, of gratingspectroscopy in the far infrared begins with Czerny in 1925 and continues to the introduction of commercialinstruments in about 1960. The spectral range was gradually extended to I mm wavelength, the resolutionwas increased primarily through the development of better detectors, and the ease of operation in the regionwas facilitated by modern electronics and sensitive recorders.
This paper gives a short history of far-infrared (here-after FIR) spectroscopy during the years 1925-1960, ,,-with occasional overlaps. Particularly, it will trace \ r:MI7the development of the use of gratings in FIR. The LAlJ i8I-- \wavelength region that I consider FIR is from 40 ,um,where crystal quartz again starts to transmit radiation, j I 6to 1 mm, where microwave techniques start to take jover. This is one of several papers covering the en- - _ _ __ __ __ __ __ _
tire area.
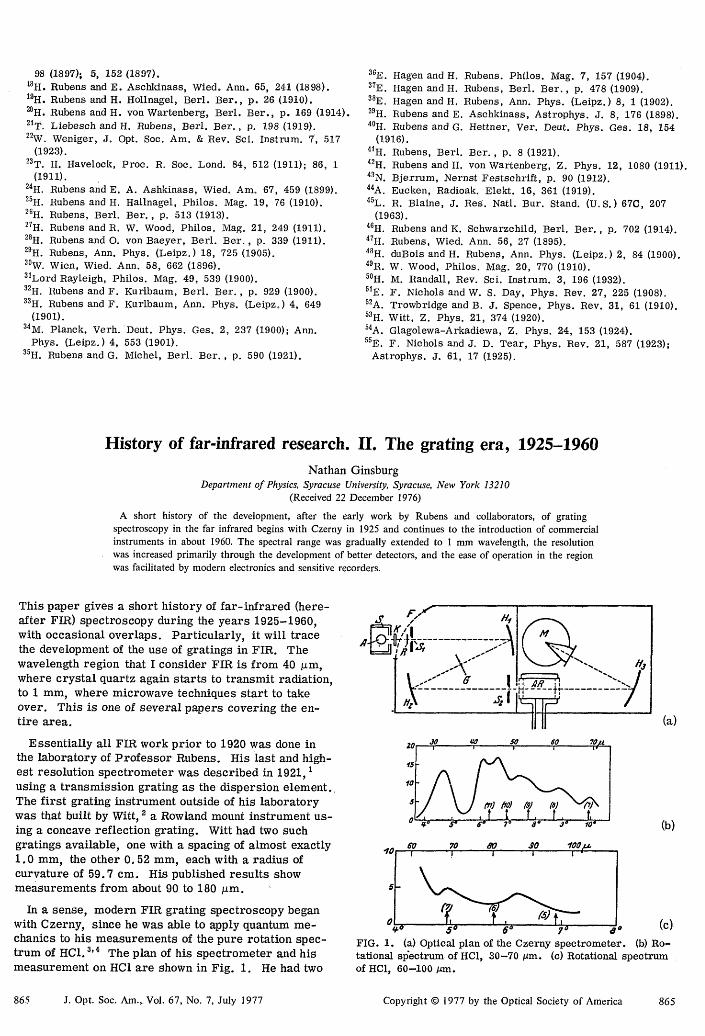
Essentially all FIR work prior to 1920 was done inthe laboratory of Professor Rubens. His last and high-est resolution spectrometer was described in 1921, 1using a transmission grating as the dispersion element.The first grating instrument outside of his laboratorywas that built by Witt, 2 a Rowland mount instrument us-ing a concave reflection grating. Witt had two suchgratings available, one with a spacing of almost exactly1.0 mm, the other 0. 52 mm, each with a radius ofcurvature of 59.7 cm. His published results showmeasurements from about 90 to 180 pum.
In a sense, modern FIR grating spectroscopy beganwith Czerny, since he was able to apply quantum me-chanics to his measurements of the pure rotation spec-trum of HCl. 3'4 The plan of his spectrometer and hismeasurement on HCl are shown in Fig. 1. He had two
865 J. Opt. Soc. Am., Vol. 67, No. 7, July 1977
0 .0 W 50 6S0 VVA210 ,- I I
15 -
10 0S
04 Q S, S. 7' 8~ J, o (b)
60 70 60 .90 lOOpuA10 I I I , T - I
- 0- . 70 (c)FIG. 1. (a) Optical plan of the Czerny spectrometer. (b) Ro-tational spectrum of HCl, 30-70 gm. (c) Rotational spectrumof HCl, 60-100 pm.
Copyright i 1977 by the Optical Society of America 865
(a)
abS-rptlO Cell
circlevernier
filament
meter coolin
to gaivanometer (a)
a,
6 4-
40
20-
Wavelength |j I
60 7,0 60 so01 Io -LtO 1-o
(b)
FIG. 2. (a) Optical plan of the Badger and Cartwvright spectrometer. (b) Rotational spectrum of ammonia.
transmission gratings of 0.4 and 0. 8 mm spacings, fur-nished him by Rubens.
While FIR measurements in the United States hadbeen made earlier (the famous Nichols and Tear5 paperin 1925), the first grating instrument designed and builtwas that by Badger 6 at the California Institute of Tech-nology. An improved version by Badger and Cart-wright7 was used to measure the rotational spectrum ofammonia. This was a vacuum instrument, but withoutsufficient resolving power to observe the doublet struc-ture of the ammonia lines. Figure 2 shows the plan oftheir spectrometer and their observation of the ammoniaspectrum between 50 and 130 im.
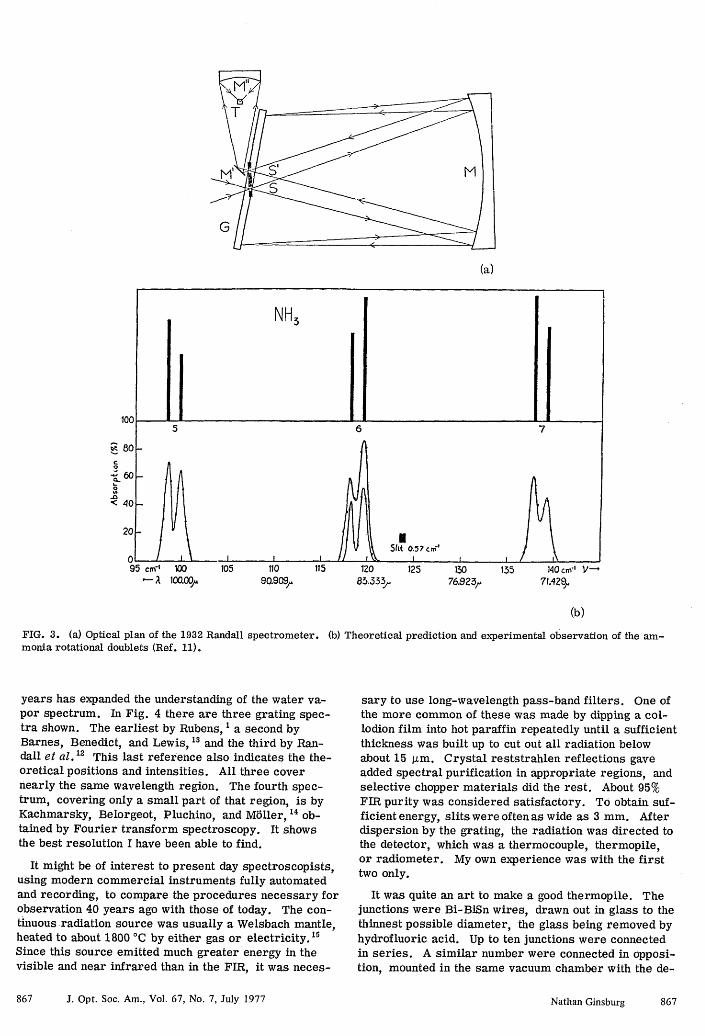
In 1932, three new FIR spectrometers were de-scribed. Barnes, a at Princeton, built a transmissiongrating instrument. Pfund,9 at Johns Hopkins, designeda universal spectrometer covering all of the infrared outto about 100 j.m. Randall, 10 at Michigan, described onemaking use of half of a 61 cm diam., 91. 5 cm focal lengthparabolic mirror which had been intended as an astro-
nomical mirror but which had been broken when the cen-ter mounting hole was being drilled into it. Using up to25. 4 x 50. 8 cm ruled gratings, this spectrometer hadavailable much more energy than any other instrumentand consequently could give much better resolution.The optical design is shown in Fig. 3.
The theoretically predicted doublet character of theammonia rotation lines was first demonstrated with theRandall instrument and reported by Wright and Randall."They also reported a much better resolved absorptionspectrum of water vapor in the 60 to 135 Atm region.With more gratings available, the water vapor spectrumfrom 18 to 110 jim was further investigated by Randall,Dennison, Ginsburg, and Weber.1 2 With the high reso-lution and excellent accuracy achieved, it was possibleto obtain all 132 energy levels of this asymmetric rota-tor out to J=11, and identify an additional 12 levels be-longing to the next three higher J values.
At this point it seems appropriate to show how theincreasing resolution of FIR spectrometers over the
866 J. Opt. Soc. Am., Vol. 67, No. 7, July 1977 Nathan Ginsburg 866
(a)
NH3
5 6 7
20 120
95 cm" 1004 a 100.00
105 11090.909
115 1ZO85*3332
125 13076.923r
135 140 cml V-'71.429,
(b)
FIG. 3. (a) Optical plan of the 1932 Randall spectrometer. (b) Theoretical prediction and experimental observation of the am-monia rotational doublets (Ref. 11).
years has expanded the understanding of the water va- sary to use long-wavelength pass-band filters. One ofpor spectrum. In Fig. 4 there are three grating spec- the more common of these was made by dipping a col-tra shown. The earliest by Rubens, 1 a second by lodion film into hot paraffin repeatedly until a sufficientBarnes, Benedict, and Lewis, 13 and the third by Ran- thickness was built up to cut out all radiation belowdall et al. 1 This last reference also indicates the the- about 15 pim. Crystal reststrahlen reflections gaveoretical positions and intensities. All three cover added spectral purification in appropriate regions, andnearly the same wavelength region. The fourth spec- selective chopper materials did the rest. About 95%trum, covering only a small part of that region, is by FIR purity was considered satisfactory. To obtain suf-Kachmarsky, Belorgeot, Pluchino, and Mbller, 14 ob- ficient energy, slits were often as wide as 3 mm. Aftertained by Fourier transform spectroscopy. It shows dispersion by the grating, the radiation was directed tothe best resolution I have been able to find. the detector, which was a thermocouple, thermopile,
or radiometer. My own experience was with the firstIt might be of interest to present day spectroscopists, two only.
using modern commercial instruments fully automatedand recording, to compare the procedures necessary for It was quite an art to make a good thermopile. Theobservation 40 years ago with those of today. The con- junctions were Bi-BiSn wires, drawn out in glass to thetinuous radiation source was usually a Welsbach mantle, thinnest possible diameter, the glass being removed byheated to about 1800 °C by either gas or electricity. 15 hydrofluoric acid. Up to ten junctions were connectedSince this source emitted much greater energy in the in series. A similar number were connected in opposi-visible and near infrared than in the FIR, it was neces- tion, mounted in the same vacuum chamber with the de-
867 J. Opt. Soc. Am., Vol. 67, No. 7, July 1977 Nathan Ginsburg 867
I I\ I- ----
K- I -
0 _,_
37.4 42.4 47.4 52.4 57.3 ;62.3 67.3 72.3 /Wavelength in M
(b)
1.3 t.z.z U.2 92.2 Y/. 1UL.Z 1
AAA A A A A AA., A A AA. AA A Ak. t
:S :200 2o0 2 p30 z-o 250
-AAAA A/EAA A A A:. A_ A At
1A 0 150 170 1.o 1 0
hAA -A .A AAA A A..A A~ .. A
80
z20
0"
4
100 .1U
(c)
(d)
FIG. 4. Comparison of water vapor absorption spectra. (a) Rul(Ref. 13). (c) Randall, Dennison, Ginsburg, and Weber, 1937 (I1976 (Ref. 14).
tector group, but out of the radiation beam. Since bothsets were subject to the same external temperature vari-ations, it was hoped that the counter voltages would can-cel and counter any drift due to such changes. Radia-tion receivers, tiny strips of metal covered with carbonor metal black, were carefully soldered to each junctionwith care so they would not touch. The total overall
bens, 1921 (Ref. 1). (b) Barnes, Benedict, and Lewis, 1935lef. 12). (d) Kachmarsky, Belorgeot, Pluchina, and Moller,
length was not more than 1. 25 cm.
The thermopile voltage was measured by a matchinglow resistance galvanometer of long period. Deflectionsof this galvanometer were never more than a few milli-meters so amplification was necessary. This was pro-vided for by Moll-Burger, Pfund, 16 or Firestone17 opti-
868 J. Opt. Soc. Am., Vol. 67, No. 7, July 1977
(a)
- I
1J. V
Nathan Ginsburg 868
0T ~ III II II
0 06 010,-- 0 0 -. 0 L -00.050 0060 000 0.1 .. 06i- - - .II --T_ F -
1. -
II.I D I0 .
II
11 - /%--(RUR5TOIN *sIt---
-,, I I 11 I I0 I I I
0030 I 0.. 0 I 050I 0060. . I
0.1
to,
103!i lo'
t
10
I
C:
(b)
P1H0TN ENERG .00)
(a)
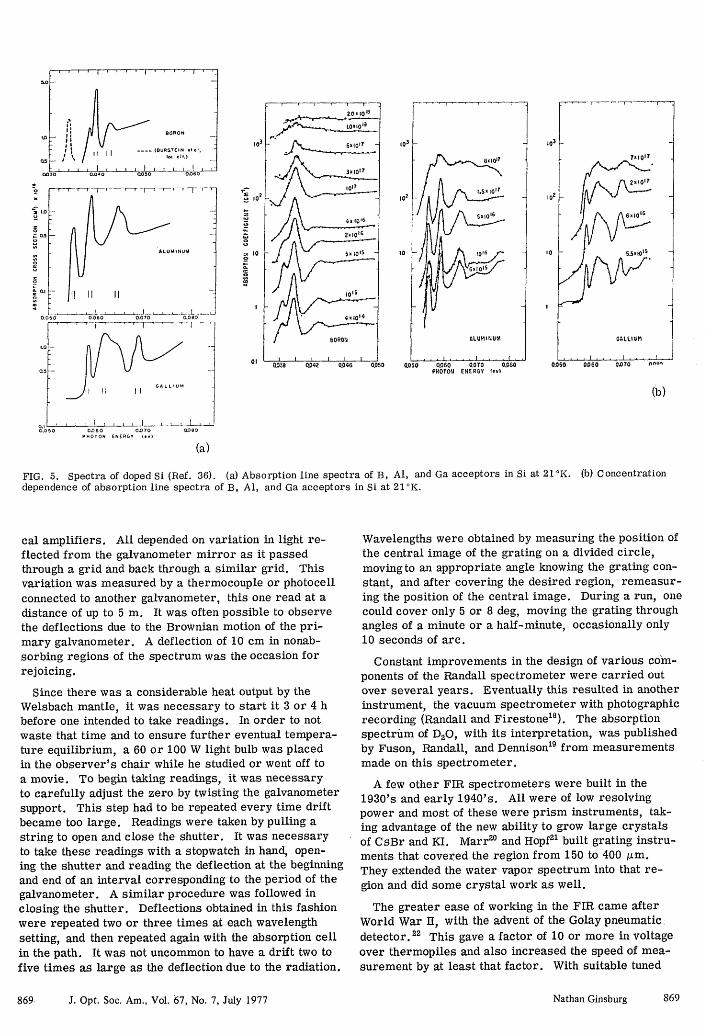
FIG. 5. Spectra of doped Si (Ref. 36). (a) Absorption line spectra of B, Al, and Ga acceptors in Sidependence of absorption line spectra of B, Al, and Ga acceptors in Si at 21'K.
cal amplifiers. All depended on variation in light re-flected from the galvanometer mirror as it passedthrough a grid and back through a similar grid. Thisvariation was measured by a thermocouple or photocellconnected to another galvanometer, this one read at adistance of up to 5 m. It was often possible to observethe deflections due to the Brownian motion of the pri-mary galvanometer. A deflection of 10 cm in nonab-sorbing regions of the spectrum was the occasion forrejoicing.
Since there was a considerable heat output by theWelsbach mantle, it was necessary to start it 3 or 4 hbefore one intended to take readings. In order to notwaste that time and to ensure further eventual tempera-ture equilibrium, a 60 or 100 W light bulb was placedin the observer's chair while he studied or went off toa movie. To begin taking readings, it was necessaryto carefully adjust the zero by twisting the galvanometersupport. This step had to be repeated every time driftbecame too large. Readings were taken by pulling astring to open and close the shutter. It was necessaryto take these readings with a stopwatch in hand, open-ing the shutter and reading the deflection at the beginningand end of an interval corresponding to the period of thegalvanometer. A similar procedure was followed inclosing the shutter. Deflections obtained in this fashionwere repeated two or three times at each wavelengthsetting, and then repeated again with the absorption cellin the path. It was not uncommon to have a drift two tofive times as large as the deflection due to the radiation.
at 21'K. (b) Concentration
Wavelengths were obtained by measuring the position ofthe central image of the grating on a divided circle,movingto an appropriate angle knowing the grating con-stant, and after covering the desired region, remeasur-ing the position of the central image. During a run, onecould cover only 5 or 8 deg, moving the grating throughangles of a minute or a half-minute, occasionally only10 seconds of arc.
Constant improvements in the design of various com-ponents of the Randall spectrometer were carried outover several years. Eventually this resulted in anotherinstrument, the vacuum spectrometer with photographicrecording (Randall and Firestone' 8 ). The absorptionspectrum of D20, with its interpretation, was publishedby Fuson, Randall, and Dennison'9 from measurementsmade on this spectrometer.
A few other FIR spectrometers were built in the1930's and early 1940's. All were of low resolvingpower and most of these were prism instruments, tak-ing advantage of the new ability to grow large crystalsof CsBr and KI. Marr2 0 and Hopf2l built grating instru-ments that covered the region from 150 to 400 ,um.They extended the water vapor spectrum into that re-gion and did some crystal work as well.
The greater ease of working in the FIR came afterWorld War H, with the advent of the Golay pneumaticdetector.2 2 This gave a factor of 10 or more in voltageover thermopiles and also increased the speed of mea-surement by at least that factor. With suitable tuned
869 J. Opt. Soc. Am., Vol. 67, No. 7, July 1977
6o0
ALUMINUM
t05o 0.060 0.070 0.060PROTON ENERGY feo)
Ik
Iw
Io
I
I
m
Nathan Ginsburg 869
a) 1.2mm H 2 .0,
b b) 1.2mm H2 0, 228 cm N2
c) 1.2mm H2 0, 45cmN 2
d) 1.2mm H 2 0, 76cm N2
\d|
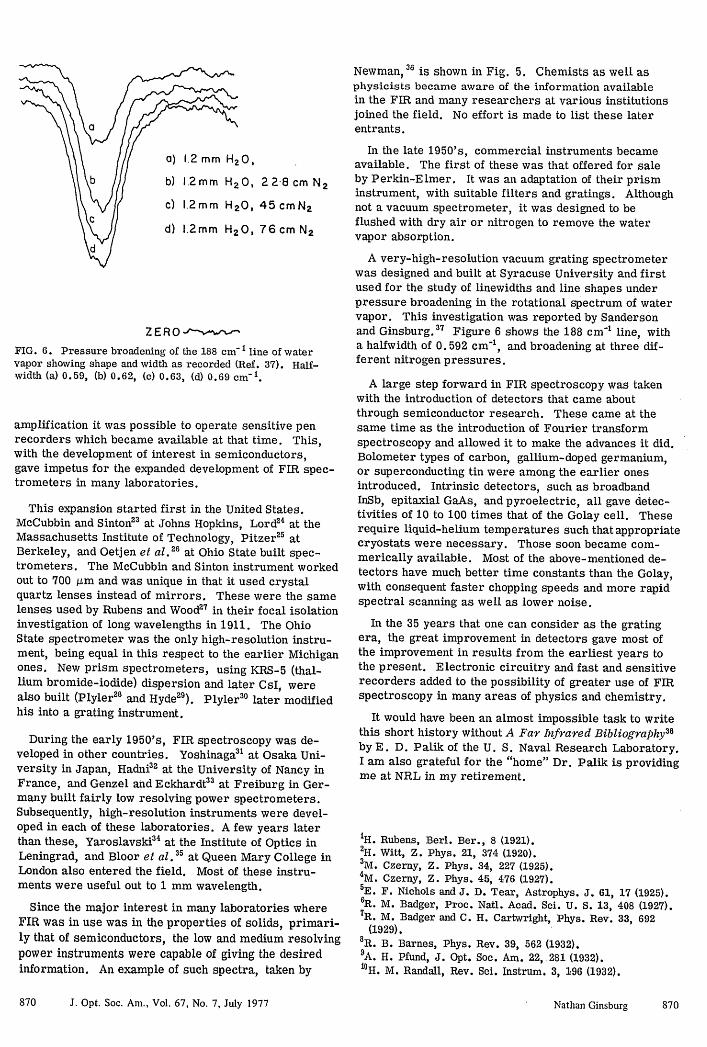
ZERO -v-"~FIG. 6. Pressure broadening of the 188 cm- 1 line of watervapor showing shape and width as recorded (Ref. 37). Half-width (a) 0.59, (b) 0.62, (c) 0.63, (d) 0.69 cm 1 .
amplification it was possible to operate sensitive penrecorders which became available at that time. This,with the development of interest in semiconductors,gave impetus for the expanded development of FIR spec-trometers in many laboratories.
This expansion started first in the United States.McCubbin and Sinton23 at Johns Hopkins, Lord2 4 at theMassachusetts Institute of Technology, Pitzer2 5 atBerkeley, and Oetjen et al.2 6 at Ohio State built spec-trometers. The McCubbin and Sinton instrument workedout to 700 ,um and was unique in that it used crystalquartz lenses instead of mirrors. These were the samelenses used by Rubens and Wood7 in their focal isolationinvestigation of long wavelengths in 1911. The OhioState spectrometer was the only high-resolution instru-ment, being equal in this respect to the earlier Michiganones. New prism spectrometers, using KRS-5 (thal-lium bromide-iodide) dispersion and later CsI, werealso built (Plyler2 8 and Hyde29). Plyler30 later modifiedhis into a grating instrument.
During the early 1950's, FIR spectroscopy was de-veloped in other countries. Yoshinaga3 ' at Osaka Uni-versity in Japan, Hadni32 at the University of Nancy inFrance, and Genzel and Eckhardt3 3 at Freiburg in Ger-many built fairly low resolving power spectrometers.Subsequently, high-resolution instruments were devel-oped in each of these laboratories. A few years laterthan these, Yaroslavski3 4 at the Institute of Optics inLeningrad, and Bloor et al. 35 at Queen Mary College inLondon also entered the field. Most of these instru-ments were useful out to 1 mm wavelength.
Since the major interest in many laboratories whereFIR was in use was in the properties of solids, primari-ly that of semiconductors, the low and medium resolvingpower instruments were capable of giving the desiredinformation. An example of such spectra, taken by
Newman, 36 is shown in Fig. 5. Chemists as well asphysicists became aware of the information availablein the FIR and many researchers at various institutionsjoined the field. No effort is made to list these laterentrants.
In the late 1950's, commercial instruments becameavailable. The first of these was that offered for saleby Perkin-Elmer. It was an adaptation of their prisminstrument, with suitable filters and gratings. Althoughnot a vacuum spectrometer, it was designed to beflushed with dry air or nitrogen to remove the watervapor absorption.
A very-high-resolution vacuum grating spectrometerwas designed and built at Syracuse University and firstused for the study of linewidths and line shapes underpressure broadening in the rotational spectrum of watervapor. This investigation was reported by Sandersonand Ginsburg.3 7 Figure 6 shows the 188 cm' line, witha halfwidth of 0. 592 cm-', and broadening at three dif-ferent nitrogen pressures.
A large step forward in FIR spectroscopy was takenwith the introduction of detectors that came aboutthrough semiconductor research. These came at thesame time as the introduction of Fourier transformspectroscopy and allowed it to make the advances it did.Bolometer types of carbon, gallium-doped germanium,or superconducting tin were among the earlier onesintroduced. Intrinsic detectors, such as broadbandInSb, epitaxial GaAs, and pyroelectric, all gave detec-tivities of 10 to 100 times that of the Golay cell. Theserequire liquid-helium temperatures such that appropriatecryostats were necessary. Those soon became com-merically available. Most of the above-mentioned de-tectors have much better time constants than the Golay,with consequent faster chopping speeds and more rapidspectral scanning as well as lower noise.
In the 35 years that one can consider as the gratingera, the great improvement in detectors gave most ofthe improvement in results from the earliest years tothe present. Electronic circuitry and fast and sensitiverecorders added to the possibility of greater use of FIRspectroscopy in many areas of physics and chemistry.
It would have been an almost impossible task to writethis short history without A Far Infrared Bibliography38
by E. D. Palik of the U. S. Naval Research Laboratory.I am also grateful for the "home" Dr. Palik is providingme at NRL in my retirement.
1 H. Rubens, Berl. ser., 8 (1921).2H. Witt, Z. Phys. 21, 374 (1920).3M. Czerny, Z. Phys. 34, 227 (1925).4M. Czerny, Z. Phys. 45, 476 (1927).5 E. F. Nichols and J. D. Tear, Astrophys. J. 61, 17 (1925).6 R. M. Badger, Proc. Natl. Acad. Sci. U. S. 13, 408 (1927).7R. M. Badger and C. H. Cartwright, Phys. Rev. 33, 692
(1929).8 R. B. Barnes, Phys. Rev. 39, 562 (1932).9 A. H. Pfund, J. Opt. Soc. Am. 22,.281 (1932).10H. M. Randall, Rev. Sci. Instrum. 3, 196 (1932).
870 J. Opt. Soc. Am., Vol. 67, No. 7, July 1977 Nathan Ginsburg 870
"N. Wright and H. M. Randall, Phys. Rev. 44, 391 (1933)."2 H. M. Randall, D. M. Dennison, N. Ginsburg, and L. R.
Weber, Phys. Rev. 52, 106 (1937).13 R. B. Barnes, W. S. Benedict, and C. M. Lewis, Phys.Rev. 47, 918 (1935).
14 J. Kachmarsky, C. Belorgeot, A. Pluchino, and K. D.M3ller, Appl. Opt. 15, 708 (1976).
15A. H. Pfund, J. Opt. Soc. Am. 26, 439 (1936).16 A. H. Pfund, Science 69, 711 (1929).17 F. A. Firestone, Rev. Sci. Instrum. 3, 163 (1932).
H. M. Randall and F. A. Firestone, Rev. Sci. Instrum. 9,404 (1938).
19 N. Fuson, H. M. Randall, and D. M. Dennison, Phys. Rev.56, 982 (1939).
200. Marr, Z. Phys. 113, 415 (1939).
21H. Hopf, Z. Phys. 116, 310 (1940).22 M. J. E. Golay, Rev. Sci. Instrum. 18, 347 (1947).23 T. K. McCubbin and W. M. Sinton, J. Opt. Soc. Am. 40,
537 (1950).2 4R. C. Lord, Phys. Rev. 85, 140 (1952).2 5C. R. Bohn, N. K. Freeman, W. D. Gwinn, J. L. Hallen-
berg, and K. S. Pitzer, J. Chem. Phys. 21, 719 (1953).
2 6R. A. Oetjen, W. H. Haynie, W. M. Ward, R. L. Hansler,H. E. Schanwecker, and E. E. Bell, J. Opt. Soc. Am. 42,559 (1952).
27H. Rubens and R. W. Wood, Philos. Mag. 21, 249 (1911).28E. K. Plyler, J. Res. Natl. Bur. Stand. (U.S.) 41, 125
(1948).2 9W. L. Hyde, J. Chem. Phys. 16, 744 (1948).30 E. K. Plyler and N. Acquista, J. Chem. Phys. 23, 752
(1955).31H. Yoshinaga and Y. Yamada, J. Phys. Soc. Jpn. 7, 223
(1952).32 A. Hadni, Rev. Opt. 33, 576 (1954).33 L. Genzel and W. Eckhardt, Z. Phys. 139, 578 (1954).34N. G. Yaroslavski, B. A. Zheludov, and A. E. Stanevich,
Opt. Spectrosk. 1, 507 (1958).3 5D. Bloor, T. J. Dean, G. 0. Jones, D. H. Martin, P. A.
Mawer, and C. H. Perry, Proc. R. Soc. Lond. 260, 510(1961).
3 6R. Newman, Phys. Rev. 103, 103, (1956).37 R. B. Sanderson and N. Ginsburg, J. Quant. Spectros.
Radiat. Transfer 3, 435 (1963).38 E. D. Palik, NRL Bibliography No. 21 April 1963.
Interferometry from 1950 to the presentL. Genzel* and K. Sakai
Osaka University, Faculty of Engineering, Department of Applied Physics, Osaka, Japan(Received 18 November 1976)
This review paper deals with the history, the important aspects, and the development of far-infraredFourier transform spectroscopy and Fabry-Perot interferometry from 1950 to the present. Most of thefundamentals of Fourier spectroscopy were worked out in the period from 1951-1961 after the realization ofthe multiplex advantage. The following period from 1962 to the present brought new instrumentalinnovations and refinements and the stage of general use. Fabry-Perot interferometry became possible in thefar infrared since metal mesh was found to be the ideal reflector for the interferometer. This kind ofinterferometry is now mainly and increasingly used in connection with far-infrared laser research.
I. HISTORICAL INTRODUCTION
This paper is concerned with the historical developmentand the outline of the important aspects of far-infra-red (ir) and submillimeter interferometry since 1950.It covers the two essential techniques of Fourier trans-form spectroscopy (FTS) and Fabry-Perot interferome-try (FPI). Although Rubens and co-workers' used bothmethods in the beginning of this century, it was onlyafter 1950 that these techniques could be successfullyrevived due to two inventions, namely, the discovery ofthe so-called multiplex gain of FTS by Fellgett 2 and theintroduction of metal mesh as nearly lossless reflectorsfor FPI by Renk and Genzel. 3
An historical review of the development of FTS up to1965 has been published by Loewenstein. 4 Detailed de-scriptions of this field are found in the review articlesor books by Mertz, Vanasse and H. Sakai, 6 Genzel, 7
Loewenstein, 8 Chantry, 9 R. J. Bell, " Geick, t1 andGriffiths. 12 The important aspects of FPI, in general,have been reviewed by Jacquinot13 while far-ir FPI isfound in detail in the book of M6ller and Rothschild 1 4 onfar-ir spectroscopy.
The FTS, based on two-beam interferometry, is
871 J. Opt. Soc. Am.. Vol. 67, No. 7, July 1977
clearly today's most important spectroscopic methodfor the whole ir, and it is probable that it will remainso in the near future even if tunable-laser spectroscopyis developed further. This is because of the unique po-tential of FTS to perform very fast measurements fromweak continuous sources over a large spectral range.
The FPI, on the other hand, is not so much a spectro-scopic method in itself. But it may become increasinglyimportant as an additional tool for far-ir laser researchor for low-intensity measurements in limited spectralregions where FTS is unnecessarily complicated. TheFPI has an important light throughput or etendue gainover slit spectrometers as first pointed out by Jacquinotand Dufour. 15 The same advantage is found in FTS usingMichelson-type interferometers due essentially to theiraxial symmetry of entrance and exit apertures.
The development of FTS started in several laborato-ries, shortly after Fellgett' s rediscovery. Strong andco-workers' 6 started to build a lamellar grating inter-ferometer for the far ir, where no efficient beam split-ters for Michelson interferometers were known. Mertz 5
constructed the first polarizing interferometer based onthe property of wire grids to split an unpolarized beam