PERFORMANCE 48 Financial 48 Segment Information 50 Financial and Non-Financial Highlights 52 10-Year Financial Data 54 Operating and Financial Review 60 Consolidated Statement of Financial Position 62 Consolidated Statement of Profit or Loss 63 Consolidated Statement of Comprehensive Income 64 Consolidated Statement of Changes in Equity 65 Consolidated Statement of Cash Flows 66 Summarized Consolidated Statement of Financial Position by Manufacturing, Services and Others and Financial Services 67 Summarized Consolidated Statement of Profit or Loss by Manufacturing, Services and Others and Financial Services 67 Summarized Consolidated Statement of Cash Flows by Manufacturing, Services and Others and Financial Services 46 Hitachi, Ltd. Integrated Report 2017
Transcript
PERFORMANCE
48 Financial48 Segment Information
50 Financial and Non-Financial Highlights
52 10-Year Financial Data
54 Operating and Financial Review
60 Consolidated Statement of Financial Position
62 Consolidated Statement of Profit or Loss
63 Consolidated Statement of Comprehensive Income
64 Consolidated Statement of Changes in Equity
65 Consolidated Statement of Cash Flows
66 Summarized Consolidated Statement of Financial Position by Manufacturing, Services and Others and Financial Services
67 Summarized Consolidated Statement of Profit or Loss by Manufacturing, Services and Others and Financial Services
67 Summarized Consolidated Statement of Cash Flows by Manufacturing, Services and Others and Financial Services
46 Hitachi, Ltd. Integrated Report 2017
3.3%4.3%3.5%
5.3%
1.2% –0.9%
2,331.92,333.1
2,066.2
6.4%5.9%
7.0%
5.6% 5.7% 5.7%1,170.31,127.61,131.6
7.3%
3.0%
3.5%
7.4%
3.4%
3.0%
753.9758.3815.7
6.6% 6.7%
7.7%
5.2% 5.2%
3.9%
1,982.82,109.32,034.0
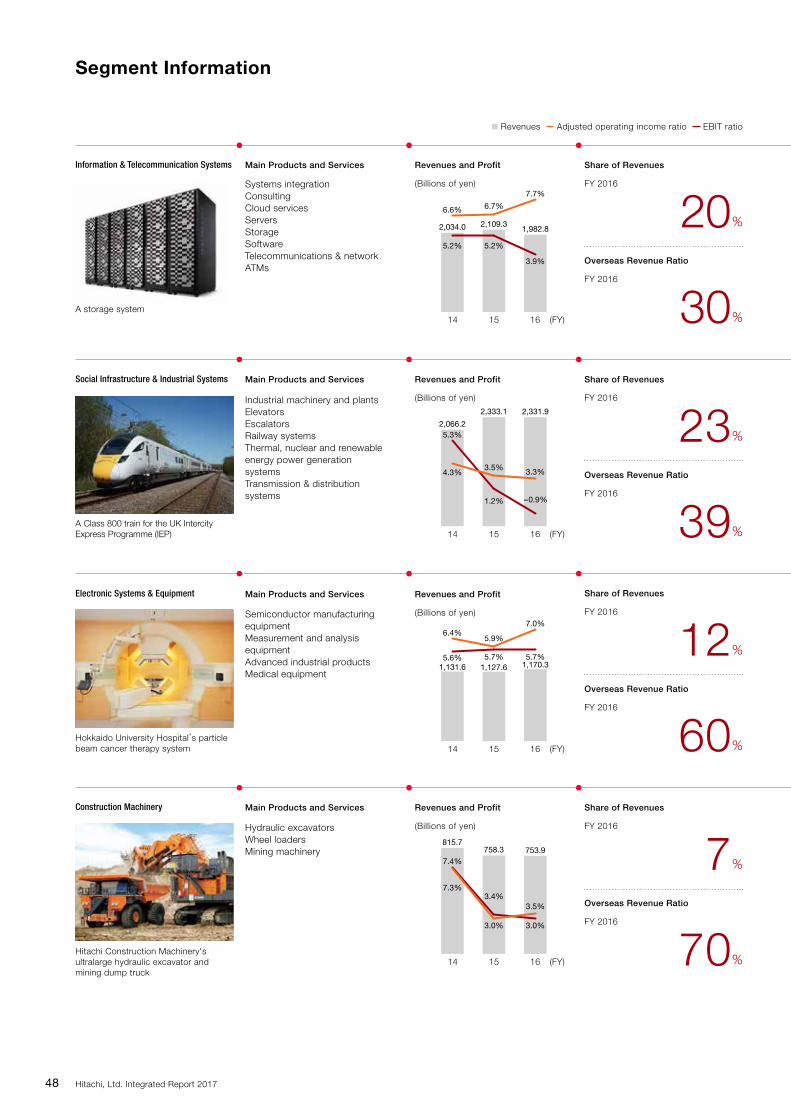
Information & Telecommunication Systems
Electronic Systems & Equipment
Construction Machinery
Social Infrastructure & Industrial Systems
A storage system
Hokkaido University Hospital’s particle beam cancer therapy system
Hitachi Construction Machinery's ultralarge hydraulic excavator and mining dump truck
A Class 800 train for the UK Intercity Express Programme (IEP)
Main Products and Services
Main Products and Services
Main Products and Services
Main Products and Services
Systems integrationConsultingCloud servicesServersStorageSoftwareTelecommunications & networkATMs
Semiconductor manufacturingequipmentMeasurement and analysisequipmentAdvanced industrial productsMedical equipment
Industrial machinery and plantsElevatorsEscalatorsRailway systemsThermal, nuclear and renewableenergy power generationsystemsTransmission & distributionsystems
Hydraulic excavatorsWheel loadersMining machinery
Revenues Adjusted operating income ratio EBIT ratio
Revenues and Profit
(Billions of yen)
Revenues and Profit
(Billions of yen)
Revenues and Profit
(Billions of yen)
Revenues and Profit
(Billions of yen)
(FY)161514
(FY)161514
(FY)161514
(FY)161514
Share of Revenues
FY 2016
20%
Share of Revenues
FY 2016
23%
Share of Revenues
FY 2016
12%
Share of Revenues
FY 2016
7%
Overseas Revenue Ratio
FY 2016
30%
Overseas Revenue Ratio
FY 2016
39%
Overseas Revenue Ratio
FY 2016
60%
Overseas Revenue Ratio
FY 2016
70%
Segment Information
48 Hitachi, Ltd. Integrated Report 2017
10.9% 12.4% 11.9%
9.9%
12.8% 12.7%
179.2
365.3356.2
7.9% 8.1% 8.2%
8.1%
9.8%
8.4%
1,464.61,564.01,529.4
5.1%
6.2%
5.7%
3.7%
5.4%
6.6%
992.21,001.1936.9
3.8% 3.5%4.0%
4.6%
6.2% 5.7%
557.3
681.0754.2
3.3%
4.2% 3.4%4.0%
3.2% 3.2%653.7
1,252.71,274.2
Revenues Adjusted operating income ratio EBIT ratio
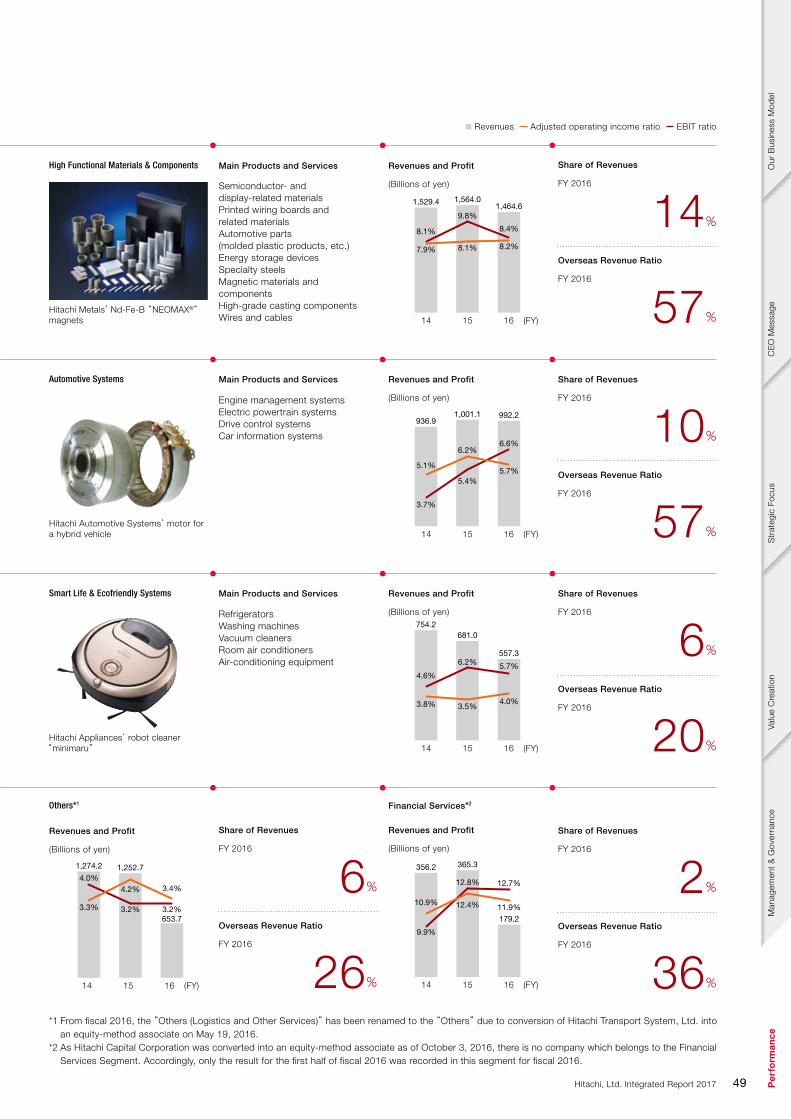
Automotive Systems
High Functional Materials & Components
Smart Life & Ecofriendly Systems
Hitachi Automotive Systems’ motor for a hybrid vehicle
Hitachi Metals’ Nd-Fe-B “NEOMAX®” magnets
Hitachi Appliances’ robot cleaner “minimaru”
Main Products and Services
Main Products and Services
Main Products and Services
Engine management systemsElectric powertrain systemsDrive control systemsCar information systems
RefrigeratorsWashing machinesVacuum cleanersRoom air conditionersAir-conditioning equipment
Semiconductor- anddisplay-related materialsPrinted wiring boards and related materialsAutomotive parts(molded plastic products, etc.)Energy storage devicesSpecialty steelsMagnetic materials andcomponentsHigh-grade casting components Wires and cables
Revenues and Profit
(Billions of yen)
Revenues and Profit
(Billions of yen)
Revenues and Profit
(Billions of yen)
(FY)161514
14 (FY)1615
(FY)161514
Share of Revenues
FY 2016
10%
Share of Revenues
FY 2016
6%
Share of Revenues
FY 2016
14%
Overseas Revenue Ratio
FY 2016
57%
Overseas Revenue Ratio
FY 2016
20%
Overseas Revenue Ratio
FY 2016
57%
Revenues and Profit
(Billions of yen)
Others*1 Financial Services*2
*1 From fiscal 2016, the “Others (Logistics and Other Services)” has been renamed to the “Others” due to conversion of Hitachi Transport System, Ltd. into an equity-method associate on May 19, 2016.
*2 As Hitachi Capital Corporation was converted into an equity-method associate as of October 3, 2016, there is no company which belongs to the Financial Services Segment. Accordingly, only the result for the first half of fiscal 2016 was recorded in this segment for fiscal 2016.
(FY)161514
Revenues and Profit
(Billions of yen)
(FY)161514
Share of Revenues
FY 2016
6%
Share of Revenues
FY 2016
2%
Overseas Revenue Ratio
FY 2016
26%
Overseas Revenue Ratio
FY 2016
36%
Hitachi, Ltd. Integrated Report 2017 49
Man
agem
ent
& G
over
nanc
eO
ur B
usin
ess
Mod
elS
trat
egic
Foc
us
Per
form
ance
CE
O M
essa
geVa
lue
Cre
atio
n
0
2,000
4,000
6,000
8,000
10,000
12,000
0
10
20
30
40
50
60
07 08 09 10 11 12 13 14 13 14 15 16 –400
–200
0
200
400
600
800
–4
–2
0
2
4
6
8
07 08 09 10 11 12 13 14 13 14 15 16
–50
–30
–20
–40
–10
0
10
20
30
07 08 09 10 11 12 13 14 13 14 15 16 –900
–450
0
450
900
07 08 09 10 11 12 13 14 13 14 15 16
0
200
400
600
800
1,000
07 08 09 10 11 12 13 14 13 14 15 16 0
100
200
300
400
500
07 08 09 10 11 12 13 14 13 14 15 16 0
1
2
3
4
5
Operating income (Adjusted operating income) / Operating income (Adjusted operating income) ratio / EBIT / EBIT ratio
Return on equity (ROE) / Return on assets (ROA) Cash flows
Capital expenditures*1 / Depreciation R&D expenditures / R&D expenditures as a percentage of consolidated revenues
Revenues / Overseas sales ratio
Operating income (Adjusted operating income) (left scale) EBIT (left scale) Operating income (Adjusted operating income) ratio (right scale) EBIT ratio (right scale)
Cash flows from operating activities Cash flows from investing activities Free cash flows
R&D expenditures (left scale) R&D expenditures as a percentage of consolidated revenues (right scale)
Revenues ( Japan Asia North America Europe Other Areas) (left scale) Overseas sales ratio (right scale)
ROE ROA
Capital expenditures Depreciation
(Billions of yen) (%)
(Billions of yen)
(Billions of yen) (%)
(Billions of yen) (%)
(%)
(Billions of yen)
U.S. GAAP
U.S. GAAP
U.S. GAAP
U.S. GAAP
U.S. GAAP
U.S. GAAP
IFRS
IFRS
IFRS
IFRS
IFRS
IFRS
(FY) (FY)
(FY)
(FY)
(FY)
(FY)
Financial and Non-Financial Highlights
50 Hitachi, Ltd. Integrated Report 2017
12 13 14 15 160
10,000
20,000
30,000
40,000
12 13 14 15 160
1,000
2,000
3,000
4,000
0
2
4
6
8
12 13 14 15 160
0.10
0.20
0.30
0
100
200
300
12 13 14 15 160
5,000
10,000
15,000
12 13 14 15 160
1,000
2,000
3,000
4,000
12 13 14 15 160
10
20
30
40
50
*1 In line with IFRS standards, capital investment is stated exclusive of investment in lease assets classified as finance leases. *2 This new indicator is calculated from fiscal 2016 onward as a percentage of the fiscal 2010 amount. *3 Fiscal 2016 figure includes a materials company that became a consolidated member of the Hitachi Group that year. *4 Number of full-time employees *5 Hitachi, Ltd. *6 No data available for fiscal 2012. *7 Total number of patents registered in the United States, Europe, and China. The number of patents
registered in Europe is based on European patent applications under European Patent Convention (EPC).
Number of employees*4*5
Occupational accident rate at companies surveyed in Japan
Global number and ratio of female managers*6
Number of registered patents
Rate of reduction in CO2 emissions from use of products and services*2
Total Hitachi, Ltd. stockholders' equity ratio 20.6 11.2 14.3 15.7 18.8 21.2 24.1 23.6
Notes: 1 In order to be consistent with financial reporting principles and practices generally accepted in Japan, operating income is presented as total revenues less cost of sales and selling, general and administrative expenses. The Company believes that this is useful to investors in comparing the Company's financial results with those of other Japanese companies. Under accounting principles generally accepted in the United States of America, restructuring charges, net gain or loss on sales and disposal of rental assets and other property and impairment losses for long-lived assets are included as part of operating income.
2 The restructuring charges mainly represent special termination benefits incurred with the reorganization of our business structures and as the result of the Company and its subsidiaries reviewing and reshaping the business portfolio.
3 EBIT is presented as income before income taxes less interest income plus interest charges. 4 The Company has changed the number of employees to exclude temporary employees starting from the year ended March 31, 2010. The figures for the prior
years have been restated to reflect the current year's presentation. 5 Effective from fiscal 2014, a part of the thermal power generation systems business is classified as a discontinued operation in accordance with the provision
of ASC 205-20, 〞Presentation of Financial Statements - Discontinued Operations,〞 which was not transferred to MITSUBISHI HITACHI POWER SYSTEMS, LTD. for the business integration in the thermal power generation systems with Mitsubishi Heavy Industries, Ltd. The results of the discontinued operation are reported separately from continuing operations. In line with this classification, 〞Revenues〞 and 〞Operating income〞 for fiscal 2013 are reclassified.
6 ROA (Return on Assets) = Net income / Total Assets (Average between the end of current fiscal year and the end of previous fiscal year) x 100
10-Year Financial Data
52 Hitachi, Ltd. Integrated Report 2017
U.S. GAAP Millions of yen
For the year: FY 2007 FY 2008 FY 2009 FY 2010 FY 2011 FY 2012 FY 2013 FY 2014
Total Hitachi, Ltd. stockholders' equity ratio 20.6 11.2 14.3 15.7 18.8 21.2 24.1 23.6
Notes: 1 In order to be consistent with financial reporting principles and practices generally accepted in Japan, operating income is presented as total revenues less cost of sales and selling, general and administrative expenses. The Company believes that this is useful to investors in comparing the Company's financial results with those of other Japanese companies. Under accounting principles generally accepted in the United States of America, restructuring charges, net gain or loss on sales and disposal of rental assets and other property and impairment losses for long-lived assets are included as part of operating income.
2 The restructuring charges mainly represent special termination benefits incurred with the reorganization of our business structures and as the result of the Company and its subsidiaries reviewing and reshaping the business portfolio.
3 EBIT is presented as income before income taxes less interest income plus interest charges. 4 The Company has changed the number of employees to exclude temporary employees starting from the year ended March 31, 2010. The figures for the prior
years have been restated to reflect the current year's presentation. 5 Effective from fiscal 2014, a part of the thermal power generation systems business is classified as a discontinued operation in accordance with the provision
of ASC 205-20, 〞Presentation of Financial Statements - Discontinued Operations,〞 which was not transferred to MITSUBISHI HITACHI POWER SYSTEMS, LTD. for the business integration in the thermal power generation systems with Mitsubishi Heavy Industries, Ltd. The results of the discontinued operation are reported separately from continuing operations. In line with this classification, 〞Revenues〞 and 〞Operating income〞 for fiscal 2013 are reclassified.
6 ROA (Return on Assets) = Net income / Total Assets (Average between the end of current fiscal year and the end of previous fiscal year) x 100
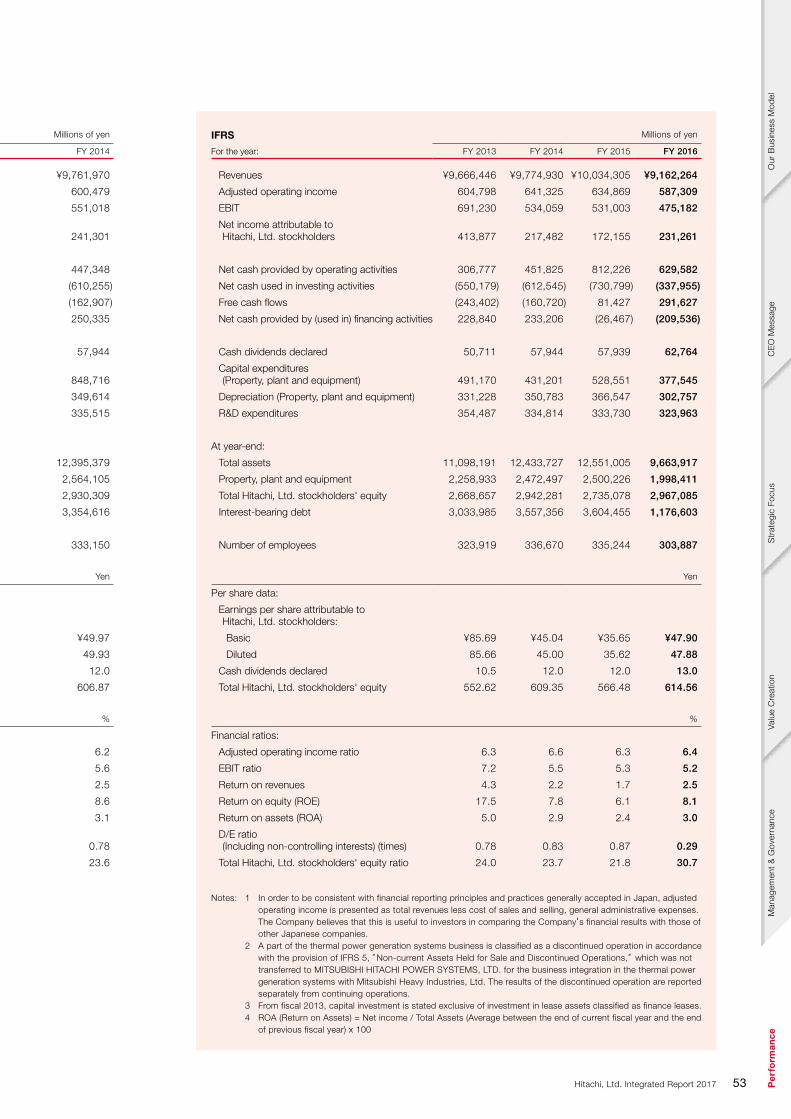
Number of employees 323,919 336,670 335,244 303,887
Yen
Per share data:
Earnings per share attributable to Hitachi, Ltd. stockholders:
Basic ¥85.69 ¥45.04 ¥35.65 ¥47.90
Diluted 85.66 45.00 35.62 47.88
Cash dividends declared 10.5 12.0 12.0 13.0
Total Hitachi, Ltd. stockholders' equity 552.62 609.35 566.48 614.56
%
Financial ratios:
Adjusted operating income ratio 6.3 6.6 6.3 6.4
EBIT ratio 7.2 5.5 5.3 5.2
Return on revenues 4.3 2.2 1.7 2.5
Return on equity (ROE) 17.5 7.8 6.1 8.1
Return on assets (ROA) 5.0 2.9 2.4 3.0
D/E ratio (Including non-controlling interests) (times) 0.78 0.83 0.87 0.29
Total Hitachi, Ltd. stockholders' equity ratio 24.0 23.7 21.8 30.7
Notes: 1 In order to be consistent with financial reporting principles and practices generally accepted in Japan, adjusted operating income is presented as total revenues less cost of sales and selling, general administrative expenses. The Company believes that this is useful to investors in comparing the Company's financial results with those of other Japanese companies.
2 A part of the thermal power generation systems business is classified as a discontinued operation in accordance with the provision of IFRS 5, 〞Non-current Assets Held for Sale and Discontinued Operations,〞 which was not transferred to MITSUBISHI HITACHI POWER SYSTEMS, LTD. for the business integration in the thermal power generation systems with Mitsubishi Heavy Industries, Ltd. The results of the discontinued operation are reported separately from continuing operations.
3 From fiscal 2013, capital investment is stated exclusive of investment in lease assets classified as finance leases. 4 ROA (Return on Assets) = Net income / Total Assets (Average between the end of current fiscal year and the end
of previous fiscal year) x 100
Hitachi, Ltd. Integrated Report 2017 53
Man
agem
ent
& G
over
nanc
eO
ur B
usin
ess
Mod
elS
trat
egic
Foc
us
Per
form
ance
CE
O M
essa
geVa
lue
Cre
atio
n
Operating Results
Effective from April 1, 2016, the Company changed the
name of the “Others (Logistics and Other services)” segment to the “Others” segment.
Summary
Billions of yen
Years ended March 31: 2016 2017Percent change
Revenues ¥10,034.3 ¥9,162.2 –9%
EBIT 531.0 475.1 –11%
Income from continuing operations, before income taxes 517.0 469.0 –9%
Net income attributable to Hitachi, Ltd. stockholders 172.1 231.2 34%
Analysis of Statement of OperationsRevenues decreased 9% to ¥9,162.2 billion, as compared
with the year ended March 31, 2016. This was due mainly
to lower revenues in the Information & Telecommunication
Systems, High Functional Materials & Components, Smart
Life & Ecofriendly Systems, Others and Financial Services
segments. This decrease was partially offset by higher
revenues in the Electronic Systems & Equipment segment.
Cost of sales decreased 9% to ¥6,782.6 billion, as
compared with the year ended March 31, 2016, and the
ratio of cost of sales to revenues was 74%, which was the
same level as the year ended March 31, 2016. Gross profit
decreased 8% to ¥2,379.5 billion, as compared with the
year ended March 31, 2016.
Selling, general and administrative expenses decreased
¥148.0 billion to ¥1,792.2 billion, as compared with the year
ended March 31, 2016, and the ratio of selling, general and
administrative expenses to revenues was 20%, as
compared with 19% for the year ended March 31, 2016.
Other income increased ¥43.2 billion to ¥100.7 billion and
other expenses increased ¥4.6 billion to ¥146.5 billion, as
compared with the year ended March 31, 2016. The details
are as follows.
Net gain on sales and disposal of fixed assets improved
by ¥19.5 billion, as compared with the year ended March
31, 2016, to a gain of ¥15.0 billion.
Impairment losses increased ¥23.8 billion to ¥68.5 billion,
as compared with the year ended March 31, 2016. This
mainly reflected impairment losses on software for sale and
other intangible assets in the Information &
Telecommunication Systems segment.
Net gain on business reorganization and others increased
¥26.1 billion to ¥81.3 billion, as compared with the year
ended March 31, 2016, reflecting the partial sale of the
shares of Hitachi Transport System, Ltd. in the Others
segment and the sale of Hitachi Koki Co., Ltd. shares in the
Electronic Systems & Equipment segment.
Special termination benefits decreased ¥20.8 billion to
¥24.6 billion, as compared with the year ended March
31, 2016.
Expenses related to competition law and others
decreased ¥15.5 billion to ¥6.7 billion, as compared with the
year ended March 31, 2016.
Financial income (excluding interest income)
decreased ¥3.5 billion to ¥7.0 billion and financial
billion to ¥26.2 billion, as compared with the year ended
March 31, 2016.
Share of loss of investments accounted for using the
equity method was ¥47.1 billion, a deterioration of ¥47.3
billion as compared with the year ended March 31, 2016,
mainly reflecting the posting of an impairment loss in
connection with the uranium enrichment business at an U.S.
equity-method associate in the Social Infrastructure &
Industrial Systems segment.
EBIT decreased ¥55.8 billion to ¥475.1 billion, as
compared with the year ended March 31, 2016.
Operating and Financial Review
54 Hitachi, Ltd. Integrated Report 2017
Interest income increased ¥0.8 billion to ¥12.9 billion
and interest charges decreased ¥6.9 billion to ¥19.0
billion, as compared with the year ended March 31,
2016.
Income from continuing operations, before income taxes
decreased ¥47.9 billion to ¥469.0 billion, as compared with
the year ended March 31, 2016.
Income taxes decreased ¥40.0 billion to ¥125.1 billion,
as compared with the year ended March 31, 2016, due
mainly to recording tax expenses in the year ended
March 31, 2016 in connection with the partial transfer of
shares of Hitachi Transport System, Ltd. and Hitachi
Capital Corporation.
Loss from discontinued operations decreased ¥51.1
billion to ¥5.9 billion, as compared with the year ended
March 31, 2016.
Net income increased ¥43.2 billion to ¥338.0 billion, as
compared with the year ended March 31, 2016.
Net income attributable to non-controlling interests
decreased ¥15.8 billion to ¥106.7 billion, as compared with
the year ended March 31, 2016.
As a result of the foregoing, net income attributable to
Hitachi, Ltd. stockholders increased ¥59.1 billion to ¥231.2
billion, as compared with the year ended March 31, 2016.
Operations by SegmentThe following is an overview of results of operations by
segment. Revenues for each segment include intersegment
transactions. Segment profit is measured by EBIT.
(Information & Telecommunication Systems)
Revenues decreased 6% to ¥1,982.8 billion, as compared
with the year ended March 31, 2016, due mainly to the
negative impact of foreign currency translation causing
lower sales from overseas subsidiaries and to lower sales
from ATMs for overseas markets.
Segment profit decreased ¥32.6 billion to ¥76.4 billion, as
compared with the year ended March 31, 2016, due mainly
to the posting of business structural reform expenses,
despite the effect of business structural reform centered on
the telecommunications & network business, improvement
in profitability of the social infrastructure-related information
systems, among other positives.
(Social Infrastructure & Industrial Systems)
Revenues were ¥2,331.9 billion, which was the same level
as the year ended March 31, 2016. This mainly reflected
decreases in revenues in the elevators and escalators
business due to the negative impact of foreign currency
translation, and in the power and energy business because
of the absence of a large project posted for the year ended
March 31, 2016, despite substantial revenue growth in the
railway systems business due to the acquisition of the
businesses of AnsaldoBreda S.p.A. (excluding a part of its
operations), the acquisition of Ansaldo STS S.p.A. (both of
which are in Italy), and an increase in revenues for the U.K.
Segment loss was ¥19.9 billion, a deterioration of ¥49.1
billion from the year ended March 31, 2016, due mainly to
the posting of an impairment loss regarding the uranium
enrichment business of an equity-method associate in the
U.S. and lower earnings in the elevators and escalators
business because of the negative impact of foreign
currency translation.
Hitachi, Ltd. Integrated Report 2017 55
Man
agem
ent
& G
over
nanc
eO
ur B
usin
ess
Mod
elS
trat
egic
Foc
us
Per
form
ance
CE
O M
essa
geVa
lue
Cre
atio
n
(Electronic Systems & Equipment)
Revenues increased 4% to ¥1,170.3 billion, as compared
with the year ended March 31, 2016, due mainly to
increased revenues at Hitachi Koki Co., Ltd. because of the
acquisition of Germany-based metabo Aktiengesellschaft,
despite a decrease in revenues at Hitachi Kokusai Electric
Inc. mainly owing to lower sales of telecommunication
equipment and video surveillance systems in Japan.
Segment profit increased ¥2.4 billion to ¥66.7 billion, as
compared with the year ended March 31, 2016, due
mainly to higher earnings at Hitachi High-Technologies
Corporation due to firm sales of semiconductor production
equipment and higher earnings at Hitachi Koki Co., Ltd.
because of the increased revenues, despite a decrease in
earnings at Hitachi Kokusai Electric Inc. mainly because of
a decline in revenues and the posting of business
structural reform expenses.
(Construction Machinery)
Revenues decreased 1% to ¥753.9 billion, as compared
with the year ended March 31, 2016, due mainly to the
negative impact of foreign currency translation caused by
appreciation of the yen, despite the recovery of demand for
hydraulic excavators in China and India.
Segment profit decreased ¥3.1 billion to ¥22.7 billion, as
compared with the year ended March 31, 2016, due mainly
to the absence of a gain on business reorganization and
others related to the sale of shares of UniCarriers Holdings
Corporation recorded for the year ended March 31, 2016,
despite the effect of business structural reforms, decreases
in business structural reform expenses and an improvement
in exchange gain or loss.
(High Functional Materials & Components)
Revenues decreased 6% to ¥1,464.6 billion, as compared
with the year ended March 31, 2016, due mainly to a fall in
revenues at Hitachi Metals, Ltd. due to the negative impact
of foreign currency translation causing a fall in sales from
overseas subsidiaries and a decline in demand associated
with the slower economies in China and emerging countries
in Asia.
Segment profit decreased ¥30.2 billion to ¥123.3 billion,
as compared with the year ended March 31, 2016, due
mainly to the decrease in revenues and the absence of
gains on business reorganization and others related to the
sales of equity interest in Hitachi Tool Engineering, Ltd. by
Hitachi Metals, Ltd. in the year ended March 31, 2016.
(Automotive Systems)
Revenues decreased 1% to ¥992.2 billion, as compared
with the year ended March 31, 2016, due mainly to negative
impact of foreign currency translation, despite sales growth
particularly in North America and China, where demand for
automobiles was firm.
Segment profit increased ¥11.8 billion to ¥65.8 billion, as
compared with the year ended March 31, 2016, due mainly
to posting of gain on sales and disposals of fixed assets
despite the decline in revenues.
(Smart Life & Ecofriendly Systems)
Revenues decreased 18% to ¥557.3 billion, as compared
with the year ended March 31, 2016, due mainly to the
effect of reorganization of the air-conditioning systems
business with an equity-method associate that is a joint
venture with Johnson Controls Inc.
Segment profit decreased ¥10.1 billion to ¥31.8 billion, as
compared with the year ended March 31, 2016, due mainly
to the effect of a decline in revenues from the reorganization
of the air-conditioning systems business and the absence of
a gain on business reorganization and others in association
with the reorganization of the air-conditioning systems
business recorded in the year ended March 31, 2016.
(Others)
Revenues decreased 48% to ¥653.7 billion, and segment
profit decreased ¥19.9 billion to ¥20.6 billion, as compared
with the year ended March 31, 2016, respectively. This was
due mainly to the conversion of Hitachi Transport System,
Ltd. to an equity-method associate.
(Financial Services)
As Hitachi Capital Corporation was converted to an
equity-method associate as of October 2016, there is no
company which belongs to the Financial Services
segment. Accordingly, only the results for the period in
which said company was a consolidated subsidiary are
recorded. As a result, revenues decreased 51% to
¥179.2 billion, and segment profit decreased ¥23.8
billion to ¥22.8 billion, as compared with the year ended
March 31, 2016, respectively.
56 Hitachi, Ltd. Integrated Report 2017
Revenues by Geographic AreaThe following is an overview of revenues attributed to
geographic areas based on customer location.
Billions of yen
Years ended March 31: 2016 2017Percent change
Japan ¥ 5,231.5 ¥4,757.6 –9%
Overseas Revenues Subtotal 4,802.7 4,404.5 –8%
Asia 2,112.3 1,860.7 –12%
North America 1,280.3 1,144.0 –11%
Europe 951.1 972.6 2%
Other Areas 459.0 427.1 –7%
Total Revenues ¥10,034.3 ¥9,162.2 –9%
Japan
Revenues in Japan decreased 9% to ¥4,757.6 billion, as
compared with the year ended March 31, 2016. This was
due to lower revenues across all segments, particularly in
the Others segment, reflecting the conversion of Hitachi
Transport System, Ltd. to an equity-method associate and
in the Financial Services segment in which Hitachi Capital
Corporation was converted to an equity-method associate.
Overseas
Overseas revenues decreased 8% to ¥4,404.5 billion, as
compared with the year ended March 31, 2016, and the
ratio to total revenues was 48%, which was the same level
as the year ended March 31, 2016.
(Asia)
Revenues in Asia decreased 12% to ¥1,860.7 billion, as
compared with the year ended March 31, 2016. This was
due mainly to lower revenues in the Social Infrastructure &
Industrial Systems segment, reflecting reduced revenues in
the elevators and escalators business, particularly in China,
the Others segment in which Hitachi Transport System, Ltd.
was converted to an equity-method associate, and the
Smart Life & Ecofriendly Systems segment due to the
reorganization of the air-conditioning systems business,
despite higher revenues in the Electronic Systems &
Equipment and the Construction Machinery segments.
(North America)
Revenues in North America decreased 11% to ¥1,144.0
billion, as compared with the year ended March 31,
2016. This was due mainly to lower revenues in the
Information & Telecommunication Systems, High
Functional Materials & Components and Others
segments, despite higher revenues in the Social
Infrastructure & Industrial Systems segment.
(Europe)
Revenues in Europe increased 2% to ¥972.6 billion, as
compared with the year ended March 31, 2016. This was
due mainly to higher revenues in the Social Infrastructure &
Industrial Systems segment, reflecting substantial growth in
the railway systems business, and the Electronic Systems &
Equipment segment, in which Hitachi Koki Co., Ltd.
recorded increased revenues due to the acquisition of
metabo Aktiengesellschaft, despite lower revenues in the
Others and the Financial Services segments, etc.
(Other Areas)
Revenues in other areas decreased 7% to ¥427.1 billion, as
compared with the year ended March 31, 2016. This was
due mainly to lower revenues in the Smart Life & Ecofriendly
Systems and the Others segments, despite higher revenues
in the Social Infrastructure & Industrial Systems segment,
reflecting increased revenues in the railway systems
business, and the Electronic Systems & Equipment
segment, reflecting increased revenues by Hitachi High-
Technologies Corporation.
Hitachi, Ltd. Integrated Report 2017 57
Man
agem
ent
& G
over
nanc
eO
ur B
usin
ess
Mod
elS
trat
egic
Foc
us
Per
form
ance
CE
O M
essa
geVa
lue
Cre
atio
n
Summary of Financial Condition, etc.
Liquidity and Capital ResourcesOur management considers maintaining an appropriate level
of liquidity and securing adequate funds for current and
future business operations to be important financial
objectives. Through efficient management of working capital
and selective investment in new plants and equipment, we
are working to optimize the efficiency of capital utilization
throughout our business operations. We endeavor to
improve our group cash management by centralizing such
management among us and our overseas financial
subsidiaries. Our internal sources of funds include cash
flows generated by operating activities and cash on hand.
Our management also considers short-term investments to
be an immediately available source of funds. In addition, we
raise funds both in the capital markets and from Japanese
and international commercial banks in response to our
capital requirements. Our management’s policy is to finance
capital expenditures primarily by internally generated funds
and to a lesser extent by funds raised through the issuance
of debt and equity securities in domestic and foreign capital
markets. In order to flexibly access funding, we maintain our
shelf registration with the maximum outstanding balance of
¥300.0 billion.
We maintain commitment line agreements with a number
of domestic banks under which we may borrow in order to
ensure efficient access to necessary funds. These
commitment line agreements generally provide for a one-
year term, renewable upon mutual agreement between us
and each of the lending banks, as well as another
commitment line agreement with a contract term of three
years ending on July 29, 2019. As of March 31, 2017, our
unused commitment lines totaled ¥599.0 billion, including
these of ¥400.0 billion which the Company maintained.
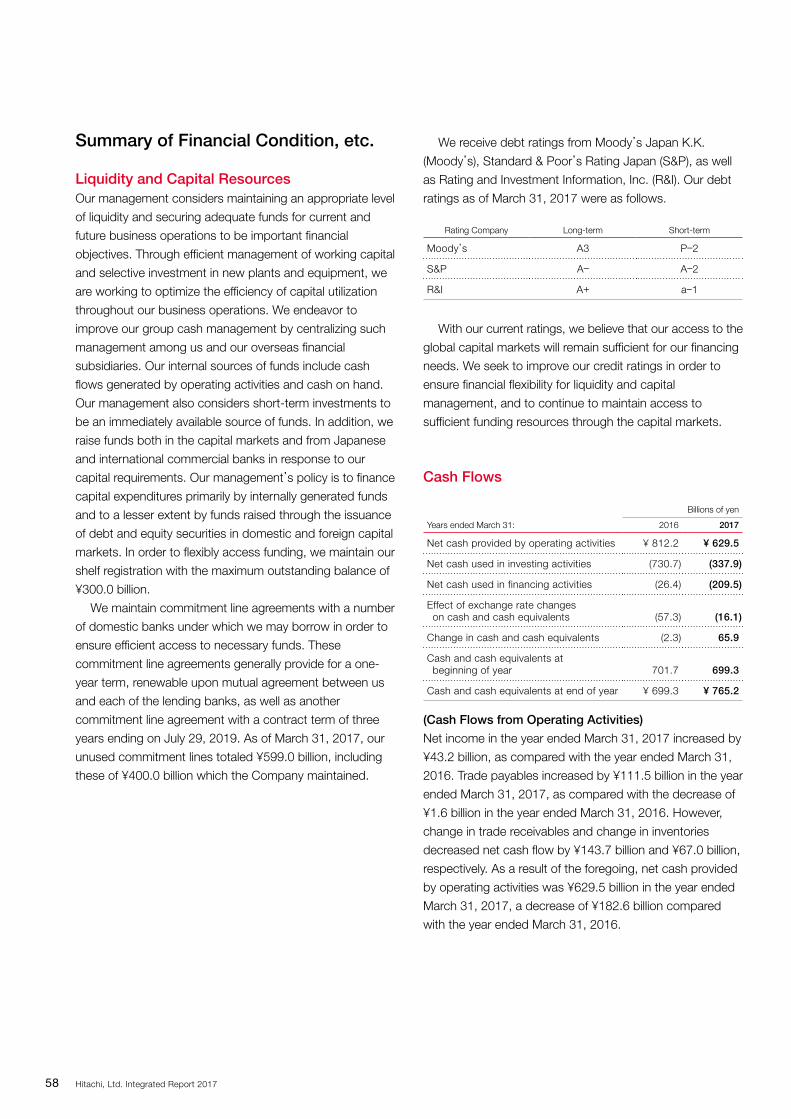
We receive debt ratings from Moody’s Japan K.K.
(Moody’s), Standard & Poor’s Rating Japan (S&P), as well
as Rating and Investment Information, Inc. (R&I). Our debt
ratings as of March 31, 2017 were as follows.
Rating Company Long-term Short-term
Moody’s A3 P–2
S&P A– A–2
R&I A+ a–1
With our current ratings, we believe that our access to the
global capital markets will remain sufficient for our financing
needs. We seek to improve our credit ratings in order to
ensure financial flexibility for liquidity and capital
management, and to continue to maintain access to
sufficient funding resources through the capital markets.
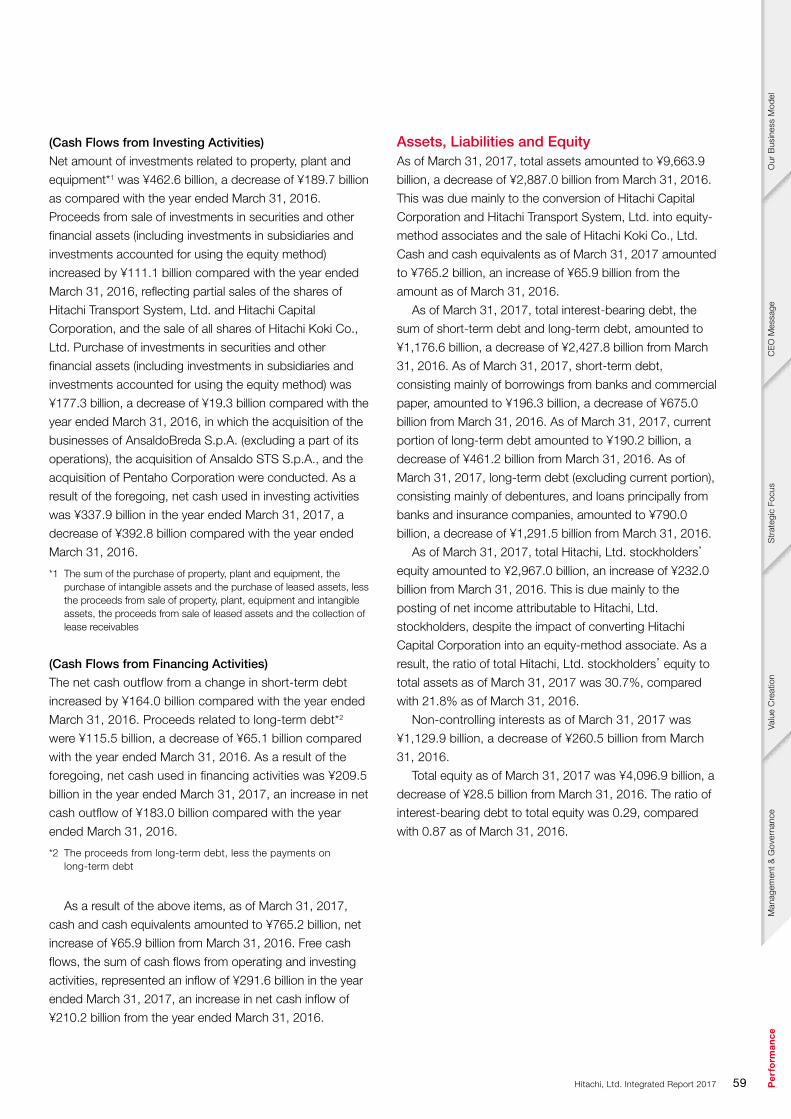
Cash Flows
Billions of yen
Years ended March 31: 2016 2017
Net cash provided by operating activities ¥ 812.2 ¥ 629.5
Net cash used in investing activities (730.7) (337.9)
Net cash used in financing activities (26.4) (209.5)
Effect of exchange rate changes on cash and cash equivalents (57.3) (16.1)
Change in cash and cash equivalents (2.3) 65.9
Cash and cash equivalents at beginning of year 701.7 699.3
Cash and cash equivalents at end of year ¥ 699.3 ¥ 765.2
(Cash Flows from Operating Activities)
Net income in the year ended March 31, 2017 increased by
¥43.2 billion, as compared with the year ended March 31,
2016. Trade payables increased by ¥111.5 billion in the year
ended March 31, 2017, as compared with the decrease of
¥1.6 billion in the year ended March 31, 2016. However,
change in trade receivables and change in inventories
decreased net cash flow by ¥143.7 billion and ¥67.0 billion,
respectively. As a result of the foregoing, net cash provided
by operating activities was ¥629.5 billion in the year ended
March 31, 2017, a decrease of ¥182.6 billion compared
with the year ended March 31, 2016.
58 Hitachi, Ltd. Integrated Report 2017
(Cash Flows from Investing Activities)
Net amount of investments related to property, plant and
equipment*1 was ¥462.6 billion, a decrease of ¥189.7 billion
as compared with the year ended March 31, 2016.
Proceeds from sale of investments in securities and other
financial assets (including investments in subsidiaries and
investments accounted for using the equity method)
increased by ¥111.1 billion compared with the year ended
March 31, 2016, reflecting partial sales of the shares of
Hitachi Transport System, Ltd. and Hitachi Capital
Corporation, and the sale of all shares of Hitachi Koki Co.,
Ltd. Purchase of investments in securities and other
financial assets (including investments in subsidiaries and
investments accounted for using the equity method) was
¥177.3 billion, a decrease of ¥19.3 billion compared with the
year ended March 31, 2016, in which the acquisition of the
businesses of AnsaldoBreda S.p.A. (excluding a part of its
operations), the acquisition of Ansaldo STS S.p.A., and the
acquisition of Pentaho Corporation were conducted. As a
result of the foregoing, net cash used in investing activities
was ¥337.9 billion in the year ended March 31, 2017, a
decrease of ¥392.8 billion compared with the year ended
March 31, 2016.
*1 The sum of the purchase of property, plant and equipment, the purchase of intangible assets and the purchase of leased assets, less the proceeds from sale of property, plant, equipment and intangible assets, the proceeds from sale of leased assets and the collection of lease receivables
(Cash Flows from Financing Activities)
The net cash outflow from a change in short-term debt
increased by ¥164.0 billion compared with the year ended
March 31, 2016. Proceeds related to long-term debt*2
were ¥115.5 billion, a decrease of ¥65.1 billion compared
with the year ended March 31, 2016. As a result of the
foregoing, net cash used in financing activities was ¥209.5
billion in the year ended March 31, 2017, an increase in net
cash outflow of ¥183.0 billion compared with the year
ended March 31, 2016.
*2 The proceeds from long-term debt, less the payments on long-term debt
As a result of the above items, as of March 31, 2017,
cash and cash equivalents amounted to ¥765.2 billion, net
increase of ¥65.9 billion from March 31, 2016. Free cash
flows, the sum of cash flows from operating and investing
activities, represented an inflow of ¥291.6 billion in the year
ended March 31, 2017, an increase in net cash inflow of
¥210.2 billion from the year ended March 31, 2016.
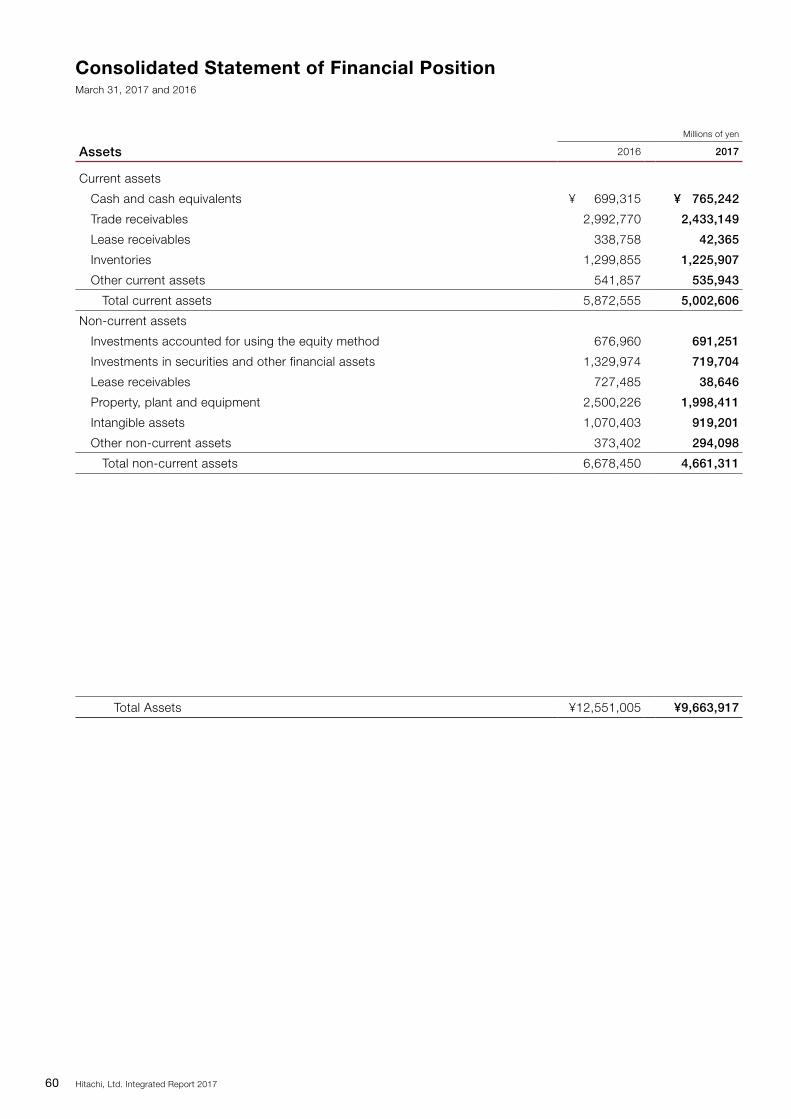
Assets, Liabilities and EquityAs of March 31, 2017, total assets amounted to ¥9,663.9
billion, a decrease of ¥2,887.0 billion from March 31, 2016.
This was due mainly to the conversion of Hitachi Capital
Corporation and Hitachi Transport System, Ltd. into equity-
method associates and the sale of Hitachi Koki Co., Ltd.
Cash and cash equivalents as of March 31, 2017 amounted
to ¥765.2 billion, an increase of ¥65.9 billion from the
amount as of March 31, 2016.
As of March 31, 2017, total interest-bearing debt, the
sum of short-term debt and long-term debt, amounted to
¥1,176.6 billion, a decrease of ¥2,427.8 billion from March
31, 2016. As of March 31, 2017, short-term debt,
consisting mainly of borrowings from banks and commercial
paper, amounted to ¥196.3 billion, a decrease of ¥675.0
billion from March 31, 2016. As of March 31, 2017, current
portion of long-term debt amounted to ¥190.2 billion, a
decrease of ¥461.2 billion from March 31, 2016. As of
March 31, 2017, long-term debt (excluding current portion),
consisting mainly of debentures, and loans principally from
banks and insurance companies, amounted to ¥790.0
billion, a decrease of ¥1,291.5 billion from March 31, 2016.
As of March 31, 2017, total Hitachi, Ltd. stockholders’ equity amounted to ¥2,967.0 billion, an increase of ¥232.0
billion from March 31, 2016. This is due mainly to the
posting of net income attributable to Hitachi, Ltd.
stockholders, despite the impact of converting Hitachi
Capital Corporation into an equity-method associate. As a
result, the ratio of total Hitachi, Ltd. stockholders’ equity to
total assets as of March 31, 2017 was 30.7%, compared
with 21.8% as of March 31, 2016.
Non-controlling interests as of March 31, 2017 was
¥1,129.9 billion, a decrease of ¥260.5 billion from March
31, 2016.
Total equity as of March 31, 2017 was ¥4,096.9 billion, a
decrease of ¥28.5 billion from March 31, 2016. The ratio of
interest-bearing debt to total equity was 0.29, compared
with 0.87 as of March 31, 2016.
Hitachi, Ltd. Integrated Report 2017 59
Man
agem
ent
& G
over
nanc
eO
ur B
usin
ess
Mod
elS
trat
egic
Foc
us
Per
form
ance
CE
O M
essa
geVa
lue
Cre
atio
n
Millions of yen
Assets 2016 2017
Current assets
Cash and cash equivalents ¥ 699,315 ¥ 765,242
Trade receivables 2,992,770 2,433,149
Lease receivables 338,758 42,365
Inventories 1,299,855 1,225,907
Other current assets 541,857 535,943
Total current assets 5,872,555 5,002,606
Non-current assets
Investments accounted for using the equity method 676,960 691,251
Investments in securities and other financial assets 1,329,974 719,704
Lease receivables 727,485 38,646
Property, plant and equipment 2,500,226 1,998,411
Intangible assets 1,070,403 919,201
Other non-current assets 373,402 294,098
Total non-current assets 6,678,450 4,661,311
Total Assets ¥12,551,005 ¥9,663,917
Consolidated Statement of Financial PositionMarch 31, 2017 and 2016
60 Hitachi, Ltd. Integrated Report 2017
Millions of yen
Liabilities 2016 2017
Current liabilities
Short-term debt ¥ 871,417 ¥ 196,357
Current portion of long-term debt 651,518 190,233
Other financial liabilities 280,048 274,270
Trade payables 1,451,918 1,402,233
Other current liabilities 1,739,315 1,657,766
Total current liabilities 4,994,216 3,720,859
Non-current liabilities
Long-term debt 2,081,520 790,013
Other financial liabilities 115,155 53,422
Retirement and severance benefits 783,670 635,684
Other non-current liabilities 450,874 366,944
Total non-current liabilities 3,431,219 1,846,063
Total Liabilities 8,425,435 5,566,922
Equity
Hitachi, Ltd. stockholders' equity
Common stock 458,790 458,790
Capital surplus 586,790 577,573
Retained earnings 1,609,761 1,793,570
Accumulated other comprehensive income 83,543 141,068
Treasury stock, at cost (3,806) (3,916)
Total Hitachi, Ltd. stockholders' equity 2,735,078 2,967,085
Non-controlling interests 1,390,492 1,129,910
Total Equity 4,125,570 4,096,995
Total Liabilities and Equity ¥12,551,005 ¥9,663,917
Hitachi, Ltd. Integrated Report 2017 61
Man
agem
ent
& G
over
nanc
eO
ur B
usin
ess
Mod
elS
trat
egic
Foc
us
Per
form
ance
CE
O M
essa
geVa
lue
Cre
atio
n
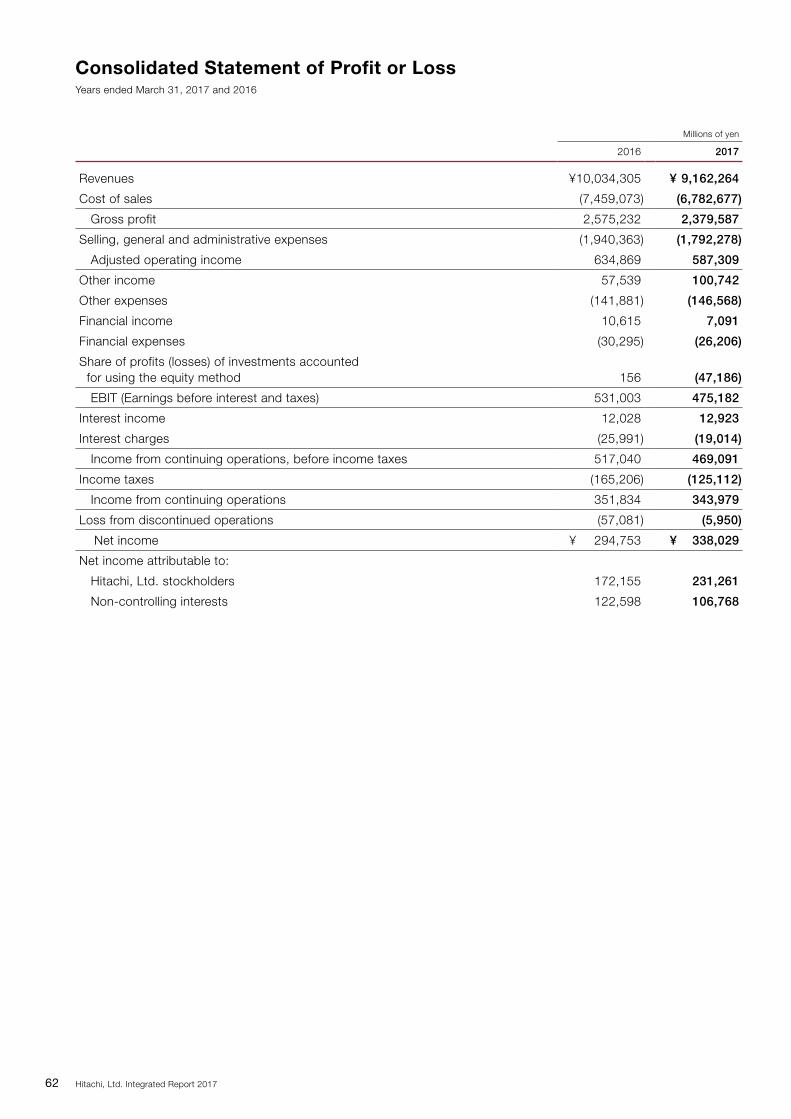
Millions of yen
2016 2017
Revenues ¥10,034,305 ¥ 9,162,264
Cost of sales (7,459,073) (6,782,677)
Gross profit 2,575,232 2,379,587
Selling, general and administrative expenses (1,940,363) (1,792,278)
Adjusted operating income 634,869 587,309
Other income 57,539 100,742
Other expenses (141,881) (146,568)
Financial income 10,615 7,091
Financial expenses (30,295) (26,206)
Share of profits (losses) of investments accounted for using the equity method 156 (47,186)
EBIT (Earnings before interest and taxes) 531,003 475,182
Interest income 12,028 12,923
Interest charges (25,991) (19,014)
Income from continuing operations, before income taxes 517,040 469,091
Income taxes (165,206) (125,112)
Income from continuing operations 351,834 343,979
Loss from discontinued operations (57,081) (5,950)
Net income ¥ 294,753 ¥ 338,029
Net income attributable to:
Hitachi, Ltd. stockholders 172,155 231,261
Non-controlling interests 122,598 106,768
Consolidated Statement of Profit or LossYears ended March 31, 2017 and 2016
62 Hitachi, Ltd. Integrated Report 2017
Millions of yen
2016 2017
Net income ¥ 294,753 ¥338,029
Other comprehensive income (OCI)
Items not to be reclassified into net income
Net changes in financial assets measured at fair value through OCI (50,323) 59,934
Remeasurements of defined benefit plans (140,844) 46,086
Share of OCI of investments accounted for using the equity method (4,275) (1,887)
Total items not to be reclassified into net income (195,442) 104,133
Equity transactions and other ‒ (9,202) ‒ (125) ‒ (9,327) (322,772) (332,099)
Total changes in equity ‒ (9,217) 183,809 57,525 (110) 232,007 (260,582) (28,575)
As of March 31, 2017 ¥458,790 ¥577,573 ¥1,793,570 ¥141,068 ¥(3,916) ¥2,967,085 ¥1,129,910 ¥4,096,995
Consolidated Statement of Changes in EquityYears ended March 31, 2017 and 2016
64 Hitachi, Ltd. Integrated Report 2017
Millions of yen
2016 2017
Cash flows from operating activities
Net income ¥ 294,753 ¥ 338,029
Adjustments to reconcile net income to net cash provided by operating activities
Depreciation and amortization 507,790 415,183
Change in trade receivables (53,092) (196,824)
Change in inventories 44,342 (22,731)
Change in trade payables (1,602) 111,589
Other 20,035 (15,664)
Net cash provided by (used in) operating activities 812,226 629,582
Cash flows from investing activities
Purchase of property, plant and equipment (369,494) (316,116)
Purchase of intangible assets (116,438) (101,034)
Purchase of leased assets (539,420) (292,943)
Proceeds from sale of property, plant and equipment, and intangible assets 22,632 52,208
Proceeds from sale of leased assets 23,834 14,539
Collection of lease receivables 326,497 180,726
Proceeds from sale (purchase) of investments in securities and other financial assets (including investments in subsidiaries and investments accounted for using the equity method), net (58,756) 71,653
Other (19,654) 53,012
Net cash provided by (used in) investing activities (730,799) (337,955)
Free cash flows 81,427 291,627
Cash flows from financing activities
Change in interest-bearing debt 110,821 (118,314)
Dividends paid to stockholders (57,907) (57,935)
Dividends paid to non-controlling interests (41,671) (36,508)
Other (37,710) 3,221
Net cash provided by (used in) financing activities (26,467) (209,536)
Effect of exchange rate changes on cash and cash equivalents (57,348) (16,164)
Change in cash and cash equivalents (2,388) 65,927
Cash and cash equivalents at beginning of year 701,703 699,315
Cash and cash equivalents at end of year ¥ 699,315 ¥ 765,242
Consolidated Statement of Cash FlowsYears ended March 31, 2017 and 2016
Hitachi, Ltd. Integrated Report 2017 65
Man
agem
ent
& G
over
nanc
eO
ur B
usin
ess
Mod
elS
trat
egic
Foc
us
Per
form
ance
CE
O M
essa
geVa
lue
Cre
atio
n
Billions of yen
2016 2017
Manufacturing, Services
and OthersFinancial Services Total
Manufacturing, Services
and OthersFinancial Services Total
Assets
Current assets ¥4,995.6 ¥1,256.8 ¥ 5,872.5 ¥5,002.6 ‒ ¥5,002.6
Cash and cash equivalents 660.9 157.0 699.3 765.2 ‒ 765.2
Summarized Consolidated Statement of Financial Position by Manufacturing, Services and Others and Financial ServicesYears ended March 31, 2017 and 2016
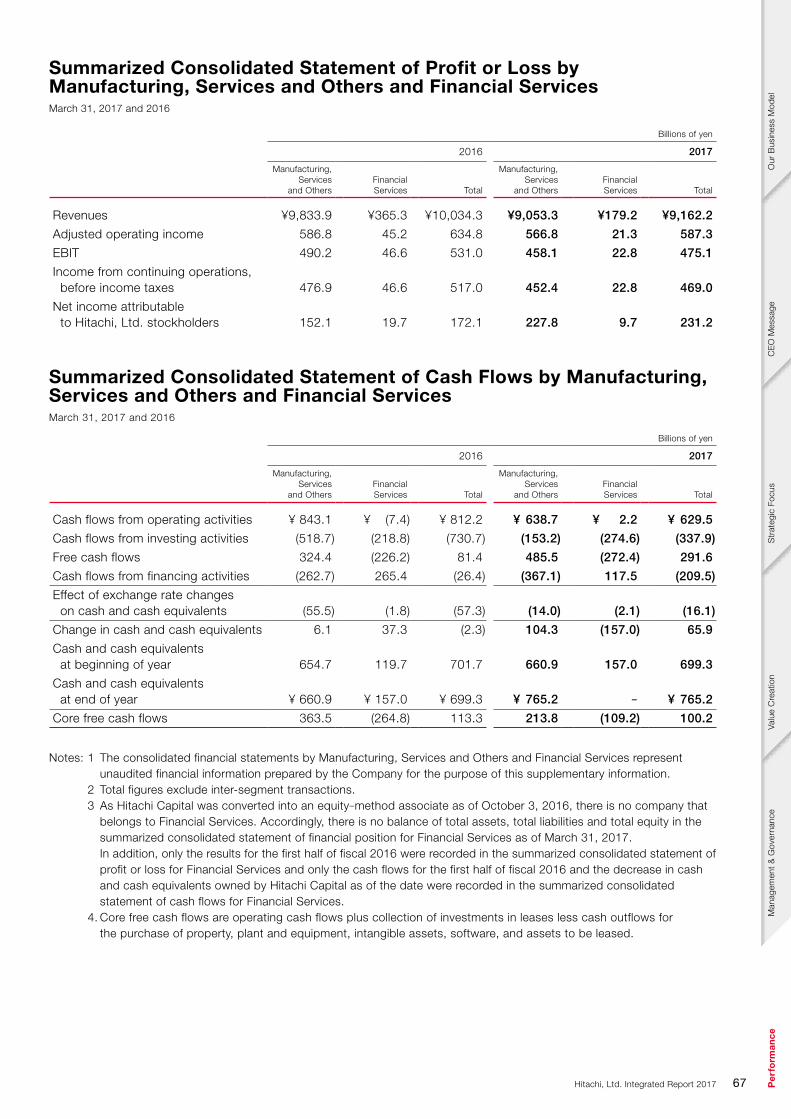
Notes: 1 The consolidated financial statements by Manufacturing, Services and Others and Financial Services represent unaudited financial information prepared by the Company for the purpose of this supplementary information.
2 Total figures exclude inter-segment transactions. 3 As Hitachi Capital was converted into an equity‒method associate as of October 3, 2016, there is no company that
belongs to Financial Services. Accordingly, there is no balance of total assets, total liabilities and total equity in the summarized consolidated statement of financial position for Financial Services as of March 31, 2017.
In addition, only the results for the first half of fiscal 2016 were recorded in the summarized consolidated statement of profit or loss for Financial Services and only the cash flows for the first half of fiscal 2016 and the decrease in cash and cash equivalents owned by Hitachi Capital as of the date were recorded in the summarized consolidated statement of cash flows for Financial Services.
4. Core free cash flows are operating cash flows plus collection of investments in leases less cash outflows for the purchase of property, plant and equipment, intangible assets, software, and assets to be leased.
Summarized Consolidated Statement of Profit or Loss by Manufacturing, Services and Others and Financial ServicesMarch 31, 2017 and 2016