58


HITTING THE M.A.R.C.
Establishing Foster Care Minimum Adequate Rates for Children
Technical Report
October 2007


Acknowledgments
This project to establish Foster Care Minimum Adequate Rates for Children (the “Foster Care MARC”) was developed and implemented by Children’s Rights in collaboration with the Ruth H. Young Center (RYC) for Families and Children at the University of Maryland School of Social Work and the National Foster Parent Association (NFPA). The project partners are grateful for the generous support provided by the Annie E. Casey Foundation, the Ira W. DeCamp Foundation and the Joseph Leroy and Ann C. Warner Fund. This project would not have been possible without the support of these three foundations and we applaud their commitment to children in foster care and their families. As we thank them for their support, we also acknowledge that the findings and conclusions presented in this report are those of the project partners alone and do not necessarily reflect the opinions of these foundations.
The project is directed by Julie Farber, M.S.W., director of policy at Children’s Rights, in collaboration with Diane DePanfilis, Ph.D., M.S.W., director of the RYC, and Karen Jorgenson, M.A., executive director of the NFPA.
The primary authors of this report are Diane DePanfilis, Ph.D., M.S.W., and Clara Daining, Ph.D., M.S.W., of the RYC; Kevin D. Frick, Ph.D., M.A., of the Johns Hopkins Bloomberg School of Public Heath, Department of Health Policy and Management; and Julie Farber, M.S.W., and Lisa Levinthal, J.D., M.P.A., of Children’s Rights.
The project partners wish to acknowledge the significant contributions to the project made by:
Associates of the RYC, including Howard Dubowitz, M.D., M.S. (University of Maryland School of Medicine, Department of Pediatrics); Jim Kunz, Ph.D., M.A., M.S.W.; and Priscilla Ryder, Ph.D., M.P.H.
Former NFPA Project Manager Dianne Kocer, M.A.
The National Association of Public Child Welfare Administrators (NAPCWA), specifically Director Anita Light and Senior Research Analyst Pat Shapiro
Former Children’s Rights’ Director of Policy Madelyn Freundlich, LL.M., J.D., M.S.W. and former Policy Analyst Emily Joyce Oakes, M.S.W.
The project benefited significantly from the advice and counsel of an advisory group that included public child welfare agency representatives, foster parents, researchers, a pediatrician, advocates and others. We thank these advisory group members for their time and guidance throughout the
v

Hitting the MARC: Establishing Foster Care Minimum Adequate Rates for Children
course of the project. It should be noted that this report presents the views of the project partners only and does not necessarily reflect the views of individual advisory group members or their organizations. Advisors included the following:
Richard P. Barth, University of Maryland School of Social Work. We give special thanks to Dr. Barth, who served as a member of the advisory board when he was at the University of North Carolina, Chapel Hill. During the course of the project, Dr. Barth became Dean of the University of Maryland School of Social Work and, thus, the project benefited significantly from his general guidance.
Mary Ault California Department of Social Services
Roy Block Foster Parent, Texas
Marc Cherna Allegheny County Department of Human Services
Ken Deibert Idaho Department of Health & Welfare
Susan Dreyfus Alliance for Children and Families
Barbara Eaton California Department of Social Services
Ramona Foley Oregon Department of Human Services
Mel Gravely Foster Parent, Ohio
Kevin George Oregon Department of Human Services
Betty Hastings Foster Parent, Tennessee
Bette Hoxie Foster Parent, Maine
Mary Ann Judge Casey Family Services
Kary Ledbetter Foster Parent, Idaho
Cindy Lewis Monroe County Department of Social Services, New York State
Emily Jean McFadden Grand Valley State University, School of Social Work
Bonnie McNulty Foster Parent, Colorado
Chris Morrison Indiana Foster Care and Adoption Association
Sarah Morrison Center for the Study of Social Policy
Mary Nelson Iowa Department of Human Services
Nancy Rollins New Hampshire Department of Health & Human Services
vi

Acknowledgements
Matt Stagner Chapin Hall Center for Children (formerly of the Urban Institute)
Randall Ruth Foster Parent, Minnesota
John Sciamanna Child Welfare League of America Moira Szilagyi
Pediatrician American Academy of Pediatrics, Task Force on Foster Care Associate Professor of Pediatrics, University of Rochester Medical Director of Starlight Pediatrics
Linda Shill California Department of Social Services
Linda Smith Oklahoma Department of Human Services
Millicent Williams Child Welfare League of America
Finally, the project benefited from input provided by Judith Eveland of the Maryland Department of Human Resources, and Duane St. Clair, a Maryland foster parent and also a representative of the NFPA.
States and localities should move quickly to adopt the Foster Care MARC. Further, laws and policies should be established at the federal and state levels that ensure adequate foster care rates going forward. Abused and neglected children in government custody have the right to receive appropriate care while in foster care and, ultimately, to grow up in a permanent family. By establishing foster care rates that cover actual costs, children can receive necessary care and have happier and more normal childhoods, child welfare systems may be better able to maintain a stable pool of foster parents and children can have better chances of growing up in permanent families.
Julie Farber, M.S.W. Director of Policy, Children’s Rights Marcia Robinson Lowry, J.D. Executive Director, Children’s Rights
Karen Jorgenson, M.A. Executive Director, National Foster
Parent Association
Diane DePanfilis, Ph.D., M.S.W.Director, Ruth H. Young Center
for Families and Children, University of Maryland School of Social Work
vii

Hitting the MARC: Establishing Foster Care Minimum Adequate Rates for Children
viii

Table of Contents
ix
Table of Contents
Acknowledgments ....................................................................................................................... v
Executive Summary..................................................................................................................... 1
Background................................................................................................................................. 15
Study Purpose and Objectives ................................................................................................. 18
Method and Study Design........................................................................................................ 19
Cost Calculations ....................................................................................................................... 23
Results.......................................................................................................................................... 32
Conclusion .................................................................................................................................. 41
References ................................................................................................................................... 43

Hitting the MARC: Establishing Foster Care Minimum Adequate Rates for Children
x
Executive Summary
Executive Summary
This report presents the first‐ever calculation of the real expenses of caring for a child in foster care in the United States. It systematically demonstrates that rates of support for children in foster care are far below what is needed to provide basic care for these children in nearly every state in the nation. On average, across the U.S., current foster care rates must be raised by 36 percent in order to reach the Foster Care Minimum Adequate Rates for Children (the “Foster Care MARC”) calculated through this project. In some states, rates are less than half of what it actually costs to care for a child in foster care.
On any given day, there are more than half a million children in foster care in the U.S., the majority of whom have entered care due to abuse and neglect by their parents. Three‐fourths of them are placed by the government with foster parents who open their homes to care for these vulnerable children and almost one‐fifth are placed in group homes and institutions.
State and local child welfare systems are obligated by federal law to provide payments to foster parents to “cover” the expenses of caring for these children, such as food, clothing and school supplies. These payments are typically funded with a combination of federal, state and local dollars. However, there is no federally required minimum rate and, until now, there has been no standardized calculation of exactly how much it costs to care for a child in foster care.
States and localities have complete discretion in setting their foster care rates. In fact, current monthly rates range from $226 in Nebraska to $869 in the District of Columbia. Differences in the cost of living in various parts of the country and some individual state policies regarding separate reimbursement for certain expenses may account for a portion of the difference. However, the range is far too wide to be completely explained by those factors. Indeed, a number of states report using no particular methodology to determine their rates. Low among myriad state and local budget priorities, foster care rates in many states do not appear to be based on a real assessment of children’s basic needs.
Thus, it is no surprise that foster parents and other advocates routinely report that current rates fall far short of the actual costs of providing care. And, if foster parents are not financially able to pick up the shortfall by paying out of their own pockets for expenses that the state or locality is legally obligated to cover, then children may do without.
There is evidence that inadequate foster care rates negatively affect foster parent recruitment and retention, which can set off a chain reaction of negative consequences for children. When a child welfare system cannot maintain an adequate pool of foster homes, children may be more likely to be
1

Hitting the MARC: Establishing Foster Care Minimum Adequate Rates for Children
placed in institutional settings or shuttled from one foster placement to another, an unstable situation that can decrease their chances of ever having a permanent home.
This report does what most state and local child welfare systems have failed to do. It establishes Foster Care Minimum Adequate Rates for Children (the “Foster Care MARC”) based on an analysis of the real costs of providing care. The Foster Care MARC is based on expenditures that are allowable under the Title IV‐E Foster Care Maintenance Program of the Social Security Act, which defines foster care maintenance payments as covering the cost of providing food, clothing, shelter, daily supervision, school supplies, personal incidentals, insurance and travel for visitation with a child’s biological family.
The Foster Care MARC sets a basic foster care rate.1 It was calculated by analyzing consumer expenditure data reflecting the costs of caring for a child; identifying and accounting for additional costs particular to children in foster care; and applying a geographic cost‐of‐living adjustment, in order to develop specific rates for each of the 50 states and the District of Columbia. The Foster Care MARC includes adequate funds to meet a child’s basic physical needs and cover the costs of “normalizing” childhood activities, such as after‐school sports and arts programs, which are particularly important for children who have been traumatized or isolated by their experiences of abuse and neglect and placement in foster care.
The Foster Care MARC provides a benchmark superior to the U.S. Department of Agriculture (USDA) estimates of the costs of raising children, upon which some states have relied to set their rates. USDA estimates are an imperfect match for setting foster care rates because they include expenses that are not typically part of a foster care rate, such as mortgage or rent, health care and education, and they exclude other expenses particular to the care of children in foster care.
The national average of the Foster Care MARC is $629 per month for 2‐year‐olds,2 $721 per month for 9‐year‐olds and $790 per month for 16–year‐olds, compared to the current national average rates of $488 per month for 2‐year‐olds, $509 per month for 9‐year‐olds and $568 per month for 16‐year‐olds.
It should be noted that the Foster Care MARC does not include the cost of transporting a child to visit with his or her biological family or the cost of full‐time child care for working foster parents. Given the variability in these expenditures from case to case, states and localities should reimburse foster parents based on their actual expenditures, in addition to the Foster Care MARC.
1 This project developed an estimate of the basic costs associated with caring for a child in foster care. The Foster
Care MARC does not include, for example, the additional costs of meeting the special needs of a child with a physical disability or medical condition. Foster care rates for children with these kinds of special needs are typically called “therapeutic foster care rates.” Although this project did not calculate therapeutic foster care rates, the Foster Care MARC provides a basic rate to which estimates of the costs of meeting children’s special needs can be added to determine adequate therapeutic foster care rates.
2 The Foster Care MARC was calculated for children ages birth‐4, 5‐13 and 14‐18. States typically report their foster care rates for children ages 2, 9 and 16, which are the midpoints of the age categories used for this project.
2

Executive Summary
It should also be noted that the Foster Care MARC excludes expenses related to the cost of travel to administrative and judicial reviews and health care appointments. These expenses are also variable and, in addition, are not reimbursable to states under the federal Title IV‐E Maintenance program, which provided the framework for the calculation of the Foster Care MARC. However, these costs are reimbursable under other federal funding mechanisms, including the Title IV‐E Administration Program and the Title XIX Medicaid Program. Here again, states should reimburse foster parents for their actual travel expenses for these purposes, in addition to the Foster Care MARC.
The Foster Care MARC should be quickly adopted by states and localities across the nation and these rates should be applied regardless of whether foster homes are directly supervised by a public child welfare agency or by private providers under contract with a public agency. Therapeutic foster care and adoption subsidy rates should also be informed by the Foster Care MARC and adjusted accordingly.
The federal government should improve the inadequate system of foster care payment by establishing minimum allowable foster care rates and requiring annual cost‐of‐living adjustments to those rates. As a first step toward achieving this goal, the federal government should require states to submit their methodology for calculating foster care rates as part of their foster care state plans, which are subject to federal approval. Finally, the federal government must strengthen its own commitment to foster care funding.
Certainly low foster care rates are not the only factors negatively affecting foster parent recruitment and retention, the well‐being of children in foster care and children’s chances of growing up in a permanent home. Low rates are among a number of significant systemic problems—for example, high caseworker caseloads—that may contribute to poor life outcomes for these children and which must be addressed. It is also critical that adequate funding and services are available to strengthen families and prevent children from entering foster care in the first place. However, when children cannot remain safely at home and do enter foster care, they must receive appropriate care, which requires adequate foster care rates.
By establishing foster care rates that cover actual costs, children can receive necessary care and have happier and more normal childhoods, child welfare systems may be better able to maintain a stable pool of foster parents and children can have better chances of growing up in permanent families.
The tables on the following pages provide a comparison of the Foster Care MARC against current rates.
3

Hitting the MARC: Establishing Foster Care Minimum Rates for Children
Table 1: Foster Care MARC Compared to Current Foster Care Rates (Alphabetical by State)
Foster Care MARC4,5
Current Foster Care
Rates3
Note: The Foster Care MARC does not include travel and child care expenses. Foster parents should be reimbursed for their
actual expenses for these activities, in addition to the Foster Care MARC.
To hit the Foster Care MARC, current rates must be increased by:6
Child’s Age: 2 9 16 2 9 16 2 9 16 US Average: 488 509 568 629 721 790 29% 41% 39%
Alabama 410 434 446 567 650 712 38% 50% 60% Alaska7,8 652 580 688 629 721 790 *** 24% 15% Arizona 793 782 879 606 695 762 *** *** *** Arkansas 400 425 475 558 639 701 39% 50% 48% California 425 494 597 685 785 861 61% 59% 44% Colorado 348 392 423 659 755 828 89% 93% 96% Connecticut 756 767 834 756 866 950 0% 13% 14% Delaware 517 517 517 625 716 785 21% 38% 52% Dist. of Columbia7 869 869 940 629 721 790 *** *** *** Florida 429 440 515 579 664 728 35% 51% 41% Georgia 416 471 540 588 674 738 41% 43% 37% Hawaii7 529 529 529 629 721 790 19% 36% 49% Idaho 274 300 431 602 689 756 120% 130% 75% Illinois 380 422 458 661 757 830 74% 79% 81% Indiana 760 760 760 630 722 791 *** *** 4% Iowa 454 474 525 626 717 786 38% 51% 50% Kansas 603 603 603 628 720 789 4% 19% 31% Kentucky 599 599 660 569 652 715 *** 9% 8% Louisiana 380 365 399 567 649 712 49% 78% 78% Maine 548 577 614 686 786 862 25% 36% 40% Maryland 735 735 750 628 720 789 *** *** 5% Massachusetts 490 531 616 766 878 962 56% 65% 56%
(continues)
4

Executive Summary
Foster Care MARC4,5
Current Foster Care
Rates3
Note: The Foster Care MARC does not include travel and child care expenses. Foster parents should be reimbursed for their
actual expenses for these activities, in addition to the Foster Care MARC.
To hit the Foster Care MARC, current rates must be increased by:6
Child’s Age: 2 9 16 2 9 16 2 9 16 US Average: 488 509 568 629 721 790 29% 41% 39%
Michigan 433 433 535 646 740 812 49% 71% 52% Minnesota 585 585 699 661 758 830 13% 29% 19% Mississippi 325 355 400 555 636 697 71% 79% 74% Missouri 271 322 358 627 719 788 131% 123% 120% Montana 515 475 572 598 685 751 16% 44% 31% Nebraska 226 359 359 636 729 799 181% 103% 123% Nevada 683 683 773 638 731 801 *** 7% 4% New Hampshire 403 439 518 724 830 910 80% 89% 76% New Jersey 553 595 667 751 860 943 36% 45% 41% New Mexico 483 516 542 600 688 754 24% 33% 39% New York8 504 594 687 721 826 906 43% 39% 32% North Carolina 390 440 490 630 722 792 62% 64% 62% North Dakota 370 418 545 584 669 734 58% 60% 35% Ohio 275 275 275 635 727 797 131% 164% 190% Oklahoma 365 430 498 557 639 700 53% 49% 41% Oregon 387 402 497 642 735 806 66% 83% 62% Pennsylvania8 640 640 640 671 770 844 5% 20% 32% Rhode Island 438 416 480 723 828 908 65% 99% 89% South Carolina 332 359 425 576 660 723 73% 84% 70% South Dakota 451 451 542 633 726 795 40% 61% 47% Tennessee 627 627 737 574 658 722 *** 5% *** Texas 652 652 652 557 638 700 *** *** 7% Utah 426 426 487 634 726 796 49% 70% 63% Vermont 475 528 584 705 808 886 48% 53% 52% Virginia 368 431 546 605 694 760 64% 61% 39% Washington 374 451 525 657 753 826 76% 67% 57%
(continues)
5
Hitting the MARC: Establishing Foster Care Minimum Rates for Children
Foster Care MARC4,5
Current Foster Care
Rates3
Note: The Foster Care MARC does not include travel and child care expenses. Foster parents should be reimbursed for their
actual expenses for these activities, in addition to the Foster Care MARC.
To hit the Foster Care MARC, current rates must be increased by:6
Child’s Age: 2 9 16 2 9 16 2 9 16 US Average: 488 509 568 629 721 790 29% 41% 39%
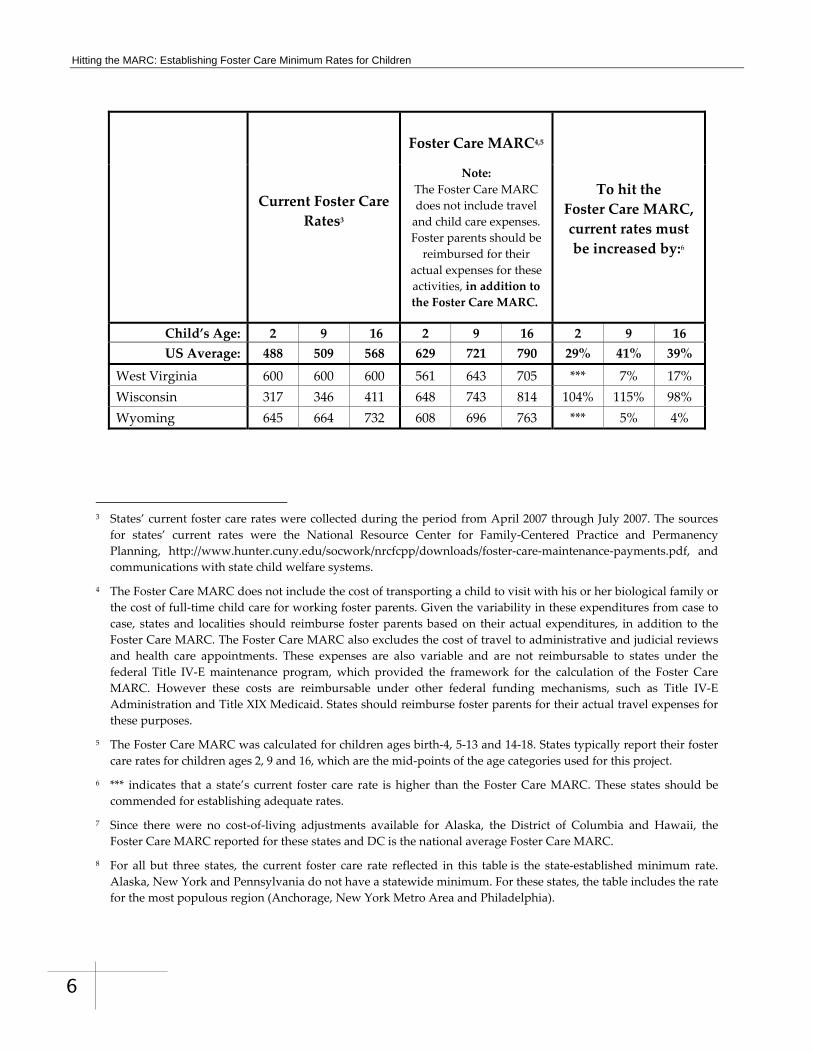
West Virginia 600 600 600 561 643 705 *** 7% 17% Wisconsin 317 346 411 648 743 814 104% 115% 98% Wyoming 645 664 732 608 696 763 *** 5% 4%
3 States’ current foster care rates were collected during the period from April 2007 through July 2007. The sources
for states’ current rates were the National Resource Center for Family‐Centered Practice and Permanency Planning, http://www.hunter.cuny.edu/socwork/nrcfcpp/downloads/foster‐care‐maintenance‐payments.pdf, and communications with state child welfare systems.
4 The Foster Care MARC does not include the cost of transporting a child to visit with his or her biological family or the cost of full‐time child care for working foster parents. Given the variability in these expenditures from case to case, states and localities should reimburse foster parents based on their actual expenditures, in addition to the Foster Care MARC. The Foster Care MARC also excludes the cost of travel to administrative and judicial reviews and health care appointments. These expenses are also variable and are not reimbursable to states under the federal Title IV‐E maintenance program, which provided the framework for the calculation of the Foster Care MARC. However these costs are reimbursable under other federal funding mechanisms, such as Title IV‐E Administration and Title XIX Medicaid. States should reimburse foster parents for their actual travel expenses for these purposes.
5 The Foster Care MARC was calculated for children ages birth‐4, 5‐13 and 14‐18. States typically report their foster care rates for children ages 2, 9 and 16, which are the mid‐points of the age categories used for this project.
6 *** indicates that a state’s current foster care rate is higher than the Foster Care MARC. These states should be commended for establishing adequate rates.
7 Since there were no cost‐of‐living adjustments available for Alaska, the District of Columbia and Hawaii, the Foster Care MARC reported for these states and DC is the national average Foster Care MARC.
8 For all but three states, the current foster care rate reflected in this table is the state‐established minimum rate. Alaska, New York and Pennsylvania do not have a statewide minimum. For these states, the table includes the rate for the most populous region (Anchorage, New York Metro Area and Philadelphia).
6

Executive Summary
Table 2: Hitting the Foster Care MARC (States Listed from Best to Worst, Alphabetical within Categories)
Current Foster Care
Rates9
Foster Care MARC10,11
Note: The Foster Care MARC does not include travel and child
care expenses. Foster parents should be
reimbursed for their actual expenses for these activities, in addition to the Foster
Care MARC.
To hit the Foster Care MARC, current rates must be increased by:12
Child’s Age: 2 9 16 2 9 16 2 9 16 US Average: 488 509 568 629 721 790 29% 41% 39%
Hitting the MARC Arizona 793 782 879 606 695 762 *** *** *** Dist. of Columbia13 869 869 940 629 721 790 *** *** ***
Missing the MARC: Must Raise Rates by up to 25% for at Least One Age Group Alaska13, 14 652 580 688 629 721 790 *** 24% 15% Connecticut 756 767 834 756 866 950 0% 13% 14% Indiana 760 760 760 630 722 791 *** *** 4% Kentucky 599 599 660 569 652 715 *** 9% 8% Maryland 735 735 750 628 720 789 *** *** 5% Nevada 683 683 773 638 731 801 *** 7% 4% Tennessee 627 627 737 574 658 722 *** 5% *** Texas 652 652 652 557 638 700 *** *** 7% West Virginia 600 600 600 561 643 705 *** 7% 17% Wyoming 645 664 732 608 696 763 *** 5% 4%
Missing the MARC: Must Raise Rates by 26% to 50% for at Least One Age Group Arkansas 400 425 475 558 639 701 39% 50% 48% Georgia 416 471 540 588 674 738 41% 43% 37% Hawaii13 529 529 529 629 721 790 19% 36% 49% Kansas 603 603 603 628 720 789 4% 19% 31% Maine 548 577 614 686 786 862 25% 36% 40% Minnesota 585 585 699 661 758 830 13% 29% 19% Montana 515 475 572 598 685 751 16% 44% 31%
(continues)
7

Hitting the MARC: Establishing Foster Care Minimum Rates for Children
Current Foster Care
Rates9
Foster Care MARC10,11
Note: The Foster Care MARC does not include travel and child
care expenses. Foster parents should be
reimbursed for their actual expenses for these activities, in addition to the Foster
Care MARC.
To hit the Foster Care MARC, current rates must be increased by:12
Child’s Age: 2 9 16 2 9 16 2 9 16 US Average: 488 509 568 629 721 790 29% 41% 39%
New Jersey 553 595 667 751 860 943 36% 45% 41% New Mexico 483 516 542 600 688 754 24% 33% 39% New York14 504 594 687 721 826 906 43% 39% 32% Pennsylvania14 640 640 640 671 770 844 5% 20% 32%
Missing the MARC: Must Raise Rates by 51% to 75% for at Least One Age Group Alabama 410 434 446 567 650 712 38% 50% 60% California 425 494 597 685 785 861 61% 59% 44% Delaware 517 517 517 625 716 785 21% 38% 52% Florida 429 440 515 579 664 728 35% 51% 41% Iowa 454 474 525 626 717 786 38% 51% 50% Massachusetts 490 531 616 766 878 962 56% 65% 56% Michigan 433 433 535 646 740 812 49% 71% 52% North Carolina 390 440 490 630 722 792 62% 64% 62% North Dakota 370 418 545 584 669 734 58% 60% 35% Oklahoma 365 430 498 557 639 700 53% 49% 41% South Dakota 451 451 542 633 726 795 40% 61% 47% Utah 426 426 487 634 726 796 49% 70% 63% Vermont 475 528 584 705 808 886 48% 53% 52% Virginia 368 431 546 605 694 760 64% 61% 39%
Missing the MARC: Must Raise Rates by 76% to 100% for at Least One Age Group Colorado 348 392 423 659 755 828 89% 93% 96% Illinois 380 422 458 661 757 830 74% 79% 81% Louisiana 380 365 399 567 649 712 49% 78% 78% Mississippi 325 355 400 555 636 697 71% 79% 74% New Hampshire 403 439 518 724 830 910 80% 89% 76% Oregon 387 402 497 642 735 806 66% 83% 62% Rhode Island 438 416 480 723 828 908 65% 99% 89%
(continues)
8

Executive Summary
Current Foster Care
Rates9
Foster Care MARC10,11
Note: The Foster Care MARC does not include travel and child
care expenses. Foster parents should be
reimbursed for their actual expenses for these activities, in addition to the Foster
Care MARC.
To hit the Foster Care MARC, current rates must be increased by:12
Child’s Age: 2 9 16 2 9 16 2 9 16 US Average: 488 509 568 629 721 790 29% 41% 39%
South Carolina 332 359 425 576 660 723 73% 84% 70% Washington 374 451 525 657 753 826 76% 67% 57%
Missing the MARC: Must Raise Rates by more than 100% for at Least One Age Group Idaho 274 300 431 602 689 756 120% 130% 75% Missouri 271 322 358 627 719 788 131% 123% 120% Nebraska 226 359 359 636 729 799 181% 103% 123% Ohio 275 275 275 635 727 797 131% 164% 190% Wisconsin 317 346 411 648 743 814 104% 115% 98%
9 States’ current foster care rates were collected during the period from April 2007 through July 2007. The sources
for states’ current rates were the National Resource Center for Family‐Centered Practice and Permanency Planning, http://www.hunter.cuny.edu/socwork/nrcfcpp/downloads/foster‐care‐maintenance‐payments.pdf, and communications with state child welfare systems.
10 The Foster Care MARC does not include the cost of transporting a child to visit with his or her biological family or the cost of full‐time child care for working foster parents. Given the variability in these expenditures from case to case, states and localities should reimburse foster parents based on their actual expenditures, in addition to the Foster Care MARC. The Foster Care MARC also excludes the cost of travel to administrative and judicial reviews and health care appointments. These expenses are also variable and are not reimbursable to states under the federal Title IV‐E maintenance program, which provided the framework for the calculation of the Foster Care MARC. However these costs are reimbursable under other federal funding mechanisms, such as Title IV‐E Administration and Title XIX Medicaid. States should reimburse foster parents for their actual travel expenses for these purposes.
11 The Foster Care MARC was calculated for children ages birth‐4, 5‐13 and 14‐18. States typically report their foster care rates for children ages 2, 9 and 16, which are the mid‐points of the age categories used for this project.
12 *** indicates that a state’s current foster care rate is higher than the Foster Care MARC. These states should be commended for establishing adequate rates.
13 Since there were no cost‐of‐living adjustments available for Alaska, the District of Columbia and Hawaii, the Foster Care MARC reported for these states and DC is the national average Foster Care MARC.
14 For all but three states, the current foster care rate reflected in this table is the state‐established minimum rate. Alaska, New York and Pennsylvania do not have a statewide minimum. For these states, the table includes the rate for the most populous region (Anchorage, New York Metro Area and Philadelphia).
9

Hitting the MARC: Establishing Foster Care Minimum Rates for Children
Who Is and Isn’t Hitting the MARC? ______
Hitting the MARC: Only Arizona and the District of Columbia have foster care rates for children of all ages that meet or exceed the Foster Care MARC.
Missing the MARC: Must raise rates by up to 25% Ten states (Alaska, Connecticut, Indiana, Kentucky, Maryland, Nevada, Tennessee, Texas, West Virginia and Wyoming) currently have foster care rates that must be raised by up to 25% for at least one age group of children in order to hit the MARC.
Missing the MARC: Must raise rates by 26% to 50% Eleven states (Arkansas, Georgia, Hawaii, Kansas, Maine, Minnesota, Montana, New Jersey, New Mexico, New York and Pennsylvania) currently have rates that must be raised by 26% to 50% for at least one age group of children in order to hit the MARC.
Missing the MARC: Must raise rates by 51% to 75% Fourteen states (Alabama, California, Delaware, Florida, Iowa, Massachusetts, Michigan, North Carolina, North Dakota, Oklahoma, South Dakota, Utah, Vermont and Virginia) currently have foster care rates that must be raised by 51% to 75% for at least one age group of children in order to hit the MARC.
Missing the MARC: Must raise rates by 76% to 100% Nine states (Colorado, Illinois, Louisiana, Mississippi, New Hampshire, Oregon, Rhode Island, South Carolina and Washington) currently have foster care rates that must be raised by 76% to 100% (i.e., doubled) for at least one age group of children in order to hit the MARC.
Missing the MARC: Must raise rates by more than 100% Five states (Idaho, Missouri, Nebraska, Ohio and Wisconsin) currently have rates that must be more than doubled for at least one age group of children in order to hit the MARC.
10

Executive Summary
Table 3: Foster Care MARC Compared to Current Foster Care Rates by Region (States Listed Alphabetically within Regions)
Current Foster Care
Rates15
Foster Care MARC16,17
Note: The Foster Care MARC
does not include travel and child care expenses. Foster
parents should be reimbursed for their actual
expenses for these activities, in addition to the Foster Care MARC.
To hit the Foster Care MARC, current rates must be increased by:18
Childʹs Age 2 9 16 2 9 16 2 9 16 US Average: 488 509 568 629 721 790 29% 41% 39%
Northeast: 579 601 650 688 789 864 19% 31% 33% Connecticut 756 767 834 756 866 950 0% 13% 14% Delaware 517 517 517 625 716 785 21% 38% 52% District of Columbia19 869 869 940 629 721 790 *** *** *** Maine 548 577 614 686 786 862 25% 36% 40% Maryland 735 735 750 628 720 789 *** *** 5% Massachusetts 490 531 616 766 878 962 56% 65% 56% New Hampshire 403 439 518 724 830 910 80% 89% 76% New Jersey 553 595 667 751 860 943 36% 45% 41% New York20 504 594 687 721 826 906 43% 39% 32% Pennsylvania20 640 640 640 671 770 844 5% 20% 32% Rhode Island 438 416 480 723 828 908 65% 99% 89% Vermont 475 528 584 705 808 886 48% 53% 52% West Virginia 600 600 600 561 643 705 *** 7% 17%
South: 438 464 522 576 660 723 31% 42% 39% Alabama 410 434 446 567 650 712 38% 50% 60% Arkansas 400 425 475 558 639 701 39% 50% 48% Florida 429 440 515 579 664 728 35% 51% 41% Georgia 416 471 540 588 674 738 41% 43% 37% Kentucky 599 599 660 569 652 715 *** 9% 8% Louisiana 380 365 399 567 649 712 49% 78% 78% Mississippi 325 355 400 555 636 697 71% 79% 74%
(continues)
11

Hitting the MARC: Establishing Foster Care Minimum Rates for Children
Current Foster Care
Rates15
Foster Care MARC16,17
Note: The Foster Care MARC
does not include travel and child care expenses. Foster
parents should be reimbursed for their actual
expenses for these activities, in addition to the Foster Care MARC.
To hit the Foster Care MARC, current rates must be increased by:18
Childʹs Age 2 9 16 2 9 16 2 9 16 US Average: 488 509 568 629 721 790 29% 41% 39%
North Carolina 390 440 490 630 722 792 62% 64% 62% Oklahoma 365 430 498 557 639 700 53% 49% 41% South Carolina 332 359 425 576 660 723 73% 84% 70% Tennessee 627 627 737 574 658 722 *** 5% *** Texas 652 652 652 557 638 700 *** *** 7% Virginia 368 431 546 605 694 760 64% 61% 39% Midwest: 427 454 506 634 727 797 49% 60% 58%
Illinois 380 422 458 661 757 830 74% 79% 81% Indiana 760 760 760 630 722 791 *** *** 4% Iowa 454 474 525 626 717 786 38% 51% 50% Kansas 603 603 603 628 720 789 4% 19% 31% Michigan 433 433 535 646 740 812 49% 71% 52% Minnesota 585 585 699 661 758 830 13% 29% 19% Missouri 271 322 358 627 719 788 131% 123% 120% Nebraska 226 359 359 636 729 799 181% 103% 123% North Dakota 370 418 545 584 669 734 58% 60% 35% Ohio 275 275 275 635 727 797 131% 164% 190% South Dakota 451 451 542 633 726 795 40% 61% 47% Wisconsin 317 346 411 648 743 814 104% 115% 98% West 503 515 590 630 722 791 25% 40% 34%
Alaska19,20 652 580 688 629 721 790 *** 24% 15% Arizona 793 782 879 606 695 762 *** *** *** California 425 494 597 685 785 861 61% 59% 44% Colorado 348 392 423 659 755 828 89% 93% 96% Hawaii20 529 529 529 629 721 790 19% 36% 49%
(continues)
12

Executive Summary
Current Foster Care
Rates15
Foster Care MARC16,17
Note: The Foster Care MARC
does not include travel and child care expenses. Foster
parents should be reimbursed for their actual
expenses for these activities, in addition to the Foster Care MARC.
To hit the Foster Care MARC, current rates must be increased by:18
Childʹs Age 2 9 16 2 9 16 2 9 16 US Average: 488 509 568 629 721 790 29% 41% 39%
Idaho 274 300 431 602 689 756 120% 130% 75% Montana 515 475 572 598 685 751 16% 44% 31% Nevada 683 683 773 638 731 801 *** 7% 4% New Mexico 483 516 542 600 688 754 24% 33% 39% Oregon 387 402 497 642 735 806 66% 83% 62% Utah 426 426 487 634 726 796 49% 70% 63% Washington 374 451 525 657 753 826 76% 67% 57% Wyoming 645 664 732 608 696 763 *** 5% 4%
15 States’ current foster care rates were collected during the period from April 2007 through July 2007. The sources
for states’ current rates were the National Resource Center for Family‐Centered Practice and Permanency Planning, http://www.hunter.cuny.edu/socwork/nrcfcpp/downloads/foster‐care‐maintenance‐payments.pdf, and communications with state child welfare systems.
16 The Foster Care MARC does not include the cost of transporting a child to visit with his or her biological family or the cost of full‐time child care for working foster parents. Given the variability in these expenditures from case to case, states and localities should reimburse foster parents based on their actual expenditures, in addition to the Foster Care MARC. The Foster Care MARC also excludes the cost of travel to administrative and judicial reviews and health care appointments. These expenses are also variable and are not reimbursable to states under the federal Title IV‐E maintenance program, which provided the framework for the calculation of the Foster Care MARC. However these costs are reimbursable under other federal funding mechanisms, such as Title IV‐E Administration and Title XIX Medicaid. States should reimburse foster parents for their actual travel expenses for these purposes.
17 The Foster Care MARC was calculated for children ages birth‐4, 5‐13 and 14‐18. States typically report their foster care rates for children ages 2, 9 and 16, which are the mid‐points of the age categories used for this project.
18 *** indicates that a state’s current foster care rate is higher than the Foster Care MARC. These states should be commended for establishing adequate rates.
19 Since there were no cost‐of‐living adjustments available for Alaska, the District of Columbia and Hawaii, the Foster Care MARC reported for these states and DC is the national average Foster Care MARC.
20 For all but three states, the current foster care rate reflected in this table is the state‐established minimum rate. Alaska, New York and Pennsylvania do not have a statewide minimum. For these states, the table includes the rate for the most populous region (Anchorage, New York Metro Area and Philadelphia).
13

Hitting the MARC: Establishing Foster Care Minimum Adequate Rates for Children
Regional Comparisons
______
Northeast: On average, current foster care rates in the Northeast must be increased by 28% in order to hit the Foster Care MARC. However, Rhode Island must increase its current rates by more than 80%.
South: On average, current foster care rates in the South must be increased by 37% in order to hit the Foster Care MARC. South Carolina and Mississippi need to raise their rates by 75% in order to hit the Foster Care MARC.
Midwest: On average, current foster care rates in the Midwest must be increased by 56% in order to hit the Foster Care MARC. Four states in the Midwest—Ohio, Missouri, Nebraska and Wisconsin—currently have rates that need to be more than doubled in order to hit the MARC.
West: On average, current foster care rates must be increased by 33% in order to hit the Foster Care MARC.
14

Background
15
Background
As of 2005, there were 512,000 children living in foster care in the United States.i,21 Foster care services, including the payments to foster parents for caring for children, are supported by a combination of federal, state and local funding.ii The Title IV‐E federal foster care program of the Social Security Act pays a portion of the states’ costs to provide care for maltreated children removed from welfare‐eligible homes. The program’s funding is structured as an “uncapped” entitlement; therefore, any qualifying expenditure will be partially reimbursed by the federal government to the states without limit. To receive federal funding for foster care payments, states must submit foster care program plans that are approved by the Secretary of the U.S. Department of Health and Human Services.iii
Different federal funding claiming practices by the states result in wide variations in funding among the States.iv The United States Department of Health and Human Services (USDHHS) reports that “It is unlikely that these disparities [in states’ claiming of federal funding] are the result of actual differences in the cost of operating foster care programs or reflect differential needs among foster children.”v
Title IV‐E of the Social Security Act defines foster care maintenance payments as “payments to cover the cost of (and the cost of providing) food, clothing, shelter, daily supervision, school supplies, a childʹs personal incidentals, liability insurance with respect to a child and reasonable travel to the childʹs home for visitation.”vi The USDHHS further clarifies that including liability insurance with respect to a child in the definition of foster care maintenance payments “gives states the option of considering insurance for foster parents as a direct foster care maintenance cost or as an administrative cost of the foster care maintenance program under title IV‐E.”vii
There is significant variability among states in the monthly payments provided to foster parents for the care of children in foster care and in the methods, if any, that states use to determine the amount of those payments. Basic foster care rates vary from $226 a month in the state of Nebraskaviii to $869 a month in the District of Columbia.ix
Foster parents and other advocates routinely report that current rates do not cover actual costs and there is some evidence that inadequate rates negatively affect foster parent recruitment and retention, which may, in turn, affect the achievement of permanency for children in foster care. Some research has found that, as a result of low rates, children in foster care may not always receive
21 Reference citations, denoted by Roman numerals, are provided in endnotes beginning on page 43.

Hitting the MARC: Establishing Foster Care Minimum Adequate Rates for Children
the care they need and community members may be deterred from becoming or remaining foster parents.x A study by the USDHHS Office of the Inspector General found that foster parents incur expenses that exceed foster care rates and often pay out of their own pockets to meet children’s needs.xi This study found that the additional financial strain placed upon foster parents causes them to consider no longer fostering.xii
Recent media reports also support these findings.xiii For example, California, which has the largest number of children in foster care of any state in the nation,xiv has reported a 30 percent decline in the number of licensed foster homes in the past ten years, attributed at least in part to low foster care rates.xv Other states have reported a shortage of family foster homes, including Louisiana, where the foster care reimbursement rate has not been increased in 11 years,xvi and Wisconsin, which has the fourth‐lowest rate in the nation.xvii
A reasonable hypothesis is that children in child welfare systems that lack adequate numbers of foster homes may be more likely to experience multiple placements and be placed in residential or institutional foster care facilities,xviii which are significantly more expensive than family foster care. The experience of multiple placements has been shown to negatively affect a child’s well beingxix and to decrease a child’s chances of being adopted.xx In fact, 60 percent of children who are adopted from foster care are adopted by their foster parents.xxi Thus, placement in a stable foster home is a critical factor in a child’s chances of being adopted, when family reunification efforts fail.
Placement instability may also affect a child’s chances at family reunification, as multiple placement moves may reduce the chances that children will visit consistently with their biological families. Frequent visiting between children in foster care and their biological parents has been shown to increase the likelihood of reunification.xxii Achieving permanency not only is beneficial for the well‐being of children, but also results in substantial government savings over long term foster care.xxiii
Certainly, low foster care rates are not the only factors impacting foster parent recruitment and retention, the well‐being of children in foster care and children’s chances of growing up in a permanent home. Low rates are among a number of significant systemic problems—for example, high caseworker caseloads—that may contribute to poor life outcomes for these children. Other factors inhibiting recruitment and retention cited by foster parents include limited caseworker support, inadequate services for the children placed in their homes, poor training and caseworker turnover.xxiv All of these systemic issues must be addressed, in addition to raising rates to appropriate levels.
Differences in the cost of living among various parts of the country, as well as some individual state policies regarding separate reimbursement for certain expenses, may account for a portion of the difference among foster care rates across the nation. However, the range is too wide to be completely explained by those factors. Indeed, many states do not report any particular method for calculating their foster care rates.xxv
16

Background
17
A Survey of How Jurisdictions Currently Set Rates In 2007, for the purpose of informing this project, the National Association of Public Child Welfare Administrators (NAPCWA) surveyed child welfare agencies in the 50 states and a number of counties to collect information on their foster care rate‐setting methodologies.22 Twenty‐six jurisdictions responded, including 21 states and 5 counties. Of these, only 14 jurisdictions documented some basis for calculating their foster care rates. The remaining 12 did not report any methodology. Only 3 out of the 26 responding jurisdictions reported having a policy requiring periodic review of the adequacy of their foster care rates.
Absent a more precise guideline—now provided by the Foster Care MARC—a few jurisdictions have tied their foster care rates to estimates of the costs of raising (non‐foster‐care) children produced by the U.S. Department of Agriculture (USDA)xxvi based on data from the Consumer Expenditure Survey (CES) administered by the Bureau of Labor Statistics (BLS).xxvii However, the USDA estimates are an imperfect basis for foster care rates because they include categories of expenditures that would not typically be included in a foster care rate such as mortgage or rent, health care and school tuition. Foster care payments are typically not intended to cover a foster parent’s mortgage or rent; health care for children in foster care is covered through Medicaid; and children in foster care typically attend public school. In addition to the USDA estimates being over‐inclusive of such expenses, the USDA estimates do not include certain costs that are particular to children in foster care. For example, the USDA estimates do not include the costs of the additional wear and tear on household items that occurs due to the particular needs and behaviors of children in foster care, given the trauma they have experienced; property and liability insurance costs related to caring for these children; or the costs of transporting children to visits with their biological families and to administrative reviews and court hearings.
Relevant Legal Precedent In 2003, a Missouri federal court ordered the state to develop a methodology for determining foster care reimbursement rates as a result of a lawsuit brought by the Missouri Child Care Association, a trade organization for approximately 60 child care agencies (operating 90 residential foster care institutions), against the Missouri Division of Family Services and the Department of Social Services.xxviii The court found the state’s method of setting payments, which was based on available funds in the state’s budget rather than children’s needs, violated federal law. The court ordered the state to develop a methodology for determining foster care maintenance payments based on the statutory criteria contained in federal law. The foster care rate at issue in this case was for residential facilities and not for foster homes, but the court’s analysis is instructive on the question of how the adequacy of foster care rates can and cannot be determined. In 2003, a Georgia federal court ruled that children in foster care have the legal right to have their needs met through adequate foster care maintenance payments.xxix
22 A copy of the NAPCWA report is available at www.childrensrights.org.

Hitting the MARC: Establishing Foster Care Minimum Adequate Rates for Children
Study Purpose and Objectives
The purpose of this study was to estimate the costs associated with providing basic care to a child in foster care in the United States in order to determine adequate foster care rates.
The objectives were as follows:
Operationally define the basic needs of a child in foster care as guided by federal regulations.
Locate the most appropriate data sources for estimating costs to meet each of these needs and build appropriate data files with these data.
Construct multivariate models to estimate the costs associated with caring for children in foster care of varying ages in the U.S.
Identify geographic cost‐of‐living variations and construct adjustment formulas based on these geographical differences.
Based on the models and the geographical adjustments, calculate foster care minimum adequate rates for children (the Foster Care MARC) for the 50 states and the District of Columbia that should be adopted by child welfare systems.
18

Method and Study Design
Method and Study Design
Federal policy, the expert opinions of the project partners and a national advisory group, existing data on the costs of caring for children, estimates of the additional costs of caring specifically for children in foster care and geographic cost‐of‐living variations were used to calculate the Foster Care MARC. The project partners and national advisory group members included current and former foster parents, public child welfare agency administrators and staff, policy analysts and researchers, economists, advocates and pediatricians.
Federal Policy and Expert Guidance The general expenditure categories and the specific cost items included within those categories in the Foster Care MARC were defined based on current federal law, regulations and policy guidance. The eight categories of allowable expenditures, as established in the Title IV‐E Maintenance Payment Program of the Social Security Act, are food, clothing, shelter, daily supervision, school supplies, personal incidentals, liability insurance and transportation associated with visits with the child’s biological family.xxx These categories provided the basic framework for the calculation of minimum adequate rates for children.
For each of the eight categories, the project partners and the advisory group examined existing relevant policy guidance provided by the USDHHS, as well as the USDA definitions of expenses and made decisions regarding which expenditures should be included in the basic23 foster care rate calculated through this analysis.
The Foster Care MARC includes only expenses for which states would be eligible to receive federal funding under the federal Title IV‐E Maintenance program. The project partners and the advisory board considered estimating foster care rates without regard to whether states would be eligible for federal Title IV‐E maintenance funding because 1) there are, in fact, expenses that foster parents incur which are not contemplated in the Title IV‐E Maintenance Program guidelines; and 2) the
23 This project developed an estimate of the basic costs associated with caring for a child in foster care. The Foster
Care MARC does not include, for example, the additional costs of meeting the special needs of a child with a physical disability or medical condition. Foster care rates for children with these kinds of special needs are typically called “therapeutic foster care rates.” Although this project did not calculate therapeutic foster care rates, the Foster Care MARC provides a basic rate to which estimates of the costs of meeting children’s special needs can be added to determine adequate therapeutic foster care rates.
19

Hitting the MARC: Establishing Foster Care Minimum Adequate Rates for Children
project partners take the position that foster care rates should cover the true costs of providing care. However, as a practical matter, it is unlikely that states would adopt rates that do not allow them to access federal Title IV‐E Maintenance funding.
However, it should be noted that some of the costs for which states cannot access federal funding through the Title IV‐E Maintenance Program, such as the cost of travel to administrative and judicial reviews and health care appointments, can be defrayed by other federal funding sources such as Title IV‐E Administration and Title XIX Medicaid. Foster parents should be reimbursed for their expenses on these activities, in addition to the Foster Care MARC, and states should access these other federal funding sources as appropriate.
Approach Once the cost categories were clearly defined, a secondary data analysis was conducted using the CES data. This analysis was supplemented with additional data on expenditures particular to children in foster care, which are not included in the CES. The estimates were then adjusted to reflect the cost‐of‐living variation in different states to create the Foster Care Minimum Adequate Rates for Children.
Consumer Expenditure Survey
After considering existing data sources, the CES was selected for use in this project. The CES data from 2002‐2004 were obtained.
The CES is a national study of household buying habits, family earnings and household characteristics conducted by the Bureau of Labor Statistics (BLS) (U.S. Department of Labor, 2002; 2003; 2004). The CES collects data from family members using both a quarterly interview survey and a one‐week diary survey focusing on consumer units (generally a family dwelling within a household). Information is collected about the families’ annual income and expenditures and includes classifications by income, age, consumer unit size and other demographic characteristics of consumer units. The samples include the total non‐institutionalized population of the United States.
The CES is the same data source used by the USDA to produce its annual report on the costs of raising a child. However, the figures released each year by the USDA are based on earlier calculations using 1990‐1992 CES data, adjusted for inflation. The project partners decided to use the more current CES data from 2002‐2004, as these data reflect more current spending patterns, and also inflation‐adjusted these data to 2006.
Data Used
These analyses utilized the interview survey data from the CES. These data reflect all of the expenditures that families incur during the course of a year. The interview survey data are collected in independent quarterly questionnaires of approximately 7,500 households. Information was used
20

Method and Study Design
from questions in the interview survey regarding the sample households’ monthly expenditures related to food, shelter, clothing, transportation, daily supervision of children and entertainment.
Families with before tax family incomes no less than $40,000 and no greater than $100,000 were selected to be included in these analyses. This group was chosen to represent at least 200 percent and no more than 500 percent of the federal poverty level for a family of four. Two hundred percent of the federal poverty level or $40,000 was selected at the low end based on the assumption that it would be difficult to meet the needs of a family of four in most locations in the country for less than this amount. The upper end of the range was selected because calculating average expenses from a group including very wealthy families would not be considered reasonable or appropriate for the purpose of estimating foster care rates.
In the CES, data are collected from each consumer unit on a quarterly basis. For these analyses, data on families who were in four consecutive quarterly surveys were used to avoid needing to impute missing data.
The only families included in the calculation were families with some children, but with two or fewer child‐years in the consumer unit. “Child‐years” rather than children were used as children could have moved in and out of the house over the course of a year. Most of the families had either one or two children for the entire year. The reason for excluding families with more than two children is that the expenditure patterns are likely different as children may share and pass along resources. Those assumptions cannot be made when reimbursing a foster family for the costs of caring for a single child. The reason for excluding families with zero children is that adults likely allocate resources for their own needs in ways that are much different than resources for the needs of their children.
For families with no more than two children, the average expenditure per family member (for expense categories such as food and utilities) or the average expenditure per child (e.g., childrenʹs clothing) was calculated. The calculated values were used in a multivariable regression analysis including indicators of having one or more children ages birth‐4, 5‐13 and 14‐18. The results from the multivariable analysis were used to predict expenditures as a function of having children of different ages (birth‐4, 5‐13 and 14‐18). The data were inflation‐adjusted using the general consumer price index to the price level of the second half of 2006 (the most recent half year available).
The Sample
One thousand, four hundred and twenty‐two families with two or fewer child‐years were included in the sample. The analyses were weighted with weights provided by the BLS so that the results would be nationally representative.
As noted above, the families included in the analysis had incomes ranging from $40,000 to $100,000; their median income was $62,761. Thus, more than half of the families had incomes in the lower half of the range, suggesting that the data are largely representative of middle class families of the family‐size used in the analyses. In 2005, the median income in the U.S. for a 4‐person family was $67,019,xxxi which is slightly higher then the median income of families included in this study.
21

Hitting the MARC: Establishing Foster Care Minimum Adequate Rates for Children
Ten percent of the families in the study sample had incomes below $43,901. Only ten percent of the families had incomes above $89,179, and 50 percent of the families had incomes ranging from $49,906 to $77,914.
Analytic Procedures
CES data from three recently available years (2002‐2004) were obtained. These data were obtained on a CD‐ROM from which summary statistics were generated and multivariate data analysis was performed. Based on the previously defined components of care (e.g., food, clothing), data files were constructed with the most appropriate cost variables to match each defined category.
Data analyzed included family composition, family income and expenditures in categories including: food, utilities, gas and motor oil, video games, toys and hobbies, school supplies, baby sitting and day care, children’s clothing, fees and admissions, linens, coin‐operated laundry and dry cleaning.
The calculation of the Foster Care MARC took into account the varying needs of children in different age groups, recognizing, for example, that the needs of and expenses generated by a 2‐year‐old are different from those of a 14‐year‐old. Based on age‐appropriate needs and expenses, adequate rates were calculated for three age groups: children ages birth‐4, 5‐13 and 14‐18. States typically report their foster care rates for children age 2, 9 and 16, which are the mid‐points of the age categories utilized for this project.
Caring for a child in foster care generates additional expenses beyond the basic costs of caring for a child who is not in foster care.xxxii Given the trauma they have experienced, children in foster care often have particular needs and behaviors that cause increased wear and tear on household items and the need to clean, fix or replace these items more frequently than in households without children in foster care. For example, foster parents may need to replace bedding or do laundry more frequently as a result of a child’s bed wetting. They may also have increased utility bills due to extra laundry and needing to leave lights on at night because children are afraid of the dark, or higher phone bills due to children needing to maintain contact with family and friends who may not live locally.
The Foster Care MARC calculation increased certain cost estimates from the CES data to account for these issues, based on the findings of a study by McHugh.xxxiii In this study, focus groups with foster parents were conducted to understand the costs associated with caring for children in foster care. Based on the foster parent reports, McHugh customized estimates of the cost of caring for non‐foster children to more accurately reflect the costs of caring for children in foster care. Many of the adjustments in the McHugh study reflect added wear and tear or damage to household items including appliances, furniture, linens, towels, beds and bedding. To adjust for wear and tear, lifetimes of some items regularly used by children in care were reduced, while costs for added cleaning of carpets and soft furnishings were increased.
22

Cost Calculations
Cost Calculations
This section provides an explanation of how each of the eight costs categories was calculated, to ultimately produce the Foster Care MARC.
Food The USDHHS provides no guidance on the cost of food for children in foster care. The USDA analysis of the CES data defined food expenditures for an average family as including “food, nonalcoholic beverages purchased at grocery, convenience and specialty stores including purchases with food stamps; dining at restaurants; and household expenditures on school meals.”xxxiv
The food category of the Foster Care MARC was based on the expenditures of a middle‐income family on food for children of different ages, as identified in the CES. This estimate was then increased by 10 percent, following the multiplier used by McHugh,xxxv to adjust for added costs associated with behavioral issues of foster children related to, for example, hoarding food or additional nutritional needs.
Clothing The USDHHS provides no guidance on the cost of clothing for children in foster care. The USDA analysis of the CES data defined clothing expenditures as “children’s apparel such as diapers, shirts, pants, dresses, and suits; footwear; and clothing services such as dry cleaning, alterations and repair and storage.”xxxvi
The clothing category of the Foster Care MARC was based on the expenditures of middle‐income families on clothing, coin operated laundry and dry cleaning as identified in the CES (utility expenses for laundry done at home is reflected in the “shelter category”). The CES estimate for costs of clothing items for children within different age groups were doubled to account for wear and tear and replacement of lost items. Following McHugh, costs of coin‐operated laundry were increased by 50 percent to adjust for added cleaning costs, consistent with the adjustment to utility costs. No adjustment was made to the cost of dry cleaning, as it is not expected that the clothes of children in foster care are frequently dry cleaned.
23

Hitting the MARC: Establishing Foster Care Minimum Adequate Rates for Children
It should be noted that the Foster Care MARC is intended to cover regular ongoing expenses related to clothing and does not include funds to purchase an entire basic wardrobe, which some children need when they enter foster care. A number of states provide an initial clothing allowance to address this issue. States that do not provide an initial clothing allowance should do so.
Shelter The USDHHS provides no guidance on the cost of shelter for children in foster care. The USDA analysis of the CES data defines housing expenditures as “shelter (mortgage interest, property taxes, or rent; maintenance and repairs; and insurance), utilities (gas, electricity, fuel, telephone and water) and house furnishings and equipment (furniture, floor coverings and major and small appliances).”xxxvii
In a study of the cost of caring for children in foster care, McHugh included the additional costs of “wear and tear” damage to household goods and increased utilities usage.xxxviii
The shelter category of the Foster Care MARC was based on per‐child expenditures of middle‐income families on utilities, furniture, appliances and household linens as identified in the CES. Following McHugh, the CES estimate for costs of utilities was increased by 50 percent to adjust for added costs associated with increased uses of water, electricity, phone, gas/oil and other utilities. The CES estimate for costs of household items including furniture, appliances and linens was doubled to adjust for extra wear and tear.
It should be noted that the Foster Care MARC does not include costs related to mortgage or rent, as foster parents are typically expected to maintain their homes independent of the foster care payment. In addition, the Foster Care MARC does not include the costs of preparing a home to meet the needs of the child such as initial furnishings or safety features (e.g., window guards). These items must be installed before the child is placed in the home and while the foster parents should be reimbursed for those expenses, they would not be included in a monthly foster care rate tied to a particular child.
Daily Supervision The USDHHS lists allowable and non‐allowable expenses under the daily supervision category. Allowable expenses include child care when the child is not in school and when the foster parent is working. This can be supplemented when a child has “greater than usual needs.”xxxix Recreation is only allowable where “it clearly substitutes for otherwise necessary daily supervision.” However, foster care reimbursement for daily supervision is “not intended to include reimbursement in the nature of a salary for the exercise by the foster family parent of ordinary parental duties.”xl
The USDA analysis of the CES data combines child care and educational expenses, including “daycare tuition and supplies; babysitting, and elementary and high school tuition, books and
24
Cost Calculations
supplies.”xli The vast majority of children in foster care attend public school and thus school tuition would not be provided through the foster care rate.
The daily supervision category of the Foster Care MARC reflects the expenditures of middle‐income families on occasional baby sitting or other child care in the home or in the home of someone else, based on the CES, and one week of residential summer camp for ages 5‐18.
Given that children in foster care often have behavioral issues, older children in foster care, even teenagers, typically require supervision. Thus, the daily supervision portion of the Foster Care MARC includes babysitting costs for children of all ages. The babysitting expenses in the CES for children ages birth‐4 were used as a base and adjusted to estimate the costs of occasional babysitting for older children.24 Cost estimates for occasional babysitting for children ages 5‐13 and 14‐18 were derived by calculating 40 percent of the expenses of the birth‐4 age group for 9 months of the year to account for the need for supervision after school or on weekends during the school year and 100 percent for 3 months when children are on summer vacation.
Additional costs associated with one week of residential camp were added to the daily supervision costs for children ages 5‐18. According to the American Camp Association, the mean weekly cost for independent non‐profit residential camps is $590.xlii
It should be noted that the Foster Care MARC does not include the cost of full‐time child care for the working foster parent. The project partners take the position that this expense should be reimbursed based on the actual costs incurred by the foster family, in addition to the regular monthly foster care rate. While it is reasonable to calculate, for example, average food costs for a child, it is not reasonable to calculate and include in the monthly rate an average of daily child care costs, given that some foster parents work full‐time and some do not work.
School Supplies The USDHHS provides no guidance on the cost of school supplies for children in foster care. The USDA analysis of the CES data includes this item under child care and educational expenses.xliii
The school supplies category of the Foster Care MARC reflects the expenditures of middle‐income families on books, recreational lessons and other school supplies, as identified in the CES. Recreational lessons reflect the expense of providing children in foster care with “normalizing” childhood experiences such as after‐school sports or creative arts activities, which are particularly important for children who may have been traumatized or isolated by their experiences of abuse and neglect and placement in foster care.xliv Following McHugh, the CES estimate for costs of books and other school supplies was doubled to adjust for wear and tear.
24 Four hundred and ninety five families were included in the analysis of babysitting costs reflecting the number of
families with two or fewer child‐years with at least one of those children in the birth‐4 age range.
25
Hitting the MARC: Establishing Foster Care Minimum Adequate Rates for Children
Personal Incidentals The USDHHS considers a range of items to fall under personal incidentals. These include: “personal hygiene, cosmetics, over the counter medications and special dietary food; infant and toddler supplies; fees related to activities, such as Boy/Girl scouts; special lessons…and miscellaneous items.”xlv In addition, USDHHS considers “reasonable and occasional cost of tickets, admission fees for sporting events, entertainment or cultural events, dues for clubs”xlvi as allowable expenses. The federal government limits what can be included in this category such that it cannot be the default category for all “extra” items, even if the extra items result in the foster parents incurring additional expenses.
The USDA analysis of the CES data includes “personal care items, entertainment and reading materials” as miscellaneous expenses.xlvii The CES documentation points to the limitations of the survey for this type of data and suggests that these incidentals may be between 5 percent and 15 percent of total expenditures on the child.xlviii Mark Lino’s work on the USDA estimates suggested that these could be valued at approximately 15 percent of all other expenses.xlix These same procedures were followed in this study; therefore, personal incidentals were estimated as 15 percent of the other expenses. The top end of the range was used to reflect that expenses for these items for foster care children are likely to be among the most costly (e.g., need to be replaced more often due to moves or disruptions). Additionally, this estimate is based on the total expenditures on a child, which have been adjusted to reflect the increased costs of caring for a child in foster care. Therefore, the costs of personal incidentals also reflect this adjustment.
The personal incidentals category of the Foster Care MARC reflects the expenditures of middle‐income families on their children for reading materials, videos, toys, hobbies, gas and motor oil, fees and admissions, as identified in the CES, and an additional 15 percent of other costs to reflect the cost of personal hygiene items, cosmetics, over the counter medications and other miscellaneous items. Following McHugh, the CES estimates for costs of reading materials video games, toys and hobbies were doubled to adjust for wear and tear.
Liability and Property Insurance The USDHHS has provided states with different options regarding liability insurance. These include “considering insurance for foster parents as a direct foster care maintenance cost or as an administrative cost of foster care maintenance program under Title IV‐E.”l
The USDA analysis of the CES data includes insurance under housing expenses, however, it provides no guidance regarding the cost of insurance for foster parents, since the USDA analysis of expenses is not specific to foster parents. Some states include payment for insurance coverage in the monthly foster care payment to parents; others provide protection through a separate insurance mechanism. In addition, some states require foster parents to carry insurance and provide coverage only for claims that have previously been denied.
26

Cost Calculations
The project partners agreed that foster parents should be provided with both liability and property insurance, which should include coverage for damages by the child in foster care to the foster parent’s home or property, harm by a child in foster care to the property or person of another party and claims by the child in foster care and/or their birth parents. The CES does not include any data on the costs of this kind of insurance. Therefore, an insurance company that provides this kind of insurance, Foster Parent Professionals, Inc., was contacted and provided the rate estimates for foster parent liability and property insurance.li
The liability insurance offered by Foster Parent Professionals, Inc. provides the following coverage for foster parents of children under the age of 18: (1) protection in the event a foster child is injured while in the care of a foster parent and the foster parent is sued by the childʹs natural parents or guardian; (2) protection from claims for bodily injury or property damage to the person or property of another because of an act of the foster child; (3) personal injury liability coverage for such things a libel, slander, false arrest, wrongful eviction and alienation of the affection of the foster child from his/her parent; (4) incidental malpractice liability coverage for the foster parent’s failure to provide needed medical care, therapy, diet or other special needs of the foster child.lii
The property damage coverage protects against damage to the foster parentʹs own property caused by a foster child and occurring while the foster child is in the care and custody of the foster parent. Excluded from coverage is property damage: (1) to property used for business pursuits; (2) arising out of the use of aircraft, ʺautoʺ or watercraft; or (3) which was intentionally caused. Each claim is interpreted on a case‐by‐case basis. ‘Intention’ is appraised, keeping in mind the child’s chronological and mental ages, with actions of younger and less competent children being less likely to be considered intentional.
The estimates provided by Foster Parent Professionals, Inc. were incorporated into the Foster Care MARC and adjusted for costs of living. It should be noted that the estimates provided were based on policies sold to child welfare agencies, not to individual foster parents, and thus, the project partners believe the estimates reflect a more conservative calculation of actual costs than if an individual foster parent were to purchase such insurance.
Reasonable Travel to the Child’s Home for Visitation The USDHHS allows “reasonable travel to the child’s home for visitation.” However, the USDHHS provides no guidance on how to define reasonable.
The costs of transporting a child in foster care to visit with his or her family can vary significantly. In some cases, a foster parent may walk across the street to take a child to visit with his or her parents. In other cases, transportation might take the form of a subway or bus ride. In yet other circumstances, a foster parent may have to drive a child 90 miles for a visit. And finally, in some jurisdictions, caseworkers or case aides—not foster parents—provide this transportation for children in foster care.
27

Hitting the MARC: Establishing Foster Care Minimum Adequate Rates for Children
28
Due to this significant variability, the Foster Care MARC does not include an average expense for travel for the purpose of a child’s visitation with his or her biological family. An average amount would underpay some foster parents and overpay others.
Instead, it is the strong recommendation of the project partners that foster parents should be reimbursed for the actual cost of their transportation related to visitation, which may include expenses related to car transport, taxi, subway, bus, etc. For mileage, the project partners recommend use of the U.S. General Service Administration’s mileage reimbursement rate which is currently .485 cents per mile.liii
It should be noted that the Foster Care MARC also excludes the costs of travel to administrative case/judicial reviews or to medical visits (beyond routine medical visits). These expenses are also variable and in addition, are not reimbursable under the Title IV‐E Maintenance program, which provided the framework for the calculation of the Foster Care MARC. However, these costs are reimbursable under other federal funding mechanisms, including the Title IV‐E Administration Program and the Title XIX Medicaid Program. Foster parents should be reimbursed for their actual expenses on these activities, in addition to the Foster Care MARC, and states should access these other federal funding sources as appropriate.
Finally, it should be noted that general travel costs associated with daily provision of basic care to a child is included in the Foster Care MARC under the personal incidentals expense category.
Table 4 presents a summary of the USDHHS guidelines, the USDA cost categories, an outline of the expenditure categories that were matched to each of the eight USDHHS cost categories, the specific CES variables and their definitions and the adjustments made to the cost estimates to account for the particular needs of children in foster care, based on the McHugh study.

Table 4: Cost Categories: Guidelines and Cost Calculations
USDHHS Cost
Category
Federal Guidelines (Child Welfare Policy Manual) USDA
Expenditure Category Included in CES Data
Analysis
Variables Included in Estimate
Variable Definition Adjustment to
category based on McHugh (2002)
Food No guidelines Food, nonalcoholic beverages purchased at grocery, convenience and specialty stores including purchases with food stamps, dining at restaurants, household expenditures on school meals
Food FOODCQ, FOODPQ
FOODCQ=TOTAL FOOD THIS QUARTER FOODPQ=TOTAL FOOD LAST QUARTER
Increased by 10%
Clothing BOYFIFCQ, BOYFIFPQ, GRLFIFCQ, GRLFIFPQ, CHLDRNCQ, CHLDRNPQ, CLOTHXB, CLOTHYB, CLOTHXA, CLOTHYA
coats, jackets, snowsuits and furs, sweaters, sweater sets and vests, shirts, blouses, rompers, underwear, undergarments, diapers, sleepwear/loungewear, hosiery, accessories, suites, sport coats, tailored jackets and vests, pants, skirts, culottes, shorts and shorts sets, (excluding athletic footwear), dresses, active sportswear
Increased by 100% for wear and tear
Coin-operated laundry JLDRYNET Costs for coin-operated laundry or dry cleaning machines for clothing items
Increased by 50% for wear and tear
Clothing No guidelines Diapers, shirts, pants, dresses, suits, footwear, clothing services: dry cleaning, alterations, repair storage
Dry Cleaning JDRYCNET Costs for services at dry cleaners or laundry for clothing items
No adjustment
Utilities UTILCQ, UTILPQ
UTILPQ= Utilities, fuels and public services last quarter; NTLGASPQ (natural gas) + ELCTRCPQ (electricity) + ALLFULPQ (fuel oil and other fuels) + TELEPHPQ (telephone services) + WATRPSPQ (water and other public services); UTILCQ=Utilities, fuels and public services this quarter; Same composition as above
Increased by 50% Shelter No guidelines Shelter (mortgage interest, property taxes, or rent; maintenance and repairs; and insurance), utilities (gas, electricity, fuel, telephone and water), house furnishings and equipment (furniture, floor coverings and major and small appliances)
Furniture and linens FURNPURX Selected furnishings from file specific to furnishings (bedroom linens, bathroom linens, kitchen and living room linens and other linens)
Increased by 100% for wear and tear
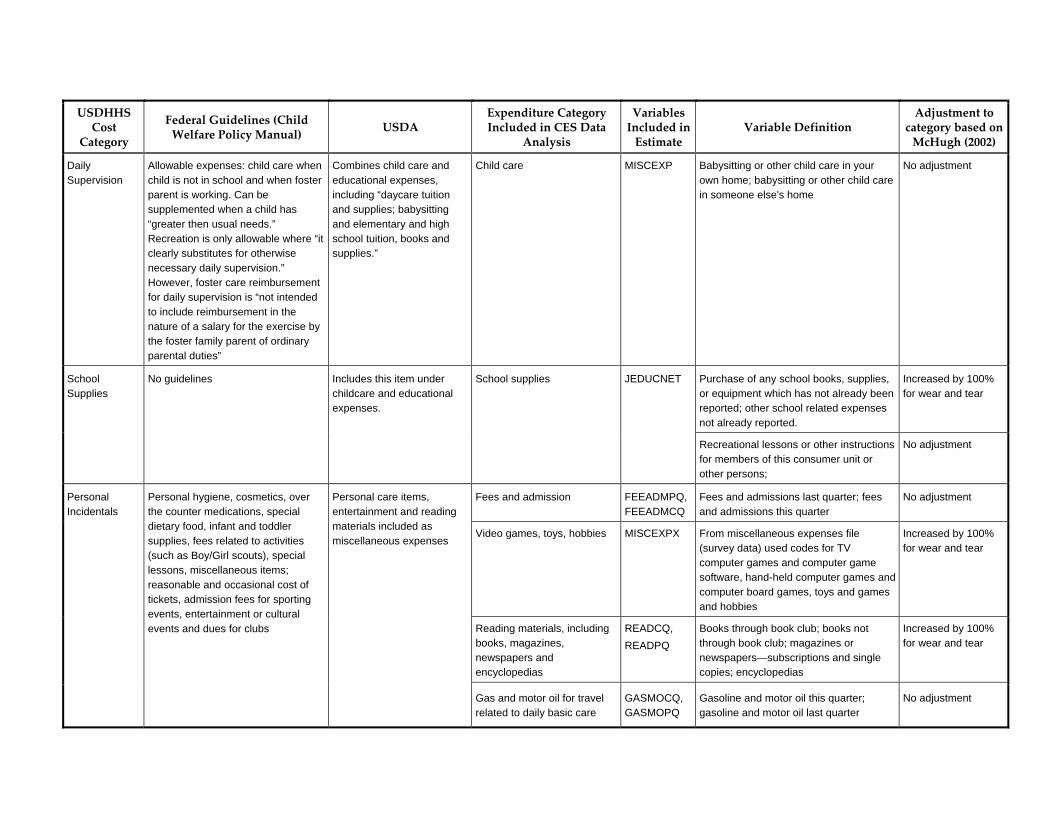
USDHHS Cost
Category
Federal Guidelines (Child Welfare Policy Manual) USDA
Expenditure Category Included in CES Data
Analysis
Variables Included in Estimate
Variable Definition Adjustment to
category based on McHugh (2002)
Daily Supervision
Allowable expenses: child care when child is not in school and when foster parent is working. Can be supplemented when a child has “greater then usual needs.” Recreation is only allowable where “it clearly substitutes for otherwise necessary daily supervision.” However, foster care reimbursement for daily supervision is “not intended to include reimbursement in the nature of a salary for the exercise by the foster family parent of ordinary parental duties”
Combines child care and educational expenses, including “daycare tuition and supplies; babysitting and elementary and high school tuition, books and supplies.”
Child care MISCEXP Babysitting or other child care in your own home; babysitting or other child care in someone else's home
No adjustment
Purchase of any school books, supplies, or equipment which has not already been reported; other school related expenses not already reported.
Increased by 100% for wear and tear
School Supplies
No guidelines Includes this item under childcare and educational expenses.
School supplies JEDUCNET
Recreational lessons or other instructions for members of this consumer unit or other persons;
No adjustment
Fees and admission FEEADMPQ, FEEADMCQ
Fees and admissions last quarter; fees and admissions this quarter
No adjustment
Video games, toys, hobbies MISCEXPX From miscellaneous expenses file (survey data) used codes for TV computer games and computer game software, hand-held computer games and computer board games, toys and games and hobbies
Increased by 100% for wear and tear
Reading materials, including books, magazines, newspapers and encyclopedias
READCQ, READPQ
Books through book club; books not through book club; magazines or newspapers—subscriptions and single copies; encyclopedias
Increased by 100% for wear and tear
Personal Incidentals
Personal hygiene, cosmetics, over the counter medications, special dietary food, infant and toddler supplies, fees related to activities (such as Boy/Girl scouts), special lessons, miscellaneous items; reasonable and occasional cost of tickets, admission fees for sporting events, entertainment or cultural events and dues for clubs
Personal care items, entertainment and reading materials included as miscellaneous expenses
Gas and motor oil for travel related to daily basic care
GASMOCQ, GASMOPQ
Gasoline and motor oil this quarter; gasoline and motor oil last quarter
No adjustment
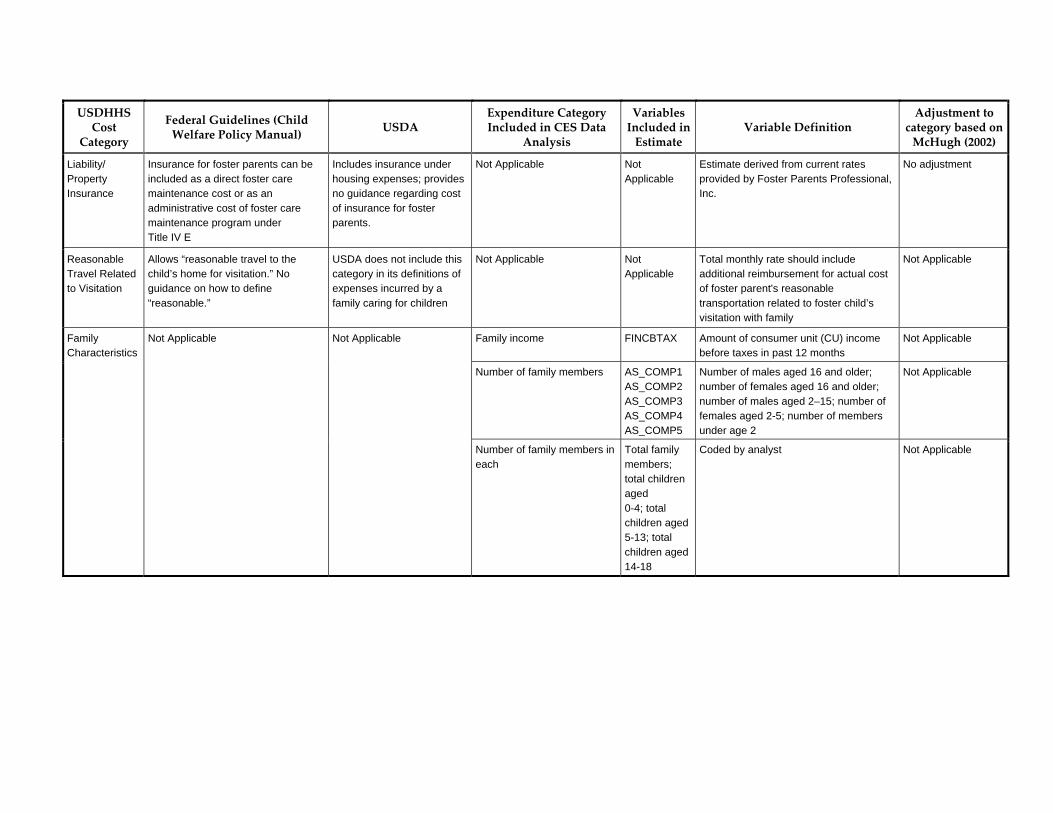
USDHHS Cost
Category
Federal Guidelines (Child Welfare Policy Manual) USDA
Expenditure Category Included in CES Data
Analysis
Variables Included in Estimate
Variable Definition Adjustment to
category based on McHugh (2002)
Liability/ Property Insurance
Insurance for foster parents can be included as a direct foster care maintenance cost or as an administrative cost of foster care maintenance program under Title IV E
Includes insurance under housing expenses; provides no guidance regarding cost of insurance for foster parents.
Not Applicable Not Applicable
Estimate derived from current rates provided by Foster Parents Professional, Inc.
No adjustment
Reasonable Travel Related to Visitation
Allows “reasonable travel to the child’s home for visitation.” No guidance on how to define “reasonable.”
USDA does not include this category in its definitions of expenses incurred by a family caring for children
Not Applicable Not Applicable
Total monthly rate should include additional reimbursement for actual cost of foster parent's reasonable transportation related to foster child’s visitation with family
Not Applicable
Family income FINCBTAX Amount of consumer unit (CU) income before taxes in past 12 months
Not Applicable
Number of family members AS_COMP1 AS_COMP2 AS_COMP3 AS_COMP4 AS_COMP5
Number of males aged 16 and older; number of females aged 16 and older; number of males aged 2–15; number of females aged 2-5; number of members under age 2
Not Applicable
Family Characteristics
Not Applicable Not Applicable
Number of family members in each
Total family members; total children aged 0-4; total children aged 5-13; total children aged 14-18
Coded by analyst Not Applicable

Hitting the MARC: Establishing Foster Care Minimum Adequate Rates for Children
Results
The national average of the Foster Care MARC is $629 per month for 2‐year‐olds, $721 per month for 9‐year‐olds and $790 per month for 16‐year‐olds.25 When adjusting for cost of living differences among states, the Foster Care MARC ranges from $555 to $766 for the 2‐year‐old age group, from $636 to $878 for the 9‐year‐old age group and from $697 to $962 for the 16‐year‐old age group. Massachusetts has the highest Foster Care MARC and Mississippi has the lowest, as a result of their respective state cost‐of‐living adjustments. The Foster Care MARC is significantly higher than current national average rates which are $488, $509 and $568 per month, respectively, for the three age groups.
As described above, it should be noted that the Foster Care MARC does not include the cost of transporting a child to visit with his/her biological family or the cost of full‐time child care for working foster parents. Given the variability in these expenditures from case to case, states and localities should reimburse foster parents for their actual expenditures, in addition to the Foster Care MARC. It should also be noted that the Foster Care MARC does not include expenses that are not reimbursable to states under the federal Title IV‐E Maintenance program, notably, the cost of travel to administrative and judicial reviews and health care appointments. These costs are partially reimbursable to states via other federal funding mechanisms, including Title IV‐E Administration and Title XIX Medicaid. Here again, states should reimburse foster parents for their actual expenses, in addition to the Foster Care MARC and take advantage of available federal funding for these purposes.
The sections below and Tables 5 and 6 provide additional detail about each of the cost categories within the Foster Care MARC and the costs of living adjustments that were made in order to develop rates for the 50 states and the District of Columbia.
25 The Foster Care MARC was calculated for children ages birth‐4, 5‐13 and 14‐18. States typically report their foster
care rates for children ages 2, 9 and 16, which are the mid‐points of the age categories used for this project.
32

Results
33
Cost Categories
Food
The food category of the Foster Care MARC reflects the expenditures of a middle‐income family on food for their children. Annual food expenditures per child are highest for 14‐18 year‐olds ($2,666 national average) and lowest for infants and young children aged birth‐4 ($2,143 national average). When adjusting for cost of living differences these annual numbers at the state level range from $1,892 to $2,610 for the birth‐4 age group, from $2,095 to $2,891 for the 5‐13 age group and from $2,353 to $3,247 for the 14‐18 age group.
The cost estimates reflect changing costs as children age. Average monthly food costs range from $178 per month for the youngest children to $222 per month for the oldest children. This means that the estimated expenditures break down to approximately $6 a day for the youngest child to $7 a day for the oldest child. It is difficult to imagine that policy makers would expect that foster parents could meet the nutritional needs of children for less than these amounts.
Clothing
The clothing category of the Foster Care MARC includes expenses for clothing items, coin operated laundry and dry cleaning. Annual clothing expenditures include $923 for children aged birth‐4, $931 for children aged 5‐13 and $1,114 for youth aged 14‐18. When adjusting for cost of living, these annual numbers at the state level range from $815 to $1,125 for the birth‐4 age group, from $821 to $1,133 for the 5‐13 age group and from $983 to $1,357 for the 14‐18 age group. On a monthly basis, the national average expenditures for clothing range from $77 for a child age 4 or under, to $78 for a child between the ages of 5 and 13, to $93 a month for children age 14 and older.
The clothing category in the Foster Care MARC reflects expenditures of a middle‐income family on clothing items, coin operated laundry and dry cleaning; all three of these columns are added together to arrive at the total estimated expenditures for the clothing category. The cost estimates in this category follow a similar pattern of being the highest (on average) for 14‐18 year‐olds. These clothing expenditure estimates, which range from $923 to $1,114 annually, are very reasonable. Cost of living adjustments accommodate regional differences overall; however, they may not totally make up for the expected increases in expense for clothing in colder climates. Policy makers from states where warmer clothing is essential to meet the basic needs of children and youth (e.g., heavy coats, sweaters, boots, etc.) may want to consider further adjustments to these clothing estimates.
As noted above, the clothing estimates included in the Foster Care MARC assume that a child already has some clothing for daily living and that states provide a separate clothing allowance if necessary when a child is placed in a foster home or transferred from one home to another home with no clothes beyond what they are wearing.

Hitting the MARC: Establishing Foster Care Minimum Adequate Rates for Children
Shelter
The shelter category of the Foster Care MARC reflects the expenditures of a middle income family on utilities, furniture and linens. Utility costs increase with the age of the child. The national averages for the entire shelter category are $2,202 for birth‐4 year‐olds, $2,294 for 5‐13 year‐olds and $2,480 for 14‐18 year‐olds. When adjusting for cost of living differences at the state level, estimates range from $1,944 to $2,682 for the birth‐4 age group, from $2,024 to $2,794 for the 5‐13 age group and from $2,189 to $3,020 for the 14‐18 age group.
On a monthly basis, the average expenditures for shelter at the national level range from $184 for a child under the age of 4, to $191 for a child between the ages of 5 and 13 and $207 for a child 14 years or older.
Daily Supervision
The daily supervision category of the Foster Care MARC reflects the expenditures of a middle‐income family on occasional baby sitting or other child care in the home or in the home of someone else and one week of residential summer camp for ages 5‐18. The national average is $217 annually for children aged birth‐4 and $709 for those aged 5‐13 and 14‐18. When adjusting for cost‐of‐living differences between states, these numbers at the state level range from $191 to $264 for the birth‐4 age group and from $626 to $864 for both the 5‐13 and the 14‐18 age groups. On a monthly basis, the average expenditures for daily supervision range from $18 a month for a child age 4 and under and $10 a month, plus $590 for one week of summer camp for children and youth age 5 and over.
It should be noted that the Foster Care MARC does not include the expenses of full‐time child care for working foster parents. The project partners take the position that this expense should be reimbursed based on the actual costs incurred by the foster family, in addition to the Foster Care MARC.
School Supplies
The school supplies category of the Foster Care MARC reflects the expenditures of middle‐income families on books, recreational lessons and other school supplies. Not surprisingly, expenditures for children ages birth‐4 are very limited ($34). The children aged 5‐13 also have limited expenditures ($108 annually). The highest expenditures are for youth aged 14‐18 ($135 annually). When adjusting for cost‐of‐living differences, these numbers at the state level range from $30 to $41 for the birth‐4 age group, from $95 to $132 for the 5‐13 age group and from $119 to $164 for the 14‐18 age groups.
On a monthly basis, these estimates amount to less than $3 for a child age 4 and under, $9 for a child between the ages of 5 and 13 and $11 for a child age 14 or older. While there are times of the year when these expenses are greater (e.g., the beginning of a school year), children enter care throughout the year and the maintenance of sufficient supplies throughout the year seems reasonable for these average estimates.
34

Results
35
Personal Incidentals The personal incidentals category of the Foster Care MARC reflects the expenditures of middle‐income families on reading materials, videos, toys and hobbies, gas and motor oil (for other allowable activities, not travel for visitation to the child’s family), fees and admissions and an additional 15 percent of other costs to reflect the cost of personal hygiene items, over the counter medication and other miscellaneous items. National averages by age include $1,928 for children aged birth‐4, $2,134 for children aged 5‐13 and $2,278 for youth aged 14‐18. When adjusting for cost of living differences between states, these numbers at the state level range from $1,702 to $2,348 for the birth‐4 age group, from $1,884 to $2,600 for the 5‐13 age group and from $2,010 to $2,774 for the 14‐18 age group. On a monthly basis, this represents approximately $161 for a child age 4 or under, $178 for a child between the ages of 5 and 13 and $190 for a child age 14 or older.
Liability and Property Insurance The insurance category of the Foster Care MARC includes the cost of purchasing liability and property insurance, based on estimates from Foster Parent Professionals, Inc., an insurance company that provides this type of insurance. The rate that is estimated for all ages for the U.S. national average is $99 annually or approximately $8 per month.
An appropriate estimate of the cost of liability insurance coverage for foster parents could not be derived from the CES data. As insurance products vary from state to state, developing an accurate estimate of cost was challenging. As discussed above, various states have policies regarding liability coverage for children in foster care (e.g., self‐insurance by the state); however, there is no consistent policy and very few instances in which a precise premium price could be ascertained. The estimate of the cost of liability insurance and property damage for this study came from Foster Parent Professionals, Inc. The combined annual cost estimate of liability insurance and property damage coverage ranges from $87 to $121 after cost of living adjustments with a national average cost of $99. If states reimburse foster parents for liability insurance expenditures separately from the basic maintenance rate or pay directly for this coverage, the average estimated rate may be decreased accordingly.
The cost of providing both property and liability insurance to foster parents was included in the Foster Care MARC since it is an expense incurred by foster parents. However, the project partners take the position that this function should actually be handled by the child welfare system, rather than requiring foster parents to purchase insurance on their own in the private market.
Reasonable Travel to the Child’s Home for Visitation As noted above, the Foster Care MARC does not include the cost of transporting a child to visit with his or her biological family. Given the variability in these expenditures from case to case, states and localities should reimburse foster parents based on their actual expenditures, in addition to the Foster Care MARC.
The Foster Care MARC also excludes the costs of travel to administrative case and judicial reviews or to medical visits (beyond routine medical visits). These expenses are also variable and, in

Hitting the MARC: Establishing Foster Care Minimum Adequate Rates for Children
addition, are not reimbursable under the Title IV‐E Maintenance program, which provided the framework for the calculation of the Foster Care MARC. However, these travel costs are reimbursable under other federal funding mechanisms, including Title IV‐E Administration and Title XIX Medicaid. States should reimburse foster parents for their actual travel expenses for these purposes and pursue available federal funding to support these expenses.
Travel costs incurred by foster parents associated with the daily provision of basic care to a child (i.e., general travel not specific to visitation) are included in the personal incidental portion of the Foster Care MARC.
Total Monthly Cost Estimates Table 5 below presents the monthly average costs for each of the eight expense categories.
Table 5: Monthly Cost Estimates
National Average: Foster Care MARC Cost Category
Ages Birth‐4 Ages 5‐13 Ages 14‐18
Food $179 $198 $222 Shelter $184 $191 $207 School Supplies $3 $9 $11 Daily Supervision $18 $59 $59 Clothing $77 $78 $93 Personal Incidentals $161 $178 $190 Liability Insurance $8 $8 $8 Total Monthly Costs $629 $721 $790
State‐Based Cost‐of‐Living Adjustments Costs of care in each of the reimbursable categories were adjusted to specifically reflect geographical differences. The costs for the 48 contiguous United States were calculated based on the state cost‐of‐living indices for 2003 developed by the Inter‐University Consortium for Political and Social Research.liv Adjustments for Hawaii, Alaska and the District of Columbia were not available, and therefore the U.S. average was used for these three jurisdictions. These relative costs‐of‐living were applied to the inflation‐adjusted amounts that were used in the analyses.
Table 6 on the following pages presents the annual cost estimates for each of the eight expense categories for the 50 states and the District of Columbia. Table 7 presents the total annual and monthly expenditures per child inflation‐adjusted for 2006, for the age groups specified, as a national average and for individual states and the District of Columbia. The monthly rates shown in Table 7 represent the Foster Care Minimum Adequate Rates for Children (Foster Care MARC) that states should adopt. States may choose to reimburse foster parents at higher rates in consideration of factors that were not possible to consider in these analyses.
36
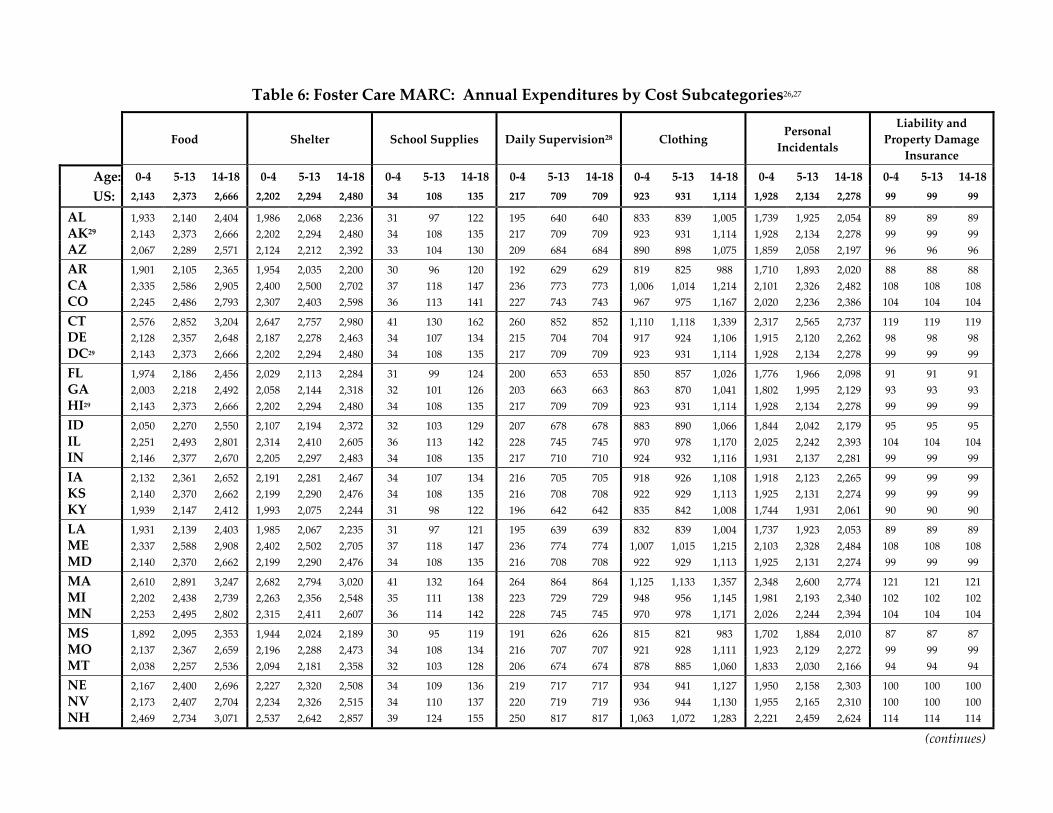
Table 6: Foster Care MARC: Annual Expenditures by Cost Subcategories26,27
Food Shelter School Supplies Daily Supervision28 Clothing Personal Incidentals
Liability and Property Damage
Insurance
Age: 0‐4 5‐13 14‐18 0‐4 5‐13 14‐18 0‐4 5‐13 14‐18 0‐4 5‐13 14‐18 0‐4 5‐13 14‐18 0‐4 5‐13 14‐18 0‐4 5‐13 14‐18 US: 2,143 2,373 2,666 2,202 2,294 2,480 34 108 135 217 709 709 923 931 1,114 1,928 2,134 2,278 99 99 99
AL 1,933 2,140 2,404 1,986 2,068 2,236 31 97 122 195 640 640 833 839 1,005 1,739 1,925 2,054 89 89 89 AK29 2,143 2,373 2,666 2,202 2,294 2,480 34 108 135 217 709 709 923 931 1,114 1,928 2,134 2,278 99 99 99 AZ 2,067 2,289 2,571 2,124 2,212 2,392 33 104 130 209 684 684 890 898 1,075 1,859 2,058 2,197 96 96 96
AR 1,901 2,105 2,365 1,954 2,035 2,200 30 96 120 192 629 629 819 825 988 1,710 1,893 2,020 88 88 88 CA 2,335 2,586 2,905 2,400 2,500 2,702 37 118 147 236 773 773 1,006 1,014 1,214 2,101 2,326 2,482 108 108 108 CO 2,245 2,486 2,793 2,307 2,403 2,598 36 113 141 227 743 743 967 975 1,167 2,020 2,236 2,386 104 104 104
CT 2,576 2,852 3,204 2,647 2,757 2,980 41 130 162 260 852 852 1,110 1,118 1,339 2,317 2,565 2,737 119 119 119 DE 2,128 2,357 2,648 2,187 2,278 2,463 34 107 134 215 704 704 917 924 1,106 1,915 2,120 2,262 98 98 98 DC29 2,143 2,373 2,666 2,202 2,294 2,480 34 108 135 217 709 709 923 931 1,114 1,928 2,134 2,278 99 99 99
FL 1,974 2,186 2,456 2,029 2,113 2,284 31 99 124 200 653 653 850 857 1,026 1,776 1,966 2,098 91 91 91 GA 2,003 2,218 2,492 2,058 2,144 2,318 32 101 126 203 663 663 863 870 1,041 1,802 1,995 2,129 93 93 93 HI29 2,143 2,373 2,666 2,202 2,294 2,480 34 108 135 217 709 709 923 931 1,114 1,928 2,134 2,278 99 99 99
ID 2,050 2,270 2,550 2,107 2,194 2,372 32 103 129 207 678 678 883 890 1,066 1,844 2,042 2,179 95 95 95 IL 2,251 2,493 2,801 2,314 2,410 2,605 36 113 142 228 745 745 970 978 1,170 2,025 2,242 2,393 104 104 104 IN 2,146 2,377 2,670 2,205 2,297 2,483 34 108 135 217 710 710 924 932 1,116 1,931 2,137 2,281 99 99 99
IA 2,132 2,361 2,652 2,191 2,281 2,467 34 107 134 216 705 705 918 926 1,108 1,918 2,123 2,265 99 99 99 KS 2,140 2,370 2,662 2,199 2,290 2,476 34 108 135 216 708 708 922 929 1,113 1,925 2,131 2,274 99 99 99 KY 1,939 2,147 2,412 1,993 2,075 2,244 31 98 122 196 642 642 835 842 1,008 1,744 1,931 2,061 90 90 90
LA 1,931 2,139 2,403 1,985 2,067 2,235 31 97 121 195 639 639 832 839 1,004 1,737 1,923 2,053 89 89 89 ME 2,337 2,588 2,908 2,402 2,502 2,705 37 118 147 236 774 774 1,007 1,015 1,215 2,103 2,328 2,484 108 108 108 MD 2,140 2,370 2,662 2,199 2,290 2,476 34 108 135 216 708 708 922 929 1,113 1,925 2,131 2,274 99 99 99
MA 2,610 2,891 3,247 2,682 2,794 3,020 41 132 164 264 864 864 1,125 1,133 1,357 2,348 2,600 2,774 121 121 121 MI 2,202 2,438 2,739 2,263 2,356 2,548 35 111 138 223 729 729 948 956 1,145 1,981 2,193 2,340 102 102 102 MN 2,253 2,495 2,802 2,315 2,411 2,607 36 114 142 228 745 745 970 978 1,171 2,026 2,244 2,394 104 104 104
MS 1,892 2,095 2,353 1,944 2,024 2,189 30 95 119 191 626 626 815 821 983 1,702 1,884 2,010 87 87 87 MO 2,137 2,367 2,659 2,196 2,288 2,473 34 108 134 216 707 707 921 928 1,111 1,923 2,129 2,272 99 99 99 MT 2,038 2,257 2,536 2,094 2,181 2,358 32 103 128 206 674 674 878 885 1,060 1,833 2,030 2,166 94 94 94
NE 2,167 2,400 2,696 2,227 2,320 2,508 34 109 136 219 717 717 934 941 1,127 1,950 2,158 2,303 100 100 100 NV 2,173 2,407 2,704 2,234 2,326 2,515 34 110 137 220 719 719 936 944 1,130 1,955 2,165 2,310 100 100 100 NH 2,469 2,734 3,071 2,537 2,642 2,857 39 124 155 250 817 817 1,063 1,072 1,283 2,221 2,459 2,624 114 114 114
(continues)

Food Shelter School Supplies Daily Supervision28 Clothing Personal Incidentals
Liability and Property Damage
Insurance
Age: 0‐4 5‐13 14‐18 0‐4 5‐13 14‐18 0‐4 5‐13 14‐18 0‐4 5‐13 14‐18 0‐4 5‐13 14‐18 0‐4 5‐13 14‐18 0‐4 5‐13 14‐18 US: 2,143 2,373 2,666 2,202 2,294 2,480 34 108 135 217 709 709 923 931 1,114 1,928 2,134 2,278 99 99 99
NJ 2,558 2,832 3,182 2,628 2,737 2,960 40 129 161 259 846 846 1,102 1,111 1,330 2,301 2,547 2,718 118 118 118 NM 2,046 2,266 2,545 2,103 2,190 2,368 32 103 129 207 677 677 881 888 1,064 1,841 2,038 2,175 95 95 95 NY 2,456 2,720 3,056 2,524 2,629 2,842 39 124 154 248 813 813 1,058 1,067 1,277 2,210 2,446 2,611 114 114 114
NC 2,147 2,378 2,671 2,207 2,298 2,485 34 108 135 217 711 711 925 932 1,116 1,932 2,138 2,282 99 99 99 ND 1,991 2,204 2,476 2,046 2,131 2,303 32 100 125 201 659 659 858 864 1,035 1,791 1,983 2,116 92 92 92 OH 2,162 2,395 2,690 2,222 2,314 2,502 34 109 136 219 716 716 932 939 1,124 1,945 2,154 2,298 100 100 100
OK 1,900 2,104 2,363 1,952 2,033 2,198 30 96 119 192 629 629 818 825 988 1,709 1,892 2,019 88 88 88 OR 2,187 2,422 2,720 2,247 2,340 2,530 35 110 138 221 724 724 942 950 1,137 1,967 2,178 2,324 101 101 101 PA 2,288 2,534 2,847 2,352 2,449 2,648 36 115 144 231 757 757 986 994 1,190 2,058 2,279 2,432 106 106 106
RI 2,462 2,727 3,063 2,530 2,635 2,849 39 124 155 249 815 815 1,061 1,069 1,280 2,215 2,452 2,617 114 114 114 SC 1,961 2,172 2,440 2,016 2,099 2,270 31 99 123 198 649 649 845 852 1,020 1,764 1,953 2,085 91 91 91 SD 2,158 2,389 2,684 2,217 2,309 2,497 34 109 136 218 714 714 929 937 1,122 1,941 2,149 2,293 100 100 100
TN 1,957 2,168 2,435 2,012 2,095 2,265 31 99 123 198 648 648 843 850 1,018 1,761 1,949 2,080 90 90 90 TX 1,898 2,102 2,362 1,951 2,032 2,197 30 96 119 192 628 628 818 824 987 1,708 1,891 2,018 88 88 88 UT 2,159 2,391 2,686 2,219 2,311 2,498 34 109 136 218 715 715 930 938 1,122 1,942 2,150 2,295 100 100 100
VT 2,404 2,662 2,990 2,470 2,573 2,782 38 121 151 243 796 796 1,036 1,044 1,250 2,162 2,394 2,555 111 111 111 VA 2,063 2,284 2,566 2,120 2,208 2,387 33 104 130 209 683 683 889 896 1,072 1,855 2,054 2,192 95 95 95 WA 2,240 2,480 2,786 2,302 2,397 2,592 35 113 141 227 741 741 965 973 1,164 2,015 2,231 2,380 104 104 104
WV 1,912 2,117 2,378 1,964 2,046 2,212 30 96 120 193 633 633 824 830 994 1,720 1,904 2,032 88 88 88 WI 2,209 2,446 2,748 2,270 2,364 2,556 35 111 139 223 731 731 952 959 1,148 1,987 2,200 2,347 102 102 102 WY 2,071 2,293 2,576 2,128 2,217 2,396 33 104 130 209 685 685 892 899 1,077 1,863 2,063 2,201 96 96 96
26 The costs of travel to a child’s family for visitation, administrative reviews, court reviews and medical visits (beyond routine visits) are not included in these rates.
Foster parents should be reimbursed for their actual expenditures on these activities, in addition to the Foster Care MARC. 27 Estimates are inflation‐adjusted to 2006. 28 Daily supervision in these rates does not include regular day care for the working foster parent. Foster parents should be reimbursed for their actual costs for this
expense, in addition to the Foster Care MARC.
29 Since there was no cost‐of‐living adjustment available for Alaska, the District of Columbia and Hawaii, the Foster Care MARC reported here for these jurisdictions is the national average Foster Care MARC.

Results
Table 7: Annual and Monthly Foster Care MARC30, 31
Note: The Foster Care MARC does not include travel and child care expenses. Foster parents should be reimbursed for their
actual expenses for these activities, in addition to the Foster Care MARC.
Annual Total Foster Care MARC Monthly Total Foster Care MARC Child’s Age: 0‐4 5‐13 14‐18 0‐4 5‐13 14‐18 US Average: 7,46 8,48 9,80 629 721 790 AL 6,805 7,799 8,550 567 650 712 AK32 7,546 8,648 9,480 629 721 790 AZ 7,278 8,341 9,144 606 695 762 AR 6,694 7,671 8,410 558 639 701 CA 8,223 9,424 10,332 685 785 861 CO 7,905 9,060 9,932 659 755 828 CT 9,069 10,394 11,394 756 866 950 DE 7,494 8,589 9,416 625 716 785 DC 7,546 8,648 9,480 629 721 790 FL 6,951 7,966 8,733 579 664 728 GA 7,053 8,082 8,861 588 674 738 HI 7,546 8,648 9,480 629 721 790 ID 7,218 8,272 9,069 602 689 756 IL 7,928 9,086 9,960 661 757 830 IN 7,557 8,660 9,494 630 722 791 IA 7,506 8,602 9,430 626 717 786 KS 7,535 8,636 9,467 628 720 789 KY 6,828 7,825 8,578 569 652 715 LA 6,801 7,794 8,544 567 649 712 ME 8,230 9,432 10,340 686 786 862 MD 7,535 8,636 9,467 628 720 789 MA 9,191 10,534 11,548 766 878 962 MI 7,752 8,884 9,740 646 740 812 MN 7,932 9,091 9,966 661 758 830 MS 6,661 7,633 8,368 555 636 697 MO 7,526 8,625 9,455 627 719 788 MT 7,177 8,225 9,016 598 685 751 NE 7,631 8,746 9,588 636 729 799 (continues)
39

Hitting the MARC: Establishing Foster Care Minimum Rates for Children
Annual Total Foster Care MARC Monthly Total Foster Care MARC Child’s Age: 0‐4 5‐13 14‐18 0‐4 5‐13 14‐18 US Average: 7,46 8,48 9,80 629 721 790 NV 7,653 8,771 9,615 638 731 801 NH 8,693 9,962 10,921 724 830 910 NJ 9,006 10,321 11,315 751 860 943 NM 7,205 8,257 9,052 600 688 754 NY 8,649 9,912 10,866 721 826 906 NC 7,561 8,665 9,499 630 722 792 ND 7,009 8,033 8,806 584 669 734 OH 7,614 8,726 9,566 635 727 797 OK 6,689 7,666 8,404 557 639 700 OR 7,700 8,824 9,674 642 735 806 PA 8,058 9,234 10,123 671 770 844 RI 8,671 9,937 10,893 723 828 908 SC 6,906 7,915 8,677 576 660 723 SD 7,597 8,707 9,545 633 726 795 TN 6,893 7,899 8,660 574 658 722 TX 6,685 7,661 8,399 557 638 700 UT 7,603 8,713 9,552 634 726 796 VT 8,464 9,700 10,634 705 808 886 VA 7,263 8,323 9,125 605 694 760 WA 7,887 9,038 9,909 657 753 826 WV 6,731 7,714 8,457 561 643 705 WI 7,778 8,913 9,771 648 743 814 WY 7,292 8,357 9,162 608 696 763
30 The Foster Care MARC does not include the cost of transporting a child to visit with his or her biological family
or the cost of full‐time child care for working foster parents. Given the variability in these expenditures from case to case, states or localities should reimburse foster parents based on their actual expenditures, in addition to the Foster Care MARC. The Foster Care MARC also excludes the cost of travel to administrative and judicial reviews and health care appointments. These expenses are also variable and are not reimbursable to states under the federal Title IV‐E maintenance program, which provided the framework for the calculation of the Foster Care MARC. However these costs are reimbursable under other federal funding mechanisms, such as Title IV‐E Administration and Title XIX Medicaid. States should reimburse foster parents for their actual travel expenses for these purposes.
31 Estimates are inflation‐adjusted to 2006. 32 Since there was no cost‐of‐living adjustment available for Alaska, the District of Columbia and Hawaii, the
Foster Care MARC reported for these states and DC is the national average Foster Care MARC.
40

Conclusion
41
Conclusion
The purpose of this study was to establish foster care minimum adequate rates for children based on economic models that take into account the federally allowable costs in connection with caring for children in foster care. The results indicate that, on average nationally, current foster care rates must be raised by 36% in order to reach the Foster Care MARC.
At any given time, more than a half a million children are in foster care and almost three quarters of these children are placed in family foster homes. State and local child welfare systems are obligated by federal law to provide payments to foster parents to “cover” the expenses of caring for these children.
There is evidence that inadequate foster care rates negatively impact foster parent recruitment and retention, which can set off a chain reaction of negative consequences for children. When a child welfare system cannot maintain an adequate pool of foster homes, children may be more likely to be placed in institutional settings or shuttled from foster placement to placement, an unstable situation that may decrease their chances of ever having a permanent home.
The Foster Care MARC should be quickly adopted by states and localities across the nation. These rates should be applied regardless of whether foster homes are directly supervised by the public child welfare agency or by private providers under contract with the public agency. Therapeutic foster care and adoptions subsidy rates should also be informed by the Foster Care MARC and adjusted accordingly. In addition, the federal government should improve the inadequate system of foster care payment by establishing minimum allowable foster care rates and requiring annual cost‐of‐living adjustments to those rates. As a first step to achieving this goal, the federal government should require states to submit their methodology for calculating foster care rates as part of their foster care state plans, which are subject to federal approval. Finally, the federal government must strengthen its own commitment to foster care funding.
Certainly, low foster care rates are not the only factor impacting foster parent recruitment and retention, the well‐being of children in foster care and children’s chances of growing up in a permanent home. They are one of a number of significant systemic problems—for example, high caseworker caseloads—that may contribute to poor life outcomes for these children and which must be addressed. In addition, it is critical that adequate funding and services are available to strengthen families and prevent children from entering foster care in the first place. However, when children cannot remain safely at home and do enter foster care, they must receive appropriate care, which requires adequate foster care rates.

Hitting the MARC: Establishing Foster Care Minimum Adequate Rates for Children
By establishing foster care rates that cover actual costs, children can receive necessary care and have happier and more normal childhoods, child welfare systems may be better able to maintain a stable pool of foster parents and children can have better chances of growing up in permanent families.
42

References
References
i U.S. Department of Health and Human Services, Administration for Children and Families, Children’s Bureau.
(2006). AFCARS report: Preliminary FY2005 estimates as of September 2006. Retrieved May 25, 2007, from .http://www.acf.hhs.gov/programs/cb/stats_research/afcars/tar/report13.htm
ii Murray, K.O. (undated). The child welfare financing structure. Retrieved May 26, 2007, from http://pewfostercare. org/research/docs/MurrayPaper2.pdf; Scarcella, C.A. Bess, R., Zielwski, E., & Geen, R. (2006). The cost of protecting vulnerable children V: Understanding state variation in child welfare financing. Washington, DC: The Urban Institute; U.S. Department of Health and Human Services, Office of the Assistant Secretary for Planning and Evaluation. (2005). Federal foster care financing: How and why the current funding structure fails to meet the needs of the child welfare field. Retrieved May 27, 2007, from: http://aspe.hhs.gov/hsp/05/fc‐financing‐ib/.
iii Social Security Act, as amended by the Child and Family Services Improvement Act, effective October 1, 2006, Section 472[42 U.S.C. 672].
iv U.S. Department of Health and Human Services, Office of the Assistant Secretary for Planning and Evaluation. (2005). Federal foster care financing: How and why the current funding structure fails to meet the needs of the child welfare field. Retrieved May 27, 2007, from: http://aspe.hhs.gov/hsp/05/fc‐financing‐ib/.
v Ibid. at 1.
Social Security Act, as amended by the Child and Family Services Improvement Act, effective October 1, 2006, Section 472
vi
[42 U.S.C. 672]; Section 475, 4A. [42 U.S.C. 675].
vii U.S. Department of Health and Human Services, Children’s Bureau. (2007). Child Welfare Policy Manual. Retrieved May 27, 2007, from http://www.acf.hhs.gov/j2ee/programs/cb/laws_policies/laws/cwpm/pdf/cwpmall. pdf at 160.
viii National Resource Center for Family Centered Practice and Permanency Planning. (2007). Foster care maintenance payments. Retrieved May 26, 2007, from http://www.hunter.cuny.edu/socwork/nrcfcpp/info_services/foster‐care.html.
ix Child and Family Services. (2007) Proposed new foster care rates effective January 1, 2007, Foster care rates effective January 1, 2006 – December 31, 2006. Washington, D.C.: author.
x Chamberlain, P. & Moreland, S. (1992). Enhanced services and stipends for foster parents: Effects on retention rates and outcomes for children. Child Welfare 75, 387‐402; Doyle J. & Peters E. (2003). The market for foster care: An empirical study of the impact of foster care subsidies. Retrieved May 14, 2007, from www.mit.edu/~jjdoyle/_web.pdf; Doyle, J. (2005). Can’t Buy Me Love? Subsidizing the care of related children. Cambridge, MA: MIT Sloan School of Management and NBER; U.S. Department of Health and Human Services, Office of Inspector General. (2002). Retaining foster parents. Washington, D.C.: author.
43
Hitting the MARC: Establishing Foster Care Minimum Adequate Rates for Children
U.S. Department of Health and Human Services, Office of Inspector General. (2002). Retaining foster parents. Washington, D.C.: author.
xi
Ibid. xii
xiii Lin, J. “Fewer families welcome foster kids: Reports blame state’s low reimbursement rates as cost of living rises” The Sacramento Bee, May 22, 2007; Garcia, E. “California’s foster parents demand a raise” San Jose Mercury News, May 23, 2007.
Child Welfare League of America, National Data Analysis System, Number of Children in Out‐of‐Home Care, for Years 2000‐2004. Retrieved June 18, 2007, from http://ndas.cwla.org/data_stats/access/predefined/Report .asp?ReportID=379.
xiv
Lin, J. “Fewer families welcome foster kids: Reports blame state’s low reimbursement rates as cost of living rises” The Sacramento Bee, May 22, 2007.
xv
xvi Haag, D. “Foster care program seeks help, homes.” The Shreveport Times, May 14, 2007.
xvii Associated Press. “State sees drop in number of foster homes.” Gazette Extra, June 12, 2007.
xviii US Department of Health and Human Services, Office of the Inspector General. (2002). Recruiting foster parents. Washington, DC.: author.
xix Rubin, D., OʹReilly, A., Luan, X., & Localio, A. R. (2007). The Impact of Placement Stability on Behavioral Well‐being for Children in Foster Care. Pediatrics, 119 (2), 336‐344; Sedlak, A. & Broadhurst, D., (1993) Study of Adoption Assistance Impact and Outcomes: Final Report. Washington D.C. Westat, Inc. Administration for Children and Families, United States Department of Health and Human Services.
xx Testa, M. (2003). Instability in Foster Care. Urbana‐Champaign: Children and Family Research Center, School of Social Work, University of Illinois.
xxi U.S. Department of Health and Human Services, Administration for Children and Families, Children’s Bureau. (2006). AFCARS report: Preliminary FY2005 estimates as of September 2006. Retrieved May 25, 2007, from http://www.acf.hhs.gov/programs/cb/stats_research/afcars/tar/report13.htm.
xxii Davis, I., Landsverk, J., Newton, R., & Ganger, W. (1996). Parental visiting and foster care reunification. Children and Youth Services Review, 18 (4/5), 363‐382.
xxiii Barth, R.P., Lee, C.K. Wildfire, J. & Guo, S. (2006) A comparison of the governmental costs of long‐term foster care and adoption. Social Service Review, 80 (1), 127‐158.
Denby, R., Rindfleisch, N., & Bean, G. (1999). Predictors of foster parents’ satisfaction and intent to continue to foster. Child Abuse & Neglect, 23 (3), 287‐303;
xxiv
Rhodes, K., Orme, J., & Buehler, C. (2001). A comparison of family foster parents who quit, consider quitting, and plan to continue fostering. Social Service Review, 75 (1), 85‐113; U.S. Department of Health and Human Services, Office of Inspector General. (2002). Retaining foster parents. Washington, D.C.: author.
National Resource Center for Family Centered Practice and Permanency Planning. (2007). Foster care maintenance payments. Retrieved May 26, 2007, from http://www.hunter.cuny.edu/socwork/nrcfcpp/info_services/foster‐care.html; National Association of Public Child Welfare Administrators. (2007). Basic Family Foster Care Maintenance Rates Survey: Summary of Findings. Survey conducted and report prepared by NAPCWA, for Childrenʹs Rights.
xxv
44
References
xxvi Lino, M. (2006). Expenditures on children by families, 2005. Washington D.C.: U.S. Department of Agriculture, Center for Nutrition Policy and Promotion. Retrieved May 27, 2007, from http://www.cnpp.usda.gov/ Publications/CRC/crc2005.pdf
National Association of Public Child Welfare Administrators. (2007). Basic Family Foster Care Maintenance Rates Survey: Summary of Findings. Survey conducted and report prepared by NAPCWA, for Childrenʹs Rights.
xxvii
Missouri Child Care Assʹn v. Martin, 241 F.Supp.2d 1032 (W.D.Mo. 2003). xxviii
Kenny A. v. Perdue , 218 F.R.D. 277, 303 (N.D. Ga. 2003).xxix
xxx Social Security Act, as amended by the Child and Family Services Improvement Act, effective October 1, 2006, Section 472[42 U.S.C. 672]; Section 475, 4A. [42 U.S.C. 675].
xxxi U.S. Department of Commerce, Census Bureau. (2007) Median Income for 4‐Person Families, by State. Retrieved September 11, 2007, from http://www.census.gov/hhes/www/income/4person.html.
xxxii McHugh, M. (2002). The costs of caring: A study of appropriate foster care payments for stable and adequate out of home care in Australia. Sydney, Australia: Social Policy Research Center, University of New South Wales.
Ibid. xxxiii
Lino, M. (2006). Expenditures on children by families, 2005. Washington D.C.: U.S. Department of Agriculture, Center for Nutrition Policy and Promotion. Retrieved May 27, 2007, from http://www.cnpp.usda.gov/ Publications/CRC/crc2005.pdf at 2.
xxxiv
McHugh, M. (2002). The costs of caring: A study of appropriate foster care payments for stable and adequate out of home care in Australia. Sydney, Australia: Social Policy Research Centre, University of New South Wales.
xxxv
Lino, M. (2006). Expenditures on children by families, 2005. Washington D.C.: U.S. Department of Agriculture, Center for Nutrition Policy and Promotion. Retrieved May 27, 2007, from http://www.cnpp.usda.gov/ Publications/CRC/crc2005.pdf at 2.
xxxvi
Ibid. at 2. xxxvii
McHugh, M. (2002). The costs of caring: A study of appropriate foster care payments for stable and adequate out of home care in Australia. Sydney, Australia: Social Policy Research Centre, University of New South Wales.
xxxviii
U.S. Department of Health and Human Services, Child Welfare Policy Manual, ACYF‐CB‐PIQ‐86‐04 (8/20/86) xxxix
U.S. Department of Health and Human Services, Child Welfare Policy Manual, ACYF‐CB‐A‐82‐01 (4/30/82). xl
Lino, M. (2006). Expenditures on children by families, 2005. Washington D.C.: U.S. Department of Agriculture, Center for Nutrition Policy and Promotion. Retrieved May 27, 2007, from http://www.cnpp.usda.gov/ Publications/CRC/crc2005.pdf at 2.
xli
xlii Allison McMunn, American Camp Association, personal communication, April 23, 2007.
xliii Lino, M. (2006). Expenditures on children by families, 2005. Washington D.C.: U.S. Department of Agriculture, Center for Nutrition Policy and Promotion. Retrieved May 27, 2007, from http://www.cnpp.usda.gov/ Publications/CRC/crc2005.pdf.
xliv Fong, R., Schwab, J., &Armour, M. (2006). Continuity of activities and child well‐being of foster care youth. Children and Youth Services Review, 28 (11), 1359‐1374.
45

Hitting the MARC: Establishing Foster Care Minimum Adequate Rates for Children
U.S. Department of Health and Human Services, Child Welfare Policy Manual, 7/6/05. xlv
U.S. Department of Health and Human Services, Child Welfare Policy Manual, ACYF‐CB‐PIQ‐97‐01, 3/4/97. xlvi
Lino, M. (2006). Expenditures on children by families, 2005. Washington D.C.: U.S. Department of Agriculture, Center for Nutrition Policy and Promotion. Retrieved May 27, 2007, from http://www.cnpp.usda.gov/ Publications/CRC/crc2005.pdf
xlvii
xlviii U.S. Department of Labor, Bureau of Labor Statistics, 2004. Consumer Expenditure Interview Survey Public Use Microdata Documentation (October 18, 2006).
xlix Lino, M. (2006). Expenditures on children by families, 2005. Washington D.C.: U.S. Department of Agriculture, Center for Nutrition Policy and Promotion. Retrieved May 27, 2007, from http://www.cnpp.usda.gov/ Publications/CRC/crc2005.pdf
U.S. Department of Health and Human Services, Child Welfare Policy Manual, ACYF‐CB‐PIQ‐82‐04, 1/29/82. l
li Bonnie Eshbaugh, Foster Parent Professionals, Inc., personal communication, August 17, 2006.
lii Bonnie Eshbaugh, Foster Parent Professionals, Inc., personal communication, November 17, 2006.
liii The U.S. General Services Administration mileage reimbursement rate was increased February 1, 2007, http://www.gsa.gov/Portal/gsa/ep/contentView.do?contentId=9646&contentType=GSA_BASIC).
liv Berry, W., Fording, R., & Hanson, R. (2004). An updated cost of living index for the American states: 1960‐2003. Retrieved May 27, 2007, from http://webapp.icpsr.umich.edu/.
46


