Page 1
HIV / HTLV Coinfection:preliminary results in a cohort from
Rio de Janeiro, Brazil
Instituto de Pesquisa Clínica Evandro Chagas Fundação Oswaldo Cruz (FIOCRUZ)
Rio de Janeiro, Brazil
www.ipec.fiocruz.br / [email protected]
Page 2
Talk structure
Some aspects of HTLV infection
HIV infection and the nervous system
• Risk for neurological diseases in
HIV/HTLV coinfection
Preliminary results in a cohort from
Rio de Janeiro
Page 3
Background
HIV-1 & HTLV• common tropism for T cells
HTLV-1:CD4+
HTLV-2:CD8+
• modes of transmission
• affect nervous system
• long latency period
• regulatory genes
Detection and isolation of HTLV-1 from cultured lymphocytes. Courtesy of Dra Maria José de Andrada-Serpa, IPEC/FIOCRUZ
Page 4
Background
HTLV• cell proliferatives
• poor replicatives
• genetically stables
A Araújo, MT Silva. Neurologic Manifestations of HTLV-I Infection. In: ROSS, Karen. (Ed). Neurologic Infectious Diseases - Principles and Practice, 2005, p. 137-149
Page 5
HTLV-1 - epidemiology
3%-6%30%
1.8%
A Araújo, MT Silva. Neurologic Manifestations of HTLV-I Infection. In: ROSS, Karen. (Ed). Neurologic Infectious Diseases - Principles and Practice, 2005, p. 137-149
Page 6
HTLV-2 - epidemiology
Page 7
HTLV
Neoplastic
ATL
Inflammatory
Arthritis
HAM/TSP
Polymyositis
Uveitis
Page 8
Human T-lymphotropic virus 1-Associated Myelopathy/Tropical Spastic Paraparesis (HAM/TSP)
Silva MT, Araújo A. Arch Neurol, 2004;61:1134-5
Page 9
Peripheral neuropathy
Page 10
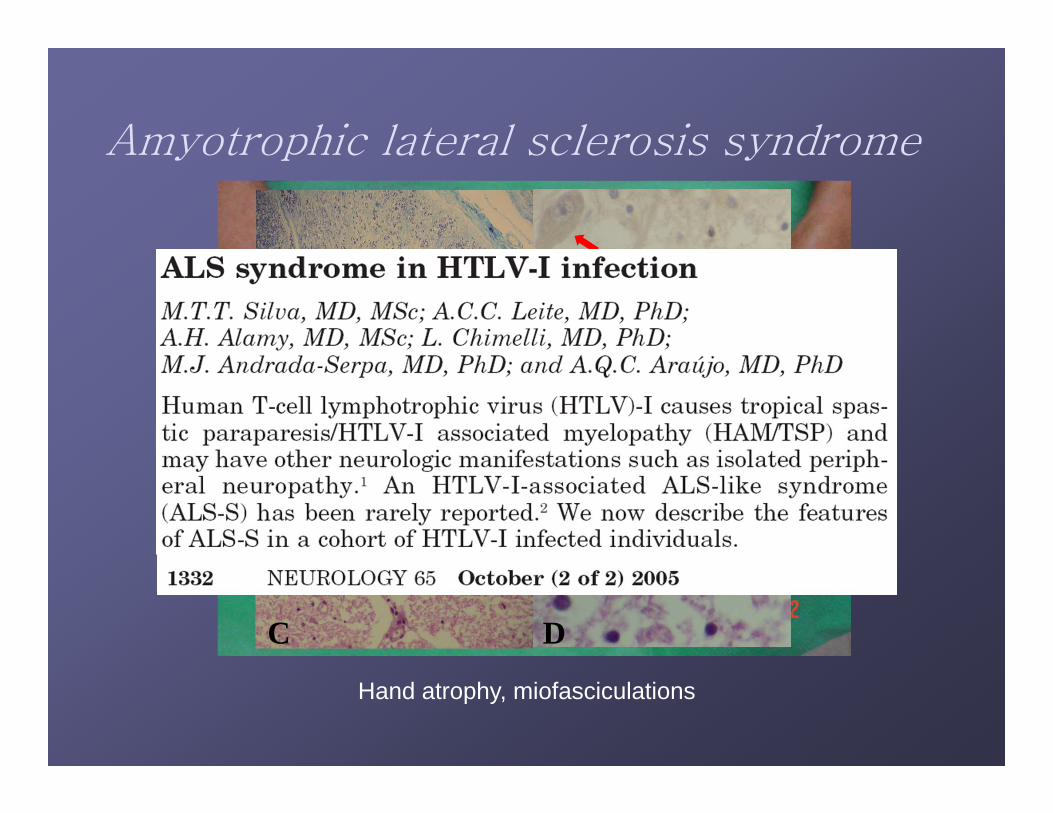
Amyotrophic lateral sclerosis syndrome
A B
C D
Hand atrophy, miofasciculations
Page 12
Pathogenesis
2% to 5% → Neurological disease(HAM/TSP)
• Viral genotypes?
• High HTLV-1 antibodies
• Female
• High HTLV-1 proviral load
Page 13
HIV and neurological diseases
Frequent and disabling (Price, 1988)
• HIV clinics - more than 1/3 patients
• Autopsy studies - more than 80% patients
Brazil – 26% to 94% (Cerebral toxoplasmosis)
Silva MT, Araújo A. J Neurovirol, 2005
Page 14
HIV/HTLV coinfection - neurological diseases
Risk for neurological diseases
• Brazil - M Schechter (1997): myelopathy
11/15 HIV/HTLV vs 10/62 HIV single infection (OR 13)
• USA – M Beilke (2005): myelopathy
2339 HIV-infected patients
172 coinfected (prevalence of 7.4%)
• 41 (35.7%) HTLV-1: Myelopathy in 4
Page 15
HIV/HTLV coinfection – laboratorial parameters
HIV/HTLV coinfection
• Higher CD4+ counts (Schechter, 1994)
• Does not affect
HIV viral load (Schechter, 1997)
HTLV-1 proviral load (Césaire, 2001)
Page 16
Objectives
What is the prevalence of HIV/HTLV
coinfection in a big cohort of HIV-
infected people from Rio de Janeiro?
Page 17
Objectives
Does HIV/HTLV coinfection render
additional risk for neurological
diseases?
Page 18
Objectives
Are HTLV-1 proviral load, HIV viral
load, and CD4+/CD8+ counts affected
by HIV/HTLV-1 coinfection in the era
post-HAART?
Page 19
Methods
Evandro Chagas Clinical Research Institute
(www.ipec.fiocruz.br)
• 2738 HIV-1-infected individuals
Random selection of 484 stored samples
HTLV-1/2 serological study
• 713 HTLV-infected individuals
Random selection of 89 individuals
Page 20
Methods
HTLV 1/2 serological study
• ELISA
• Western Blot
HTLV Proviral load
• real time PCR (TaqMan system) number of copies/100 cells = [tax copies/(β-globin copies/2)]100
Page 21
Methods
Neurological assessment
• Myelopathy
HAM/TSP - WHO criteria (1990)
• Peripheral neuropathy
Clinical
Electrophysiological
Page 22
Preliminary results
Page 23
General group
51 10,5 10,5 10,5433 89,5 89,5 100,0484 100,0 100,0
CoinfectedHIV-1 single infectionTotal
ValidFrequency Percent Valid Percent
CumulativePercent
Overview
Page 24
Virological group
36 70,6 70,6 70,63 5,9 5,9 76,55 9,8 9,8 86,37 13,7 13,7 100,0
51 100,0 100,0
HIV/HTLV-1HIV/HTLV-2HIV/HTLV-1/2IndeterminateTotal
ValidFrequency Percent Valid Percent
CumulativePercent
Overview
Page 25
Demographic data
HIV single infection (N 433)• Age:41 (18-73)• Sex: 167 female (38%)
HTLV single infection (N 89)• Age:52 (20-88)• Sex: 51 female (57%)
HIV/HTLV coinfection (N 51)• Age:46 (30-71)• Sex: 17 female (33%)
Page 26
Laboratorial data
CD4+ count• HIV single infection
• HIV/HTLV coinfection
Test Statisticsa
7241,00081932,000
-,894,371
Mann-Whitney UWilcoxon WZAsymp. Sig. (2-tailed)
CD4 count
Grouping Variable: HIV/HTLV coinfectiona. HIV/HTLV coinfection
NoYes
CD
4+ ly
mph
ocite
cou
nt
4000
3000
2000
1000
0
-1000
5354445369710112520868400255157
323
4
204
Page 27
Laboratorial data
CD8+ count• HIV single infection
• HIV/HTLV coinfection
Test Statisticsa
7407,50081327,500
-,369,712
Mann-Whitney UWilcoxon WZAsymp. Sig. (2-tailed)
CD8 count
Grouping Variable: HIV/HTLV coinfectiona.
HIV/HTLV coinfection
NoYes
CD
8+ ly
mph
ocite
cou
nt
4000
3000
2000
1000
0
-1000
12770113101
469
204139
Page 28
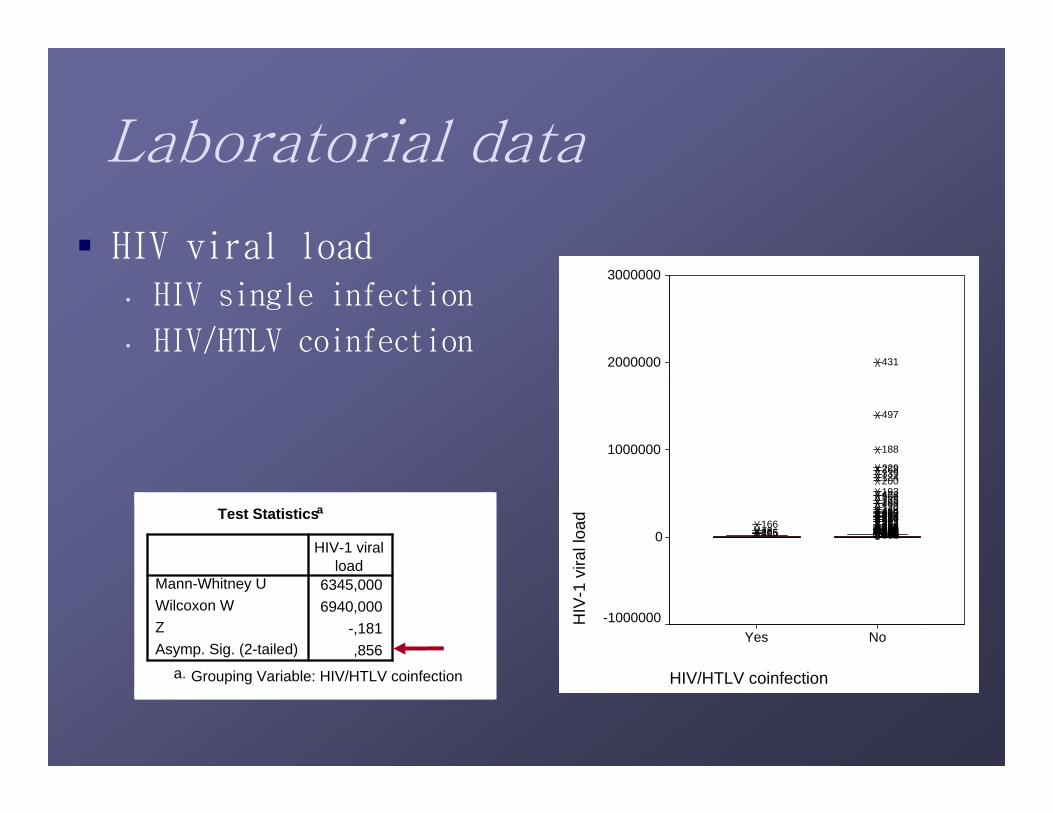
Laboratorial data
HIV viral load• HIV single infection
• HIV/HTLV coinfection
Test Statisticsa
6345,0006940,000
-,181,856
Mann-Whitney UWilcoxon WZAsymp. Sig. (2-tailed)
HIV-1 viralload
Grouping Variable: HIV/HTLV coinfectiona. HIV/HTLV coinfection
NoYes
HIV
-1 v
iral l
oad
3000000
2000000
1000000
0
-1000000
46435254127032540214829491384391801004751761084075192232148533752945939310436928732833224953793288154093383156749011852717595456463905234355243547122043438530400424376120444259135506423193200124339268229
188
497
431
10541526648166
Page 29
Laboratorial data
HTLV-1 proviral load
HTLV single infectioCoinfected
HTL
V-1
pro
vira
l loa
d
70
60
50
40
30
20
10
0
-10
270
257
18
Test Statisticsa,b
,4511
,502
Chi-SquaredfAsymp. Sig.
HTLV-1proviral load
Kruskal Wallis Testa.
Grouping Variable: General groupb.
Page 30
Risk Estimate
1,059 ,592 1,895
1,053 ,626 1,771
,994 ,935 1,057
484
Odds Ratio forOpportunistic infection(sim / não)For cohort General group= CoinfectedFor cohort General group= HIV-1 single infectionN of Valid Cases
Value Lower Upper
95% ConfidenceInterval
OI – HIV/HTLV vs HIV single infection
Opportunistic infection * General group Crosstabulation
Count
27 223 25024 210 23451 433 484
simnão
Opportunisticinfection
Total
CoinfectedHIV-1 single
infection
General group
Total
Chi-Square Tests
,038b 1 ,846,002 1 ,963,038 1 ,846
,883 ,482
,038 1 ,846
484
Pearson Chi-SquareContinuity Correctiona
Likelihood RatioFisher's Exact TestLinear-by-LinearAssociationN of Valid Cases
Value dfAsymp. Sig.
(2-sided)Exact Sig.(2-sided)
Exact Sig.(1-sided)
Computed only for a 2x2 tablea.
0 cells (,0%) have expected count less than 5. The minimum expected count is24,66.
b.
Page 31
Death – HIV/HTLV vs HIV single infection
HIV/HTLV coinfection * Death Crosstabulation
Count
12 28 4028 372 40040 400 440
YesNo
HIV/HTLV coinfection
Total
Yes NoDeath
Total
Chi-Square Tests
23,276b 1 ,00020,576 1 ,00016,299 1 ,000
,000 ,000
23,223 1 ,000
440
Pearson Chi-SquareContinuity Correctiona
Likelihood RatioFisher's Exact TestLinear-by-LinearAssociationN of Valid Cases
Value dfAsymp. Sig.
(2-sided)Exact Sig.(2-sided)
Exact Sig.(1-sided)
Computed only for a 2x2 tablea.
1 cells (25,0%) have expected count less than 5. The minimum expected count is3,64.
b.
Risk Estimate
5,694 2,616 12,393
4,286 2,369 7,755,753 ,613 ,924440
Odds Ratio for HIV/HTLVcoinfection (Yes / No)For cohort Death = YesFor cohort Death = NoN of Valid Cases
Value Lower Upper
95% ConfidenceInterval
Page 32
Neurological diseases
Neurological disease * General group Crosstabulation
Count
26 49 49 12425 384 40 44951 433 89 573
YesNo
Neurologicaldisease
Total
CoinfectedHIV-1 single
infectionHTLV single
infection
General group
Total
Page 33
Neurological diseases
Neurological diagnosis * General group Crosstabulation
Count
25 384 39 4489 23 32
1 1
4 2 15 21
12 45 9 661 2 3
1 11 1
51 433 89 573
AsymptomaticHAM/TSPNeurogenic bladderdysfunctionHAM/TSP & PeripheralneuropathyPeripheral neuropathyDementiaATLOptic neuritis
Neurologicaldiagnosis
Total
CoinfectedHIV-1 single
infectionHTLV single
infection
General group
Total
Page 34
Neurological disease * General group Crosstabulation
Count
26 49 7525 384 40951 433 484
YesNo
Neurologicaldisease
Total
CoinfectedHIV-1 single
infection
General group
Total
Neurological diseasesHIV/HTLV coinfection vs HIV single infection
Chi-Square Tests
54,995b 1 ,00052,000 1 ,00041,064 1 ,000
,000 ,000
54,881 1 ,000
485
Pearson Chi-SquareContinuity Correctiona
Likelihood RatioFisher's Exact TestLinear-by-LinearAssociationN of Valid Cases
Value dfAsymp. Sig.
(2-sided)Exact Sig.(2-sided)
Exact Sig.(1-sided)
Computed only for a 2x2 tablea.
0 cells (,0%) have expected count less than 5. The minimum expected count is7,89.
b.
Risk Estimate
8,171 4,377 15,256
5,685 3,480 9,287
,696 ,589 ,822
485
Odds Ratio forNeurological disease(Yes / No)For cohort General group= CoinfectedFor cohort General group= HIV-1 single infectionN of Valid Cases
Value Lower Upper
95% ConfidenceInterval
Page 35
Neurological diseasesHIV/HTLV coinfection vs HTLV single infection
Neurological disease * General group Crosstabulation
Count
26 49 7525 40 6551 89 140
YesNo
Neurologicaldisease
Total
CoinfectedHTLV single
infection
General group
Total
Chi-Square Tests
,217b 1 ,642,084 1 ,772,216 1 ,642
,725 ,386
,215 1 ,643
140
Pearson Chi-SquareContinuity Correctiona
Likelihood RatioFisher's Exact TestLinear-by-LinearAssociationN of Valid Cases
Value dfAsymp. Sig.
(2-sided)Exact Sig.(2-sided)
Exact Sig.(1-sided)
Computed only for a 2x2 tablea.
0 cells (,0%) have expected count less than 5. The minimum expected count is23,68.
b.
Risk Estimate
,849 ,426 1,692
,901 ,582 1,396
1,062 ,824 1,368
140
Odds Ratio forNeurological disease(Yes / No)For cohort General group= CoinfectedFor cohort General group= HTLV single infectionN of Valid Cases
Value Lower Upper
95% ConfidenceInterval
Page 36
Myelopathy HIV/HTLV coinfection vs HIV single infection
Myelopathy * HIV/HTLV coinfection Crosstabulation
Count
13 2 1538 431 46951 433 484
YesNo
Myelopathy
Total
Yes NoHIV/HTLV coinfection
Total
Chi-Square Tests
95,170b 1 ,00087,019 1 ,00050,349 1 ,000
,000 ,000
94,974 1 ,000
484
Pearson Chi-SquareContinuity Correctiona
Likelihood RatioFisher's Exact TestLinear-by-LinearAssociationN of Valid Cases
Value dfAsymp. Sig.
(2-sided)Exact Sig.(2-sided)
Exact Sig.(1-sided)
Computed only for a 2x2 tablea.
1 cells (25,0%) have expected count less than 5. The minimum expected count is1,58.
b.
Risk Estimate
73,724 16,041 338,838
10,696 7,435 15,389
,145 ,040 ,527
484
Odds Ratio forMyelopathy (Yes / No)For cohort HIV/HTLVcoinfection = YesFor cohort HIV/HTLVcoinfection = NoN of Valid Cases
Value Lower Upper
95% ConfidenceInterval
Page 37
Myelopathy HIV/HTLV coinfection vs HTLV single infection
Myelopathy * HIV/HTLV coinfection Crosstabulation
Count
13 38 5138 51 8951 89 140
YesNo
Myelopathy
Total
Yes NoHIV/HTLV coinfection
Total
Chi-Square Tests
4,145b 1 ,0423,435 1 ,0644,261 1 ,039
,046 ,031
4,115 1 ,042
140
Pearson Chi-SquareContinuity Correctiona
Likelihood RatioFisher's Exact TestLinear-by-LinearAssociationN of Valid Cases
Value dfAsymp. Sig.
(2-sided)Exact Sig.(2-sided)
Exact Sig.(1-sided)
Computed only for a 2x2 tablea.
0 cells (,0%) have expected count less than 5. The minimum expected count is18,58.
b.
Risk Estimate
,459 ,215 ,979
,597 ,352 1,012
1,300 1,022 1,654
140
Odds Ratio forMyelopathy (Yes / No)For cohort HIV/HTLVcoinfection = YesFor cohort HIV/HTLVcoinfection = NoN of Valid Cases
Value Lower Upper
95% ConfidenceInterval
Page 38
Peripheral neuropathy HIV/HTLV coinfection vs HIV single infection
Isolated peripheral neuropathy * HIV/HTLV coinfectionCrosstabulation
Count
12 45 5739 388 42751 433 484
YesNo
Isolated peripheralneuropathy
Total
Yes NoHIV/HTLV coinfection
Total
Chi-Square Tests
7,578b 1 ,0066,367 1 ,0126,287 1 ,012
,011 ,009
7,563 1 ,006
484
Pearson Chi-SquareContinuity Correctiona
Likelihood RatioFisher's Exact TestLinear-by-LinearAssociationN of Valid Cases
Value dfAsymp. Sig.
(2-sided)Exact Sig.(2-sided)
Exact Sig.(1-sided)
Computed only for a 2x2 tablea.
0 cells (,0%) have expected count less than 5. The minimum expected count is6,01.
b.
Risk Estimate
2,653 1,295 5,433
2,305 1,284 4,137
,869 ,757 ,997
484
Odds Ratio forIsolated peripheralneuropathy (Yes / No)For cohort HIV/HTLVcoinfection = YesFor cohort HIV/HTLVcoinfection = NoN of Valid Cases
Value Lower Upper
95% ConfidenceInterval
Page 39
Peripheral neuropathy HIV/HTLV coinfection vs HTLV single infection
Isolated peripheral neuropathy * HIV/HTLV coinfectionCrosstabulation
Count
12 9 2139 80 11951 89 140
YesNo
Isolated peripheralneuropathy
Total
Yes NoHIV/HTLV coinfection
Total
Chi-Square Tests
4,578b 1 ,0323,586 1 ,0584,405 1 ,036
,048 ,031
4,545 1 ,033
140
Pearson Chi-SquareContinuity Correctiona
Likelihood RatioFisher's Exact TestLinear-by-LinearAssociationN of Valid Cases
Value dfAsymp. Sig.
(2-sided)Exact Sig.(2-sided)
Exact Sig.(1-sided)
Computed only for a 2x2 tablea.
0 cells (,0%) have expected count less than 5. The minimum expected count is7,65.
b.
Risk Estimate
2,735 1,063 7,038
1,744 1,111 2,737
,638 ,383 1,061
140
Odds Ratio forIsolated peripheralneuropathy (Yes / No)For cohort HIV/HTLVcoinfection = YesFor cohort HIV/HTLVcoinfection = NoN of Valid Cases
Value Lower Upper
95% ConfidenceInterval
Page 40
Conclusions
HIV/HTLV coinfection – 10.5%
• HTLV-1 – 70.6%
No differences
• CD4+/CD8+ counts
• HIV viral load
• OI incidence
HIV/HTLV coinfection vs HIV single infection
• Death – OR 5.69 (12/28 vs 28/372)
HAART effects?
Page 41
Conclusions
HIV/HTLV coinfection vs HIV single infection
• Neurological disease – OR 8.17
Myelopathy – 13/51 (HIV – 2/433)
OR 73.7
Peripheral neuropathy – 12/51 (HIV – 45/433)
OR 2.6
Page 42
Future prospective
Long term follow up• Asymptomatic HIV/HTLV coinfection
Estimate risk HAM/TSP: 2% to 5%
Higher in coinfected patients?
Neuropsychological assessment
Page 43
Authors
Marcus Tulius T Silva, MD, PhD – Neurologist Maria José de Andrada-Serpa, MD, PhD – Virologist Beatriz Grinsztejn, MD, PhD – HIV clinic Eliane Berinqué – Statistic Dayse Campos, MSc – Statistic Hugo Rojas, MD – Post-graduated student Ramza Harab, MSc – Biologist Marília Santini, MD, PhD – HIV Clinic Ana Leite, MD, PhD – Neurologist Marco Lima, MD, PhD - Neurologist Abelardo Araújo, MD, PhD - Neurologist
Page 44
Acknowledged - Financial support
Ministry of Health – BrazilNational Program against Sexual Transmitted Diseases & AIDS
Page 45
Thank you!
Grazie mille!
[email protected]


![Elizabeth Sherman, PharmD, AAHIVPhivaidsinstitute.med.miami.edu/documents/...HIV-HCV...• SVR rates similar to HCV monoinfected [1,2] • In HCV/HIV coinfection, treat HCV as though](https://static.documents.pub/doc/80x56/5fbc30e57653e03e261e9924/elizabeth-sherman-pharmd-aa-a-svr-rates-similar-to-hcv-monoinfected-12.jpg)

