17
HIV in British Columbia: Recent Trends Presentation for the Pacific AIDS Network February 25, 2009 Stephen Smith Manager, Blood-borne Pathogens
| Date post: | 14-Dec-2015 |
| Category: |
Documents |
| Upload: | patience-vipond |
| View: | 214 times |
| Download: | 1 times |

HIV in British Columbia:
Recent Trends
Presentation for the Pacific AIDS Network
February 25, 2009
Stephen SmithManager, Blood-borne Pathogens

HIV Testing and Newly Identified Infections (Source: BCCDC HIV Surveillance)
What we know from HIV surveillance data:• How many people tested positive for HIV within BC; • In most cases, what health region most of these people live in;• In most cases, gender, age range, ethno-cultural background;• In most cases, how they believe they became infected.
What we don’t know from HIV surveillance data:• Which are incident infections and which are prevalent infections;• How many undiagnosed infections there are in BC;• How many people are living with HIV in BC at present.

Number of HIV Tests Performed in BC, 2001-2007
0
20,000
40,000
60,000
80,000
100,000
120,000
140,000
160,000
180,000
200,000
2001 2002 2003 2004 2005 2006 2007
# o
f H
IV T
ests
Per
form
ed

Number of HIV Tests Performed in BC, 2001-2007Proportion Attributable to Prenatal Screening
0
20,000
40,000
60,000
80,000
100,000
120,000
140,000
160,000
180,000
200,000
2001 2002 2003 2004 2005 2006 2007
# of
HIV
Tes
ts P
erfo
rmed


Rate of Persons Testing Newly Positive for HIV in BC and Canada, 2001-2007
0.0
2.0
4.0
6.0
8.0
10.0
12.0
Ra
te p
er
10
0,0
00
po
pu
lati
on
BC Rate 10.3 10.2 9.8 10.5 9.4 8.3 9.1
Canadian Rate 7.0 8.0 7.9 7.9 7.8 7.8 7.5
2001 2002 2003 2004 2005 2006 2007

VCH
53%
FHA
21%
VIHA
14%
IHA
5%
NHA
7%
Percentage of Newly Reported HIV Infections by Health Region - 2007
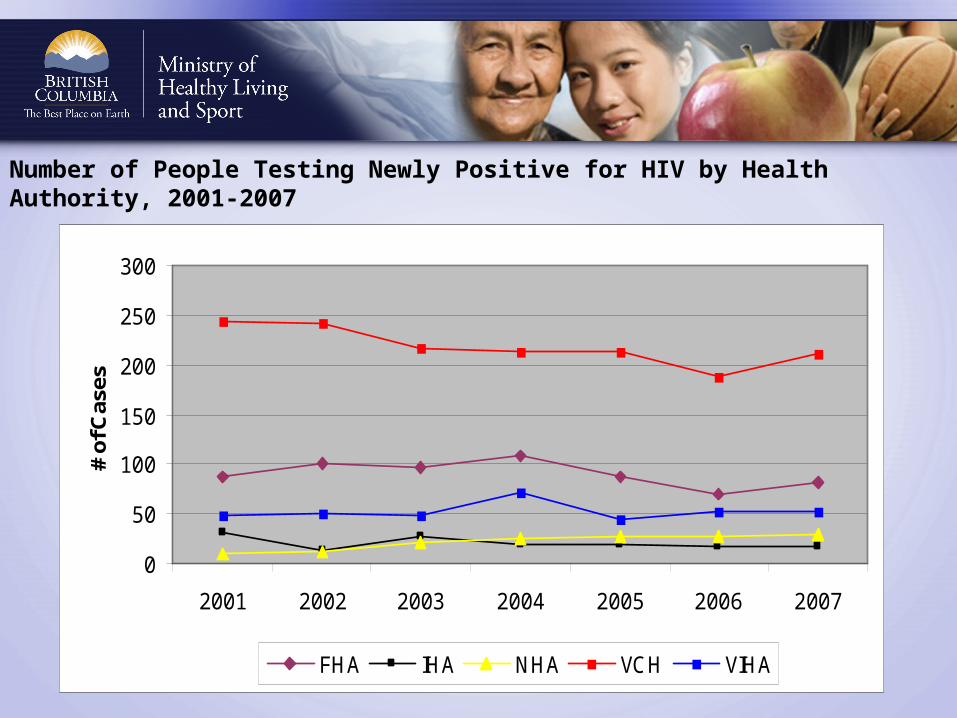
Number of People Testing Newly Positive for HIV by Health Authority, 2001-2007
0
50
100
150
200
250
300
2001 2002 2003 2004 2005 2006 2007
# of
Cas
es
FHA IHA NHA VCH VIHA


<200% 20-29
18%
30-3934%
40-4930%
50+18%
<201%
20-2944%
30-3924%
40-4917%
50+14%
Persons Testing Newly Positive for HIV in BC by Age and Gender, 2007
Females – 55% >29 Males – 82% >29


Caucasian68%
Aboriginal15%
Asian8%
Black3%
Hispanic5%
Other1%
Newly Reported HIV Infections by Ethno-cultural Categories, 2007

Newly Reported Infections by Ethno-cultural Categories and Gender, 2007
Caucasian45%
Aboriginal41%
Asian8%
Black5%
Other1%
Hispanic0%
Caucasian74%
Aboriginal8%
Asian9%
Black2%
Other1%
Hispanic6%
Females Males

HIV Treatment Data (Source: BC HIV Drug Treatment Program – BCCfE)
What we know from treatment data:• The number of people actively on HAART in BC and accessing treatment
through the BC HIV DTP;• The number of people who are DTP participants but not actively on
HAART;• The number of people taking various combinations of ARVs;• Median viral load counts for DTP participants;• Median CD4 counts for DTP participants;• Some characteristics such as gender, ethno-cultural background, etc.;• Some level of access to care.
What we don’t know from HIV treatment data:• Who may need treatment but not have access to it.

Number of Drug Treatment Program Participants on ARV Treatment by Health Authority of Residence, 2003-2007
0
500
1000
1500
2000
2500
3000
VCH VIHA FHA NHA IHA
2003 2004 2005 2006 2007

Number of Aboriginal HIV Drug Treatment Program Participants on ARV Treatment by Health Authority of Residence, 2006 & 2007
0
20
40
60
80
100
120
140
160
VCH VIHA FHA NHA IHA
2006 2007
Males

Number of Aboriginal HIV Drug Treatment Program Participants on ARV Treatment by Health Authority of Residence, 2006 & 2007
Females
0
5
10
15
20
25
30
35
VCH VIHA FHA NHA IHA
2006 2007

![Blood Borne Pathogens Training [Read-Only]](https://static.documents.pub/doc/80x56/61740a8f4be7466d59631bea/blood-borne-pathogens-training-read-only.jpg)


