SYMPOSIUM: DRUG POLICY REALITY AND REFORM THE WAR ON DRUGS AND PRISON GROWTH: LIMITED IMPORTANCE, LIMITED LEGISLATIVE OPTIONS J OHN F. PFAFF* I. INTRODUCTION The dramatic rise in imprisonment in the United States over the past forty years is hard to understate. Decades of stable incarceration ended sud- denly in the mid-1970s, as the U.S. prison population soared from about 300,000 to 1.6 million inmates, and the incarceration rate from 100 per 100,000 to over 500 per 100,000. The incarceration boom is unprecedented in American history, and unseen anywhere else in the world; traditionally indistinguishable from its peers, the United States is now the world’s largest jailer, both in absolute numbers and in rate. Home to only five percent of the world’s population, it now houses over twenty percent of its prisoners. Not surprisingly, academics, policymakers, and journalists alike have attempted to ferret out the causes of this carceral explosion. Though explana- tions differ, almost all analysts agree that a major cause has been the “War on Drugs.” The argument is intuitive and straight-forward: the prison boom has been driven by increases in the arrest, conviction, and incarceration— often for quite long terms—of perhaps often low-level drug offenders as part of federal, state, and local efforts to combat drug use and trafficking. 1 And Figure 1 suggests why this claim is so easy to accept: U.S. incarceration rates started to set new records around the time the Reagan-era War on Drugs got underway. * Professor of Law, Fordham Law School. 1 See, e.g., MICHELLE ALEXANDER, THE NEW JIM CROW: MASS INCARCERATION IN THE AGE OF COLORBLINDNESS (2012).
THE WAR ON DRUGS AND PRISON GROWTH:LIMITED IMPORTANCE, LIMITED
LEGISLATIVE OPTIONS
JOHN F. PFAFF*
I. INTRODUCTION
The dramatic rise in imprisonment in the United States over the pastforty years is hard to understate. Decades of stable incarceration ended sud-denly in the mid-1970s, as the U.S. prison population soared from about300,000 to 1.6 million inmates, and the incarceration rate from 100 per100,000 to over 500 per 100,000. The incarceration boom is unprecedentedin American history, and unseen anywhere else in the world; traditionallyindistinguishable from its peers, the United States is now the world’s largestjailer, both in absolute numbers and in rate. Home to only five percent of theworld’s population, it now houses over twenty percent of its prisoners.
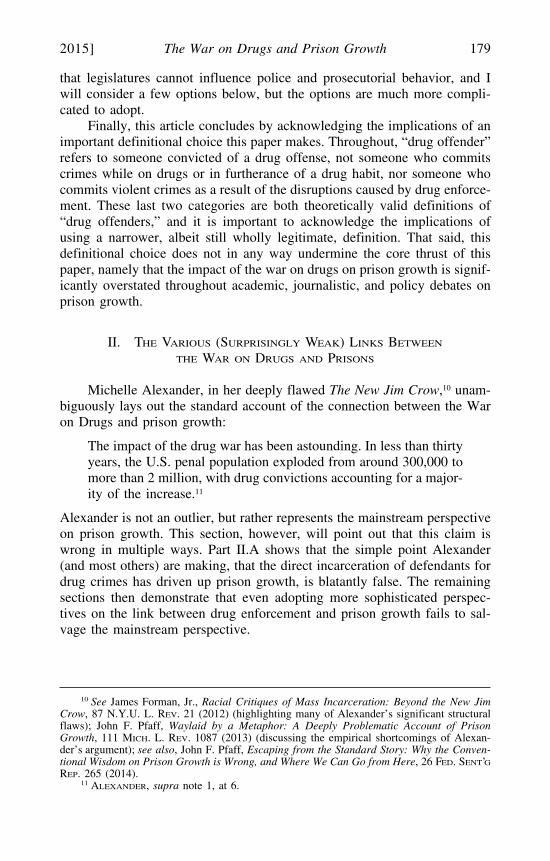
Not surprisingly, academics, policymakers, and journalists alike haveattempted to ferret out the causes of this carceral explosion. Though explana-tions differ, almost all analysts agree that a major cause has been the “Waron Drugs.” The argument is intuitive and straight-forward: the prison boomhas been driven by increases in the arrest, conviction, and incarceration—often for quite long terms—of perhaps often low-level drug offenders as partof federal, state, and local efforts to combat drug use and trafficking.1 AndFigure 1 suggests why this claim is so easy to accept: U.S. incarcerationrates started to set new records around the time the Reagan-era War onDrugs got underway.
* Professor of Law, Fordham Law School.1 See, e.g., MICHELLE ALEXANDER, THE NEW JIM CROW: MASS INCARCERATION IN THE
Note: Data from the Bureau of Justice Statistics’ National Prisoner Statistics (“NPS”).2
Given the widespread acceptance of the centrality of the drug war toprison growth, it is not surprising that recent efforts by state and federalgovernments to rein in prison growth have focused on drug enforcement.New York state, for example, has weakened its notorious Rockefeller DrugLaws.3 The U.S. Congress has reduced the severity of its sanctions for crack-related offenses, while President Barack Obama has commuted the sentencesof several inmates serving long sentences for drug crimes to symbolize theneed for broader drug-policy reform.4 California enacted a bill to reducecrack sentences,5 and Missouri recently reduced the first-time possession of
2 “In Custody” and “Under Jurisdiction” are fairly similar ways of counting prisoners.The BJS changed approaches in 1977. All state- and national-level data on prison populations,admissions, and releases are available on-line through the BJS’s Data Analysis Tool for NPSdata. E. Ann Carson & Joseph Mulako-Wangota, Corrections Statistical Analysis Tool (CSAT)– Prisoners, BUREAU OF JUST. STAT. [hereinafter BJS/NPS Data], http://www.bjs.gov/in-dex.cfm?ty=nps (last visited Oct. 30, 2014), archived at http://perma.cc/X79Z-WYLB.
3 Jeremy W. Peters, Albany Reaches Deal to Repeal ‘70s Drug Laws, N.Y. TIMES (Mar.25, 2009), available at http://www.nytimes.com/2009/03/26/nyregion/26rockefeller.html,archived at http://perma.cc/NHM7-M5JM.
4 David Nakamura, Obama Commutes Sentences of 8 Inmates with Crack Cocaine Con-victions, Citing 2010 Law, WASH. POST (Dec. 19, 2013), available at http://www.washingtonpost.com/politics/obama-commutes-sentences-of-8-inmates-with-crack-cocaine-convictions-citing-2010-law/2013/12/19/758d2848-68da-11e3-a0b9-249bbb34602c_story.html, archivedat http://perma.cc/M5AE-VDQV.
5 See S.B. 1010, 2013-2014 Leg., 2013-2014 Sess. (Cal. 2014) (amending Sections11351.5 and 11470 of the Health and Safety Code, and amending Section 1203.073 of thePenal Code, relating to controlled substances); see also Patrick McGreevy & Melanie Mason,California Lawmakers Pass Education and Drug Bills, Strike Prop. 187, L.A. TIMES (Aug. 21,
no more than ten grams of marijuana from a class A misdemeanor (whichcould result in up to a year in jail) to a class D misdemeanor (which faces notime at all).6
Yet despite its widespread popularity, the argument pinning prisongrowth to the War on Drugs oversimplifies the connection between the two.This article starts to develop a more sophisticated analysis of how the Waron Drugs shapes prison populations, and examines its implications for theoptions available to legislatures seeking to better manage prison growth. Myconclusions run contrary to the conventional wisdom and, when it comes toreform, will not be particularly optimistic: the role of the War on Drugs isgreatly exaggerated, and the areas where it matters most are likely the onesover which legislatures have the least control.
There are two broad issues I want to address here. Part II closely exam-ines the empirical validity of various theoretical connections between theWar on Drugs and prison growth, focusing in particular on five potentialpathways. There appears to be little empirical support for any of them—or,at the very least, whatever effects the War on Drugs has had are indirect andhard to measure. And these indirect effects are generally caused by actorswho operate fairly independently of state legislatures.
Nonetheless, even if the War on Drugs does not drive much of thegrowth in incarceration, valid reasons remain for trying to rein in its reach,and there still exist steps that legislatures can take. So Part III turns its atten-tion to what legislatures can and cannot accomplish. But again, the conclu-sions are not optimistic. The tools most readily available to the legislature—such as adjusting what drugs are illegal and the sentences that attach to drugoffenses—likely will not have much effect on prison populations, even justfor drug offenders. Efforts that regulate prosecutorial behavior more directlymay be more effective, but they are also harder to design and raise morecomplicated political issues; that a handful of states have adopted such re-forms, however, does prove that such reforms are more than just thoughtexperiments.
The five means by which the War on Drugs can drive up incarcerationrates (or punishment more generally) considered in Part II are (1) the directincarceration of drug offenders, (2) the re-incarceration of all types of of-fenders due to drug-related parole violations, (3) the impact of drug incarcer-ations on prison admissions instead of prison populations, (4) the extent towhich prior drug offenses trigger repeat-offender enhancement, even fornon-drug crimes, and (5) the effects of large-scale drug arrests and incarcer-ations on neighborhood social cohesion, and the connections between socialstability and incarceration. As noted above, despite the theoretical plausibil-
2014), available at http://www.latimes.com/local/education/la-me-pol-legislature-20140822-story.html, archived at http://perma.cc/89ZF-X4HF.
6 See MO. REV. STAT. §§ 558.011, 579.015.4 (2013).
ity of all five, the data cautions against putting too much weight on any ofthem.
While the first two theories—that drug incarcerations and drug-relatedparole violations drive growth—have received the most attention, they arealso the easiest to debunk. For all the talk about drug incarcerations drivingup prison populations, drug offenders comprise only 17% of state prisonpopulations and explain only about 20% of prison growth since 1980. As forparole violations, it may be unfair to attribute any prison growth to paroleadmissions in the first place, since rising parole admissions could simplyreflect rising parole releases. But even putting that issue aside, drug-relatedparole violations make up a relatively small percentage of all admissions—and even a smaller percentage of just parole-revocation admissions. Further-more, perhaps as many as a third of those returning due to technical viola-tions are also returning because of something more substantive, like a newoffense. In short, however logical and intuitive these theories may appear,empirical support is severely lacking.
The third theory is somewhat off the beaten path of drug-war scholar-ship. Despite all the “throw-away-the-key” rhetoric that surrounds drugpunishment, it turns out that almost all drug offenders serve relatively shortsentences. So while drug offenders make up a relatively small share of theprison population, they could make up a much larger share of prison admis-sions. And while we tend to focus on the total stock of prisoners as ourmeasure of punitiveness, the fact that most prisoners serve relatively shortsentences and return home may imply that the flow of people through thesystem is a more relevant measure of punitiveness. Until recently, it washard to estimate this flow accurately, but recent advances in data-gatheringmake it easier to calculate. Perhaps surprisingly, even here the impact ofdrug incarceration is slight—as with the stock of prisoners, only about 20%of the flow comes from drug-related admissions.
The fourth possible pathway from the drug war to mass incarcerationreturns to looking at total incarceration levels. Perhaps drug incarcerationsare relatively short but ultimately trigger much longer sentences for futurenon-drug crimes via repeat offender laws. The available data make it clearthat prior drug incarcerations do not seem to play any important role in fu-ture non-drug incarcerations. But problematic gaps in that data make it im-possible to observe either (1) how non-incarcerative prior criminal justicecontacts, such as arrests or felony convictions without prison time, influenceformal sentencing policies such as recidivist statutes, or (2) how these non-incarcerative contacts influence informal decisions, such as the police’s will-ingness to arrest a suspect, the prosecutor’s willingness to prosecute a defen-dant, or even the type of charges chosen by the prosecutor. In other words,are the police more willing to arrest someone with a long list of prior drugarrests/convictions for a relatively minor non-drug crime, and is the prosecu-tor more willing to indict him, and to invoke more serious charges when she
does (e.g., felony over misdemeanor, or felony with mandatory time overone without such a minimum)?
In all these scenarios, prior criminal justice contacts due to the War onDrugs may shape subsequent punishments, but their impact is almost invisi-ble in the data. But it is invisible for a reason, and one that can be resolved:almost no data is gathered on prosecutorial behavior, making it impossible tounderstand what shapes prosecutors’ decisions to file what charges againstwhat types of defendants. There is police agency-level data on crimes andarrests, individual-level data from some states on prison admission, but al-most nothing on prosecutors. There is no reason such data cannot be gath-ered, but until it is we remain blind to the decision-making process of themost powerful actor in the criminal justice system.
The final pathway considered here is a more macro-level one, and amore speculative one as well. Concentrated enforcement, whether via arrestsor incarceration, can be a mixed blessing for a community. On the one hand,it removes dangerous people from the neighborhood, and that improves so-cial cohesion and neighborhood social capital. On the other hand, if enforce-ment sweeps too wide a net, it can detain relatively non-violent offenderswhose removals impose net losses on neighborhood stability. The most obvi-ous connection between instability and incarceration would be through risingcrime rates, but crime rates have fallen since 1991, so any increased instabil-ity caused by drug arrests or incarcerations has likely not translated into any(gross) increase in crime.7 But there are other ways in which social instabil-ity can contribute to rising incarceration rates, even in a time of fallingcrime. The primary possibility considered here is the nexus betweenprosecutorial punitiveness and social instability. Increased incarceration, atleast since the early 1990s,8 has been driven almost entirely by an increasedwillingness on the part of prosecutors to file felony charges against arrestees.Perhaps this punitiveness is inspired in no small part by a desire to use thecriminal justice system (perhaps poorly) to try to rectify structural problemsin relatively high-crime communities.
7 By relying primarily on state-level models, the results do not rule out that concentrateddrug enforcement has led to gross increases in crime (and thus punishment) in smaller geo-graphic areas, the evidence of which is drowned out by broader declines elsewhere in the state.But urban areas, where such localized effects are most likely, have generally seen sharp de-clines in crime over the past several decades, suggesting that any such effect is likely small.
8 The phrase “at least since the early 1990s” appears dozens of times in this paper, so itmay be helpful to explain the two key reasons why this limitation is invoked so often. First,crime rose steadily from 1960 to 1991 (with a brief pause in the early 1980s), and it then fellsteadily from 1991 to today. There is no reason to assume that the causes of prison growthduring a period of rising crime are the same as those during a period of declining crime. But—and this is the second reason—there are important limitations in the available data (specifi-cally, data on prosecutorial behavior) that make it hard to look back past 1994. Thus thequalified restriction: some of the effects discussed here could also have played similar rolesprior to 1994, but there currently is a lack of sufficient data to see if they in fact did. See JOHN
F. PFAFF, THE CENTRALITY OF PROSECUTORS TO PRISON GROWTH (forthcoming) (discussingboth the limitations in the data and the importance of looking at prosecutors).
Taken together, these findings suggest that the effects of the War onDrugs are often relatively slight compared to other causes, and that they arecertainly not as big as many often assert. In reality, a majority of prisongrowth has come from locking up violent offenders, and a large majority ofthose admitted to prison never serve time for a drug charge, at least not astheir “primary” charge.9 These results pose a challenge to those who wish toaggressively scale back incarceration, since the current politics of reducingsanctions for drug offenders is less complicated than that for reducing pun-ishment for violent or property offenders. Reforming drug statutes is easier,but doing so will likely not effect significant change in the overall incarcera-tion rate.
Yet policymakers and the public may still want to reduce the scope ofthe War on Drugs. At any given point over 200,000 people are in prison ondrug charges, and perhaps as many as 1.6 million inmates passed throughstate prisons between 2000 and 2012 on drug convictions. States spend sev-eral billion dollars a year incarcerating drug offenders, and the personal,familial, and social costs to inmates and their families are greater still; it isunlikely that these costs are justified by whatever benefit drug enforcementproduces, especially on the margin. Even if reducing the scope of the War onDrugs has surprisingly little impact on overall prison populations, the collat-eral benefits of such a roll-back could justify the efforts.
Thus, Part III considers the options available to state legislatures. Thefindings here are somewhat pessimistic. Legislatures have a limited set oftools. The two primary ones are the reduction of sentence lengths and thedecriminalization of drug offenses. But drug offenders already serve rela-tively short sentences—in the sample of disproportionately-Northern anddisproportionately-liberal states used here, the median stay in prison for adrug offender is generally about a year. And relatively few people appear tobe in prison on marijuana charges, which is the drug most amenable todecriminalization. Legislatures also have control over how recidivist statutesare written and the conditions that trigger parole violations, but neither ofthese seem to play a major role in prison growth either, at least with respectto drug offenders.
Furthermore, the ways in which the War on Drugs might matter themost are the ones over which the legislature have little control: police deci-sions about who to arrest, and prosecutorial choices about who to charge andwith what specific crimes. Police respond to city officials, and the districtattorney is typically a county-elected official with little or no higher-leveloversight. Moreover, police and prosecutors are granted significant discre-tion, and courts are loath to second-guess their decisions. That is not to say
9 Technically speaking, the claim that “a large majority of those admitted to prison neverserve time for a drug charge” means that for that majority of inmates the most serious chargewas never a drug charge. Many inmates are convicted of multiple charges, and someone con-victed of a violent or property offense along with a drug charge will be classified as a “vio-lent” or “property” offender, not a “drug” offender.
that legislatures cannot influence police and prosecutorial behavior, and Iwill consider a few options below, but the options are much more compli-cated to adopt.
Finally, this article concludes by acknowledging the implications of animportant definitional choice this paper makes. Throughout, “drug offender”refers to someone convicted of a drug offense, not someone who commitscrimes while on drugs or in furtherance of a drug habit, nor someone whocommits violent crimes as a result of the disruptions caused by drug enforce-ment. These last two categories are both theoretically valid definitions of“drug offenders,” and it is important to acknowledge the implications ofusing a narrower, albeit still wholly legitimate, definition. That said, thisdefinitional choice does not in any way undermine the core thrust of thispaper, namely that the impact of the war on drugs on prison growth is signif-icantly overstated throughout academic, journalistic, and policy debates onprison growth.
II. THE VARIOUS (SURPRISINGLY WEAK) LINKS BETWEEN
THE WAR ON DRUGS AND PRISONS
Michelle Alexander, in her deeply flawed The New Jim Crow,10 unam-biguously lays out the standard account of the connection between the Waron Drugs and prison growth:
The impact of the drug war has been astounding. In less than thirtyyears, the U.S. penal population exploded from around 300,000 tomore than 2 million, with drug convictions accounting for a major-ity of the increase.11
Alexander is not an outlier, but rather represents the mainstream perspectiveon prison growth. This section, however, will point out that this claim iswrong in multiple ways. Part II.A shows that the simple point Alexander(and most others) are making, that the direct incarceration of defendants fordrug crimes has driven up prison growth, is blatantly false. The remainingsections then demonstrate that even adopting more sophisticated perspec-tives on the link between drug enforcement and prison growth fails to sal-vage the mainstream perspective.
10 See James Forman, Jr., Racial Critiques of Mass Incarceration: Beyond the New JimCrow, 87 N.Y.U. L. REV. 21 (2012) (highlighting many of Alexander’s significant structuralflaws); John F. Pfaff, Waylaid by a Metaphor: A Deeply Problematic Account of PrisonGrowth, 111 MICH. L. REV. 1087 (2013) (discussing the empirical shortcomings of Alexan-der’s argument); see also, John F. Pfaff, Escaping from the Standard Story: Why the Conven-tional Wisdom on Prison Growth is Wrong, and Where We Can Go from Here, 26 FED. SENT’G
Basic statistics about prison populations rebut the claim that drug incar-cerations have driven America’s prison boom. Figure 2 plots the share ofstate prisoners12 whose primary charge13 was a drug offense. Several featuresstand out. First, the sharp relative rise in drug offenders begins about five toten years after the slow, steady rise in incarceration began. Second, at therelative peak of drug incarcerations, in 1990, approximately 22% of all in-mates were drug offenders—or, phrased more starkly, over three-quarters ofall state prisoners were serving time primarily for non-drug offenses. Andthird, since about 1990, even as prison populations continued to rise, theshare of drug inmates has actually slowly declined, hitting about 17% by2010. Each of these features clearly discredits the argument that drug incar-cerations have driven overall incarceration.
12 The focus on state offenders is appropriate here because (1) nearly 90% of all prisonersare state offenders, (2) the federal system disproportionately targets drug offenders due to itslimited criminal jurisdiction, and (3) the budgetary and political pressures on federal criminalagencies differ so widely from those on state criminal justice actors that it is impossible toextrapolate federal outcomes to state ones. That said, little changes by including the federalsystem. While about 50% of federal prisoners are serving time for drug offenses, only 11% ofUS prisoners are in the federal system. So adding in the federal prison system raises all thepercentages here by about five points (i.e., if 17% of state prisoners in 2010 were serving timefor drug crimes, then 22% of all US prisoners were doing so).
13 Since offenders can be convicted of multiple charges, some sort of rule is needed todetermine whether someone incarcerated for arson and heroin trafficking is a “violent” or“drug” offender. The rule employed by the NPS (the aggregate state-level prison counts) andthe Survey of Inmates in State and Federal Correctional Facilities is that any violent offensetrumps any property crime, and any property crime outranks drug offenses. Results derivedfrom National Corrections Reporting Program (“NCRP”) data classifies an offender by theoffense that carries the longest sentence, under the assumption that that is most likely the mostserious one.
FIGURE 2: PERCENT OF PRISONERS SERVING TIME FOR DRUG OFFENSES,
1980–2010
Note: Data from NPS.14
The relative unimportance of the War on Drugs can be seen anotherway. Between 1980 and 2009, state prisons added approximately 1.07 mil-lion prisoners, as the prison population shot up from 294,000 to 1.36 mil-lion.15 Table 1A disaggregates the growth across four types of offenses:violent, property, drug, and other.
TABLE 1A: VARIOUS OFFENSES’ CONTRIBUTION TO STATE PRISON
GROWTH, 1980–2009
%1980 2009 % Change Contribution
Total 294,000 1,362,000 363%
Violent 173,300 724,300 318% 52%
Property 89,300 261,200 192% 16%
Drug 19,000 242,200 1175% 21%
Other 12,400 134,500 985% 11%
Note: Data from NPS.16
14 See BJS/NPS Data, supra note 2. R15 Id. During the sample period, California becomes an extreme outlier in its use of parole
violations. Given that it houses approximately 10% of all U.S. prisoners, it can skew national-aggregate statistics.
While drug prisoners had the fastest rate of growth, that is because theirinitial base rate was so low: fewer than 1/15 the number of violent prisonersin 1980. Their overall contribution to total population growth, however, issmall. Between 1980 and 2009, state prisons added a net 223,200 drug in-mates, which is only 21% of the total net increase of 1,068,000.17 Con-versely, the additional 551,000 violent offenders—an increase 2.4 timeslarger than that for drug offenders, despite a small percentage change—con-tributed over half of the net increase in prisoners; violent and property of-fenders combined contributed more than two-thirds.18 In other words, if noone was admitted to prison on a drug charge between 1980 and 2009, thenthe state prison population in 2009 would have been 1.12 million instead of1.36 million: a 3.7-fold increase rather than a 4.5-fold one (assuming, ofcourse, all else constant).
There is a valid criticism, however, that can be leveled against Table1A: by focusing on the entire period of 1980-2009, I stack the deck againstdrug offenses, which peaked in relative importance in 1990 (at 22% of allstate inmates). Could they have contributed much more to growth upthrough 1990, even if not such much beyond then? To assess this, Table 1Bbreaks Table 1A up into two periods, 1980-1990, and 1990-2009:
TABLE 1B: VARIOUS OFFENSES’ CONTRIBUTION TO STATE PRISON GROWTH,
1980–1990, 1990–2009
%% Contrib,
Contrib, 1990 –1980 1990 2009 1980 – 90 2009
Total 294,000 681,400 1,362,000
Violent 173,300 316,600 724,300 36% 60%
Property 89,300 173,700 261,200 22% 13%
Drug 19,000 148,600 242,200 33% 14%
Other 12,400 45,500 134,500 9% 13%
Note: Data from NPS.19
The results here do shift a bit. Drug offenses are still not the dominantcontributor to prison growth, even during the first stage of rising incarcera-
17 The math: 223,200 = 242,200 – 19,000, and 1,068,000 = 1,362,000 – 294,000.18 Failing to account for base rates is a common mistake. For example, people often point
to the fact that women are the fastest rising segment of prison populations, which is true:between 1978 and 2008, the year that the number of women in U.S. prisons peaked, the num-ber of women in prison grew by 818%, the number of men by 410%. Yet, at the same time, theincreased incarceration of men was responsible for over 92% of the overall increase in incar-ceration. The reason is simply that there were so few women in prison in 1978—11,583,compared to 282,813 men—that a relatively small absolute increase (to 106,358 in 2008)translates into a relatively large percentage change.
tion, but their role in the 1980s is on a par with the locking up of violentoffenders. When the crime drop begins, however—which is when one mightexpect drug offenses to become more important, since they are more discre-tionary—the importance of drug offenses declines precipitously, and the in-carceration of violent offenders dominates. In other words, whatever thehistorical importance of drug offenses to prison growth, the incarceration ofdrug offenders is not a central causal factor today.20
Also, consider the following important side-note: that drug offenderscomprise only a relatively small share of prison populations also underminesanother common criticism of the War on Drugs, namely that drug incarcera-tions explain the racial imbalance in prison populations. Consider Table 2,which summarizes the most recent statistics on race and incarceration fromthe Sourcebook of Criminal Justice Statistics.21
TABLE 2: RACIAL DISTRIBUTION OF STATE PRISONERS, 201022
Number Percent for Category
Offenses Totals White Black Hispanic White Black Hispanic
All 1,362,028 468,529 518,763 289,429 34.4% 38.1% 21.2%
Drug 237,000 69,500 105,600 47,800 29.3% 44.6% 20.2%
Other 150,400 56,400 50,500 35,600 37.5% 33.6% 23.7%
Note: Data from NPS.23
Putting aside the debate over what constitutes a “proportionate” incar-ceration rate across races,24 and regardless of how “right” or “wrong” it is
20 This is particularly true since, as Part II.A2 shows below, drug offenders serve fairlyshort sentences, so almost none of those admitted for drug violations in the 1988–1990 periodremain in prison today.
21 Estimated Number and Percent Distribution of Prisoners Under Jurisdiction of StateCorrectional Authorities, SOURCEBOOK OF CRIM. JUST. STAT. ONLINE (2013), http://www.albany.edu/sourcebook/pdf/t600012010.pdf, archived at http://perma.cc/E4XK-KCJT.
22 Id. Note that percentages do not necessarily sum to one since other races are omitted.Also, while “Hispanic” is technically an ethnicity, not a race, the data separate out non-Hispanic whites from Hispanics. In the incarceration data used here, almost all Hispanics (wellover 90%) identify as white, not black, when asked about race.
23 See BJS/NPS Data, supra note 2. R24 The core challenge with such a debate is that blacks appear to commit violent crimes,
especially serious violent crimes, at higher rates than whites, and the racial composition ofdrug dealers (as opposed to users) is unknown. For example, about 50% of all murderers areblack, and blacks comprised about 50% of all murderers in prison in 2010 (70,100 out of166,700—if anything, at 42% blacks seems somewhat under-represented). As crimes becomeless severe, however, declining reporting rates and more discretionary arrest decisions makeracial breakdowns harder to compute, so one should be wary of generalizing murder results tolesser offenses. See HENRY RUTH & KEVIN R. REITZ, THE CHALLENGE OF CRIME: RETHINKING
OUR RESPONSE 32–35, 103–04 (2006). As for drug offending, it is widely noted that drug useappears to be racially proportionate, although the sources of data on drug use (household and
for 38% of prisoners to be black, Table 2 demonstrates that scaling back theincarceration of drug offenders will have little effect on overall racial dispar-ity. If we were to release every inmate serving time for a drug offense in2010, the total prison population would fall from 1,362,028 to 1,125,028,and the percentage of that population that was white/black/Hispanic wouldchange from 34.4%/38.1%/21.2% to 35.5%/36.7%/21.5%. In other words,the percent of the prison population that is black would fall by only 1.4percentage points (from 38.1% to 36.7%), and the white-black gap wouldnarrow only slightly, from 3.8 percentage points (34.3% vs. 38.1%) to 1.2percentage points (35.5% vs. 36.7%). The minor effect of drug incarcera-tions on the racial compositions of prisons should not be surprising, giventhat drug offenses make up such a relatively small fraction of all offenders.In short, there simply are not enough drug offenders in prison to move thenumbers substantially.
B. Drugs and Technical Parole Violations
Even if direct drug admissions are not driving up prison populations,perhaps “indirect” ones are, namely drug-related parole violations. A pa-rolee (for any crime) returned to prison due to, say, failing a drug test couldbe seen as a victim of the War on Drugs, or at least of the punitive attitudestoward drug use that fuel the war. And some have expressed concern aboutthe increasing impact of “technical” revocations—such as those due to fail-ing a drug test—on prison populations. This section examines both the“big” and “small” versions of this argument. The “big” argument is thatparole violations in general play a major role in prison growth, and the“small” is that technical violations drive parole revocations. Both argumentsare wanting.
My disagreement with the “big” point is perhaps more philosophicalthan empirical. It is true that revocations are rising, but the causal connectionlikely runs in the opposite direction: parole revocations are rising becauseprison populations are rising, not the other way around. After all, not onlyare parole revocations rising, but so too are parole releases. If, say, 40% ofall prisoners are paroled each year, and 75% of all parolees violate back toprison within a year of release, then if the prison population rises from100,000 to 150,000, the number of parole revocations could rise from 30,000to 45,000—not as the cause, but as the result of prison growth.
school surveys, emergency room admissions for overdoses) may be biased in ways that corre-late with race. See, e.g., David M. Ledgerwood et al., Comparison Between Self-report andHair Analysis of Illicit Drug Use in a Community Sample of Middle-age Men, 33 ADDICTIVE
BEHAV. 1131, 1136 (2008) (reporting that African-American men tend to under-report cocaineuse). But even if users are racially proportional, that does not mean that dealers need be(though they could be). And, unfortunately, there is almost no data on the racial compositionof dealers outside of arrest data, and the pool of arrestees could reflect racial biases in enforce-ment, either due to individual officer bias or to structural effects in how police are deployedmore broadly.
The problems with the “small” point are more empirical. There simplyare not enough technical violators returning to prison for such revocations toplay a significant role pushing up the number of returning violators, muchless prison populations more generally. This argument becomes evenstronger when we realize that many of those whose parole is revoked fortechnical violations are also guilty of non-technical violations, such as newsubstantive offenses, at the same time.
1. The “Big” Point: The Epiphenomenon of Increasing ParoleRevocations
That people posit a link between parole revocations and prison growthis understandable. Consider Figure 3A, which plots the number of prisonersreleased onto parole and the number of parolees violated back to prison forall fifty states except California. As the prison population rose, so too do didthe number of parole releases and parole revocations: between 1978 and2012, prison populations grew by 376%, parole releases by 339%, and pa-role revocations by 606%.25 Parole revocations rose much more quickly thanthe population as a whole, which at first glance implies that they may haveplayed a role in pushing populations up—although, as always, base ratesmatter.26
Figures 3B and 3C, however, quickly complicate that simple narrative.Figure 3B plots both annual releases (whether onto parole or otherwise) as apercent of total prison population and annual parole releases as a percent ofall releases. What Figure 3B shows is that about 45% to 50% of the totalprison population is consistently released each year, and that parole releasesare consistently about 70% of all releases. In other words, as prison popula-tions marched steadily upwards from the 1980s into the 2010s, a relativelyconstant fraction of inmates was released each year, and a relatively constantfraction of those released were released onto parole.27
Figure 3C then attempts to estimate the extent to which the risk of pa-role revocation changes over time, by computing—roughly—the fraction ofa year’s parole releases that are revoked the following year. For example, they-axis measures, say, the number of parole revocations in 1990 divided bythe number of parole releases in 1989; the lag is used to capture the fact that
25 See BJS/NPS Data, supra note 2. During the sample period, California becomes an Rextreme outlier in its use of parole violations given that it houses approximately 10% of allU.S. prisoners, it can skew national-aggregate statistics.
26 Id. The base rate for parole revocations in 1978 was 1/13 that for prison populations and1/5 that for parole releases: 19,830 parole revocations in 1978 compared to a prison populationof 256,148 and 88,830 parole releases.
27 Id. Both the share of releases and parole’s share of those releases declines somewhat inthe mid-1990s, which is likely due to the adoption of parole-restricting policies such as Truth-in-Sentencing Laws in the wake of the Violent Crime Control Act of 1994. Note, though, thatboth rebound a bit in the 2000s and the total drop for each is about five points.
parole revocations are not immediate.28 This rough estimate of the risk ofrevocation does trend upwards from the late 1970s to the early 1990s, butover the course of the 1990s and 2000s it is generally stable, if somewhatnoisy.
Taken together, then, these figures tell an interesting story: while parolerevocations have risen, this rise seems to be the result of prison growth, notits cause. As prison populations have risen, a relatively constant fraction ofprisoners have been released in general, and released onto parole in particu-lar. And at least since the 1990s, the risk that these parolees would be vio-lated back to prison has remained fairly constant as well. These resultsstrongly suggest that at least from the 1990s on, prison growth has driven upparole revocations, not the other way around.
The claim that growth is causing revocations rather than revocationsdriving growth is further supported by Figure 3D, which plots the percent ofprison admissions that are parole revocations. As admissions grew over thecourse of the prison boom, the share of parole revocations in each admis-sions cohort has been fairly stable, again at least since the early 1990s. Andeven before then, it only rose by about ten percentage points over fifteenyears. In other words, while admissions rose by 28% between 1994 and2012, the share of admissions due to parole revocations rose by about onepercentage point, from 25.7% to 26.7%. Note, too, that prison growth ap-pears to be driven entirely by admissions,29 not by time served; that paroleviolations are not driving up admissions implies that they are not driving upprison populations overall.
28 Id. The core assumption here is that if 30,000 inmates are paroled in 1989 and 20,000are violated back in 1990, then all those 20,000 come from the 1989 cohort of parole releases;this estimates the risk of revocation for the 1989 release cohort as 2/3. This is, of course, notentirely realistic, since many parole revocations take place more than one year after release.But a comprehensive BJS study did find that a large percent of revocations occur within thefirst three years of release. See PATRICK A. LANGAN & DAVID J. LEVIN, BUREAU OF JUST.
STAT., RECIDIVISM OF PRISONERS RELEASED IN 1994 (June 2002), available at http://www.bjs.gov/content/pub/pdf/rpr94.pdf, archived at http://perma.cc/Q7N7-Q85Z. I considered morecomplicated approaches to account for the fact that revocation takes time, such as looking atthe ratio of parole revocations in year t to a weighted average of parole releases in years t-1, t-2, and t-3. But the results were consistently similar, suggesting that this simple approximationis an effective representation of what was taking place.
29 See John F. Pfaff, The Micro and Macro Causes of Prison Growth, 28 GA. ST. U. L.
REV. 1239, 1242 (2012); see also PFAFF, CENTRALITY, supra note 8; Pfaff, Escaping, supranote 10. Between 1994 and 2008 (endpoints dictated by limitations in the data), arrests fell,and both the probability that a felony case resulted in a prison admission and the time servedfor that admission remained flat. But the probability that an arrest resulted in a felony filing inthe first place (and thus ultimately in an admissions) soared.
The argument here can be summarized with a simple metaphor. As-sume there is a boat filling up with water, and someone is trying to bail it outwith a bucket. But the bucket has a vertical crack along its side, so a fixedpercent of the water that goes into the bucket falls out again back into theboat. Is the water from that crack causing the boat to fill with water? It feelsas though the answer should be “no”; something else is causing the waterlevels in the bucket to rise, and the increase in water that leaks is merely aresult of that.
That is the “big” critique. But even if one remains convinced that pa-role revocations are important—and it is true that prison growth would havebeen slower had there been fewer revocations—it is still possible to arguethat whatever role parole revocations are playing, drug-driven parole revoca-tions, specifically technical violations, are not an important part of that role.
2. The Minor Effect of Technical Violations
Not all parole violations are created equal: some parolees return toprison after committing new, serious offenses, others after more “technical”violations such as failing drug tests or failing to satisfy other more-regula-tory conditions of parole. Most of the datasets on prison admissions gatheredby the Bureau of Justice Statistics record that an admission is due to parolerevocation, but rarely why parole was revoked. The exceptions here are theperiodic Survey of Inmates in State Correctional Facilities and the Survey ofInmates in Federal Correctional Facilities.34 The most recent wave of thesurvey, conducted in 2004, interviewed a nationally-representative sample of14,499 inmates in state prisons across the country. Among the hundreds ofquestions it asked each inmate was whether that inmate had had parole re-voked and, if so, why.35
Table 3 summarizes the 2004 Survey’s results for its questions aboutwhat, if anything, an inmate did to trigger a parole revocation. The firstcolumn gives the percentage of all inmates reporting the various reasons forrevocation, the second column the percentage of all inmates who were ad-mitted for violating parole.36
34BUREAU OF JUST. STAT., THE SURVEY OF INMATES IN STATE CORRECTIONAL FACILITIES
AND THE SURVEY OF INMATES IN FEDERAL CORRECTIONAL FACILITIES QUESTIONNAIRE (2004)[hereinafter SURVEY OF INMATES] , http://www.bjs.gov/content/pub/pdf/sisfcf04_q.pdf,archived at http://perma.cc/JGZ4-J47W.
35 Id. That the Survey’s sampling method is restricted to national-level estimates is obvi-ously a serious limitation, given that outcomes vary widely and importantly across states andeven counties, but the Survey provides the most detailed picture of those serving time in prisonand one of the few comprehensive sources on the causes of parole revocations.
36 Given the sample size, the error bars around the estimates are sufficiently small thatthey are omitted here. Note that the percentages in the second column sum to more than 100%because some people report more than one reason for being sent back. Id.
Failed to report to drug/alcohol treatment 0.4% 2.2%
Failed to report for other counseling 0.4% 2.3%
Failed to report to parole officer 2.7% 17.1%
Left jurisdiction without permission 0.7% 4.3%
Failed to find/maintain employment 0.2% 1.0%
Failed to pay fines 0.3% 1.7%
Contact with known felons 0.2% 1.1%
Possession of gun 0.3% 1.7%
Other reason 1.6% 10.3%
Note: Data from the 2004 wave of the Survey of Inmates in State and Federal Correctional
Facilities.37
These statistics demonstrate that drug-related technical violations—fail-ing a drug test, failing to take a drug test, or failing to report to treatment—play minimal roles in overall admissions, and even fairly minor roles withinthe pool of parole revocations. And Table 3 actually overstates the role oftechnical violations since, as mentioned above, inmates often reported multi-ple reasons for being violated back. And revocation for a new offense—arguably the least technical of all violations—is reported by 26% of thosewho also failed a drug test, 29% of those who also failed to report to a drugtest, 31% of those who also failed to report to treatment, 36% of those whoalso failed to report to other treatment, and so on.38 Moreover, for over halfof those who reported both a new offense violation and a drug test violation,the new offense was something more serious than a drug crime—either aviolent or property offense. Only 22% of those who reported failing paroledue to both a technical drug violation and a new offense reported that thenew offense was a drug crime.
Furthermore, new drug offenses do not appear to be triggering paroleeviolations at a significant rate. Among those violated back for a new offense,a drug offense was the top new charge in only 20.3% of the cases. Violent
37 See SURVEY OF INMATES, supra note 34.38 Given some irregularities in the data, the estimates of technical violators who also have
non-technical, new-substantive-offense violations likely understate these values, perhapssomewhat substantially. See id.
and property offenses comprised 60.3% of all revoking new offenses: 37.5%violent, 22.8% property.39 As with so many of the other potential connec-tions between the War on Drugs and prison growth, despite intuitive linksbetween rising incarceration rates and parole revocations, and technical rev-ocations in particular, the data seem to imply that any such effect simply isnot that strong.
C. The Role of Admissions: The Apocryphal Revolving Door
When we talk about incarceration in the United States, we tend to focuson the stock of prisoners in prison on any given day, not the flow of prison-ers through the system. The claim that the United States has the highestincarceration rate in the world, for example, rests on comparing the one-dayprisoner count in the United States to that in other countries.40 But despite allthe rhetoric about long sentences, most prisoners in the United States servefairly short sentences,41 so looking only at prisoner counts provides a poten-tially incomplete picture of the size, scope, and distribution of incarcerationin the United States, since the total population on any one day reflects only afraction of those passing through.
The severity of this oversight depends on who exactly is serving theshort sentences. Consider a prison system in which each person serves oneyear in prison, and over a ten-year period the country incarcerates one mil-lion people per year. If each person is only admitted once, then the onemillion people in prison in the tenth year represent only one-tenth of the tenmillion people who passed through prison during that decade. On the otherhand, if the same million people are admitted each year, then the total popu-lation in the tenth year is equal to the number of people who have passedthrough over that decade. In the latter case, it is not so much that sentencesare short as it is that inmates are serving long sentences on, as some com-mentators put it, “the installment plan.”42 Moreover, if different categoriesof offenders serve different length terms in prison, then one-day counts pro-vide a skewed picture of who is passing through prisons.43
39 Approximately 7.5% of those claiming a parole revocation with a new offense do notreport the type of new offense, but even if all those are drug offenses the basic results here donot change. Id.
40 See, e.g., ROY WALMSLEY, INTERNATIONAL CENTRE FOR PRISON STUDIES, WORLD
PRISON POPULATION LIST (9th ed. 2011), available at http://www.idcr.org.uk/wp-content/uploads/2010/09/WPPL-9-22.pdf, archived at http://perma.cc/MKV2-CFC2.
41 See John F. Pfaff, The Myths and Realities of Correctional Severity: Evidence From theNational Corrections Reporting Program, 13 AM. L. & ECON. REV. 491, 506 (2011); see alsoPFAFF, CENTRALITY, supra note 8, 28–35; Pfaff, The Durability of Prison Populations, 2010 U.
CHI. LEGAL F. 73, 76 (2010).42 See, e.g., Sara Steen & Tara Opsal, “Punishment on the Installment Plan”: Individual-
Level Predictors of Parole Revocation in Four States, 87 PRISON J. 344, 345 (2007).43 The following example shows how the bias can arise. Assume that drug offenders each
serve one-year sentences and violent offenders (murderers, say) serve 50-year terms. In year 1,the state admits one drug offender and one violent offender, and year 2 two drugs offenders
From a policy perspective, understanding whether we are cycling thesame people through time and time again or admitting a host of people forjust one or two terms is important, as is understanding whether year-endcounts poorly estimate the distribution of offenders flowing through prison.Incarceration imposes a host of collateral costs on offenders and their fami-lies: reduced future income, adverse health effects, reduced marital options,strained familial relationships more generally, and so on.44 And many ofthese costs occur after only the first one or two stints in prison. In order tomake an accurate cost-benefit analysis of our incarceration policies—whichwould also take into account the costs of being a victim and the extent towhich reducing those costs via incarceration offsets the costs imposed onoffenders—we need to better understand exactly how many people passthrough prison gates, and the types of offenses of which they are guilty. Thisis especially true when it comes to drug offenders, where the costs to victimsare more indirect, and thus where the direct collateral costs are morerelevant.45
Identifying whether prisons were admitting the same people over andover again or not was, until recently, almost impossible due to a lack of data.But a recent revision to a major prisoner-level Bureau of Justice Statisticsdataset now allows us to do just that: by introducing inmate-specific identifi-ers, it is possible to determine whether an inmate admitted in 2007 is, say,the same one admitted in 2002 or someone serving his first term in prison.46
The data cover only the years 2000–2012, and only eight states (the Tier Astates) provide consistently reliable data, with another seven (the Tier Bstates) providing data that is slightly less reliable.47 And as the list of states
and one violent offender, in year 3 three drug offenders and one violent offender, and so on. Inyear 50 there are one hundred prisoners: 50 violent offenders (serving 50-year terms) and 50drug offenders (serving one-year terms). During that time, though, the state admitted 50 vio-lent offenders but 1,274 drug offenders. So drug offenders comprise 50% of the prisoners inyear 50 but 98% of the admissions to date.
44 One of the leading works in this area is BRUCE WESTERN, PUNISHMENT AND INEQUALITY
IN AMERICA (2006). See also COMM. ON CAUSES AND CONSEQUENCES OF HIGH RATES OF
INCARCERATION, THE GROWTH OF INCARCERATION IN THE UNITED STATES: EXPLORING THE
CONSEQUENCES (Jeremy Travis, Bruce Western & Steve Redburn eds., 2014) (review of thecollateral costs of incarceration).
45 Drug offenses are generally referred to as “victimless crimes,” although drug use im-poses real costs on its users (at least for more-serious drugs), and thus drug sellers are notexactly engaged in a victimless trade. But the nature of victim-ness is less clear in drug casesthan in clearly-nonconsensual violent and property crimes.
46 Data derived from NCRP. It has always been possible to observe that a state admitted1,000 inmates per year over a ten-year period. But now we can observe that the state admitted5,000 people once, 700 people twice each (for a total of 1,400 admissions), 400 people threetimes each (for a total of 1,200 admissions), and 600 people four times each (for a total of2,400 admissions).
47 The Tier A states are California, Colorado, Kentucky, Missouri, New York, Oklahoma,Pennsylvania, and Utah. The Tier B states are Georgia, Iowa, Michigan, North Dakota, Tennes-see, Oregon, and West Virginia. “Reliability” is measured by comparing the total number ofannual admissions in the NCRP to those gathered by the BJS’s National Prisoner Statisticsprogram, which gathers annual aggregate (rather than offender-level) prison population data.To qualify for Tier A, the number of NCRP admissions had to be roughly within +/- 10% of
in note 47 makes clear, there is an unfortunate northern/urban/industrial biasto these states, suggesting that some caution should be taken before extrapo-lating these results too broadly. But Tiers A and B nonetheless provide acomprehensive overview of admissions in the United States. Between 2000and 2012, 8.42 million prisoners were admitted to all state prisons in theUnited States, with 2.76 million (or 33% of all state admissions) in Tier Astates, and 3.78 million (or 45% of all state admissions) in Tiers A and Bcombined.
Table 4A reports the basic findings about how inmates cycle throughprison. The table gives the results for all inmates and then groups them intothree mutually exclusive categories: those who are never incarcerated for adrug offense, those who are only incarcerated for drug offenses (perhapsmultiple times), and those with multiple incarcerations for both drug andnon-drug offenses. The first six rows report the number of unique offenders:the 265,587 people admitted two times in Tier A states (the second row ofthe “All Admits” column) represent 531,174 admissions (two per person).“Total Offenders” measures the number of unique people who enter prisonover the entire 13-year sample (and is thus just the sum of the first six rowsof the table). “Total Admissions” measures the number of admissions,counting a single person entering three times as three admissions.48
TABLE 4A: DISTRIBUTIONS OF REPEAT ADMISSIONS, 2000–2012:
TIER A STATES
TimesAdmitted All Admits Never Drugs Only Drugs Some Drugs1 875,345 673,414 201,931 x
Note: Data from NCRP.49 Tier A states are listed in note 47. R
the NPS admissions count for every year. Tier B states have at least a few years where the twocounts diverge more significantly.
48 The value in total admissions is greater than the number of offenders multiplied by thenumber of times admitted, since the data here are censored. For concision, all those admittedmore than five times are clustered into one category. But the data indicate the exact number oftimes each inmate was admitted for those in the “more than five” category, and the value for“total admissions” reflects these real (uncensored) values.
49 The NCRP data is on file with the author [hereinafter NCRP Data].
TABLE 4A: DISTRIBUTIONS OF REPEAT ADMISSIONS, 2000–2012:
TIER B STATES
TimesAdmitted All Admits Never Drugs Only Drugs Some Drugs1 368,958 297,178 71,780 x
2 103,478 76,590 17,309 9,579
3 36,713 25,621 5,205 5,887
4 12,539 8,479 1,492 2,568
5 3,789 2,512 411 866
More than 5 1,416 928 149 339
Total764,162 579,622 130,983 53,557Admissions
Total526,893 411,308 96,346 19,239Offenders
Note: Data from NCRP.50 Tier B states are listed in note 47. R
Several major points stand out in Table 4A. First, most inmates admit-ted since 2000 served just one term, and almost 90% served no more thanthree (though we will consider a slight caveat to that claim below).51 Thismakes clear that prison is much more a flow than a stock: we need to paymore attention to admissions and less to total population. Second, offenderstend to “specialize” when it comes to drugs: most convicted of drug of-fenses are only convicted of drug offenses, even if they are incarceratedmultiple times. And third, most offenders are non-drug offenders.
This last point is perhaps the most surprising. Drug inmates’ share ofunique offenders is basically the same as their share of inmates: about 20%,or 26% if we count those convicted of both drug and non-drug offenses as“drug offenders,” compared to 17% of the total stock.52 No matter whetherlooking at the stock of prisoners in prison or the flow of admissions throughthe prison gates, violent offenders remain the primary engine of growth. Thisis a tricky issue for reformers because the politics of decarcerating violentoffenders is much more treacherous than that of reducing drug offenders.Not all violent offenders are murderers and serious assaulters, and manywould likely be better served by not being incarcerated, but the optics andpolitical risks of violent-offender decarceration are much tougher to navigatethan those for drug offenses. It is worth noting that aggregate statistics con-firm the finding here that looking at the flow of prisoners is as important, ifnot more important, than looking at the stock. Between 2000 and 2012, the
50 Id.51 In Tier B states, the effect is even stronger: over 90% (472,426 out of 526,893) serve no
more than two terms in prison.52 Tier A states admitted 1,442,810 unique offenders, of which 371,258—or 25.7%—are
either just-drug (300,733 or 20.1%) or some-drug (70,525 or 4.6%) offenders.
United States as a whole added slightly more than 100,000 prisoners to thestock of inmates, as the prison population rose from 1.5 million to 1.6 mil-lion. But during that same time, states admitted nearly 8.4 million people toprison.53 States admitted five prisoners for every one they held—and as theresults here indicate, these were not just the same people returning over andover again.
That is the broad overview. But one more technical point deserves someattention before moving on to the next drug-incarceration pathway. The re-sults above may understate the number of terms the median prisoner serves.What we really care about is how many terms the average offender serves,not how many terms those admitted between 2000 and 2012 serve. Table 4A,however, reports only the latter and surely underestimates the former. Atleast some of those who serve just one term during the sample period areadmitted for the first time toward the end of that period and are destined tobe readmitted sometime after 2012. To see if this potential error is a seriousconcern, Table 4B recreates Table 4A, but it restricts itself to just the 2000entry cohort. The thirteen-year follow-up period for that cohort enables us tobetter see how readmissions play out over a large portion of a person’s crimi-nally active life. The results in Table 4B indicate that Table 4A does under-state the number of times inmates return to prison, but not by much. Themedian number of admissions for all offenses rises from one to two, and thenumber of terms served by 90% of all inmates changed from three to fewerthan six. But drug offenders remain about 23% of all admittees, or 32% ifwe include the some-drugs category in that count.
TABLE 4B: DISTRIBUTIONS OF REPEAT ADMISSIONS, 2000: TIER A
TimesAdmitted All Admits Never Drugs Only Drugs Some Drugs1 77,390 54,807 22,583 X
2 40,210 27,639 9,234 3,337
3 25,203 16,906 5,144 3,153
4 16,627 10,932 3,090 2,605
5 10,601 6,745 1,947 1,909
More than 5 19,813 11,745 3,026 5,042
Total510,854 330,703 101,526 78,625Admissions
Total189,844 128,774 45,024 16,046Offenders
Note: Data from NCRP.54 Tier A states are listed in note 47. R
53 Perhaps most striking, between 2000 and 2012, New York state’s prison population fellevery year for a total decline of 16,000, even as it admitted over 198,000 unique people toprison (out of almost 327,000 total admissions).
TABLE 4B: DISTRIBUTIONS OF REPEAT ADMISSIONS, 2000: TIER B
TimesAdmitted All Admits Never Drugs Only Drugs Some Drugs1 24,053 19,394 4,659 X
2 11,883 8,441 2,125 1,317
3 6,357 4,238 961 1,158
4 2,943 1,939 357 647
5 1,143 752 127 264
More than 5 502 329 60 113
Total87,671 62,604 14,276 10,734Admissions
Total46,881 35,093 8,289 3,499Offenders
Note: Data from NCRP.55 Tier B states are listed in note 47. R
D. Drug Convictions and Repeat Offender Laws
Another potentially important, albeit generally under-studied, link be-tween the War on Drugs and incarceration is the possible interaction be-tween drug convictions and repeat offender laws. The intuition here issimple. Drug convictions may not result in long sentences themselves, butthey may provide the necessary predicate offenses for later non-drug crimesto trigger recidivist enhancements. All states employ various sorts of repeat-offender statutes, including the infamous, if rarely-used, “three strikes”laws,56 so this would appear to be a fairly easy way for drug convictions topush up incarceration rates.
The data in Table 4, however, highlight a serious limitation with thisclaim: most inmates serve only a few stints in prison. In particular, very fewinmates serve time for both drug and non-drug offenses, which are the casesin which drug convictions could act as recidivist “triggers” for more seriousnon-drug crimes.57 National aggregate statistics from the 2004 Inmate Sur-vey yield similar results: over 80% of inmates report no prior incarcerations.No matter how powerful such recidivist statutes are, they seem to be appliedto only a small fraction of prisoners.
55 Id.56 Although about half of all states have three strikes laws, it appears that about 90% of all
three-strike sentences are imposed in a single state, California. See FRANKLIN E. ZIMRING ET
AL., PUNISHMENT AND DEMOCRACY: THREE STRIKES AND YOU’RE OUT IN CALIFORNIA (2001).57 In fact, Table 4 overstates the number of such “triggerable” inmates, since the “some
drug” category does not differentiate the order of convictions. Thus someone convicted first ofheroin trafficking and then armed robbery is included in that category, as is someone firstconvicted of armed robbery and then heroin trafficking, even though only for the first inmatecould the drug conviction “trigger” the recidivist enhancement.
That said, there are two major limitations to the National CorrectionsReporting Program (“NCRP”) (and, similarly, the 2004 Inmate Survey) thatcomplicate the claim that prior drug convictions do not matter much. Thefirst, and most obvious, is that what we observe in both the NCRP and 2004Inmate Survey are prior incarcerations,58 not prior felony convictions, andrecidivist enhancements care about the latter. At first blush, incarcerationseems like a fair proxy for felony conviction, since felonies generally de-mand prison time. But many defendants may accept felony plea deals thatlimit incarceration to the often lengthy time served in jail awaiting trial, andsuch cases may not appear in the NCRP or the Inmate Survey. And unlikeoffender-level prisoner data, offender-level conviction data is not availabledue to an absence of comprehensive prosecutorial data, an issue this articlewill address in more depth shortly.
The second shortcoming is that even focusing on the impact of priorconvictions on subsequent punishments may miss the more important—butmore indirect and much harder to detect—ways in which prior drug convic-tions trigger tougher sanctions. The more relevant triggers may not be formalrecidivist-enhancement statutes but informal decisions by police and prose-cutors about which defendants to target and how harshly to treat them. Inother words, police may respond more aggressively to crimes believed to becommitted by those with more extensive (perhaps drug-related) priorrecords, or they may simply find it easier to clear such crimes since theoffenders are more likely to be under greater surveillance by parole or pro-bation officers. And prosecutors may charge repeat offenders more seriouslyand not necessarily via repeat-offender statutes. For example, prosecutorsmay charge aggravated assault more often than simple assault in borderlinecases, or adopt less compromising positions during plea bargain negotiations(perhaps in part because of the shadows cast by the repeat-offender laws).
That said, the police-severity point may not be that important, at leastfor overall prison growth, simply because arrests have declined even asprison populations have risen, at least since the 1990s.59 One interesting fea-ture of policing in the United States is that for all the changes in crime ratesand law enforcement tactics and technology over the years, clearancerates—the fraction of reported crimes for which police make an arrest—have remained fairly stable since the 1970s for serious (i.e., index) violentand property crimes, except that for murders, which has dropped by about 20points to around 60%.60 So arrests for index offenses have declined with the
58 The Survey asks inmates about their ten prior commitments to prison, but not aboutconvictions that do not result in prison time.
59 See, e.g., PFAFF, CENTRALITY, supra note 8. The results concerning arrests, prosecu- Rtions, and prison admissions used in this section all come from this paper unless otherwiseindicated.
60 Pfaff, Micro and Macro, supra note 29, at 1249. Clearance rates are computed only forthe index of violent and property offenses, but then these are the crimes most likely to result inprison time. It should be noted that clearance rates, like all estimates derived from the UniformCrime Reports (“UCR”), should be treated with some caution, given the well-documented
drop in crime. Even including arrests for serious drugs, which did rise some-what in the mid-2000s, combined arrests for index offenses and seriousdrugs declined by about 10% between 1994 and 2008.61
Changes in prosecutorial behavior, however, deserve more attention.The primary engine of prison growth, at least since crime began its declinein the early 1990s, has been an increased willingness on the part of districtattorneys to file felony charges against arrestees.62 During that time, crimehas declined, total arrests for index offenses and non-marijuana drug of-fenses have declined, and both the probability that a felony case results in aprison admission and the time spent in prison if admitted have been stable.Yet prison admissions, and thus total prison populations, have both steadilyincreased, because the probability that an arrest for a serious crime results ina felony case has risen dramatically. In other words, prosecutors have be-come substantially more aggressive over the past 25 years, for reasons thatare not yet understood.63
The connection here between the War on Drugs, longer criminalrecords, and increased prosecutorial aggressiveness is fairly straightforward.Increased drug enforcement results in defendants with longer felony recordsand prosecutors may be more aggressive against such defendants. They maybe less willing to plead down felonies to misdemeanor, or to drop casesaltogether; to divert to an alternative program, or to drop more seriouscharges. They may also be more willing to select charges that carrymandatory minimums even when there are viable alternate charges that carryno minimum. Such harshness could reflect increasingly punitive attitudes onthe part of prosecutors, perhaps in response to rising crime rates from the1960s to the 1990s, or to other political and social factors. Or it could be thatprosecutors have maintained a relatively constant approach toward chargingrepeat offenders, but the number of arrestees with long records has grown,thanks in part to drug-related convictions. Note, too, that prosecutors neednot be more aggressive just toward those with more convictions, but perhapsalso toward those only with more prior arrests, even if some of those arrestsnever resulted in convictions.
It is almost impossible, however, to empirically assess what shapesprosecutorial charging decisions—both whether to file in the first place andthe types of charges chosen—due to a striking absence of data. While thereare extensive datasets on crime (UCR, National Crime Victimization Sur-vey), arrests (UCR), and prisoners (National Prisoner Statistics, NCRP),there is no real equivalent for prosecutorial outcomes. The National Prosecu-
problems with UCR data. See, e.g., Michael D. Maltz, Look Before You Analyze: VisualizingData in Criminal Justice, in THE HANDBOOK OF QUANTITATIVE CRIMINOLOGY (Alex R. Pi-quero & David Weisburd eds., 2010).
61 “Serious” drugs here mean non-marijuana drugs, a restriction made to reflect the factthat marijuana arrests rarely result in prison time. See PFAFF, CENTRALITY, supra note 8. R
62 Id. at 5–22.63 They are not yet understood because this central impact of prosecutors is only newly
discovered; my paper appears to be the first to highlight it so sharply.
tors Survey sounds promising but only provides national-level data—despitethe fact that trends in prison growth are likely explained by county-levelvariations in prosecutorial behavior—and only looks at administrative issues(staffing size, etc.), not charging behavior.64 And the BJS’s State CourtProcessing Statistics (“SCPS”) looks at cases from filing to disposition andthus has the ability to shed some light on prosecutorial choices, but it toofails to provide usable data on charging decisions.65 In theory, one could atleast partially glean what is happening in prosecutors’ offices by comparingdistributional differences in arrestee and inmate populations, but arrest andprison datasets are not sufficiently detailed or comparable to do so.66 Sowhile it is certainly plausible that prosecutors are punishing recidivists moreaggressively via informal, but important, charging decisions, detecting anysuch effect is essentially impossible with the currently available data.
E. Drug Enforcement and Neighborhood Stability
Intense criminal enforcement—whether via arrests or incarcerations—has a complex relationship with community stability. Removing violent of-fenders likely increases neighborhood social cohesion, but incarcerating rel-atively nonviolent offenders can have a negative impact on communitysocial capital.67 Families are weakened both during and after incarceration,and ex-inmates find it hard to find employment and maintain relationships,
64 See STEVEN W. PERRY & DUREN BANKS, BUREAU OF JUST. STAT., PROSECUTORS IN
STATE COURTS, 2007—STATISTICAL TABLES (2011), available at http://www.bjs.gov/content/pub/pdf/psc07st.pdf, archived at http://perma.cc/56ED-TJLA.
65 There are several limitations with the SCPS. First, by picking up cases once charges arefiled, the SCPS cannot measure what shapes the decision to file charges in the first place,which may be the primary engine of prison growth. See PFAFF, CENTRALITY, supra note 8.Second, it has scant information about characteristics that may factor heavily in prosecutorialdecisions, such as prior criminal history. And the data are gathered in a sufficiently peculiarway that the BJS itself has issued a warning not to use the dataset for causal analysis. SeeSTATE COURT PROCESSING STATISTICS DATA LIMITATIONS, BUREAU OF JUST. STAT. (2010),available at http://www.bjs.gov/content/pub/pdf/scpsdl_da.pdf, archived at http://perma.cc/BAU7-2BWT.
66 For example, one could draw some inferences about how prosecutors take prior criminalhistory into account by observing the distribution of prior histories in the pool of those who arearrested and comparing it to the distribution of those admitted to prison. It may not be fair toattribute all of any such difference to prosecutorial case selection—sentencing laws and judi-cial behavior would matter as well—but the greater the gap, the more likely prosecutors aretaking prior records into account somehow. But the UCR provides only aggregate agency-levelcounts of arrests per type of crime broken out by only a few demographic variables (age andrace-and-sex). And the NCRP does not provide data on prior criminal history (except indi-rectly, as shown above in Part II.D, and then only from 2000 onward). So the UCR providesdata in too aggregated a form to see the distribution of prior criminal histories, and the NCRPprovides data at a better level of (dis)aggregation, but in insufficient detail.
67 See, e.g., Jeffrey Fagan & Tracey L. Meares, Punishment, Deterrence and Social Con-trol: The Paradox of Punishment in Minority Communities, 6 OHIO ST. J. CRIM. L. 173, 173-174 (2008).
both of which can contribute to future reoffenses and other social ills.68 Evenarrests without incarceration can disrupt individuals’ lives. An extensivecriminological literature suggests, for example, that even just arresting delin-quent youth can, in certain contexts, increase future adult offending by “la-beling” the youth as a delinquent.69 All these effects can undermineneighborhood stability.
There is, however, a chicken-and-egg problem here that is difficult toempirically disentangle. On the one hand, the collateral costs of drug arrestsand incarcerations could contribute to higher unemployment rates, highersingle-parenthood rates, and other weakened social outcomes that tend todefine high-crime, heavily-policed neighborhoods. On the other hand, thoseneighborhoods often see an increased reliance on drug sales in part becauseof these social pathologies. Estimating the extent to which higher drug en-forcement is causing social disorder rather than responding to it, or its symp-toms, is quite difficult, and well beyond the scope of this paper. That said, inthis period of generally low rates, it is likely that the scale of drug enforce-ment is inefficient, and that enforcement in high-enforcement areas, on themargin at least, is creating more harm than good.70
The most obvious connection between drug-enforcement instability andprison growth would be through crime: more instability leads to more crime,and more crime leads to larger prison populations. However, whatever mar-ginal effects on crime that drug enforcement may have, over the past twentyyears crime has fallen sharply while prison populations have risen steadily.If instability is contributing to rising incarceration rates, it cannot be throughincreased offending.
So how then might it be? One potential answer requires looking againat the actor most responsible for prison growth in recent years, the prosecu-tor. As outlined above, the primary engine for prison growth since the 1990shas been the increased willingness of prosecutors to file felony chargesagainst arrestees.71 During a time of falling crime, prosecutors became moreand more aggressive against offenders. Prosecutorial behavior is rarely stud-ied and poorly understood, but one possibility for why it may have changed
68 See, e.g., JOHN H. LAUB & ROBERT J. SAMPSON, SHARED BEGINNINGS, DIVERGENT
LIVES: DELINQUENT BOYS TO AGE 70 (2003).69 See, e.g., Anthony Petrosino et al., The Impact of Juvenile System Processing on Delin-
quency, in LABELING THEORY: EMPIRICAL TESTS 113, 114 (David P. Farrington & Joseph Mur-ray eds., 2014).
70 Note, though, that this is a historically contingent claim. James Forman, for example,has done an excellent job pointing out that activists in minority, high-crime neighborhoodsoften lobbied for tough drug sentencing laws, including the Rockefeller Drug Laws, becausethey bore the brunt of drug markets’ costs. Forman, supra note 10, at 36. In making this argu-ment, Forman significantly complicates the “New Jim Crow” hypothesis, which posits thatdrug enforcement was designed to curtail minority rights in a post-Civil Rights era.
71PFAFF, CENTRALITY, supra note 8. Between 1994 and 2008, felony filings rose by 37%, R
as the probability an arrest would lead to a felony case soared from 0.37 to 0.57; this riseappears to explain most to all of the rise in incarceration, with admissions rising by a similar40% over that time. Id.
is that prosecutorial aggressiveness stems from frustration over broader so-cial ills. While crime in poor urban areas may be falling, these areas remainsocially disadvantaged in many ways, and prosecutors may be acting moreaggressively in a perhaps ill-advised effort to “help” those communities de-velop stronger social capital. In other words, arrests that in the past wouldhave resulted in dismissal or misdemeanor charges may now be treated asfelonies by prosecutors who think that these lower-level offenses are con-tributing to general social disorder and who are frustrated by the disorder’spersistence even in an era of relatively low crime rates. Of course, if drugarrests and convictions contribute to lower social capital (at least on the mar-gin), then there is a bitter irony to this enforcement approach.72
Again, given the paucity of rigorous evidence about the drivers ofprosecutorial behavior, this is nothing more than a provocative hypothesis.But it does provide at least a plausible explanation for why prosecutors havebecome more punitive even as crime rates have declined. And regardless ofwhether this exact theory is correct, it is important to think about the compli-cated relationship between law enforcement and social disorder, especiallywhen it comes to offenses like drug crimes where police and prosecutorsalike have more discretion and more alternatives. Even if drug enforcementdoes not send that many people to prison, if it ultimately destabilizes neigh-borhoods more than it supports them, it may contribute to further enforce-ment—and enforcement costs—in those areas in ways that are perhaps hardto directly evaluate.
F. To Summarize
What, then, are the takeaways from all this? There are a few broadclaims that deserve highlighting:
1. Drug incarcerations do not contribute significantly to prison popula-tions, at least not directly. The numbers here are clear: Only 17% ofall prisoners are serving time for drug offenses. The increase in drugoffenders in prison explains only about 22% of prison growth. Andthe results are roughly the same when we look at admissions: indi-vidual drug offenders comprise only about 20% to 25% of thoseadmitted to prison.
2. Drug violations do not contribute significantly to parole revocations.And that is before even determining whether increasing parole viola-tions are a cause or effect of increased incarceration.
72 A further irony could be that increased drug enforcement could make the neighborhoodappear more disordered than it otherwise would. Greater enforcement can become ideologi-cally self-perpetuating, if it goes searching for crime, and finds it.
3. None of these numbers means that people should necessarily be in-different to whether the War on Drugs continues. Even if scalingback drug enforcement does not significantly reduce prison popula-tions, or at least not to the extent hoped for by reformers on bothsides of the aisle, it still could be a net social plus. Leaving moneyon the table is unwise, even if it is not as much as reformers wouldlike it to be.
4. The War on Drugs may have a more powerful effect in ways that areharder to observe, particularly through its impact on prosecutorialbehavior. Prosecutorial filing decisions appear to drive prisongrowth in recent decades, and it is an open question as to what hasfueled prosecutors’ increased aggressiveness. But longer arrest orconviction records could play a role, and drug enforcement actionsthat do not necessarily result in more prison time may nonethelesscontribute to these records.
5. The War on Drugs may contribute to the collateral costs of incarcer-ation such as reduced health, earnings, and familial stability, in waysthat are more avoidable than those associated with violent or prop-erty crimes, simply because the decision to use arrest and incarcera-tion is more discretionary for drug offenses. Furthermore, thesecollateral costs may contribute to general community instability thatleads either to a greater desire on the part of police and prosecutorsto punish violators even in a time of generally-declining crime.
Particularly because of Points 3 and 5, it is worth asking what legisla-tures still can do should they wish to rein in the reach of the War on Drugs.
III. THE OPTIONS AVAILABLE TO LEGISLATURES
On any given day, there are over 200,000 inmates serving time in stateprisons on drug charges,73 and something on the order of 1.1 million individ-uals have passed through state prisons since 2000 on at least one drug con-viction.74 Scaling back drug enforcement could yield significant social
73SOURCEBOOK, supra note 21.
74 This number simply crudely extrapolates the NCRP results developed in Part II to allfifty states. A total of 486,843 unique individuals were admitted to prison in Tier A and Bstates between 2000 and 2012 for at least one drug offense (i.e., either all or some of theiradmissions were for drug crimes), and Tier A and B states admitted about 45% of all admis-sions to state prisons during that time. Assuming Tier A and B states are a representativesample of all states, then a simple extrapolation yields a national drug admission number of 1.1million (mathematically, 486,843/0.45 = 1,081,873). Of course, the assumption that Tier Aand B states are a random sample of all states may well be incorrect, given that they appear tobe disproportionately urban, industrialized, and liberal. It is likely impossible to accuratelyadjust this simple extrapolation to account for the imbalance in the data, but the 1.1 millionfigure is likely a reasonable approximation.
benefits, even if doing so will not significantly reduce the scale of incarcera-tion in the United States. Moreover, regardless of the normative appeal ofreining in the War on Drugs, as a factual matter it is a goal with wide biparti-san support,75 so it is worth considering what legislatures can do to limit itsscope.
Unfortunately, legislative options, at least straight-forward ones, arelimited. The tools available to legislatures are fairly blunt and most of thedecisions driving drug-related sanctions are made by more-local actors overwhom legislatures have little direct oversight or control. The primary ap-proaches that legislatures can take are decriminalization, sentence reduction,and amending the rules for technical parole violations. Within these broadparameters set by the criminal code and its sentencing provisions, however,police, prosecutors, and parole officers and parole boards have wide discre-tion to act.
This section will begin by showing that these parameters are alreadynot “binding” on police and prosecutors, and thus adjusting them should notbe expected to be particularly effective. Legalizing drugs—specifically ma-rijuana, the only drug for which decriminalization is currently politically fea-sible—or reducing the official sanction will likely have little direct effect onprison populations, since few marijuana cases result in prison time already,even for distribution, and most drug offenders serve relatively short terms inprison. And Part II.B already established that parole reform will have onlyminor effects. None of which is to say that decriminalization, sentence re-duction, or parole reform will have no impact, only that whatever effectsthey have will be indirect and likely less effective than expected.
Given that the conventional reform efforts will probably have surpris-ingly little effect on incarceration overall, and even on the incarceration ofdrug defendants in particular, this section will also highlight some more rad-ical legislative approaches that could prove promising. The first is the possi-bility of imposing charging guidelines on prosecutors, and second wouldtarget the financial incentives of prosecutors in an effort to discourage themfrom focusing too much on drug offenders. Such tactics could actually besuccessful—particularly those that take aim at a peculiar aspect of most statebudgeting arrangements that make prison effectively “free” for prosecu-tors—and all are politically viable. For instance, New Jersey employs charg-ing guidelines, and California has aggressively attacked the budgetary moralhazard problem. That they are viable, however, does not mean that they are
75 See, e.g., AM. CIV. LIBERTIES UNION, SMART REFORM IS POSSIBLE: STATES REDUCING
INCARCERATION RATES AND COSTS WHILE PROTECTING COMMUNITIES (2011), available athttps://www.aclu.org/files/assets/smartreformispossible.pdf, archived at http://perma.cc/8WAZ-CL9; Tom Keane, From the Right, Common Sense on Drug Policy, BOSTON GLOBE (Aug. 9,2014), available at http://www.bostonglobe.com/opinion/2014/08/08/right-wing-takes-lead-reforming-crime-policy/zHD2ZJTsziq5qpEfKQHzML/story.html, archived at http://perma.cc/D7PZ-2B48.
easy to implement: the political risks are greater than more-traditional ap-proaches, and so far New Jersey and California remain outliers.
A. Decriminalization and Sentence Reduction
The two most direct tools available to the legislature are decriminaliz-ing drug offenses and reducing the sentences that attach to various drug vio-lations. Unfortunately, neither alternative is likely to make much of a dent indrug-related incarcerations. First, consider decriminalization. Althoughcountries such as Portugal have received significant attention for adoptingpublic-health based decriminalization policies for a wide range of seriousdrugs,76 at least in the United States the debate over decriminalization re-mains generally limited to marijuana. And as this section will make clear,marijuana offenses simply do not result in prison time.
Consider data from the NCRP, focusing here solely on the Tier B statesfor reasons that are wholly opaque, none of the Tier A states provide usabledata on the type of drug for which someone is incarcerated.77 Figure 4A plotsthe percent of drug (not all) inmates serving time for marijuana offenses inTier B states over the period 2000–2012. It is true that the share of marijuanatraffickers rose, but only to 10%; that of possessors fell to barely 0.6%. Anddrug offenders comprise only about 20% to 25% of all inmates in Tier Bstates, so that reduces the share of marijuana offenders to 2% and 0.1% ofthe overall prison populations in those states.
One note of caution, though, is that for approximately 25% of all drugoffenders in Tier B states, the drug of conviction is classified as “unspeci-fied,” with about 20% of those for trafficking and 5% for possession. If allof these “unspecified” drug offenders are unclassified marijuana offenders,then the pool of marijuana inmates obviously rises significantly, particularlyfor trafficking. There is no reason to assume that they are all marijuana of-fenders, but this gap in the data does suggest that the results in Figure 4Arepresent a lower bound on the extent to which marijuana decriminalizationwould reduce prison admissions. However, even in the extreme and unrealis-
76 See, e.g., Michael Specter, Getting a Fix, NEW YORKER (Oct. 17, 2011), available athttp://www.newyorker.com/magazine/2011/10/17/getting-a-fix, archived at http://perma.cc/6FG8-SB7D. Of course, one must be careful about extrapolating results in Portugal to theUnited States, given that Portugal is a culturally, ethnically, and religiously homogenous coun-try with a population barely more than that of New York City alone (10.5 million vs. 8.8million). See INSTITUTO NACIONAL DE ESTATISTICA, CENSOS 2011: RESULTADOS DEFINITIVOS
PORTUGAL 18 (2012), available at http://www.ine.pt/xportal/xmain?xpid=INE&xpgid=ine_publicacoes&PUBLICACOESpub_boui=148275789&PUBLICACOEStema=5414321&PUBLICACOESmodo=2, archived at http://perma.cc/9TLX-NVN7.
77 The NCRP disaggregates drug offenses into heroin, cocaine/crack, marijuana/hash,other, or unspecified. Without any explanation, every Tier A state classifies almost every drugoffense as either “other” or “unspecified.” This is surely impossible: it cannot be the case thatalmost every drug inmate in New York State is serving time for something other than heroin orcrack/cocaine (or marijuana). But it is also impossible to back out what the real drug offensesare for such inmates.
tic case where the full 25% of “unspecified” offenders are marijuana offend-ers, over two-thirds of all inmates serving time for drug offenses are stillincarcerated for non-marijuana crimes.
FIGURE 4A: PERCENTAGE OF DRUG OFFENDERS SERVING TIME
FOR MARIJUANA OFFENSES, TIER B STATES, 2000–2011.
Note: Data from NCRP.78 Tier B states are listed in note 47.
While marijuana decriminalization may not significantly reduce drug-related incarcerations, the story is slightly different when it comes to drug-related arrests. Figure 4B plots the share of drug arrests for marijuanacharges over the period between 1982 and 2012. Although the fraction ofdrug arrests for marijuana dropped significantly during the 1980s, as atten-tion turned to heroin and crack/cocaine, by the end of the 2000s about half(48%) of all drug arrests were for marijuana. Even if most of these arrestsare for possession and never result in any real jail time—in 2012, for in-stance, there were seven possession arrests for every sale arrest79—as notedabove, they can still be destabilizing.
78 See NCRP Data, supra note 49. R79 In 2012, 42% of all drug arrests were for marijuana possession, 6% for marijuana sale.
And at no point in the sample period do marijuana sale arrests top 10% of all drug arrests.
FIGURE 4B: PERCENTAGE OF DRUG ARRESTS FOR MARIJUANA OFFENSES,
1982–2012
Note: Data from Sourcebook of Criminal Justice Statistics.80
So while decriminalization will not have a significant direct effect ondrug-related incarceration, it could have a real impact on drug-related ar-rests. Yet the impact of such a reduction should not be overstated. Figure 4Cplots the percent of all arrests that are drug-related, whether for possessionor sale. As a share of all arrests, drug arrests increase until the 2000s, atwhich point they level out at around 12% or 13%.81 Thus the legalization ofall marijuana offenses—which exceeds even what has taken place in Colo-rado and Washington, the two states to have legalized marijuana most ag-gressively—would reduce drug arrests by about 48%, but drug arrests arejust 12% of all arrests. The total decline in arrests due to marijuanadecriminalization would thus be about 6%. Given that 12.4 million peoplewere arrested in 2011, that translates into nearly 720,000 fewer arrests: asignificant number, but one that is somewhat less impressive than expectedgiven the 48%-of-all-drug-arrests figure.
80 See Percent Distribution of Arrests for Drug Abuse Violations, SOURCEBOOK OF CRIM.
JUST. STAT. (2013), http://www.albany.edu/sourcebook/pdf/t4292012.pdf, archived at http://perma.cc/4ZQ6-82C5.
81 The same pattern holds if limited to serious arrests, i.e., sale/manufacture as a percent-age of sale/manufacture, index violent crime arrests, and index property crime arrests.
FIGURE 4C: DRUG ARRESTS AS PERCENT OF ALL ARRESTS, 1980–2011
Note: Data from the Arrest Data Analysis Tool.82
As with decriminalization, sentencing reductions sound promising, butsuch reforms are not likely to deliver the changes desired. The main issuesare that (1) inmates generally serve relatively short sentences in the firstplace, and (2) drug offenders serve shorter sentences than average prisoners.This is illustrated in Figure 5, which provides several perspectives on time-to-release in all Tier A states in the NCRP, excluding California.83 Figure 5Aplots the median time to release for drug offenders and non-drug offendersfor each entry cohort between 2000 and 2011.84 Figures 5B and 5C plot the75th percentile and 90th percentile times to release, respectively.85
82 Arrest Data Analysis Tool, BUREAU OF JUST. STAT., http://www.bjs.gov/index.cfm?ty=datool&surl=/arrests/index.cfm (last visited Oct. 30, 2014), archived at http://perma.cc/YV8K-YSKZ.
83 Californian inmates serve disproportionately short stints in prison, in no small part dueto California’s historically disproportionate reliance on parole releases and violations to man-age its prison population prior to Realignment. California comprises nearly half of the Tier Aobservations—1.52 million admissions over the sample period. Given this and its outlier sta-tus, it is important to treat California separately.
84 In other words, half of all inmates admitted in 2000 were released in slightly more than500 days, and half of all drug offenders admitted in 2000 were released in just under 400 days.The figure stops in 2011 since too few prisoners had been released from the 2012 entry cohortto compute enough of the variables of interest. Tellingly, even with data only through 2012, themedian time served by inmates admitted as late as 2011 can be computed, which only strength-ens the claim that time served is relatively short.
85 Not all years have 75th and 90th releases, since in some cases those inmates were notreleased as of 2012, the last year of available data.
As is clear in Figure 5, drug inmates (as well as non-drug offenders)serve fairly short terms in prison. The median time is on the order of aboutone year, with 75% of all drug offenders released in under two years, and90% generally out in slightly more than three. It thus seems that in mostcases the official maximum sentences for drug offenses are not binding. Thisis not to say that cutting the statutory sentence length will have no effect onincarceration rates—district attorneys may use the threat of long sentencesto induce pleas more quickly, for example—but it does mean that any sort ofeffect will be indirect and will operate in ways that are not fully understand-able given the lack of empirical data on how the plea bargain processoperates.
FIGURE 5A: MEDIAN TIME TO RELEASE, TIER A STATES, 2000–2011.
Note: Data from NCRP.86 Tier A states are listed in note 47.
Thus, decriminalization and sentence reduction will have only nominal,direct effects on incarceration in general—and likely on the incarceration ofdrug offenders alone. Yet both could still have some impact, although calcu-lating the scope of that impact is quite difficult. Decriminalization, for exam-ple, could significantly alter the scope of drug arrests, though its impact ontotal arrests would be much less.89 And sentence reduction could alter thethreats prosecutors are able to bring to bear during the plea bargain process.Both of these effects could be significant, but there is simply a lack of em-pirical knowledge at this point as to whether that would be the case.
B. Parole Reform
Reforming parole procedures is another avenue legislatures could pur-sue to reduce incarceration in general, and drug-related incarceration in par-ticular, but this approach too will likely not have a significant impact. Whilethe decision to grant parole is made by a state-level executive office (paroleboards are generally appointed by the governor) and the decision when torevoke parole is made by local probation officers, it is the legislature thatdefines the restrictions placed on parolees (such as the need to attend drugtreatment) and the violations that trigger revocation back to prison (such asfailing a drug test). Thus, for example, North Carolina recently made it eas-ier for probation officers to use non-incarcerative alternatives to deal withparolees who commit technical violations such as failing a drug test.90 In thiscase, the legislature may be relying on the discretion of probation officersnot to violate offenders back to prison (i.e., parole officers can, but need not,use alternatives). However, one could easily imagine a legislature mandatingthat certain low-level violations, such as certain types of drug-test failures,cannot result in revocation back to prison. That said, the results in Part II.B.above caution against putting too much weight on such changes. At least at anational level, technical violations are relatively unimportant; national re-sults mask significant state-by-state variation, however, so parole reformmay be more effective in some outlier states.
C. Regulating the Prosecutor
The challenge that state legislatures face is that the actor most responsi-ble for determining the scale of incarceration—the prosecutor—is one over
89 The Prohibition-like arguments in favor of decriminalization—that it would reduce non-drug offenses like murder by legalizing currently-illegal drug markets and reducing the need toresolve disputes in them with violence—likely do not apply with much force to the decriminal-ization of marijuana. See, e.g., Jeffrey A. Miron & Jeffrey Zwiebel, The Economic CaseAgainst Drug Prohibition, 9 J. ECON. PERSP. 175, 178 (1995).
90 See, e.g., LAUREN-BROOKE EISEN & JULIENE JAMES, VERA INST. OF JUST., REALLOCAT-
ING JUSTICE RESOURCES: A REVIEW OF 2011 STATE SENTENCING TRENDS 10 (2012), availableat http://www.vera.org/sites/default/files/resources/downloads/reallocating-justice-resources.pdf, archived at http://perma.cc/B9BK-NPXU.
whom they have almost no direct control. In 47 states, district attorneys aredirectly elected, and generally at fairly local levels; in the three states with-out direct elections,91 they are appointed by the state Attorney General, whois generally a directly-elected executive official (and thus again relativelyautonomous from the legislature).92 Furthermore, the budgets for prosecutorsare determined at the local/county level, so legislative control over the statebudget does not provide the legislature with direct control either (althoughits control over intergovernmental transfers may be important).
Actually, the fiscal situation is worse; not only do legislatures not havedirect control over prosecutorial budgets, but also they have effectivelygranted prosecutors almost unfettered access to state budgets.93 Locallyelected prosecutors determine whom to charge with felonies, crimes that re-sult in time spent in state-funded prisons. This creates an obvious moralhazard problem, which is amplified by the fact that lesser sanctions such asjail time, probation, or diversion are often paid for by the county.94 Thusincarceration in prison is actually “cheaper” for the prosecutor than some-thing less severe.
Yet despite the political and fiscal autonomy of prosecutors, there aresteps that legislatures could take to rein in their independence. First, theycould try to regulate their behavior directly by imposing prosecutorial guide-lines. After all, judges are often relatively independent of legislatures aswell, yet judicial guidelines have often been effective at regulating judicialsentencing practices.95 And such prosecutorial guidelines are not entirely un-heard of. As discussed below, New Jersey has adopted them, at least forpleading out drug cases. Admittedly, New Jersey is the only state to imple-ment such guidelines, and they were developed by the Attorney General (notthe legislature) as the result of judicial (not legislative) pressure in a statewhere the Attorney General has more control than most over local districtattorneys. Nonetheless, prosecutorial guidelines are worth at least someattention.
A more indirect, but perhaps more politically viable, approach is totarget prosecutors’ financial incentives for going after drug offenders. If fel-ony drug cases become more “expensive” to prosecutors, prosecutors will
91 These states are Alaska, Connecticut, and New Jersey. See STEVEN W. PERRY, BUREAU
OF JUST. STAT., PROSECUTORS IN STATE COURTS, 2005 2 (2006), available at http://www.bjs.gov/content/pub/pdf/psc05.pdf, archived at http://perma.cc/B6RJ-CF3X.
92 State attorneys general are elected in forty-five states, with the governor (a directly-elected executive official) appointing the AG in three others. See Matt Friedman, An ElectedAttorney General? Lawmaker Wants to Let Voters Choose, Not Christie, NJ.COM (Mar. 11,2014, 10:35 AM), http://www.nj.com/politics/index.ssf/2014/03/an_elected_attorney_general_lawmaker_wants_to_let_voters_pick_not_christie.html, archived at http://perma.cc/8FKD-BHSQ.
93 See WILLIAM STUNTZ, THE COLLAPSE OF AMERICAN CRIMINAL JUSTICE, at location 3059(Kindle ed. 2013).
94 See id.95 See, e.g., John F. Pfaff, The Continued Vitality of Structured Sentencing Following
Blakely: The Effectiveness of Voluntary Guidelines, 54 UCLA L. REV. 235 (2005).
likely pursue them less frequently. And if prosecutors are less inclined toprosecute drug cases, police may reduce their focus on drug arrests.96 Herethe most striking effort can be seen in California, whose “Realignment”process has attempted to push much of the financial obligation of convictingand incarcerating drug offenders onto the counties (and thus onto theprosecutors).
1. Direct Regulation: Prosecutorial Guidelines
Almost all states impose almost no substantive controls on prosecutors,even those with comprehensive judicial sentencing guidelines, despite thetremendous power prosecutors wield. The one exception is New Jersey,which has experimented with imposing rigorous plea bargaining guidelineson prosecutors, primarily for drug cases. Over the course of the 1990s, theNew Jersey Supreme Court held that prosecutorial discretion to invokecharges that carried mandatory minimums in drug cases, combined with re-strictive sentencing guidelines, violated the state’s separation of powers doc-trine.97 To remedy this problem, the court instructed the state AttorneyGeneral to draw up guidelines to regulate prosecutorial plea bargaining indrug cases. The current guidelines, called the “Brimage Guidelines,”98 run toover one hundred pages and instruct prosecutors about acceptable discounts,including aggravating and mitigating situations that permit lesser or greaterdiscounts. Trial courts have the authority to review plea decisions under an“arbitrary and capricious” standard.99
The Brimage Guidelines look very much like sentencing guidelines.They have a plea bargain grid with offense severity on one axis and priorcriminal history on the other, and a list of aggravating factors (including thatthe defendant resisted arrest and the crime occurred in a “quality of life”zone) and mitigating factors (including that the defendant is enrolled in atreatment program or has no prior court involvement) for prosecutors to con-sider. Based on the offense, prior history, and adjustments due to ag-gravators and mitigators, the prosecutor is given a plea range that he isallowed to offer. There are a host of exceptions, such as when the crime is
96 This would be true at least to some extent. In some cases low-level drug arrests may beused more as a means of order-maintenance, not drug control, with the primary goal being totemporarily detain the arrestee, not to necessarily convict him. These arrests would be rela-tively unaffected by a change in prosecutorial behavior.
97 See, e.g., State v. Brimage, 706 A.2d 1096 (N.J. 1998); State v. Vasquez, 609 A.2d 29(N.J. 1992); State v. Lagares, 601 A.2d 698 (N.J. 1992).
98 Named after Brimage, 706 A.2d 1096, the case that invalidated prior guidelines and ledto the most recent set of revisions.
99 See ST. OF N.J. DIV. OF CRIM. JUST., REVISED ATTORNEY GENERAL GUIDELINES FOR
NEGOTIATING CASES UNDER N.J.S.A. – EFFECTIVE FOR OFFENSES COMMITTED ON OR AFTER
SEPTEMBER 15, 2004 [hereinafter Brimage Guidelines 2], available at http://www.njdcj.org/agguide/directives/brimage_all.pdf (last visited Oct. 30, 2014), archived at http://perma.cc/MYP5-FM3K; see also Ronald F. Wright, Prosecutorial Guidelines and the New Terrain inNew Jersey, 109 PENN. ST. L. REV. 1087, 1104 (2005).
particularly heinous or when a conviction is difficult to secure,100 but theguidelines impose structure on when and how prosecutors secure plea bar-gains, and judicial oversight appears to encourage compliance with theguidelines.
Obviously, the Brimage Guidelines are a limited case. They werespurred by state supreme court resistance to sentencing guidelines, imposedin a fairly liberal state that is one of the few whose district attorneys report tothe state Attorney General, and apply to only a narrow set of crimes. Yet it isinteresting to note that the scope of covered crimes has expanded beyonddrug cases, as the state Attorney’s General office has already developedguidelines for sex offender registration among other offenses.101 There isclearly at least some support for such guidelines in New Jersey.
And there is no obvious reason—absent aggressive lobbying by politi-cally-powerful prosecutors’ offices—why legislatures could not impose suchguidelines themselves.102 In many cases judicial guidelines have been quiteeffective at regulating fairly autonomous judges, and there is no a priorireason to believe that similar guidelines could not regulate prosecutors aswell. That said, the absence of guidelines outside of New Jersey suggeststhat states are generally reluctant to impose such restrictions, even though inan era of low crime and tight state budgets, the political power of prosecu-tors to resist any and all oversight in the name of being “tough on crime”may be waning.103
A more indirect approach that legislators could take would be to makeincarceration less “free” for the prosecutor. Long theorized,104 the approachhas become the foundation of California’s “Realignment” efforts to cureconstitutional deficiencies with its prison system. In Brown v. Plata, the
100 See, e.g., Brimage Guidelines 2, §§ 3.11-13.101 See Wright, supra note 99, at 1097 n.46; ST. OF N.J. DIV. OF CRIM. JUST., ATTORNEY
GENERAL GUIDELINES, available at http://www.state.nj.us/lps/dcj/agguide.htm (last visitedOct. 30, 2014), archived at http://perma.cc/Z8ZU-SC5F.
102 Prosecutors may be better positioned than judges to resist guideline adoption. Even instates where judges are directly elected in partisan elections, they are considered less “politi-cal” actors than prosecutors and thus less able to publicly lobby for or against legislation. Andjudges may in fact be ethically restricted from doing so. Prosecutors face no such limitations.
103 For example, in a 2011 poll of 800 politically active Republicans in Florida, 65% saidthey would vote for a prosecutor who was “smart on crime” over one who was “tough oncrime.” See FL. TAXWATCH, SMART JUSTICE POLL RESULTS 5 (2012), available at http://www.floridataxwatch.org/resources/pdf/SmartJusticePoll11912.pdf, archived at http://perma.cc/9ZZ8-RRSS. Such results suggest that the tough-at-any-cost approaches of past years (to theextent they were more than rhetorical flourishes) are coming to an end.
104 See, e.g., Robert L. Misner, Recasting Prosecutorial Discretion, 86 J. CRIM. L. &
CRIMINOLOGY 717 (1996), which advocated for allotting each district attorney a given numberof state prison bed-years each year that he or she could use. So a District Attorney given 100bed-years for 2014 could send 100 people to prison for one year each or two people to prisonfor fifty years.
United States Supreme Court held that overcrowding in California’s massiveprison system, and the attendant breakdown in health and mental health ser-vices, rose to the level of an Eighth Amendment violation, and it affirmed alower-court decision ordering California to reduce its prison population.105
California’s answer was “Realignment,” a complicated system de-signed to make county officials internalize the costs of incarceration. Theprocess itself is quite complex, and working through its particulars are be-yond the scope of this article, but at its heart is the rule that if felony con-victs classified as “triple-nons”—non-violent, non-sexual, non-seriousoffenders106—are going to be imprisoned, that sentence must be served in thecounty jail in the county in which they are convicted, regardless of thelength of the sentence. In other words, California imposes no limit on howcounty prosecutors choose to manage relatively low-level cases, but by re-quiring such defendants to serve any term in county jail, Realignment forcesthose county officials to internalize the cost of punishment.107
At least so far, Realignment seems to be having a dramatic effect onCalifornia prison populations. Although California’s incarceration levels hadstarted to decline in 2006, about the time that federal courts began to ac-tively monitor confinement conditions in the state, between 2006 and 2010its prison population dropped by only 10,000, from 175,000 to 165,000.108
Realignment went into effect on October 1, 2011, and by the end of that yearCalifornia’s prison population had dropped by over 15,000 to slightly lessthan 150,000. By the end of 2012 it had dropped another 15,000 to under135,000.109 California is just one state, and other states without the samecombination of excessive overcrowding, aggressive federal judicial over-sight, and political culture may not be able to adopt a similar plan, or maynot see similar outcomes. But California’s results at least indicate that insome settings directly targeting the moral hazard problem could lead to sig-nificant reductions in incarceration.
Legislatures could also experiment with less comprehensive ap-proaches, such as taxing counties for the convicts they send to state prisons
105 Brown v. Plata, 131 S.Ct. 1910 (2011).106 “Non-sexual” means that the offender does not need to register as a sex offender, and
“serious” offenders are those convicted of serious violent or destructive crimes such as murderor arson or carjacking as defined in Cal. Penal Code § 1192.7(c).
107 This is at least true in theory. In practice, Realignment has also involved providingcounties with subsidies to partially offset the unexpected, increased costs of having to lock uptriple-nons. If not managed properly, such subsidies could undermine the entire goal of forcingcounties to internalize the costs of incarcerating these low-level offenders. The state has beenexperimenting with various ways to provide the subsidies, in part to try to avoid this veryproblem. See MIA BIRD & JOSEPH HAYES, PUB. POL’Y INST. OF CAL., FUNDING PUBLIC SAFETY
REALIGNMENT (2013), available at http://www.ppic.org/content/pubs/report/R_1113MBR.pdf,archived at http://perma.cc/4ZES-GHW6.
108 BJS/NPS Data, supra note 2. R109 Not surprisingly, jail populations have risen, but in theory those are being paid for out
of local budgets and thus (properly) reflect local priorities—putting aside the subsidizationconcerns raised in note 107. R
or, conversely, offering a rebate for those that they do not send. The tax-per-prisoner idea is straight-forward, though it raises obvious political concerns:a local state legislator could face opposition from a district attorney whoargues that public safety is being impeded when the county “can’t afford” tosend a serious offender to prison. A rebate could achieve similar results—tosend a defendant to prison is to forego a rebate—but with better politicaloptics. It would also raise some trickier implementation issues, such as de-termining the proper baseline below which counties would be subsidized,and making sure the rebate is calibrated such that counties don’t have a posi-tive incentive to convict-and-divert defendants.110 But some sort of policy tofiscally incentivize prosecutors to rely on more local, and likely cheaper andmore efficient sanctions could certainly be developed.
Legislators could also scale back policies that give local enforcementofficials an incentive to go after drug offenders. The most obvious exampleare asset forfeiture laws, which often allow local police departments to keepassets seized in drug raids. Such laws were drafted with the goal of encour-aging drug interdiction and repealing or reducing them would likely leadpolice to focus their attention elsewhere, at least on the margin.111 But de-spite some of the alarm commentators have raised over the effects of suchlaws,112 their impact can be overstated. One recent empirical paper, for ex-ample, found that local governments offset police funding by about 25 to 40cents on the dollar: for every dollar a police department received under anasset forfeiture law, its budget was reduced by 25 to 40 cents.113 The study’sevidence also indicated that police took these reductions into account whenmaking choices.114 Given the offsets, reforming these laws will not havequite the punch in practice that it might seem on paper.
As should be clear by now, my conclusions here are somewhat skepti-cal about the impact many legislative reforms could have on prison growth.The tools most readily available to the legislature—decriminalization, sen-tence reduction, parole reform—seem unlikely to have a strong immediateimpact on prison populations in general, and drug incarcerations in particu-lar. Other approaches such as prosecutorial guidelines and budgetary re-
110 For example, this policy ought to avoid situations in which a county receives $1,000for not sending certain felons to prison, yet an available diversion program costs only $750.
111 There have only been limited efforts along these lines. See, e.g., Nick Sibilla, Minne-sota Now Requires a Criminal Conviction Before People Can Lose Their Property to Forfei-ture, FORBES (May 7, 2014), http://www.forbes.com/sites/instituteforjustice/2014/05/07/minnesota-forfeiture-reform/, archived at http://perma.cc/6DHG-BWJR.
112 See, e.g., MARIAN R. WILLIAMS ET AL., INST. FOR JUST., POLICING FOR PROFIT: THE
ABUSE OF CIVIL ASSET FORFEITURE (2010), available at http://www.ij.org/policing-for-profit-the-abuse-of-civil-asset-forfeiture-4, archived at http://perma.cc/PYS7-DZ7B.
113 Katherine Baicker & Mireille Jacobson, Finders Keepers: Forfeiture Laws, PolicingIncentives, and Local Budgets, 91 J. PUB. ECON. 2113, 2125 (2007). Their results actuallyindicate that the 25 to 40 cent reduction is when police take advantage of state asset forfeitureprograms. When the police rely on a nominally more generous parallel federal program, thelocal governments wholly offset the forfeitures on a one-for-one basis.
forms may be more effective, but are politically more challenging and muchmore difficult to design and implement. It is telling that many states arereducing time served and decriminalizing marijuana, but none seem to befollowing in the footsteps of New Jersey and California.
However, to end on an optimistic note for those hoping to rein in drugenforcement, even if the legislature’s powers are relatively weak or hard totake advantage of, drug decarceration can still occur. Just because the moralhazard problem persists does not mean that police and prosecutors will al-ways take (full) advantage of it. Consider Figure 7, which plots the numberof drug offenders in New York State prisons over time. The three verticallines indicate the years when the Rockefeller Drug Laws were adopted(1973), and when the Laws were reformed, first toothlessly (2004) and thenmore substantively (2009).115
Two clear features stand out. First, just because a state legislaturepasses tough laws does not mean police and prosecutors take advantage ofthem right away; drug incarcerations actually fell in the wake of the Rocke-feller Drug Laws’ passage, and they did not rise until crack exploded on thescene. Second, and more relevant here, drug incarcerations have declinedsteadily since 1997 not because of any real change in the state law, butbecause police and prosecutors simply changed their priorities. The declinebegan well before the hollow 2004 reforms and continued unabated aftertheir passage and after the passage of the more-substantive 2009 reforms.And while this change in priorities was not constant across the state—thestate-wide drop in drug incarcerations was driven by the five counties thatcomprise New York City, with New York state’s remaining counties continu-ing to increase the number of drug offenders they sent to prison116—the de-cline nonetheless shows that downstream actors can change their choiceseven when the legislature is inactive on the issue.
For reformers, the lessons from New York are clear: it may be moreeffective to engage with the downstream actors directly rather than to lobbylegislatures. Working to elect mayors and district attorneys who pledge notto aggressively prosecute drug cases may have a much bigger impact thantrying to change the state drug laws. However, such city-by-city and county-by-county campaigns are potentially more expensive and time consumingthan lobbying the legislature, especially in states unlike New York wherecrime and enforcement are less concentrated in just a few cities and counties,even though the results of the campaigns might be much more significant.
116 See JAMES AUSTIN & MICHAEL JACOBSON, BRENNAN CTR. FOR JUST., HOW NEW YORK
CITY REDUCED MASS INCARCERATION: A MODEL FOR CHANGE? (2013), available at http://www.brennancenter.org/sites/default/files/publications/How_NYC_Reduced_Mass_Incarceration.pdf, archived at http://perma.cc/B3LY-BDWJ, which points out that the rest of the coun-ties in New York continued to be more punitive toward drug offenders and non-drug offendersalike, but that their increased punitiveness was more than offset by declining aggressivenessamong New York City prosecutors.
FIGURE 7: DRUG INMATES IN NEW YORK PRISONS, 1965–2013
Notes: Data from the New York State Statistical Yearbook, various years.117
3. A Brief Note on Drug Addiction and Drug Market Violence
So far, the phrase “drug offenders,” has referred to those punished forpossessing or selling drugs. But there are two other types of offenders whocould be considered “drug offenders” and whose punishment could be atleast partially attributed to the War on Drugs: (1) those who commit non-drug offenses while on drugs, and (2) those who commit non-drug, violentoffenses in the furtherance of drug trafficking. Taking this expanded view of“drug offenders” complicates, at least to some degree, the general point thatthe War on Drugs is relatively unimportant and so it requires at least a briefdiscussion.
First, consider the significance of classifying those who commit non-drug crimes while on drugs as “drug offenders.” Such offenders are numer-ous. In the 2008 NCVS, for example, 9% of all violent crime victims, andnearly 17% of all rape victims in particular, thought that their assailants hadbeen under the influence of drugs or drugs and alcohol at the time of thecrime.118 And this is surely a lower floor on drug use since nearly 50% of all
117 See NEW YORK STATE STATISTICS, ROCKEFELLER INST. OF GOV’T, STAT. YEARBOOK,available at http://www.rockinst.org/nys_statistics/, archived at http://perma.cc/J2FW-3P49.The Yearbook was not published every year during the 1960s and 1970s, as well as duringstatistical year 1988. The figure includes the data for all years in which the Yearbook waspublished.
118CRIMINAL VICTIMIZATION IN THE UNITED STATES, U.S. DEP’T OF JUST. 2008 STATISTI-
CAL TABLES, Table 32 (2011), available at http://www.bjs.gov/content/pub/pdf/cvus08.pdf,
respondents said they did not know or could not tell whether their assailantswere under the influence of drugs or alcohol, and the Victimization Surveyprovides no information about those who commit property crimes.119 Simi-larly, in the 2004 Inmate Survey, 56% of state prisoners admitted to usingdrugs in the month prior to their offenses, and 32% at the time of the crime;17% of state offenders claimed they committed their instant offenses to getmoney for drugs.120 Although many of these offenders committed non-drugcrimes, drugs played a central role in their offenses.
Why, however, should society attribute an assault committed under theinfluence of drugs or a theft to feed a drug habit to the War on Drugs? Ifnothing else, the public’s insistence on viewing drug use as a criminal ratherthan a public health issue likely precludes it from adopting more treatment-based approaches that target the underlying addiction fueling the criminalbehavior. It is true that there has been a rising interest in drug courts inrecent years, but it is telling that such courts require the defendant to gothrough the criminal justice process to secure treatment. Defendants are stillgenerally required to plead guilty and continuously face the risk of criminalsanction during their time in treatment. Refusing to view drug addiction—and its attendant anti-social conduct—as a public health concern constrainsthe options available to deal with that addiction. To the extent that criminal-based approaches are less efficient at addressing the causes of addiction thancivil or medical-based ones, the resulting social ills are, to some extent,caused by the War on Drugs and the attitudes that motivate it.
The second, broader definition of drug-related offending would accountfor a wider range of offenses caused by the War on Drugs. Edward Shepardand Paul Blackley lay out the possible links between drug enforcement and(marginal) increases in crime rates:
(1) distribution networks are disrupted, leading to disputes overmarket share and informal contractual arrangements within thesedrug markets; (2) disruptions in the market lead drug sellers toswitch to other forms of economic crime that are considered sub-stitutes, such as robbery or burglary . . . ; (3) drug users resort tocrime as a result of physical or psychological withdrawal, or frombehavioral changes resulting from ending their self-treatment ofmedical conditions; (4) prices and profits increase for remainingsellers, providing more incentive for potential suppliers to engagein crime to obtain a share of the market and leading to more eco-
archived at http://perma.cc/E68Q-JAGE. At a more disaggregated level, 16.5% of rape vic-tims, 16% of robbery victims, 10% of aggravated assault victims, and 7% of simple assaultvictims reported that their assailants were on drugs. Another 14% thought their assailants wereunder the influence of alcohol alone. Id.
119 Id.120
CHRISTOPHER J. MUMOLA & JENNIFER C. KARBERG, BUREAU OF JUST. STAT., DRUG
USE AND DEPENDENCE, STATE AND FEDERAL PRISONERS 1 (2006), available at http://www.bjs.gov/content/pub/pdf/dudsfp04.pdf, archived at http://perma.cc/3GNT-NQ9M.
nomic crime by users who need to obtain income to support ahabit; (5) resources spent on drug enforcement are diverted frominvestigations and arrests for other types of crime that may in-crease as a result . . . ; and (6) the imprisonment of drug users andsellers takes prison cells that are in short supply, resulting in theearly release of other criminals, prison overcrowding, or newprison construction.121
A recent meta-analysis purports to show a positive (marginal) relation-ship between drug enforcement and crime rates, with more drug enforcementleading to more crime.122 However, it appears that few if any of the studiesincluded in the meta-analysis account for the risk of endogeneity. Whiledrug enforcement may influence crime rates, crime rates surely influencedrug enforcement as well. And if drug enforcement rises with crime rates,123
then studies that fail to account for this reciprocal relationship will overstatethe extent to which drug enforcement raises crime rates. In fact, they mayeven get the sign wrong (i.e., report that drug enforcement raises crime rateswhen it actually lowers them), though there is no real way to estimate themagnitude of the bias.
In other words, while the theoretical concerns are quite valid, the em-pirical evidence in support of it is quite weak—although absence of evi-dence should not be read here as evidence of absence, especially given themethodological challenge of estimating the relationship between drug en-forcement and crime rates. That said, the connection between drug enforce-ment and violence is likely weaker today than in the past: violence overall islower than it has been in forty years, yet drug consumption and drug marketsare still operating at levels comparable to those in the much more violent1980s.124 While enforcement may have a marginal effect on violence—mar-
121 Edward M. Shepard & Paul R. Blackley, Drug Enforcement and Crime: Recent Evi-dence from New York State, 86 SOC. SCI. Q. 323, 327 (2005).
122 See Dan Werb et al., Effect of Drug Law Enforcement on Drug Market Violence: ASystematic Review, 22 INT’L J. OF DRUG POL’Y 87, 87 (2011). Again, this is a marginal claim,so the fact that crime has fallen even as drug enforcement has risen does not disprove it: itcould be that crime rates would have fallen even faster but for drug enforcement.
123 At first blush, it may seem that rising crime rates should lead to less drug enforcement,since officers would be diverted from drug offenses to focus on more serious crimes. Butofficers may use drug arrests as easy pretextual ways to get violent offenders off the street, andthe increased presence of officers in high-crime areas may have the collateral effect of produc-ing more drug arrests as well.
124 See, e.g., RONALD G. FRYER, JR., ET AL., NAT’L BUREAU OF ECON. STAT., MEASURING
THE IMPACT OF CRACK COCAINE (2005), available at http://pricetheory.uchicago.edu/levitt/Pa-pers/FryerHeatonLevittMurphy2005.pdf, archived at http://perma.cc/WZQ4-J9H3, which ar-gues that prohibition-related violence associated with crack distribution declined over thecourse of the 1990s, even as crack markets remained relatively robust (at about 65% to 70% oftheir peak 1980s scale). Perhaps the statistic that most clearly suggests drug-related violencehas declined is that the homicide rate for young people age 18 to 24 has dropped from about 25per 100,000 in the early 1990s to about 13 per 100,000 by 2008; for black males aged 18 to 24,who bore the brunt of crack-related violence, from approximately 200 per 100,000 in the early1990s to about 90 per 100,000 in 2008. See ALEXIA COOPER & ERICA L. SMITH, BUREAU OF
kets would be even more stable and violence even lower still but for currentlevels of enforcement—whatever destabilizing effect enforcement has is notstrong enough to offset other forces pushing violence down.
In other words, defining “drug offenders” solely as those convicted ofdrug crimes is not as objectively correct as it might initially seem. Althoughcertainly a valid and useful definition, there are other ways to think aboutwhat counts as the product of drug enforcement that may alter estimates ofthe impact of the War on Drugs. Furthermore, this section should establishthat scaling back the War on Drugs can have collateral effects—such aschanging how society manages addiction or how enforcement interacts withdrug-market violence—that are not immediately apparent when simply look-ing at arrest or incarceration rates.
IV. CONCLUSION
With crime rates low and budgets tight, states have been seeking waysto reduce incarceration rates. One common suggestion has been to roll backthe incarceration of drug offenders. Such an approach, however, will likelybe disappointing, since drug-related incarcerations have not driven prisonpopulations as much as conventional wisdom holds. Drug offenders do notmake up a large enough share of all prisoners or (unique) admissions fordrug reform alone to significantly reduce incarceration rates, nor do priordrug incarcerations seem to trigger repeat offender laws in large numbers.Neither do parole revocations appear to be driven by drug-related technicalviolations.
That does not, however, render drug enforcement irrelevant. Considerdrug arrests, which could play an important role, for example, by contribut-ing to neighborhood disorder that fuels prosecutorial aggressiveness. Andtreating drug use as a criminal rather than public health issue may foreclosemore effective treatment options, or force treatment to be imperfectlywedged into pre-existing criminal justice institutions, as is the case withdrug courts.
Furthermore, if legislators decide that reducing drug enforcement is stilla net social good, regardless of its impact on prison populations, the tools attheir disposal are limited. Criminal justice enforcement in the United Statesis highly disaggregated across a wide range of institutions operating rela-tively independently of each other. At least right now, prison growth isdriven by prosecutorial aggressiveness, and legislatures have little controlover locally elected, locally funded prosecutorial offices. Legislative successmay require unconventional yet viable approaches, such as adopting charg-ing or pleading guidelines or making efforts to push the cost of felony incar-ceration onto county budgets.
JUST. STAT., HOMICIDE TRENDS IN THE UNITED STATES, 1980-2008 (2011), available at http://www.bjs.gov/content/pub/pdf/htus8008.pdf, archived at http://perma.cc/4T8A-T5GJ.