Volume 2 • Issue 3 • 1000123J Geol GeosciISSN: 2329-6755 JGG, an open access journal
Mitigation Exploration Risk of Jurassic Reservoir by Seismic Inversion, Penobscot Area, Sable Sub Basin Nova Scotia, Offshore, CanadaQadeer Ahmad*Bahria University Islamabad, Pakistan
IntroductionHigh exploration costs require that you achieve your target in the
first attempt. Optimization technology innovate higher-value solutions. Inversion is one of those techniques which mitigate the exploration risk by reservoir prediction. It is a process of transforming impedance into quantitative rock properties like porosity, saturation and pore pressure.
Area
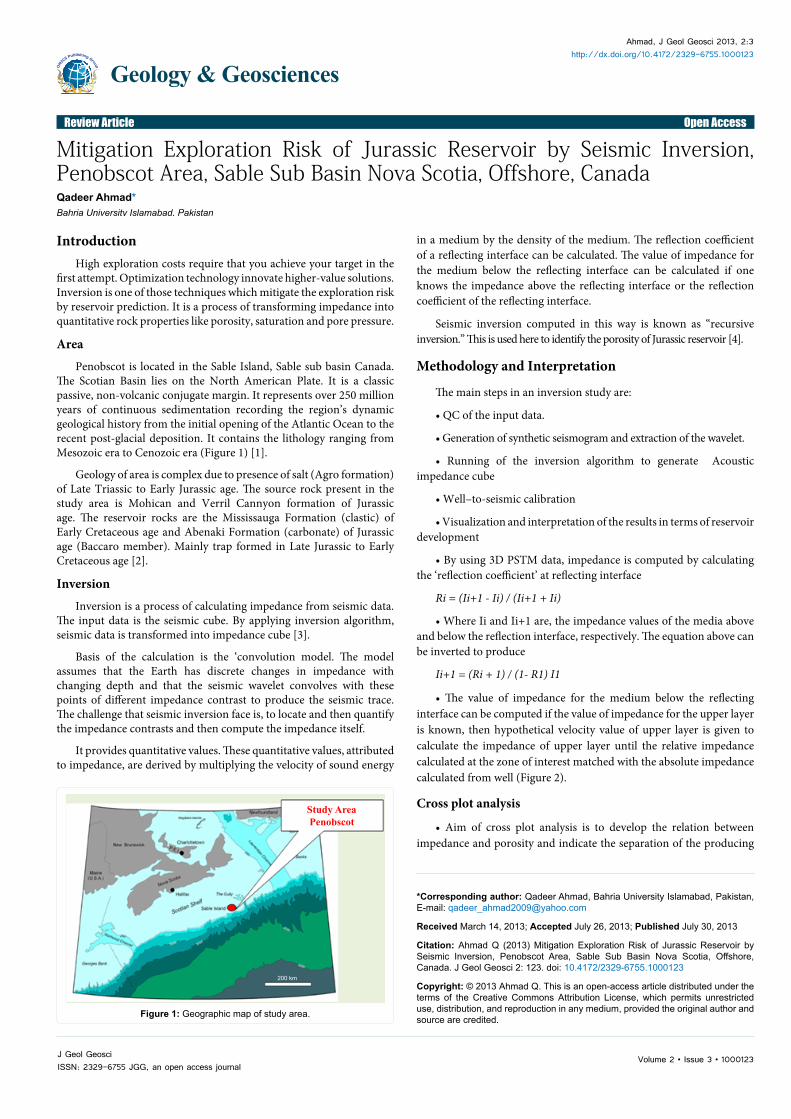
Penobscot is located in the Sable Island, Sable sub basin Canada. The Scotian Basin lies on the North American Plate. It is a classic passive, non-volcanic conjugate margin. It represents over 250 million years of continuous sedimentation recording the region’s dynamic geological history from the initial opening of the Atlantic Ocean to the recent post-glacial deposition. It contains the lithology ranging from Mesozoic era to Cenozoic era (Figure 1) [1].
Geology of area is complex due to presence of salt (Agro formation) of Late Triassic to Early Jurassic age. The source rock present in the study area is Mohican and Verril Cannyon formation of Jurassic age. The reservoir rocks are the Mississauga Formation (clastic) of Early Cretaceous age and Abenaki Formation (carbonate) of Jurassic age (Baccaro member). Mainly trap formed in Late Jurassic to Early Cretaceous age [2].
Inversion
Inversion is a process of calculating impedance from seismic data. The input data is the seismic cube. By applying inversion algorithm, seismic data is transformed into impedance cube [3].
Basis of the calculation is the ‘convolution model. The model assumes that the Earth has discrete changes in impedance with changing depth and that the seismic wavelet convolves with these points of different impedance contrast to produce the seismic trace. The challenge that seismic inversion face is, to locate and then quantify the impedance contrasts and then compute the impedance itself.
It provides quantitative values. These quantitative values, attributed to impedance, are derived by multiplying the velocity of sound energy
in a medium by the density of the medium. The reflection coefficient of a reflecting interface can be calculated. The value of impedance for the medium below the reflecting interface can be calculated if one knows the impedance above the reflecting interface or the reflection coefficient of the reflecting interface.
Seismic inversion computed in this way is known as “recursive inversion.” This is used here to identify the porosity of Jurassic reservoir [4].
Methodology and Interpretation
The main steps in an inversion study are:
• QC of the input data.
• Generation of synthetic seismogram and extraction of the wavelet.
• Running of the inversion algorithm to generate Acoustic impedance cube
• Well–to-seismic calibration
• Visualization and interpretation of the results in terms of reservoir development
• By using 3D PSTM data, impedance is computed by calculating the ‘reflection coefficient’ at reflecting interface
Ri = (Ii+1 - Ii) / (Ii+1 + Ii)
• Where Ii and Ii+1 are, the impedance values of the media above and below the reflection interface, respectively. The equation above can be inverted to produce
Ii+1 = (Ri + 1) / (1- R1) I1
• The value of impedance for the medium below the reflecting interface can be computed if the value of impedance for the upper layer is known, then hypothetical velocity value of upper layer is given to calculate the impedance of upper layer until the relative impedance calculated at the zone of interest matched with the absolute impedance calculated from well (Figure 2).
Cross plot analysis
• Aim of cross plot analysis is to develop the relation between impedance and porosity and indicate the separation of the producing
Citation: Ahmad Q (2013) Mitigation Exploration Risk of Jurassic Reservoir by Seismic Inversion, Penobscot Area, Sable Sub Basin Nova Scotia, Offshore, Canada. J Geol Geosci 2: 123. doi: 10.4172/2329-6755.1000123
Page 2 of 3
Volume 2 • Issue 3 • 1000123J Geol GeosciISSN: 2329-6755 JGG, an open access journal
part of the reservoir from its non-producing part. Absolute impedance was calculated at B-41 well (Figure 3). Petrophysical interpretation was carried out at Abenaki Formation to calculate the volume of shale, porosity, and effective porosity. Cross plot between impedance and porosity was generated, with impedance in X-axis, porosity in Y-axis and GR (Gamma Ray) displayed in the Z-axis (Figure 4).
Technique for separating reservoir from non-reservoir
• Cross plot gives a relation between impedance and porosity but there is an ambiguity seen in transforming these values into rock properties like porosity. Impedance versus porosity is color coded with GR (Gamma Ray) log which classify different lithology. Scale of GR was used to classify lithology as mentioned in the Table 1.
• After clipping the impedance range that comes from the shale, only the reservoir impedance range is displayed (Figure 5).
Results and Discussion• Seismic inversion is carried out for reservoir prediction of the
Jurassic carbonate. In seismic inversion there is an ambiguity seen in
transforming impedance values into rock properties like porosity. At some point there is a sharp increase in porosity and low impedance observed which gives good indication of reservoir. But this picture is false as it arises from the presence of shale. Shale has excellent porosity and has low impedance like reservoir rock. The task here is to separate those points of reservoir from points which comes from non-reservoir (shale). To solve this ambiguity a technique is used in which gamma ray values are imbedded during porosity predication from impedance. This technique helps a lot in isolating the points (high porosity) which come from the shale and prevent from misleading.
Conclusion1. In seismic inversion, reservoir characterization in terms of
porosity has been carried out, which successfully identified the producing part of the reservoir from the non producing part.
2. Seismic Inversion helped in delineating the sweet spots.
INPUT
OUTPUT
Impedance Cube
INVERSION
3D seismicdata
Seismicwavelet
Initial impedancemodel
Picked Horizonsin TWT
Figure 2: Work flow for the inversion.
Baccro member
L. Missisauga
Top Abenaki
Sand 1, 2 & 3
Sand 6
Sand 7
0 5000
B41 1
2.200
2.300
2.400
2.500
2.600
Figure 3: Time to impedance converted 1047 inline passing though B-41 well.
GR
Tight L.stLimes
tone
Porous Limestone Shale
11.000
25.444
39.889
54.333
68.778
83.222
97.667
112.111
126.556
141.000
3160
3180
3200
3220
3240
3260
3280
3300
3320
3340
3360
Depth (m
)
AI POROSITY GR
8000 10000 12000 14000IMPEDANCE
PORS = 0.474716084 - 3.3976183e-005* calculated AI
0.4
0.3
0.2
0.1
0
PO
RO
SIT
YIMPEDANCE vs POROSITY
Figure 4: Lithology discrimination at well B-41 (Impedance Vs Porosity) embedded with GR color coding.
Low Impedance
727700 732700 737700 742700
N
727700 732700 737700 742700
4898700
4893700
4898700
4893700
XYMetes 1480
1470
1460
1450
14401430
1420
1410
14001390
1380
13701360
1350
1340
1330
13201310
1300
1290
1280
12701260
1250
1240
1230
12201210
1200
1190
11801170
1160
1150
1140
11301120
1110
1100
1090
1080
10701060
1050
1040
1030
1020
10101000
1480
1470
1460
1450
14401430
1420
1410
14001390
1380
13701360
1350
1340
1330
13201310
1300
1290
1280
12701260
1250
1240
1230
12201210
1200
1190
11801170
1160
1150
1140
11301120
1110
1100
1090
1080
10701060
1050
1040
1030
1020
10101000
Figure 5: Time to impedance converted 1047 inline passing though B-41 well.
Scale of GR (API) Lithology1-35 Coarse Sand
35-45 Medium Grained Sand45-65 Fine Grained Sand65-75 Silt>75 Shale
Citation: Ahmad Q (2013) Mitigation Exploration Risk of Jurassic Reservoir by Seismic Inversion, Penobscot Area, Sable Sub Basin Nova Scotia, Offshore, Canada. J Geol Geosci 2: 123. doi: 10.4172/2329-6755.1000123
Page 3 of 3
Volume 2 • Issue 3 • 1000123J Geol GeosciISSN: 2329-6755 JGG, an open access journal
3. Hydrocarbon exploration risk in term of reservoir quality has been reduced after applying the seismic inversion technique.
Acknowledgement
I need to thank especially Nova Scotia Offshore Board for providing the data and giving me the opportunity to work in a fascinating area. I am also thankful to Opendtect team.
References
1. Benson RN, Doyle RG (1988) Early Mesozoic rift basins and the development
Citation: Ahmad Q (2013) Mitigation Exploration Risk of Jurassic Reservoir by Seismic Inversion, Penobscot Area, Sable Sub Basin Nova Scotia, Offshore, Canada. J Geol Geosci 2: 123. doi: 10.4172/2329-6755.1000123
Submit your next manuscript and get advantages of OMICS Group submissionsUnique features:
User friendly/feasible website-translation of your paper to 50 world’s leading languagesAudio Version of published paperDigital articles to share and explore
Special features:
250 Open Access Journals20,000 editorial team21 days rapid review processQuality and quick editorial, review and publication processingIndexing at PubMed (partial), Scopus, EBSCO, Index Copernicus and Google Scholar etcSharing Option: Social Networking EnabledAuthors, Reviewers and Editors rewarded with online Scientific CreditsBetter discount for your subsequent articles
Submit your manuscript at: http://www.omicsonline.org/submission
of the United States middle Atlantic continental margin, in Triassic-Jurassic Rifting Continental Breakup and the Origin of the Atlantic Ocean and Passive Margins. Edited by Manspeizer W, Elsevier, New York, USA.
2. Dravis JJ (1997) Digenesis and Porosity Evolution of Abenaki Carbonates, Panuke Field, Offshore Nova Scotia: WellF-70, EnCana Internal Report 12-45.
3. Latimer RB, Davison R, Van Riel P (2000) Interpreter’s guide to understanding and working with seismic derived acoustic impedance data. The Leading Edge 19: 242-256.
4. Veeken PCH, Da Silva M (2004) Seismic inversion methods and some of their constraints.