19
HMS Networks Q1 2020 presentation April 23 rd 2020 Staffan Dahlström, CEO, Joakim Nideborn, CFO

HMS Networks Q1 2020 presentationApril 23rd 2020
Staffan Dahlström, CEO, Joakim Nideborn, CFO

Agenda
Summary
Business update
Financial results
Q&A

Financial summary of Q1 2020 and R12 months
• Net sales 361 MSEK (380), -5%
• Order intake 401 MSEK (387), +4%
• EBIT 67 MSEK (60)
• EBIT margin 19% (16)
• Cash flow from ops. of 55 MSEK (52)
• EPS 1.01 (0.88)
Q1
• Net sales 1,500 MSEK (1,425), +5%
• Order intake 1,484 MSEK (1,470), +1%
• EBIT 250 MSEK (248)
• EBIT margin 17% (17)
• Cash flow from ops. of 257 MSEK (224)
• EPS 4.56 (3.76)
R12 months
We are Connecting Devices™
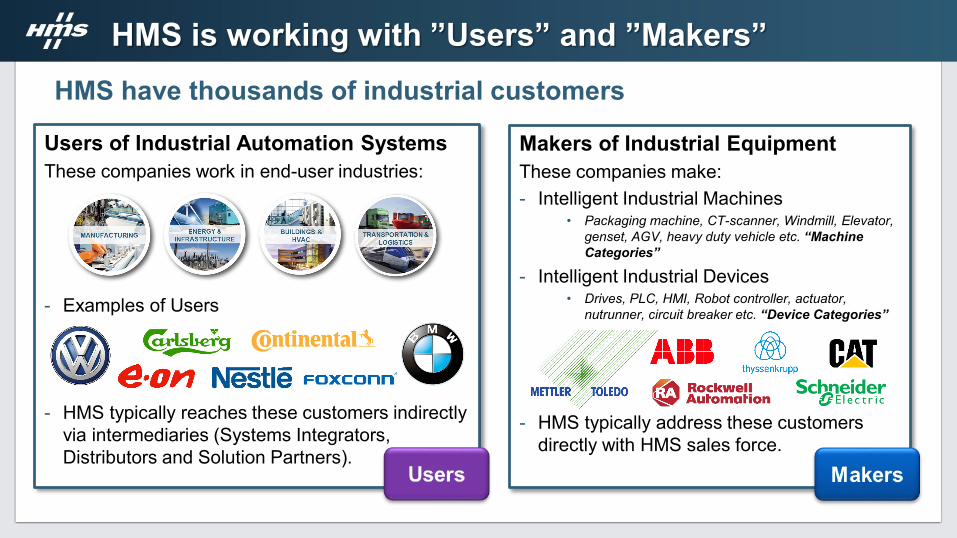
HMS is working with ”Users” and ”Makers”HMS have thousands of industrial customers
Makers of Industrial Equipment These companies make:- Intelligent Industrial Machines
• Packaging machine, CT-scanner, Windmill, Elevator, genset, AGV, heavy duty vehicle etc. “Machine Categories”
- Intelligent Industrial Devices• Drives, PLC, HMI, Robot controller, actuator,
nutrunner, circuit breaker etc. “Device Categories”
- HMS typically address these customers directly with HMS sales force.
Users of Industrial Automation SystemsThese companies work in end-user industries:
- Examples of Users
- HMS typically reaches these customers indirectly via intermediaries (Systems Integrators, Distributors and Solution Partners).

Understanding of HMS sales

HMS Financial targets – 20/20/50
345 384 382501
589702
952
1 183
1 366
1 519
201620142010 20132011 2012 2015 2017 2018 2019
+18%
HMS sales development 2010-2019 HMS Financial targets
Salesgrowth(CAGR)
EBIT(% margin)
Dividend (% of EPS)
20%
20%
50%
Target Actual avg. 2010-2019
18%
18%
46%

Agenda
Summary
Business update
Financial results
Q&A

Corona update
• No major Corona impact on HMS business and all team members are OK
• Manufacturing facilities in Spain closed for 2-3 weeks, now up and running
• Managed to secure supply, small disruptions from China after Chinese new year
• Customers stocking up to avoid shortage, order intake boosted 30-40 MSEK
Q1
• Order intake down ~20% compared to 2019 so far in April
• Expected challenging quarter
• Short-time work implemented in Sweden since last week, in Germany from next week
• Close monitoring of the situation and potential implementation of short-time work at higher level as well as in other areas
Q2
• Once the Corona situation is behind us we expect good market conditions for Automation & Digitalization, and we should then have intact teams to execute our business – until then we keep a close eye on our cost and cash flow
Strategy

• Volatile sales and order intake as effect of some customers stocking up for tougher times
• In general a positive trend in USA and Asia, driven by Japan where some of our main customers are ordering after some weak quarters
• Europe continues to be challenging, especially Germany being weak. Substantially down from Q1 2019 but on similar levels as Q4 2019
• Ewon delivering record quarter, Remote Access solutions gain interest in these times!
• Anybus and Ixxat down from Q1 2019, but still on positive track from H2 2019
• Intesis somewhat impacted by supply chain disruptions, but back on track towards the end of the quarter
Business update first quarter 2020

Agenda
Summary
Business update
Financial results
Q&A

Order intake 401 MSEK
• Order intake in Q1 401 MSEK (387), corresponding to an increase of 4%
• Organic a decrease of 4%
• Book to bill of 1.11 (1.02)
• Even distribution of the organic decline between brands vs. Q1 2019, except Ewon
• Record order intake driven by FX and customers stocking up
32% 15% 8% 17% 3% 34% 3%
328
289 288
350
387 375 372
337
01002003004005006007008009001 0001 1001 2001 3001 4001 5001 600
0
50
100
150
200
250
300
350
400
450
Q118Q417Q217 Q317 Q218 Q219Q418Q318 Q119 Q319
401
Q419 Q120
336360
387
+4%
24% 11% 11%
Order intake R12 Order intake
ORDER INTAKE, MSEK Comments on Q1 order intake
Comments on R12 months order intake
• Order intake R12 months 1,484 MSEK (1,470), corresponding to an increase of 1%
• Organic a decrease of 6%
• Book to bill of 0.99
Growth -13% 4%

Net sales 361 MSEK
Growth
• Net Sales of 361 MSEK (380), corresponding to a decrease of 5%
• Organic a decrease of 8%
• EMEA: -11%
• Americas: +4%
• Asia: +9%
29% 20% 14% 15% 10% 20% 7%
301320 329
377
346361
01002003004005006007008009001 0001 1001 2001 3001 4001 5001 600
0
50
100
150
200
250
300
350
400
450
Q217 Q119 Q120Q418Q317 Q118Q417 Q318Q218 Q219 Q319 Q419
299 305
353 363380
416-5%
16% 19% 26%
Net Sales R12 Net Sales
NET SALES, MSEK Comments on Q1 Net Sales
Comments on R12 months Net Sales
• Net Sales of 1,500 MSEK (1,425), corresponding to an increase of 5%
• Organic the same level as last year R12 months
• EMEA: 4% growth
• Americas: 5% growth
• Asia: 11% growth-5%-5%

Sales per market Q1 2020Sales per geography Q1 2020, MSEK
Americas• Net Sales 87 MSEK (84)• 24% of Group sales (22)• USA represents 83%
Asia• Net Sales 60 MSEK (55)• 17% of Group sales (15)• Japan represents 57%
EMEA• Net Sales 214 MSEK (240)• 59% of Group sales (63)• Germany represents 40%
59%24%17%

EBIT 67 MSEK (19% margin)
EBIT, %
• EBIT 67 MSEK (60), EBIT margin of 18.5% (15.8)
• Q1 gross margin of 62.4% (59.3), positive effects from a favorable product mix, efficiency improvements and acquisitions
• OPEX decrease of 6 MSEK corresponding to an organic decrease of 14 MSEK (-8%)
• 5 MSEK of OPEX reduction due to less travelling and cancelled customer events
20% 21% 10% 20% 19% 14% 15%
59
65
31
63 63
74
52
60
72
56 55
67
0
50
100
150
200
250
300
0
10
20
30
40
50
60
70
80
Q119Q218Q417Q217 Q317 Q318Q118 Q219Q418 Q319 Q419 Q120
+12%
21% 16% 17%
EBIT R12 EBIT
EBIT, MSEK Comments on Q1 results
Comments on R12 months results
• EBIT of 250 MSEK (248), corresponding to 16.7% (17.4) margin
• Gross margin 61.9% (60.4)
• OPEX increase of 65 MSEK, driven by acquisitions, FX and restructuring costs
• Restructuring program effects as planned, 45 MSEK OPEX reduction annually
19%16%

EPS 1.01 SEK
• EPS of 1.01 SEK (0.88)
• Net financials of -4 MSEK (-4)
0.5
0.1
1.0
0.0
0.6
2.0
0.2
0.3
0.4
0.7
5.0
4.5
0.8
0.9
1.04.0
3.5
1.1
0.5
1.2
2.5
3.0
1.5
0.0Q217 Q419Q318Q317
0.860.78
0.98
Q118
0.80
0.90
1.01
Q417 Q218 Q418
0.88
Q119 Q219 Q120Q319
0.90
0.43
0.90
1.09 1.10+15%
EPS R12 EPS
EPS, SEK Comments on Q1 EPS
Comments on R12 months EPS
• EPS of 4.56 (3.76)
• Net financials of -15 MSEK (-15)
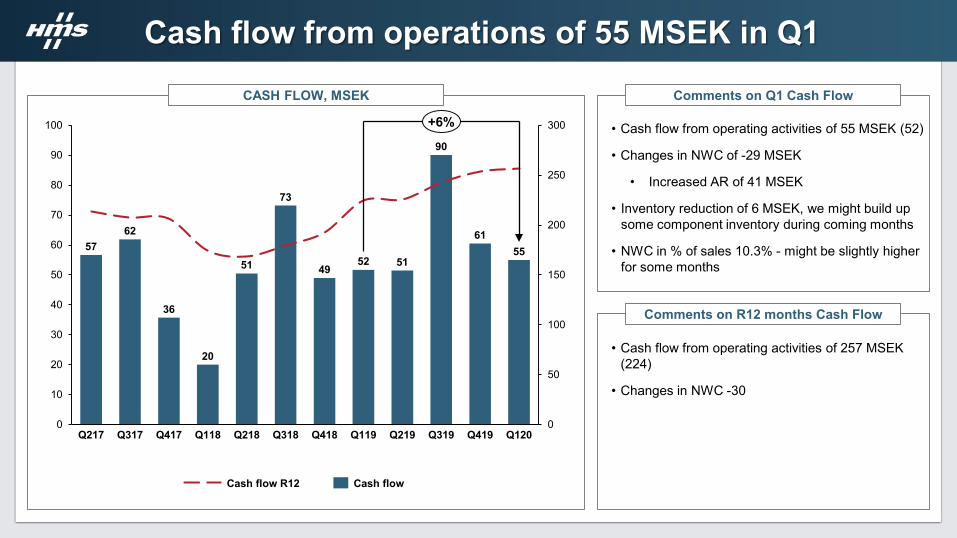
Cash flow from operations of 55 MSEK in Q1
• Cash flow from operating activities of 55 MSEK (52)
• Changes in NWC of -29 MSEK
• Increased AR of 41 MSEK
• Inventory reduction of 6 MSEK, we might build up some component inventory during coming months
• NWC in % of sales 10.3% - might be slightly higher for some months
5762
36
20
51
73
4952 51
90
6155
0
50
100
150
200
250
300
0
10
20
30
40
50
60
70
80
90
100
Q119Q418 Q319Q318Q217 Q120Q317 Q417 Q118 Q218 Q219 Q419
+6%
Cash flow R12 Cash flow
CASH FLOW, MSEK Comments on Q1 Cash Flow
Comments on R12 months Cash Flow
• Cash flow from operating activities of 257 MSEK (224)
• Changes in NWC -30

Net debt 390 MSEK
• Net debt / EBITDA of 1.13 (1.33)
• Net debt / Equity: 0.36 (0.45)
• Reduced leverage as result of no dividend
Net debt and leverage, MSEK Comments on Net debt and leverage
304335
365
311
428365
309 299
98
96
98
93 91
0
50
100
150
200
250
300
350
400
450
500
550
1.3
1.7
0.4
0.0
1.6
1.0
0.3
0.1
1.5
0.6
0.2
0.5
0.70.80.9
1.4
1.11.2
1.8
390
Q219 Q319 Q120
463
Q417 Q218 Q318 Q418 Q119 Q419Q118
409
524
402381
342
-5%
Net debt/EBITDA Net debt IFRS 16 Net debt

Q&A


