Coordinated by Frédérique Motte (AIM Paris-Saclay), Annie Zavagno, and Sylvain Bontemps • 50 researchers from 10 institutes • Management team: P. André, J. di Francesco, F. Motte, S. Pezzuto, D. Ward-Thompson • HOBYS talks: N. Schneider, P. Tremblin, A. Zavagno • HOBYS posters: V. Minier (A#77), Q. Nguyen-Luong, T. Rayner (#63), A. Rivera- Ingraham (#65) D. Russeil (#68), K. Rygl (#69), J. Tigé (#79) • Special credit to: S. Bontemps, P. Didelon, A. Gusdorf, M. Hennemann, T. Hill, F. Louvet, A. Men’shchikov, V. Minier, Q. Nguyen-Luong, N. Schneider Mini-starburst ridges and “present-day” SFR in HOBYS, the Herschel imaging survey of OB Young Stellar objects PACS http://hobys-herschel.cea.fr F. Motte, The universe explored by Herschel, ESTEC October 18th, 2013 1 SAG3
Transcript
Coordinated by Frédérique Motte (AIM Paris-Saclay), Annie Zavagno, and Sylvain Bontemps
• 50 researchers from 10 institutes • Management team: P. André, J. di Francesco, F. Motte, S. Pezzuto, D. Ward-Thompson • HOBYS talks: N. Schneider, P. Tremblin, A. Zavagno • HOBYS posters: V. Minier (A#77), Q. Nguyen-Luong, T. Rayner (#63), A. Rivera-
Ingraham (#65) D. Russeil (#68), K. Rygl (#69), J. Tigé (#79) • Special credit to: S. Bontemps, P. Didelon, A. Gusdorf, M. Hennemann, T. Hill,
F. Louvet, A. Men’shchikov, V. Minier, Q. Nguyen-Luong, N. Schneider
Mini-starburst ridges and “present-day” SFR in HOBYS, the Herschel imaging survey of OB Young Stellar objects
PACS
http://hobys-herschel.cea.fr
F. Motte, The universe explored by Herschel, ESTEC October 18th, 2013 1
SAG3
1. HOBYS specificity 2. Cloud structure study, ridge definition 3. Census of young stellar objects, SFR estimates 4. Future HOBYS work and perspectives
Mini-starburst ridges and “present-day” SFR in HOBYS, the Herschel imaging survey of OB Young Stellar objects
http://hobys-herschel.cea.fr
F. Motte, The universe explored by Herschel, ESTEC October 18th, 2013 2
Schmidt-Kennicutt diagram
DR21
Σgas
ΣSF
R
October 18th, 2013 F. Motte, The universe explored by Herschel, ESTEC
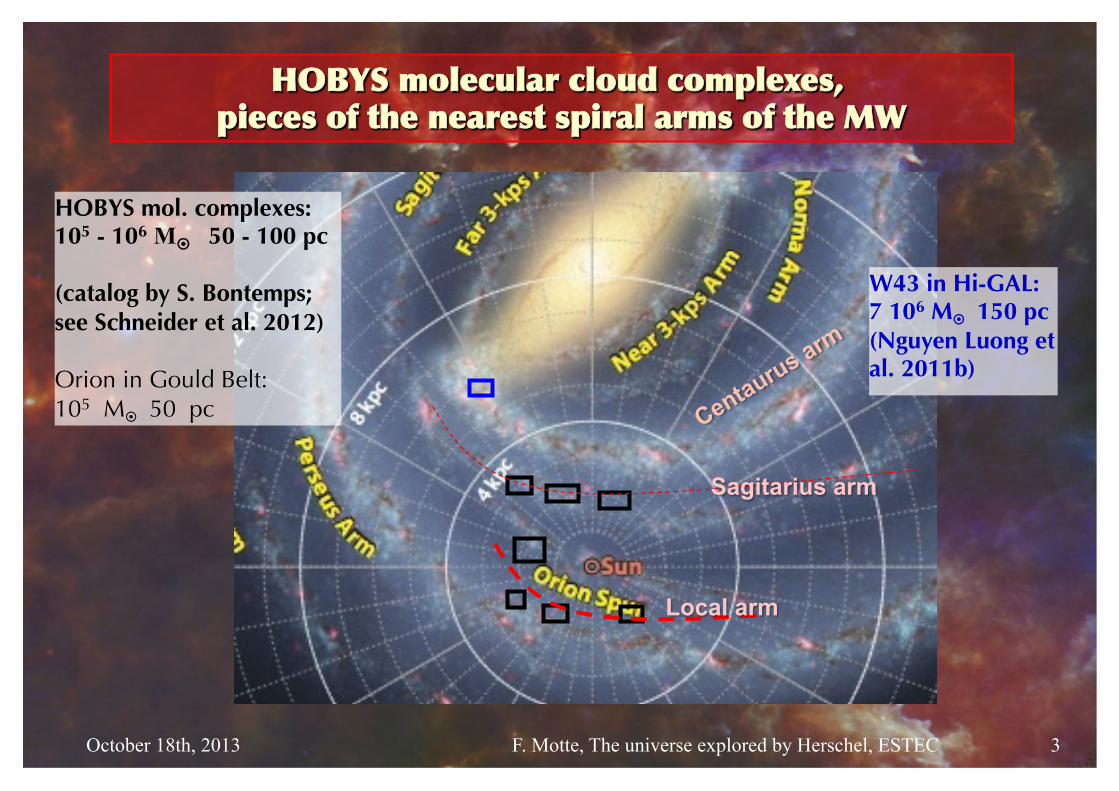
HOBYS molecular cloud complexes, pieces of the nearest spiral arms of the MW
HOBYS mol. complexes: 105 - 106 M 50 - 100 pc (catalog by S. Bontemps; see Schneider et al. 2012) Orion in Gould Belt: 105 M 50 pc
W43 in Hi-GAL: 7 106 M 150 pc (Nguyen Luong et al. 2011b)
Local arm
Sagitarius arm
3
October 18th, 2013 F. Motte, The universe explored by Herschel, ESTEC
HOBYS molecular cloud complexes, one necessary step toward nearby galaxies
HOBYS mol. complexes: 105 - 106 M 50 - 100 pc (catalog by S. Bontemps; see Schneider et al. 2012) Orion in Gould Belt: 105 M 50 pc
W43 in Hi-GAL: 7 106 M 150 pc (Nguyen Luong et al. 2011b)
Local arm
Sagitarius arm
Lada et al. (2012)
HOBYS complexes + W43
4 Mass of gas
October 18th, 2013
• Target all molecular cloud complexes forming OB-type stars at dSun < 3 kpc
HPBW = 6''-36.9'' @ 0.7-3 kpc down to 0.03-0.2 pc dense cores
⇒ census of intermediate- to high-mass protostars
⇒ link between cloud structure and (high-mass) SF
⇒ feedback effects
• Complementary to other Herschel KPs:
- high-mass dense cores (small and isolated clouds) - EPOS (Krause et al.)
- low-mass cores (~0.02 pc) – HGBS, Cold Cores and HOPS survey (André et al.; Juvela, Ristorcelli et al.; Megeath et al.)
- protoclusters (~1 pc clumps) - Hi-GAL (Molinari et al.)
Herschel HOBYS suvey
F. Motte, The universe explored by Herschel, ESTEC 5
T. Hill F. Motte P. Didelon et al.: The Eagle has landed. Herschel’s view of M16
Fig. 1. The 70 µm PACS image of M16 with well-known regions from the literature, as well as regions identified (the ring feature) and discussedin this paper, indicated on the map. Note the extended coverage (East and South) provided by the two sets of PACS observations (see section 2)compared with the common area coverage presented in the rest of the figures. Right: Herschel three-colour (60, 160, 250µm) composite image ofthe Eagle Nebula. As a proxy, the hot regions in this map appear blue, whilst colder regions appear red.
Gvaramadze & Bomans (2008) for more on the NGC6611 clus-ter.
We present here unprecedented high-resolution high-sensitivity Herschel observations, spanning the far-infrared andsubmillimetre regime, of the Eagle Nebula. These Herscheldata cover a much greater, unparalleled area around the cen-tral NGC6611 cluster and the Pillars of Creation than previous(space) observations and studies, which have focused more onthese respective regions. Here we present a structural analysisof the entire M16 molecular cloud complex, with respect to thewell-known central OB cluster and the Pillars of Creation. Aconjunct paper by White et al. (2012) examines the stellar con-tent of the M16 region as detected by Herschel. These authorsreport evidence of a mini-starburst of high-mass star formationin an active ridge adjacent to the ionised cavity around the Pillarsof Creation. Concurrently, Marston et al., (in prep) focus on acomparison of the Pillars of Creation with existing studies.
2. Observations, and data reduction
M16 was observed on 2010, March 24 and September 11 – 12,as part of the HOBYS guaranteed time key program (Motte etal. 2010). In March, the SPIRE (250, 350, 500µm; Gri!n et al.2010) camera was inadvertently turned o" and thus only theshorter PACS (70, 160µm; Poglitsch et al. 2010) wavelengthswere mapped during this period. In September, the parallel-scanmode of Herschel was used to simultaneously map with both in-struments at the aforementioned five bands, using the slow scanspeed (20!!/s). For these September observations, the SPIREcamera was aligned with the PACS data taken from March, al-lowing 100% common area coverage (normally, the positionalo"set between the PACS and SPIRE instruments results in a
small spatial o"set between the PACS and SPIRE maps), as wellas an extended PACS coverage to the east and south. A total areaof " 1.5 deg was mapped using two orthogonal scan directions.
Each of the March and September data were reducedwith version 5.0.1975 of the Herschel Interactive ProcessingEnvironment (HIPE1; Ott 2010) adopting standard steps of thedefault pipeline to level-1 including calibration and deglitching.To improve the baseline subtraction, data taken during the turn-around of the telescope were used. Calibration of the PACS datahas been found to be within 10% and 20% at 70 and 160µm, re-spectively, whilst SPIRE calibration is within 10% for all bands(see the respective observers’ manuals).
Maps were produced using the HIPE level-1 data andv7 of the Scanamorphos software package2 which performsbaseline and drift removal before regriding (Roussel, 2011,submitted). The two sets of PACS data, from March andSeptember, were combined within Scanamorphos using the‘frames fromallscans’ function, to produce a single map of theentire PACS coverage. For simplicity we hereafter refer to thecombination of the PACS data as the PACS data, rather than re-ferring to the singular observational data sets. The highest reso-lution 70µm Herschel image of the M16 region is presented inFig. 1 (left) with the full five bands presented by White et al.(2012). This 70 µm image traces the hot dust, comparable toSpitzer studies, and protostars in this region. The three colourimage is given in Fig. 1 (right).
Feedbacks effects of OB star clusters: Heating, UV compression & triggered star formation
F. Motte, The universe explored by Herschel, ESTEC 6
T. Hill F. Motte P. Didelon et al.: The Eagle has landed. Herschel’s view of M16
Fig. 1. The 70 µm PACS image of M16 with well-known regions from the literature, as well as regions identified (the ring feature) and discussedin this paper, indicated on the map. Note the extended coverage (East and South) provided by the two sets of PACS observations (see section 2)compared with the common area coverage presented in the rest of the figures. Right: Herschel three-colour (60, 160, 250µm) composite image ofthe Eagle Nebula. As a proxy, the hot regions in this map appear blue, whilst colder regions appear red.
Gvaramadze & Bomans (2008) for more on the NGC6611 clus-ter.
We present here unprecedented high-resolution high-sensitivity Herschel observations, spanning the far-infrared andsubmillimetre regime, of the Eagle Nebula. These Herscheldata cover a much greater, unparalleled area around the cen-tral NGC6611 cluster and the Pillars of Creation than previous(space) observations and studies, which have focused more onthese respective regions. Here we present a structural analysisof the entire M16 molecular cloud complex, with respect to thewell-known central OB cluster and the Pillars of Creation. Aconjunct paper by White et al. (2012) examines the stellar con-tent of the M16 region as detected by Herschel. These authorsreport evidence of a mini-starburst of high-mass star formationin an active ridge adjacent to the ionised cavity around the Pillarsof Creation. Concurrently, Marston et al., (in prep) focus on acomparison of the Pillars of Creation with existing studies.
2. Observations, and data reduction
M16 was observed on 2010, March 24 and September 11 – 12,as part of the HOBYS guaranteed time key program (Motte etal. 2010). In March, the SPIRE (250, 350, 500µm; Gri!n et al.2010) camera was inadvertently turned o" and thus only theshorter PACS (70, 160µm; Poglitsch et al. 2010) wavelengthswere mapped during this period. In September, the parallel-scanmode of Herschel was used to simultaneously map with both in-struments at the aforementioned five bands, using the slow scanspeed (20!!/s). For these September observations, the SPIREcamera was aligned with the PACS data taken from March, al-lowing 100% common area coverage (normally, the positionalo"set between the PACS and SPIRE instruments results in a
small spatial o"set between the PACS and SPIRE maps), as wellas an extended PACS coverage to the east and south. A total areaof " 1.5 deg was mapped using two orthogonal scan directions.
Each of the March and September data were reducedwith version 5.0.1975 of the Herschel Interactive ProcessingEnvironment (HIPE1; Ott 2010) adopting standard steps of thedefault pipeline to level-1 including calibration and deglitching.To improve the baseline subtraction, data taken during the turn-around of the telescope were used. Calibration of the PACS datahas been found to be within 10% and 20% at 70 and 160µm, re-spectively, whilst SPIRE calibration is within 10% for all bands(see the respective observers’ manuals).
Maps were produced using the HIPE level-1 data andv7 of the Scanamorphos software package2 which performsbaseline and drift removal before regriding (Roussel, 2011,submitted). The two sets of PACS data, from March andSeptember, were combined within Scanamorphos using the‘frames fromallscans’ function, to produce a single map of theentire PACS coverage. For simplicity we hereafter refer to thecombination of the PACS data as the PACS data, rather than re-ferring to the singular observational data sets. The highest reso-lution 70µm Herschel image of the M16 region is presented inFig. 1 (left) with the full five bands presented by White et al.(2012). This 70 µm image traces the hot dust, comparable toSpitzer studies, and protostars in this region. The three colourimage is given in Fig. 1 (right).
Feedbacks effects of OB star clusters: Heating, UV compression & triggered star formation
F. Motte, The universe explored by Herschel, ESTEC 7
Example cloud filament forming a stellar cluster
70μm, 160μm, 250μm
W48 complex
IRDC G35.39-00.33
Rising NH2 contours
70 µm protostars
Nguyen Luong et al. 2011a; Rygl et al. subm.
October 18th, 2013 F. Motte, The universe explored by Herschel, ESTEC 8
1. HOBYS specificity 2. Cloud structure study, ridge definition 3. Census of young stellar objects, SFR estimates 4. Future HOBYS work and perspectives
Mini-starburst ridges and “present-day” SFR in HOBYS, the Herschel imaging survey of OB Young Stellar objects
F. Motte, The universe explored by Herschel, ESTEC October 18th, 2013 9
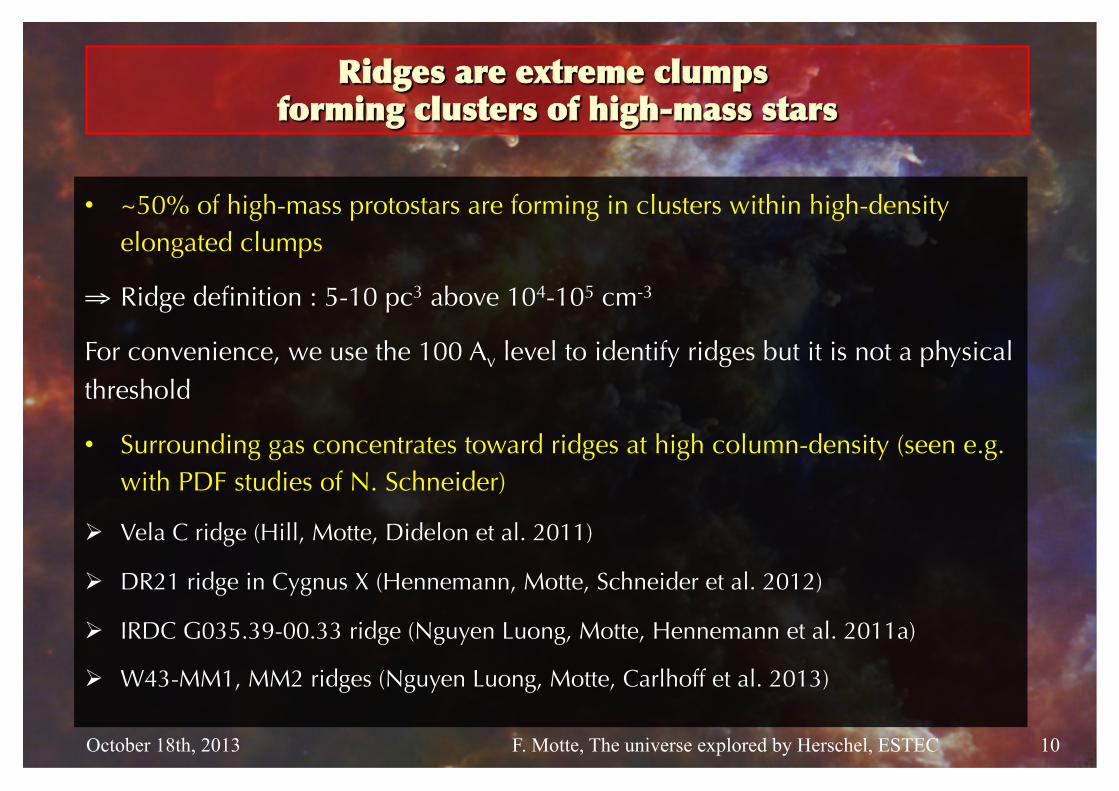
Ridges are extreme clumps forming clusters of high-mass stars
October 18th, 2013 F. Motte, The universe explored by Herschel, ESTEC
• ~50% of high-mass protostars are forming in clusters within high-density elongated clumps
⇒ Ridge definition : 5-10 pc3 above 104-105 cm-3
For convenience, we use the 100 Av level to identify ridges but it is not a physical threshold
• Surrounding gas concentrates toward ridges at high column-density (seen e.g. with PDF studies of N. Schneider)
Vela C ridge (Hill, Motte, Didelon et al. 2011)
DR21 ridge in Cygnus X (Hennemann, Motte, Schneider et al. 2012)
IRDC G035.39-00.33 ridge (Nguyen Luong, Motte, Hennemann et al. 2011a)
W43-MM1, MM2 ridges (Nguyen Luong, Motte, Carlhoff et al. 2013)
10
Minier et al. 2012
Some ridges could have formed by compression by UV radiation…
Vela C ridge
70μm, 160μm, 250μm
A model of ridge formation within a sheet compressed by the OB cluster UV
radiation explains the observed structure and kinematics (Minier, Tremblin, Hill et al.
2012)
October 18th, 2013 F. Motte, The universe explored by Herschel, ESTEC
Column density (contours)
RCW36
11
Most ridges should form by cloud global collapse
Column density (cm-2)
NH2 > 1023 cm-2, 10 000 M, 9 pc2, <n> ~ 104 cm-3
Hennemann, Motte, Schneider et al. 2012
October 18th, 2013 F. Motte, The universe explored by Herschel, ESTEC
Schneider, Csengeri, Bontemps et al. 2010
• Forced-fall (pressure-driven infall) of the DR21 ridge further fed by filaments.
13CO(1-0) 0.2-1 km/s infall speeds
Gas flows along sub-filaments Global infall
12
• Similar kinematics for the W43-MM1 & MM2 ridges (Motte et al. 2005; Louvet et al. in prep.)
Column density (cm-2)
~ Taurus filament
Hennemann et al. 2012
Steps toward SF in ridges:
1. MHD tubulent shocks build-up filaments that gently accrete from their surrounding.
2. Gravity braids filaments in a collapsing clump attracting more filaments.
3. Stars and filaments simultaneously form. Protostar accretion is non-local & aspherical.
⇒ Prestellar cores may not exist in such environment
The DR21 ridge, formed by merging of super-critical filaments?
Radius (pc)
20
40
60
80
100
Col
umn
dens
ity (1
022 c
m-2) Averaged profile
Beam (FWHM 0.17 pc)b)
-1.0 -0.5 0.0 0.5 1.0
2
4
6
8
10
12
14
Col
umn
dens
ity (1
022 c
m-2) c)
October 18th, 2013 F. Motte, The universe explored by Herschel, ESTEC
See Csengeri et al. 2011a-b for gas inflow shears in DR21 cores
See also Henshaw et al. 2013; Louvet et al. in prep. for other ridges 13
October 18th, 2013 F. Motte, The universe explored by Herschel, ESTEC
Bright & extended SiO emission along W43 ridges
SiO classically associated with protostellar outflows but here >70% is associated to 5-10 km/s shocks (Nguyen Luong et al. 2013; Louvet et al. in prep.)
Observations compared with shock models with Si in gas or SiO in grain mantles to constrain the filament merging (Gusdorf et al. in prep.).
See also Jiménez-Serra et al. 2011 for the IRDC G035.39-00.33
Nguyen Luong et al. 2013
W43-MM1 ridge in SiO 2-1 @ IRAM 30m
2-1 5-4 6-5 8-7 10-9
14
Multi-transition with APEX
1. HOBYS specificity 2. Cloud structure study, ridge definition 3. Census of young stellar objects, SFR estimates 4. Future HOBYS work and perspectives
Mini-starburst ridges and “present-day” SFR in HOBYS, the Herschel imaging survey of OB Young Stellar objects
http://hobys-herschel.cea.fr
F. Motte, The universe explored by Herschel, ESTEC October 18th, 2013 15
HOBYS contribution to the Schmidt-Kennicutt (SFE/SFR versus Mgas/Σgas) relation
Making a direct link between protostars and their cloud, Herschel measures instantaneous SFE, easier to compare with statistical models of SFR (e.g. Federrath et al. 2012).
• Herschel or (sub)millimeter samples of protostars (lifetime ~105 yr) (e.g. Motte et al. 2003; Nguyen Luong et al. 2011a)
‘’Present-day’’ SFR
• Spitzer sample of pre-main sequence stars (lifetime ~106 yr) or effect of OB stars (depletion time 2 x 10⁶ yr) on the cloud (e.g. Heiderman et al. 2010; Kennicutt 1998)
‘’Past’’ SFR
With both SFRs, one may constrain the history of star formation...
F. Motte, The universe explored by Herschel, ESTEC October 18th, 2013 16
70 µm protostars
Nguyen Luong et al. 2011a
October 18th, 2013 F. Motte, The universe explored by Herschel, ESTEC
Warning: Spatial scales used for SFR/SFE estimates
70μm, 160μm, 250μm
Cygnus X
Hennemann et al. 2012
100 pc
Local SFR on the DR21 ridge (5 pc)
Global SFR on the CygX-North cloud (50 pc)
CygOB2, 45-100 O stars
17
High-res. extragalactic beam
CygX-North cloud
Mini-starburst cluster in the G035.39-00.33 ridge
• Herschel census:
⇒ 5 high-mass class 0 protostars or 20 protostars with 2 M on the main seq.
• Assumptions:
Core-to-star mass efficiency: ε ∼ 20-40% in 0.1 pc 106 cm-3 dense cores
Protostellar lifetime: 105 yr of IR-quiet/Class0-like massive protostars
Fast episode of cloud formation: 1-3 106 yr
⇒ A mini-burst of SF (SFE ~20%, SFR~300 M/Myr, 40 M/yr/kpc2 within 8 pc2)
(Nguyen-Luong, Motte, Hennemann et al. 2011) Contours: SiO from Jimenez-Serra et al. 2010
October 18th, 2013 F. Motte, The universe explored by Herschel, ESTEC 70 µm protostellar systems
18
Galactic mini-starburst ridges location in a SK diagram
Schmidt-Kennicutt diagram
All these values must be refined with new protostar catalogs. These pioneering studies need to be generalized…
Caveats: Core-to-star formation efficiency assumed to be constant
Extrapolation of a standard IMF to mini-starburst ridges October 18th, 2013 F. Motte, The universe explored by Herschel, ESTEC
Starburst quadrant:
ΣSFR > 1 M/yr/kpc2
Σgas > 100 M/pc2
DR21
19
Adapted from Nguyen Luong et al. 2011 for HOBYS ridges
Constraining statistical theories of SFR on W43-MM1…
According to models of Lada et al. 2012; Krumholz et al. 2011, 2012; Padoan & Nordlund 2012, …
October 18th, 2013 F. Motte, The universe explored by Herschel, ESTEC 20
CFE
nH2 (cm-3)
An IRAM Plateau de Bure census of protostars in the W43-MM1 ridges provides an estimate of the clump to core formation efficiency (CFE, Louvet et al. in prep.).
- They predict a constant CFE = SFRff / ε in regions above the SF threshold (Av> 8 mag).
- It is inconsistent with first measurements!!!
Multi-freefall models (Hennebelle et al. 2012; Federrath et al. 2012) with more realistic cloud structure should be more adequate...
Prediction of threshold models
Louvet et al. in prep.
October 18th, 2013 F. Motte, The universe explored by Herschel, ESTEC
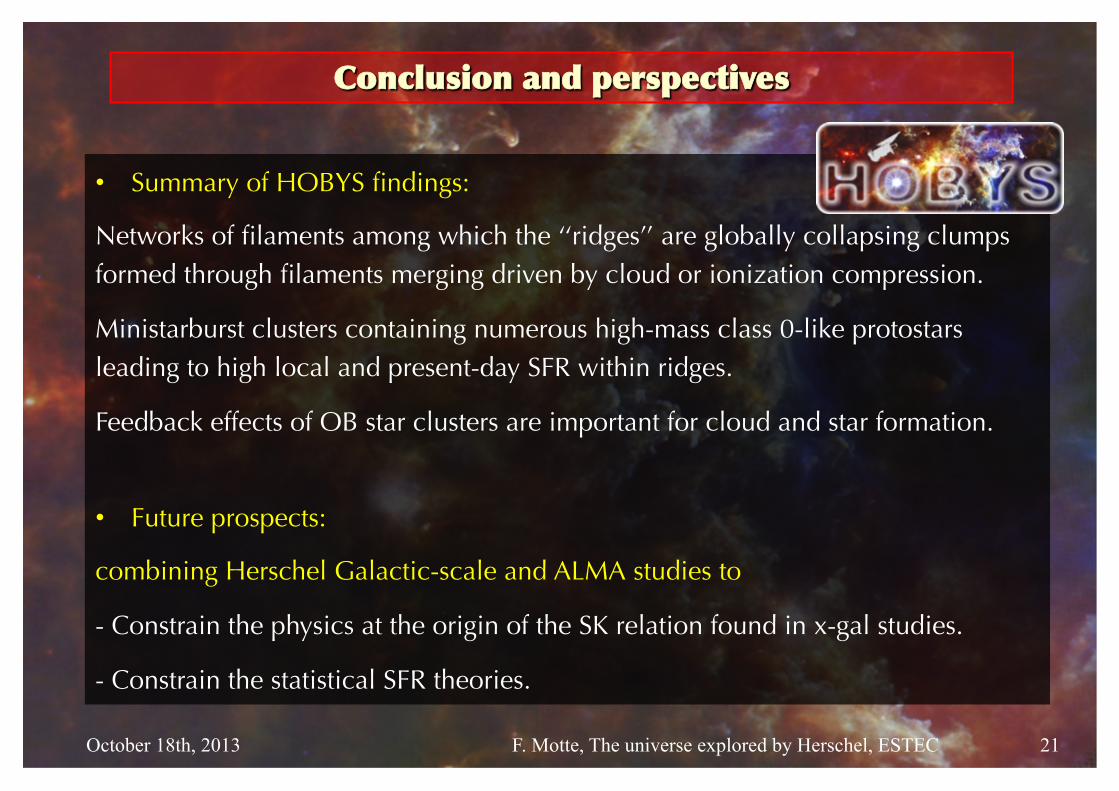
Conclusion and perspectives
• Summary of HOBYS findings:
Networks of filaments among which the ‘‘ridges’’ are globally collapsing clumps formed through filaments merging driven by cloud or ionization compression.
Ministarburst clusters containing numerous high-mass class 0-like protostars leading to high local and present-day SFR within ridges.
Feedback effects of OB star clusters are important for cloud and star formation.
• Future prospects:
combining Herschel Galactic-scale and ALMA studies to
- Constrain the physics at the origin of the SK relation found in x-gal studies.


![[Music Theory] de La Motte - Contrappunto (Desprez)](https://static.documents.pub/doc/80x56/55cf98b3550346d033993094/music-theory-de-la-motte-contrappunto-desprez.jpg)


