+ All Categories
Home > Documents > Hochschule Düsseldorf Fachbereich ... best team will win… SS 2016 - IT Applications in Business...

Hochschule Düsseldorf Fachbereich ... best team will win… SS 2016 - IT Applications in Business...

Date post: 20-May-2018
Category:
Upload: vudang
View: 216 times
Download: 3 times
Share this document with a friend
38
HSD Hochschule Düsseldorf University of Applied Scienses W Fachbereich Wirtschaftswissenschaften Faculty of Business Studies IT Applications in Business Analytics Business Analytics (M.Sc.) IT in Business Analytics SS2016 / Lecture 07 Use Case 1 (Two Class Classification) Thomas Zeutschler SS 2016 - IT Applications in Business Analytics - 6. Analytical Use Case 1 1
Transcript

HSDHochschule Düsseldorf

University of Applied Scienses

WFachbereich Wirtschaftswissenschaften

Faculty of Business Studies

IT Applications in Business Analytics

Business Analytics (M.Sc.)

IT in Business Analytics

SS2016 / Lecture 07 – Use Case 1 (Two Class Classification)

Thomas Zeutschler

SS 2016 - IT Applications in Business Analytics - 6.

Analytical Use Case 11

HSDFaculty of Business Studies

Thomas Zeutschler

Associate Lecturer

Let’s get started…

SS 2016 - IT Applications in Business Analytics - 6. Analytical Use Case 1 2

…be a business analytics consultant!

HSDFaculty of Business Studies

Thomas Zeutschler

Associate Lecturer

Case 1 – Bike Sales

SS 2016 - IT Applications in Business Analytics - 6. Analytical Use Case 1 3

HSDFaculty of Business Studies

Thomas Zeutschler

Associate Lecturer

Point of Departure…

SS 2016 - IT Applications in Business Analytics - 6. Analytical Use Case 1 4

2016 HSD PolygonWhether you're making a go at XC mountain bike racing or simply looking to upgrade your confidence level on the trail, the HSD Polygon hardtail mountain bike proves to be the perfect choice.

The HSD Polygon feature sour race-proven 29er geometry with a low-slung bottom bracket and

incredibly short chainstays for a planted sensation,

snappy handling, and efficient power transfer. It's

the obvious mountain bike for anyone who

demands speed and reliability.

HSDFaculty of Business Studies

Thomas Zeutschler

Associate Lecturer

Point of Departure…

SS 2016 - IT Applications in Business Analytics - 6. Analytical Use Case 1 5

HSD Bike Shop We run a bike shop, both stationary and online.

Based on an online competition we collected

a couple of new customer records.

We want to send an eMail

to the most promising new

customers to advertise our

new 2016 mountain bike model, the HSD Polygon.

Who are they?

HSDFaculty of Business Studies

Thomas Zeutschler

Associate Lecturer

The best team will win…

SS 2016 - IT Applications in Business Analytics - 6. Analytical Use Case 1 6

4x Teams volunteer to deliver the best proposal for the eMail campaign.

Main Deliverable

Proposal for list of “new customers” to send an eMail.

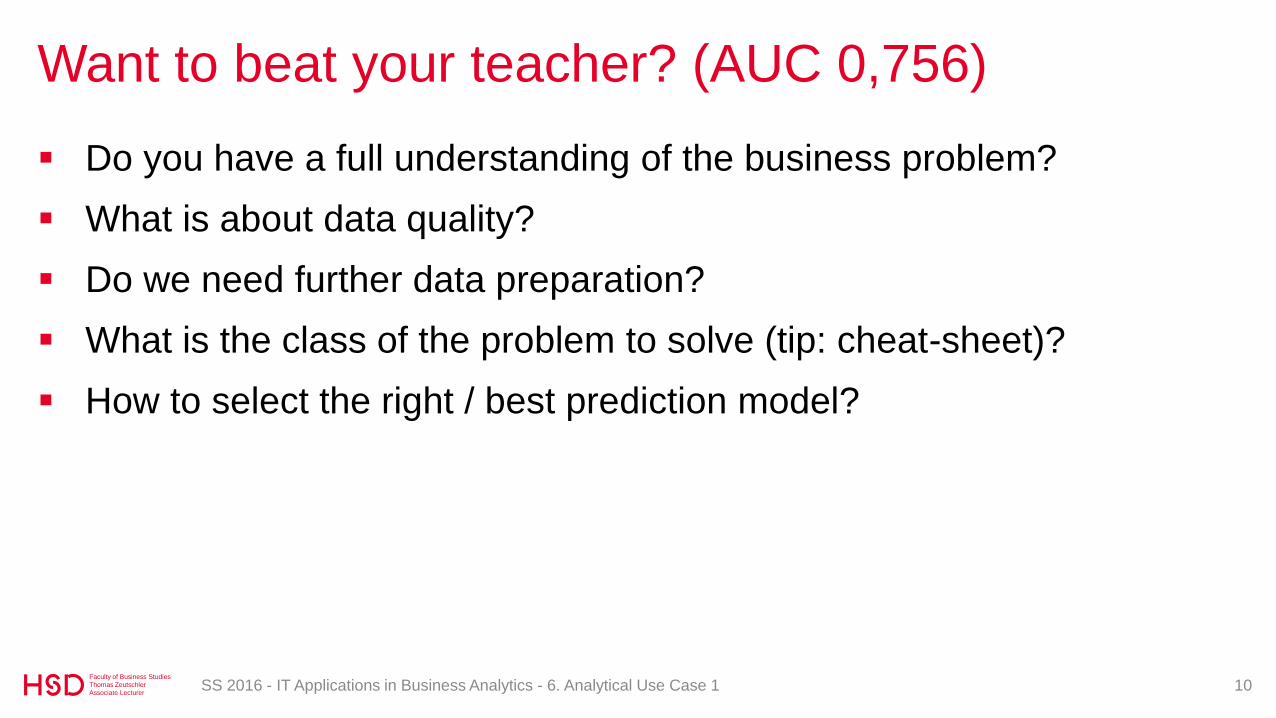
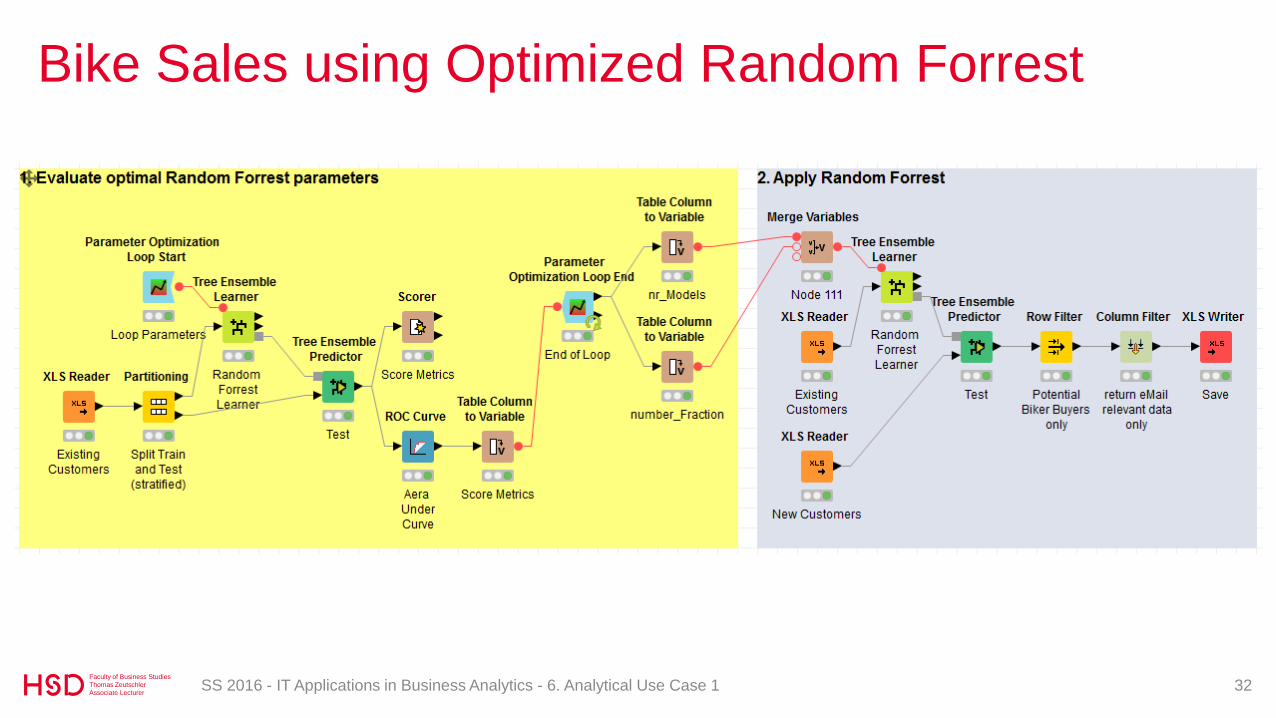
Evaluate the best prediction model

Use the ROC AUC (area under curve) value

Present your results (next week)

What have you done and why?

(use your Knime workflows to explain)

What is your conclusion and proposal?

Compile a few slides, max. 10 minutes presentation

HSDFaculty of Business Studies

Thomas Zeutschler

Associate Lecturer

CRISP DM – Phases and Tasks

SS 2016 - IT Applications in Business Analytics - 6. Analytical Use Case 1 7

Business

Understanding Determine Business

Objectives

Background.

Business Objectives.

Business Success

Criteria.

Assess Situation

Inventory of Resources,

Requirements,

Assumptions and

Constraints.

Risks and Contingencies

Terminology.

Costs and Benefits.

Determine Data Mining

Goals

Data Mining Goals.

Data Mining Success

Criteria.

Produce Project Plan

Project Plan.

Initial Assessment of

Tools and Techniques.

Data

UnderstandingCollect Initial Data

Initial Data Collection

Report.

Describe Data

Data Description

Report.

Explore Data

Data Exploration

Report.

Verify Data Quality

Data Quality Report.

Data

PreparationSelect Data

Rationale for Inclusion/

Exclusion.

Clean Data

Data Cleaning Report.

Construct Data

Derived Attributes.

Generated Records.

Integrate Data

Merged Data.

Format Data

Reformatted Data.

Dataset

Dataset Description.

Modelling

Select Modelling

Technique

Modelling Technique.

Modelling Assumptions.

Generate Test Design

Test Design.

Build Model

Parameter Settings

Models.

Model Description.

Assess Model

Model Assessment.

Revised Parameter

Settings.

Evaluation

Evaluate Results

Assessment of Data.

Mining Results w.r.t.

Business Success

Criteria.

Approved Models.

Review Process

Review of Process.

Determine Next Steps

List of Possible Actions.

Decision.

Deployment

Plan Deployment

Deployment Plan.

Plan Monitoring and

Maintenance

Monitoring and

Maintenance Plan.

Produce Final Report

Final Report.

Final Presentation.

Review Project

Experience

Documentation.

HSDFaculty of Business Studies

Thomas Zeutschler

Associate Lecturer

Available Data

SS 2016 - IT Applications in Business Analytics - 6. Analytical Use Case 1 8

Sheet: ExistingCustomers >>> Use for model training and test.

Sheet: NewCustomers >>> Select promising eMails receivers.

https://wiwi.hs-duesseldorf.de/personen/thomas.zeutschler/Seiten/default.aspx

HSDFaculty of Business Studies

Thomas Zeutschler

Associate Lecturer

Knime Sample Implementation…

SS 2016 - IT Applications in Business Analytics - 6. Analytical Use Case 1 9

Beat the teacher. Area Under Curve = 0,756

Receiver Operating Characteristic (ROC),

is a graphical plot that illustrates the

performance of a binary classifier system

as its discrimination threshold is varied.

https://wiwi.hs-

duesseldorf.de/personen/thomas.zeuts

chler/Seiten/default.aspx

HSDFaculty of Business Studies

Thomas Zeutschler

Associate Lecturer

Want to beat your teacher? (AUC 0,756)

SS 2016 - IT Applications in Business Analytics - 6. Analytical Use Case 1 10

Do you have a full understanding of the business problem?

What is about data quality?

Do we need further data preparation?

What is the class of the problem to solve (tip: cheat-sheet)?

How to select the right / best prediction model?

HSDFaculty of Business Studies

Thomas Zeutschler

Associate Lecturer

Cheating

SS 2016 - IT Applications in Business Analytics - 6. Analytical Use Case 1 11

HSDFaculty of Business Studies

Thomas Zeutschler

Associate Lecturer

Two Class Classification

SS 2016 - IT Applications in Business Analytics - 6. Analytical Use Case 1 12

HSDFaculty of Business Studies

Thomas Zeutschler

Associate Lecturer

Two Class Classification – Introduction

SS 2016 - IT Applications in Business Analytics - 6. Analytical Use Case 1 13

Also called “Binary Classification”

Statistical Problem:

“Classify the elements of a given set

into two groups by applying a certain

classification method.”

Application in economies:

Customer selection, e.g. Whom to send an eMail?

Portfolio decisions, e.g. What stocks or products to buy?

Any kind of Yes/No assignment

Application in medical testing: Has a patient a certain disease or not?

HSDFaculty of Business Studies

Thomas Zeutschler

Associate Lecturer

Two Class Classification – Similar Problems

SS 2016 - IT Applications in Business Analytics - 6. Analytical Use Case 1 14

Super-Problem:

“Statistical Classification”

One Class (unary) Classification

“Identify specific elements among others.”

Application: outlier detection, anomaly detection, novelty detection

Multi-Class (multinomial) Classification

“Classify the elements of a given set into more than

two groups by applying a certain classification method.”

Application: clustering, attribute assignment, just more then 2 classes

HSDFaculty of Business Studies

Thomas Zeutschler

Associate Lecturer

Actual

Class

Predicted Class

Yes

No

Yes NoBiker Buyer ?

……

… …

Two Class Classification – Confusion Matrix

SS 2016 - IT Applications in Business Analytics - 6. Analytical Use Case 1 15

Purpose: Evaluate the performance of a certain classification algorithm.

HSDFaculty of Business Studies

Thomas Zeutschler

Associate Lecturer

Two Class Classification – Confusion Matrix

SS 2016 - IT Applications in Business Analytics - 6. Analytical Use Case 1 16

Purpose: Evaluate the performance of a certain classification algorithm.

Actual

Class

Predicted Class

Yes

No

Yes NoBiker Buyer ?

true negativestrue positives

false positive false negatives

error

correct

HSDFaculty of Business Studies

Thomas Zeutschler

Associate Lecturer

Actual

Class

Predicted Class

Yes

No

Yes No

Biker Buyer ?

Population = 3.017

20496

77 2.640

Two Class Classification – Confusion Matrix

SS 2016 - IT Applications in Business Analytics - 6. Analytical Use Case 1 17

Purpose: Evaluate the performance of a certain classification algorithm.

HSDFaculty of Business Studies

Thomas Zeutschler

Associate Lecturer

predicted condition

positive negativeTotal Population

real

condition

positive

negative

false negative(type II error)true positive

false positive(type I error) true negative

Two Class Classification – Confusion Matrix

SS 2016 - IT Applications in Business Analytics - 6. Analytical Use Case 1 18

Positive Predictive Value (PPV),

= Σ True positive /

Σ Test outcome positive

(also called Precision)

False Omission Rate (FOR)

= Σ False negative /

Σ Test outcome negative

False Discovery Rate (FDR)

= Σ False positive /

Σ Test outcome positive

Negative Predictive Value (NPV)

= Σ True negative /

Σ Test outcome negative

True Positive Rate (TPR)

= Σ True positive /

Σ Condition positive

(also called Sensitivity, Recall)

False Negative Rate (FNR)

= Σ False negative /

Σ Condition positive

(also called Miss rate)

False Positive Rate (FPR)

= Σ False positive /

Σ Condition negative

(also called Fall-out)

True Negative Rate (TNR)

= Σ True negative /

Σ Condition negative

(also called Specificity (SPC))

Purpose: Evaluate the performance of a certain classification algorithm.

Accuracy (ACC)

= (Σ True positive +

Σ True negative) /

Σ Total population

Prevalence

= Σ Condition positive /

Σ Total population

Positive Likelihood Ratio (LR+)

= TPR / FPR

Negative Likelihood Ratio (LR−)

= FNR / TNR

Diagnostic Odds Ratio (DOR)

= LR+ / LR−

HSDFaculty of Business Studies

Thomas Zeutschler

Associate Lecturer

Classification Method Comparison

SS 2016 - IT Applications in Business Analytics - 6. Analytical Use Case 1 19

http://tjo-en.hatenablog.com/entry/2014/01/06/234155

Linearly separable pattern:

Binary (2-classes) classification

HSDFaculty of Business Studies

Thomas Zeutschler

Associate Lecturer

Classification Method Comparison

SS 2016 - IT Applications in Business Analytics - 6. Analytical Use Case 1 20

Linearly inseparable pattern:

Binary Classification

for a simple XOR patternhttp://tjo-en.hatenablog.com/entry/2014/01/06/234155

HSDFaculty of Business Studies

Thomas Zeutschler

Associate Lecturer

Classification Method Comparison

SS 2016 - IT Applications in Business Analytics - 6. Analytical Use Case 1 21

Linearly separable pattern:

3-classes classification

http://tjo-en.hatenablog.com/entry/2014/01/06/234155

HSDFaculty of Business Studies

Thomas Zeutschler

Associate Lecturer

Classification Method Comparison

SS 2016 - IT Applications in Business Analytics - 6. Analytical Use Case 1 22

Linearly inseparable pattern:

Binary Classification for a

complex XOR pattern

http://tjo-en.hatenablog.com/entry/2014/01/06/234155

HSDFaculty of Business Studies

Thomas Zeutschler

Associate Lecturer

Classification Method Comparison

SS 2016 - IT Applications in Business Analytics - 6. Analytical Use Case 1 23

4-classes classification

for a complex pattern

http://tjo-en.hatenablog.com/entry/2014/01/06/234155

HSDFaculty of Business Studies

Thomas Zeutschler

Associate Lecturer

Classification Method Comparison

SS 2016 - IT Applications in Business Analytics - 6. Analytical Use Case 1 24

Try to understand the pattern of data...

…by applying visual data analysis

…by applying pairwise comparison of attributes

Is your data Linear Separable?

Yes: Logistic Regression, Neuronal Networks…be cautious on Decision Tree or Random Forrest

No: Random Forrest or SVM

???: Random Forrest…good balance of generalization and accuracy, and its computational cost is relatively low

But: Neuronal Networks can (not must) be the best solution…but it’s not easy to tune them to deliver good results (many parameters).

HSDFaculty of Business Studies

Thomas Zeutschler

Associate Lecturer

Decision Tree Learning

SS 2016 - IT Applications in Business Analytics - 6. Analytical Use Case 1 25

HSDFaculty of Business Studies

Thomas Zeutschler

Associate Lecturer

Decision Tree Learning

SS 2016 - IT Applications in Business Analytics - 6. Analytical Use Case 1 26

Decision Tree (partial) for Bike Sales Sample

A supervised learning method.

Purpose: Predict the value of a certain

target variable of an item based on

observations on other variables

from other items.

If the target variable is from a

finite set of values, then we

call it classification tree.

Otherwise a regression tree.

Leaves represent class

labels, whereas Branches

represent conjunctions

of features (variables)

that lead to those class labels.

HSDFaculty of Business Studies

Thomas Zeutschler

Associate Lecturer

Decision Tree Learning

SS 2016 - IT Applications in Business Analytics - 6. Analytical Use Case 1 27

A decision trees describe data, not decisions.

A decision tree can be used as input

for decision making, e.g. a prediction.

Computation: Recursive Partitioning Recursively split the data set into subsets based

on an attribute-value-test. (Greedy Algorithm)

The recursion is completed when the subset at

a node has all the same value of the target variable,

or when splitting no longer adds value to the predictions.

This approach is called top-down induction of decision trees

Different algorithms and metrics have been developed to

solve the core in decision tree generation: What is the

right variable at each step that best splits the set of items?

Greedy Algorithm: making the locally optimal

choice at each stage of recursive process.

HSDFaculty of Business Studies

Thomas Zeutschler

Associate Lecturer

Decision Tree Learning in Knime

SS 2016 - IT Applications in Business Analytics - 6. Analytical Use Case 1 28

Metric (quality measure) for splitting:

Gini Index or “Gini Impurity” :Given a set of m items i of {1,2,…,m} and fi be the fraction of

items labeled with the value vi.

Information Gain Ratio:Based on the entropy* of an information:

Information Gain is defined as

= Entropy(parent) - Weighted Sum of Entropy(Children)

*the expected value of an information.

HSDFaculty of Business Studies

Thomas Zeutschler

Associate Lecturer

Decision Tree Learning in Knime

SS 2016 - IT Applications in Business Analytics - 6. Analytical Use Case 1 29

Pruning Method

Pruning reduces tree size and avoids overfitting

which increases the generalization performance,

and thus, the prediction quality. Available is the

"Minimal Description Length" (MDL) pruning or

it can also be switched off.

Reduced Error Pruning

Just relevant if execution speed matters. Otherwise

switch it off.

Skip nominal columns with domain information

Always switch on. This ensures that columns with

too many nominal values (e.g. the customer name

in the bike sales sample) are automatically skipped.

HSDFaculty of Business Studies

Thomas Zeutschler

Associate Lecturer

Bike Sales – Solutions

SS 2016 - IT Applications in Business Analytics - 6. Analytical Use Case 1 30

HSDFaculty of Business Studies

Thomas Zeutschler

Associate Lecturer

Bike Sales using Decision Tree

SS 2016 - IT Applications in Business Analytics - 6. Analytical Use Case 1 31

HSDFaculty of Business Studies

Thomas Zeutschler

Associate Lecturer

Bike Sales using Optimized Random Forrest

SS 2016 - IT Applications in Business Analytics - 6. Analytical Use Case 1 32

HSDFaculty of Business Studies

Thomas Zeutschler

Associate Lecturer

Result Comparision

SS 2016 - IT Applications in Business Analytics - 6. Analytical Use Case 1 33

Optimized Random Forrest

Decision Tree

HSDFaculty of Business Studies

Thomas Zeutschler

Associate Lecturer

Bike Sales reevaluation by common sense

SS 2016 - IT Applications in Business Analytics - 6. Analytical Use Case 1 34

Just 2000 new customers?

Let’s send everyone an eMail…

HSDFaculty of Business Studies

Thomas Zeutschler

Associate Lecturer

Lecture Summary & Homework

SS 2016 - IT Applications in Business Analytics - 6. Analytical Use Case 1 35

HSDFaculty of Business Studies

Thomas Zeutschler

Associate Lecturer

Lessons Learned

SS 2016 - IT Applications in Business Analytics - 6. Analytical Use Case 1 36

Try to understand the business problem end-to-end.

Try think beyond the scope of your current knowledge and work.

That’s analytical thinking.

Even simple looking analytical problems may get tricky.

You must follow multiple analytical paths to find the best solution.

HSDFaculty of Business Studies

Thomas Zeutschler

Associate Lecturer

Homework

SS 2016 - IT Applications in Business Analytics - 6. Analytical Use Case 1 37

Read the post

“Classification performance comparison”

http://tjo-en.hatenablog.com/entry/2014/01/06/234155

Read the article

“Predicting Good Probabilities With Supervised Learning”

http://machinelearning.wustl.edu/mlpapers/paper_files/icml2005_Nicule

scu-MizilC05.pdf

HSDFaculty of Business Studies

Thomas Zeutschler

Associate Lecturer

Any Questions?

SS 2016 - IT Applications in Business Analytics - 6. Analytical Use Case 1 38


Recommended