23
Hold ’em or Fold ’em: Where are We in the Equity Cycle? Danny Bubis, CFA Alec MacIsaac, CFA Aaron Clark, CFA Ben Ellis, CFA
| Date post: | 26-Dec-2015 |
| Category: |
Documents |
| Upload: | barrie-welch |
| View: | 225 times |
| Download: | 0 times |

Hold ’em or Fold ’em:Where are We in the Equity Cycle?
Danny Bubis, CFAAlec MacIsaac, CFA
Aaron Clark, CFABen Ellis, CFA

Tetrem – who we are
• North American equities (Canada and U.S.)• Value focus, large-cap bias• $5.9 billion assets under management• Winnipeg and Boston offices• Founded in 2004, employee-owned• Personal investments same as clients’

Tetrem – who we are
Funds managed at CI• CI Canadian Investment (since 2006)• CI Canadian Dividend (since 2011)• United Canadian Equity Value (since 1993)• United US Equity Alpha Corp Class (since 2008)• Allocations within Portfolio Series and Synergy Tactical Asset
Allocation
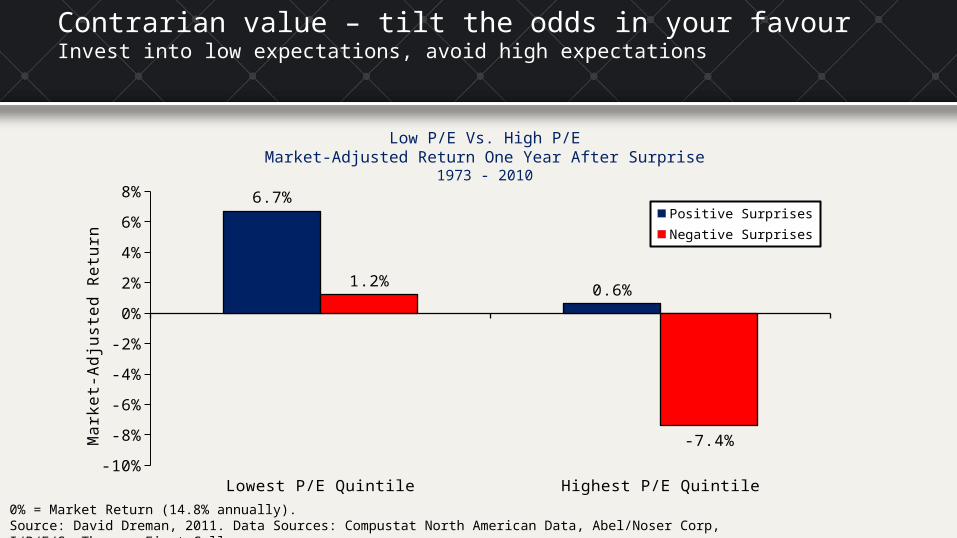
Lowest P/E Quintile Highest P/E Quintile-10%
-8%
-6%
-4%
-2%
0%
2%
4%
6%
8% 6.7%
0.6%1.2%
-7.4%
Positive SurprisesNegative Surprises
Mar
ket-
Adju
sted
Ret
urn
Low P/E Vs. High P/EMarket-Adjusted Return One Year After Surprise
1973 - 2010
0% = Market Return (14.8% annually).Source: David Dreman, 2011. Data Sources: Compustat North American Data, Abel/Noser Corp, I/B/E/S, Thomson First Call.
Contrarian value – tilt the odds in your favourInvest into low expectations, avoid high expectations

Contrarian value – tilt the odds in your favourLow volatility is normal
Volatility Index (VIX)January 5, 1990 Through September 5, 2014
Source: Bloomberg.
0
10
20
30
40
50
60
70
80
90
Jan '90 Jan '95 Jan '00 Jan '05 Jan '10
Years of High Anxiety
Years of Normalcy
?

Sell-Side Consensus Indicator
Source: BofA Merrill Lynch Global Research US Equity Strategy. As of August 31, 2014.
Contrarian value – tilt the odds in your favourSell-side bearishness is bullish for stocks

Large cap – the next hot handLarge caps lining up for outperformance
12/31/1978 12/31/1983 12/31/1988 12/31/1993 12/31/1998 12/31/2003 12/31/2008 12/31/20130.60
0.80
1.00
1.20
1.40
1.60
1.80
0.77
S&P 100 (Mega Caps) VS. Russell 2000 (Small Caps)
Source: BofA Merrill Lynch, Bloomberg. As of July 31, 2014.
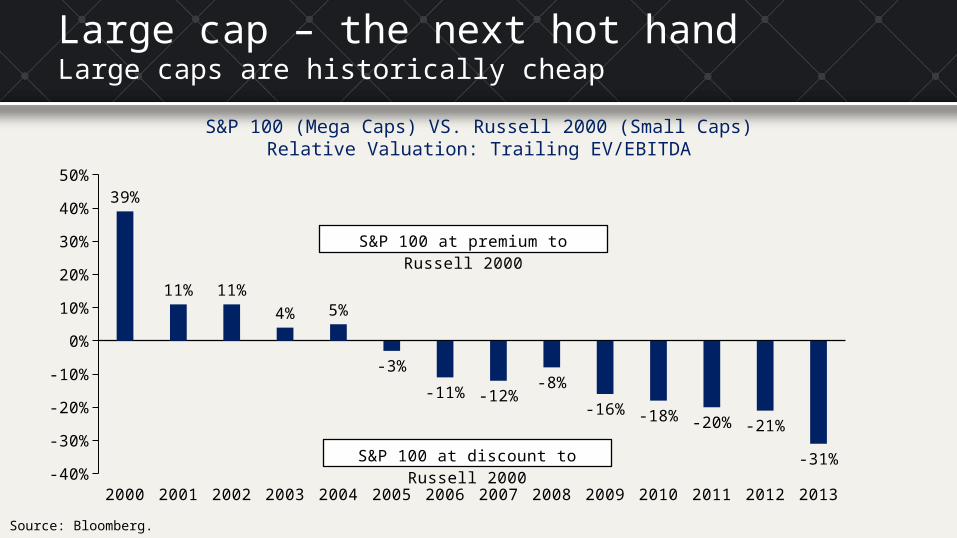
Large cap – the next hot handLarge caps are historically cheap
S&P 100 (Mega Caps) VS. Russell 2000 (Small Caps)Relative Valuation: Trailing EV/EBITDA
Source: Bloomberg.
2000 2001 2002 2003 2004 2005 2006 2007 2008 2009 2010 2011 2012 2013-40%
-30%
-20%
-10%
0%
10%
20%
30%
40%
50%
39%
11% 11%4% 5%
-3%
-11% -12%-8%
-16% -18% -20% -21%
-31%
S&P 100 at premium to Russell 2000
S&P 100 at discount to Russell 2000

Source: Empirical Research Partners. As of August 31, 2014.
Dividend growth – not a crap shootDividend growers are the value opportunity
52 54 56 58 60 62 64 66 68 70 72 74 76 78 80 82 84 86 88 90 92 94 96 98 00 02 04 06 08 10 12 140.0
0.5
1.0
1.5
2.0
2.5
3.0
3.5Dividend Growth Is More Highly Valued
Dividend Yield Is More Highly Valued (i.e. Dividend Growth Is Cheap)
Average
Ratio of Trailing P/E – Highest Quintiles of Dividend Growth and Yield
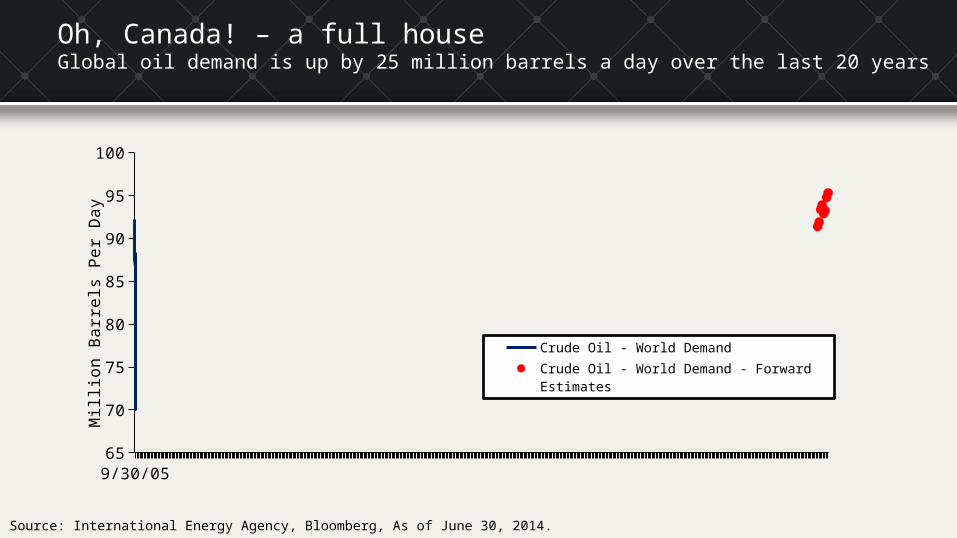
12/31/1995 12/31/1998 12/31/2001 12/31/2004 12/31/2007 12/31/2010 12/31/201365
70
75
80
85
90
95
100
Crude Oil - World Demand
Crude Oil - World Demand - Forward Estimates
Mill
ion
Ba
rre
ls P
er
Da
y
Source: International Energy Agency, Bloomberg, As of June 30, 2014.
Oh, Canada! – a full houseGlobal oil demand is up by 25 million barrels a day over the last 20 years

World Oil Consumption In 2012Barrels Consumed Per Capita
(1) Source: United States Energy Information Agency, Ned Davis Research. Monthly data. As of September 30, 2013.(2) Series allocated to 100 on December 31, 1993.
Oh, Canada! – a full houseDeveloping countries hold the key to growth in oil demand
FQ1 ...
FQ2 ...
FQ3 ...
FQ4 ...
FQ1 ...
FQ2 ...
FQ3 ...
FQ4 ...
FQ1 ...
FQ2 ...
FQ3 ...
FQ4 ...
FQ1 ...
FQ2 ...
FQ3 ...
FQ4 ...
FQ1 ...
FQ2 ...
FQ3 ...
FQ4 ...
FQ1 ...
FQ2 ...
FQ3 ...
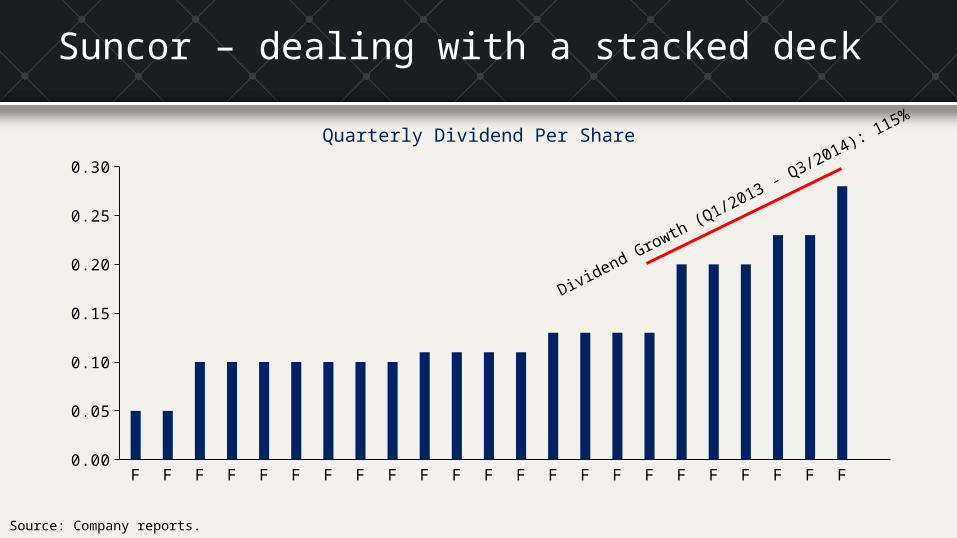
0.00
0.05
0.10
0.15
0.20
0.25
0.30
Suncor – dealing with a stacked deck
Source: Company reports.
Quarterly Dividend Per Share
Dividend Growth (Q1/2013 - Q3/2014): 115%

Intel – the house always wins
2009 2010 2011 2012 2013 2014e0
10
20
30
40
50
60
$4$9
$25
$33
$38
$51
US$
Bill
ions
Source: Historic figures derived from company reports. Forward looking estimates are from Tetrem Capital Management. As of September 8, 2014.
Cumulative Cash Returned to Shareholders Since 2009
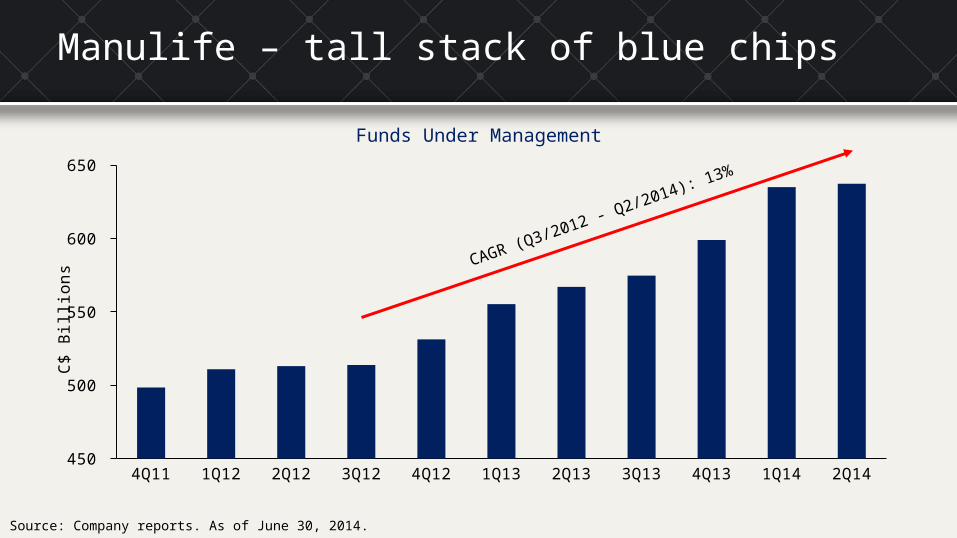
4Q11 1Q12 2Q12 3Q12 4Q12 1Q13 2Q13 3Q13 4Q13 1Q14 2Q14 450
500
550
600
650
C$ B
illio
nsManulife – tall stack of blue chips
Source: Company reports. As of June 30, 2014.
CAGR (Q3/2012 - Q2/2014): 13%
Funds Under Management

Open Text – a cash flow slot machine
Source: Company reports. As of September 3, 2014.
Cash Flow
FY07 FY08 FY09 FY10 FY11 FY12 FY13 FY14$0
$100
$200
$300
$400
$500
$110
$166$186
$214$244
$287
$339
$448
C$ M
illio
ns
7 Year CAGR: 22%
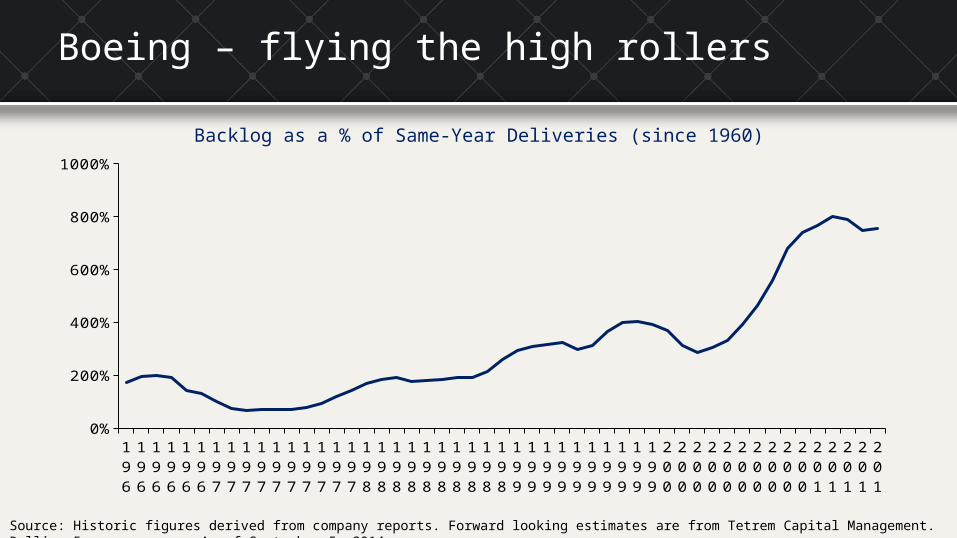
Boeing – flying the high rollers
Source: Historic figures derived from company reports. Forward looking estimates are from Tetrem Capital Management. Rolling 5-year average. As of September 5, 2014.
Backlog as a % of Same-Year Deliveries (since 1960)
1964
1965
1966
1967
1968
1969
1970
1971
1972
1973
1974
1975
1976
1977
1978
1979
1980
1981
1982
1983
1984
1985
1986
1987
1988
1989
1990
1991
1992
1993
1994
1995
1996
1997
1998
1999
2000
2001
2002
2003
2004
2005
2006
2007
2008
2009
2010
2011
2012
2013
2014
0%
200%
400%
600%
800%
1000%

Thomson Reuters – coming out of rehab
Source: Company reports, Bloomberg. As of September 10, 2014.
EBITDA Margin
2010 2011 2012 2013 2014E 2015E 2016E22%
23%
24%
25%
26%
27%
28%
29%
30%
31%
2016E FCF $2,486M
2013 FCF $1,099M

CI Canadian Investment Fund
Source: Fundata, August 31, 2014

CI Canadian Dividend Fund
Source: Fundata, August 31, 2014

United Canadian Equity Value Corporate Class
Source: Fundata, August 31, 2014

United U.S. Equity Alpha Corporate Class
Source: Fundata, August 31, 2014

Questions?

FOR ADVISOR USE ONLY – NOT FOR DISTRIBUTION TO CLIENTS
®CI Investments, the CI Investments design are registered trademarks of CI Investments Inc. Commissions, trailing commissions, management fees and expenses all may be associated with mutual fund investments. Please read the prospectus before investing. Unless otherwise indicated and except for returns for periods less than one year, the indicated rates of return are the historical annual compounded total returns including changes in security value. All performance data assume reinvestment of all distributions or dividends and do not take into account sales, redemption, distribution or optional charges or income taxes payable by any securityholder that would have reduced returns. Mutual funds are not guaranteed, their values change frequently and past performance may not be repeated. This communication is published by CI as a general source of information and is not intended to provide personal legal, accounting, investment or tax advice. Facts and data provided by CI and other sources are believed to be reliable when posted; however, CI cannot guarantee that they are accurate or complete or that they will be current at all times. CI and its affiliates will not be responsible in any manner for direct, indirect, special or consequential damages howsoever caused, arising out of the use of this presentation.
Thank you


