2828 N. Harwood, Suite 1300, Dallas, Texas 75201 (Address of Principal Executive Offices)
(214) 871-3555
(Registrant’s telephone number, including area code) Check the appropriate box below if the Form 8-K filing is intended to simultaneously satisfy the filing obligation of the registrant under any of the following provisions: [ ] Written communications pursuant to Rule 425 under the Securities Act (17 CFR 230.425) [ ] Soliciting material pursuant to Rule 14a-12 under the Exchange Act (17 CFR 240.14a-12) [ ] Pre-commencement communications pursuant to Rule 14d-2(b) under the Exchange Act (17 CFR
240.14d-2(b)) [ ] Pre-commencement communications pursuant to Rule 13e-4(c) under the Exchange Act (17 CFR
240.13e-4(c))
__________________
1
95277916.4
HOLLYFRONTIER CORPORATION (Exact name of registrant as specified in its charter)
Furnished as Exhibit 99.1 and incorporated by reference into this Item 7.01 in its entirety is a copy of a presentation to be presented by HollyFrontier Corporation (the “Corporation ”) on March 24, 2014 at the Howard Weil Energy Conference in New Orleans, Louisiana and to current and potential investors at other meetings throughout 2014.
The information contained in, or incorporated into, this Item 7.01 is being furnished and shall not be deemed “filed” for the purposes of Section 18 of the Securities Exchange Act of 1934, as amended, or otherwise subject to the liabilities of that section, nor shall it be deemed incorporated by reference into any registration statement or other filing under the Securities Act of 1933, as amended, except as shall be expressly set forth by specific reference to such filing.
Item 9.01 Financial Statements and Exhibits.
(d) Exhibits
_______________________ * Furnished herewith.
1
Exhibit No. Description
99.1 Presentation by the Corporation to be presented on March 24, 2014 at the Howard Weil Energy Conference in New Orleans, Louisiana .*
SIGNATURES
Pursuant to the requirements of the Securities Exchange Act of 1934, the registrant has duly caused this report to be signed on its behalf by the undersigned hereunto duly authorized.
Date: March 20, 2014
HOLLYFRONTIER CORPORATION
By: /s/ Douglas S. Aron
Name: Douglas S. Aron
Title: Executive Vice President and Chief
Financial Officer
EXHIBIT INDEX
_______________________ * Furnished herewith.
2
Exhibit No. Description
99.1 Presentation by the Corporation to be presented on March 24, 2014 at the Howard Weil Energy Conference in New Orleans, Louisiana.*
Investor Presentation March 2014
2
3
HollyFrontier Investment Highlights 4 � Pure play competitive refinery � 5 refineries with 443,000 barrels per day refining capacity � Attractive niche product markets with advantaged crude supply � Rocky Mountains, Southwest and Mid-Continent � Strong investment track record with future growth focused on advantaged projects � Woods Cross, El Dorado and Tulsa ref ineries purchased at industry lows on a per barrel basis � Strong Financial Performance � Industry leading returns on capital � Best in class net income per barrel crude capacity � Track record of high cash return to shareholders � Strong and Liquid Balance Sheet � Investment Grade Ratings from S&P and Moody’s � Significant Ownership in High-Quality Logistics MLP, Holly Energy Partners � Own 39% of HEP, including 2% GP interest and 37% of LP Units � Have achieved high-split on GP Incentive Distribution Rights � For FY2013, HFC received over $73 million in cash distributions from HEP
Footpr int of HollyFrontier and Holly Energy Partners Collaboration with HEP provides strategic growth opportunities in logistics and marketing operations 5
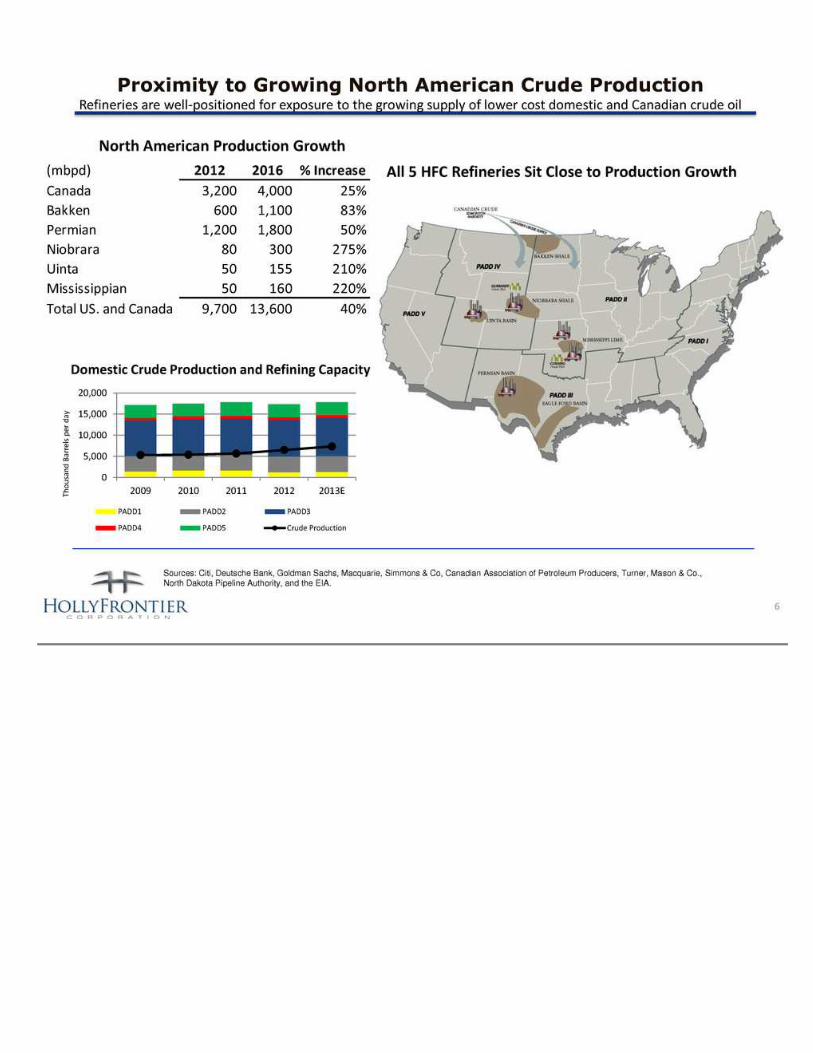
Proximity to Growing North American Crude Production Refiner ies are well-positioned for exposure to the growing supply of lower cost domestic and Canadian crude oil 6 Sources: Citi, Deutsche Bank, Goldman Sachs, Macquarie, Simmons & Co, Canadian Association of Petroleum Producers, Turner, Mason & Co., North Dakota Pipeline Authority, and the EIA. All 5 HFC Refineries Sit Close to Production Growth Domestic Crude Production and Refining Capacity North American Production Growth Th o u sa n d B ar re ls p er d ay 0 5,000 10,000 15,000 20,000 2009 2010 2011 2012 2013E PADD1 PADD2 PADD3 PADD4 PADD5 Crude Production (mbpd) 2012 2016 % Increase Canada 3,200 4,000 25% Bakken 600 1,100 83% Permian 1,200 1,800 50% Niobrara 80 300 275% Uinta 50 155 210% Mississippian 50 160 220% Total US. and Canada 9,700 13,600 40%
*Data from publicly available financial statements. **Source: Bloomberg 7 Historical Crude Differentials** Advantaged Crude Slate � Ref inery location and configuration enables a fleet-wide crude slate discounted to WTI � Discounted feeds drive higher gross margins / barrel and ultimately, EBITDA � Highly flexible refining system allows feedstock optionality Feedstock Advantaged Refining* $ /b b l d is co u n t to WT I Regional Crude Slate* Mid Con Southwest Rockies 0% 20% 40% 60% 80% 100% 11 12 13 11 12 13 11 12 13 Sweet Sour Heavy Black Wax Other Feedstocks + Blends -$20 -$15 -$10 -$5 $0 $5 4Q2013 3Q2013 2Q2013 1Q2013 Rockies MidCon Southwest Consolidated -$40 -$35 -$30 -$25 -$20 -$15 -$10 -$5 $0 $5 1/1 1 3/1 1 5/1 1 7/1 1 9/1 1 1 1 /1 1 1/1 2 3/1 2 5/1 2 7/1 2 9/1 2 1 1 /1 2 1/1 3 3/1 3 5/1 3 7/1 3 9/1 3 1 1 /1 3 1/1 4 WTI/Brent WCS/WTI WTS/WTI
Crude Price Sensitivity 8 All HFC purchased barrels are at or below WTI price � Run approximately 80,000 bpd of WCS � Run approximately 90,000 bpd of WTS Sensitivity determined from WTI, WTS, and WCS crude inputs multiplied by annualized crude capacity for HFC and adjusted for approximate tax expenses. The full year $/share impact is determined based on 12/31/13 shares outstanding. Based on assumption that Brent based crude sets product pr ices. $0.00 $0.10 $0.20 $0.30 $0.40 $0.50 $0.60 WCS/WTI WTS/WTI WTI/Brent $0.09 $0.12 $0.51 EPS Sensitivity to $1 Change in Differential* Fu ll ye ar $ /s h ar e Im p ac t
Focus on Safe and Reliable Operations 9 Personal Safety Ref inery Reliability Equivalent Distillation Capacity Process Availability *Data from 2H2011 following the Holly and Frontier merger Source: HFC Analysis Key Initiatives � Occupational and Process Safety Management Teams � Risk-based Inspection Program � Operational Integrity and Training � You See I t, You Own It Process Safety Tier 1 Process Safety Incident Rate OSHA 300 Recordable Incident Rate 0 0.1 0.2 0.3 0.4 2011* 2012 2013 0 0.2 0.4 0.6 0.8 1 1.2 1.4 1.6 2011* 2012 2013** Employees Contractors 92% 93% 94% 95% 96% 97% 2012 2013 HFC Consolidated 2012 Industry Average
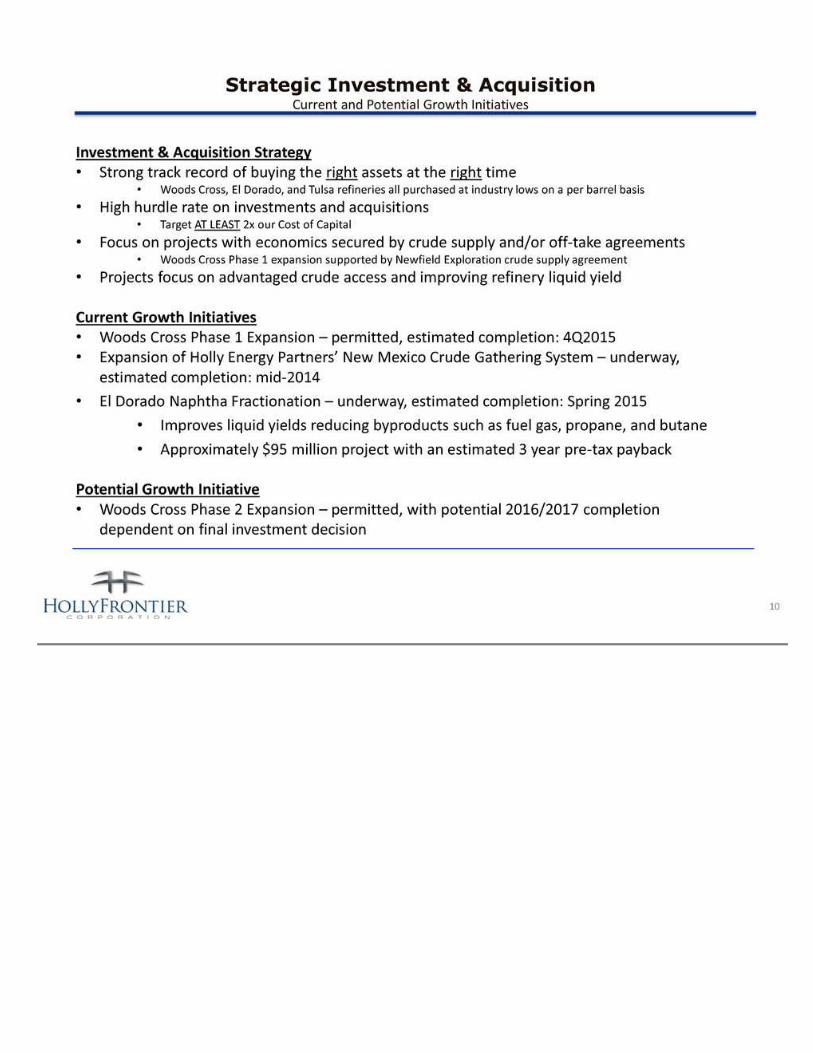
10 Investment & Acquisition Strategy • Strong track record of buying the right assets at the right time • Woods Cross, El Dorado, and Tulsa refineries all purchased at industry lows on a per barrel basis • High hurdle rate on investments and acquisitions • Target AT LEAST 2x our Cost of Capital • Focus on projects with economics secured by crude supply and/or of f-take agreements • Woods Cross Phase 1 expansion supported by Newfield Exploration crude supply agreement • Projects focus on advantaged crude access and improving refinery liquid yield Current Growth Initiatives • Woods Cross Phase 1 Expansion – permitted, estimated completion: 4Q2015 • Expansion of Holly Energy Partners’ New Mexico Crude Gathering System – underway, estimated completion: mid-2014 • El Dorado Naphtha Fractionation – underway, estimated completion: Spring 2015 • Improves liquid yields reducing byproducts such as fuel gas, propane, and butane • Approximately $95 million project with an estimated 3 year pre-tax payback Potential Growth Initiative • Woods Cross Phase 2 Expansion – permitted, with potential 2016/2017 completion dependent on final investment decision Strategic Investment & Acquisition Current and Potential Growth Initiatives
11 Strategic Investment & Acquisition Woods Cross Expansion Woods Cross Expansion: Phase 1 •Expansion of total capacity from 31,000 to 45,000 barrels per day •Includes relocation/revamp of FCC and polymerization units from Bloomfield, NM ref inery •Supported by a supply agreement with Newfield for advantaged local Uinta Basin Black Wax Crude •Anticipated yields of approximately 60% gasoline and 40% diesel •Incremental Production to ship down the UNEV Pipeline to Las Vegas •Expected completion: 4Q2015 •2.5 year payback Woods Cross Expansion: Potential Phase 2 •Expansion from 45,000 up to 60,000 barrels per day •Group 3 Lubricant Production •Pursuing crude supply agreements to support this expansion project •Potential completion: 2016/2017 •Approximate 2 year payback *Woods Cross Phase 1 expected EBITDA generation based on an assumed crack spread environment. Woods Cross Phase 2 expected EBITDA generation based on group 2 lubr icant cracks. PROJECT ESTIMATED CAPEX PROJECTED EBITDA GENERATION* Woods Cross Phase 1 $300 million $125 million Potential Woods Cross Phase 2 $500 million >$200 million Woods Cross Crude Runs 0 10,000 20,000 30,000 40,000 50,000 60,000 70,000 Current Phase 1 Phase 2 BlackWax Total
Capital Expenditure Overview *We expect 2014 capital expenditures to total approximately $400 million, and expect to spend approximately $111 on turnarounds and tank maintenance. Legacy HOC & FTO capital expenditures combined for per iods prior to the 2011 merger. 2011 capital expenditure calculated using 2011 HFC capital expenditure of $374m plus FTO CapEx of $42.4m for 2011 period prior to the merger. Does not include capital for HEP or turnarounds. **Approximate splits among capital expenditures. Please refer to publicly available f inancial statements for actuals. 12 m ill io n s Historical Capital Expenditure Expenditures by Classification** m ill io n s Histor ical Turnaround Costs Growth, 30% Maintenance + Environmental 40% Turnaround, 20-30% $- $100 $200 $300 $400 2010 2011 2012 2013 2014E* $272 $377 $290 $381 $400 $0 $50 $100 $150 $200 2010 2011 2012 2013 2014E* $86 $53 $160 $194 $111
Strong Balance Sheet & Cash Returns 13 � $1.7 billion cash on balance as of 12/31/13 � $190 million outstanding debt � excludes non-recourse HEP debt � $287 million 9.875% notes called in June 2013 � Total debt to capital ratio 3% as of 12/31/13* � As of 12/31/13, approximately $312 million remaining in share repurchase authorization � Continued commitment to returning excess cash to shareholders *Excluding HEP debt which is nonrecourse Since the July 2011 merger we have returned over $2 billion in cash to shareholders milli o n s $270 $864 $825 $0 $150 $300 $450 $600 $750 $900 2011 2012 2013 Buyback Dividend
Dividend Returns to Shareholders *Dividends are split adjusted reflecting HFC’s two-for-one stock split announced August 3, 2011. **Data from public filings and press releases. As of 3/19/2014 NYSE closing prices. See page 33 for calculations 14 � Increased regular dividend 5 times since the merger, a 300% increase � Declared 12 special dividends since the merger LTM Cash Yield to Shareholders** 2011 Regular Special Q1 $0.075 - Q2 $0.075 - Q3 $0.0875 $0.50 Q4 $0.10 $0.50 2012 Regular Special Q1 $0.10 $0.50 Q2 $0.15 $0.50 $0.50 $0.50 Q4 $0.20 $0.50 2013 Regular Special Q1 $0.30 $0.50 Q $0.30 $0.50 Q3 $0.30 $0.50 Q4 $0.30 $0.50 2014 Regular Special Q1 $0.30 $0.50 $0.15 Dividends Declared* Q3 0.0% 2.5% 5.0% 7.5% HFC PBF WNR DK ALJ TSO PSX MPC VLO 6.5% 4.4% 4.0% 3.4% 2.8% 1.8% 1.8% 1.8% 1.7%
Best In Class Returns on Capital Employed Pro Forma HollyFrontier Returns on Invested Capital (Average 2009-2013)* 5-year average ROIC calculated by taking the average of ROIC’s for the years 2009-2013. ROIC calculated as net income divided by the sum of total debt and total equity. For HFC, legacy HOC/FTO earnings, debt & equity were combined for 5-year calculations. See page 33 for calculations. 15 R O C E -2% 0% 2% 4% 6% 8% 10% 12% 14% HFC MPC PSX DK WNR TSO VLO ALJ PBF 13% 13% 11% 7% 6% 5% 4% -1% -1%
Strong Financial Metr ics vs Peers Net Income per Barrel of Crude Capacity HFC earnings per bbl strongest in peer sector (2009 – 2013) HFC earnings calculated by adding legacy HOC plus FTO earnings for periods prior to the merger. See page 33 for calculations. 16 D o lla rs p er b ar re l 4.76 3.66 2.92 2.00 1.42 1.18 1.11 0.15 -0.22 -6.00 -4.00 -2.00 0.00 2.00 4.00 6.00 8.00 10.00 12.00 HFC MPC PSX WNR DK TSO VLO PBF ALJ 2009 2010 2011 2012 2013
Business not Built on WTI/Brent Spread Between 2001-2010, WTI traded on average at a $1.00 PREMIUM to Brent Between 2001-2010: � Average ROIC 22% � Average NI/BBL $2.69 -10.0% 0.0% 10.0% 20.0% 30.0% 40.0% 50.0% 2001 2002 2003 2004 2005 2006 2007 2008 2009 2010 ROIC Source: Bloomberg HFC financials calculated by adding legacy HOC plus FTO for per iods prior to the merger. See page 33 for calculations. 17
Holly Energy Partners Investment Highlights 18 � Well positioned assets that serve high growth markets � Revenues are 100% fee based with no commodity ownership r isk. � Long-term contracts support cash flow stability � HEP benefits from strong sponsor relationship with HollyFrontier � Successful execution of growth plan has resulted in consistent distribution increases � Fee based revenues with no commodity risk; revenue sources include: � Tariffs from pipeline movements � Storage and transfer fees for terminalling � Fees from loading rack activity � Capacity lease commitments � Long Term Contracts Support Cashflow Stability � Major refiner customers have entered into 15-year contracts � Contracts require minimum payment obligations for volume and/or revenue commitments � Earliest contract matures in 2018 � Over 80% of revenues are tied to long term contracts with minimum commitments � Minimum annualized commitments produce over $259 million in revenue (85% of 2013 revenues)
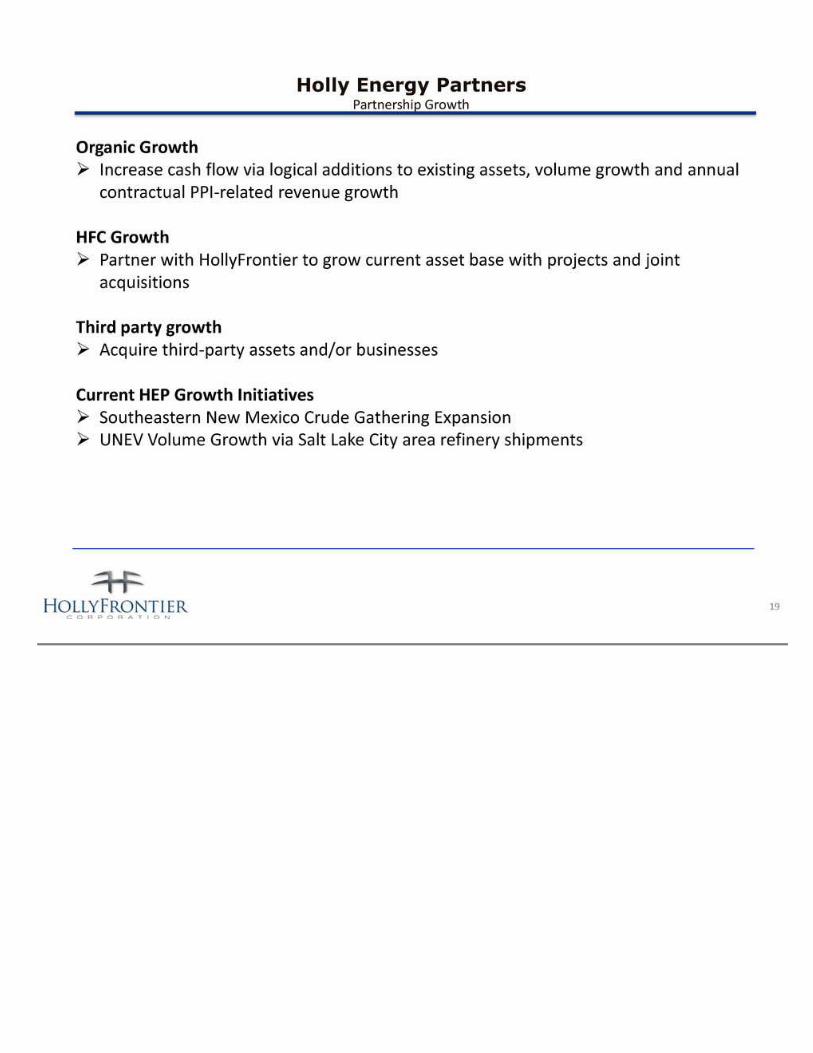
Holly Energy Partners Partnership Growth 19 Organic Growth � Increase cash flow via logical additions to existing assets, volume growth and annual contractual PPI-related revenue growth HFC Growth � Partner with HollyFrontier to grow current asset base with projects and joint acquisitions Third party growth � Acquire third-party assets and/or businesses Current HEP Growth Initiatives � Southeastern New Mexico Crude Gathering Expansion � UNEV Volume Growth via Salt Lake City area refinery shipments
20 Expansion Project Improves • 800 miles of pipeline in SE New Mexico • Increased delivery capacity of up to 100,000 bpd • Additional delivery capacity to Navajo Refinery • Connections to major clearing points • Centurion to Cushing • Provides new connection via Bisti to Midland/Crane • Expanded gathering footprint and additional lease connections Permian Production: 200 – 300m bpd growth per year thru 2015 Holly Energy Partners Southeastern New Mexico Crude Gathering Expansion
HEP Growth: Cash Distribution Since Inception 21 milli o n s $0 $20 $40 $60 $80 $100 $120 $140 $160 2005 2006 2007 2008 2009 2010 2011 2012 2013 $35 $44 $49 $54 $68 $86 $99 $126 $144 HFC received approximately $73mm in cash distributions for FY2013
Value of HFC’s LP & GP Interests in HEP 22 *Based on a range of recent HEP unit pr ices on the NYSE for valuation purposes. NYSE closing price on 3/19/14 was $32.74. Methodology: • GP values are equal to quarterly GP IDR cash f low (for 4Q 2013) on an annualized basis minus the $5m GP giveback for the a period of 3 years (as part of the HEP UNEV purchase transaction) times the above range of commonly used market multiples. GP IDR cash flow is approximately $7.5MM per quarter. These values do not reflect actual after tax value to HFC. • Approximate limited partner unit value estimated using a range based on recent market price & general partner value estimated using a commonly used range of Wall Street market multiples applied to incentive distributable cash flow. These values do not ref lect actual af ter tax value to HFC. LP INTEREST*: HEP Unit Pr ice 30.00$ 32.00$ 34.00$ HFC owns 22.4m common units ($mm): 672$ 717$ 762$ GP INTEREST: Quarter ly GP IDR cash flow: Annualized Q4 IDR cashflow ($mm): 29.9$ Multiple of GP cash flow: 15X 20X 25X Current GP Interest IDR Distributions ($mm): 449$ 598$ 748$ HEP VALUE TO HFC (millions): 1,121$ 1,509$
HollyFrontier Corporation (NYSE: HFC) 2828 N. Harwood, Suite 1300 Dallas, Texas 75201 (214) 954-6510 www.hollyfrontier.com Julia Heidenreich, VP, Investor Relations Blake Barfield, Investor Relations [email protected] 214-954-6510 23
Appendix 24
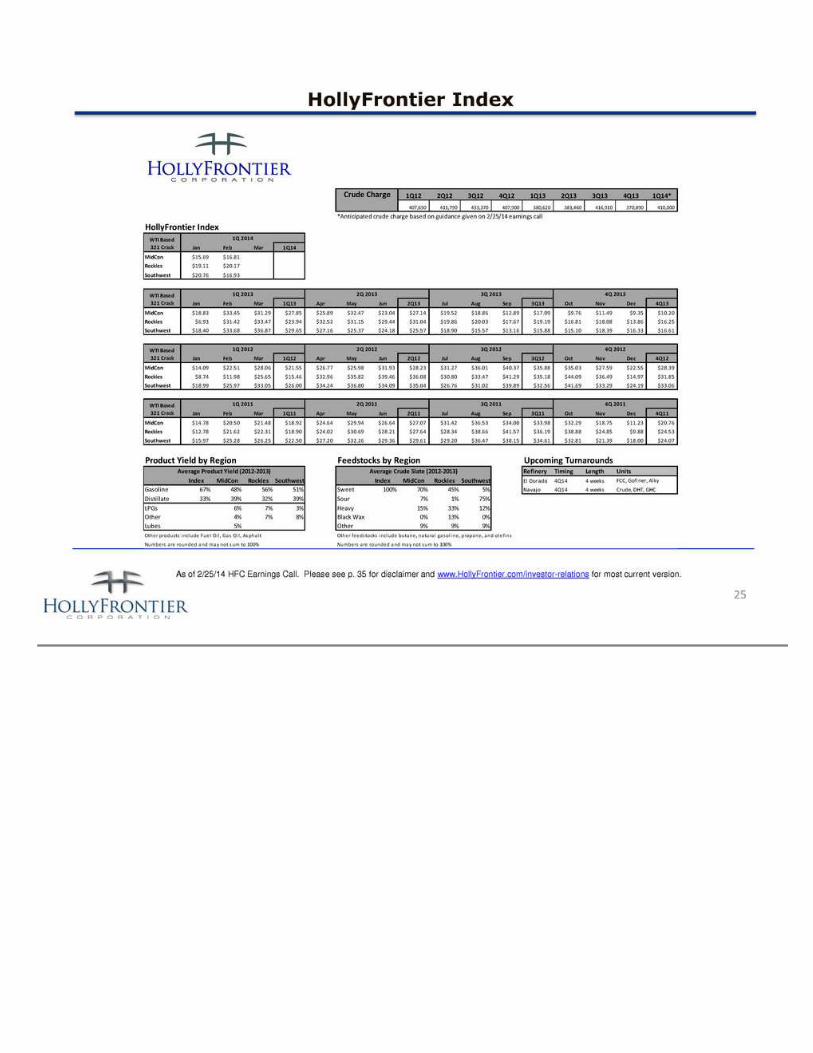
25 HollyFrontier Index As of 2/25/14 HFC Earnings Call. Please see p. 35 for disclaimer and www.HollyFrontier.com/investor-relations for most current version. 1Q12 2Q12 3Q12 4Q12 1Q13 2Q13 3Q13 4Q13 1Q14* 407,650 411,790 433,370 407,900 380,620 381,460 416,910 370,890 410,000 *Anticipated crude charge based on guidance given on 2/25/14 earnings call HollyFrontier Index Jan Feb Mar 1Q14 MidCon $15.69 $16.81 Rockies $19.11 $20.17 Southwest $20.76 $16.93 Jan Feb Mar 1Q13 Apr May Jun 2Q13 Jul Aug Sep 3Q13 Oct Nov Dec 4Q13 MidCon $18.83 $33.45 $31.29 $27.85 $25.89 $32.47 $23.04 $27.14 $19.52 $18.86 $12.89 $17.09 $9.76 $11.49 $9.35 $10.20 Rockies $6.93 $31.42 $33.47 $23.94 $32.52 $31.15 $29.44 $31.04 $19.86 $20.03 $17.67 $19.19 $16.81 $18.08 $13.86 $16.25 Southwest $18.40 $33.68 $36.87 $29.65 $27.16 $25.37 $24.18 $25.57 $18.90 $15.57 $13.16 $15.88 $15.10 $18.39 $16.33 $16.61 Jan Feb Mar 1Q12 Apr May Jun 2Q12 Jul Aug Sep 3Q12 Oct Nov Dec 4Q12 MidCon $14.09 $22.51 $28.06 $21.55 $26.77 $25.98 $31.93 $28.23 $31.27 $36.01 $40.37 $35.88 $35.03 $27.59 $22.55 $28.39 Rockies $8.74 $11.98 $25.65 $15.46 $32.96 $35.82 $39.46 $36.08 $30.80 $33.47 $41.29 $35.18 $44.09 $36.49 $14.97 $31.85 Southwest $18.99 $25.97 $33.05 $26.00 $34.24 $36.80 $34.09 $35.04 $26.76 $31.02 $39.89 $32.56 $41.69 $33.29 $24.19 $33.06 Jan Feb Mar 1Q11 Apr May Jun 2Q11 Jul Aug Sep 3Q11 Oct Nov Dec 4Q11 MidCon $14.78 $20.50 $21.48 $18.92 $24.64 $29.94 $26.64 $27.07 $31.42 $36.53 $34.00 $33.98 $32.29 $18.75 $11.23 $20.76 Rockies $12.78 $21.62 $22.31 $18.90 $24.02 $30.69 $28.21 $27.64 $28.34 $38.66 $41.57 $36.19 $38.88 $24.85 $9.88 $24.53 Southwest $15.97 $25.28 $26.25 $22.50 $27.20 $32.26 $29.36 $29.61 $29.20 $36.47 $38.15 $34.61 $32.81 $21.39 $18.00 $24.07 Product Yield by Region Feedstocks by Region Upcoming Turnarounds Refinery Timing Length Units Index MidCon Rockies Southwest Index MidCon Rockies Southwest El Dorado 4Q14 4 weeks Gasoline 67% 48% 56% 51% Sweet 100% 70% 45% 5% Navajo 4Q14 4 weeks Distillate 33% 39% 32% 39% Sour 7% 1% 75% LPGs 6% 7% 3% Heavy 15% 33% 12% Other 4% 7% 8% Black Wax 0% 13% 0% Lubes 5% Other 9% 9% 9% Other products include Fuel Oi l , Gas Oi l , Asphalt Other feedstocks include butane, natura l gasol ine, propane, and olefins Numbers are rounded and may not sum to 100% Numbers are rounded and may not sum to 100% WTI Based 321 Crack Average Product Yield (2012-2013) Average Crude Slate (2012-2013) Crude, DHT, GHC FCC, Gofiner, Alky 4Q 2013 3Q 2012 1Q 2013 2Q 2013 3Q 2013 1Q 2014 Crude Charge WTI Based 321 Crack 4Q 2011 4Q 2012 WTI Based 321 Crack 1Q 2011 2Q 2011 3Q 2011 WTI Based 321 Crack 1Q 2012 2Q 2012
HollyFrontier Enterprise Value 26 *As of 4Q13 publicly available f inancial statements. NYSE closing price on 3/19/14 was $48.90. **Holly Energy Partners Debt is non-recourse to HollyFrontier **See p. 22 for additional details on GP and LP valuation ranges and methodology All amounts in millions except per share data Source: Bloomberg 2015 EBITDA: Estimate Range $1.5B - $3.0B 2015 EBITDA: Consensus $2.0B Shares Outstanding* 199 Price per Share* $48.90 Market Cap 9,731 Less: Cash* (1,665) Total Debt* 998 Less: HEP Debt** (808) Enterprise Value $8,256 HEP GP Value*** (550) *** HEP LP Value*** (700) Implied Refining EV $7,006
Logistics Matter Proximity to Crude Oil Pricing Hubs and Takeaway Infrastructure 27 Prices reflect estimated transportation cost per barrel via pipeline, rail and marine Sources: Barclays, Credit Suisse, Deutsche Bank, Macquarie, and Tudor Pickering Holt
Feedstock Flexibility* • High WTI/WTS ($3 or higher) • Low WTI/WCS ($8 or less) • WTI/Brent Range ($10 to $20) • Low WTI/WTS ($2 or less) • High WTI/WCS ($20 or higher) • WTI/Brent Range ($10 to $20) • Low WTI/WTS ($2 or less) • Low WTI/WCS ($8 or less) • WTI/Brent Range ($20 or higher) *Please note these are current and estimated maximum crude rates and are subject to change based on a var iety of factors. Ability to maximize WCS constrained by pipeline space. WCS includes high TAN crudes. 28 WTI 52% WCS Black Wax 35% WTS 13%
Mid-Continent: El Dorado & Tulsa Refiner ies The Mid-Continent Region comprises our Tulsa and El Dorado Refineries and has a combined crude oil processing capacity of 260,000 BPSD. Mid-Continent Sales of Refinery Produced Products 247,030 BPD • Located in El Dorado, Kansas • 135,000 BPSD capacity and Nelson Complexity rating of 11.8 • Processes sour and heavy (Canadian) crude oils into high value light products • Distributes to high margin markets in Colorado and Mid-Continent/Plains states • Tulsa West and Tulsa East facilities are located less than two miles apart in Tulsa, Oklahoma and are operated as an integrated facility through interconnecting pipelines • 125,000 BPSD capacity and Nelson Complexity rating of 14.0 • Processes predominantly sweet crude oil with up to 10,000 BPD of heavy Canadian crudes • Distributes to the Mid-Continent states and also sells its specialty lubricants, which are high value products that provide a higher margin, throughout the United States and Central and South America TULSA REFINERIES EL DORADO REFINERY 29 Crude and Feedstocks Sour crude oil, 6% Sweet crude oil, 69% Heavy sour crude oil, 16% Other feedstocks and blends, 9% Product Mix Gasolines, 47% Diesel fuels, 31% Jet fuels, 8% Lubricants, 4% Asphalt, 3% Fuel Oil, 1% Other, 6%
Southwest: Navajo Refinery The Southwest Region consists of our Navajo Refinery and has a crude oil processing capacity of 100,000 BPSD. In addition, we manufacture and market commodity and modified asphalt products through the Southwest Region. Southwest Sales of Refinery Produced Products 94,830 BPD • Located in Artesia, New Mexico and operated in conjunction with a refining facility 65 miles east in Lovington, New Mexico • 100,000 BPSD capacity and Nelson Complexity rating of 11.8 • Processes sour and heavy crude oils into high value light products • Distr ibutes to high margin markets in Ar izona, New Mexico and West Texas NAVAJO REFINERY 30 Product Mix Gasolines, 51% Diesel fuels, 39% Asphalt 1% Fuel Oil, 6% Other, 3% Crude and Feedstocks Sour crude oil, 72% Sweet crude oil, 8% Heavy sour crude oil, 11% Other feedstocks and blends, 9%
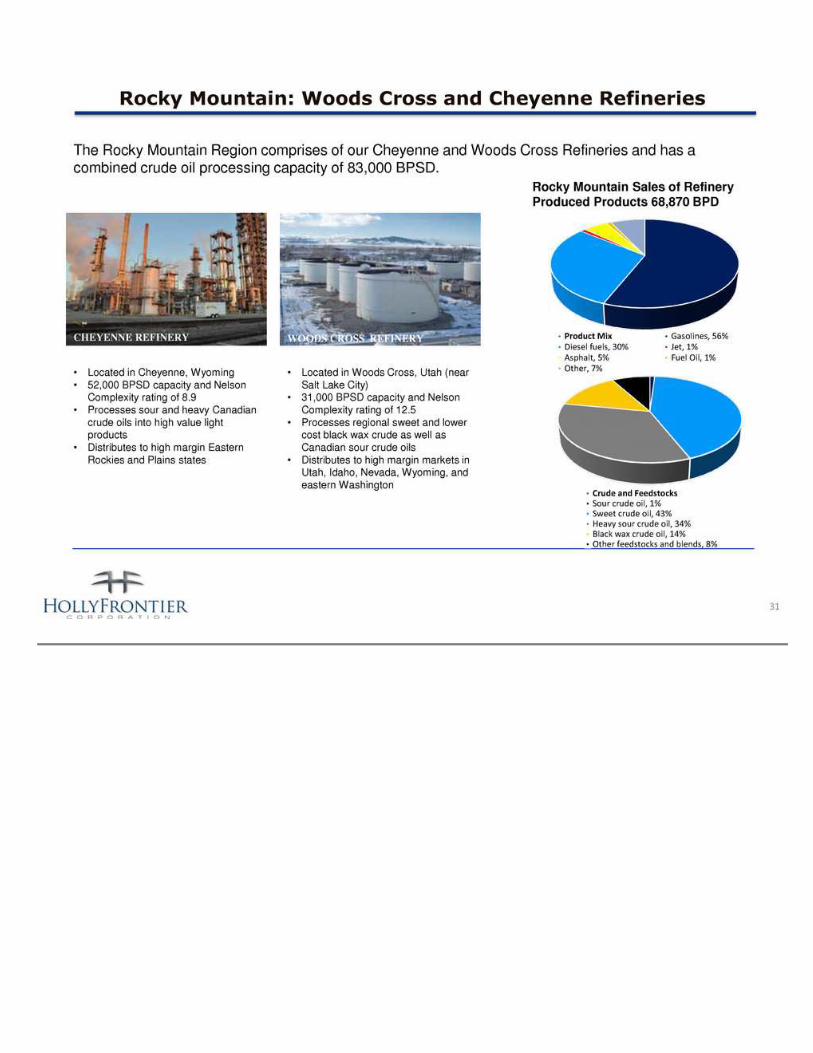
Rocky Mountain: Woods Cross and Cheyenne Refineries The Rocky Mountain Region comprises of our Cheyenne and Woods Cross Refineries and has a combined crude oil processing capacity of 83,000 BPSD. Rocky Mountain Sales of Refinery Produced Products 68,870 BPD • Located in Cheyenne, Wyoming • 52,000 BPSD capacity and Nelson Complexity rating of 8.9 • Processes sour and heavy Canadian crude oils into high value light products • Distributes to high margin Eastern Rockies and Plains states • Located in Woods Cross, Utah (near Salt Lake City) • 31,000 BPSD capacity and Nelson Complexity rating of 12.5 • Processes regional sweet and lower cost black wax crude as well as Canadian sour crude oils • Distributes to high margin markets in Utah, Idaho, Nevada, Wyoming, and eastern Washington CHEYENNE REFINERY WOODS CROSS REFINERY 31 Product Mix Gasolines, 56% Diesel fuels, 30% Jet, 1% Asphalt, 5% Fuel Oil, 1% Other, 7% Crude and Feedstocks Sour crude oil, 1% Sweet crude oil, 43% Heavy sour crude oil, 34% Black wax crude oil, 14% Other feedstocks and blends, 8%
Holly Energy Partners Holly Energy Partners owns and operates substantially all of the ref ined product pipeline and terminalling assets that support our refining and marketing operations in the Mid- Continent, Southwest and Rocky Mountain regions of the United States. • 2,900 miles of crude oil and petroleum product pipelines including joint venture interests in UNEV Pipeline, LLC and SLC Pipeline LLC • 12 million barrels of refined product and crude oil storage • 26 terminals and loading rack facilities in 9 Western and Mid-Continent states • 25% joint venture interest in SLC Pipeline LLC — a 95-mile crude oil pipeline system that serves refineries in the Salt Lake City area • 75% joint venture interest in UNEV Pipeline, LLC – a 400-mile refined products pipeline system connecting Salt Lake area refiners to the Las Vegas product markets. HEP PRODUCTS 32
Definitions Non GAPP measurements: We report certain f inancial measures that are not prescr ibed or authorized by U. S. generally accepted accounting principles ("GAAP"). We discuss management's reasons for reporting these non-GAAP measures below. Although management evaluates and presents these non-GAAP measures for the reasons described below, please be aware that these non-GAAP measures are not alternatives to revenue, operating income, income from continuing operations, net income, or any other comparable operating measure prescribed by GAAP. In addition, these non-GAAP financial measures may be calculated and/or presented differently than measures with the same or similar names that are reported by other companies, and as a result, the non-GAAP measures we report may not be comparable to those reported by others. Refining gross margin or refinery gross margin: the dif ference between average net sales price and average product costs per produced barrel of refined products sold. Refining gross margin or ref inery gross margin is a non-GAAP performance measure that is used by our management and others to compare our refining performance to that of other companies in our industry. This margin does not include the effect of depreciation, depletion and amortization. Other companies in our industry may not calculate this performance measure in the same manner. Our histor ical refining gross margin or refinery gross margin is reconciled to net income under the section entitled “Reconciliation to Amounts Reported Under Generally Accepted Accounting Principles” in HollyFrontier Corporation’s 2013 10-K filed February 25, 2014. Net Operating Margin: the difference between refinery gross margin and refinery operating expense per barrel of produced refined products. Net operating margin is a non-GAAP performance measure that is used by our management and others to compare our refining performance to that of other companies in our industry. This margin does not include the effect of depreciation, depletion and amortization. Other companies in our industry may not calculate this performance measure in the same manner. Our historical net operating margin is reconciled to net income under the section entitled “Reconciliation to Amounts Reported Under Generally Accepted Accounting Principles” in HollyFrontier Corporation’s 2013 10-K filed February 25, 2014. EBITDA: Earnings before interest, taxes, depreciation and amortization, which we refer to as EBITDA, is calculated as net income plus (i) interest expense net of interest income, (ii) income tax provision, and ( iii) depreciation, depletion and amortization. EBITDA is not a calculation provided for under GAAP; however, the amounts included in the EBITDA calculation are derived from amounts included in our consolidated f inancial statements. EBITDA should not be considered as an alternative to net income or operating income as an indication of our operating performance or as an alternative to operating cash flow as a measure of liquidity. EBITDA is not necessarily comparable to similarly titled measures of other companies. EBITDA is presented here because it is a widely used financial indicator used by investors and analysts to measure performance. EBITDA is also used by our management for internal analysis and as a basis for financial covenants. Our historical EBITDA is reconciled to net income under the section entitled “Reconciliation to Amounts
Reported Under Generally Accepted Accounting Principles” in HollyFrontier Corporation’s 2013 10-K filed February 25, 2014. Debt-To-Capital: A measurement of a company's financial leverage, calculated as the company's long term debt divided by its total capital. Debt includes all long-term obligations. Total capital includes the company's debt and shareholders' equity. Return on Invested Capital: A measurement which for our purposes is calculated using Net Income divided by the sum of Total Equity and Long Term Debt. We consider ROIC to be a meaningful indicator of our financial performance, and we evaluate this metric because it measures how effectively we use the money invested in our operations. IDR: Incentive Distribution Rights BPD: the number of barrels per calendar day of crude oil or petroleum products. BPSD: the number of barrels per stream day (barrels of capacity in a 24 hour period) of crude oil or petroleum products. MMSCFD: million standard cubic feet per day. Solvent deasphalter / residuum oil supercritical extraction (“ROSE”): a refinery unit that uses a light hydrocarbon like propane or butane to extract non-asphaltene heavy oils from asphalt or atmospheric reduced crude. These deasphalted oils are then further converted to gasoline and diesel. The remaining asphaltenes are either sold, blended to fuel oil or blended with other asphalt as a hardener. Distributable Cash Flow: Distributable cash flow (DCF) is not a calculation based upon GAAP. However, the amounts included in the calculation are derived from amounts separately presented in HEP’s consolidated financial statements, with the exception of excess cash flows over earnings of SLC Pipeline, maintenance capital expenditures and distr ibutable cash f low from discontinued operations. Distributable cash flow should not be considered in isolation or as an alternative to net income or operating income as an indication of HEP’s operating performance or as an alternative to operating cash flow as a measure of liquidity. Distributable cash flow is not necessarily comparable to similarly titled measures of other companies. Distr ibutable cash flow is presented here because it is a widely accepted financial indicator used by investors to compare partnership performance. We believe that this measure provides investors an enhanced perspective of the operating performance of HEP’s assets and the cash HEP is generating. HEP’s historical net income is reconciled to distributable cash flow in "Item 6. Selected Financial Data" of HEP's 2013 10-K. 34
HFC Index Disclosure 35 The data on p. 25 is for informational purposes only and is not reflective or intended to be an indicator of HollyFrontier's past or future financial results. This data is general industry information and does not reflect prices paid or received by HFC. The data was compiled from publicly available information, var ious industry publications, other published industry sources, including OPIS, and our own internal data and estimates. Although this data is believed to be reliable, HFC has not had this information verified by independent sources. HFC does not make any representation as to the accuracy of the data and does not undertake any obligation to update, revise or continue to provide the data. HFC's actual pricing and margins may differ from benchmark indicators due to many factors. For example: - Crude Slate differences – HFC runs a wide variety of crude oils across its refining system and crude slate may vary quarter to quarter. - Product Yield differences – HFC’s product yield differs from indicator and can vary quarter to quarter as a result of changes in economics, crude slate, and operational downtime. - Other differences including but not limited to secondary costs such as product and feedstock transportation costs, purchases of environmental credits, quality differences, location of purchase or sale, and hedging gains/losses. Moreover, the presented indicators are generally based on spot sales, which may differ from realized contract prices. Market prices are available from a variety of sources, each of which may vary slightly. Please note that this data may differ f rom other sources due to adjustments made by data providers and due to differ ing data definitions. Below are indicator definitions used for purposes of this data. MidCon Indicator: (100% Group 3: Sub octane and ULSD) – WTI Rockies Indicator: 63% Cheyenne: ((100% Denver Regular Gasoline; 100% Denver ULSD) – WTI) 37% Woods Cross: ((60% Salt Lake City Regular Gasoline, 40% Las Vegas Regular Gasoline; 80% Salt Lake City ULSD, 20% Las Vegas ULSD) – WTI) 2013 Southwest Indicator: (50% El Paso Subgrade Gasoline, 50% Phoenix CBG; 50% El Paso ULSD, 50% Phoenix ULSD) – WTI 2011 - 2012 Southwest Indicator: (50% El Paso Regular Gasoline, 50% Phoenix CBG; 50% El Paso ULSD, 50% Phoenix ULSD) – WTI