44
Home Care Quality and Safety: A Profile of Home Care Providers in California August, 2013
| Date post: | 19-Jan-2019 |
| Category: |
Documents |
| Upload: | nguyendieu |
| View: | 215 times |
| Download: | 0 times |

Home Care Quality and Safety: A Profile of Home Care Providers in California
August, 2013

Home Care Quality and Safety: A Profile of Home Care Providers in California
Nadereh Pourat, PhD
UCLA Center for Health Policy Research
Health Economics and Evaluation Research Program
August, 2013
This report was funded by the Service Employee International Union,
Union of Long Term Care Workers. The analysis, interpretation and conclusions contained
within this report are the sole responsibility of the authors.
Suggested Citation:
Pourat N. Home Care Quality and Safety: A Profile of Home Care Providers in California. Los Angeles, CA: UCLA
Center for Health Policy Research, 2013.

Table of Contents
Summary ......................................................................................................................................... 6
Introduction .................................................................................................................................... 6
Types of Home Care Providers ........................................................................................................ 7
Demand for Home Care .................................................................................................................. 9
California Home Care Industry Size and Growth .......................................................................... 12
Home Health Agencies .............................................................................................................. 12
Home Care Agencies ................................................................................................................. 15
Non‐Agency Providers .............................................................................................................. 17
Regulation, Characteristics, and Care Delivery Assessment ......................................................... 20
California Home Health Care Licensure and Certification ........................................................ 20
Characteristics of Home Health Agencies in California and Care Delivery Assessment ........... 21
Structural Assessment of Quality of Care ......................................................................... 23
Process and Outcome Assessment of Quality of Care ...................................................... 29
California Home Care Agency Regulation ................................................................................. 32
Characteristics of Home Care Agencies in California and Care Delivery Assessment .............. 33
California Non‐Agency Provider Regulation ............................................................................. 33
Characteristics of Non‐Agency Providers in California and Care Delivery Assessment ........... 34
Summary of Findings..................................................................................................................... 36
Demand for home care ............................................................................................................. 36
California Home Care Industry Size and Growth ...................................................................... 36
Regulation, Characteristics, and Care Delivery Assessment ..................................................... 37
Policy Implications ........................................................................................................................ 39
References .................................................................................................................................... 41

Table of Exhibits
Exhibit 1. Projected Population Growth in California and Percent Disabled, by Age, 2010‐2050 . 9
Exhibit 2. Level of Disability by Age, U.S., 2010 ............................................................................ 10
Exhibit 3. Estimates of the Size of the Disabled Population by Type of Disability in California ... 10
Exhibit 4. California Disabled Population1 by Age, Federal Poverty Level (FPL), and Insurance
Coverage, 2 2009 ........................................................................................................................... 11
Exhibit 5. Percent Change in Number of Home Health Care Establishments in United States from
1998‐2011, by State ...................................................................................................................... 13
Exhibit 6. Number of Home Health Care Establishments and Paid Employees in California, 1998‐
2011 .............................................................................................................................................. 14
Exhibit 7. Growth in Providers of Services for Elderly and Persons with Disabilities, California,
1998‐2011 ..................................................................................................................................... 16
Exhibit 8. Estimated Number of Home Health and Personal Care Aide Employees in United
States and California, May 2012 ................................................................................................... 17
Exhibit 9. Number of Individual Providers with Tax Identification Numbers in California, 1998‐
2011 .............................................................................................................................................. 18
Exhibit 10. Licensed Home Health and Hospice Agencies in California, 2011 .............................. 21
Exhibit 11. HHA Characteristics, 2011 .......................................................................................... 22
Exhibit 12. HHA Patient Characteristics, 2011 .............................................................................. 23
Exhibit 13. HHA Certification Status, 2011 ................................................................................... 24
Exhibit 14. HHA Staffing by Certification Status, 2011 ................................................................. 24
Exhibit 15. HHA Type of Skilled Services Provided, by Certification Status, 2011 ........................ 25
Exhibit 16. HHA Number of Skilled Services Provided, by Certification Status, 2011 .................. 26
Exhibit 17. HHA Average Annual Number of Unique Patients and Number of Visits, by
Certification Status, 2011 .............................................................................................................. 27

Exhibit 18. HHA Average Annual Number of Visits by Patient Age, by Certification Status, 2011
....................................................................................................................................................... 28
Exhibit 19. HHA Average Annual Number of Visits, by Type of Staff and Certification Status, 2011
....................................................................................................................................................... 29
Exhibit 20. Quality of Care by Home Health Agencies in California, 2012 ................................... 30

August, 2013 UCLA Center for Health Policy Research Health Disparities
6 Home Care Quality and Safety: A Profile of Home Care Providers in California
Summary
The rapid growth of the home care industry coincides with increases in the proportion of the
population over 65 years of age and more likely to need assistance with basic daily activities
due to illness or disability. This report provides a profile of the home care industry and the
patients/consumers of such services in California, assessing available data on licensure and
certification as mechanisms for promoting safety and quality of care. The results indicate that
little information is available on the characteristics and care delivery of home care agencies and
individual providers of nonmedical home care. The results also illustrate that licensure and
certification of home health agencies are associated with higher structural quality‐of‐care
measures. Establishing licensure and basic safety standards for home care agencies is a
reasonable public health policy to reduce the potential for adverse consequences for the
growing aging and disabled populations.
Introduction
The home care industry is growing rapidly, a phenomenon that parallels the aging of the
population and the higher levels of disability among those 65 years of age and older. The
industry’s growth may be partially due to its potential to reduce the rates of institutionalization,
hospitalization, and emergency room use. Home health and personal care service providers,
who work in the patient/consumer’s residence, have varying degrees of training and
certification. Services include treatments such as wound care and pain management, help with
fall prevention, assistance with basic needs such as bathing and dressing, and help with
household activities such as shopping and transportation.
Delivery of care at home raises concerns for quality and patient safety, particularly because
services are provided in the home rather than in an institution and frequently on a one‐to‐one
basis. Scrutiny and oversight of quality and patient safety in home health care are prioritized by
the Centers for Medicare and Medicaid Services. Licensure and certification, along with
multidimensional quality measures and regular assessment of home health agencies, may
address many of the concerns about the quality and safety of home health care. The availability
of provider background checks in referral registries for Medicaid home care recipients can allay
some of the concerns for those receiving personal home care services. However, standards for
quality of care and consumer safety have not been established for health care assistants (HCAs)
or any individual providers who are privately employed by home care recipients.
The growth of home care is particularly notable among providers of personal home care
services who are not licensed or certified and who lack other regulation and oversight. Personal
and home health aide occupations are projected to grow 46 percent by 2018, compared to 10

UCLA Center for Health Policy Research Health Disparities Program
August, 2013
Home Care Quality and Safety: A Profile of Home Care Providers in California 7
percent for all occupations.1 Studies of consumer and patient safety and quality for home care
services are sparse, but some evidence of fraud and abuse has raised questions about safety
and quality for the recipients of personal care services. California does not regulate HCAs,
employment agencies, or individuals who provide home care privately. Fraud and abuse by
HCAs were recently documented in a publication from the United States Office of the Inspector
General and in another from California’s Senate Office of Oversight and Outcomes. The
evidence in these reports indicated billing for services when consumers were in the hospital or
a nursing home, billing for more hours than actually provided, delivery of services by
unqualified providers, delivery of services that were not medically necessary, physical abuse,
threats, property theft, and patient abandonment.1,2 A 2003 study of the In‐Home Supportive
Services (IHSS) program in California indicated that beneficiaries more often reported abuse
and neglect by nonfamily providers than by family providers.3
Combined with further expected growth in the home care industry, such evidence has led to
calls for licensure and certification of HCAs and individual home care providers. A number of
pieces of legislation have been introduced in California to implement standards and regulations
for HCAs and individuals providing personal care services. AB 1217 (B. Lowenthal), the most
comprehensive, would require the California Department of Social Services (CDSS) to license
HCAs and certify individuals who provide home care services. The bill would also require every
service provider to complete a background check and provide this information on the CDSS
website.4 Other related proposed legislation includes AB 322 (Yamada), which would license
and regulate “home care organizations,” and AB 987 (Maienschein), which would require
California to apply for federal grants to develop home health aide training programs.
This policy brief provides data on the home care industry in California, including the potential
level of demand for home care, a profile of home care providers, and quality and safety
indicators when available. The information contained in this publication illustrates the context
in which home care services are delivered and depicts the gaps in information on quality of care
and patient safety.
Types of Home Care Providers
Home care providers in California can be classified into four broad categories: (1) home health
agencies that provide home health care, (2) home care or referral agencies that provide
nonmedical personal home care, (3) IHSS providers of personal care services to Medicaid
(Medi‐Cal in California) beneficiaries, and (4) individuals who provide home health and personal
care in private arrangements.
Home health agencies (HHAs) are licensed and regulated under California Health and Safety
Code Section 1725‐1742. Certification by Medicare, Medicaid, the Joint Commission, the

August, 2013 UCLA Center for Health Policy Research Health Disparities
8 Home Care Quality and Safety: A Profile of Home Care Providers in California
Community Health Accreditation Program (CHAP), and the Accreditation Commission for Health
Care (ACHC) can be used instead of a state survey to grant licensure. Certification means
compliance with specific federal guidelines regarding patient care and allowing billing to
Medicare and Medicaid. HHAs include skilled nursing care and health care provided by other
licensed and/or trained health professionals, such as physical and occupational therapists,
social workers, and home health aides. A patient’s plan of care must be determined by a
physician, meet medically necessary criteria, and be updated regularly. HHA licensure
requirements vary by state.
Home care agencies (HCAs) have a business license granted by the California State Board of
Equalization and the individual cities in which they operate, but they do not have specific home
care licensure or certification requirements. HCAs provide nonmedical personal care services,
such as domestic services, and help with basic needs, including bathing, dressing, and eating.
These services are provided by home health aides, certified nurse assistants (CNAs),
noncertified nurse assistants, personal care attendants (PCAs), and companions. Some home
care agencies are businesses without employees (nonemployer firms) or staffing agencies that
do not employ or manage home health aides or other direct care providers but instead refer or
match independent providers to clients for a fee.
Non‐agency providers are independent providers who are not employed by an HHA or HCA.
These providers may find employment through registries operated by government agencies,
through private referral agencies, or privately. Non‐agency providers include independent IHSS
providers who provide care to Medi‐Cal beneficiaries of the IHSS program. These providers
range from trained, licensed, and certified providers to untrained individuals. Most California
counties have a Public Authority agency that operates a voluntary referral registry for Medi‐Cal
beneficiaries and acts as the employer of record. However, the providers are directly selected,
employed, and managed by the program beneficiaries. Non‐agency providers also include
privately employed individuals who are independent providers directly employed by the
consumer, without any public or private agency as intermediary. These providers, who also
range from trained, licensed, and certified providers to untrained individuals, may find
employment through privately operated referral agencies or registries.

UCLA Center for Health Policy Research Health Disparities Program
August, 2013
Home Care Quality and Safety: A Profile of Home Care Providers in California 9
Demand for Home Care
The demand for home care is greatest among the aged and disabled populations. California has
the largest share of the population age 65 and older in the U.S. This population is expected to
grow 161 percent by 2050, increasing to 11.1 million from nearly 4.3 million in 2010 (data not
shown).5 The population age 85 and older is expected to grow by 310 percent during that time
period, with the number rising from about 0.6 million to nearly 2.5 million (Exhibit 1). In
contrast, the population under 65 years of age is expected to increase by 19 percent in the
same time frame. 6
Exhibit 1. Projected Population Growth in California and Percent Disabled, by Age, 2010‐2050
Source: California Department of Finance, January 2013, and The American Communities Survey, 2005‐2007 6,7
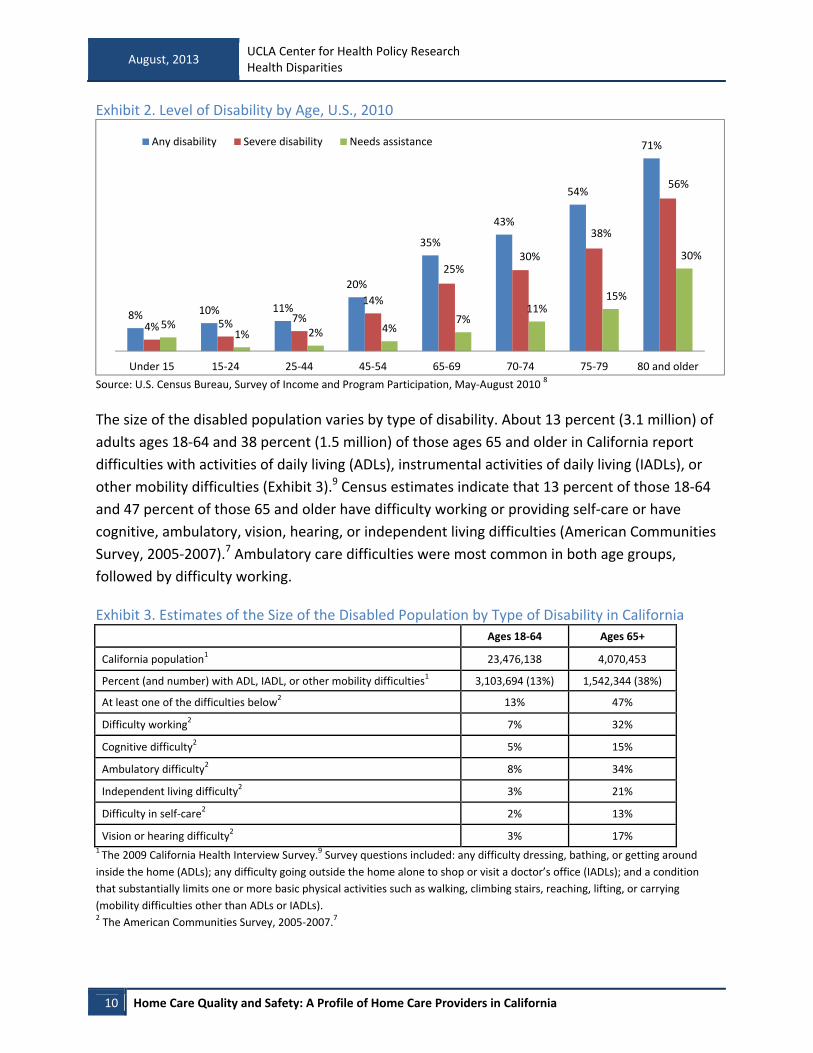
Level of disability grows with age (Exhibit 2). The prevalence of any disability is 71 percent
among those ages 80 and older. More than half (56 percent) of individuals 80 and older report
severe disabilities, and 30 percent report needing assistance for their disability.8
33,037,840
39,230,883
3,665,209
8,649,570
606,333
2,484,62085+
65‐84
0‐64
13% Disabled
82% Disabled
42% Disabled
August, 2013 UCLA Center for Health Policy Research Health Disparities
10 Home Care Quality and Safety: A Profile of Home Care Providers in California
Exhibit 2. Level of Disability by Age, U.S., 2010
Source: U.S. Census Bureau, Survey of Income and Program Participation, May‐August 2010 8
The size of the disabled population varies by type of disability. About 13 percent (3.1 million) of
adults ages 18‐64 and 38 percent (1.5 million) of those ages 65 and older in California report
difficulties with activities of daily living (ADLs), instrumental activities of daily living (IADLs), or
other mobility difficulties (Exhibit 3).9 Census estimates indicate that 13 percent of those 18‐64
and 47 percent of those 65 and older have difficulty working or providing self‐care or have
cognitive, ambulatory, vision, hearing, or independent living difficulties (American Communities
Survey, 2005‐2007).7 Ambulatory care difficulties were most common in both age groups,
followed by difficulty working.
Exhibit 3. Estimates of the Size of the Disabled Population by Type of Disability in California
Ages 18‐64 Ages 65+
California population1 23,476,138 4,070,453
Percent (and number) with ADL, IADL, or other mobility difficulties1 3,103,694 (13%) 1,542,344 (38%)
At least one of the difficulties below2 13% 47%
Difficulty working2 7% 32%
Cognitive difficulty2 5% 15%
Ambulatory difficulty2 8% 34%
Independent living difficulty2 3% 21%
Difficulty in self‐care2 2% 13%
Vision or hearing difficulty2 3% 17% 1 The 2009 California Health Interview Survey.9 Survey questions included: any difficulty dressing, bathing, or getting around
inside the home (ADLs); any difficulty going outside the home alone to shop or visit a doctor’s office (IADLs); and a condition
that substantially limits one or more basic physical activities such as walking, climbing stairs, reaching, lifting, or carrying
(mobility difficulties other than ADLs or IADLs). 2 The American Communities Survey, 2005‐2007.7
8% 10% 11%
20%
35%
43%
54%
71%
4% 5% 7%
14%
25%30%
38%
56%
5%1% 2% 4%
7%11%
15%
30%
Under 15 15‐24 25‐44 45‐54 65‐69 70‐74 75‐79 80 and older
Any disability Severe disability Needs assistance

UCLA Center for Health Policy Research Health Disparities Program
August, 2013
Home Care Quality and Safety: A Profile of Home Care Providers in California 11
The California population with ADL, IADL, and mobility difficulties is likely to require home care
services. Examining the federal poverty level (FPL) and insurance coverage of this population
illustrates the likelihood that many disabled individuals will seek home care in the private,
unregulated market. For example, 49 percent of those 65 years of age and older were below
200 percent FPL and had Medi‐Cal; these individuals were therefore likely to qualify for In‐
Home Supportive Services benefits (2009 California Health Interview Survey; Exhibit 4). Another
50 percent had other insurance coverage, most frequently Medicare; 92 percent of those 65
years of age and older but at 200 percent FPL and above also had other insurance coverage,
again most often Medicare. Medicare covers home health under specific conditions, but not
personal care services, and most private insurance does not cover substantial levels of home
care.
Exhibit 4. California Disabled Population1 by Age, Federal Poverty Level (FPL), and Insurance Coverage, 2 2009
Source: The 2009 California Health Interview Survey 1 Disability is defined as any difficulty dressing, bathing, or getting around inside the home (ADLs); any difficulty going outside
the home alone to shop or visit a doctor’s office (IADLs); and a condition that substantially limits one or more basic physical
activities such as walking, climbing stairs, reaching, lifting, or carrying (mobility difficulties other than ADLs or IADLs). 2 Other insurance includes Medicare, employment‐based, or privately purchased insurance.
32%
14%
1%
26%
81%
50%
92%
42%
5%
49%
8%
0‐199% FPL 200% FPL and above 0‐199% FPL 200% FPL and above
18‐64 65+
Medi‐Cal Other Insurance Uninsured

August, 2013 UCLA Center for Health Policy Research Health Disparities
12 Home Care Quality and Safety: A Profile of Home Care Providers in California
California Home Care Industry Size and Growth
Home Health Agencies
The national home health care industry has experienced significant growth in recent years. The
number of home health care establishments (home health care agencies with employees or
other providers of home health care) grew by 50 percent nationally from 1998 to 2011,
increasing from 19,420 to 29,161 (Exhibit 5). 10

UCLA Center for Health Policy Research Health Disparities Program
August, 2013
Home Care Quality and Safety: A Profile of Home Care Providers in California 13
Exhibit 5. Percent Change in Number of Home Health Care Establishments in United States from 1998‐2011, by State
Source: U.S. Census Bureau County Business Patterns. Includes establishments with NAICS (North American Industry
Classification System) code 621610 (Home Health Care Services) engaged primarily in providing skilled nursing services in the
home, along with a range of the following: personal care services, homemaker and companion services, physical therapy,
medical social services, medications, medical equipment and supplies, counseling, 24‐hour home care, occupation and
vocational therapy, dietary and nutritional services, speech therapy, audiology, and high‐tech care, such as intravenous
48%
‐31%
53%
54%
89%
31%
‐8%
9%
36%
88%
20%
31%
37%
75%
10%
10%
10%
45%
6%
‐6%
52%
13%
100%
71%
58%
188%
32%
28%
69%
10%
61%
20%
‐5%
135%
‐44%
51%
22%
30%
16%
23%
79%
40%
19%
50%
102%
‐18%
58%
15%
‐21%
18%
5%
50%
Alabama
Alaska
Arizona
Arkansas
California
Colorado
Connecticut
Delaware
District of Columbia
Florida
Georgia
Hawaii
Idaho
Illinois
Indiana
Iowa
Kansas
Kentucky
Louisiana
Maine
Maryland
Massachusetts
Michigan
Minnesota
Mississippi
Missouri
Montana
Nebraska
Nevada
New Hampshire
New Jersey
New Mexico
New York
North Carolina
North Dakota
Ohio
Oklahoma
Oregon
Pennsylvania
Rhode Island
South Carolina
South Dakota
Tennessee
Texas
Utah
Vermont
Virginia
Washington
West Virginia
Wisconsin
Wyoming
United States

August, 2013 UCLA Center for Health Policy Research Health Disparities
14 Home Care Quality and Safety: A Profile of Home Care Providers in California
therapy.11 These data exclude government employees, businesses without an Employer Identification Number issued by the
Internal Revenue Service, and businesses without employees. Establishments with small multi‐unit companies may be under‐
represented.10
The rate of growth of home health agencies in California has been more rapid than the national
rate. From 1998 to 2011, the number of such establishments grew by 89 percent in California
(Exhibit 6). The average size of establishments, as indicated by the number of employees, grew
by 35 percent, a slower pace than the growth in the number of establishments. Among the
states, California has the second‐highest number of home health agencies (after Texas) and the
third‐highest number of employees (after Texas and New York).
Exhibit 6. Number of Home Health Care Establishments and Paid Employees in California, 1998‐2011
Source: U.S. Census Bureau County Business Patterns.11 Includes establishments with NAICS 621610.11 These data exclude
government employees and businesses without an Employer Identification Number issued by the Internal Revenue Service or
businesses without employees. Establishments with small, multi‐unit companies may be underrepresented.10
The 2,984 home health care establishments in California in 2011 employed 75,480 employees,
with the annual payroll reported at over $2.14 billion in 2011. The number of these
establishments varied across California counties, with the largest numbers reported in Los
Angeles County (1,044) and Orange County (228). A comparison of the total number of home
health service establishments in 2011 County Business Pattern data with the number of
licensed HHA and hospices in the 2011 Office of Statewide Health Planning and Development
(OSHPD) indicated that 65 percent of all establishments were licensed by the California
75,480
47,519
56,038
2,9841,582
20112010200920082007200620052004200320022001200019991998
Paid Employees in Establishments
Establishments
35% Increase
89% Increase

UCLA Center for Health Policy Research Health Disparities Program
August, 2013
Home Care Quality and Safety: A Profile of Home Care Providers in California 15
Department of Public Health as HHAs or hospices. California law requires all organizations
providing home health services to obtain licensure. The reason for the large discrepancy (35
percent) between these two data sources is not clear, but the discrepancy could be due to a
number of factors. The U.S. Census Bureau County Business Pattern data are obtained from the
Business Register, which includes information on all single and multi‐establishments in the
United States. Some error in the County Business Pattern data sources may be due to error in
self‐classification by organizations in their administrative data. A likely reason for the
discrepancy is that some establishments identified in the County Business Patterns as part of
the home health services industry, such as visiting nurse associations, do not obtain licensure as
HHAs in California.
Home Care Agencies
Little official data is available on how many HCA establishments operate in California. These
establishments are classified under industry code 624120, “services for the elderly and persons
with disabilities.” This classification is broad and captures nonmedical services that include
adult day health care for seniors and disabled persons, senior centers, community centers,
disability support groups, and self‐help organizations. Various business listings of these
establishments can be found by searching for “home care aide organizations,” “nonmedical
home care,” or similar titles.
In 2011, there were 23,037 establishments under industry code 624120 in the United States, a
growth of 73 percent since 1998. These establishments had an annual payroll of over $1.7
billion. The proportion of the establishments in this industry that are home care agencies is not
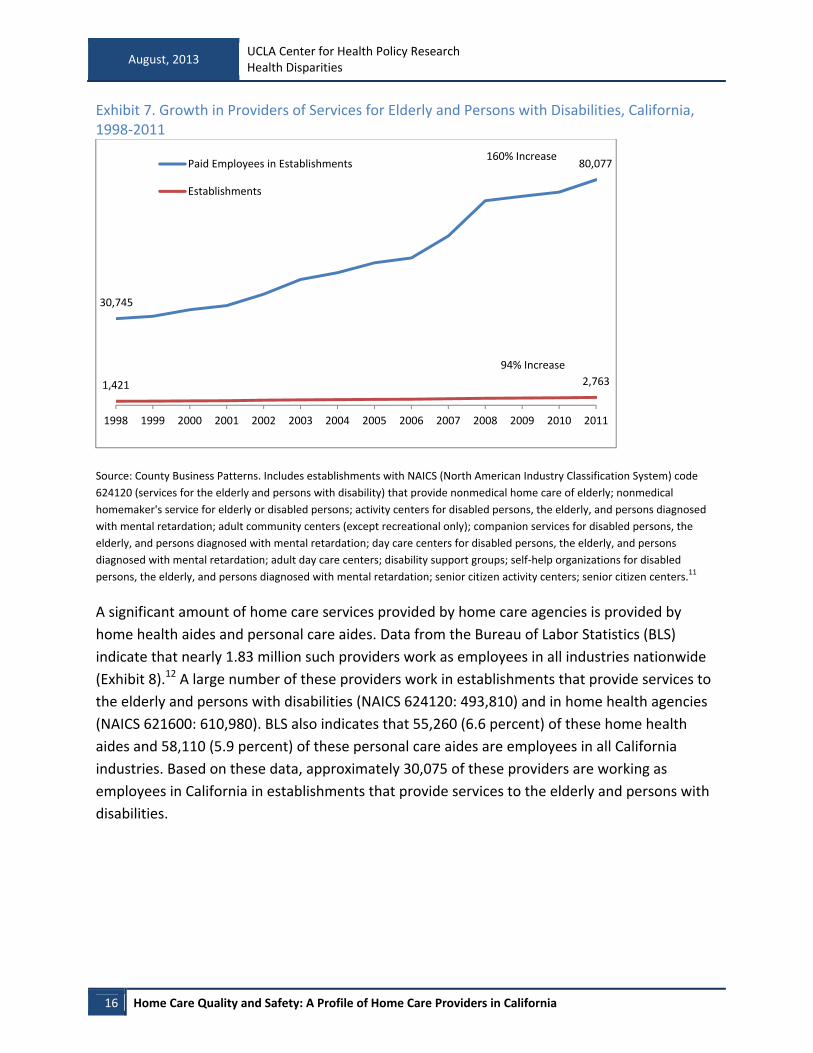
available. There were 2,763 of these home care establishments operating in California in 2011
(Exhibit 7). The number of these establishments grew by 94 percent between 1998 and 2011.11
August, 2013 UCLA Center for Health Policy Research Health Disparities
16 Home Care Quality and Safety: A Profile of Home Care Providers in California
Exhibit 7. Growth in Providers of Services for Elderly and Persons with Disabilities, California, 1998‐2011
Source: County Business Patterns. Includes establishments with NAICS (North American Industry Classification System) code
624120 (services for the elderly and persons with disability) that provide nonmedical home care of elderly; nonmedical
homemaker's service for elderly or disabled persons; activity centers for disabled persons, the elderly, and persons diagnosed
with mental retardation; adult community centers (except recreational only); companion services for disabled persons, the
elderly, and persons diagnosed with mental retardation; day care centers for disabled persons, the elderly, and persons
diagnosed with mental retardation; adult day care centers; disability support groups; self‐help organizations for disabled
persons, the elderly, and persons diagnosed with mental retardation; senior citizen activity centers; senior citizen centers.11
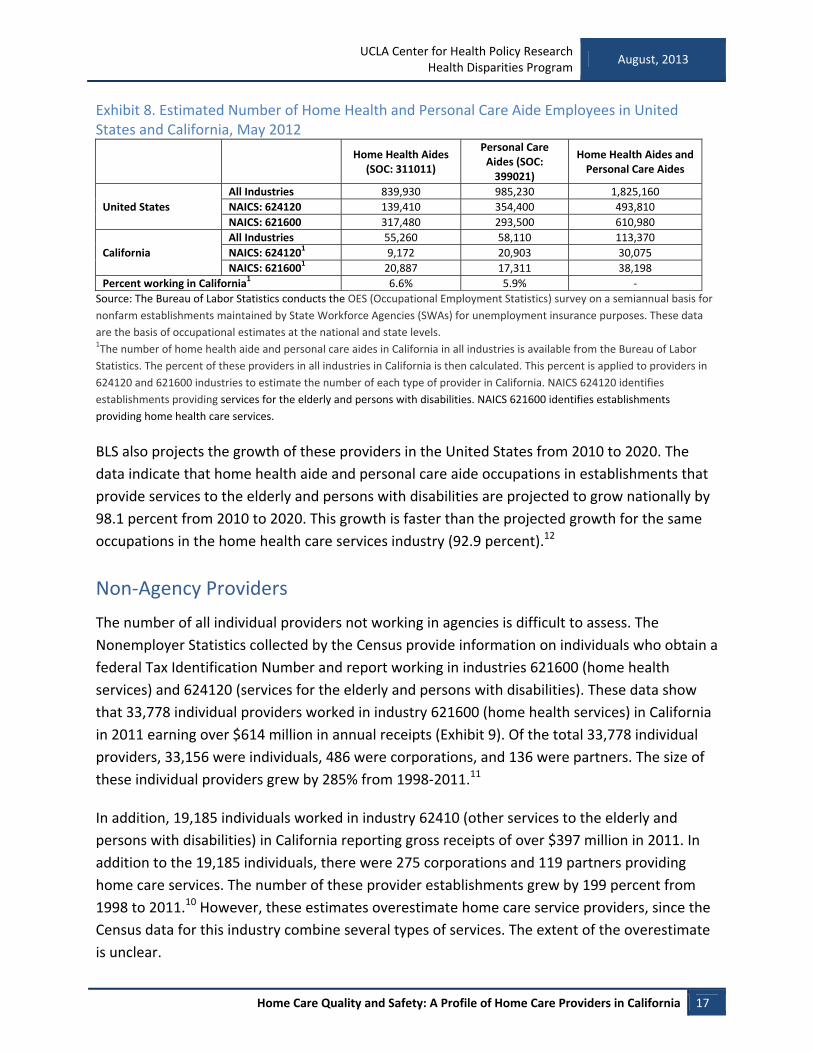
A significant amount of home care services provided by home care agencies is provided by
home health aides and personal care aides. Data from the Bureau of Labor Statistics (BLS)
indicate that nearly 1.83 million such providers work as employees in all industries nationwide
(Exhibit 8).12 A large number of these providers work in establishments that provide services to
the elderly and persons with disabilities (NAICS 624120: 493,810) and in home health agencies
(NAICS 621600: 610,980). BLS also indicates that 55,260 (6.6 percent) of these home health
aides and 58,110 (5.9 percent) of these personal care aides are employees in all California
industries. Based on these data, approximately 30,075 of these providers are working as
employees in California in establishments that provide services to the elderly and persons with
disabilities.
80,077
30,745
2,7631,421
20112010200920082007200620052004200320022001200019991998
Paid Employees in Establishments
Establishments
160% Increase
94% Increase
UCLA Center for Health Policy Research Health Disparities Program
August, 2013
Home Care Quality and Safety: A Profile of Home Care Providers in California 17
Exhibit 8. Estimated Number of Home Health and Personal Care Aide Employees in United States and California, May 2012
Home Health Aides (SOC: 311011)
Personal Care Aides (SOC: 399021)
Home Health Aides and Personal Care Aides
United States
All Industries 839,930 985,230 1,825,160
NAICS: 624120 139,410 354,400 493,810
NAICS: 621600 317,480 293,500 610,980
California
All Industries 55,260 58,110 113,370
NAICS: 6241201 9,172 20,903 30,075
NAICS: 6216001 20,887 17,311 38,198
Percent working in California1 6.6% 5.9% ‐
Source: The Bureau of Labor Statistics conducts the OES (Occupational Employment Statistics) survey on a semiannual basis for
nonfarm establishments maintained by State Workforce Agencies (SWAs) for unemployment insurance purposes. These data
are the basis of occupational estimates at the national and state levels. 1The number of home health aide and personal care aides in California in all industries is available from the Bureau of Labor
Statistics. The percent of these providers in all industries in California is then calculated. This percent is applied to providers in
624120 and 621600 industries to estimate the number of each type of provider in California. NAICS 624120 identifies
establishments providing services for the elderly and persons with disabilities. NAICS 621600 identifies establishments
providing home health care services.
BLS also projects the growth of these providers in the United States from 2010 to 2020. The
data indicate that home health aide and personal care aide occupations in establishments that
provide services to the elderly and persons with disabilities are projected to grow nationally by
98.1 percent from 2010 to 2020. This growth is faster than the projected growth for the same
occupations in the home health care services industry (92.9 percent).12
Non‐Agency Providers
The number of all individual providers not working in agencies is difficult to assess. The
Nonemployer Statistics collected by the Census provide information on individuals who obtain a
federal Tax Identification Number and report working in industries 621600 (home health
services) and 624120 (services for the elderly and persons with disabilities). These data show
that 33,778 individual providers worked in industry 621600 (home health services) in California
in 2011 earning over $614 million in annual receipts (Exhibit 9). Of the total 33,778 individual
providers, 33,156 were individuals, 486 were corporations, and 136 were partners. The size of
these individual providers grew by 285% from 1998‐2011.11
In addition, 19,185 individuals worked in industry 62410 (other services to the elderly and
persons with disabilities) in California reporting gross receipts of over $397 million in 2011. In
addition to the 19,185 individuals, there were 275 corporations and 119 partners providing
home care services. The number of these provider establishments grew by 199 percent from
1998 to 2011.10 However, these estimates overestimate home care service providers, since the
Census data for this industry combine several types of services. The extent of the overestimate
is unclear.

August, 2013 UCLA Center for Health Policy Research Health Disparities
18 Home Care Quality and Safety: A Profile of Home Care Providers in California
Exhibit 9. Number of Individual Providers with Tax Identification Numbers in California, 1998‐2011
Source: U.S. Census, Nonemployer Statistics in NACIS code 621610 (home health care services) and NACIS 624120 (services for
the elderly and persons with disabilities). Data are originated from tax return information of the Internal Revenue Service. A
nonemployer business is one that has no paid employees, has annual business receipts of $1,000 or more, and is subject to
federal income taxes. Most nonemployers are self‐employed individuals operating very small unincorporated businesses, which
may or may not be the owner’s principal source of income. Receipts include gross receipts, sales, commissions, and income
from trades and businesses, as reported on annual business income tax returns. Business income consists of all payments
received for services rendered by nonemployer businesses, such as payments received as independent agents and contractors.
Each distinct business income tax return filed by a nonemployer business is counted as a firm. A nonemployer business may
operate from the owner’s home address or from a separate physical location. Most geography codes are derived from the
business owner's mailing address, which may not be the same as the physical location of the business. The data are subject to
nonsampling error, such as errors of self‐classification by industry on tax forms, as well as errors of response, nonreporting, and
coverage. Values provided by each firm are slightly modified to protect the respondent's confidentiality.
Alternatively, the above estimates for both home health care and personal care service
industries underestimate the overall number of individuals providing home care, since many of
these individuals may be paid in cash or do not earn sufficient income from these activities to
report taxes or obtain a tax identification number, which would lead to representation in
Census data. Underrepresentation is particularly likely among family caregivers who only
provide care to family members, often intermittently.
Other data estimate the number of independent providers in California’s IHSS program at
376,000 in 2011.13 Also, 80 percent of personal care aides in California work for private
households. Personal care aides and home health aides are projected to be the fastest‐growing
33,778
8,775
19,185
6420
20112010200920082007200620052004200320022001200019991998
Home health services
Services for the elderly and persons with disabilities285% Increase
199% Increase

UCLA Center for Health Policy Research Health Disparities Program
August, 2013
Home Care Quality and Safety: A Profile of Home Care Providers in California 19
occupations in the state, with growth of 45.7 percent and 43.6 percent, respectively, expected
from 2008 to 2018.14
An assessment of the IHSS registry in Los Angeles County indicated 75,079 registered providers
in 2007, up from 26,630 in 2002 and representing a growth of 182 percent.15 This registry also
reported a growth of 170 percent in the number of IHSS consumers from 1993 to 2011. Such a
growth in participation was potentially encouraged by year‐round activities to publicize the
registry’s services through multiple and diverse venues.16

August, 2013 UCLA Center for Health Policy Research Health Disparities
20 Home Care Quality and Safety: A Profile of Home Care Providers in California
Regulation, Characteristics, and Care Delivery
Assessment
California Home Health Care Licensure and Certification
In California, HHAs are licensed by the California Department of Public Health (CDPH). All
agencies, regardless of in‐state or out‐of‐state status, must obtain licensure in order to operate
in California. Agencies have the option of obtaining certification by Medicare or accreditation
by the Joint Commission, Community Health Accreditation Program (CHAP), or Accreditation
Commission for Health Care, Inc. (ACHC) and can submit that certification with their application
for licensure. In the absence of certification or accreditation by the above agencies, CDPH will
conduct a licensure and certification survey assigning the request a low‐priority status. This
survey can take several years to complete.17
HHA certification by Medicare and Medicaid programs requires that these agencies meet
eligibility criteria, including compliance with the Conditions of Participation (CoP) laid out in
federal regulations. A state agency conducts the certification survey on behalf of the Centers
for Medicare & Medicaid Services (CMS). However, CMS may grant “deemed” status to
organizations that have obtained accreditation from the Joint Commission or other accrediting
organizations that have met or exceeded Medicare’s CoP.18
The standards that must be met for accreditation generally apply to organization and
administration, program and service operations, fiscal management, human resource
management, provision of care and record management, quality outcomes and performance
improvement, and risk management, such as infection and safety control.19 The accreditation
organization standards may be organized differently. For example, the Joint Commission
standards include environment of care, emergency management, human resources, infection
prevention and control, information management, leadership, life safety, medication
management, national patient safety goals, provision of care, performance improvement,
maintaining record of care, rights of the individual, waived testing, and required written
documentation.20
Licensure, certification, and accreditation provide structural safeguards for delivery of high‐
quality care and patient safety by ensuring that providers have sufficient training and oversight.
Trained providers and regular competency review are the basic standards for delivery of quality
care. Additional measures of quality of care include the process of care delivery (such as
completion of specific tasks while providing care) and patient outcomes (such as improvements
in health and quality of life).

UCLA Center for Health Policy Research Health Disparities Program
August, 2013
Home Care Quality and Safety: A Profile of Home Care Providers in California 21
Characteristics of Home Health Agencies in California and Care Delivery
Assessment
All organizations licensed as HHA or hospice are required to submit annual data on service
providers, patients seen, admission and discharge, diagnosis, and source of reimbursement.21 A
total of 1,928 facilities were identified in California, with 1,803 (93.5 percent) reporting
utilization data for 2011 (Exhibit 10). We examined facilities with open licenses that were
operating in 2011 and that were HHAs with or without hospice services (1,346). The remainder
of this section provides data on the latter facilities.
Exhibit 10. Licensed Home Health and Hospice Agencies in California, 2011
Total licensed facilities1 1,928
Facilities reporting utilization data1 1,803
Facilities with open license status1 1,782
Facilities operating in 20111 1,677
HHA facilities (with or without hospice) 1 1,346
Responded to Medicare home care quality survey2,3 925
Successfully merged licensure and quality survey data4 857 1 2010 Home Health Agencies and Hospice Annual Utilization Data, Office of Statewide Health Planning and Development
(OSHPD). 22
2 Medicare home health CAHPS (Consumer Assessment of Healthcare Providers and Systems) survey, 2012.23 3 950 licensed HHAs responded to the Medicare home care quality survey, but 25 did not have an open license, were not
operating, or were hospice‐only organizations. 4 The reason for lack of a successful merge between the two data sources may be that the data from each source were
collected in two different years.
The majority of HHAs were sole facilities (71 percent) and for‐profit organizations (88 percent;
Exhibit 11). Many were staffed by registered nurses (41 percent) or home health aides (19
percent). The most commonly provided services were IV (intravenous) and enterostomal
therapy and blood transfusions (62 percent). Nineteen percent also provided private duty or
shift duty nursing or homemaker services, which consist of continuous care services for a
minimum of eight hours per shift per day. Other specialized services, such as AIDS or pediatrics
care, may have been provided by an organization other than the HHA.

August, 2013 UCLA Center for Health Policy Research Health Disparities
22 Home Care Quality and Safety: A Profile of Home Care Providers in California
Exhibit 11. HHA Characteristics, 2011
Ownership
Sole facility 71%
California‐based multiple branch agency 23%
Out‐of‐state multiple branch agency 6%
Profit status
For‐profit (investor‐owned) 88%
Public 1%
Nonprofit 11%
Services1
Home care: private duty nursing, homemaker2 19% Skilled (special) services
IV therapy, enterostomal therapy, blood transfusions 62% AIDS, pediatrics 29% Respiratory therapy, other 19% Mental health counseling or psychiatric nursing 11%
Staffing1
Staff registered nurse3 41% Registered nurse/licensed vocational nurse4 14% Certified nurse assistant 4% Home health aide 19% Homemaker 3% Other home care worker 4%
Source: 2011 Home Health Agencies and Hospice Annual Utilization Data, OSHPD 1 Categories overlap. 2 Only service provided for a minimum of eight hours per day are reported. 3 Some HHAs (86) are missing a response to this question but may have nurses on staff. 4 Providing nonintermittent, eight‐hours‐per‐day shift care.
The average number of patients seen per agency in 2011 was 525, with the majority of those
patients over the age of 60 (Exhibit 12). The average number of home visits for these patients
was 9,602, and the primary source of reimbursement was Medicare. The majority of visits
included skilled nursing services.

UCLA Center for Health Policy Research Health Disparities Program
August, 2013
Home Care Quality and Safety: A Profile of Home Care Providers in California 23
Exhibit 12. HHA Patient Characteristics, 2011
Patients
Average number of patients seen per agency in 2011 525
Average number of patients by age
0‐20 20
21‐60 99
61 and older 405
Visits
Average number of HHA visits in 2011 9,062
Average number of HHA visits by source of payment Medicare 5,203 Medi‐Cal 1,371
HMO, PPO 1,506 MSSP, TriCARE/CHAMP, other third party 860 Private 101 Not reimbursed 22
Average number of HHA visits by type of staff Skilled nursing 6,170 Physical, occupational, speech therapy 2,241 Home health aide 510 Social worker 120 Physician, nutritionist, spiritual, other 21
Source: 2011 Home Health Agencies and Hospice Annual Utilization Data, OSHPD
Structural Assessment of Quality of Care
Compliance with various certification standards has implications for quality of care, but it is also
driven by the market sectors that an HHA targets. Certification standards require structural
safeguards that include training and oversight of staff, among other requirements. For example,
HHAs that are certified by Medicare must conduct regular competency assessments of their
staff registered nurses. At the same time, HHAs obtain Medicare certification because they may
specialize in highly skilled services, such as IV therapy, that are reimbursable by Medicare. The
following data examine the association of type of certification by HHAs with various
characteristics such as the type and amount of care provided by certified and noncertified
direct care providers, when applicable.
Most HHAs are certified by both Medicare and Medi‐Cal (78 percent), though some may hold
additional certification (Exhibit 13). A small proportion (5 percent) do not have Medicare or
Medi‐Cal certification but do have certification from one of the three different organizations
that satisfy the requirements of Medicare and Medi‐Cal and can be reimbursed for services
provided to patients with such coverage. Nearly all of the remaining 7 percent report Medicare,

August, 2013 UCLA Center for Health Policy Research Health Disparities
24 Home Care Quality and Safety: A Profile of Home Care Providers in California
Medi‐Cal, or a certification by another organization but do not name that organization. Those
with an unknown certification agency are not included in the analyses in this report.
Exhibit 13. HHA Certification Status, 2011
Certification
Medicare & Medi‐Cal1 78%
Medicare1 6%
Medi‐Cal1 3%
Joint Commission, ACHC, or CHAP only2 5%
None3 7%
Source: 2011 Home Health Agencies and Hospice Annual Utilization Data, OSHPD 1 May have Joint Commission, ACHC, CHAP, or other unknown certification.
2 Includes both accredited and deemed status.
3 Fewer than 0.5 percent of HHAs without the above certifications also report certification by another, unnamed organization.
Agencies with only Joint Commission, ACHC, or CHAP certification were most likely (67 percent)
to have registered nurses on staff (Exhibit 14). Those certified by Medi‐Cal only were most likely
to have registered nurse/licensed vocational nurses providing nonintermittent (eight‐hour shift)
nursing services (76 percent) or home health aides/certified nurse assistants (71 percent). HHAs
certified by Medi‐Cal (27 percent) or those with unknown or no certification (24 percent) were
most likely to have homemakers or other such staff. These differences in type of staff given the
certification status were statistically significant.
Exhibit 14. HHA Staffing by Certification Status, 2011
Source: 2011 Home Health Agencies and Hospice Annual Utilization Data, OSHPD
38%42%
47%
67%
52%
10%
3%
76%
10%
28%
17% 17%
71%
12%
28%
4% 3%
27%
7%
24%
Medicare & Medi‐Cal Medicare Medi‐CalJoint Commission, ACHC, or CHAP only None
Staff registered nurse Shift care registered nurse/Licensed vocational nurse
Home health aide/Certified nurse assistant Homemaker/Other home care worker

UCLA Center for Health Policy Research Health Disparities Program
August, 2013
Home Care Quality and Safety: A Profile of Home Care Providers in California 25
Skilled services such as IV and enterostomal therapy and blood transfusions were least
frequently provided by HHAs with Medi‐Cal certification only (51 percent) or those without
known or any certification (36 percent; Exhibit 15). However, HHAs with Medi‐Cal certification
only were most likely to provide AIDS/pediatric services (82 percent) or therapies such as
respiratory therapy (27 percent). These differences in type of service provided and in
certification status were statistically significant.
Exhibit 15. HHA Type of Skilled Services Provided, by Certification Status, 2011
Source: 2011 Home Health Agencies and Hospice Annual Utilization Data, OSHPD
The number of skilled services provided by HHAs also varied by type of certification (Exhibit 16).
HHAs with Medicare certification only or with unknown or no certification were most likely to
not provide any skilled services (43 percent and 56 percent, respectively). HHAs with Medicare
and Medi‐Cal certification most often provided four different types of services (5 percent).
These differences were statistically significant.
66%
57%
51%
67%
36%
27%
19%
82%
34%
27%
12% 14%
27%
6% 5%
13% 12%
2% 3% 3%
Medicare & Medi‐Cal Medicare Medi‐CalJoint Commission, ACHC, or CHAP only None
IV therapy, enterostomal therapy, blood transfusionsAIDS, PediatricsRespiratory therapy, other

August, 2013 UCLA Center for Health Policy Research Health Disparities
26 Home Care Quality and Safety: A Profile of Home Care Providers in California
Exhibit 16. HHA Number of Skilled Services Provided, by Certification Status, 2011
Source: 2011 Home Health Agencies and Hospice Annual Utilization Data, OSHPD
HHAs certified by both Medicare and Medi‐Cal had the highest average number of unique
patients per year (573), corresponding to 10,232 visits (Exhibit 17). In contrast, HHAs with
Medi‐Cal certification only had an average of 101 unique patients per year but delivered 14,429
visits.
32%43%
11%
33%
56%
35%
26%
36%
31%
22%
21% 21%
33%
31%
19%8% 8%
20%
1% 1%5%
2% 0% 3% 2%
Medicare & Medi‐Cal Medicare Medi‐Cal Joint Commission,ACHC, or CHAP only
None
4
3
2
1
None

UCLA Center for Health Policy Research Health Disparities Program
August, 2013
Home Care Quality and Safety: A Profile of Home Care Providers in California 27
Exhibit 17. HHA Average Annual Number of Unique Patients and Number of Visits, by Certification Status, 2011
Source: 2011 Home Health Agencies and Hospice Annual Utilization Data, OSHPD
The age range of patients seen by HHAs varied by type of certification. HHAs certified by both
Medicare and Medi‐Cal (479) and those certified by Medicare only (391) visited the largest
average number of patients over 60 years of age in 2011 (Exhibit 18). In contrast, HHAs with
only Medi‐Cal certification visited the largest share of patients 20 years of age or younger (62).
573
446
101
247
34
Number of Unique Patients
None
Joint Commission, ACHC,or CHAP only
Medi‐Cal
Medicare
Medicare & Medi‐Cal10,232
6,782
14,429
2,112 906
Number of Visits

August, 2013 UCLA Center for Health Policy Research Health Disparities
28 Home Care Quality and Safety: A Profile of Home Care Providers in California
Exhibit 18. HHA Average Annual Number of Visits by Patient Age, by Certification Status, 2011
Source: 2011 Home Health Agencies and Hospice Annual Utilization Data, OSHPD
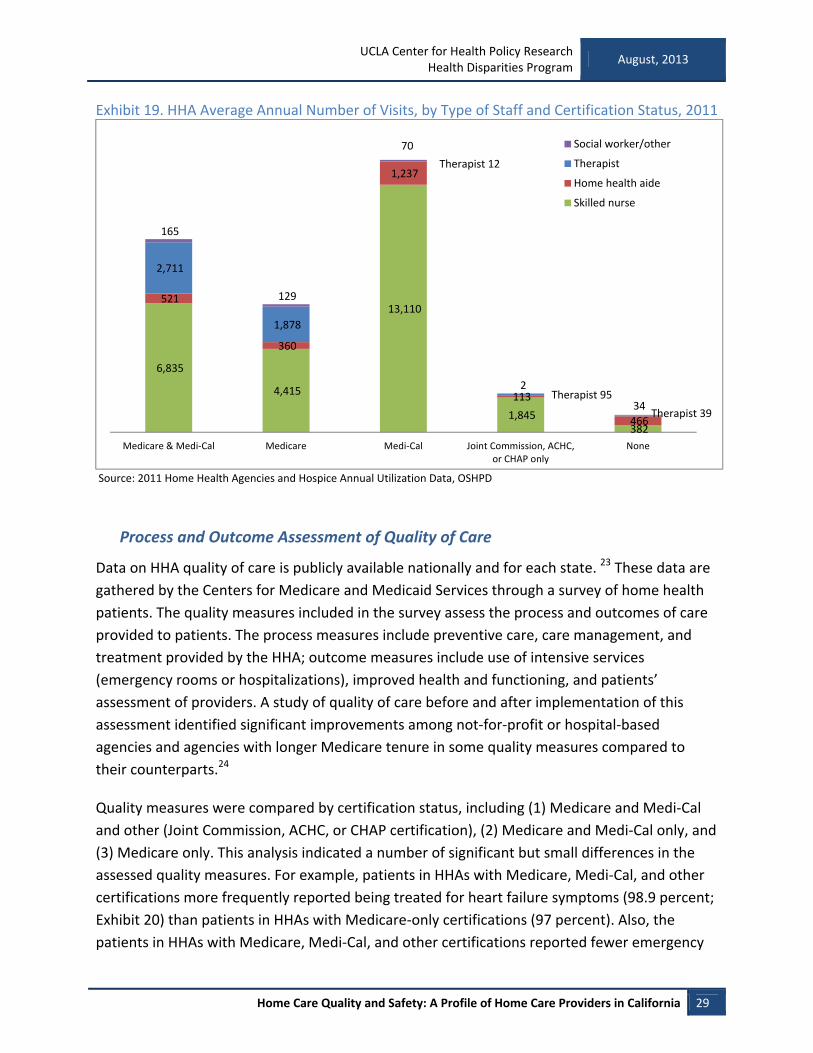
With respect to the type of provider, Medicare‐ and Medicaid‐certified HHAs provide the
largest average number of visits by therapists (physical, occupational, speech; 2,711) and social
workers (165; Exhibit 19). However, HHAs with Medi‐Cal certification provide the most visits by
skilled nurses (13,110) or home health aides (1,237).
479
391
14
106
17
109
80
28
140
16
21
5
62
21
2
Medicare & Medi‐Cal Medicare Medi‐Cal Joint Commission,ACHC, or CHAP only
None
Ages 0 to 20
Ages 21 to 60
Ages 61 plus
UCLA Center for Health Policy Research Health Disparities Program
August, 2013
Home Care Quality and Safety: A Profile of Home Care Providers in California 29
Exhibit 19. HHA Average Annual Number of Visits, by Type of Staff and Certification Status, 2011
Source: 2011 Home Health Agencies and Hospice Annual Utilization Data, OSHPD
Process and Outcome Assessment of Quality of Care
Data on HHA quality of care is publicly available nationally and for each state. 23 These data are
gathered by the Centers for Medicare and Medicaid Services through a survey of home health
patients. The quality measures included in the survey assess the process and outcomes of care
provided to patients. The process measures include preventive care, care management, and
treatment provided by the HHA; outcome measures include use of intensive services
(emergency rooms or hospitalizations), improved health and functioning, and patients’
assessment of providers. A study of quality of care before and after implementation of this
assessment identified significant improvements among not‐for‐profit or hospital‐based
agencies and agencies with longer Medicare tenure in some quality measures compared to
their counterparts.24
Quality measures were compared by certification status, including (1) Medicare and Medi‐Cal
and other (Joint Commission, ACHC, or CHAP certification), (2) Medicare and Medi‐Cal only, and
(3) Medicare only. This analysis indicated a number of significant but small differences in the
assessed quality measures. For example, patients in HHAs with Medicare, Medi‐Cal, and other
certifications more frequently reported being treated for heart failure symptoms (98.9 percent;
Exhibit 20) than patients in HHAs with Medicare‐only certifications (97 percent). Also, the
patients in HHAs with Medicare, Medi‐Cal, and other certifications reported fewer emergency
6,835
4,415
13,110
1,845 382
521
360
1,237
113
466
2,711
1,878
Therapist 12
Therapist 95
Therapist 39
165
129
70
2
34
Medicare & Medi‐Cal Medicare Medi‐Cal Joint Commission, ACHC,or CHAP only
None
Social worker/other
Therapist
Home health aide
Skilled nurse
August, 2013 UCLA Center for Health Policy Research Health Disparities
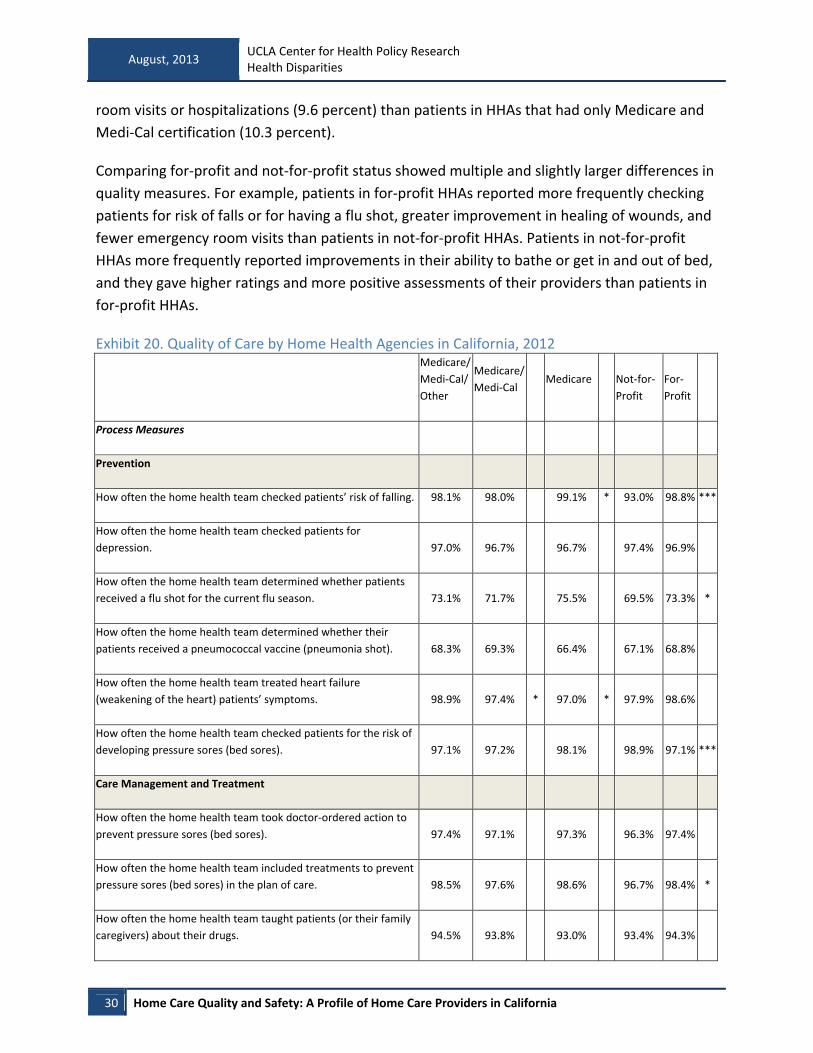
30 Home Care Quality and Safety: A Profile of Home Care Providers in California
room visits or hospitalizations (9.6 percent) than patients in HHAs that had only Medicare and
Medi‐Cal certification (10.3 percent).
Comparing for‐profit and not‐for‐profit status showed multiple and slightly larger differences in
quality measures. For example, patients in for‐profit HHAs reported more frequently checking
patients for risk of falls or for having a flu shot, greater improvement in healing of wounds, and
fewer emergency room visits than patients in not‐for‐profit HHAs. Patients in not‐for‐profit
HHAs more frequently reported improvements in their ability to bathe or get in and out of bed,
and they gave higher ratings and more positive assessments of their providers than patients in
for‐profit HHAs.
Exhibit 20. Quality of Care by Home Health Agencies in California, 2012
Medicare/
Medi‐Cal/
Other
Medicare/
Medi‐Cal Medicare Not‐for‐
Profit
For‐
Profit
Process Measures
Prevention
How often the home health team checked patients’ risk of falling. 98.1% 98.0% 99.1% * 93.0% 98.8% ***
How often the home health team checked patients for
depression. 97.0% 96.7% 96.7% 97.4% 96.9%
How often the home health team determined whether patients
received a flu shot for the current flu season. 73.1% 71.7% 75.5% 69.5% 73.3% *
How often the home health team determined whether their
patients received a pneumococcal vaccine (pneumonia shot). 68.3% 69.3% 66.4% 67.1% 68.8%
How often the home health team treated heart failure
(weakening of the heart) patients’ symptoms. 98.9% 97.4% * 97.0% * 97.9% 98.6%
How often the home health team checked patients for the risk of
developing pressure sores (bed sores). 97.1% 97.2% 98.1% 98.9% 97.1% ***
Care Management and Treatment
How often the home health team took doctor‐ordered action to
prevent pressure sores (bed sores). 97.4% 97.1% 97.3% 96.3% 97.4%
How often the home health team included treatments to prevent
pressure sores (bed sores) in the plan of care. 98.5% 97.6% 98.6% 96.7% 98.4% *
How often the home health team taught patients (or their family
caregivers) about their drugs. 94.5% 93.8% 93.0% 93.4% 94.3%

UCLA Center for Health Policy Research Health Disparities Program
August, 2013
Home Care Quality and Safety: A Profile of Home Care Providers in California 31
Medicare/
Medi‐Cal/
Other
Medicare/
Medi‐Cal Medicare Not‐for‐
Profit
For‐
Profit
How often the home health team checked patients for pain. 98.6% 98.3% 98.6% 98.9% 98.4% *
How often the home health team treated their patients’ pain. 98.8% 98.6% 99.1% 97.9% 98.9%
For patients with diabetes, how often the home health team got
doctors’ orders, gave foot care, and taught patients about foot
care. 96.5% 95.8% 95.7% 94.7% 96.5%
Outcome Measures
Emergency Room Visit/Hospitalization
How often patients receiving home health care needed any
urgent, unplanned care in the hospital emergency room, without
being admitted to the hospital. 9.6% 10.3% * 9.1% 12.4% 9.5% ***
How often home health patients had to be admitted to the
hospital. 15.6% 16.5% * 15.7% 15.3% 15.9%
Improved Health and Functioning
How often patients got better at bathing. 64.6% 65.7% 64.7% 66.7% 64.7% *
How often patients got better at getting in and out of bed. 51.9% 55.0% * 50.5% 57.3% 52.0% ***
How often patients’ breathing improved. 63.4% 65.9% 63.7% 68.2% 63.6% ***
How often patients got better at taking their drugs correctly by
mouth. 44.3% 45.3% 41.0% 46.2% 44.1%
How often patients got better at walking or moving around. 57.7% 56.6% 54.8% 56.3% 57.3%
How often patients’ wounds improved or healed after an
operation. 92.1% 92.6% 91.4% 90.3% 92.8% **
How often patients had less pain when moving around. 74.9% 73.4% 74.8% 65.9% 75.5% ***
Provider Assessment
Patients who gave their home health agency a rating of 9 or 10 on
a scale from 0 (lowest) to 10 (highest). 78.0% 78.4% 78.4% 82.4% 77.4% ***
Patients who reported that their home health team
communicated well with them. 81.4% 82.6% 81.6% 85.1% 81.3% ***
Patients who reported that their home health team discussed 81.4% 80.3% 80.6% 84.5% 80.3% ***

August, 2013 UCLA Center for Health Policy Research Health Disparities
32 Home Care Quality and Safety: A Profile of Home Care Providers in California
Medicare/
Medi‐Cal/
Other
Medicare/
Medi‐Cal Medicare Not‐for‐
Profit
For‐
Profit
medicines, pain, and home safety with them.
Patients who reported that their home health team gave care in a
professional way. 85.0% 85.4% 83.9% 86.8% 84.7% **
Patients who reported YES, they would definitely recommend the
home health agency to friends and family. 73.4% 73.1% 73.1% 78.9% 72.2%
How often the home health team began the patient’s care in a
timely manner. 92.8% 91.9% 92.4% 91.3% 92.7%
Source: Medicare home health CAHPS (Consumer Assessment of Healthcare Providers and Systems) survey, 2012.23 HAAs
contract with a vendor that who administers the survey by mail and/or telephone and submits the data to the CMS. CMS adjust
the data for patient mix to ensure that survey results are not influenced by different characteristics of patients in HHAs.
California Home Care Agency Regulation
Unlike universal licensure and high levels of certification among HHAs, home care agencies are
not regulated in many states. In a 2011 survey of 30 states to identify those that have licensure
requirements for HCAs, the California Senate Office of Oversight and Outcomes found that 24
of the 30 had such requirements.2 These states included New York, Texas, and Florida, which,
along with California, have experienced the largest growth in home health care industries.
Other states may have implemented licensure requirements since the date of that survey.
Arkansas requires licensure for HCAs providing care to Medicaid beneficiaries.25 Idaho and
some other states have regulations that include a minimum set of standards applicable to HCAs
providing care under the Medicaid program.
California does not regulate home care agencies that offer nonmedical personal care services;
such providers can operate with a business license. The states that regulate or license
nonmedical providers may vary in their regulation of types of providers and specific aspects of
service delivery. Depending on the state, the licensure or regulation may apply to HCAs,
employment agencies, and/or independent providers. Regulations define the services that can
be provided and the certification and training required of direct service providers and other
workers. The requirements contained in the regulations define the responsibilities of regulating
agencies (e.g., collecting licensing fees, addressing consumer complaints, and overseeing
deficiencies and plans to address deficiencies) and the regulated organizations (e.g., obtaining
background checks, assessing staff competencies, maintaining documentation, and informing
consumers of their rights).

UCLA Center for Health Policy Research Health Disparities Program
August, 2013
Home Care Quality and Safety: A Profile of Home Care Providers in California 33
For example, the state of New York has established a set of minimum standards for HCAs.26
These standards cover patient rights, patient service policies and procedures, plans of care,
medical orders, clinical supervision, patient care records, governing authority, contracts,
personnel, and records and reports.
In Pennsylvania, regulations apply to HCAs and home care registries. These regulations require
criminal background checks of all staff and TB screening of all direct care providers, including
contractors. Assuring the competency of all providers is also required. A valid license is
required, when applicable. A competency exam that is developed and conducted by the agency
or proof of valid certification and training that ensures current compliance with competency
requirements is needed. Annual or more frequent review of competency must also be
conducted. The HCA is required to document compliance with all requirements, provide
information to consumers on their rights in service planning, give advance notice of
termination, and provide contact information for complaints. Among the responsibilities of the
Pennsylvania Department of Health are ensuring compliance with licensure requirements and
investigating complaints.27
Characteristics of Home Care Agencies in California and Care Delivery
Assessment
Little information is available on the characteristics of HCAs in California. Publicly available data,
including the Economic Census and County Business Patterns, do not separately identify HCAs,
and California does not require a specific license for these establishments. Therefore, HCA‐
specific official information is not available. Various professional organizations for home health,
hospice, and home care providers provide listings and searchable databases. However, these
databases are restricted to member organizations or do not provide sufficient information to
identify HCAs. In addition, there are no public data available from official sources to assess the
delivery of care by HCAs.
California Non‐Agency Provider Regulation
Non‐agency providers include licensed and/or certified providers, as well as those without any
formal training or regulatory oversight. The California Department of Public Health licensing
and certification program oversees certification of certified nurse assistants, home health aides,
and certified hemodialysis technicians. The department also operates a publicly available,
searchable website by provider name, displaying the provider’s certificate types, certificate
numbers, and status (active, revoked, or denied).28
California’s Public Authorities operate a separate registry of personal home care providers for
Medi‐Cal beneficiaries who receive these services under the In‐Home Supportive Services (IHSS)

August, 2013 UCLA Center for Health Policy Research Health Disparities
34 Home Care Quality and Safety: A Profile of Home Care Providers in California
program. The genesis of Public Authorities can be traced back to difficulties in finding and
retaining home care providers for people with disabilities and the elderly, difficulties
experienced by home care providers looking for jobs, and lack of an employer of record to
organize for wages above minimum wage in the early 1990s. In 1999, legislation (AB 1682) was
passed to mandate that an employer of record be established in California by January 2003,
incentivizing the use of Public Authorities as a mode of service. Public Authorities are public
agencies that act as the employer of record in most California counties. There are 56 Public
Authorities in California.29
Each Public Authority sets up and operates a registry to help consumers find personal care
providers, conducts background checks for providers in the registries, documents and takes
action on complaints, mediates between providers and consumers, offers access to provider
training, and negotiates with the unions representing the individual providers.30,31 Provider
participation in registries is voluntary, but background checks are required for all providers paid
by IHSS.
Characteristics of Non‐Agency Providers in California and Care Delivery
Assessment
Individual providers in California are frequently low‐income individuals, with personal care
aides and home health aides earning about 10 dollars per hour and nursing aides earning wages
of about 13 dollars per hour in 2011. The wages for these workers declined slightly from 11
dollars for personal care aides since 2001, but increased since 2001 to 12 dollars for nursing
aides. Approximately half of these workers rely on means‐tested public assistance, including
Medi‐Cal and food and nutrition programs.13
Los Angeles County IHSS data reported that 39 percent of these workers in 2007 were not
family members or other relatives and that some of these workers were employed
intermittently.15
No data are available from official sources to assess delivery of care by non‐agency providers
employed privately. However, information is available from Washington State’s “Individual
Provider” referral registry, which is similar to California’s IHSS referral registry. Studies of the
impact of registries on worker turnover and satisfaction, as well as consumer satisfaction in
Washington State, indicated a decline in the rates of provider turnover in the program from
2004 to 2009. The registry consumers had a higher level of need (as assessed by higher ADL
scores) than those not using the registry.32
A study of consumer satisfaction with the referral registry in Washington State found high levels
of satisfaction with both individual providers and the referral registry services. Consumers were

UCLA Center for Health Policy Research Health Disparities Program
August, 2013
Home Care Quality and Safety: A Profile of Home Care Providers in California 35
highly satisfied with providers’ trustworthiness, respectfulness, work ethics, and punctuality.
Most found provider training in their specific condition very important. Consumers’ knowledge
of the registry was fairly low (27 percent), and only 13 percent of those with knowledge of the
registry had used it. Negative ratings of the referral registry pertained to providers’ not
returning phone calls or the matching of providers with consumer preferences, among other
factors.33
A similar survey of providers in Washington State identified high levels of job satisfaction and
found that health insurance and wages were the most important benefits of being a provider.
Consumer awareness of the registry was relatively common (46 percent), but only 17 percent
had used the registry. The latter group did not have a provider. Those who knew about the
registry but did not use it had a provider.34
Washington State also conducted a feasibility study on opening its referral registry to private
pay providers. The study acknowledged that a wide range of private and nonprofit registries
was available in Washington. However, it concluded that a specific strength and advantage of
the state’s registry services was the inclusion of background checks and more extensive
character and competency‐based evaluation to match consumers and providers. The study also
found that should the registry be opened to private pay consumers, those who associated the
registry with higher levels of quality and safety would be the most likely to use the registry.
Opening the registry to private pay consumers was not expected to be costly or to require
much additional training for workers. Any additional costs could be compensated by an annual
fee or hourly surcharge.35

August, 2013 UCLA Center for Health Policy Research Health Disparities
36 Home Care Quality and Safety: A Profile of Home Care Providers in California
Summary of Findings
Demand for Home Care
The size of the population in need of home care services is anticipated to increase significantly,
and many of these individuals will require personal care services.
The population 85 years of age and older continues to grow rapidly in California and is
expected to triple in size by 2050.
The most common disabilities reported by the California population are ambulatory
difficulties.
Income and insurance coverage of those with disabilities in California indicate that a
large segment of the population is likely to use personal care services in the private and
often unregulated market.
California Home Care Industry Size and Growth
The home care industry has grown significantly since 1998. The increase in the number of
individual providers (nonemployer firms) has accounted for much of this growth.
Home health agencies grew by 50 percent nationally from 1998 to 2011.
In California, HHAs grew in both number of establishments (89 percent) and number of
employees (35 percent) from 1998 to 2011. California has the second‐largest number of
HHAs and the third‐largest number of HHA employees nationally.
More than one‐third (35 percent) of HHAs in California operate in Los Angeles County,
with another 8 percent in Orange County.
The exact number of home care agencies in California is not available because these
agencies are combined with other providers of services for the elderly and persons with
disabilities (NAICS 624120). The available data on establishments in this broad industry
category show a growth of 73 percent nationally and 181 percent in California from
1998 to 2011.
An estimated 30,075 home health and personal care aides were employees under NAICS
624120 in California in 2012. The number of such employees is projected to grow
nationally by 98.1 percent from 2010 to 2020, a more rapid rate than the growth in
number for the same types of employees in the home health services industry (92.9
percent; NAICS 621600).
There were 33,778 individual providers in home health services in 2011, with over $614
million in total annual receipts. These providers saw a growth of 285% from 1998 to
2011.

UCLA Center for Health Policy Research Health Disparities Program
August, 2013
Home Care Quality and Safety: A Profile of Home Care Providers in California 37
There were 19,185 individual providers in services for the elderly and persons with
disabilities in 2011, with a growth of 199% in the number of these providers from 1998
to 2011.
Regulation, Characteristics, and Care Delivery Assessment
Regulation in the form of licensure, certification, or background checks is not consistently
required of all home care providers in California. HHAs in California are regulated by universal
licensure requirements, which are necessary for operating an HHA in California. However, HCAs
require only a general business license. Some individual providers are licensed or certified, and
some may undergo background checks under the IHSS program.
All HHAs operating in California are required to be licensed by the California Department
of Public Health. Providers reimbursed by Medicare or Medi‐Cal are also required to be
certified by the Centers for Medicare and Medicaid Services or by private organizations
such as the Joint Commission. Certification is not required for HHAs that have only
privately paid patients.
Most licensed HHAs (93 percent) are certified. Licensure and certification provide basic
standards and structural safeguards to ensure patient safety and improve quality of
care.
HCAs do not require licensure in California, although 24 other states do require
licensure of HCAs, and some states have minimum standards for these agencies.
Depending on the state, HCA licensure may define service provision, certification and
training of direct service providers, and the responsibilities of regulating organizations
(e.g., collecting licensing fees, addressing consumer complaints, and overseeing
deficiencies) or of regulated organizations (e.g., obtaining background checks and
assessing staff competencies).
Individual providers who are certified nurse assistants or home health aides are certified
by the California Department of Public Health.
Individual providers in the IHSS system also receive background checks and may be
subject to corrective actions based on complaints.
Many other Individual providers are not subject to structural safeguards intended to
ensure patient safety and quality of care, instead providing care without any oversight.
Assessment of the staffing, patient, and service characteristics of HHAs indicated a
concentration of certified providers delivering skilled nursing and specialized services to mostly
older populations covered by Medicare, Medi‐Cal, and private insurance. The assessment of
these characteristics by certification status indicates appropriate delivery of specialized services

August, 2013 UCLA Center for Health Policy Research Health Disparities
38 Home Care Quality and Safety: A Profile of Home Care Providers in California
by trained providers. The process and quality measures showed that patients had generally
positive views of HHAs and rated them highly. The few differences in patient assessment were
associated with certification and for‐profit status.
Most home health agencies that were licensed and operating in California in 2011 had
single facilities based in California (71 percent), were for profit (88 percent), and offered
specialized services such as IV therapy (62 percent). Many utilized licensed and certified
staff, including registered nurses (41 percent) and home health aides (19 percent).
Most home health services provided Medicare‐paid skilled nursing care to patients over
60 years of age.
The great majority of home health agencies (78 percent) were certified by both
Medicare and Medi‐Cal, and many had other voluntary accreditation or certification.
Staffing of HHAs and services provided varied by certification status. Agencies without
Medicare and Medi‐Cal certification had the highest proportion of registered nurses.
HHAs without Medicare and Medi‐Cal certification but with accreditation from the Joint
Commission, CHAP, and/or ACHC most frequently (67 percent) provided specialized
services such as IV therapy.
HHAs with Medi‐Cal certification provided the highest number of visits, despite having a
relatively low number of unique patients. These HHAs also provided more home visits to
patients 20 years of age or younger, and many of their services were in the area of
skilled nursing care.
For‐profit HHAs had lower rates of emergency room visits, while not‐for‐profit HHAs
excelled in improvements in some activities of daily living and in positive patient
assessments of their providers.
HHAs with multiple certifications in addition to Medicare and Medi‐Cal also had a
slightly lower rate of emergency room visits and hospitalizations than HHAs with
Medicare and Medi‐Cal certification only.
Little information is available on the characteristics of the HCAs, and there are no public data
from official sources to assess their delivery of care.
Data on characteristics of individual providers are limited, and little information is available on
the delivery of care by these individuals.
Individual providers in the California IHSS program are frequently low‐income
individuals, and many are family members.
Washington State studies of the Medicaid providers of personal care services, similar to
the IHSS in California, have shown high levels of provider retention and provider and
patient satisfaction.
UCLA Center for Health Policy Research Health Disparities Program
August, 2013
Home Care Quality and Safety: A Profile of Home Care Providers in California 39
Policy Implications
This report provides evidence of significant growth in the home care industry, particularly
among unregulated providers. Personal care services can play a significant role in improving
quality of life and maintaining individuals in the community. Further growth in this segment of
the home care industry is highly likely. This report highlights the importance of the licensure
and certification of home care providers in establishing structural assurances of patient safety
and quality of care.
In general, licensure is a proxy measure for availability of patient safeguards, because licensure
typically requires background checks and protections of patients’ rights, among other
regulations. The fact that 24 states require licensure of home care agencies demonstrates a
concern for patient safety and the perceived need for minimum oversight of organizations that
often deliver unsupervised personal care services to vulnerable populations. The role of
personal home care services in keeping vulnerable aging and disabled populations at home is
likely to drive further growth in this sector of the home care industry, particularly in California.
Licensure establishes basic patient safety standards.
Expansion of certification and registries for individual health and personal care providers may
also be used as a method of extending patient safeguards, with providers screened through
background checks and the resulting information conveyed to patients and consumers who
seek care privately.
In addition to licensure, certification is a proxy for the assessment of structural quality
safeguards because it requires staff training and competency review. Uniform certification
requirements would establish minimum standards of care for providers in agencies or in private
arrangements. Public availability of such information can improve consumer safety by assisting
consumers who are searching for qualified and reliable home health and personal care
providers. Consumers can screen out providers whose certification is not current or has been
revoked, as well as those who do not pass criminal background checks.
Gaps in available data prevent assessment of the size of nonmedical home care providers as
well as of the ability to evaluate patient safety and quality of care of these providers. Licensure
would increase the availability of data on characteristics of HCAs and thus make possible the
assessment of care delivery by these establishments.
Also, no assessment of process and outcome of care is available concerning uncertified HHAs
that are most likely to provide services to private pay patients. These gaps in available data may
be addressed by increasing the availability of reports on care delivery or of surveys of

August, 2013 UCLA Center for Health Policy Research Health Disparities
40 Home Care Quality and Safety: A Profile of Home Care Providers in California
organizations and individuals that provide home care. However, the potential costs of such data
collection to the regulating agencies and home care providers should be considered.
The trends in aging of the population, the higher rate of disability among those with advanced
age, and the promise of home health and nonmedical home care services in preventing rates of
institutionalization are important public health concerns in California. These trends will
continue to accelerate the growth in the home care industry in the state. Appropriate patient
safety and quality safeguards are established for HHAs and IHSS providers in California, but
HCAs and independent providers in private arrangements are currently not subject to these
safeguards. Establishing licensure and basic safety standards is a reasonable public health
policy to reduce the potential for adverse consequences for the growing aging and disabled
populations.
Author information:
Nadereh Pourat, PhD, is professor at the UCLA Fielding School of Public Health, adjunct
professor at the UCLA School of Dentistry, and director of research at the UCLA Center for
Health Policy Research.
Funder information:
This policy brief was funded by the Service Employee International Union, Union of Long Term
Care Workers. The analysis, interpretation and conclusions contained within this report are the
sole responsibility of the authors.
Acknowledgements:
The author wishes to thank Daphna Gans, PhD and Kathryn Kietzman, PhD for reviewing; Nigel
Lo for preliminary analysis of OSHPD data; and Max Hadler for editing this publication.
Suggested citation:
Home Care Quality and Safety: A Profile of Home Care Providers in California. Los Angeles, CA:
UCLA Center for Health Policy Research, 2013.
Related citation:
Pourat N. Home Care Industry in California is Growing and Largely Unregulated. (Policy Brief)
Los Angeles, CA: UCLA Center for Health Policy Research, 2013.

UCLA Center for Health Policy Research Health Disparities Program
August, 2013
Home Care Quality and Safety: A Profile of Home Care Providers in California 41
References
1. U.S. Department of Health and Human Services. Personal Care Services: Trends, Vulnerabilities, and Recommendations for Improvement. 2012; https://oig.hhs.gov/reports‐and‐publications/portfolio/portfolio‐12‐12‐01.pdf.
2. Adkisson J, Hill J, Korber D, Vogel N. Caregiver Roulette: California Fails to Screen those who Care for the Elderly at Home. California Senate Office of Oversight and Outcomes 2011; http://www.ihsscoalition.org/documents/53553550‐2385‐Caregiver‐Roulette.pdf.
3. Matthias RE, Benjamin AE. Abuse and Neglect of Clients in Agency‐Based and Consumer‐Directed Home Care. Health & Social Work. August 1, 2003 2003;28(3):174‐184.
4. Lowenthal B. AB‐1217 Home Care Services Consumer Protection Act of 2013. 2013; http://leginfo.legislature.ca.gov/faces/billNavClient.xhtml?bill_id=201320140AB1217.
5. U.S. Department of Health and Human Services. A Profile of Older Americans: 2011. 2011; http://www.aoa.gov/Aging_Statistics/Profile/2011/docs/2011profile.pdf.
6. California Department of Finance. Report P‐2: Population Projections by Race/Ethnicity and 5‐Year Age Groups, 2010‐2060. 2013; http://www.dof.ca.gov/research/demographic/reports/projections/P‐2/.
7. Integrated Public Use Microdata Series (IPUMS‐USA). University of Minnesota; Date Accessed: May 20, 2013. https://usa.ipums.org/usa/. Accessed May 20, 2013.
8. Brault MW. Americans With Disabilities: 2010. Current Population Reports 2012; http://www.census.gov/prod/2012pubs/p70‐131.pdf.
9. University of California, Los Angeles; 2009, Date Accessed: May 20, 2013. http://ask.chis.ucla.edu/main/default.asp. Accessed May 20, 2013.
10. U.S. Census Bureau. Nonemployer Statistics. U.S. Department of Commerce 2010; http://www.census.gov/econ/nonemployer/download.htm.
11. U.S. Census Bureau. 2011 County Business Patterns (NAICS). U.S. Department of Commerce 2011; http://censtats.census.gov/cgi‐bin/cbpnaic/cbpcomp.pl.
12. Occulational Employment Statistics. U.S. Department of Labor; 2012. http://data.bls.gov/oes/.
13. The Paraprofessional Healthcare Institute. State by State Data. 2012; http://phinational.org/policy/states/california/.
14. The Paraprofessional Healthcare Institute. State Facts: California's Direct‐Care Workforce. 2010;

August, 2013 UCLA Center for Health Policy Research Health Disparities
42 Home Care Quality and Safety: A Profile of Home Care Providers in California
http://www.phinational.org/sites/phinational.org/files/clearinghouse/CA%20Fact%20Sheet‐%2011‐04‐10.pdf.
15. Persoanl Assistance Services Coucil. The Impacts of Medical Benefits on the Los Angeles County IHSS Workforce: A Five‐Year Study. 2007; http://pascla.org/wp‐content/uploads/bsk‐pdf‐manager/18_HealthcareImpactStudyRTZ‐1207.pdf.
16. Personal Assistance Services Council of Los Angeles County. 2010‐2011 Report. 2011; http://pascla.org/downloads/pasc_annualreport_2011.pdf.
17. California Department of Public Health. Applications for Licensing and/or Certification of a Home Health Agency (HHA). 2013; http://www.cdph.ca.gov/pubsforms/forms/Pages/HealthFacility‐HomeHealthAgency.aspx.
18. The Joint Commission. Facts about federal deemed status and state recognition. 2012; http://www.jointcommission.org/assets/1/18/Facts_about_Federal_Deemed_Status.pdf.
19. Accreditation Commission for Health Care. Home Health. 2013; http://achc.org/programs/home‐health.
20. Community Health Accreditation Program. Accreditation Standards. 2013; http://chapinc.org/Accreditation/Accreditation%20Standards.
21. California Office of Statewide Health Planning & Development. ALIRTS User Guides, Forms and Instructions. 2012; http://www.oshpd.ca.gov/hid/ALIRTS/FormsUserGuides.html.
22. California Office of Statewide Health Planning & Development. Home Healtlh Agencies and Hospice Facility Annual Utilization Data. 2011; http://www.oshpd.ca.gov/HID/Products/Hospitals/Utilization/HHA_Utilization.html.
23. Centers for Medicare & Medicaid Services. Official Home Health Compare Data. 2013; https://data.medicare.gov/data/home‐health‐compare.
24. Jung K, Shea D, Warner C. Agency Characteristics and Changes in Home Health Quality After Home Health Compare. Journal of Aging and Health. June 1, 2010 2010;22(4):454‐476.
25. Arkansas Department of Health. Rules and Regulations for Private Care Agencies in Arkansas. 2010; http://www.healthy.arkansas.gov/aboutADH/RulesRegs/PrivateCareAgencies.pdf, 007.05.
26. New York State Department of Health. Licensed Home Care Services Agencies ‐ Minimum Standards. 2012;

UCLA Center for Health Policy Research Health Disparities Program
August, 2013
Home Care Quality and Safety: A Profile of Home Care Providers in California 43
http://w3.health.state.ny.us/dbspace/NYCRR10.nsf/0/8525652c00680c3e8525652b00609e5b?OpenDocument.
27. Pennsylvania Department of Health. Home Care Agencies/Home Care Registries. 2013; http://www.portal.state.pa.us/portal/server.pt?open=514&objID=558578&mode=2.
28. California Department of Public Health. L & C Certification Verification Search Page. 2013; http://www.apps.cdph.ca.gov/cvl/SearchPage.aspx.
29. California Association of Public Authorities for IHSS. 2013; http://www.capaihss.org/.
30. Seyden N, Robert B. The History of In‐Home Supportive Services and Public Authorities in California. California In‐Home Supportive Services Consumer Alliance 2013; http://cicaihss.org/ihss‐public‐authority‐history.
31. Barnes C, Logsdon V, Sutherland S, Gonzales E. The In‐Home Supportive Services Provider Handbook. California State University, Sacramento, Institute for Social Research 2006; http://www.cdss.ca.gov/agedblinddisabled/res/pdf/IHSS_Provider_Handbook.pdf.
32. Mann C. A Longitudinal Study of Workforce Stability: Individual Providers in Washington State. Social & Economic Sciences Research Center 2010; http://www.hcrr.wa.gov/surveys/docs/HCQA%202010%20Database%20Report%20FINAL.pdf.
33. Mann C, Pavelchek D. Consumer Mail Survey. Social & Economic Sciences Research Center 2008; http://www.hcrr.wa.gov/surveys/docs/Consumer_Survey_Report_08.pdf.
34. Mann C, Pavelchek D. Individual Provider Phone Survey. Social & Economic Sciences Research Center 2008; http://www.hcrr.wa.gov/surveys/docs/HCQA_2008_ProviderSurvey_phone.pdf.
35. Public Knowledge L. Fee‐for‐Service Feasibility Study. Washington State Home Care Quality Authority 2008; http://www.hcrr.wa.gov/surveys/docs/WA%20HCQA%20Feasibility%20Report‐Final.pdf.

The views expressed in this report are those of the authors and do not
necessarily represent the UCLA Center for Health Policy Research, the
Regents of the University of California, or collaborating organizations or
funders.
Copyright © 2013 by the Regents of the
University of California. All Rights Reserved.
The UCLA Center
for Health Policy Research is affiliated with the
UCLA Fielding School of Public Health and the UCLA School of Public Affairs.
Phone: 310‐794‐0909 Fax: 310‐794‐2686
Email: [email protected] www.healthpolicy.ucla.edu


