360
Lloyds Banking Group Annual Report and Accounts 2020 1 Lloyds Banking Group Annual Report and Accounts 2020

Lloyds Banking Group Annual Report and Accounts 2020 1
Lloyds Banking Group Annual Report and Accounts 2020

Our GroupWe are the largest UK retail and commercial financial services provider with over 25 million customers and a presence in nearly every community.
The Group’s main business activities are retail and commercial banking, general insurance and long-term savings, provided through the largest branch network and digital bank in the UK, with well recognised brands including Lloyds Bank, Halifax, Bank of Scotland and Scottish Widows.
Our shares are quoted on the London and New York stock exchanges and we are one of the largest companies in the FTSE 100 index.
Our reportingWe aim to report in an integrated way to reflect the way we operate, while retaining separate sections for our environmental and social performance for ease of reference. As well as reporting our financial results, we also report on our strategy and approach to operating responsibly while taking into account relevant economic, political, social, regulatory and environmental factors.
This Annual Report and Accounts contains forward-looking statements with respect to the Group’s plans and its current goals and expectations relating to its future financial condition, performance, results, strategic initiatives and objectives. For further details, reference should be made to the forward-looking statements on page 347.
The 2020 Annual Report and Accounts incorporates the strategic report and the consolidated financial statements, both of which have been approved by the Board of Directors.
On behalf of the Board Robin Budenberg Chair Lloyds Banking Group 23 February 2021
Snap happy As we did previously, in 2020, we offered colleagues from across the Group an opportunity to submit photographs that they felt represented their year. The winning images have been highlighted on the divider pages of this report alongside the photographer's name.
Strategic reportOur COVID response 01Chair's statement 04Group Chief Executive’s review 08Our business model 12Key performance indicators 14Our progress in building a sustainable and responsible business 16Our external environment 32Strategic review 2021 36Our key stakeholders and Board engagement 46Financial performance overview 52Risk overview 56
Financial resultsSummary of Group results 62Divisional results 73Other financial information 77
GovernanceA letter from our Chair 81Our Board 82Group Executive Committee 84Corporate governance report 86
Directors’ report 111Directors’ remuneration report 115Other remuneration disclosures 138
Risk managementThe Group’s approach to risk 144Emerging risks 147Risk governance 150Capital stress testing 152Full analysis of risk categories 153
Financial statementsIndependent auditors’ report 206Consolidated financial statements 215Parent company financial statements 335
Other informationShareholder information 344Five year financial summary 346Forward-looking statements 347Abbreviations 348Alternative performance measures 348Subsidiaries and related undertakings 349
£1.4bn(54)%Statutory profit after tax reduced significantly; largely due to increased impairments given the deterioration in the economic outlook
0.57pOrdinary dividend per share, given the Group’s strong capital position dividends have resumed at the maximum allowed
Group performance Continued strategic progress with financial performance impacted by the coronavirus pandemic, deterioration of the economic outlook and lower interest rates
Inside this year’s Annual Report
55.3%6.8ppCost:income ratio deteriorated due to lower income
3.7%(4.1)ppReturn on tangible equity of 3.7 per cent given lower statutory profit
17.4m+6.1%Digitally active customers continued to increase and we remain the largest digital bank in the UK
81%+7ppColleague engagement remains at its highest ever level with our employee engagement index seven points higher than 2019

Strategic reportFinancial results
Governance
Risk manag
ement
Financial statements
Other inform
ation Lloyds Banking Group Annual Report and Accounts 2020 01
Our COVID response
During an extraordinarily challenging time we are Helping Britain Recover, as part of our Group purpose of Helping Britain Prosper.
We have lent over £12 billion to help businesses bounce back and granted around 1.3 million payment holidays to support customers, while increasing customer satisfaction, strengthening our franchise with growth in deposits and further enhancing our leading digital proposition, which now serves 17.4 million customers.
Over the following pages and throughout this report we highlight what Helping Britain Recover means and how we are supporting people, businesses and communities to emerge stronger than before.
Our GroupWe have and will continue to support our customers and colleagues to get through these extraordinary times.
We have an important role to play in Britain’s recovery, working with others to help build an inclusive, greener and more resilient economy for the whole of the UK.
Read more on how we're supporting the UK through these extraordinary times on the pages that follow.

02 Lloyds Banking Group Annual Report and Accounts 2020
Supporting customersMany people continue to feel the impact of the past year on their personal finances. We have approved around 1.3 million payment holidays for customers who have mortgages, personal loans, credit cards and car finance with us since the start of the outbreak, and are helping our customers to replan their finances.
Our dedicated telephone services, with extended opening hours for the over 70s and NHS workers, have taken around 880,000 calls since the end of March, allowing us to prioritise support for these customers and their urgent needs. We’ve also proactively made over 750,000 calls to check on the wellbeing of our vulnerable customers. These services will continue.
Supporting businessesAs a result of the lockdowns, businesses are facing challenges like never before. Many have been forced to close and furlough their staff, while others have had to adapt to external changes. Whatever situation our business customers have faced, we’ve stood by their side.
We have supported them to obtain more than £12 billion in finance through the Government-backed lending schemes, helped them to manage their cash flow by granting around 34,000 capital repayment holidays and helped their working capital by agreeing around 22,000 fee-free overdrafts to businesses.
We are doing our best to help and advise British businesses of all sizes so that as lockdown eases they can adapt their business models to re-open safely and profitably.
The public health crisis caused by coronavirus has affected all of us and the society in which we live. Our priority is to help the UK recover in an effective, inclusive and sustainable way.
We’re giving our customers the flexibility they need to manage their finances, while helping protect them from fraud.
We’re working with the Government to provide loans and working capital support for the businesses of Britain, at the same time as providing the sector-by-sector expertise needed to help them adapt for success.
We’re keeping our colleagues as safe as we can while they provide essential services to people across the UK. And we’re working with the Government to get practical help to those who need it most, in communities across all the regions of the UK.
For over 320 years, with our unique family of brands, we have supported Britain through the good times and the bad and this time is no different. In 2021, we will continue to do all we can to Help Britain Recover, as this is in the best interests of all our stakeholders. More information on our next chapter on pages 36 to 45.
Our COVID response continued
Supporting our stakeholders during the COVID crisis

Strategic reportFinancial results
Governance
Risk manag
ement
Financial statements
Other inform
ation Lloyds Banking Group Annual Report and Accounts 2020 03
Supporting our colleaguesWe’re taking every precaution to protect our colleagues. More than 50,000 colleagues worked from home for most of 2020, up from 15,000 before the pandemic, and this will continue, until at least Summer 2021.
Where our colleagues are providing an essential service for the UK, such as in our call centres and branches, we are following social distancing rules, to keep both our colleagues and customers safe.
Supporting communitiesThe effects of coronavirus will remain for some time to come; that’s why we’re providing extra practical and emotional support for the most vulnerable in society.
Through a range of new and existing partnerships we are providing extra capacity in friendship services, mental health programmes and digital skills training. We have also provided £25.5 million to our charitable Foundations in 2020 and have guaranteed the same funding for 2021, to keep those who are most isolated connected and give people support when they need it most.
Board oversight of the pandemic in 2020 can be found on pages 90 and 91

04 Lloyds Banking Group Annual Report and Accounts 2020
OverviewMy first annual statement to you as Chair comes at the end of what has been a tumultuous and extraordinary year for both the UK and Lloyds Banking Group. It has been a year of unprecedented challenge in which many people have suffered but also one in which the Group has proved it can make a difference and truly support its customers and the UK economy.
Having joined the Board in October and taken over the role of Chair from 1 January 2021, I have been hugely impressed with the response of the Group to the COVID-19 crisis and the achievements during the last year. I am particularly proud of our workforce and the continued commitment and dedication in supporting our customers and each other. We provided over £12 billion of lending to businesses through Government-backed schemes and granted around 1.3 million payment holidays to retail customers, providing vital support at a time of crisis.
Helping Britain Recover and Strategic Review 2021 The role of Chair is to help ensure that the Board and the executive team are focusing on the right issues and developing the right purpose and strategy, executing it effectively and with the right values and cultures as an organisation.
We recognise that the focus of the Group's purpose must evolve in response to the current environment and changing customer needs and expectations. Many individual and business customers have been impacted by the crisis and we have a responsibility, as the UK’s largest bank, to help these customers and Help Britain Recover. This is completely aligned with our ongoing purpose of Helping Britain Prosper, and is in the best interests of all stakeholders.
In September 2020, the Group launched The Big Conversation and since then we have brought together more than 900 people, including industry leaders, local politicians and expert voices in virtual sessions around the country to discuss what the pandemic has meant for them and what support they need to survive and thrive.
We have subsequently published the findings which can provide insight and direction to different stakeholder groups as we explore together how we can help to rebuild the economy. We are privileged to be able to use our comprehensive regional and national network and our sector expertise to bring together people with a diverse range of perspectives.
Although the next couple of years will be challenging, the pandemic provides a unique opportunity for banks to evidence their importance to customers and the economy and we will continue to play the important role expected of us as the UK’s leading financial services provider. We will help Britain rebuild sustainably by playing our part in the country’s economic recovery.
Helping Britain Recover is at the heart of Strategic Review 2021, which launched the same day as our full year results, in February 2021 and will further enhance our capabilities to create the UK's preferred financial partner for personal customers and the best bank for business. Having been heavily involved in the development of the evolution of strategy, the Board is excited about the opportunities for the Group.
Given the Group’s unique position in the UK economy, as part of Strategic Review 2021, we have identified five areas where we can make a transformational societal impact and which are also deeply integrated into the strategic development of our business: Help rebuild households’ financial health and wellbeing, Support businesses to recover, adapt and grow, Expand availability of affordable and quality homes, Accelerate the transition to a low carbon economy and Build an inclusive society and organisation.
These five priorities for 2021 consist of a number of commitments in areas where we can make the biggest difference, create value for our customers and, given they will enable us to build a sustainable and inclusive business, will also benefit shareholders. Further detail on our purpose and the areas of focus are provided on pages 38 and 39.
Continued transformation of the GroupThe Group’s significant investment in transformation and digital in recent years has clearly positioned us well. It is also clear that we will need to continue to evolve and invest to build on this advantage. The COVID-19 crisis, which is having an unprecedented impact on the overall economy, on businesses across sectors, and on how we all live our lives, has accelerated the pace of change in the banking industry. It has also highlighted new emerging trends that will shape the industry in the future.
To compete effectively against new competitors we will need to continue to modernise our technology architecture, transform how we work and enhance our use of data across the business. As an efficient, scale operator with strong multi-brand, multi-channel capabilities and a fantastic customer franchise we have significant advantages, but sustainable success will only be possible through further embracing technology and enhancing our customer propositions.
To do this, we need to continue our journey to become a much more flexible organisation with a more agile culture and faster decision-making. We will need to reinvent the way we do business and are increasingly likely to partner with specialist technology and fintech providers. The first stages of this approach are laid out in our evolution of strategy, Strategic Review 2021. I believe it is a solid foundation for our continued transformation and delivering strong and superior returns.
Chair's statement
Our unique position allows us to Help Britain Recover and play our part in returning the UK to prosperity
The Group has been playing a leading role in the immediate national response, supporting customers, colleagues and our communities through the crisis and beyond. Robin Budenberg Chair

Strategic reportFinancial results
Governance
Risk manag
ement
Financial statements
Other inform
ation Lloyds Banking Group Annual Report and Accounts 2020 05
STRATEGIC REVIEW 2021: BUILDING THE UK'S PREFERRED FINANCIAL PARTNER
Help rebuild households’ financial health and wellbeing
We will have over 6,500 colleagues trained to support customers to build their financial resilience
We will expand our existing ‘Mental Health Accessible’ accreditation for Lloyds Bank across Halifax and Bank of Scotland
We will partner with independent debt advice organisations to ensure customers have access to practical support
Support businesses to recover, adapt and grow
We will develop appropriate recovery plans for our customers, supported by 1,100 business specialists
We will support at least 75,000 UK businesses to start up in 2021
We will help at least 185,000 small businesses boost their digital capability
Expand availability of affordable and quality homes
We will provide £10 billion of lending to first-time-buyers and lead a national conversation on access to the housing market
We will provide £1.5 billion of new funding support, incl. £500 million in ESG-linked funding, in support of the social housing sector
We will assess the energy retrofit requirements of over 200,000 homes in the social housing sector
Accelerate the transition to a low carbon economy
We will expand the funding available under our green finance initiatives from £3 billion to £5 billion
We will ensure our own operations are net zero by 2030
We will become the first major pensions and insurance provider to target halving the carbon footprint of all our investments by 2030
We will introduce a flagship fossil fuel-free fund to support green growth
Build an inclusive society and organisation
We will set new aspirations for 50 per cent women, 3 per cent Black and 13 per cent Black, Asian and Minority Ethnic colleagues in senior roles by 2025
We will maintain our £25.5 million contribution to foundations in 2021
We will support regional regeneration, including launching the 'Regional Housing Growth Initiative'
We will support financial inclusion by providing banking to potentially excluded groups of people
Lloyds Banking Group is a customer focused, sustainable, efficient and low risk UK financial services leader with a clear purpose of Helping Britain Prosper. Given the pandemic and our unique position at the heart of the UK economy, our priority for the next phase of our strategy is to focus on Helping Britain Recover.
Strategic Review 2021 is focused on delivering co-ordinated growth opportunities across our core business areas to create the UK’s preferred financial partner for personal customers and the best bank for business. The strategy is supported by further investment in four specific capabilities: a modernised technology architecture, integrated payments, creating a data-driven organisation and reimagined ways of working
Strategic Review 2021: Building the UK's preferred financial partner pages 36 to 45
Enhancingour
Capabilities
Helping Britain Recover: We have identified five priority areas, based on where we feel we can make the most difference

06 Lloyds Banking Group Annual Report and Accounts 2020
The Big Conversation – Helping Britain Recover
Lloyds Banking Group has brought together more than 900 businesses, community members, policy makers and subject-matter experts across the UK’s nations and regions to explore how we can help the UK recover from the impact of coronavirus.
Conversations have covered a range of topics, from accessing the finance and skills to support the recovery journey, to the opportunities brought about by an increasingly digital economy. Conversations also revealed a shared view of what the critical priorities should be for policy-makers to emerge with an economy that is both more resilient and more sustainable.
We've partnered with the Confederation of British Industry (CBI), bringing the voices and experience of its 190,000 members to the conversation.
Scan the QR code to read the report
RemunerationProtecting our colleagues and recognising their efforts to support our customers during this unprecedented year has been important to the Group. We were able to confirm to all full-time and part-time permanent colleagues that they would continue to be paid their contracted hours as normal, no matter what their role, how the outbreak affected what they did for the Group or what their personal circumstances were, and did not take any Government funding to pay colleagues.
We have a duty to support our customers, colleagues and communities during this uncertain time and we believe the changes we made to our pay and absence policies during the course of 2020 have ensured that our colleagues received the support they needed during such a challenging year.
Given the financial performance of the business, we were not able to pay any bonuses for 2020, but to ensure that the support shown to customers was appropriately recognised, we made a one-off recognition award to 40,000 colleagues, predominantly those in customer-facing roles and are awarding all colleagues a £400 share award to motivate delivery of the next phase of our strategy. In addition, the vast majority of colleagues will receive an above inflation pay increase this year with larger relative increases for lower grade colleagues. As a result, the total package for the vast majority of customer-facing colleagues was largely unchanged in the year.
Our colleagues and cultureThe sheer amount of change that people have coped with during 2020 is phenomenal and the role of our colleagues cannot be understated. I have heard of so many wonderful examples of colleagues supporting each other and our customers, and the empathy and dedication our colleagues have shown is a testament to the Group.
COVID-19 is likely to change ways of working beyond what we ever thought was possible with more virtually-connected, remote working teams and fewer offices. Also, employees’ expectations are evolving with over 77 per cent of our colleagues, who are currently working from home, indicating in recent colleague surveys that they would like to work from home three or more days per week. All this requires companies to rethink the way they manage their business and, given that we want to be an employer of choice, attracting the best staff, this hybrid approach is likely to be increasingly prevalent.
The Board and senior management have a vital role to play in shaping and embedding a healthy corporate culture. With this in mind, creating structures which put customers at the heart of decision-making has been a major focus for the Board’s attention over the last few years. During the pandemic, there has been increased focus on ensuring customers are supported appropriately and the Board is determined that this will continue. More information on the Board oversight of our culture journey can be found on page 92.
The values and standards of behaviour we set are an important guiding influence and we are determined to address and learn from historic failures, including those at HBOS Reading which occurred before Lloyds acquired HBOS in 2009. An independent re-review of compensation for those impacted is currently being progressed and we await the outcome of the Dame Linda Dobbs’ review on the Group’s handling of the issue. We are already implementing lessons learnt so far and are committed to ensuring all those impacted are treated fairly and compensated appropriately.
There are strong links between governance and establishing a culture that supports long-term sustainable success and I am keen to ensure the Group continues to build a strong reputation in this area.
While the Group was the first FTSE 100 company to set targets to increase both gender and ethnic diversity at senior levels, the Board recognises that there is always more that can be done to ensure a diverse workforce. The Board was therefore pleased to endorse a Race Action plan in support of Black colleagues to drive cultural change, recruitment and progression across the Group. Further information about the Race Action plan can be found on page 25.
Chair's statement continued
We also gained shareholder approval for the 2020 Directors’ Remuneration Policy at the AGM in May last year. We do however recognise that a substantial proportion of our shareholders voted against the Policy and against the Long Term Share Plan and are sensitive to concerns on remuneration in the sector. Following further engagement with our shareholders, we have therefore committed to a series of changes in how the new Policy is to be implemented and disclosed in 2021. Our new Chief Executive Officer, Charlie Nunn, has also agreed to a significantly reduced reward package. For further details, please refer to pages 115 to 142 in our Directors’ Remuneration Report.
Shareholder returnsThe Group's financial performance in 2020 was clearly impacted by the pandemic and the consequent challenging economic environment. Despite this we delivered a resilient financial performance and continued to make good strategic progress. Our performance continues to demonstrate the stability of our customer franchise and business model, the appropriateness of our strategy and the strength of our balance sheet.
I am also pleased to announce that the Board has recommended a final ordinary dividend of 0.57 pence per share. This is the maximum dividend we were able to recommend given current regulatory constraints. Going forward our capital position remains strong and we remain committed to future capital returns.

Strategic reportFinancial results
Governance
Risk manag
ement
Financial statements
Other inform
ation Lloyds Banking Group Annual Report and Accounts 2020 07
Board changesWe have a strong, diverse and experienced Board, which proved its effectiveness throughout the year. A number of Board changes have been seen during the year, as outlined below.
As disclosed in last year’s annual report, Catherine Woods joined the Board as a Non-Executive Director in March. In May, Anita Frew retired as Deputy Chair and Non-Executive Director, having served 9 years on the Board. Alan Dickinson succeeded Anita as Senior Independent Director and also took on the role of Deputy Chair, bringing his significant Board, financial and regulatory experience to these roles. In addition, Nick Prettejohn took on the role of Chair of the Board Risk Committee on an interim basis in May, with Catherine Woods taking over from Nick from 1 January 2021.
In addition, during September 2020 both Simon Henry and Juan Colombás retired from the Board. Sarah Legg assumed the role of Chair of the Audit Committee in October.
Group Chief Executive One of my first actions when I joined the Group was to recruit a new Group Chief Executive and I was delighted to be able to announce in November the appointment of Charlie Nunn. Charlie will, subject to regulatory approval, join the Group in August 2021 from HSBC and brings with him significant operational, technology and strategic expertise. I am personally excited about Charlie’s vision for the Group, as well as his passion for our commitment to Helping Britain Recover. The Board and I look forward to working with him to ensure the success of the next stage of development of the Group.
On 30 April 2021, António Horta-Osório will retire as Group Chief Executive and Director of Lloyds Banking Group plc having led the Group for the last ten years. I would like to take this opportunity to pay tribute to the outstanding contribution that António has made to first turning round and then leading the strategic development of the Group over the last decade. His personal commitment and strong vision have driven a period of substantial and successful change in the Group, restoring Lloyds to its pre-eminent position as the UK’s leading financial services provider. During his tenure, he has overseen a comprehensive transformation of the Group's balance sheet, operations, and customer propositions, including the repayment of the UK Government's £21 billion investment and evolution of the Group into the UK's largest digital bank.
As previously indicated, the Board has agreed that during any interim period between António Horta-Osório stepping down and Charlie Nunn joining the Group, William Chalmers, Chief Financial Officer will, subject to regulatory approval, take on the role of acting Group Chief Executive in addition to his ongoing responsibilities as Chief Financial Officer, with the support of Alan Dickinson and myself. It will be critically important to maintain momentum during this period and arrangements will be made to support William in this role and manage his wider responsibilities appropriately.
Introducing our new Group Chief Executive Charlie NunnCharlie Nunn will, subject to regulatory approval, join the Group in August 2021, as our new Group Chief Executive. He was previously the Global Chief Executive of Wealth and Personal Banking at HSBC. Charlie has had a long and successful career in financial services. He began as a management consultant at Accenture where he worked for 13 years in the US, France, Switzerland and the UK. He then moved to McKinsey & Co. as a Senior Partner for five years, joining HSBC in 2011.
At HSBC, he has held a series of leadership positions including Global Chief Operating Officer of Retail Banking and Wealth Management, Group Head of Wealth Management and Digital, and Chief Executive of Retail Banking and Wealth Management before taking on his most recent role.
In addition Lord Blackwell retired from the Board on 1 January 2021 having been a member of the Board for nearly nine years and Chairman since April 2014. He has been instrumental in helping turn the business around since the financial crisis and refocus the business on Helping Britain Prosper. I must thank him for his strong stewardship during this period and sage advice since I joined the Board.
Also, as recently announced, Sara Weller will have served 9 years as a Non-Executive Director in February 2021 and accordingly plans to retire as Chair of the Responsible Business Committee and a Non-Executive Director at the AGM in May 2021. Amanda Mackenzie will take on the role of Chair of the Responsible Business Committee following Sara's retirement from the Board and Sarah Legg has been appointed as a member of the Responsible Business Committee with effect from 1 February 2021.
Full details of the changes are provided in the Nomination and Governance Committee Report on pages 98 to 100.
SummaryIn summary, what is very clear, is that we are operating in an increasingly dynamic and competitive market. Only by truly focusing on the needs of the customer and embracing technology will banks be successful.
Given significant investment and transformation in recent years we are well positioned with strong foundations to support our response to the evolving banking landscape. We intend to further build and adapt our compelling offering for customers, while at the same time delivering a positive societal impact and long-term superior and sustainable returns for shareholders.
I would like to end by reiterating my thanks to our colleagues for their significant contribution in 2020. It is the commitment, innovation and dedication from all of them that enables us to deliver for our customers and shareholders. There are difficult times and more change ahead, both this year and beyond, however we will do our best to fulfil our role in the country’s recovery.
Lloyds Banking Group will Help Britain Recover and Help Britain Prosper again.
Robin Budenberg Chair

08 Lloyds Banking Group Annual Report and Accounts 2020
Coronavirus has had a profound impact on our lives and the economy but the Group has delivered a resilient performance with continued strategic progress. António Horta-Osório Group Chief Executive
Group Chief Executive’s review
Continued strategic progress while supporting customers and colleagues in difficult times
The impact of the coronavirus pandemic on the people, businesses and communities in the UK and around the world in 2020 has been profound. Many countries, including the UK, have seen unprecedented levels of economic contraction as a result of lockdown measures, as well as comprehensive and co-ordinated Government support measures. In this environment, we remain absolutely focused on working with all our stakeholders to support our customers and ensure a sustainable recovery.
The Group’s successful ongoing transformation, continued investment and growing franchise strength positioned us well to face the pandemic. In response to the challenging economic environment, we provided around 1.3 million payment holidays on mortgages, loans, credit cards and motor finance products while we also set up dedicated phone lines for customers over 70 years old and for customers who are working on the frontline in the NHS. We are also providing significant support for our business clients, providing more than £31 billion of gross lending to small and medium sized businesses, including Government-backed lending. Within Insurance and Wealth, we have supported the NHS by providing free additional insurance cover to its workers and by alleviating pressure on GPs with a reduction in medical evidence required for insurance claims.
The Group has benefited from its multi-brand, multi-channel distribution model during the pandemic, as we have been able to continue serving customers through the UK's leading digital bank, the largest branch network in the UK and our telephony centres. I am particularly pleased with how quickly the Group adapted to the initial lockdown and how well our digital banking proposition has performed in a period of significantly heightened usage.
Our infrastructure has been highly resilient, with around 90 per cent of our branches remaining open while our digital channels have performed well, attaining record levels of customer satisfaction despite significantly increased usage.
Once again I would like to express my gratitude to all of our colleagues for their resilience, dedication and hard work throughout 2020. Our people have retained their clear focus on supporting their customers and Helping Britain Prosper in very challenging circumstances. I am proud of everything the Group has done to support the UK economy in 2020. This would not have been possible without the exemplary dedication of our colleagues.
Given our clear UK focus, the Group’s financial performance is inextricably linked to the health of the UK economy and thereby the impact of the coronavirus pandemic. Significant uncertainties remain relating to the pandemic, the third national lockdown and the speed and efficacy of the vaccination programme. Nonetheless, the Group’s purpose, unique business model, competitive advantages and ambitious strategic evolution will ensure that it will be able to Help Britain Recover from the crisis whilst delivering long-term sustainable returns for our shareholders.
Financial performanceIn the context of the pandemic, statutory profit after tax was £1.4 billion. This was 54 per cent lower than 2019 and earnings per share of 1.2 pence were down 66 per cent. Lower profits were significantly due to the impairment charge of £4.2 billion in 2020 (2019: £1.3 billion), primarily reflecting the deterioration in the economic outlook. Trading surplus of £6.4 billion was down 27 per cent on 2019, reflecting continued revenue pressures partly offset by lower total costs. Our relentless focus on cost efficiencies has led to a 4 per cent reduction in operating costs despite absorbing additional coronavirus-related expenses during 2020.
Loans and advances were broadly in line with prior year at £440.2 billion. Growth in the open mortgage book of £7.2 billion, including £10.2 billion in the second half of the year, and £11.1 billion (£12.4 billion approved at 12 February 2021) of Government-backed lending more than offset lower unsecured Retail balances and other Corporate and Institutional lending, as well as the continued reduction in the closed mortgage book.
The Group’s capital position remains strong with a CET1 ratio of 16.4 per cent before allowing for ordinary dividends and 16.2 per cent after dividends, both ahead of the Board’s ongoing target of c.12.5 per cent, plus a management buffer of c.1 per cent. Given our strong capital position at the year end and the regulator’s clarification that banks may resume capital distributions, the Board has recommended a final ordinary dividend of 0.57 pence per share, the maximum allowed under the Prudential Regulation Authority's temporary framework on 2020 distributions.

Strategic reportFinancial results
Governance
Risk manag
ement
Financial statements
Other inform
ation Lloyds Banking Group Annual Report and Accounts 2020 09
Strategic progressThe Group’s previous three-year strategic plan was launched in February 2018 and we have now achieved our ambitious target of transforming the Group for success in a digital world by investing £2.8 billion across our four strategic pillars.
Leading customer experienceIn 2020, we successfully built on our track record of improving customer propositions, even in the context of our focus on supporting our customers and ensuring operational resilience during the coronavirus crisis. The pandemic has accelerated the shift towards digital for everyday banking needs. We are the largest digital bank in the UK and have seen our digitally active customer base increase to 17.4 million customers, while our active mobile app users have increased by nearly two million in 2020 to 12.5 million customers. At the same time, we have continued to enhance our digital propositions, with a focus on convenience and control. As a consequence, we have seen our digital customer satisfaction scores improve to a year end record high of 67.
Alongside creating the UK’s leading digital bank, we have maintained the UK’s largest branch network. We have managed to keep around 90 per cent of our branches open during the coronavirus pandemic, using appropriate safeguarding measures. In addition, we have maintained our ATM network at over 95 per cent capacity and have set up dedicated telephone lines our customers over 70 years old and those working on the frontline in the NHS.
Digitising the GroupWe have accelerated the digitisation of the Group by progressively modernising and simplifying the IT architecture, continuing to digitise customer journeys and migrating applications to private cloud. We have now digitised 78 per cent of the Group’s cost base, ahead of our GSR3 target of 70 per cent. With cumulative technology spend of more than £4 billion over GSR3, our ongoing focus on transforming the business and investing in digital enabled us to respond effectively to the accelerated shift to digital channels brought about by the coronavirus pandemic. The proportion of products originated via digital channels increased significantly in 2020, up 10 percentage points to 85 per cent, our highest level to date.
Despite this significant progress, we are only just starting to see the transformation that technology is enabling. Customers will increasingly expect to interact with us in a more effective, agile and personalised way. To compete effectively against new entrants and respond to these evolving customer expectations, we need to continue to transform how we work, replace some of our legacy systems and enhance our use of data across the business. Some of this development will be internal but we will also increasingly use partnerships with specialist technology and fintech providers.
Maximising Group capabilitiesWe have actively supported our Commercial Banking clients through the pandemic, exceeding our £6 billion target for increasing net lending to start-ups, SME and Mid Market clients over the last three years. Outside of our support for the Government lending schemes, in 2020 we also achieved our £18 billion commitment for gross lending to UK businesses.
In 2020 we increased the number of customers with access to our unique Single Customer View capability by c.1.5 million to c.6.5 million. We also expanded the scope of Single Customer View to include Halifax Share Dealing so that customers with this functionality are now able to view their pensions and investment portfolios alongside their banking products. We have seen cumulative growth in open book assets under administration of £46 billion, or 69 per cent, over the GSR3 period to £113 billion, only narrowly missing the £50 billion growth target despite challenging market conditions.
Transforming ways of workingThe coronavirus pandemic is having significant implications for our colleagues, in both their personal and professional lives. These include accelerating the transition to new ways of working for the majority of the Group and accentuating the skills that we have sought to develop over the course of GSR3. Since March 2020, more than 50,000 colleagues (over 70 per cent of our workforce) have worked remotely and we have increased our adoption of remote working tools to greatly increase collaboration and support more agile working practices.
In 2020 we delivered an additional 2.1 million training hours to develop the skills for the future, taking the total to 5.3 million hours over the course of GSR3, ahead of our target. In addition, the proportion of change programmes delivered using agile methodologies has increased to 65 per cent over the course of GSR3, ahead of our target of 50 per cent.
Our 2020 Colleague Survey received almost 50,000 responses and showed positive increases in all main areas, including overall engagement up 7 percentage points to 81 per cent. This reflects the highest level since measurement started in 2011 and is above the UK high-performing norm.
2018 TO 2020 STRATEGIC HIGHLIGHTS
Leading customer experience
>17 million digitally active customers
>12 million mobile app users
67digital net promoter score, a year end record high
Digitising the Group
78 per centof cost base covered by digitisation
>£4 billioncumulative technology spend 2018-2020
Maximising Group capabilities
>£6 billionof net lending to start-ups, SMEs and Mid Market customers
1.5 millionadditional pension customers
>6 millioncustomers able to see their banking, insurance and pension products in one place through Single Customer View functionality
Transforming ways of working
5.3 millioncumulative additional future skills training hours delivered
65 per centof change delivered by agile methodologies
Read more on pages 18 and 19

10 Lloyds Banking Group Annual Report and Accounts 2020
Group Chief Executive’s review continued
As the UK's largest mortgage lender, we recognise the vital importance of helping Britain get a home. We have provided close to £9 billion of finance for the social housing sector and lent c.£40 billion to first-time buyers over 2018 to 2020.
Building capability and digital skills was more important in 2020 than ever, given the need for customers to access services during periods of lockdown. We have now facilitated digital training for 1.8 million individuals, SMEs and charities since the start of 2018 and delivered over 12,500 devices to customers, enabling them to safely book medical appointments, connect with family and access internet banking facilities.
Supporting businesses to start up and to grow is fundamental to Helping Britain Recover. We have now helped over 265,000 businesses start up since the beginning of 2018 and trained over 1,200 apprentices through our investment in the Lloyds Bank Advanced Manufacturing Training Centre since the beginning of 2018.
The Group launched The Big Conversation: Helping Britain Recover in September 2020, a national programme of events which brought together more than 900 businesses, community members, policy makers and subject-matter experts across the UK’s nations and regions to explore how we can together help the UK recover from the impact of coronavirus and build a more resilient and sustainable economy.
We are championing Britain’s diversity and in 2020 launched our Race Action plan. This makes the Group the first FTSE 100 company to make such public commitments, including a new goal to specifically increase Black representation in senior roles to align with the overall UK labour market. We also published our first Ethnicity Pay Gap Report, made progress on gender diversity and published our annual Gender Pay Gap Report.
Further information on our approach to environmental, social and governance issues can be found in our 2020 Environmental, Social and Governance Report, available on the Group’s website.
Management changeIt is with mixed emotions that I will step down as Group Chief Executive at the end of April. It has been a great honour to work alongside all of my colleagues and achieve the remarkable transformation of the past ten years, but now is the right time to move on, following my announcement last July.
Charlie Nunn will be the next Group Chief Executive. He was previously the Global Chief Executive of Wealth and Personal Banking at HSBC and has had a long and successful career in financial services. Charlie will find a warm welcome at Lloyds Banking Group and a deep commitment from all of our people to deliver on our purpose and to Help Britain Recover. I am sure that he will find his time here as fulfilling and fascinating as I have done and I wish him the very best.
Helping Britain ProsperWe recognise that the focus of the Group's purpose must evolve in response to the current environment with changing societal and customer needs and expectations. Given our focus on the UK, we are dedicated to helping our customers, clients, colleagues and communities get through the coronavirus pandemic and rebuild livelihoods, whilst delivering long-term sustainable success for shareholders. Our core values underpin our purpose to Help Britain Prosper. With this in mind, our focus for the near-term will be to Help Britain Recover.
We are committed to supporting a sustainable recovery which supports all of the people and regions in our society. In 2021, we will Help Britain Recover by concentrating on five key areas where we can make the most difference, all of which are embedded in our business strategy. This is discussed further in the Strategic Review 2021 section.
Help rebuild households’ financial health and wellbeing
Support businesses across the UK to recover, adapt and grow Expand availability of affordable and quality homes Accelerate the transition to a low carbon economy Build an inclusive society and organisation
The Group is committed to helping the UK transition to a sustainable low carbon economy. We continue to make progress in implementing our financed emissions reduction ambition on the path to net zero by 2050 or sooner, working with customers, Government and the market to help reduce the emissions we finance. In so doing, we are also focusing on enhancing our green finance products and services. This includes supporting renewable energy projects since the start of 2018 that could power the equivalent of 10.1 million homes, more than doubling the number of electric vehicles we finance, raising around £2.9 billion funding in green and sustainable bonds for our clients since 2016 and offering pensions to our customers and colleagues with sustainable investment choices.
We are working hard to tackle social disadvantage across Britain. In 2020, the Group’s four independent charitable Foundations received £25.5 million of funding, enabling them to continue their work in supporting nearly 2,800 charities. These charities tackle vital issues such as domestic abuse, mental health, modern slavery and human trafficking, and employability. The Group has committed to maintain its £25.5 million funding to the Foundations in 2021, ensuring that these charities can secure a more certain future during these difficult times and safeguard their important work.
Our ongoing commitment to helping people save for the future is key to developing social mobility and we have increased the open book assets that we hold on behalf of customers in retirement and investment products by £46 billion since the start of 2018.
Strategic Review 2021Today's environment continues to evolve and provide new challenges. The macroeconomic environment remains uncertain, whilst we are witnessing increasing societal expectations, an accelerated shift to digital and new technology capabilities in the context of the pandemic driving a step change in ways of working.
Throughout 2020 the management team, in conjunction with the Board, have worked on developing an evolution of our strategy to address these issues. We have made significant progress in recent years, leveraging the unique strengths and assets of the Group, including our purpose driven and customer focused business model, our low risk approach to business, our market leading efficiency and our leading multi-channel propositions, including the largest digital bank and branch network in the UK. This has created the platform for Strategic Review 2021, the next stage of our journey.
The Group has a clear purpose of Helping Britain Prosper, which drives our strategy. Given the pandemic and the challenging macroeconomic environment, our focus for 2021 is Helping Britain Recover. This is in the context of delivering co-ordinated growth opportunities by building the UK’s preferred financial partner for personal customers and the best bank for business. Delivery of the Group's customer focused ambitions in our two main segments, will be underpinned by the enhancement of four core capabilities within our business. These capabilities focus on delivering a modernised technology architecture, building an integrated payments platform, creating a data-driven organisation and implementing reimagined ways of working. Strategic execution in 2021, supported by increased investment, is underpinned by long-term strategic vision in these customer segments and capabilities.
Enhancingour
Capabilities

Strategic reportFinancial results
Governance
Risk manag
ement
Financial statements
Other inform
ation
KEY MILESTONES FOR THE GROUP IN THE PAST DECADE
Lloyds Banking Group Annual Report and Accounts 2020 11
OutlookThe impact of the coronavirus pandemic on the people, businesses and communities in the UK and around the world continues to be profound. Significant uncertainties remain, specifically relating to the pandemic and the speed and efficacy of the vaccination programme. I remain confident that the Group’s clear purpose, unique business model, significant competitive advantages and the customer focused evolution of our strategy we have announced in Strategic Review 2021 will ensure that the Group is able to Help Britain Recover and in so doing, help transition to a sustainable economy.
António joined the Board and launched the first Group Strategic Review First Group Strategic Review with the clear aim to become the best bank for customers.
Developed a clear strategic focus António set out a clear focus on becoming a simple, low risk, customer focused UK bank with significantly reduced risk-weighted assets, lower reliance on short-term funding, strong asset quality and capital levels, and a new executive team.
The strategy focused on supporting the real economy of the UK, in the retail, commercial and insurance areas.
Launch of Helping Britain Prosper Plan, and Group Strategic Review 2 Alongside the next phase of the strategy, the Group launched the Helping Britain Prosper Plan to address some of the social, economic and environmental challenges facing the UK. The Plan took us beyond business as usual, uniting the Group behind an inspiring set of objectives.
Recognising the importance of digital We became the first UK bank to have a digital division, reporting directly to the Chief Executive.
First dividend in six years announced Returning the Group to profitability with over £12 billion to date returned to shareholders since dividends were resumed in 2014.
Completion of the Group Strategic Review 2 GSR2 enabled the Group to become the largest digital bank in the UK while delivering a simple, low risk, customer focused, UK retail and commercial bank.
Partnership with Mental Health UK Drawing on his own personal experiences, António shone a spotlight on the importance of good mental health, both within the Group and across the UK corporate world, helping to break down stigmas.
The Group has raised over £13 million for Mental Health UK to date.
Lloyds Banking Group returns to private ownership In May 2017, the Government completed the sale of their shares and the Group returned to private ownership.
Launch of Group Strategic Review 3
Completion of the Group Strategic Review 3 An ambitious plan, with significant additional investment, successfully delivered a leading customer experience; further digitised the Group; maximised the Group’s capabilities; and transformed ways of working.
Largest digital bank in the UK 17.4 million digitally active customers and 12.5 million mobile app users, alongside the largest branch network in the UK.
Launch of Strategic Review 2021
2011 2014 2017 2020
The Group faces the future with confidence. This is reflected in our guidance for 2021, based on our current macroeconomic assumptions:
Net interest margin to be in excess of 240 basis points
Operating costs to reduce further to c.£7.5 billion
Net asset quality ratio to be below 40 basis points
Improving profitability with statutory return on tangible equity of between 5 and 7 per cent (on the new basis)
Risk-weighted assets in 2021 to be broadly stable on 2020
Intention to accrue dividends and resume progressive and sustainable ordinary dividend policy
I would like to again express my thanks to all of my colleagues, without whom the Group's customer focus, resilient financial performance and significant strategic transformation, achieved in very challenging circumstances, would not have been possible.
António Horta-Osório Group Chief Executive
Built the largest digital bank in the UK while maintaining the largest branch network Simplified, UK-focused business model with presence in 6 countries, down from 30 countries in 2011 Committed to Helping Britain Prosper and deepening our support for communities across the UK
Significant improvement in customer satisfaction levels Integrated multi-brand, multi-channel model Significant dividends for shareholders and full repayment to the taxpayer Delivered a financially strong business with lower costs as a competitive advantage and superior levels of investment Targeted and strategic growth
Led the conversation on mental health in the workplace Increasingly engaged workforce First FTSE 100 company to set a public goal on gender diversity in 2014 and 2018, the first FTSE 100 company to target an increase in the proportion of Black, Asian and Minority Ethnic colleagues
Overview: Transformed the business from 2011 to 2020

12 Lloyds Banking Group Annual Report and Accounts 2020
OUR PURPOSE
Helping Britain ProsperThe Group has a clear ongoing purpose of Helping Britain Prosper, and given the considerable impact of the pandemic, the current focus is on Helping Britain Recover.
We aim to help our customers, clients, colleagues and communities get through the crisis and back on their feet, while delivering long-term sustainable success for shareholders.
OUR CULTURE
Our core values underpin our purpose to Help Britain Prosper Ensuring we create the right environment for our colleagues to deliver our aim to become the best bank for customers, colleagues and shareholders:
Putting customers first Keeping it simple Making a difference together
Our business model
How we create value, and what sets us apart
OUR GROUP
A unique customer proposition Enabling us to serve the financial needs of customers in one place. We operate multiple brands through three core divisions: Retail, Commercial Banking and Insurance and Wealth.

Strategic reportFinancial results
Governance
Risk manag
ement
Financial statements
Other inform
ation Lloyds Banking Group Annual Report and Accounts 2020 13
OUR BUSINESS MODEL
We are a customer focused, sustainable, efficient and low risk UK financial services leader with distinctive capabilities
Multi-brand, multi-channel proposition with the UK's largest digital bank and branch networkOperating in an integrated way through a range of distribution channels and brands ensures our customers can interact with us when and how they want and enables us to address the needs of different customer segments more effectively.
Differentiated and sustainable customer franchise with leading integrated propositionsOur scale and reach across the UK means that our franchise extends to over 25 million customers, with 17.4 million digitally active. We are uniquely positioned to serve our customers’ banking, insurance and wealth management needs in one place through a comprehensive product range informed by customer analysis and insight.
Market leading efficiency through tech-enabled productivity improvementsOur simpler operating model and continued focus on efficiency provide a cost advantage, enabling us to invest more to the benefit of both customers and shareholders.
Prudent, low risk business with strong capital positionBeing low risk is fundamental to our business model. Our low risk appetite is reflected through the quality of our loan portfolio and underwriting criteria. Our financial strength has been transformed in recent years and our capital position is strong.
Rigorous execution and management discipline Experience of delivering change in recent years provides benefit as we further transform the business.
Purpose-driven and customer focused cultureOur clear purpose of Helping Britain Prosper is driving the business and our current focus on Helping Britain Recover is at the heart of our evolution of strategy.
Inclusive and diverse organisationBeing one of the largest employers in the country, we will further focus on developing an inclusive, diverse, skilled and future-ready workforce.
Sustainable and superior
returns
Creating competitive advantages We believe that these capabilities provide significant competitive advantage. The Group's significant investment in transformation and digital in recent years, enabled by our efficiency, has positioned us well. Continued investment will remain important to further build this advantage and enable us to continue to deliver for customers while also delivering sustainable and superior returns over the longer-term, as outlined on the accompanying diagram.
RISKS TO OUR BUSINESS MODEL
As a large, UK focused financial services provider we face several external and internal challenges:
The main external challenges we face are discussed on pages 32 to 35
Unprecedented societal demands
Macro economic environment to remain challenging and uncertain
Accelerated shift to digital and new capabilities
Step change in ways of working
We also face a number of internal challenges:
Repositioning and growing the business to deliver revenue generation and diversification
Meeting demand for more personalised value added solutions
Using technology to deliver step change in efficiency and agility
Attracting, developing and retaining the best talent to respond to new ways of working
We recognise these challenges to our business model and strategy and regularly review the associated risk implications, to enhance our sustainability over the longer-term. For further details on the risks associated to our strategy, please refer to pages 56 to 59.
As we enter the next phase of our strategy we will build on these capabilities and accelerate the Group's transformation to become the UK's preferred financial partner
Market leading efficiency
Greater investment capacity
Improvement to customer experience
Enhancements to internal processes
Net cost reduction

14 Lloyds Banking Group Annual Report and Accounts 2020
FINANCIAL
Key performance indicators
Resilient business model in a challenged economic environment
Underlying profit before tax£m
2,193
Statutory profit after tax£m
1,387
2016120171201820192020 2,193
7,5318,0667,6286,782
20162017201820192020 3.7
7.811.78.96.6
20161
20171
20181
20191
2020 16.213.813.913.913.0
20161201712018120192020 1,387
3,0064,5063,6492,605
20162017201820192020 0.57
1.123.213.052.55
Our performance2020 was a difficult year, with the effects of the coronavirus pandemic and lower interest rates impacting our financial performance, in line with the banking industry as a whole.
Although the economic outlook remains uncertain, our financial strength and business model will ensure that the Group can continue to support its customers and Help Britain Recover.
Pay for performance across the GroupKey performance indicators are regularly reviewed by the Board and the Group Executive Committee, to evidence performance against the Group’s most important priorities. These include measures for assessing financial and non-financial performance, balancing the interests of various stakeholders including customers, shareholders and colleagues.
To ensure colleagues act in the best interests of customers and shareholders, variable remuneration at all levels across the Group is aligned to these priorities and takes into account the Group’s financial performance and specific conduct and risk management controls.
All the key performance indicators shown here directly impact remuneration outcomes and support the delivery of our reward principles.
In 2021Further to stakeholder feedback we are looking to further simplify and enhance the single balanced scorecard used for performance assessment, the bonus (Group Performance Share) and the Long Term share plan in 2021. The new balanced scorecard has been aligned to our strategic priorities and has been structured to incentivise the right behaviours and results. The weighting for financial performance has been increased to 50 per cent while the number of measures in the balanced scorecard has been reduced from 15 to 7 to ensure greater focus and simplicity.Our 2021 balanced scorecard
Financial (50%)- Statutory Profit After Tax (20%)
- Statutory ROTE (20%)
- Operating Costs (excl. remediation) (10%)
Strategic (50%)- Reducing operational carbon emissions (7.5%)
- Increasing our gender and ethnic representation in senior roles (7.5%)
- Group Customer Dashboard – our assessment of how effectively we are serving customers across all brands, products and services (25%)
- Colleague engagement – our performance relative to external benchmark scores (10%)
The statutory return on tangible equity was lower in 2020 given the lower statutory profit, largely due to increased impairment charges and lower income.
In 2021, to aid comparability with peers, we will report return on tangible equity without adding back the post-tax amortisation of intangible assets.(2020 return on tangible equity would have been 2.3 per cent on the new basis).
Ordinary dividendp per share
0.57
20162017201820192020 55.3
48.549.351.855.3
The Group's cost:income ratio deteriorated in the year, driven by lower income, but remains market leading.
In 2021, this key performance indicator will be replaced by operating costs (excl. remediation). This will align to our 2021 balanced scorecard.
Cost:income ratio%
55.3
Statutory return on tangible equity%
3.7
Common equity tier 1 ratio (CET1)%
16.2
Statutory profit after tax was lower in 2020, largely due to increased impairment charges and lower income.1 Restated to reflect amendments to IAS12.
Underlying profit before tax was lower in 2020, reflecting lower net income and higher impairment charges, partly offset by the Group’s continued progress in cost reductions.1 Restated to include remediation
Ordinary dividend per share, given the Group’s strong capital position dividends have resumed at the maximum allowed under the Prudential Regulation Authority's temporary framework on 2020 distributions.
Ongoing target: c.12.5 per cent plus a management buffer of c.1 per cent
Our common equity tier 1 ratio remains strong and is significantly in excess of our current target and regulatory requirement.1 Reported on a pro forma basis, reflecting the
dividend paid up by the Insurance business and declared share buybacks in 2017 and 2018.

Strategic reportFinancial results
Governance
Risk manag
ement
Financial statements
Other inform
ation Lloyds Banking Group Annual Report and Accounts 2020 15
20162017201820192020 (42)
27(20)14
(10)
20162017201820192020 688
3,1383,2913,9873,377
Economic profit£m
688
Total shareholder return%
(42)
Economic profit, a measure of profit taking into account expected losses, tax and a charge for equity utilisation. Economic profit in 2020 was impacted by lower net income received in the year.2020 basis has been amended in line with changes to reward scheme performance measures, on equivalent basis to prior years 2020 economic profit would be £1,197 million
Total shareholder return reflects share price performance and dividends paid. Our share price decreased significantly in 2020, in line with other UK banks, with no dividend payable in the year given the regulatory restrictions.
NON-FINANCIAL
20162017201820192020 68.0
66.063.465.062.7 2016
2017201820192020 17.4
16.415.713.412.5
Customer satisfaction(all channel net promoter score)
68.0
Digitally active customers£m
17.4
20162017201820192020 17/22
20/2220/2221/2220/24
Helping Britain Prosper Plan targets achieved
17/22
Our all channel net promoter score measures the customer perception of day-to-day services across our channels. In 2020, we have seen record satisfaction with an uplift of 2 year-on-year. This encompasses positive contributions from Branch and Digital, with customers appreciating the service provided.
This measures how well we are delivering a leading customer experience. It tells us how effective we are in building strong customer relationships.Historical scores restated to reflect changes in measurement approach
Reflecting the pace of digital adoption, the number of active digital customers increased in the year to 17.4 million, with 12.5 million mobile banking app customers and average customer logons at 26 times per month.
This indicates the progress we are making in digitising the Group from the customer usage standpoint.
We have made strong progress since we launched the Plan in 2014. In 2020, we have seen the impact of the pandemic reflected in our Helping Britain Prosper plan performance with selected areas unable to reach their targets. This has resulted in the Group achieving 17 out of 22 targets for 2020. Find out more on pages 20 to 31.
H1 2018H2 2018H1 2019H2 2019H1 2020 2.6
3.02.93.43.9 2016
2017201820192020 81
74737671
Customer complaintsFCA reportable complaints per 1,000 accounts
2.6
Employee engagement index% favourable
81
20192020 >£7.3
>£4.9
Green finance£bn (cumulative)
>7.3
FCA reportable complaints excluding PPI and claims management companies have significantly reduced over the last five years.
We do make mistakes, but when this happens, we work hard to fix the issue quickly for the customers involved and learn from any mistakes.
From a strategic perspective, reduction in customer complaints confirms our achievements in delivering a leading customer experience.H2 2020 data not available at time of publishing.
Employee engagement is at an all time high and was six points above the norm for top performing UK companies with increases in scores for advocacy, pride and satisfaction. Colleagues were also positive about their wellbeing, process improvements and performance management. Preferences on working arrangements were also captured in our Autumn survey and will inform future working styles.
This indicates how much progress we are making in transforming ways of working.
In 2020, we provided over £2.3 billion of green finance in Commercial Banking, through our Clean Growth Finance Initiative, Commercial Real Estate Green Lending Initiative, Renewable Energy Financing and Green Bond facilitation. This increased our total green finance to over £7.3 billion since 2016. In addition, we have supported clients with over £1.8 billion of Sustainability Linked Loans since 2017.

16 Lloyds Banking Group Annual Report and Accounts 2020
Group Strategic Review 3 priorities
Leading customer experience
Digitising the Group
Maximising Group capabilities
Transforming ways of working
The largest digital bank in the UK, with our digitally-active customer base of 17.4 million up over 30 per cent since 2017
Maintained the UK’s No.1 branch network
Improved customer satisfaction, with digital net promoter score increasing by 2 per cent vs. 2017 to an all-time high of 67
Read more on page 18
78 per cent of cost base covered by digitisation, while progressively modernising and simplifying our IT architecture
>£4 billion cumulative technology spend 2018 - 2020
Read more on page 18
Over £6 billion of net lending to start-ups, SMEs and Mid Market customers since 2018, comfortably exceeding our cumulative 3 year target
1.5 million new pension customers
£46 billion cumulative growth in open book assets under administration since the end of 2017, despite challenging market conditions during 2020
Read more on page 19
5.3 million cumulative additional future skills training hours delivered
65 per cent of change delivered by agile methodologies
Read more on page 19
Our progress in building a sustainable and responsible business
2018 – 2020: What we have achieved over the last three years
We have invested around £2.8 billion in our strategic priorities across four pillars over the past three years, with this investment helping us deliver significant progress in our ongoing transformation of the Group for success in a digital world.
2018 – 2020

Strategic reportFinancial results
Governance
Risk manag
ement
Financial statements
Other inform
ation Lloyds Banking Group Annual Report and Accounts 2020 17
Our Helping Britain Prosper priorities
Helping the transition to a sustainable low carbon economyAverage number of homes that could be powered as a result of our support of UK renewable energy projects
10.1 million
Tackling social disadvantage across BritainNumber of charities we supported in 2020 as a result of our £100 million commitment to the Group’s independent charitable Foundations
2,787
Helping people save for the future Growth in open book assets that we hold on behalf of customers in retirement and investment products3
£45.6 billion
Building capability and digital skills Number of individuals, SMEs and charities trained in digital skills, including internet banking
1.8 million
Supporting businesses to start up and grow Increased amount of net lending to start up, SME and Mid Market businesses
>£6 billion
Helping Britain get a homeAmount of lending committed to help people buy their first home
£39.7 billion
Championing Britain’s diversity
Addressing some of the social, economic and environmental challenges facing the UK was the foundation of our Helping Britain Prosper Plan. Below are the impacts achieved since 2018 against our seven priority performance areas. Further information on progress in each of the priorities can be found on pages 20 to 31 and in our 2020 Lloyds Banking Group ESG Report.
Percentage of senior roles held by Black, Asian and Minority Ethnic colleagues in 2020
7.7 per cent1
Percentage of roles held by Black, Asian and Minority Ethnic colleagues in 2020
10.6 per cent1
2018 – 2020
Read more on pages 20 to 23
Read more on page 27
Read more on pages 25 to 26
Read more on page 28 Read more on page 27
Read more on page 29 Read more on page 28
Percentage of senior roles held by women in 2020
37 per cent1
1 2020 Indicator is subject to Limited ISAE3000 (revised) assurance by Deloitte LLP for the 2020 Annual Responsible Business Reporting

18 Lloyds Banking Group Annual Report and Accounts 2020
Leading customer experience
Digitising the Group
In line with our purpose of Helping Britain Prosper, our primary focus during the current pandemic has been to support and do what is right for our customers. Despite this challenging backdrop, we have successfully built on our track record of strengthening our propositions and improving the experience of both our personal and business customers during the course of 2020.
Improving the experience of our personal customersCOVID-19 has accelerated the shift towards digital for everyday banking needs. We are the largest digital bank in the UK and have seen our digitally-active customer base increase by 6 per cent to 17.4 million customers, while our active mobile app users have also increased by nearly 2 million to 12.5 million customers. We have continued to enhance our digital propositions, with a focus on speed, convenience, personalisation and control. These include the broadening of our unique Single Customer View functionality to include stockbroking portfolios, biometric functionality to authorise payments through the mobile banking app, more personalised customer communication and navigation within digital apps, and enhanced control features, such as upcoming payment notifications and ’confirmation of payee’ functionality, to protect against fraud. As a consequence, we have seen our digital and all channel customer satisfaction scores continue to improve and reach respective all-time highs of 67 and 68.
Improving the experience of our business customersBusiness customers are also turning to digital channels for everyday needs, while continuing to value human interaction for more complex needs. We have proactively supported approximately 60,000 business customers via our Client Outreach Programme, while also improving the digital propositions available to them. Amongst other developments, we were the first bank globally to implement ’SWIFT GPI Instant’ to increase the speed and transparency of cross-border payments. In addition, we launched a Green Building Tool to help customers make their properties more energy-efficient, as well as a pilot Business Finance Assistant tool designed to help clients save time on financial admin and manage their finances more effectively.
Our ongoing focus on transforming the business and investing in digital have enabled us to respond effectively to the accelerating shift to digital channels brought about by the COVID-19 pandemic, with the benefits of this investment evidenced throughout the crisis.
Delivering for customersThe proportion of products originated via digital channels increased significantly in 2020, up 10 percentage points to 85 per cent, the highest level to date. Despite increased usage, this was not at the expense of customer satisfaction where net promoter scores reached an all-time high, as ongoing investment in systems and functionality meant that we were able to meet the increased customer demand, while also adapting our offering to make it easier for our customers to perform activities online. For example, we doubled the size of cheque scanning limits for our customers, resulting in a more than 80 per cent increase in the number of cheques deposited by our retail customers.
Continued adoption of new technologies In addition, we have continued to increase our adoption of new technologies and these have allowed us to support our customers at pace. As an example, we have used robotics to process over 90 per cent of Bounce Back Loan applications and, through this, have created significant colleague capacity during a period of increased demand. The use of technology has also created opportunities to further improve operational efficiencies as we modernise our IT and data architecture and improve processes at the same time as prioritising our technology based investment. By the end of 2020, 78 per cent of our cost base was covered by digitisation. This compares to our original GSR3 target of 70 per cent and represents nearly a five and a half fold increase versus the equivalent figure of 12 per cent at the end of 2017. In addition, we have continued to make progress on migrating applications to cloud solutions.
Key Objectives 2018 to 2020
Remain number 1 UK digital bank with Open Banking functionality Unrivalled reach, with UK’s largest branch network serving complex needs Data-driven and personalised customer propositions
Key Objectives 2018 to 2020
Deeper end-to-end transformation targeting 70 per cent of our cost base Simplification and progressive modernisation of our data and IT infrastructure Technology enabled productivity improvements across the business
Personalising our customer experience We are improving the experience of our customers through the combination of new technological capabilities and our extensive data insights. Using real time customer triggers and predicted needs, based on machine learning, we are now able to deliver enhanced navigation within our digital apps as well as more timely, relevant and co-ordinated communications across email, SMS and within apps that are specifically tailored our customers’ individual needs
Our progress in building a sustainable and responsible business continued
Progress in 2020
2020: Progress against our strategic priorities
Supporting our customersThrough the use of robotics over 300,000 Bounce Back Loans have been approved with a total value of over £9 billion and an approval rate of around 97 per cent
Without our robotics capability, we wouldn’t have been able to provide such timely support to our customers at a time when they needed it the most.
Lloyds Banking Group colleague

Strategic reportFinancial results
Governance
Risk manag
ement
Financial statements
Other inform
ation Lloyds Banking Group Annual Report and Accounts 2020 19
Maximising Group capabilities
Transforming ways of working
We have continued to make strong progress in meeting our personal customers’ growing financial planning and retirement needs, while continuing to support our Commercial Banking clients through increased lending and further customer proposition improvements.
Meeting our customers’ growing financial planning and retirement needsIn 2020 we increased the number of customers with access to our unique Single Customer View capability by approximately 1.5 million to c.6.5 million, but did not achieve our original target of extending this to 9 million customers, due to our revised focus on more immediate customer priorities in light of COVID-19. We also expanded the scope of Single Customer View to include Halifax Share Dealing so that customers with this functionality are now able to view their pensions and investment portfolios alongside their banking products. Separately, we also launched an equity release product via our Scottish Widows brand, through which customers can access equity in their homes to help family members get onto the housing ladder or supplement their own retirement income. While the pandemic has caused some delays, our ambition for Schroders Personal Wealth to become a top three UK financial planning business remains unchanged, although we now expect to achieve this by 2025.
Improving the experience of our Commercial Banking clientsWe have actively supported our Commercial Banking clients throughout the COVID-19 crisis. In 2020 we achieved our gross lending commitment to businesses of £18 billion and comfortably exceeded our cumulative three year target of increasing net lending to start-ups, SME and Mid Market clients by £6 billion. In addition, we extended our support for business clients who trade overseas by successfully completing the Bank’s first UK Export Finance backed Export Development Guarantee transaction, participating in the completion of transactions with a total syndicated value of £4.4 billion to support clients with their trading ambitions. We have also launched a number of new client propositions. These include our Payables API proposition, ’PayTo’, which has seen rapid client uptake, having processed around 500,000 transactions totalling over £2 billion over the course of the year, as well as a 25-fold increase in the value of transactions processed between the first and fourth quarters.
The COVID-19 pandemic is having significant implications for our colleagues. These include accelerating the transition to new ways of working for the majority of the Group while also challenging the skills that we have sought to develop over the course of this strategic plan. This significant change has also increased our focus on our broader workforce proposition, ensuring our colleagues feel valued and engaged in an uncertain environment.
New ways of workingSince March, more than 50,000 colleagues have worked remotely as a result of the pandemic. In order to facilitate this and to improve colleague experiences of working from home, we have enabled the distribution of over 100,000 office items to our colleagues’ homes. In addition, we increased our adoption of remote working tools to increase collaboration and support more agile working practices. At the height of the crisis, we also demonstrated significant operational agility by rapidly redeploying over 2,500 colleagues to customer support functions to respond to elevated customer demand.
In addition to physical and technological support, we have also prioritised the mental health of our colleagues in a period of significant uncertainty and change with regular check-ins throughout the year and increasing access to a number of wellbeing tools. For example, over 14,000 colleagues have made use of the mindfulness app, Headspace, for which the Group provides a free annual subscription.
Delivering the skills for the future Despite significant levels of change during the year, we remain focused on ensuring our colleagues have the skills to deliver our longer-term transformation aims and, as such, have continued to invest in their development. We delivered an additional 2.1 million training hours to develop the skills for the future in 2020, taking the total to a cumulative 5.3 million over GSR3, surpassing our target for this strategic plan.
Key Objectives 2018 to 2020
50 per cent increase in training and development to 4.4 million hours Up to 30 per cent change efficiency improvement
Key Objectives 2018 to 2020
>£50 billion growth in financial planning and retirement open book assets under administration >1 million new pensions customers >£6 billion of additional net lending to start-ups, SMEs and Mid Market customers
Progress in 2020
Improving customer experienceOur PayTo payments proposition enables our Commercial Banking clients to make single Faster Payments directly from their own systems in less than a second, via a secure, direct connection with the Bank, and without human intervention. Since launch, PayTo has processed around 500,000 transactions totalling over £2 billion, with its real-time response also enabling our clients to significantly improve their own working capital management as well as the experience of their customers.
Delivering for each other and our customersThroughout the year our colleagues have done a brilliant job of making the best of this situation by adapting at speed and continuing to deliver for our customers and each other. As we consider how our business can thrive in whatever the new world may look like, we’re also seizing the opportunity to pause, learn from our experiences and reimagine how we all might work in the future.
I have worked for the Group for over 20 years and I have never been prouder to say that I work for Lloyds Banking Group; the support for staff (and in turn our customers) throughout the pandemic has been simply exceptional
Lloyds Banking Group colleague

20 Lloyds Banking Group Annual Report and Accounts 2020
Helping Britain transition to a sustainable low carbon economy
E S G
We have provided indicators next to each area of performance to provide the reader with clear guidance as to which aspect of our ESG performance the section supports as well as an indication of the United Nations Sustainable Development Goals (SDGs) that we support through our activities. Through both our Helping Britain Prosper Plan (HBP) and wider responsible business activities, we’re actively supporting the UN’s sustainable development agenda, working towards the SDGs.
E Environmental Our environmental indicator relates to areas of our performance which have an environmental impact.
S Social Our social indicator relates to areas of our performance indicating our management of relationships with employees, suppliers, customers, and the communities within which we operate.
G Governance Our governance indicator relates to areas of performance that support good governance practices and facilitate Lloyds Banking Group being considered a responsible business.
This section contains certain disclosures in alignment with the recommendations of the Task Force on Climate-related Financial Disclosures (TCFD). Additional TCFD related disclosures can be found in the Lloyds Banking Group ESG Report.
Our unique position within the UK economy means that the successful transition to a more sustainable, low carbon economy is of strategic importance to us. We support the aims of the 2015 Paris Agreement, the UK Government’s Net Zero target and Ten Point Plan for a Green Industrial Revolution; and the recommendations of the TCFD.
The economic recovery required post-COVID-19 provides a critical opportunity to drive Clean Growth and ensure that the UK’s decarbonisation requirements sit at the heart of the UK’s policy framework. In 2020, we joined over 200 businesses, investors and business organisations in calling on the Government to deliver a clean, inclusive and resilient recovery plan. The Group produced a separate document outlining why we believe prioritising a green recovery is critical and the priority areas we thought should feature within any economic stimulus plan.
Our strategyOur goal and approachAs a signal of our commitment we set an ambitious goal in 2020, working with customers,
Government and the market to help reduce the emissions we finance by more than 50 per cent by 2030, on the path to net zero by 2050 or sooner, which will support the UK Government's ambition and the 2015 Paris Agreement. During the course of 2020, we have calculated an initial estimate of our 2018 financed emissions baseline and we developed our first emission intensity reduction ambition for the power sector, the decarbonisation of which is critical to the UK achieving its climate targets. We will continue to develop additional sector specific ambitions throughout 2021.
In addition, the Insurance and Wealth division (excluding Wealth Private Banking) have published a target to reach net zero across our full portfolio of investments by 2050, halving their investments’ carbon footprint by 2030.
More detail is provided in the metrics and targets section (see page 22).
In order to meet our overall 2030 and 2050 goals, we will continue to:
Identify new ways to support our customers and clients with the management of opportunities and risks associated with climate change, and the transition to a low carbon economy. Identify, manage and disclose material sustainability and climate-related risks across the Group and their impacts on the Group and its financial planning processes, in line with the TCFD framework. This includes working with industry bodies, specialist consultancies and leading academics to develop a robust climate risk measurement capability. Use our scale and reach to help drive progress towards a sustainable and resilient UK economy through engagement with customers, communities, industry, Government, shareholders and suppliers. Embed sustainability into the way we do business and manage our own operations in a more sustainable way. To support this we have updated our operational climate pledges, setting a new net zero goal for 2030 (see page 22).
We participate in several industry initiatives and have signed up to key principles that drive action on climate change and sustainability, which are detailed in our Lloyds Banking Group ESG Report.
Recognition of activityTo address the increasing needs of our stakeholders, and to enhance our ESG disclosures we have included a full table of the Group’s performance against various ESG indices, which includes our 2020 CDP (formerly Carbon Disclosure Project) rating, in the Lloyds Banking Group ESG Report.
Risk managementThe Group has adopted a comprehensive approach to embedding climate-related risks into our Enterprise Risk Management Framework through:
Creation of a new principal risk for climate risk, in order to drive dedicated focus and a consistent approach, whilst enhancing Board-level insight
Highlights We continue to make progress in implementing our financed emissions reduction ambition on the path to net zero by 2050 or sooner, working with customers, Government and the market to help reduce the emissions we finance. We calculated our initial estimated view of 2018 financed emissions baseline and developed our first emissions intensity reduction ambition for the power sector. We continue to make progress in the implementation of the recommendations of the Taskforce on Climate-related Financial Disclosures (TCFD). We have developed three new operational climate pledges which will accelerate our plan to tackle climate change and apply across our operations. We have launched several new green finance products, tools and services in the year.
Our progress in building a sustainable and responsible business continued
Our Helping Britain Prosper Plan has served to unite the Group behind an inspiring set of environmental and social impact ambitions which have enabled us to provide significant support for key areas where we believed we could make the biggest difference as a Group. The Helping Britain Prosper plan is underpinned and supported by various additional Environmental, Social and Governance (ESG) performance areas which form a firm foundation for the Group to be a responsible, inclusive, ethical and sustainable company.
For the 2020 reporting period, we have included updates on our Helping Britain Prosper plan objectives as well as disclosing additional ESG aspects of our performance to reflect the evolving information needs of our stakeholders.
Our 2020 performance on our 7 priority Helping Britain Prosper areas can be identified in the following text by this indicator
Selected disclosures related to good governance practices that support conducting our business in a responsible manner are included in this report. Further disclosures related to the governance of the Group can be found on page 86.
We have produced a supplementary ESG Report on our performance in 2020 which contains further details on all disclosures included in this section which is available on our webpage.
Progress in 2020
E S G
2020: Progress in environmental and social performance

Strategic reportFinancial results
Governance
Risk manag
ement
Financial statements
Other inform
ation Lloyds Banking Group Annual Report and Accounts 2020 21
OUR AMBITION
We set ourselves seven leadership ambitions to support the UK’s transition to a sustainable future:
BusinessBecome a leading UK commercial bank for sustainable growth, supporting our clients to transition to sustainable business models and operations, and to pursue new clean growth opportunities
HomesBe a leading UK provider of customer support for energy efficient, sustainable homes
VehiclesBe a leading UK provider of low emission/green vehicle fleets
Pensions and investmentsBe a leading UK pension provider that offers our customers and colleagues sustainable investment choices, and challenges the companies we invest in to behave more sustainably and responsibly
InsuranceBe a leading UK insurer in improving the resilience of customers’ lives against extreme weather exacerbated by climate change
Green bondsBe a leading UK bank in the green/sustainable bonds market
Our own footprintBe a leading UK bank in reducing our own carbon footprint and challenging our suppliers to ensure our own consumption of resources, goods and services is sustainable
How we are delivering against our ambitions In 2020, we have focused on enhancing our green finance products and services to achieve our ambitions. Examples of this include the following.
Since 2018 the Group has supported renewable energy projects that could power the equivalent of 10.1 million homes, significantly exceeding our Helping Britain Prosper Plan 2020 target We launched several new green finance products, tools and services: a Lloyds Bank and Bank of Scotland Green Buildings Tool; a
Sustainability Fixed Term Deposit and 95 Day Notice Account; and we also structured and co-ordinated the first Sterling Overnight Index Average (SONIA) Sustainability Linked Loan for Affinity Water
We launched our Green Living and Eco Home Hub for Halifax and Lloyds customers To support Halifax customers with the cost of green home improvements, we have also
introduced a Green Living Reward under the UK Department for Business, Energy and Industrial Strategy (BEIS) Green Home Finance Innovation Fund
In 2020, we more than doubled the number of electric vehicles financed through our Motor Finance and Leasing subsidiaries, Lex Autolease and Black Horse
We have launched our Responsible Investment Framework in March 2020 and our supporting Stewardship Policy Our Exclusions Policy focuses on companies that have failed to meet our environmental, social and governance standards, namely manufacturers of controversial weapons, UN Global Compact violators and those deriving more than 10 per cent of their revenue from thermal coal and tar sands extraction. We are currently divesting an initial £440 million from these companies, starting with those investments where we have direct control and are working to expand the application of this policy into external pooled funds that underpin our multi-asset funds as well. Early success of our engagement with one of our
partner asset managers has led the investment manager to introduce an exclusions policy for all their Europe-domiciled passive funds totalling over £20 billion, leading to an additional divestment of approximately £280 million within our customer pension portfolios Through our shareholder investments we provide direct loans for renewable energy, including for offshore wind and solar energy We are also investing £2 billion of our Pension and Retirement Portfolio Pension Funds into a new fund, the ACS Climate Transition World Equity Fund, co-created with BlackRock that looks to increase investment in companies that are well prepared for the low carbon transition and to reduce exposure to those that are less so
We continue to partner with RedArc to operate a trauma helpline that aids customers needing extra help after a traumatic claim such as a fire or flood
We are also investing in ways to minimise the impact of flooding on our customers. For example, we continue to provide a Rapid Response Vehicle to quickly assess claims and release funds to customers in the worst affected areas
Since the launch of this ambition in 2016, we have maintained our role as a leader for our UK corporate clients between 2016 and 2020, raising around £2.9 billion.
We continue to improve the sustainability of our own operations and have recently updated our operational climate pledges (see page 22) This year we have calculated and disclosed the emissions associated with increased homeworking as a result of COVID-19, and sponsored a white paper in this area
We have continued to reduce the energy and carbon intensity of our properties and have supported low carbon travel Our overall location-based carbon emissions were 159,487 tonnes CO2e; a 24 per cent decrease since 2019 and 72 per cent since our 2009 baseline (legacy scope)
Progress in 2020
Integration of climate risk into our existing principal risks, to ensure comprehensive consideration across all aspects of our business activity.
Climate Risk is included as both a principal and emerging risk this year given it is such a new and fast moving area. We continue to ensure our approach for climate risk management has suitable Board-level visibility. The Board has approved a Risk Appetite Statement for climate risk, as well as an interim metric to ensure the Group continues to progress activities at pace,
supported by Board-level risk reporting.
As the understanding and importance of climate risk progresses, climate scenario analysis is becoming an essential capability and risk management tool. Scenario analysis assists the identification, measurement and ongoing assessment of climate risks over the longer-term, and the potential threats to the Group’s strategic objectives. In 2020, the Group has developed its climate scenario analysis framework and will see outputs from this in 2021.
To further accelerate progress, we have engaged with third-party consultants to support the development of our climate risk management framework and high priority sector analysis, thereby extending our modelling and assessment capabilities for quantifying climate risk.
Climate risk and sustainability has been a key consideration in the credit assessment process in recent years, and in 2020 we have deepened the integration of sustainability into our credit risk processes and appetite statements. We

22 Lloyds Banking Group Annual Report and Accounts 2020
OUR ENVIRONMENTAL AND SOCIAL PERFORMANCE
continue to refine the Group’s external sector statements, which help articulate appropriate areas of climate-related risk appetite and our approach to the risk assessment of our customers. For more information on the Group’s external sector statements see page 24.As part of the Group's credit risk policy, we have mandatory requirements to consider environmental risks in key risk management activities. In Commercial Banking, Relationship Managers must continue to ensure that sustainability risk is considered for all new and renewal facilities, and specifically commented on where credit limits exceed £500,000. We have also developed and are piloting a tool in Commercial Banking to help qualitatively assess our clients’ physical and transition risks.In Retail, we consider exposure to physical risks, such as flooding, in our mortgages origination criteria and we have also introduced sustainability related criteria into our motor finance businesses. Within Insurance, an assessment of climate-related risks to General Insurance (GI) liabilities is integrated into the internal model governance process. We further developed our weather modelling capabilities in 2020 through completion of a research partnership between the Group's GI Weather Modelling Team and the University of Reading on extreme wind and flood risk in the UK.Sectors with increased climate riskThe Group has identified those sectors where we have lending to customers that may likely contribute a higher share of Lloyds Banking Group’s financed emissions (see Table 1). Not all customers in these sectors have high emissions or are exposed to significant transition risks. As discussed within our disclosure, we continue to enhance and refine this work at both counterparty and sector level, considering both risks and opportunities as we look to support our customers' responses to climate change.
Metrics and targetsFinanced emissions Lloyds Banking Group believes it is appropriate to provide more financial information on our financed emissions, although we also recognise this is a rapidly developing area, with evolving and sometimes limiting data availability, data completeness and calculation methodologies. We expect these to continue to improve in
2021 and beyond, helping us to refine our approaches, estimates and understanding of the climate risk within Lloyds Banking Group’s portfolios. However, in order to enhance disclosure, whilst recognising these limitations, we detail in Table 2 an initial estimated view of the 2018 financed emissions baseline across the Group’s own lending activity (excluding Insurance and Wealth).This will serve as an initial basis for our goal of helping to reduce the emissions we finance by more than 50 per cent by 2030 and to help us better support customers in their transition plans to a low-carbon economy (see Table 2). We selected 2018 as there is more comprehensive company emissions reporting and UK Government Office of National Statistics (ONS) emissions data available at that time.We have used the emerging industry standard for calculating financed emissions developed by the Partnership for Carbon Accounting Financials (PCAF). The baseline is an estimate, as client or asset level emissions data is currently not available in all cases and where appropriate, we have used internal and external data and proxies to fill these data gaps. Given this is a new discipline that will continue to develop and evolve, it is expected that our baseline will change in the future (perhaps materially), which may require restatement. We expect methodologies for calculating financed emissions to mature, with data availability and quality also improving from clients and Government sources.Our initial estimated view of the 2018 financed emissions baseline covers approximately 70 per cent of the Group’s balance sheet (excluding Insurance and Wealth)1 comprised of:
Motor vehicle loans (Lex and Black Horse) – at individual vehicle level, vehicle emission intensity and contracted (or estimated) miles driven per annum
Mortgages (Retail UK Mortgages) – from Energy Performance Certificates (EPCs) where available with estimates used for properties without EPC ratings Business loans (Commercial Banking only) – on client-level emissions data and asset-based estimates using ONS UK sector emissions Cash balances – with no associated emissions
Our progress in building a sustainable and responsible business continued
Helping Britain transition to a sustainable low carbon economy continued
For the remaining balance sheet, 26 per cent currently have no method for calculating emissions and 4 per cent do not have data readily available to enable emissions to be calculated.2
As currently recommended by PCAF, the baseline only includes Scope 1 and 2 emissions of clients and does not include undrawn lending commitments, off balance sheet contingents or areas where there is no methodology.Insurance and Wealth financed emissionsThe financed emissions for the Insurance and Wealth division are not included in the Group’s total financed emissions or the Group’s target to reduce financed emissions by 50 per cent by 2030. Due to the different nature of banking and investment activity, the Insurance and Wealth division will be further developing its approach to reporting appropriate climate metrics and targets during 2021.
Power sector ambitionIn Commercial Banking, we have been working to develop a power sector ambition as power sector decarbonisation is critical for the UK to achieve its Net Zero goal.
We have determined that our power generation portfolio, comprising Commercial Banking large corporate and project finance portfolio facilities, generated financed emissions of 0.7MtCO2e in 2018, with an emission intensity of 141gCO2e/kWh on a drawn basis, covering both UK and EU exposures. This is lower than the UK average grid emissions intensity of 283 gCO2e/kWh in 2018, due to our market leading support for UK offshore and renewable energy.
Having assessed our Commercial Banking large corporate and project finance power generation portfolio against decarbonisation plans and our commitment to Help Britain Prosper, we are now setting an ambition to reduce the portfolio’s emission intensity to less than 75gCO2e/kWh by 2030* This is in line with the UK’s net zero ambition, but takes into account the combination of UK and European clients in our portfolio.*We have followed the PCAF recommendation to only account for drawn lending exposure in our financed emission disclosure. It is important to highlight that the undrawn portion of the power generation portfolio could result in fluctuations to the emission and power intensity baseline.
Achieving our ambition will be dependent on the UK and European countries putting in place the policy frameworks to meet decarbonisation goals and major utilities achieving their decarbonisation objectives. We will work with the Government and our clients to help support this transition.Green financeIn 2020, we provided over £2.3 billion of green finance in Commercial Banking, through our Clean Growth Finance Initiative, Commercial Real Estate Green Lending Initiative, Renewable Energy Financing and Green Bond facilitation. This increased our total green finance to over £7.3 billion since 2016. In addition, we have supported clients with over £1.8 billion of Sustainability Linked Loans since 2017.
New climate pledges for our own operations In 2019 we announced achievement of our 2030 carbon emission reduction goal for our own operations, 11 years early, having reduced carbon emissions by 63 per cent between 2009 and 2019, and exceeding our 60 per cent reduction target. We are now able to announce three new operational climate pledges which
Progress in 2020
GovernanceOur governance structure provides clear oversight and ownership of the Group’s sustainability strategy and management of climate-related risks. Governance for climate-related risks is embedded into the Group’s existing governance structure and is complementary to governance of the Group’s sustainability strategy.
Lloyds Banking Group Board
Divisional forums/ working groups
Group Sustainability forum
Climate Risk Planning & Prioritisation
Climate Risk Executive Management
Group Risk Committee
Board Risk Committee
Group Sustainability team
Group Executive Sustainability Committee
Group Executive Committee
Responsible Business Committee

Strategic reportFinancial results
Governance
Risk manag
ement
Financial statements
Other inform
ation Lloyds Banking Group Annual Report and Accounts 2020 23
OUR ENVIRONMENTAL AND SOCIAL PERFORMANCE
accelerate our plan to tackle climate change and apply across our operations.
We will achieve net zero carbon operations by 2030. We plan to reduce our direct emissions (known as Scope 1 and 2 emissions) by at least 75 per cent (compared to 2018/9 levels) We will reduce our total energy consumption by 50 per cent by 2030 (compared to 2018/9). Whilst we already procure zero carbon electricity, it remains crucial that we reduce the amount of power we consume to support the UK in meeting an increasing demand for renewable energy We will maintain travel carbon emissions below 50 per cent of pre COVID-19 (2018/9) levels, embedding for the long-term the
reduced levels of commuting and business travel seen during the pandemic and supporting colleagues to switch to low carbon transport.
Achieving these goals will not be easy, and we will need to invest in our buildings over the next decade, supporting the UK to make a green recovery. We will continue to deploy energy efficient technology including LED lighting and improved building controls. We will remove all use of natural gas from our estate, replacing our gas boilers with zero carbon heating technologies and create more sustainable branches in communities across the UK. Many of the technologies we will need to use are still new and we will need to work closely with our partners and supply chain to innovate.
Looking forwardIn 2021, we will continue to develop additional sector-based ambitions to support our goal to help reduce the emissions we finance by more than 50 per cent by 2030. We will continue to enhance our methodologies and framework for reporting climate risks and opportunities, taking into account relevant industry guidelines and regulatory reporting requirements. This will further advance our disclosures and respond to the evolving needs of both our shareholders and other stakeholders.
Read more on climate change related performance
lloydsbankinggroup.com/who-we-are responsible-business/downloads.html
Table 2. Initial estimated view of the 2018 financed emissions baseline for the Group’s own lending (excluding the Insurance and Wealth division)
Asset classEstimated MtCO2e (Scope 1 & 2 emissions)
Equivalent share of UK total emissions by sector / asset class6
Motor vehicle loans3
3.2 c.4%
Mortgages4 6.3 c.6%
Business loans5
15.9 c.6%
Total 25.41,2 c.5.6%
Table 1. Lending1 to customers in sectors at increased risk from the impacts of climate change
Commercial Banking sector4
Lending to Commercial Banking customers (£m)2
% of total Group loans & advances to customers3
Dec 2020 Dec 2019 Dec 2020 Dec 2019
Energy use in buildings Real estate (inc housing associations) 25,426 27,124 5.04% 5.44%Agriculture Agriculture, forestry & fishing5 7,464 7,219 1.48% 1.45%Transport Passenger transport 1,135 1,120 0.22% 0.22%
Industrial transport 1,374 1,674 0.27% 0.34%Automotives6 1,485 1,272 0.29% 0.26%
Energy use in industry Housebuilders 870 1,168 0.17% 0.23%Construction7 1,210 1,179 0.24% 0.24%Cement, construction materials, chemicals & steel manufacture 317 391 0.06% 0.08%General manufacturing 1,301 1,285 0.26% 0.26%Food manufacturing and wholesalers 1,312 1,844 0.26% 0.37%
Energy supply Oil & Gas8 1,099 1,393 0.22% 0.28%Utilities 1,638 1,779 0.32% 0.36%Coal mining 8 21 0.002% 0.004%Total 44,639 47,469 8.85% 9.53%
Loans & advances to customers (£m)
% of total Group loans & advances to customers3
Retail division areas9 Dec 2020 Dec 2019 Dec 2020 Dec 2019
UK Mortgages 294,806 289,198 58.42% 58.04%UK Motor Finance 15,201 15,976 3.01% 3.21%Total 310,007 305,174 61.44% 61.25%
1. Commercial Banking and Retail divisions only. Excludes Insurance and Wealth division.2. Commercial Banking division only, excludes Commercial Finance. Drawn lending is gross of significant risk transfers. Excludes Business Banking lending, which sits within Retail division.
2019 restated on a consistent basis with 2020.3. Percentages calculated using total Group loans and advances to customers on a statutory basis, before allowance for impairment losses (£504,603 million at 31 December 2020 and
£498,247 million at 31 December 2019 - see page 316).4. Commercial lending classified using ONS SIC codes at legal entity level.5. Agriculture lending includes Agricultural Mortgage Corporation (AMC) based on loans and advances to customers £4,186 million (2019: £3,998 million).6. Includes Automotive manufacture, retail & wholesale trade, rentals and parts but excludes finance captives and securitisations.7. Construction excludes 41100 Development of building projects (included within Real Estate) and 41202 Construction of domestic buildings (reported separately as Housebuilders).8. Excludes Commodity Traders.9. Based on loans and advances to customers within Retail Division.
Progress in 2020
1 Includes Nil emissions for cash balances, which accounted for 8% of the Group’s balance sheet2 Examples of areas where there is no current method for calculating emissions include: Government securities,
derivatives, personal loans, credit cards and reverse repos. Areas where data was not readily available, but coverage may be expanded in the future include: business banking, non-UK mortgages, loans and advances to banks and some assets at fair value through profit and loss.
3 Covers 95 per cent of motor vehicle loans and operating lease assets. Excludes assets that do not have a motor, specialist vehicles and vehicles where mileage is difficult to estimate. Currently does not apply a loan-to-value ratio for emissions.
4 Covers 97 per cent of mortgages. Excludes non-UK mortgages. Uses EPC emissions estimates for 45% of properties and average emission intensity profiles of EPC C to G properties to calculate emissions for the balance of properties where EPCs are not available. Property index value as at end 2018 is used for current property value in PCAF emission attribution calculations.
5 Includes 99% of Commercial Banking business loans, based on drawn lending. The PCAF sector-based approach has been used for the majority of the business loans baseline, using Office of National Statistics (ONS) UK emissions. The business loans method has been applied to project finance (excluding Power project finance) and commercial real estate assets, which will be refined in the future as better data becomes available.
6 Total UK emissions in 2018 were: 88 MtCO2e from cars and vans; c.100 MtCO2e from homes, including emissions from both electricity and heating; and 263 MtCO2e from business (excluding emissions from electricity used in residential property). Source: Department for Business, Energy and Industrial Strategy - 2018 UK Greenhouse Gas Emissions, Final Figures.

24 Lloyds Banking Group Annual Report and Accounts 2020
OUR ENVIRONMENTAL AND SOCIAL PERFORMANCE
Our progress in building a sustainable and responsible business continued
ESG lending and investment
Highlights We have tightened our lending appetite for the coal sector. We have further enhanced our environmental and social risk lending due diligence processes. In 2020, we have developed and piloted a tool in Commercial Banking to help assess our clients' physical and transitions risks. We have established a dedicated Responsible Investment team in our Insurance and Wealth division and have launched our Responsible Investment Framework and Stewardship policy through Scottish Widows.
Lloyds Banking Group sector statements The Group has identified selected sectors and defined specific risk appetites related to our financing activities.
Our 2020 review of our sector statements has tightened our lending appetite for exposure to the coal sector even further. The Group will not:
Engage new Commercial Banking customers where any revenue is derived from operating thermal or metallurgical coal mines, Directly finance new or existing UK coal-fired power stations by the end of 2022, Support new project finance or direct investment in coal power operations of diversified utility companies elsewhere in the world, unless the finance is used to decommission the coal power generation or convert to renewable power generation, or Provide general purpose banking or lending to any new customers where any revenue is derived from operating coal-fired power stations in the UK.
We will continue to support existing customers in the coal industry to diversify their strategy to eliminate coal mining or coal power operations from their UK operations in line with the Government’s 2024 phase-out target. We will also continue to encourage clients with international coal-related operations to reduce their exposure in line with the Paris Agreement.
The Group expects all of our customers to comply with applicable international conventions, sanctions and embargoes, legislation, and licensing requirements whilst showing a clear commitment to robust ESG performance and risk management.
The Climate Transition World Equity fund
Scottish Widows partnered with BlackRock to create a new fund aligned to the goals of the Paris Agreement, helping mitigate climate change risks and benefiting from the opportunities relating to the low carbon transition. We have now initially committed £2 billion from our default pension offering to be invested into this fund – the Climate Transition World Equity fund, which was launched in August. This will enable over 2.6 million pension savers to invest more sustainably.
We are also expanding its use within our wider multi-asset fund range. Compared to benchmark, this fund could be expected to achieve a 50 per cent reduction in carbon emissions intensity and to achieve 60 per cent more revenue from ‘green’ technologies. We continue to integrate ESG factors into the rest of the default pension investment offering, with the underlying funds moving to introduce exclusions on companies which fail to meet our standards on United Nations Global Compact, Controversial Weapons, Thermal Coal and Tar Sands over the next year, as publicised in the Scottish Widows Exclusions Policy.
During 2020 we have placed additional emphasis on the importance of engagement with clients in the oil and gas sector to determine whether they have Paris-aligned transition plans in place.
We will continue to develop sector specific guidance to help relationship managers identify climate risks.
Our full sector statements are available on our website, and further detail related to the sector statements can be found in the 2020 Lloyds Banking Group ESG report.
Sustainability risks and lending As part of the Group's credit risk policy, we have mandatory requirements to consider environmental risks in key risk management activities. In Commercial Banking, Relationship Managers must continue to ensure that sustainability risk is considered for all new and renewal facilities, and specifically commented on where credit limits exceed £500,000.
In 2020, we have developed and piloted a tool in Commercial Banking to help assess our clients’ physical and transition risks.
The Group is a signatory to The Equator Principles, a risk management framework for managing environmental and social risks in Project Finance transactions, such as large scale energy, industrial, or infrastructure projects.
Our 2020 performance table related to The Equator Principles can be found in the 2020 Lloyds Banking Group ESG Report.
Responsible investment and stewardshipOver the course of 2020 we have focused on building robust foundations for future responsible investment activity, launching our responsible investment framework in March and developing Stewardship and exclusions policies. We have also established a Responsible Investment (RI) team which is made up of professionals with diverse backgrounds in RI, policy, research, advocacy, data, and climate science.
Executive oversight is provided by a Responsible Investment Committee. This Committee, with strong Board support, plays a pivotal role in setting Scottish Widows’ sustainability agenda and provides strategic direction to our responsible investment activity.
As an asset owner, we work with the largest of our investee companies to engender positive change and enhance their approach to climate and Board diversity issues. We ask all of our fund managers to comply with the UK Stewardship Code or an equivalent for their jurisdiction.
Read more on ESG in Lending and Investment practices
lloydsbankinggroup.com/who-we-are responsible-business/downloads.html
Progress in 2020
E S G

Strategic reportFinancial results
Governance
Risk manag
ement
Financial statements
Other inform
ation Lloyds Banking Group Annual Report and Accounts 2020 25
OUR ENVIRONMENTAL AND SOCIAL PERFORMANCE
Our inclusion and diversity data2020 2019
Gender
Board members Male 8 9
Female 4 4
GEC and GEC direct reports Male 86 111
Female 41 50
Senior managers Male 4,540 4,539
Female 2,670 2,647
Colleagues Male 28,948 29,522
Female 39,817 41,033
Ethnicity
% of Board members from an ethnic minority background 8.3% NR
% of Senior managers from an ethnic minority background* 7.7% 6.7%
% of Colleagues from an ethnic minority background* 10.6% 10.2%
Disability
% of colleagues who disclose that they have a disability 3.2% 2.8%
Gender identity and sexual orientation
% of colleagues who disclose that they are lesbian, gay, bisexual or transgender 2.3% 2.2%
All data as at 31/12/2020. Group Executive Committee (GEC) assists the Group Chief Exec. in strategic, cross-business or Group wide matters and inputs to Board. GEC and Direct Reports includes the Group Chief Exec., GEC and colleagues who report to a member or attendee of GEC, excluding administrative or executive support roles (personal assistant, executive assistant).Reporting: A colleague is an individual who is paid via the Group's payroll and employed on a permanent or fixed termcontract (employed for a limited period). Includes parental leavers, and internationals (UK includes Guernsey, IOM, Jerseyand Gibraltar). Excludes leavers, Group Non-Executive Directors, contractors, temps, and agency staffDiversity: Calculation is based on headcount, not FTE (full-time employee value). Data source is HR system (Workday) containing all permanent colleague details. Gender: includes international, those on parental/maternity leave, absent without leave (AWOL) and long-term sick. Excludes contractors, Group Non-Executive Directors, temps and agency staff. All other diversity information is UK Payroll only. All diversity information is based on voluntary self-declaration, apart from gender, so is not 100 per cent representative; our systems do not record diversity data of colleagues who have not declared this information.Ethnic background: comprising of mixed/multiple, Asia, Black, Middle Eastern, North African and other (non-white) ethnicities. Colleague grades: from A through to J, Senior Executive (SE), Executive (EX) and Executive Director (ED) A being the lowest. Senior Managers: Grades F, G, H, J, SE, EX and ED (F being the lowest). NR: Data not reported during period.* 2020 Indicator is subject to Limited ISAE 3000 (revised) assurance by Deloitte LLP for the 2020 Annual Responsible Business
Reporting
Championing inclusion and diversity
Highlights During 2020, we launched our Race Action plan. The Group was the first FTSE 100 company to launch a new public goal to specifically increase Black representation in senior roles to align with the overall UK labour market. We have published our first Ethnicity Pay Gap Report. We have published our annual Gender Pay Gap Report. We achieved the external Hampton-Alexander goal of 33 per cent women in the combined Executive Committee and Direct Report population.
Lloyds Banking Group aims to create a fully inclusive environment that is representative of modern-day Britain and where everyone can reach their potential. We continue to invest in making the Group a leading inclusive employer, where the unique differences our colleagues bring to work every day are valued.
Building a truly inclusive organisation also requires us to be an anti-racist organisation – one where all colleagues speak up, challenge, and act to take an active stance against racism and discrimination of any kind.
Getting this right is at the heart of our purpose to Help Britain Prosper – a more inclusive society is a more prosperous society, and a diverse business is a better business.
Ethnic diversityIn 2018 we made a public commitment to increase the ethnic diversity of both our overall and senior workforce, which has led to positive changes. Feedback from our Black colleagues however, demonstrated that there was still more to do.
In July 2020, our Group Chief Executive, António Horta-Osório launched our Race Action plan. The Group was the first FTSE 100 company to make such a public commitment, which includes a new public goal to specifically increase Black representation in senior roles from 0.6 per cent at senior grades to at least 3 per cent by 2025, to align with the overall UK labour market. We have already delivered a number of activities, including establishing a
The Lloyds Banking Group Race Action plan Our Race Action plan aims to drive cultural change, recruitment and progression across the Group.
The plan includes a new public goal, complementing our broader 2018 ethnic diversity target, to specifically increase Black representation in senior roles from 0.6 per cent at senior roles to at least 3 per cent by 2025, aligning the Group with the overall UK labour market.
To ensure we make robust progress in delivering our plan, we have appointed a dedicated senior leader to lead a Race Action plan team, who will work together with our Race Action plan working group to drive action. We have also appointed 23 Black, Asian and Minority Ethnic colleagues to form a Race advisory panel, who are already providing invaluable input into our plan.
In December 2020, we broadened our plan to go further and work beyond our own internal boundaries by actively supporting Black communities through our partnerships with Foundervine and the Black Business Network.
Further information and progress in relation to our implementation of our Race Action plan can be found in the 2020 Lloyds Banking Group ESG Report.
Progress in 2020
E S G
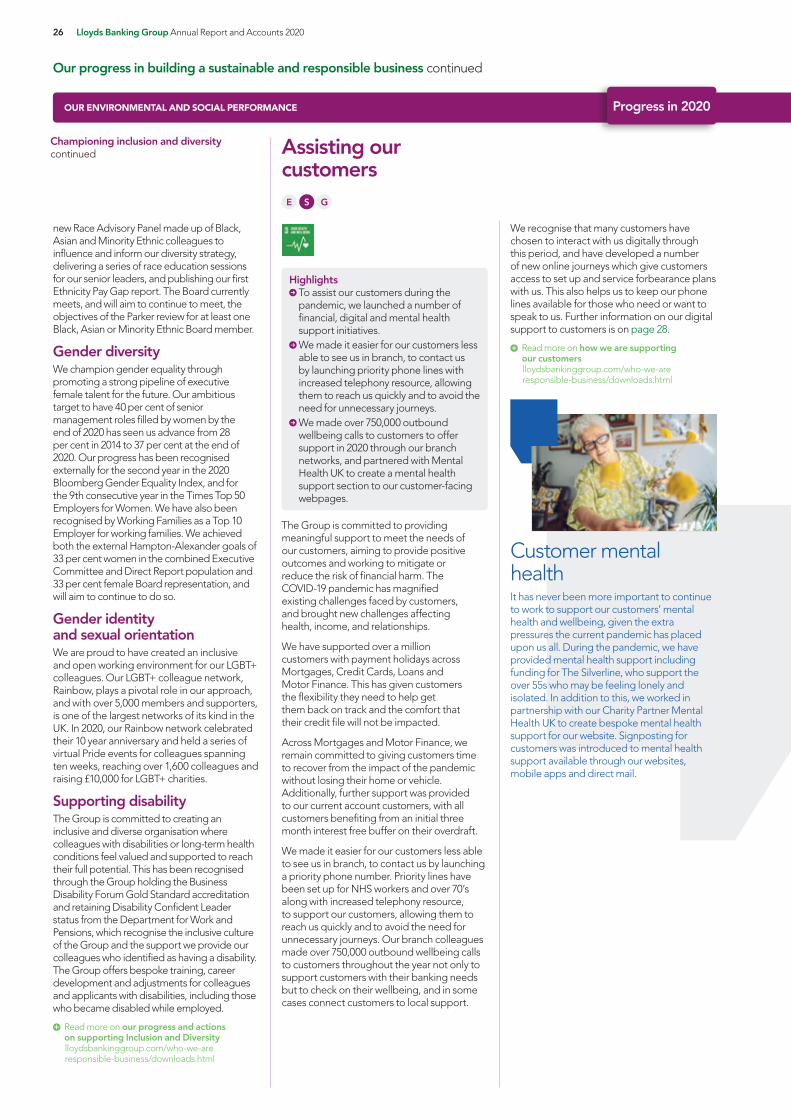
26 Lloyds Banking Group Annual Report and Accounts 2020
OUR ENVIRONMENTAL AND SOCIAL PERFORMANCE
Our progress in building a sustainable and responsible business continued
Customer mental healthIt has never been more important to continue to work to support our customers’ mental health and wellbeing, given the extra pressures the current pandemic has placed upon us all. During the pandemic, we have provided mental health support including funding for The Silverline, who support the over 55s who may be feeling lonely and isolated. In addition to this, we worked in partnership with our Charity Partner Mental Health UK to create bespoke mental health support for our website. Signposting for customers was introduced to mental health support available through our websites, mobile apps and direct mail.
Championing inclusion and diversity continued
new Race Advisory Panel made up of Black, Asian and Minority Ethnic colleagues to influence and inform our diversity strategy, delivering a series of race education sessions for our senior leaders, and publishing our first Ethnicity Pay Gap report. The Board currently meets, and will aim to continue to meet, the objectives of the Parker review for at least one Black, Asian or Minority Ethnic Board member.
Gender diversityWe champion gender equality through promoting a strong pipeline of executive female talent for the future. Our ambitious target to have 40 per cent of senior management roles filled by women by the end of 2020 has seen us advance from 28 per cent in 2014 to 37 per cent at the end of 2020. Our progress has been recognised externally for the second year in the 2020 Bloomberg Gender Equality Index, and for the 9th consecutive year in the Times Top 50 Employers for Women. We have also been recognised by Working Families as a Top 10 Employer for working families. We achieved both the external Hampton-Alexander goals of 33 per cent women in the combined Executive Committee and Direct Report population and 33 per cent female Board representation, and will aim to continue to do so.
Gender identity and sexual orientationWe are proud to have created an inclusive and open working environment for our LGBT+ colleagues. Our LGBT+ colleague network, Rainbow, plays a pivotal role in our approach, and with over 5,000 members and supporters, is one of the largest networks of its kind in the UK. In 2020, our Rainbow network celebrated their 10 year anniversary and held a series of virtual Pride events for colleagues spanning ten weeks, reaching over 1,600 colleagues and raising £10,000 for LGBT+ charities.
Supporting disability The Group is committed to creating an inclusive and diverse organisation where colleagues with disabilities or long-term health conditions feel valued and supported to reach their full potential. This has been recognised through the Group holding the Business Disability Forum Gold Standard accreditation and retaining Disability Confident Leader status from the Department for Work and Pensions, which recognise the inclusive culture of the Group and the support we provide our colleagues who identified as having a disability. The Group offers bespoke training, career development and adjustments for colleagues and applicants with disabilities, including those who became disabled while employed.
Read more on our progress and actions on supporting Inclusion and Diversity
lloydsbankinggroup.com/who-we-are responsible-business/downloads.html
The Group is committed to providing meaningful support to meet the needs of our customers, aiming to provide positive outcomes and working to mitigate or reduce the risk of financial harm. The COVID-19 pandemic has magnified existing challenges faced by customers, and brought new challenges affecting health, income, and relationships.
We have supported over a million customers with payment holidays across Mortgages, Credit Cards, Loans and Motor Finance. This has given customers the flexibility they need to help get them back on track and the comfort that their credit file will not be impacted.
Across Mortgages and Motor Finance, we remain committed to giving customers time to recover from the impact of the pandemic without losing their home or vehicle. Additionally, further support was provided to our current account customers, with all customers benefiting from an initial three month interest free buffer on their overdraft.
We made it easier for our customers less able to see us in branch, to contact us by launching a priority phone number. Priority lines have been set up for NHS workers and over 70’s along with increased telephony resource, to support our customers, allowing them to reach us quickly and to avoid the need for unnecessary journeys. Our branch colleagues made over 750,000 outbound wellbeing calls to customers throughout the year not only to support customers with their banking needs but to check on their wellbeing, and in some cases connect customers to local support.
Assisting our customers
Highlights To assist our customers during the pandemic, we launched a number of financial, digital and mental health support initiatives. We made it easier for our customers less able to see us in branch, to contact us by launching priority phone lines with increased telephony resource, allowing them to reach us quickly and to avoid the need for unnecessary journeys. We made over 750,000 outbound wellbeing calls to customers to offer support in 2020 through our branch networks, and partnered with Mental Health UK to create a mental health support section to our customer-facing webpages.
We recognise that many customers have chosen to interact with us digitally through this period, and have developed a number of new online journeys which give customers access to set up and service forbearance plans with us. This also helps us to keep our phone lines available for those who need or want to speak to us. Further information on our digital support to customers is on page 28.
Read more on how we are supporting our customers
lloydsbankinggroup.com/who-we-are responsible-business/downloads.html
Progress in 2020
E S G

Strategic reportFinancial results
Governance
Risk manag
ement
Financial statements
Other inform
ation Lloyds Banking Group Annual Report and Accounts 2020 27
OUR ENVIRONMENTAL AND SOCIAL PERFORMANCE
Supporting businesses and SMEs
Highlights We have provided over £12 billion of lending through Government-backed lending schemes. We have helped over 265,000 businesses start up since 2018. We have trained 1,211 apprentices, graduates and engineers through our investment in the Lloyds Bank Advanced Manufacturing Training Centre since 2018. We have invested over £5 million in supporting over 230 businesses and 450 apprentices to develop STEM skills that will support the UK’s recovery. We have supported over 368,000 organisations in gaining digital skills and to adapt their businesses with technology since 2018 through strategic partnerships. To support businesses in their transition to a low carbon future, we launched several new green finance products, tools and services (page 21).
Supporting businesses of all types and sizes is fundamental to helping Britain to both prosper and recover. The pandemic has had a profound impact on the way we live our lives and on the global economy. We remain fully focused on helping our customers and the UK economy recover, in collaboration with Government and our regulators.
This year we have actively supported our clients with over £12 billion of Government backed lending in addition to a range of propositions including approximately 34,000 capital repayment holidays and around 22,000 fee-free overdrafts as part of the Group's £2 billion COVID-19 fund. As the impact of the pandemic has been felt across the UK, we have also looked to address wider concerns related to the impact on businesses in a number of ways through providing online guides and a webcast series. Content has covered topics such as managing fraud risks, mental health, the road to a low carbon economy, optimising working capital and risk management.
Since 2018, we have now helped over 265,000 businesses start up and re-affirmed our commitment to the UK’s manufacturing sector providing £3.7 billion of dedicated investment, whilst continuing to build on our financial commitments with our broader support for a range of issues that impact business skills and productivity every day.
Our Apprenticeship strategyThe Group has continued with its long-term investment of £10 million over ten years in the Lloyds Bank Advanced Manufacturing Training Centre at the Manufacturing Technology Centre (AMTC) in Coventry, which is on track to support the training and upskilling of around 3,500 apprentices, graduates and engineers by the end of 2024. Through our annual investment in the AMTC, we have trained and upskilled 1,211 manufacturing apprentices, graduates and engineers in manufacturing since 2018.
In addition, by utilising our apprenticeship levy we have now committed in excess of £5.4 million supporting over 230 businesses and 450 apprentices to invest in critical science, technology, engineering, maths (STEM) and digital skills that will support the UK’s recovery across London, West Midlands and Greater Manchester. This is part of a £9 million commitment by the Group over three years to help small and medium enterprises to develop apprenticeships through our Levy Transfer initiative.
Supporting businesses with digital skills For over five years, Lloyds Banking Group has evidenced how crucial technology is for small businesses and the digital economy through the Business Digital Index reports. We partner with Be the Business, Google, Microsoft, Small Business Britain and others to support small businesses to gain skills and confidence to both recover and thrive, by adapting their businesses with technology. We have held free workshops, peer to peer networking sessions across all regions of the UK and have a range of free on-demand learning available, helping over 368,000 organisations since 2018, with more in plan for 2021.
Further information on how we are supporting businesses and SMEs as well as our strategic partnerships can be found in the 2020 Lloyds Banking Group ESG Report.
Helping Britain get a home
Highlights We have delivered close to £9bn of finance for the Social Housing sector since 2018. 1,900 new homes were built through The Housing Growth Partnership by SME’s through our support. We provided £39.7 billion to first time home buyers since 2018.
As the largest lender to the UK housing sector we recognise the importance of home ownership and that a lack of affordable housing can lead to social disadvantage. Working with more than 200 housing associations across the UK, we have delivered more than £2.5 billion of finance for the social housing sector in 2020 and close to £9 billion since 2018. We also continue to support The Housing Growth Partnership, who provide help and mentoring to small and mid-sized house builders and have built 1,900 new homes across the UK during 2020.
This year we provided £13 billion to first-time buyers, and across the last three years have provided £39.7 billion of lending, this outcome is significantly above our £30 billion commitment. We have also increased the ways in which we support first time buyers in accessing the property market by welcoming applications from the new Scottish First Homes Fund, making it easier for those with little or no savings to buy their first home.
Further information on how we are helping Britain to get a home can be found in the 2020 Lloyds Banking Group ESG Report.
Read more on how we are helping Britain to get a home
lloydsbankinggroup.com/who-we-are responsible-business/downloads.html
Progress in 2020
E ES SG G
Partnering with the Woodland Trust
In January 2020 we announced a new partnership with the Woodland Trust to plant ten million trees over the next ten years expanding the UK’s carbon sink and helping to reforest the UK. Our partnership has three parts.
Supporting Farmers: We are helping farmers and landowners transition to a low carbon future by offering preferential funding when planting more than 0.5ha of new woodland.
Working with Communities: We are supporting the Woodland Trust with their Community Tree Pack scheme.
Funding New Woods: We will be creating 10 brand new 'woods within woods' at existing Woodland Trust sites across the UK.

28 Lloyds Banking Group Annual Report and Accounts 2020
OUR ENVIRONMENTAL AND SOCIAL PERFORMANCE
Our progress in building a sustainable and responsible business continued
We Are Digital Helpline
Building financial resilience
Highlights We have facilitated digital training for 1.8 million people since 2018 to assist in narrowing the digital skills gap. We have facilitated the delivery of over 12,500 devices through the DevicesDotNow campaign and We Are Digital Helpline. Through the latter, we have assisted over 8,000 people to learn digital skills to be able to access online services and connect virtually with family and friends. We established a Domestic and Economic Abuse Team, conducted training for our colleagues on how to support customers facing these circumstances through strategic partnerships, and supported charities assisting victims.
The digital skills gapLloyds Bank AcademyTo facilitate the shift to a more digital economy, the Group has developed the Lloyds Bank Academy. The Academy teaches basic digital and workplace skills through online and face-to face courses, aiming to provide support where, when and how people need it. During 2020 these courses shifted to online webinars due to lockdown restrictions.
The Group has facilitated digital training for 1.8 million people since 2018 through the Academy and the Academy curriculum continues to expand having a breadth of content and partners, including large corporates, charities, credit unions and job seekers. Our insight is used by both Government and other organisations in the UK. Our Consumer Digital Index was viewed in over 85 countries with over 37,000 views online.
FutureDotNowLloyds Banking Group is a founding organisation of FutureDotNow, a coalition of leading companies in the UK dedicated to accelerating the UK’s digital skills at scale, with a focus on the employees and customers of large organisations. As the pandemic started to impact communities in the UK, the Group was heavily involved with the DevicesDotNow emergency campaign, helping with the call to industry for devices, data and support for people who were shielding. The campaign raised over £1.5 million and funding secured to deliver over 11,500 devices, data and support to customers.
Domestic and economic abuseThrough the year the UK has seen an increase in reports of economic and domestic abuse. We are proud of the support we have made available to victims and survivors. The introduction of the Domestic and Economic Abuse Team to help victims of financial and economic abuse was an important next step in both raising awareness and supporting our customers.
Our engagement with the charity Surviving Economic Abuse has been critical to achieving this and working with them, we have developed an ability to support victims in separating financial affairs quickly and, where appropriate, to offer forbearance from debt incurred as a result of coercion.
During 2020, to support our initiatives, we have partnered with the charities Surviving Economic Abuse and Tender to train our colleagues to support customers experiencing domestic and financial abuse, and have engaged with a number of charities to refer victims and survivors of abuse to our Domestic and Economic Abuse Team for support with their finances. We work very closely with the charity Safe Lives. Safe Lives have participated in our live broadcasts and colleague webinars which we run all year round to provide expert advice and guidance to colleagues.
Financial capabilityThe Group has a suite of financial capability resources available online. These interactive tools are designed to be an engaging and informative way of helping children and young people understand money and financial management.
In support of our communities and in the spirit of Helping Britain Recover from the ongoing pandemic, content has been made available to all via the Lloyds Bank Academy. This provides the opportunity for the lesson plans to be delivered by individuals, parents, teachers, employers or charities, encouraging positive conversations about money at home, at work and in our communities.
Read more on Financial resilience initiatives, Lloyds Bank Consumer Digital Index, 2020 Transformation with Tech lloydsbankinggroup.com/who-we-are responsible-business/downloads.html
The Group delivered a new dedicated phone line which provides guidance and remote training to customers less able to see us in branch, to help them stay connected with everyday digital activities, including online banking. Customers were contacted and able to access free and practical support to help them stay connected online. With guidance from We Are Digital’s agents, users learn skills to help with everyday tasks such as online shopping, booking a doctor’s appointment using the NHS website, connecting virtually with family and friends, as well as internet banking. The service provides not just remote help via a telephone, but has also allowed for customers and charities in need to be able to be provided with a basic tablet device. We provided over 1,000 devices and data, and helped 12,500 callers to the helpline.
Progress in 2020
E S G
Helping people save for the futureWe recognise the importance of savings to build financial resilience and to help tackle disadvantage. We want to make saving for the future as easy as possible and we continue to improve choice, flexibility and control for customers who are investing, saving or planning for retirement. The Group has had a £45.6 billion growth in open book assets1 that we hold on behalf of customers in retirement and investment products since 2018.1 Growth in assets under administration on our front books

Strategic reportFinancial results
Governance
Risk manag
ement
Financial statements
Other inform
ation Lloyds Banking Group Annual Report and Accounts 2020 29
OUR ENVIRONMENTAL AND SOCIAL PERFORMANCE
Supporting our communities
Supporting our colleagues
As one of the UK’s largest corporate donors, we use our scale to reach millions of people and help tackle social disadvantage in communities across the UK.
Spanning across the past 35 years, our four regional Foundations have been providing essential funding and support to charities across the UK and Channel Islands, helping communities overcome complex social issues and rebuild lives.
In 2020, the Foundations received £25.5 million enabling them to support 2,787 charities. These charities are tackling issues such as domestic abuse, mental health, modern slavery and human trafficking, and employability. The Group’s commitment to maintain its £25.5 million in the Foundations funding in 2021 helps secure a more certain future for charities during these difficult times and safeguard the important work that they do.
In addition to adapting many of our community engagement initiatives to virtual delivery, we have responded directly to community needs through new investments. These investments included the expansion of our Mental Health and Money Advice lines, CLIC online chat services run by our Charity of the Year partner Mental Health UK (MHUK), and the provision of mobile devices through a partnership with We Are Digital (See page 28)
Our total community investment in 2020 was £51.2 million and includes our colleagues’ time, direct donations, and a share of the Group’s profits given annually to the Foundations.
Further information related to how we are supporting our community initiatives can be found in the 2020 Lloyds Banking Group ESG Report.
Read more on how we are supporting our community initiatives
lloydsbankinggroup.com/who-we-are responsible-business/downloads.html
Providing a safe work environmentDuring 2020, a key challenge posed by the pandemic was for the Group to continue to provide essential financial services through its physical infrastructure and remain open to customers. The Group has been implementing business changes to manage the pandemic since early 2020, and has reviewed every iteration of the UK Government's advice. By the end of 2020, the Group had co-ordinated over 3,000 risk assessments across our operations to ensure all offices and branches are compliant with legislation and safe for our colleagues and customers.
Agile workingWe have seen changing customer demands, changing colleague needs and expectations, a fluctuating and less stable business environment, and significant economic issues which have led the Group to consider how to reimagine the way we work.
Prior to the pandemic, the Group had approximately 35 per cent of colleagues with an existing agile working arrangement however, due to national lockdown in early 2020, this extended to over 50,000 colleagues working from a home environment. During 2021 we will continue to reimagine ways of working and use behavioural experiments to test our thinking and identify the practicalities of various options.
Highlights £51.2 million in total was provided for community investment in 2020. £25.5 million was donated to our 4 independent charitable foundations in 2020. 2,787 charities were supported in 2020.
Highlights Health and safety of our colleagues and customers was a key COVID-19 response focus, ensuring our offices and branches were compliant with regulations, safe and able to remain open. Over 50,000 colleagues were supported in converting to a working from home arrangement with technology, equipment and IT assistance. Free access was provided for all colleagues to the Headspace app, and we have continued to train colleagues to become mental health advocates. Our colleague engagement surveys indicated overall that colleagues felt supported, that the company culture was more positive and caring, and that there is an interest by colleagues to explore changing ways of working in the future. 4.1 million hours of training were delivered to colleagues primarily via virtual training delivery.
Colleague mental health Highlights in 2020 related to our colleague mental health initiatives included the continued expansion of our ‘Optimal Leadership Resilience Programme’ to more of our leaders in order to help them build personal resilience. In addition, we continue to promote the ‘Your Resilience’ portal to all colleagues, including new content to support our colleagues with the additional challenges they may face as a result of the pandemic.
We have extended our partnership with Headspace, offering all colleagues a free subscription to the market leading meditation app, providing access to mindfulness modules covering a range of topics from stress to self-esteem.
Emergency supportThe pandemic has brought the issue of domestic and economic abuse to the fore. In 2020, we launched an Emergency Assistance Programme covering the cost of emergency accommodation and one-to-one support. This is available to all Lloyds Banking Group colleagues and their children, at no cost to them. During this emergency stay, the colleague can receive additional support from our Employee Assistance Programme which will help them through their next steps and provide support.
Colleague engagementThe Group understands that engagement is a two-way process, so each year we ask colleagues to share their views via our independently-run colleague survey, and participate in the annual Banking Standards Board (BSB) Culture Assessment. Our Spring Pulse colleague survey had a 66 per cent response rate and indicated positive reflections related to colleagues feeling supported, the company culture being more positive and caring and indicated an interest by colleagues to explore changing ways of working in the future. Our Autumn survey was completed by 72 per cent of the organisation and showed further increases in pride, satisfaction and overall engagement.
Colleague remunerationA number of key decisions were taken to support colleagues in relation to pay and financial and non-financial recognition. All Group employees receive a competitive and fair reward package. To encourage ownership colleagues are eligible to participate in HMRC-approved share plans. Further information is provided on page 115.
Read more on how we support our colleagues lloydsbankinggroup.com/who-we-are responsible-business/downloads.html
Progress in 2020
E ES SG G

30 Lloyds Banking Group Annual Report and Accounts 2020
OUR ENVIRONMENTAL AND SOCIAL PERFORMANCE
Conducting our Business Responsibly
Supporting colleagues to do the right thingOur Values and Behaviours alongside the Financial Conduct Authority’s Conduct rules set out the expectations of colleagues and colleagues are encouraged to make decisions aligned to these. The Group's Code of Ethics and Responsibility is available on our website.
Speak UpColleagues are encouraged to speak up, challenge and act if they witness anything inappropriate and we provide colleagues with a variety of channels to do this. They can report the matter directly to Group Conduct Investigations, or make use of our independent and confidential Speak Up service, that is operated by a third party. All concerns are taken seriously and if an investigation is required, it will be conducted sensitively by an independent party. In 2020 colleagues reported 482 concerns, of which 178 were formally investigated following triage, with 41 per cent of those investigations substantiated, resulting in remedial action. Other Group services also exist to support colleagues in trying to informally resolve grievances. In addition, a new informal resolution channel ‘Let’s Talk’ was launched to support colleagues to reflect on their concerns and understand their rights and options so that grievances can be effectively and appropriately resolved through formal and informal channels.
Our progress in building a sustainable and responsible business continued
Highlights 482 concerns were raised through our Speak Up line of which 178 were formally investigated with 41 per cent of those investigations substantiated. We became members of the United for Wildlife Financial Taskforce. We co-sponsored the National Economic Crime Centre (NECC) initiative to tackle criminals seeking to exploit COVID-19. Supplier expenditure was £5.1 billion with over 95 per cent of our third-party supplier spend incorporated in the UK. £4 billion of taxes paid over to the UK Government.
Human rights and modern slaveryThe Group believes in the importance of doing business in ways that value and respect the human rights of our colleagues, customers, business partners and communities affected by our business. We are guided by the International Bill of Human Rights as well as the International Labour Organisation’s (ILO) Core Labour Standards and its Tripartite Declaration of Principles.
As signatories to the United Nations (UN) Global Compact, we are aligned with its human rights and labour standards and report on our progress annually. We also recognise the Organisation for Economic Co-Operation and Development (OECD) Guidelines for Multinational Enterprises and the UN’s Guiding Principles on Business and Human Rights.
Pursuant to the UK Modern Slavery Act, we produce a Modern Slavery Statement on an annual basis. The Statement outlines the steps we take to combat modern slavery and human trafficking in our business and supply chains and the steps we take to respond and support survivors and is available on our website.
Conduct risk The Group takes a range of mitigating actions with respect to conduct risk and remains focused on delivering a leading customer experience. The Group’s ongoing commitment to fair customer outcomes sets the tone from the top and supports the development of our Values led culture which puts customers at the heart, strengthening links between actions to support conduct, culture and customers and enabling more effective control management.
More information related to our approach and management of Conduct Risk can be located on page 197.
Customer complaintsOur goal, in line with our purpose of Helping Britain Prosper, is to support customers whenever they have cause to complain.
To ensure that we supported our customers, we introduced prioritisation principles to ensure customers in challenging financial situations were prioritised. We reviewed approximately 35,000 complaints and prioritised over 2,300 to our highest category, aiming to make contact with the customer within 24 hours. Where we noted a concentration of complaints, we reviewed our working patterns to ensure those customers were supported.
We evolved our method of customer communication by contacting our customers via SMS to reduce the time they would need to wait for an update, and to minimise our colleagues’ need to visit an office. We will review on an ongoing basis how we can continue to help our customers.
Protecting customer data and financesCyber securityCustomers trust us to keep their money and data safe, and the Group deploys sophisticated technology to protect both. We recognise the importance of secure behaviours and continue to educate our customers and colleagues on cyber threats.
We continue as a founding member of the Financial Services Cyber Collaboration Centre, working with the Government’s National Cyber Security Centre, and the Cross-Market Operational Resilience Group. We work closely with other banks recognising the importance of collaboration when it comes to security, including as part of the Cyber Defence Alliance (CDA). Recognising cyber security as a non-competitive issue, we continue to collaborate externally to protect the Group and the wider industry.
Fraud and financial crime The financial crime landscape is undergoing unprecedented change in terms of both regulatory reform and evolving crime threats. The Group’s adoption of a risk-based approach to managing and mitigating fraud and financial crime risk ensures compliance with applicable regulations via a control framework which focuses on those customers, products, channels, and jurisdictions that carry heightened risk.
There are core Group wide policies within the Group’s risk management framework relating to fraud, anti-money laundering, counter terrorist financing, sanctions and prohibitions, and anti-bribery. A combined fraud and financial crime mandatory training course reflecting key policy requirements is undertaken by all colleagues annually.
Further information related to how we are conducting our business responsibly can be found in the 2020 Lloyds Banking Group ESG Report.
Read more on information related to our progress in Fraud and Financial Crime initiatives
lloydsbankinggroup.com/who-we-are responsible-business/downloads.html
Progress in 2020
E S G

Strategic reportFinancial results
Governance
Risk manag
ement
Financial statements
Other inform
ation Lloyds Banking Group Annual Report and Accounts 2020 31
Responsible sourcingWe work closely with our suppliers of goods and services to manage risks and drive continuous improvements in the standards of performance and quality. We work with approximately 3,000 active suppliers of varying sizes, with the majority in the professional services sectors such as management consultancy, legal, HR, IT, operations, marketing and communication. In 2020 our supplier expenditure was £5.1 billion with over 95 per cent of our third-party supplier spend incorporated in the UK.
The Group requires suppliers to adhere to relevant Group policies, and suppliers are additionally required to comply with our Code of Supplier Responsibility which outlines our expectations for responsible business, sustainability practice and behaviour. Our suppliers are asked in addition to this, to comply with specific third-party supplier policies as applicable to the services they provide to the Group.
Any supplier related grievances or concerns can be raised using our confidential SpeakUp whistleblowing service. Further information related to key Board decisions on supplier management are located on page 51.
TaxAppropriate, prudent and transparent tax behaviour is a key component of corporate responsibility. Tax is one of the ways in which businesses contribute to the societies in which they operate, and we are proud to be among the UK’s highest payers of corporate taxes.
In 2020 we paid £2.1 billion of cash taxes. This was primarily on business profits, VAT on goods and services needed to run our business, bank levy and employer social security on staff salaries. In addition, we collected £1.9 billion of cash taxes primarily from payroll taxes and customer product taxes. We comply with the HMRC Code of Practice on Taxation for Banks.
For further information about the taxes we pay, and the economic value we generate for the UK, please refer to our annual Tax Strategy document on the Lloyds Banking Group website.
Additional information on how we are conducting our business responsibly can be found in the 2020 Lloyds Banking Group ESG Report.
Read more on how we are conducting our business responsibly
lloydsbankinggroup.com/who-we-are responsible-business/downloads.html
NON-FINANCIAL INFORMATION STATEMENT
This section of the strategic report constitutes Lloyds Banking Group’s Non-Financial Information Statement, produced to comply with sections 414CA and 414CB of the Companies Act. The information listed is incorporated by cross-reference.
Reporting requirement
Policies and standards which govern our approach
Information necessary to understand our Group and its impact, policies due diligence and outcomes
Stakeholders Annual materiality assessment1
Supplier management– Reflecting the needs of our stakeholders,
page 51– Code of Supplier Responsibility
https://www.lloydsbankinggroup.com/who-we-are/working-with-suppliers/responsible-sourcing-supplier-management.html
Environmental matters
Environmental (TCFD) statement – Reflecting the needs of our stakeholders, pages 49 and 50
– Helping the transition to a sustainable low carbon economy, page 20
Employees Colleague Policy1
Code of Responsibility Health and Safety Policy1
– Reflecting the needs of our stakeholders, pages 48
– Supporting our Colleagues page 29– Championing inclusion & diversity, page 25
Respect for human rights
Human Rights Policy statement Colleague Policy1
Pre-Employment vetting standards1
Data Privacy Policy1
Modern Slavery and Human Trafficking Statement
Information and Cyber Security Policy1
– Reflecting the needs of our stakeholders, page 51
– Suppliers, page 51– Championing inclusion & diversity, page 25– Conducting our business responsibly,
page 30– Modern Slavery and Human Trafficking
Statement https://www.lloydsbankinggroup.com/who-we-are/responsible-business/downloads.html
Social matters Volunteering standards1
Matched giving guidelines1
– Reflecting the needs of our stakeholders: Communities and Environment, page 49
– Helping Britain Prosper Plan, page 17– Championing inclusion and diversity,
Assisting our customers, Supporting businesses and SMEs, Helping Britain get a home, Building financial resilience, Supporting our communities, Supporting our colleagues, Conducting our business responsibly, page 25 to 31
Anti-corruption and anti-bribery
Anti-Bribery Policy1
Anti-Bribery Policy Statement Anti-Money Laundering and Counter Terrorist Financing Policy1
Fraud Risk Management Policy1
– Conducting our business responsibly, page 30
– Reflecting the needs of our stakeholders: Colleagues, page 48
Description of principal risks and impact of business activity
– Helping the transition to a sustainable low carbon economy: Risk management, page 20
– Risk overview 2020 themes, page 56– Our principal risks, page 57
Description of the business model
– Our Business Model, page 13– Key performance indicators, page 14– Our strategic priorities, page 18– Helping Britain Prosper Plan, page 17– Global Reporting Initiative (GRI) standards
https://www.lloydsbankinggroup.com/who-we-are/responsible-business/downloads.html
– Reporting Criteria https://www.lloydsbankinggroup.com/who-we-are/responsible-business/downloads.html
– ESG 2020 Report https://www.lloydsbankinggroup.com/who-we-are/responsible-business/downloads.html
Non-financial key performance indicators
1 Certain Group Policies, internal standards and guidelines are not published externally.
The policies mentioned above form part of the Group’s Policy Framework which is founded on key risk management principles. The policies which underpin the principles define mandatory requirements for risk management. Robust processes and controls to identify and report policy outcomes are in place and were followed in 2020.
OUR ENVIRONMENTAL AND SOCIAL PERFORMANCE

32 Lloyds Banking Group Annual Report and Accounts 2020
ECONOMY
Highlights Given our focus on UK customers, the Group’s prospects are closely linked to the fortunes of the UK economy. The economic outlook is highly uncertain, dependent on how fast the UK can deliver vaccines and how effective they are against potential variants of COVID-19. We expect the UK economy to grow by 3 per cent in 2021 after a weak start this quarter, followed by brisker growth of 6 per cent in 2022. There are uncertainties in both directions. Our low risk business model and focus on efficiency serves us well in an uncertain environment. Nevertheless, improving Group financial performance is heavily dependent on economic recovery.
Link to principal risksCreditCapitalFunding and liquidityMarket
20202019201820172016
1.7 1.7 1.3 1.4
-9.9
Source: ONS
UK economic growth
(9.9)%GDP growth
Our external environment
The Group continues to adapt to evolving market trends
Overview2020 was an extraordinarily difficult year for the UK economy with GDP falling by almost 10 per cent due to the restrictions on activity necessary to contain the COVID-19 pandemic. Emergency action from the Government and banks was key in limiting long-term damage, but the pace and extent of recovery are uncertain, dependent crucially on how quickly and how completely vaccine programmes in the UK and abroad can be delivered and suppress mutating variants of COVID-19. Significant restrictions on activity are expected to ease only gradually through 2021, and unemployment and business closures will drag on the economy’s ability to return to the pre-COVID level of output, which we expect to take until during 2024.
The economy could perform better than this central expectation, if there is a quicker impact of vaccines on the ability to ease activity restrictions or a sudden release of unexpected savings that some households have accrued. On the other hand, difficulties in deploying effective vaccines and consequences on spending plans of the sharp rise in Government and companies' debt could lead to an even weaker economic recovery than expected. Uncertainty for the longer-term outlook has also increased, around the ability of productivity growth to improve, the impact of increased indebtedness on future interest rates and Government policy reaction to the deep and unequal societal impacts of the COVID-19 recession.
Market dynamicsThe 2020 recession has been unlike any previous recession, driven by mandated restrictions on activity focused on sectors where social contact is highest, but accompanied by unprecedented policy support. The younger and lower-paid have been at greatest risk of lost employment or reduced income, while some others have had their financial position improved by a period of continued income but reduced spending.
This recession has impacted our markets very differently to previous recessions. Consumer credit fell sharply as spending was constrained, but growth in households’ deposits was buoyed to over 10 per cent from 4 per cent in 2019. Mortgage balance growth slowed only slightly to 3.0 per cent from 3.4 per cent in 2019, companies lending rose strongly by over 9 per cent driven by the Government’s guaranteed lending schemes, and companies deposits growth was also boosted to a very strong 28 per cent. The rise in unemployment, of 1.2 per cent by November has been much less than would normally be expected for such a deep fall in GDP, due to Government support via the Coronavirus Job Retention Scheme and the Jobs Support Scheme. The housing market has also been more buoyant through the second half of 2020 than expected, with prices rising by almost 6 per cent in 2020, benefiting from employment support, from the temporary cut in stamp duty, and from unexpected households’ savings.
2021 is expected to see the start of unwinding of many of these impacts as consumer spending recovers further and businesses begin to pay down some of the debt recently accrued. Unemployment is expected to rise further to a peak around 8 per cent during the second half of 2021 as furlough support is withdrawn. We expect average house prices to fall 4 per cent in 2021, as the stamp duty reduction expires and as first time buyer demand is constrained by a lower employment rate amongst the young and very limited pay growth. Mortgages growth is expected to weaken to its slowest in seven years. Consumer credit growth is expected to remain subdued, and growth in households’ deposits to slow sharply from its high rate of 2020. Balances of companies' lending and deposits are both expected to fall in 2021 after their large increases of 2020. Interest rates are likely to stay very low near-term, to help the economy recover at a time when Government and companies' debt has increased significantly.
Uncertainty for the longer-term growth outlook has increased. Productivity growth averaged just 0.4 per cent per annum over the five years to 2019, compared with nearly 2 per cent per annum before the 2008 financial crisis, and it is unclear how it will evolve in future. The post-financial-crisis recovery in business investment was weak, and investment fell very sharply again during the pandemic. Additionally, the change in our trading relationship with the EU has introduced additional processes and costs for some businesses. The pandemic may have provided an opportunity to boost productivity through more rapid changes to working practices, preferences for living locations, and accelerated adoption of online purchasing than would have happened otherwise. More positively, the Government’s plans to ‘level-up’ the UK across its regions via a step-change in infrastructure investment could help to spur improved productivity growth.
Uncertainty for the longer-term outlook for interest rates has also increased. If high indebtedness drags on growth it may keep interest rates very low for a long time. However, it could also spur a change in policymakers’ frameworks for managing economies, towards higher inflation targets and higher nominal interest rates, although this is unlikely for the UK over the coming year at least in our view. An early return to austerity or significant fiscal tightening represents a risk to the outlook.
Our responseGiven our UK focus, the Group’s prospects are closely linked to the performance of the UK economy. Our low risk, stable business model and focus on efficiency positions us well to continue to support customers irrespective of macro conditions.
Pay growth
CPI inflation
0.0
0.5
1.0
1.5
2.0
2.5
3.0
3.5
4.0
2020f2019201820172016
0.7
2.72.5
1.8
0.9
1.8
2.4
2.3
3.0
3.4
Pay growth vs inflation
Source: ONS
20202019201820172016
5.5
2.8
2.0
4.0
5.8
Source: Halifax houseprice index
UK housing market
5.8%House price growth(Dec vs. Dec basis)
20202019201820172016
4.94.4
4.13.8
4.5
Source: ONS
UK unemployment rates
4.5%Unemployment rate

Strategic reportFinancial results
Governance
Risk manag
ement
Financial statements
Other inform
ation Lloyds Banking Group Annual Report and Accounts 2020 33
Link to principal risksConduct Operational resilience Credit
Market dynamicsThe unprecedented social and economic challenges posed by COVID-19 have significantly impacted the lives of our personal and business customers, while also having the potential to adversely affect financial resilience and vulnerability, as well as inequality more generally, in the longer-term.
Against this backdrop, a number of customer trends that existed prior to the pandemic have accelerated, most notably the shift to digital channels. Customers are increasingly shopping online and turning to digital channels to meet everyday banking needs, while continuing to value human interaction and more direct support for more complex and immediate needs, such as addressing financial difficulties.
Customer expectations continue to be shaped by experiences outside financial services, with speed, convenience and greater levels of personalisation, based on more sophisticated data insight, becoming ever more important in an increasingly competitive market.
Our responseDuring the COVID crisis, we have been fully focused on providing the necessary financial and practical support in an empathic way to our personal and business customers.
We have introduced a range of measures to alleviate the most immediate financial pressures and provided support through dedicated Government backed schemes.
We have ensured that our customers could continue to benefit from our multi-channel model and have maintained good access to our banking services. We have also set up dedicated phone lines to give priority access to NHS staff and our more elderly customers.
Looking beyond our customers’ financial needs, we have provided digital skills training to help more of our personal and business customers get online, mentoring support to our business customers, and increased support for our customers’ mental health needs.
In addition to these more immediate priorities, we have continued to invest in our capabilities, improve our service and support, develop new propositions and deliver a number of significant enhancements, especially to the digital propositions available to our personal and business customers.
The COVID-19 crisis has impacted our customers in different ways and we need to ensure we are able to respond to everyone's circumstances and needs. From helping customers in financial difficulties to get back on track, to building their financial resilience and supporting the achievement of their life-goals across generations, we will continue to leverage our unique data and insights, capabilities and multi-channel business model, to deliver personalised and fit-for purpose propositions.
Now more than ever it is vital that we address our customers' needs holistically and leverage our unique reach, strength of our franchise as well as capabilities, such as Single Customer View. An end-to-end focus on customers' life-time needs will create additional value for our customers and strengthen our competitive advantages.
In order to meet all our customers' evolving payment needs in their channel of choice, we will need to continue modernising our payments infrastructure to deliver a seamless customer experience. Our unparalleled market position and strong participation across the payments ecosystem mean we can support our clients in improving their payments systems for their customers, while simplifying the retail experience.
Our commercial clients have also seen their businesses being impacted in different ways and we will continue to support them through the crisis and get back on their feet, whatever their circumstances might be. We are also looking to help our business customers adapt and grow back stronger and more sustainably, introducing new value adding services and improving our capabilities. As businesses are increasingly looking to self-serve their simple banking needs, we are enhancing our digital offering and improving our product portfolio to deepen our client relationships through the cycle.
0%
10%
20%
30%
40%
50%
Online spendingShare of online transactions by month, %
Jan Feb Mar Apr May Jun Jul Aug Sep Oct Nov Dec
2019 2020
CUSTOMER
Highlights COVID-19 has profoundly impacted our customers’ financial and non-financial circumstances, while also accelerating some underlying behavioural shifts Customers are increasingly turning to digital channels for their simpler banking needs Against the challenging backdrop caused by COVID-19, we have provided significant financial and non-financial support to our customers, while also ensuring continued good access to banking services and maintaining investment in enhancing our customer propositions We will continue to respond to increasing expectations for speed, convenience, control and personalisation and deepen relationships with our customers and clients across our unique integrated banking, insurance and wealth offering
DigitalBranch
0.00.51.01.52.02.5
3.03.5
2020201920182017201620152014
Channel changeShift to digital channels over time

34 Lloyds Banking Group Annual Report and Accounts 2020
Our external environment continued
COMPETITION
Highlights Our competitive landscape continues to broaden with an increasing number of digital-only providers, although the current environment has increased scrutiny on the profitability and sustainability of these business models Established competitors continue to re-focus on core business areas, with some restructuring exercises accelerated to offset increasing revenue headwinds in the low-rate environment. More diversified peers have benefited through the COVID-19 crisis to date due to a reduced reliance on interest income and increased market volatility Threat from big-tech and large international peers remains
Finally, we continue to see a threat from leading technology companies and international incumbents, with these well positioned to potentially capture opportunities in the UK market with digital only offerings, and we have seen some emerging signs of this.
Our responseWe continue to respond effectively to the threats posed by increasing levels of competition and a more challenging operating environment by offering products and services that our customers value.
Our strong franchise, combined with an ongoing focus on innovation, provide us with the ability to not only be relevant but also deepen relationships with our customers as we effectively respond to the changing environment.
Across our core markets we have remained open for business across all channels at a time when our customers have needed support, in line with our purpose of Helping Britain Prosper. Our multi-channel offering, including our leading branch network, allows us to reach a broad variety of customers and enables them to interact with us in whichever manner they prefer. This model, combined with the breadth of our offering as the UK's only integrated financial services provider, drives customer value, engagement and trust. This remains an important competitive advantage, which we will continue to strengthen and enhance, as we are looking to further deepen relationships with our customers through delivering holistic propositions across Retail, Insurance and Wealth.
Looking specifically at our non-physical channels, we remain committed to investing in our digital offering. We continue to respond to functionality developments from neo-bank and big-tech peers that our customers expect to be replicated, and have a strong pipeline of developments for 2021, with faster time-to-market thanks to ongoing investment in technology. Our market leading, simple, low risk business model, and integrated financial services offering position us strongly to compete with a variety of other players in the market. It is therefore crucial that we further strengthen our competitive advantages and develop new ones by diversifying our business, expand our value-adding offering to our customers and capture new growth opportunities.
Market dynamicsThe Group continues to operate in competitive markets, with competition supported by regulatory change, ongoing shifts in customer behaviours and increasing levels of innovation. Against this backdrop the COVID-19 pandemic has significantly accelerated the pace of change in numerous areas.
Digital-only providers have continued to gain traction with customers. Neo-banks, in particular, have replicated a more traditional customer offering alongside strong digital functionality, while marketplace models enable collaboration and provide customers access to a broader suite of products and services.
However, the COVID-19 crisis has had a meaningful impact on a number of these businesses, slowing growth and limiting revenue streams. This has created a heightened focus on the profitability and sustainability of these models, with greater levels of uncertainty reflected in lower valuations in a number of recent funding rounds. While these pressures have the potential to limit disruptive threats over the near to medium-term, the threat from more differentiated businesses, often those who pursue a more traditional banking model, are likely to persist.
Beyond this, more traditional competitors have continued to re-focus on core business areas while also improving their own digital offerings. During the COVID-19 crisis, peers with more diversified revenue streams that are less dependent on interest income have tended to perform more resiliently, although the sustainability of these trends is uncertain given market volatility levels. In addition, some peers have accelerated existing restructuring exercises as a means to offset future revenue headwinds.
Market dynamicsThe regulatory response to the COVID-19 pandemic has seen increased regulatory intervention and prioritisation of regulatory requirements relating to the fair treatment of customers. Key areas of focus for 2021 are below:
Customer treatmentFair treatment of customers continues to be a priority for the FCA, with particular focus on those in vulnerable circumstances as well as long standing customers.
Capital regulationThe Group continues its implementation of regulatory capital developments including the final Basel III reforms.
IBOR transitionProgress continues, with alternative products delivered and transfer of clients to updated products underway.
OtherA number of other regulatory initiatives are underway which seek to address, amongst other things; operational resilience, climate change, general insurance pricing, onshoring EU regulations, strong customer authentication, culture and fraud. The Group also continues to respond to regulatory initiatives in respect of the COVID-19 pandemic.
Our responseAs a Group we always seek to comply with all applicable regulation. Given the Group’s customer focused, sustainable and low risk business model, it is well placed to meet these requirements and welcomes the positive effect that they have on the industry, its customers and other stakeholders.
REGULATION
Highlights The UK financial services sector is expected to remain highly regulated
Increased volume of new regulation and market reviews continue to be issued, with further regulatory changes anticipated
Uncertainty remains around the impact of the UK’s exit from the EU on the existing regulatory and legal framework, in particular the extent of friction created by changing arrangement and potential for the UK to deviate from the EU’s regulatory system
Link to principal risksRegulatory and legal Conduct Credit Capital Market Operational resilience Climate
Link to principal risksRegulatory and legalConductOperationalPeople

Strategic reportFinancial results
Governance
Risk manag
ement
Financial statements
Other inform
ation Lloyds Banking Group Annual Report and Accounts 2020 35
TECHNOLOGY
Highlights Digital adoption continues to increase at pace, with a significant acceleration in 2020 as a result of COVID-19 Investment in new technologies is of increasing importance in order to deliver continued improvements to the customer experience and to improve operational efficiencies Cyber security and the protection and appropriate use of customer data remain important factors in retaining customer trust
Banks have also continued to invest significantly in their data capabilities in order to harness insights and utilise these in order to further improve customer experience. By having a better understanding of customer trends and expectations, banks are able to increase their relevance and offer greater levels of personalisation, replicating experiences that are commonplace in other digitally focused industries. The increased focus on the sharing and utilisation of data has created a growing onus on the safeguarding of this, with this of particular importance given that trust remains a key differentiator between established banks and newer, digital-only financial service providers.
Our response To support our position as the largest digital bank in the UK, we have continued to invest heavily in technology and digital initiatives to ensure that we can continue to deliver a leading customer experience across our differentiated multi-brand, multi-channel model. While the COVID-19 pandemic has led to some slowdown in overall investment spend, we have continued to prioritise digital initiatives, with our technology spend remaining weighted towards creating new capabilities and enhancing existing ones to improve the overall customer experience. During the course of the year we have continued to improve our digital functionality and have simplified digital journeys for our customers, and we expect to further develop these areas in 2021 with a customer-centric pipeline of updates.
During the course of 2020, we have also continued to embrace the use of new technologies to improve processes and deliver productivity enhancements, which in turn deliver improved experiences for both customers and colleagues.
OverviewThe pace of digital adoption has continued to accelerate in recent years. This has been underpinned by increasing similarities in customer behaviours and preferences across multiple geographies, heightened expectations of service based on experiences outside of financial services and continued improvements in functionality and capabilities within digital channels. Moreover, the pace of change has accelerated significantly in 2020 as lockdown measures reduced interactions through physical channels, despite these remaining available to customers should they be needed. This trend appears to have continued throughout the year, suggesting a more profound shift rather than a temporary one.
This continued change in channel preference has created an ongoing need for investment in technology across the sector. This investment often includes but is not limited to enabling the delivery of innovative new features for the benefit of customers, the upgrading and modernising of legacy systems, and the adoption of new technologies such as machine learning, artificial intelligence and cloud based solutions in order to increase the effectiveness and efficiency of an organisation.
Customers are using the digital channel more than ever for simpler needs% volume of products originated digitally
This includes using robotics to process over 90 per cent of Bounce Back Loan applications, having built this process from scratch, using technology to accurately and at scale provide credit decisions at a time when customers required urgent support. The use of robotics has significantly improved colleague capacity to focus on providing additional customer support. Across the Group, we have saved more than 1.8 million hours through the use of robotics over the last three years, including over 700,000 in 2020 alone.
In addition to improving outcomes for customers, significant investment in new technologies and the modernisation of our existing IT architecture have supported our ongoing focus on efficiency, with business as usual costs down 4 per cent in 2020. This relentless focus on efficiency continues to create capacity for future investment, helping us to future-proof our business.
Given the ongoing shift to digital, ensuring that customer data remains safe is becoming increasingly important. We are therefore continuing to invest in the resilience and security of our systems.
Link to principal risksData Change/execution Operational resilience
20202019201820172014
40%
73%68%
75%
85%

36 Lloyds Banking Group Annual Report and Accounts 2020
Up to June 2020 Up to February 2021 2021 focus
Review of strategic progress and look ahead to the next strategic plan As part of our strategic cycle, the Board and Executive Management team attend an annual two-day strategy meeting.
In June 2019, the Board discussed how recent and expected trends across customer behaviours, technology and competition pointed to a narrowing of scenarios for the banking sector’s longer-term evolution. In addition, the Board considered the key societal and environmental challenges facing the UK and the Group’s role in addressing them.
These assessments led to the identification of the key emerging priorities for the next strategic plan.
Development of high-level strategic options with Helping Britain Recover at their heartWhile these priorities remain relevant for the Group’s long-term strategic focus, the significant impacts of COVID-19 on the UK and our stakeholders, have become the most important drivers of our shorter-term response and strategic priorities.
In light of this, the Board and Executive Management team agreed in June 2020 that the Group's purpose should be firmly embedded at the heart of our strategy, with our immediate focus on Helping Britain Recover framing our strategic plan for 2021 as well as the associated priorities regarding our customer propositions, colleagues and Group capabilities.
Finalisation of strategy and communicationTeams across the Group then helped translate these priorities into more detailed initiatives, ensuring that Helping Britain Recover remains the key focus.
At an extended Board session in November, attended by both the then incumbent and incoming Chair, these initiatives were subsequently discussed in the context of the investment required in 2021 and the Group’s longer-term financial plan.
Since then, the Board have supported the development of detailed plans, with measurable outcomes designed to support successful delivery and mitigate execution risks, as well as the communication approach for our evolution of strategy.
Building the UK's preferred financial partnerOver the following pages, we outline our strategic priorities for 2021 and beyond, and how they have both been shaped by and will be instrumental in Helping Britain Recover.
Strategic review 2021: Building the UK's preferred financial partner
Our next chapter
Our strategic planning processWe regularly review our strategy in light of our changing operating environment to ensure that our focus remains the right one for our customers, colleagues, shareholders and broader society. Over the past two years we have considered how we can build on the Group’s successful transformation, with a defining purpose further embedded in a refreshed strategy that can be at the heart of Britain’s recovery while delivering enduring value to all our stakeholders.
Why the change? Since 2011, we have significantly transformed our business for the benefit of our customers and other key stakeholders, while also positioning us well to succeed in a digital world. We are not complacent, however, and recognise that we need to continually evolve in response to increasing customer and societal expectations, new technologies and a rapidly changing competitive environment. Most importantly, we also recognise that we have a critical role to play in Helping Britain Recover from the COVID pandemic.
Up to June 2019

Strategic reportFinancial results
Governance
Risk manag
ement
Financial statements
Other inform
ation Lloyds Banking Group Annual Report and Accounts 2020 37
Strategic Review 2021 Lloyds Banking Group is a customer focused, sustainable, efficient and low risk UK financial services leader with the clear purpose of Helping Britain Prosper. The next phase of our strategy, Strategic Review 2021, is focused on Helping Britain Recover and further enhancing our core capabilities.
Through this approach, which is focused on near term execution and underpinned by our longer term strategic vision, we are aiming to capture the co-ordinated growth opportunities available to us in our two core business areas by creating the UK's preferred financial partner for personal customers and the best bank for business.
Strategic Review 2021 builds on our core capabilities and the strong foundations from previous strategic reviews, reinforcing our customer focus. We have made significant progress in recent years, leveraging the unique strengths and assets of the Group, including our purpose driven and customer focused business model, our low risk approach to business, our market leading efficiency and our leading
multi-channel propositions including the largest digital bank and branch network in the UK. This has created the platform for Strategic Review 2021.
The UK’s preferred financial partner Through delivery of the strategy we intend to create the preferred financial partner for personal customers and the best bank for business. Delivery of our customer-centric ambitions will be supported by accelerating the Group’s transformation, with particular focus on four capabilities:
Delivering a modernised technology architecture Building an integrated payments platform Creating a data-driven organisation Implementing reimagined ways of working
Our superior cost structure has enabled us to maintain high levels of strategic investment. We will invest around £0.9 billion this year to support the Strategic Review 2021 initiatives and the long-term strength of the business.
Enhancingour
Capabilities
Building the UK’s preferred financial partner

38 Lloyds Banking Group Annual Report and Accounts 2020
Strategic review 2021: Building the UK's preferred financial partner continued
Support businesses to recover, adapt and grow
Help rebuild households’ financial health and wellbeing
Helping Britain Recover We recognise that the focus of the Group's purpose must evolve in response to the current environment and changing customer needs and expectations.
With the evolution of our strategy, we will further embed our purpose across all of our activities. This will ensure we contribute to creating an environmentally sustainable and inclusive future for the UK and by doing so build a successful and sustainable business.
The global pandemic will have lasting social and economic effects on the United Kingdom. Its impact has been felt by everyone, whether through financial hardship, reduced choices, mental distress or personal loss.
Our focus will therefore be to Help Britain Recover, and we are committed to working with others in five areas where we can make the most difference.
We will help rebuild households’ financial health and wellbeingWe remain committed to supporting our customers to become financially resilient and to plan and save for the future. We will provide practical support, and flexibility where possible, to help our customers facing financial difficulty to get back on track and help as many customers as we can to stay in their own home.
In 2021, we will:
Have over 6,500 colleagues trained to support customers to build their financial resilience Maintain our commitment to supporting mental health and become accredited as ‘Mental Health Accessible’ for Halifax and Bank of Scotland, in addition to the existing Lloyds Bank accreditation Partner with independent debt advice organisations to ensure customers have access to practical support
We will support businesses to recover, adapt and growWe will be by the side of businesses as they recover, supporting UK business to adapt and grow, and create quality jobs across the regions of the UK.
In 2021, we will:
Develop appropriate recovery plans for our customers, supported by 1,100 business specialists in communities across Britain Support at least 75,000 UK businesses to start up in 2021 Help at least 185,000 small businesses boost their digital capability through our Regional Academies, partnerships and digital mentoring
Helping Britain Recover
Enhancingour
Capabilities

Strategic reportFinancial results
Governance
Risk manag
ement
Financial statements
Other inform
ation Lloyds Banking Group Annual Report and Accounts 2020 39
Expand availability of affordable and quality homes
Accelerate the transition to a low carbon economy
Build an inclusive society and organisation
We will expand the availability of affordable and quality homes As the UK recovers from the pandemic, we aspire to a UK in which all households have access to stable, affordable and safe homes in places they want to live. We are committed to broadening access to home ownership and exploring opportunities to increase our support to the UK rental sector.
In 2021, we will:
Provide £10 billion of lending to help people to buy their first home in 2021, and lead a national conversation on how more households can access the housing market Provide £1.5 billion of new funding support, including £500 million in ESG-linked funding, in support of the social housing sector Support the creation of national sustainability standards for house-building finance and assess the energy retrofit requirements of over 200,000 homes in the social housing sector
We will help accelerate the transition to a low carbon economy With recovery comes an opportunity to build a greener future, creating new businesses and jobs for the future. We want to play our part in supporting the transition to net zero and are committed to working with customers, Government and the market to help reduce the carbon emissions we finance by more than 50 per cent by 2030 on the path to net zero by 2050 or sooner.
In 2021, we will:
Expand the funding available under our green finance initiatives from £3 billion to £5 billion, to support businesses to transition Launch a new goal to ensure our own operations are net zero by 2030 Become the first major pensions and insurance provider to target halving the carbon footprint of all our c.£170bn investments by 2030 on our path to net zero by 2050 Introduce a flagship fossil fuel-free fund to support green growth, allowing pension savers to choose to invest in UK companies pursuing a positive environmental impact
We will help build an inclusive society through our financial services offering and by creating an organisation that reflects the society we serve We believe that the economic and social recovery should be one that’s truly inclusive and involves communities across the UK's nations and regions.
In 2021, we will:
Set new aspirations for a leadership team that reflects the society we serve, of 50 per cent women, 3 per cent Black and 13 per cent Black, Asian and Minority Ethnic colleagues in senior roles by 2025 Maintain our £25.5 million contribution to our independent charitable foundations, with the Lloyds Bank Foundation for England and Wales focusing 25 per cent of its support on Black, Asian and Minority Ethnic led charities Support regional regeneration, including launching the ‘Regional Housing Growth Initiative’, helping small- and medium-sized housebuilders create more homes in the North of England, the Midlands and the regions of Scotland Support financial inclusion by providing banking for groups of people experiencing homelessness, financial abuse or victims of modern slavery and supporting the prisoner banking programme

40 Lloyds Banking Group Annual Report and Accounts 2020
Preferred financial partner for personal customers
Why this is important The COVID-19 pandemic has accelerated a number of pre-existing shifts in customer behaviours and preferences, while also starkly demonstrating financial vulnerabilities affecting customers of all ages across the UK. As the UK’s largest financial services provider, we have a unique opportunity to meet more of our customers’ broader financial needs and improve their overall resilience throughout their lifetime, with personalised and value-adding products and services that are relevant to them.
Long-term visionLeveraging our unique capabilities to meet more of our customers' needs
2021 investment focusTo achieve our vision and become the preferred financial partner for personal customers, we are focusing on three key areas of investment in 2021:
Enable financial resilience and wellbeing through dedicated customer assessment and support Significantly deepen relationships with priority segments through enhanced journeys and new capabilities Digitise to reduce cost to serve
Measures of success: Net open book mortgage growth in 2021 Maintain record all channel net promoter score in 2021 Increase priority segment customers with needs met by both Retail and Insurance and Wealth Positive annual net new money in Insurance and Wealth open book assets; to deliver a £25 billion increase by 2023
Enable financial resilience and wellbeing through dedicated customer assessment and support Consistent with our broader societal and strategic focus on Helping Britain Recover, we will use our unique position as the UK’s only integrated financial services provider to address both the short-term financial challenges facing our customers and build longer-term resilience, with products and services relevant to their changing needs.
Over the course of 2021, we will support our customers, with a dual focus on building short-term resilience through savings and borrowings, and on strengthening long-term resilience by broadening access to protection and other insurance coverage against unforeseen life events. As part of our overall approach, in 2021 we will launch a range of tools that enable a better assessment of financial wellbeing, while also building on our strong track record in supporting our most vulnerable customers by simplifying our customer treatment approaches and deploying specialist vulnerable customer support where needed.
Significantly deepen relationships with priority segments through enhanced journeys and new capabilities We have the largest personal customer franchise for financial needs in the UK, with approximately 50 per cent of UK adults having a relationship with the Group and 17.4 million digitally-active customers. We have a considerable opportunity to build on these strong foundations and significantly deepen our customer relationships, especially within our priority segments.
We will meet more of our customers’ broader banking, insurance and wealth needs throughout their lifetime, making better use of our unique scale and data insights to develop a more personalised approach and offering products and services that meet their specific needs at a time and via channels that are relevant to them. Consistent with this focus, we will make a number of further enhancements to our customer journeys, building on the significant improvements already delivered during our most recent strategic plan.
We will also broaden customer access to long-term financial planning and long-term saving with priorities including the better integration of our Schroders Personal Wealth offering across our Retail branch network. Through these and other initiatives, we expect to achieve net growth in open book mortgage balances in 2021. Looking beyond this, we are aiming to increase priority segment customers with needs met by both Retail and Insurance and Wealth propositions and expect to generate positive annual net new money into our open book Insurance and Wealth propositions, delivering a £25 billion increase by 2023.
Digitise to reduce cost to serveWe have a strong track record in simplifying customer processes to improve their overall experience and satisfaction, while also capturing operational efficiencies and cost savings. Looking ahead, we remain focused on improving the experience of all our customers, with increasing levels of data-driven personalisation being accompanied by other improvements that provide them with richer insights and put them more in control of their finances.
To achieve this and drive further improvements in operational efficiency, in 2021 we will continue to utilise the latest technologies to digitise key customer journeys and support greater levels of self-service, while also migrating high volume telephony users to digital services to reduce failure demand and improve the customer experience. In doing this, we recognise that our multi-channel approach remains important for a large number of our customers.
We will therefore continue to offer our customers a seamless experience across channels, with our branch network increasingly optimised to meet more complex needs. Taking all these elements together, in 2021 we are aiming to maintain our record all channel net promoter scores, following the all-time highs that were achieved in 2020.
Strategic review 2021: Building the UK's preferred financial partner continued
Britain's preferred financial partnerEnhancing
ourCapabilities

Strategic reportFinancial results
Governance
Risk manag
ement
Financial statements
Other inform
ation Lloyds Banking Group Annual Report and Accounts 2020 41
Best bank for business
Why this is important We are committed to remaining by the side of British businesses of all sizes, with market-leading propositions that are relevant to their very specific and evolving needs. As we emerge from the COVID pandemic, we will need to continue supporting our clients, not only with their immediate financial needs, but with a focus on helping them adapt, grow and thrive as we transition to a low carbon economy.
Long-term visionLeading digital SME bank; disciplined and strengthened large client proposition
2021 investment focusTo achieve our vision and become the best bank for all UK businesses, while also supporting a more sustainable UK economic recovery, we have identified three key areas of strategic focus and investment for 2021:
Enhance SME channel and service with increased digitisation Automate recovery support and finance the green transition Strengthen Corporate and Institutional product capabilities
Measures of success: More than 50 per cent growth in SME products originated via a digital source in 2021 5 point increase in SME and Retail Business Banking digital net promoter score by 2023 Profitably improve share in markets products for core clients in 2021
Enhance SME channel and service with increased digitisationSMEs play a vital role in the UK economy and we have remained steadfast in our support to them, having achieved significant market share growth in recent years. We will build on this track record by ensuring that our products and services continue to respond effectively to their evolving needs.
As SMEs increasingly turn to digital channels for speed, convenience and control, we will expand our end-to-end digital origination for simple products, while also enhancing self-service capabilities for day-to-day banking, with priorities in 2021 including the delivery of a self-serve platform with automated decisioning for Asset Finance products. Looking beyond banking, we will extend the capabilities of our accountancy solution for SMEs, while also making this available to more clients. Through these initiatives, in 2021 we expect to achieve at least 50 per cent growth in SME products originated via a digital source and to increase our SME and Retail Business Banking digital net promoter score by 5 points by 2023.
SMEs continue to value human interaction for their more complex needs. Through our strong network of relationship managers and leading branch network for smaller business clients we have a significant competitive advantage in responding to these needs, and will continue to upskill our colleagues to provide an enhanced service, while also delivering a more seamless experience across channels.
Automate recovery support and finance the green transitionIn 2020, we stood firmly by the side of UK business, providing support to clients impacted by the pandemic. We will continue to work closely with these clients and the Government to ensure that businesses approaching the end of COVID capital support have the best chance to build resilience, adapt and return to growth. As part of this, we will roll out a digital-led BBLs engagement model enabling clients to access support and self-serve, while also working individually with clients requiring specialist help.
We strongly believe that there is a unique opportunity to rebuild the UK economy on a more sustainable and low-carbon basis and that, through our focus on Helping Britain Recover, we can be at the forefront of this. We have already started working with our clients, the Government and the market to help reduce the carbon emissions we finance by more than 50 per cent by 2030 on the path to net zero and, as part of this, in 2021 will expand our funding for green finance initiatives from £3 billion to £5 billion.
We will also continue to help fund sustainable housing development, with other priorities including supporting the creation of national sustainability standards for new-build housing and working with housing associations to improve the energy efficiency of social housing accommodation.
Strengthen Corporate and Institutional product capabilitiesWe also have a significant presence at the larger end of the market, with over 60 per cent of FTSE 100 companies having an active relationship with the Group. We will build on the progress made in our previous strategic plan by continuing to deepen our relationships with these larger clients and strengthening our simple and low risk commercial banking offering. At the same time we will enhance our fee based client propositions, with the aim of diversifying our revenue generation.
We already provide our Corporate and Institutional clients with a personalised service proposition and tailored support: an approach which was incredibly effective as the impacts of the pandemic were felt very differently across the portfolio. We will build on these foundations by improving the alignment of our coverage model and creating an ecosystem for Corporate and Institutional clients. In addition we will modernise our markets capabilities, with areas of focus including the upgrading of our FX platform and digitisation of our rates capability. Through these initiatives, we are looking to profitably improve our share in markets products for core clients in 2021.
Enhancingour
Capabilities

42 Lloyds Banking Group Annual Report and Accounts 2020
Strategic review 2021: Building the UK's preferred financial partner continued
Modernised technology architecture
Why this is important In order to remain relevant to our customers and retain our cost leadership position in an increasingly competitive operating environment, we will need to continue modernising our technology architecture. Through this, we aim to deliver a further step change in agility and responsiveness to customer trends, while also supporting our broader strategic priorities around enhanced data insights, improved customer experience and operational resilience and efficiency.
Long-term vision Efficient, scalable and resilient cloud-based architecture, supporting business transformation
2021 investment focusWe have identified three key areas for strategic investment in 2021 to support our vision of delivering a modernised technology architecture:
Further broaden self-service capabilities through digitisation Prove and leverage public cloud to create foundations for future technology architecture Simplify legacy estate through technology optimisation
Measures of success Mobile app releases to double year-on-year in 2021 Further mobile app enhancement to maintain record mobile-app net promoter score c.30 per cent of technology applications and services migrated and c.20 per cent decommissioned by 2023 Deliver new technology architecture pilot
In doing this, we will build on the next generation capabilities and insights that we are already developing through strategic partnerships with specialist partners such as Google Cloud, Thought Machine, Microsoft Azure and Form3, as well as the new insights and capabilities that we are developing ourselves.
While our adoption of a cloud-based technology architecture is likely to be an ongoing area of focus into the long-term, we are confident that this will drive a step change in our customer propositions and efficiency.
Simplify legacy estate through technology optimisationThrough our investment in technology, we have a significant opportunity to simplify our estate, and by the end of 2023 expect to have migrated around 30 per cent and decommissioned about 20 per cent of our technology applications and services.
To achieve our longer-term ambitions, we will ultimately need to migrate our customers and relevant applications to this new environment.
In doing this, it is vitally important that our core systems and customer data remain protected and that operational continuity is maintained. To gain comfort in this regard, we will initially conduct a focused, pilot migration of our own back-book customers to the new cloud-based architecture in 2021. This will help us identify potential issues that can be effectively addressed before we replicate this migration on a much larger scale.
By the end of the year, we are aiming to have achieved a c.40 per cent reduction in applications from our legacy architecture through this pilot exercise and to have safely migrated approximately 400,000 customer accounts to the new bank architecture.
Our success in delivering these targeted milestones in 2021 will, in turn, help determine the pace and scale of our approach as we simplify our legacy estate, with a view to capturing the significant medium-term opportunities available to us, including transformed customer experiences and improved operational agility.
Further broaden self-service capabilities through digitisation In recent years we have made significant progress in the development of our technology platform and capabilities, having invested over £4 billion cumulatively in these strategic priorities by the end of 2020. This investment has, in turn, played a fundamental role in helping us to deliver a leading customer experience and in improving our operational agility, resilience and efficiency.
Our successes in these areas are reflected, amongst other things, in our digital net promoter scores, which reached a record high in 2020, our year-on-year reductions in net costs, and our ability to now make simple changes to our digital propositions intraday, as opposed to our previous 30 day release cycles.
Looking ahead, we will build on this strong track record and respond to the growing customer demand for convenience and control by broadening the self-service capabilities available to our digital customers. Consistent with this focus and our objective of maintaining our record mobile app net promoter score, we will double the number of enhancements we make to our mobile app in 2021.
Prove and leverage public cloud to create foundations for future technology architectureTo support our long-term strategic vision of building and operating an efficient, scalable and resilient cloud-based architecture, we will increase our investment in R&D to assess the customer and business benefits that next-generation technologies could have on the organisation. In 2021 we will initially focus on proving the appropriateness of public cloud for our specific customer and operational needs, with a view to assessing how this can be leveraged to create the foundations for our future technology architecture and drive the next phase of our operational transformation.
Enhancing our capabilities

Strategic reportFinancial results
Governance
Risk manag
ement
Financial statements
Other inform
ation Lloyds Banking Group Annual Report and Accounts 2020 43
Integrated payments
Why this is important In recent years digital payments have grown significantly, fuelled by the rapid rise in online shopping and e-commerce, as well as increased demand for speed, convenience, security and choice. Looking ahead, these trends are expected to continue, with the ability to offer a leading payments proposition vital in capturing this significant growth opportunity in the face of increased competitive disruption.
Long-term visionSeizing the payments growth opportunity in our customers' channel of choice
2021 investment focusFor 2021 we have identified three key areas of focus:
Enhance card e-commerce and international payments experience to drive increased customer usage Build capability and integration of new cash management and payments platform Enhance merchant services proposition with improved distribution capabilities
Measures of success Maintain leading card spend market share in 2021, with growth in credit card spend market share from 2022 3x increase in corporate clients on new cash management and payments platform in 2021 15 per cent to 20 per cent new client growth per annum in merchant services
Enhance card e-commerce and international payments experience to drive increased customer usageAs a Group, we are well-positioned to capture the significant growth opportunity associated with the accelerated shift to digital payments. We are the largest card issuer in the UK and have over a 20 per cent share in card-based payments.
In addition, we have strong participation across the payments ecosystem, ranging from more traditional debit and credit card methods across our High Street banking brands to more emerging and innovative methods across APIs and Open Banking. To capture this opportunity, we will enhance the consumer payments experience, with a focus on speed, convenience, choice and security.
Amongst other developments, in 2021 we will continue to expand real-time push notifications and will look to translate improvements in customer experience into improved loyalty, with a range of customer rewards and offers that are targeted, based on our rich data insights. Through these initiatives, our objective for 2021 is to maintain our leading share of card spend, with a longer-term objective of achieving market share growth in credit card spend from 2022.
Build capability and integration of new cash management and payments platformDuring the course of our most recent strategic plan, we significantly invested in the development of a new cash management and payments platform with leading API functionality for our corporate clients. To capitalise on this past investment, meet additional client needs across cash management and payments, and address the growing demand for payment solutions that are increasingly integrated into our clients’ clients' business flows, we will continue to enhance our platform capabilities.
As part of this overall approach, we will continue to build out our international and complex liquidity capabilities, while also improving the integration between our payments platform and other digital channels used by our corporate clients. Through these initiatives, we have set an objective of achieving a threefold increase in the number of corporate clients using our new cash management and payments platform in 2021.
Enhance merchant services proposition with improved distribution capabilitiesAgainst a backdrop of ongoing and significant growth in e-commerce and digital payment volumes, our merchant customers are increasingly demanding the ability to accept multiple payment methods, with a view to improving checkout conversion rates and lower payment costs.
To address these needs, in 2021 we will modernise our payments gateway to offer integrated journeys across different payment types as well as a range of value-added services. In addition, this will form part of a strong merchant services proposition with key features including real-time data insights and customer analytics.
To ensure that we are able to meet more of our merchant customers’ needs through these proposition enhancements, we are also focused on improving our distribution capabilities. In light of these developments, we are targeting new client growth of between 15 and 20 per cent per year in this fast-growing and evolving market.

44 Lloyds Banking Group Annual Report and Accounts 2020
Strategic review 2021: Building the UK's preferred financial partner continued
Why this is important As the UK’s largest financial services provider, processing approximately 14 billion customer transactions and interactions in 2020 alone, we have access to a wealth of customer data. In an increasingly competitive market, it is vital that we are able to appropriately use this data to create insights that deliver better customer outcomes and strengthen our own risk management processes.
Long-term visionLeveraging our data proposition to create value for all stakeholders
2021 investment focusWe have identified three key areas of strategic investment focus in 2021 to support our medium-term vision and become a data-driven organisation
Expand use of data to enable better customer and business propositions Extend machine learning capabilities to drive faster and more accurate pricing and risk decisions Deliver organisational reform of data strategy and management, supporting collaboration
Measures of success: Increase in meeting personal customer needs using advanced analytics (e.g. 20 per cent increase in home insurance needs met) >10 per cent increase in fraud detection rates from expansion of machine learning
50 per cent return on investment from year 1 investment in advanced analytics
Expand use of data to enable better customer and business propositionsAs customers’ expectations of financial services are increasingly being shaped by their experiences outside of the sector, personalisation has become an increasingly important differentiator. In our most recent strategic plan, we were able to successfully develop our data and advanced analytics capabilities to deliver more personalised propositions and improve the customer experience.
We will continue to enhance our data and advanced analytics capabilities to deliver better customer and business propositions. Through data-driven marketing we are already able to meet 20 per cent of customer needs, with the use of appropriate data insights helping to ensure that our propositions are more targeted to genuine needs and, through this, lead to better customer outcomes and response rates.
Through the further development of our capabilities in this area we are targeting a significant increase in personal customers' needs we can meet using advanced analytics, including for example, a 20 per cent increase in Home Insurance needs met.
Extend machine learning capabilities to drive faster and more accurate pricing and risk decisionsThe potential benefits from improved data and analytics capabilities extend beyond customer outcomes and an improvement in the overall customer experience, with significant efficiency and risk opportunities also available through the further development and deployment of our machine learning across key business processes.
In 2021, we will increase the use of machine learning to drive faster and more accurate pricing and risk decisions, while also expanding its usage to cover at least 50 per cent of customer transactions. We expect this approach to achieve at least a 10 per cent increase in fraud detection rates and therefore play an important role in our ongoing efforts to protect our customers and the Group from this growing threat.
In addition, advanced analytics will be used to deliver early insights into financial vulnerabilities, which is particularly important as our personal customers and business clients recover from the effects of pandemic.
Deliver organisational reform of data strategy and management, supporting collaborationIn order to realise these significant customer and organisational benefits, we will need to access our data more efficiently and flexibly, while also ensuring that we adhere to the highest standards of data management and protection. To achieve this, we will implement organisational changes in respect of our data strategy and management and will establish centralised centres of excellence to help drive innovation and develop best data practice that can be consistently deployed across the Group.
In addition, we will further embed data and analytics capabilities within our business functions, with the aim of achieving a more effective alignment between our technical and business expertise. Through this approach, we also expect to be able to direct our strategic investment in a more effective and immediate way, in turn helping us to deliver greater financial and operational benefits. Through this and our broader approach to data, we expect to be able to deliver a 50 per cent return on our investment in advanced analytics in the first year.
Enhancing our capabilities
Data-driven organisation

Strategic reportFinancial results
Governance
Risk manag
ement
Financial statements
Other inform
ation Lloyds Banking Group Annual Report and Accounts 2020 45
Further build our purpose-led culture through refreshed values and behavioursHelping Britain Prosper is at the heart of everything we do. We want all of our colleagues to be able to identify with this purpose, while also recognising how they are contributing to Britain’s recovery.
To achieve this and ensure that our culture continues to accurately reflect our purpose, we will rollout a new behaviours framework and aligned purpose driven values. Our colleagues continue to demonstrate great determination, flexibility and mutual support during the pandemic as they adapt to new circumstances and new ways of working. We recognise the importance of retaining the positive learnings and behaviours from this challenging period as we continue to explore new ways of working.
During the pandemic, we increased the support available to our colleagues for their physical and mental health, with the wellbeing of our people remaining a key priority going forward. Through all of these initiatives, we are aiming to maintain our leading employee engagement scores in 2021 and beyond.
Build career pathways to attract and retain a more diverse, skilled and future ready workforceWe were the first FTSE100 company to introduce targets for senior roles held by female and Black, Asian and Minority Ethnic colleagues and have made significant progress towards these ambitious goals. We will build on this, with the goal of ensuring our workforce is more diverse and mirrors the society we serve. Consistent with this, we will increase female and Black, Asian and Minority Ethnic representation at the most senior levels, with the aspiration of increasing this to 50 per cent and 13 per cent respectively by 2025.
As our business becomes increasingly technology-driven, we will need to continue attracting and developing future skills. We have already exceeded our recent colleague training targets and reduced our dependency on external contractors.
Why this is important Our people are crucial to the success of the Group and our purpose. To retain this source of competitive advantage, we must evolve our colleague proposition to reflect new working patterns and colleague expectations post COVID, while also delivering a sustainable workspace that supports increased collaboration and innovation. We must also invest in developing future skills, ensuring that everything we do is underpinned by a purpose-driven and inclusive culture.
Long-term visionPurpose-led future ready and inclusive workforce in a transformed workspace
2021 investment focusIn order to evolve to a future-ready workplace, ways of working and workforce, our activity and investment will centre around three areas in 2021:
Further build our purpose-led culture through refreshed values and behaviours Build career pathways to attract and retain a more diverse, skilled and future ready workforce Deliver sustainable workplace solutions, including reduced office footprint
Measures of success: Maintain leading Employee Engagement Index Aspiration of 50 per cent of senior roles held by women and 13 per cent senior roles held by Black, Asian and Minority Ethnic colleagues by 2025 8 per cent reduction in office space in 2021, with c.20 per cent cumulative reductions by 2023.
We will build on this, with a range of initiatives designed to help us attract targeted skills. We will also continue to encourage our colleagues to develop future-ready skills, while providing them with tailored and easily-accessible content to achieve this. In addition, we recognise that new ways of working, hybrid workplaces and more agile working patterns will also require softer skills and leadership capabilities, and we will work with all our colleagues to ensure they have the right foundations to succeed in this new normal.
Deliver sustainable workplace solutions, including reduced office footprintThe pandemic has led to unprecedented change in the way companies operate, while also accelerating the shift to more agile working patterns. While recent internal surveys show that the vast majority of our colleagues would like to retain some form of home working, offices will undoubtedly remain important for colleague interaction, collaboration and innovation.
In response, we will deliver a reduced, sustainable and future ready office footprint, with activity expected to commence in several of our collaboration hubs as we emerge from the COVID crisis. These programmes, which are expected to deliver an 8 per cent reduction in our office space in 2021 as well as cumulative reductions of c.20 per cent by 2023, will be informed by behavioural experiments and pilots that will help us determine the future look of our offices and ways of working.
We will also reduce our own carbon footprint, with key initiatives including improved energy efficiency across our office and branch real estate, new ways of working and reduced travel requirements. Consistent with this focus, we have set a target of achieving net zero carbon operations by 2030.
Reimagined ways of working

46 Lloyds Banking Group Annual Report and Accounts 2020
COVID-19 responseThe Group’s response to the COVID pandemic has been a central focus for the Board since the start of the outbreak. The Board has sought to take all possible steps to support customers through these challenging times.
Regular Board updates from across the Group identified key areas of customer concern. In addition, the Group Chief Executive attended virtual customer engagement events, which provided an important opportunity for customers to raise directly any concerns on the matters of most significance to them. Areas of worry included customers’ ability to meet their ongoing financial commitments, and to continue to operate their businesses as the extent of the economic impacts emerged.
The Board considered and approved the Group’s vital role in the Government’s COVID related business loan schemes, which provided funding to a range of client businesses across a number of economic sectors. Customer payment holidays were also introduced, complementing other means of Group support, including removing fees for missed payments and access to fixed term accounts without charge.
The Board supported further key actions, including the launch of two initiatives with digital inclusion training provider, We Are Digital. These included providing tablet devices free of charge to over-70s isolated by COVID, and a dedicated phone line giving vulnerable customers support in staying connected with digital activities, including managing online banking. The Board was also keen that the Group play a part in tackling the isolation many feel as a result of the crisis. The Group was therefore pleased to partner with Age UK in providing The Silver Line, a 24/7 helpline for those aged 55 and over who may be feeling lonely or isolated.
The essential nature of a deep understanding of challenges faced by customers in financial difficulty was also highlighted by the pandemic. The Board was updated regularly on the needs of these customers, which resulted in the provision of additional support. This included increasing our capacity to serve customers who needed the help of a colleague, and delivering related self-serve functionality where preferred by customers.
Customer feedbackCustomer feedback is always a priority for the Board. Regular updates are provided which give valuable insight into the Group’s performance in delivering on our customer-related objectives, and on improving customer outcomes.
With Board oversight, new means of sharing customer views were developed for use over the coming year. These will provide greater insight not only on customer experience, but also on the progress being made to improve customer satisfaction in the areas of most importance. This will in turn help in ensuring the Board can continue to focus on the things that matter most to our customers and our clients.
The Board recognises the importance of understanding our performance in supporting customers, including how the Group performs relative to our peers. Related updates covered a range of internal and external measures, including customer indices and market share updates. Such updates provided important insight, and enabled the Board to recommend suitable customer related actions.
Helping Britain RecoverThe needs of customers once the pandemic abates has also been a focus for the Board. This has included providing direction for the development of our Helping Britain Recover ambitions, building on the Group's purpose of Helping Britain Prosper.
These ambitions seek to address the changes in priorities for our stakeholders, including our customers, as the country emerges from the pandemic.
The Board oversaw the development of these ambitions, which aim to make sure the Group’s purpose remains aligned to a changing society, fully integrating our societal objectives with our business objectives. Read more on the Board’s role in this process on page 49.
Technology transformationThe Board has taken steps to make sure the Group continues to build on its response to customer demand for technology. Digital transformation has therefore remained a key focus, including supporting the development of the Group’s Cloud strategy, and the ongoing roll-out of technological developments for customers, discussed further on page 51.
More detail COVID-19 response Read more on pages 1 to 3Helping Britain Recover Read more on pages 38 to 39Technology transformation Read more on page 18
The Board is responsible for the long-term success of the Company, setting and overseeing the culture, purpose, values and strategy of the Group. The Board’s understanding of stakeholders’ interests is central to these responsibilities, crucial to the Company’s success, and informs key aspects of Board decision-making as set out in this statement.
Stakeholder engagement is embedded in all aspects of the Board’s decision-making and can be seen in the range of tailored activities across the stakeholder groups. It is also embedded in the Board’s delegation of the management of the business to the Executive, with examples of related action taken included across the report, in particular the sections referenced under ‘More Detail’.
The Executive, including the Group Chief Executive and Chief Financial Officer, provide the Board with details of material stakeholder interaction and feedback, through regular business updates. Stakeholder interests are also identified by the Executive in the wider proposals put to the Board.
This year interaction with stakeholders was adapted to comply with the Government’s measures in relation to COVID-19, and has been undertaken virtually as necessary.
This section (pages 46 to 51) acts as our Section 172(1) statement; but, given the importance of stakeholder interests, our reputation for high standards of business conduct and a long-term perspective, these matters are discussed where relevant throughout the report.
Our key stakeholders and Board engagement
Reflecting the needs of our stakeholders in Board decisionsCUSTOMERS
The Board’s deep understanding of customers’ needs is vital in setting and achieving the Company’s goals. Customer needs and a customer-centric approach remain therefore a key consideration in Board decisions.
Section 172(1) StatementIn accordance with the Companies Act 2006 (the ‘Act’), the Directors provide this statement describing how they have had regard to the matters set out in section 172(1) of the Act, when performing their duty to promote the success of the Company, under section 172. Further details on key actions in this regard are also contained within the Corporate Governance Report on pages 81 to 110 and the Directors’ Report on pages 111 to 114.
This statement also provides details of how the Directors have engaged with and had regard to the interests of our key stakeholders.

Strategic reportFinancial results
Governance
Risk manag
ement
Financial statements
Other inform
ation Lloyds Banking Group Annual Report and Accounts 2020 47
The Group places great importance on making sure shareholders are effectively briefed on strategic and financial progress, in addition to considering their valued feedback. Comprehensive disclosure is provided with results and, given the increasing focus of investors on ESG matters, we now issue a specific ESG-focused presentation for investors ‘Our approach to ESG’.
The Group undertook more than 340 institutional investor meetings in 2020, many of which were with management, and also hosted a retail investor event. In addition, various Non-Executive Directors engaged directly with shareholders through the year, including the Chair and the Remuneration Committee Chair. Meetings held by the Chair largely focused on corporate strategy, governance and sustainability, while the Remuneration Committee Chair consulted extensively on the new remuneration policy, both pre and post the 2020 AGM.
To ensure investors were fully briefed on Group governance initiatives a Governance event was also held in November, hosted by the Chair and the Chairs of all the Board Committees. Key topics discussed included governance, sustainability and remuneration, and it provided an excellent forum for Board members to hear directly investor views on key topics.
Board members are also kept up to date on market views and shareholder sentiment by Investor Relations, including an annual presentation with the Group’s corporate brokers on market dynamics and corporate perception. The Board’s Nomination and Governance Committee considers correspondence received from institutional shareholders, with feedback provided to the Board on material retail shareholder correspondence.
The Annual General MeetingThe Board recognises that the Annual General Meeting (‘AGM’) is an important opportunity for shareholders, institutional and retail alike, to hear from and engage with the Board.
The Board was keen that 2020’s AGM adapt to the challenges of the pandemic, and provision was made so shareholders could access as many of the benefits of an AGM as possible.
The opportunity was provided for shareholders to hear from and put questions to the Board, on a virtual basis in line with safety guidance. Answers to questions, and remarks from the Chair and Group Chief Executive were also made available online.
Given the importance of the AGM in shareholder engagement, the Board continues to consider what will be possible for the 2021 meeting. The Board is especially keen to make sure the best possible engagement is safely available for shareholders.
Succession planningThe Board recognises the key role played by the Chair and the Group Chief Executive in the Group’s future success, and the relevance of these important appointments to all of the Group’s stakeholders, including to our many shareholders.
Considerable time was therefore given to the processes relating to succession and recruitment to these positions, which concluded in the appointment of Robin Budenberg as Chair, and confirmation that Charlie Nunn would be appointed as Group Chief Executive. These processes are discussed in greater detail in the report of the Board’s Nomination and Governance Committee on page 98.
Future strategy The Board considered the development of the next phase of the Group’s strategy, to be implemented during 2021. To help in this, dedicated sessions were held with the Executive in both June and November, to shape strategic priorities and agree how these would be implemented.
Consideration was given to feedback from key stakeholders, including understanding the priorities of the Group’s shareholders in respect of our strategic direction. The Group’s approach to the environment and climate change was of particular importance in shaping strategy, and is discussed further on page 50.
More detail Annual General Meeting Read more on page 344Appointment of new Chair Read more on page 99Appointment of new Chief Executive Read more on page 99Future strategy Read more on pages 36 to 45
ECONOMYSHAREHOLDERS
The Group has the largest shareholder base in the UK, with around 2.3 million shareholders including most employees.
The Board recognises the importance of understanding the priorities of different shareholder groups when developing and implementing strategy, with ongoing engagement with both institutional and retail shareholders.
Despite the challenging economic environment, the Group has delivered a robust financial performance, and demonstrated resilience and ability to continue to generate capital. This has been supported by our customer-centric strategy and the strength of our balance sheet.
At the end of March, in response to a request from the PRA the Board took the decision not to make quarterly or interim dividend payments, accrual of dividends, or share buybacks on ordinary shares. While the Board understood this was a difficult decision from the perspective of the Group's stakeholders, it was nonetheless important in helping the Group serve the needs of businesses and households through the extraordinary challenges of COVID-19.
In addition, to preserve additional capital for use in serving our customers, the Board agreed to cancel the final 2019 dividend on ordinary shares.
These were hard decisions for the Board. They involved balancing the interests of our shareholders, for whom regular distributions are important, and those of our customers, many of whom needed additional support during the pandemic.
The Board has recommended a final ordinary dividend of 0.57 pence per share, the maximum allowed under the Prudential Regulation Authority's temporary framework on 2020 distributions.
The decision is supported by the regulator, and follows extensive shareholder feedback and discussion with other stakeholders. Read more about our approach to dividends on page 68.
KEY BOARD DECISIONDIVIDENDS
Link to strategic priorities
Leading customer experience
The Board is pleased that despite the challenges which the year has presented, the Group’s strong performance has enabled us to recommence dividend payments, and recommend to shareholders a final ordinary dividend of 0.57 pence per share.Robin Budenberg Chair

48 Lloyds Banking Group Annual Report and Accounts 2020
The Board considers that maintaining open dialogue is crucial in informing its thinking, allowing Directors to hear first-hand the varied colleague views on the matters most important to them, and to the Group.
The Board agreed in 2019 its approach to workforce engagement, which has remained unchanged during the year. The definition of workforce agreed by the Board is our permanent colleagues, contingent workers and third-party suppliers that work on the Group’s premises delivering services to our customers and supporting key business operations.
The Board continues to receive Workforce Engagement reports which comprises two component parts, a summary of the Board’s engagement activity with colleagues, and key themes raised by colleagues and trends on people matters. These covered all matters of colleague engagement, in particular key and emerging issues for colleagues, including Group culture and our response to the COVID pandemic.
During the year the Board communicated with colleagues through a number of means. These included informal colleague lunch and breakfast meetings, held by the Group Chief Executive and the Chair, and attended by Non-Executive Directors.
Virtual Town Hall sessions were hosted by both the Chair and the Group Chief Executive. These were complemented by engagement sessions led by other senior leaders, with feedback from all sessions shared with the Board. Town Hall sessions were particularly helpful in allowing colleagues the opportunity to ask questions, share their views, and receive a direct answer in real time.
During the year the Board gained further understanding of colleague views through a number of surveys completed by colleagues across the Group. These included the annual colleague survey, ad hoc ‘Pulse’ surveys, and participation by colleagues in the survey of the Banking Standards Board.
The Board considers these arrangements invaluable in giving them an understanding of the views of the workforce and encouraging meaningful dialogue between the Board and the workforce.
During the year the Group also communicated directly with colleagues detailing Group performance, changes in the economic and regulatory environment and updates on key strategic initiatives.
Meetings were also held throughout the year between Group representatives and our recognised unions.
The Group offers a competitive and fair reward package. Colleagues are eligible to participate in HMRC-approved share plans which promote share ownership by giving employees an opportunity to invest in Group shares. Further information can be found on page 136 in the Directors’ Remuneration Report.
Culture accelerationFollowing engagement, cultural acceleration initiatives have been a focus for the Board as the Group looks to accelerate the cultural change started in 2019.
The Board reviewed plans to further improve ways of working, encourage greater collaboration, and continue the reduction in bureaucracy. Opportunities were encouraged to promote simplicity in process and practice wherever possible.
A number of related initiatives were successfully completed during the year. These included a project to simplify the Group’s Committee structure, and retain a more agile approach to decision-making which had been necessary during the pandemic.
DiversityThe Board believes a diverse workforce is vital to the Group’s success, and values the differences each colleague brings to their role, making the Group stronger and better able to meet the needs of our customers.
In support of this the Board approved in July 2020 the introduction of our Race Action plan, designed to drive race related cultural change, recruitment and progression across the Group. The plan will be taken forward by a dedicated team, who will work with a newly formed Race Advisory Panel to further develop and implement the plan over the coming year.
The Board also approved a target to increase Black representation in senior roles to at least 3 per cent by 2025. This complemented the Group’s broader 2018 Black, Asian and Minority Ethnic representation targets of 10 per cent overall, and 8 per cent at senior management levels.
More detail Colleague engagement Read more on page 29Diversity Read more on page 25Speak Up Read more on page 30
Our key stakeholders and Board engagement continued
COLLEAGUES
While the COVID pandemic has been challenging for our customers, it has also posed challenges for our colleagues. The Board was therefore keen to ensure colleagues received all the support the Group could give.
Regular and open engagement with colleagues was crucial, with the Group Chief Executive undertaking a series of related video broadcasts, keeping colleagues informed of developments.
This was supported by other members of the Executive, including colleague Q&A sessions held by the Group’s People Director, where colleagues posed the questions which mattered to them most.
The Board agreed various measures of support for colleagues in response to the crisis. These included the temporary suspension of staff reductions, enhancements to working environment safety, flexible holiday entitlement and a commitment to pay colleagues in full, regardless of how their work had been impacted.
The Board took steps to ensure along with the Executive that colleague wellbeing was prioritised. Resources were made available to help colleagues in adjusting to the changing circumstances, including support in areas such as work life balance, health and financial management.
The Board considered it important that priority continue to be given to supporting colleague mental health. A number of related steps were taken, including support via the Group’s ‘Your Resilience’ portal, with new content to address the challenges colleagues faced as a result of the pandemic. The Group’s partnership with Headspace was also extended, offering all colleagues a free subscription to an app providing access to modules covering a range of mental health related topics.
The Board was also keen the Group’s response should include faster roll-out of our Digital Workplace programme, which on completion allowed the majority of colleagues to work from home. The Board in addition approved a recognition payment to frontline colleagues, in thanks for their efforts in supporting our customers during the pandemic.
The Board has considered how colleague working practices will develop beyond the COVID crisis, in particular how more flexible and efficient ways of working seen during 2020 could be retained.
This included the agreement of steps to be taken by the Executive to ensure the Group’s workplace continues to evolve with both the needs of the business, and the changing ways in which colleagues wish to work.
KEY BOARD DECISIONCOVID RESPONSE
Colleagues are vital to the delivery of the Group’s strategy and ambitions. This is recognised by the Board in its engagement with colleagues throughout the year.

Strategic reportFinancial results
Governance
Risk manag
ement
Financial statements
Other inform
ation Lloyds Banking Group Annual Report and Accounts 2020 49
Helping Britain RecoverThe Board has given much focus to overseeing the development of the Group’s Helping Britain Recover ambitions. This continues our strategy of Helping Britain Prosper, designed to play a part in the UK’s recovery from the COVID pandemic, and is discussed in more detail below.
The views of stakeholders have informed the development of these ambitions, which aim to integrate fully the Group’s societal objectives with its business objectives, and will be key in the next phase of our strategy.
Environmental ambitionsDuring the year the Board approved an ambitious goal, working with customers, Government and the market to help reduce the carbon emissions the Group finances by at least 50 per cent by 2030. With the Group's 2030 carbon emission reduction goal for our own operations met, the Board also considered the development of new internal carbon, energy and travel targets. Consideration was also given to the development of several new green finance products, tools and services.
A commitment was approved to invest £2 billion in BlackRock’s ACS Climate Transition World Equity Fund, via Scottish Widows' default fund offering. The Group’s investment will make up 10 per cent of the equities portion of our default pension investment approach within Scottish Widows, focused on investing in the companies already at the forefront of decarbonisation and responsible use of natural resources. The Board’s consideration of environmental ambitions is discussed further on page 50.
Regional AmbassadorsThe Board continues to value the support provided by the Group’s ten regional ambassadors, who between them help in establishing strong relationships with local politicians, councils and other community institutions across the UK.
The feedback of these ambassadors informs not only the Board’s view of stakeholder priorities, but allows the Group to offer locally its insight on the major economic and social debates the country faces.
Charitable FoundationsThe Board continued to support the work of the Group's charitable Foundations. Together during the year they have funded local charities in tackling issues ranging from financial disadvantage and social exclusion, to domestic abuse and modern slavery.
As well as grant funding, the Foundations offer charities additional support, with mentoring, learning, training and networking support also provided.
The Board was particularly pleased at the positive impact of the Foundations in helping charities respond locally to the COVID crisis. During the year the Board agreed the Group would continue to fund the important work of the Foundations in 2021, at levels of funding in line with those of 2020.
The Chair undertook virtual visits to several charities supported by the Foundations, including the Tom Harrison House in Liverpool, providing important insight into the role of the Group in supporting communities across the UK.
More detail Environmental ambitions Read more on pages 20 to 24Helping Britain Recover Read more on pages 38 to 39Charitable Foundations Read more on page 29
The Board considered it vital that the Group as one of the UK’s main financial services providers plays a key role in the country’s plan to rebuild the economy.
In September 2020 the Group launched The Big Conversation: Helping Britain Recover. A three-month series of roundtable discussions were held across all nations and regions of the UK, which encouraged open debate of the challenges facing the country during the pandemic, and how the UK could emerge with an economy that is more resilient and more sustainable.
The Big Conversation brought together many of the Board’s key stakeholders, including businesses, community members, policy makers and subject-matter experts across the UK’s nations and regions. Focus was given to discussing the support and policy interventions that these stakeholders considered necessary for a strong recovery from the pandemic.
A final report, published in December 2020, was shared with all participants as well as with key politicians and policy makers, and is available on the Group’s website. The Board was pleased the Group was in this way able to amplify its stakeholders’ voices to those who can make a difference. We anticipate extending this initiative in 2021 to encompass more topics of importance to our stakeholders.
In addition, the Board agreed in June that it was important to build a long-term framework which would help the Group more fully integrate its business ambitions with its societal objectives, acting wherever possible as a positive driver for change.
After considering recommendations from the Executive, built around feedback from stakeholders, the Board concluded the plan would focus on five key areas of stakeholder priority. These included Help rebuild households’ financial health and wellbeing, Support businesses to recover, adapt and grow, Expand availability of affordable and quality homes, Accelerate the transition to a low carbon economy and Build an inclusive society and organisation.
In 2021, we’ll continue to listen to our key stakeholders from across the UK to understand what local communities and economies need to emerge from the pandemic stronger and more resilient.
KEY BOARD DECISIONHELPING BRITAIN RECOVER
As one of the largest financial services providers in the UK, the Group has a presence in almost every community. As such, the Group places great importance on engagement and action to help these communities prosper, and build a more sustainable future. This has been a core consideration for the Board in the development of the Group’s next strategic phase.
The Board is supported in environmental and community matters by its Responsible Business Committee. This Committee supports the Board with consideration of stakeholder views on all matters relating to the Group’s goals to be a trusted, sustainable and responsible business.
Link to strategic priorities
Leading customer experience
COMMUNITIES AND ENVIRONMENT

50 Lloyds Banking Group Annual Report and Accounts 2020
KEY BOARD DECISIONENVIRONMENTAL AMBITIONS
COVID responseExtensive engagement was needed with regulators and Government in the initial response to the COVID crisis. This helped ensure the Group’s response could both best support our customers, but also remain in step with Government priorities for supporting the stability of the wider UK economy.
Senior leaders worked closely with the FCA, PRA and representatives of HM Treasury to agree the Group’s participation in the COVID related support schemes, keeping the Board apprised of all developments.
Following these interactions, the Board approved the Group’s participation in the Government’s economic response, successfully providing our customers with access to the Government’s support measures and loan schemes.
The Board continued to review the provision of this support as the year progressed, remaining close to the developing priorities of Government and of our regulators, as well as the impact on our customers and business.
Regulatory agendaThe Chair and individual Directors, in particular the Chairs of the Board’s Committees, have in the ordinary course of business had continuing discussions with the FCA and PRA on a number of aspects of the regulatory agenda.
The Board in turn reviewed regular updates on this and wider Group regulatory interaction. This provided a view of key areas of regulatory focus, alongside progress being made in addressing key regulatory priorities.
Key areas of regulatory interest for the Board have included ensuring robust prudential standards, the fair treatment of customers, and the Group’s ongoing response to market changes. During the year such changes have included not only the response to COVID, but the UK’s exit from the EU, in addition to climate change responsibilities, and ensuring the Group’s ongoing financial and operational resilience.
Board members proactively engage with the regulators across all these areas, in addition to a standing programme of monthly updates, including to the Board’s Risk Committee.
These updates cover all aspects of the regulatory agenda, with emerging regulatory and legal risks, in addition to an overview of the Group’s wider regulatory interaction. This provides a focused view of areas of priority, alongside detail of regulatory actions, and enforcement activity.
The Board continues to closely monitor the status of the Group’s regulatory relationship, seeking to enhance engagement particularly in key areas of regulatory change. During the coming year this is expected to include the ongoing impacts of COVID, including customer relief, in addition to EU exit transition, climate risk management, dividend distribution and remuneration policy.
More detail COVID-19 response Read more on pages 1 to 3Environmental ambitions Read more on pages 20 to 24
REGULATORS AND GOVERNMENT
Our key stakeholders and Board engagement continued
As a signal of the Group’s commitment to sustainability, the Board approved an ambitious goal to reduce the emissions we finance by 2030, on the path to net zero by 2050 or sooner.
Achieving these goals will not be easy, and the Board recognises the Group will need to take a number of actions.
These will over the coming years include investing in our buildings, removing the use of natural gas from our estate, and progressing our plans for zero carbon branches in communities across the UK. Many of the technologies needed are still new. The Board therefore recognises that close work will be needed with our partners and suppliers in developing innovative new solutions.
Some initiatives were however approved for 2020, including the launch of a number of green finance products, tools and services. These included the Green Buildings Tool, a free to use insight tool, launched specifically for Commercial Banking clients. The tool helps clients identify energy efficiency improvements relating to both commercial and residential buildings, along with the associated costs and benefits of those improvements.
The tool also complements the existing Green Lending Initiative in the real estate and housing sectors, and our Clean Growth Finance Initiatives across all of Commercial Banking’s sectors.
The Board was also pleased that the Group was able to launch its Green Living and Eco Home Hub for Halifax and Lloyds Bank customers. This online tool is first in the market amongst lenders, providing mortgage customers with a tailored action plan on home improvements which can help improve sustainability.
Further initiatives included the introduction of the Sustainability Fixed Term Deposit and 95 Day Notice Accounts, where deposited funds are used to support sustainability ambitions.
The Board will continue to oversee initiatives to help the Group achieve its sustainability goals, which will form a core part of the Group’s strategy in the coming years.
The Board and the Group continue to maintain strong, open and transparent relationships with our regulators and Government authorities, including key stakeholders such as HMRC and HM Treasury.
Liaison with regulators and Government is an ongoing priority, at all levels of the organisation, allowing the Board to ensure the Group’s strategic aims align with the requirements of these important stakeholders.
Link to strategic priorities
Leading customer experience
As the amount of new regulation continues to increase, and uncertainty remains about the impact of the UK’s exit from the EU on regulatory frameworks, the Board recognises the importance of continuing to strengthen the Group’s relationships with our key regulators.Sara Weller Independent Director

Strategic reportFinancial results
Governance
Risk manag
ement
Financial statements
Other inform
ation Lloyds Banking Group Annual Report and Accounts 2020 51
Supplier experienceRecognising the role of suppliers in the Group’s day-to-day operations, and its future ambitions, the Board was keen that supplier experience be continually reviewed in order that it may be improved wherever it was possible to do so.
As such the Board regularly considered supplier feedback on the Group’s processes, ensuring areas of potential improvement were acted upon.
Supplier frameworkA Board-approved framework ensures the most significant supplier contracts receive the approval of the Board.
This has during the year included those supporting the Group’s digital ambitions, as discussed in more detail below, with the Board approving certain supplier contracts which were key in progressing this strategic priority.
The framework also ensures appropriate Executive oversight of supplier spending not considered by the Board, allowing challenge to be made where appropriate, and minimising risks and unnecessary cost. The Board reviewed updates on material related actions.
Supplier payment The Board recognises that late payment of suppliers can represent a significant financial impact for them.
As such the Board seeks to ensure the Group’s supplier payment practices continue to meet wider industry standards.
To that end, the Board’s Audit Committee considered reports from the Group’s Sourcing and Finance teams on the efficiency of supplier payment practices, including those relating to the Group’s key supplier relationships.
Supply Chain Resilience The impacts of the COVID crisis have been no less material within the Group’s supply chain, with the Board keen to ensure these important relationships were not unduly impacted. The Board has also been mindful of the effects of the EU Exit on the Group’s supply chain, as the UK approached the deadline of the related transition period.
Related updates were considered on the work of the Group’s Supply Chain Resilience programme. This along with the Supplier Framework provided valuable assurance on the Group’s most critical supplier relationships, including those located in the EU. In particular the Board considered the work of the Group’s Incident Management process and the contribution from sourcing and supply chain SME’s from across the Group, an important means of support to key suppliers in managing the impacts of COVID on their relationships with the Group.
The Board recognised the challenge of preparations by suppliers for finalisation of the EU Exit, in particular when combined with the pressures of the COVID crisis. This included regular related updates for suppliers provided using the Group’s website.
Modern slavery The Board continues to have a zero tolerance attitude towards modern slavery in the Group’s supply chain, receiving updates on progress made in the ongoing enhancements to our supplier practices.
These included measures which address the risk of human trafficking and modern slavery in our wider supply chain.
More detail Responsible sourcing Read more on page 31
SUPPLIERS
As part of how the Group can continue to Help Britain Recover, the Board agreed that digital investment played a key role, enabling the Group to best adapt to and support our stakeholders’ developing priorities.
The Board agreed that as we prepare for the next phase of our strategy, acceleration of our approach to the public cloud was central in further digitising our business, enabling us to greatly improve the experience of both our customers and of our colleagues.
While the Group has already taken some big steps in digital transformation, modernising how we serve customers, and changing how we work, the Board agreed that cloud technology was key to building on this progress.
This will include continuing to simplify our IT systems, and enhancing our IT architecture. Combining future-proofed cloud technology with smart customer data and insight, we want to deliver an even better and more personalised experience, regardless of the channel a customer chooses to do business with us.
Progress overseen by the Board has included the mobilising of the Group’s new Cloud Centre of Excellence, an important step in harnessing the opportunities cloud technology presents.
The Board held two deep dive sessions in June and October to review the Group’s cloud strategy in detail. This allowed debate and challenge of the risks and further development of plans. The Board also participated in an insights programme on cloud technology to augment their current knowledge and understanding.
The Board has also overseen progress in the Group’s use of external platforms, key in establishing our cloud services. The Board’s IT and Cyber Advisory Forum has assisted in this by reviewing detailed aspects of the cloud strategy.
The Board was pleased that, despite the challenges of the pandemic, progress was also made in delivering technological developments which have helped to further improve our customer experience. These included industry leading capability for customers to view and cancel subscription services for items such as their monthly TV streaming and broadband service providers, paid for via their current account. Functionality was also introduced allowing more of our general insurance customers to submit their claims digitally, improving the speed and efficiency our claims process.
KEY BOARD DECISIONDIGITAL TRANSFORMATION
Link to strategic priorities
Leading customer experience
Maximising Group capabilities
We rely on a number of partners for important aspects of our operations and customer service provision.
The Board recognises the importance of its role in overseeing these relationships, which are integral to the Group’s future success.
The Board recognises that the Group’s supply chain, and ensuring strong and mutually beneficial relationships with our suppliers, are key to the Group’s ongoing success.Catherine Woods Independent Director

52 Lloyds Banking Group Annual Report and Accounts 2020
Financial performance reflects the challenging economic environment The Group’s statutory profit before tax for the year was £1,226 million with statutory profit after tax of £1,387 million. Both measures were impacted by the significant impairment charge taken during the year, the majority of which was recognised during the first half and reflected the Group’s revised economic outlook for the UK, following the outbreak of the coronavirus pandemic. In the fourth quarter, statutory profit before tax was £792 million and statutory profit after tax was £680 million, both benefiting from improved business conditions and a reduced impairment charge.
Trading surplus for the year was £6,440 million, a reduction of 27 per cent on 2019, reflecting the challenging external environment. Net income was down 16 per cent to £14,404 million, driven by both lower net interest income and lower other income. The Group has maintained its focus on delivering cost savings, with total costs down 4 per cent, while continuing to invest in the Group's digital propositions.
The Group’s underlying profit was £2,193 million for the year, compared to an underlying profit of £7,531 million in 2019, reflecting lower net income and the significant impairment charge of £4,247 million taken in 2020.
The Group’s balance sheet remains very strong. Loans and advances to customers were flat on prior year at £440 billion. This includes an increase in open mortgage book net lending of £7.2 billion in the year, with £6.7 billion growth in the fourth quarter, reflecting the strength of the UK housing market. Total customer deposits increased by £38.9 billion in the year, to £450.7 billion. Retail current account growth was £20.5 billion in 2020 and ahead of the market, driven by lower levels of customer spending during the pandemic and inflows to the Group’s trusted brands. Commercial Banking current account growth also illustrates the Group's strong customer relationships and a proportion of the Government-backed lending being retained on deposit by SME customers.
The Group’s CET1 capital ratio post dividend increased 242 basis points over the year, from 13.8 per cent on a pro forma basis to 16.2 per cent, or 16.4 per cent pre dividend accrual.
Income statement – underlying basis
2020£m
2019£m
Change%
Net interest income 10,773 12,377 (13)
Other income 4,515 5,732 (21)
Operating lease depreciation (884) (967) 9
Net income 14,404 17,142 (16)
Operating costs (7,585) (7,875) 4
Remediation (379) (445) 15
Total costs (7,964) (8,320) 4
Trading surplus 6,440 8,822 (27)
Impairment (4,247) (1,291)
Underlying profit 2,193 7,531 (71)
Restructuring (521) (471) (11)
Volatility and other items (361) (217) (66)
Payment protection insurance provision (85) (2,450)
Statutory profit before tax 1,226 4,393 (72)
Tax credit (expense) 161 (1,387)
Statutory profit after tax 1,387 3,006 (54)
Earnings per share 1.2p 3.5p (66)
Dividends per share – ordinary 0.57p 1.12p
Banking net interest margin 2.52% 2.88% (36) bp
Average interest-earning banking assets £435bn £435bn –
Cost:income ratio 55.3% 48.5% 6.8 pp
Asset quality ratio 0.96% 0.29% 67bp
Return on tangible equity - existing basis 3.7% 7.8% (4.1) pp
Return on tangible equity - new basis 2.3% 6.6% (4.3) pp
Key balance sheet metrics
At 31 Dec2020
At 31 Dec2019
Change%
Loans and advances to customers1 £440bn £440bn –
Customer deposits2 £451bn £412bn 9
Loan to deposit ratio 98% 107% (9)pp
CET1 ratio3,4 16.2% 13.8% 2.4pp
CET1 ratio pre IFRS 9 transitional relief3,4 15.0% 13.4% 1.6pp
Transitional MREL ratio3,4 36.4% 32.6% 3.8pp
UK leverage ratio3,4 5.8% 5.2% 0.6pp
Risk-weighted assets3 £203bn £203bn –
Tangible net assets per share 52.3p 50.8p 1.5p
1 Excludes reverse repos of £58.6 billion (31 December 2019: £54.6 billion).
2 Excludes repos of £9.4 billion (31 December 2019: £9.5 billion).
3 The CET1, MREL and leverage ratios and risk-weighted assets at 31 December 2019 are reported on a pro forma basis, reflecting the dividend paid up by the Insurance business in the subsequent first quarter period. The CET1 ratio pre IFRS 9 transitional relief reflects the full impact of IFRS 9, prior to the application of transitional arrangement for capital that provide relief for the impact. Excluding dividend accrual, the CET 1 ratio at 31 December 2020 was 16.4 per cent.
4. CET1 ratios at 31 December 2020 include an increase of 51 basis points following the implementation of the revised capital treatment of intangible software assets. The benefit through CET1 capital is reflected through the MREL and leverage ratios.
Financial performance overview
Group

Strategic reportFinancial results
Governance
Risk manag
ement
Financial statements
Other inform
ation Lloyds Banking Group Annual Report and Accounts 2020 53
Retail
Retail offers a broad range of financial service products to personal and business banking customers, including current accounts, savings, mortgages, credit cards, unsecured loans, motor finance and leasing solutions. Its aim is to be the preferred financial partner for personal customers, by building deep and enduring relationships that meet more of our customers' financial needs and improve their financial resilience throughout their lifetime, with personalised products and services that are increasingly relevant to them. Retail operates a multi-brand and multi-channel strategy. It continues to simplify its business and provide more transparent products, helping to improve service levels and reduce conduct risk, whilst working within a prudent risk appetite.
£1,991 millionUnderlying profit decreased by 53 per cent
c.£40 billionExceeded target of mortgage lending to first time buyers by over 30 per cent across 2018 to 2020
#1Maintained largest branch network with around 90 per cent of branches remaining open during pandemic
76/ 67Record highs of net promoter scores across branch and digital
Progress against strategic prioritiesLeading customer experience
UK’s leading digital bank with digitally active customers up 6 per cent to 17.4 million and mobile users up 16 per cent to 12.5 million. Over 4 billion internet banking logins in 2020, with average monthly logins up 12 per cent
Maintained the UK’s largest branch network with around 90 per cent of branches remaining open throughout the pandemic, whilst implementing coronavirus safeguarding measures to protect customers and colleagues
Supported customers through the pandemic with c.1.3 million payment holidays, c.880,000 calls answered on dedicated lines for NHS workers and over 70s, along with over 750,000 wellbeing calls made by branch colleagues
Continued to support first time buyers with c.£40 billion of mortgage lending in 2018 to 2020, exceeding the Group's target by over 30 per cent.
Improved customer experience reflected in increased branch and digital net promoter scores reaching record highs
Digitising the Group Supporting customers in financial difficulty with more accessible support through digital channels for the first time
5 million customers now receiving push notification alerts helping them manage their finances (up 80 per cent)
Launched Business Finance Assistant, to support small businesses managing their finance needs
Maximising Group capabilities £7.6 billion of Bounce Back Loans provided to Business Banking customers (out of Group total £12.4 billion)
£37 billion increase in deposits, reflecting the strength of the Group's trusted brands in an uncertain environment
Transforming ways of working Over 2,500 branch colleagues redeployed to support customers through the pandemic, whilst over 21,000 colleagues were able to work from home and over 13,000 laptops distributed to colleagues across the Retail Bank
1,000 strong Branch Financial Assistance team created to support customers in financial difficulty
Launched new green propositions including an Energy Saving Tool, helping customers improve energy efficiency of their homes and an electric vehicle salary sacrifice proposition
Financial performance Net interest income 9 per cent lower, reflecting the low rate environment, actions to support customers and lower unsecured balances with reduced levels of activity and demand during the pandemic
Other income 14 per cent lower with reduced levels of customer activity and customer spending and the continued impact of a smaller Lex fleet size in line with the market, in part offset by lower operating lease depreciation
Operating costs flat, with efficiency savings offsetting an increase in costs related to supporting customers during the coronavirus pandemic. Remediation costs decreased 47 per cent on prior year to £125 million
Impairment increased significantly to £2,384 million, primarily driven by the charge in the first half of the year reflecting a material deterioration in the economic outlook as a result of the coronavirus pandemic
Customer lending increased 2 per cent with increased mortgage activity, including open book growth of £6.7 billion in the fourth quarter and support for Business Banking customers, partly offset by lower unsecured balances
Customer deposits increased 15 per cent with strong inflows to the Group's trusted brands and lower spend activity, along with increased Bounce Back Loan driven deposits
Risk-weighted assets up 1 per cent, with credit migration and model changes offset by lower unsecured balances
Key worker very thankful for payment holiday support
A nurse contacted the dedicated payment holiday line to explain how she had been impacted by COVID. She normally made up her income working additional shifts, however because of COVID had only been able to work on one ward, to prevent the spread of the virus across wards, which had reduced her income by half. Her husband who worked in a restaurant had also been furloughed.
With a mortgage, credit card and a loan, it was a worrying time for the customer. We were able to give the customer a payment holiday across all products saving the customer c.£2,000 per month. The customer was emotional, overwhelmed and very grateful for the support the bank had been able to give her and her family when they most needed it.
20162017201820192020 17.4
16.415.713.412.5
UK's largest digital bankActive online users (m)
17.4

54 Lloyds Banking Group Annual Report and Accounts 2020
Commercial Banking
Commercial Banking has a client-led, low risk, capital efficient strategy and is committed to becoming the best bank for business. Through its segmented client coverage model, it provides clients with a range of products and services such as lending, transaction banking, working capital management, risk management and debt capital markets. Continued investment in capabilities and digital propositions will enable the business to build a leading digital SME proposition and a disciplined and strengthened Corporate and Institutional client franchise.
£96 millionUnderlying profit decreased by 95 per cent
19 per centmarket share of SME lending
>£6.0 billionnet SME and Mid Market lending target exceeded
Financial performance overview continued
Supporting green ambitions
French oil major Total has advanced its diversification into renewable energy by taking a majority stake in the UK’s Seagreen 1 offshore wind project.
Cost of more than £3.0 billion, Seagreen is one of the largest investments in Scottish infrastructure. Upon completion it will provide sustainable energy to 1 million homes.
The Seagreen transaction is the first partially-subsidised offshore wind project to be financed in the UK, as the sector moves away from its dependency on Government subsidies. Approximately 40 per cent of the turbines benefit from a fixed power price guarantee from the UK Government
As part of Lloyds Bank’s Clean Growth Financing Initiative (CGFI), the Group provided £198 million to the project in a total debt package of £1.4 billion.
Progress against strategic prioritiesLeading customer experience
Implemented an extensive client outreach programme across SME and Mid Corporates in response to the coronavirus crisis, reaching c.60,000 businesses impacted by the pandemic to date
SME mentoring service launched in partnership with Be The Business to help clients recover from the pandemic
Digitising the Group First globally to implement SWIFT GPI Instant, increasing the speed and transparency of cross-border payments
Over £2 billion processed through the Payables API, allowing clients to send Faster Payments directly from their systems without human intervention
Launched the Trade Tracker API, giving clients greater transparency through real-time transaction status updates
Rapid deployment of robotics to automate the opening of Bounce Back Loans, enabling over 300,000 loans with a value of over £9 billion to be opened since May and supported over £1 billion on the first day following the launch
Maximising Group capabilities Exceeded the Group’s three year target to provide £6 billion of additional net lending to start-up, SME and Mid Market clients by end-2020 and surpassed the 2020 target of £18 billion gross new lending target to these businesses
Actively supported clients with over £12 billion of Government-backed lending, in addition to c.34,000 capital repayment holidays and c.22,000 fee-free overdrafts as part of the Group's £2 billion COVID-19 fund
Supported £3.7 billion of investment in the UK manufacturing sector and participated in the completion of a number of UK Export Finance backed Export Development Guarantee transactions to the syndicated value of £4.4 billion to support clients' trading ambitions, whilst helping c.15,000 SMEs export for the first time over the past three years
In 2020, provided over £2.3 billion of green finance, taking the total green finance provided to over £7.3 billion since 2016. In addition, we have supported clients with over £1.8 billion of Sustainability Linked Loans since 2017
Transforming ways of working Upgraded the Business Banking Online Lending Tool to accommodate the Government’s coronavirus lending schemes, enabling faster decision making and freeing up Relationship Manager time to help clients
Financial performance Net interest income of £2,357 million, down 18 per cent on prior year, reflecting competitive asset markets, lower deposit income due to bank rate reductions partly offset by ongoing business optimisation across assets and liabilities
Other income decreased by 9 per cent to £1,292 million, primarily driven by lower transaction banking income as a consequence of coronavirus-related impacts on customer trading volumes, with markets income remaining resilient
Operating costs were 11 per cent lower reflecting the result of continued investment in efficiency initiatives
Impairments increased to £1,464 million, reflecting a significant deterioration in the Group's economic outlook, as well as a small number of single name charges
Customer lending was lower at £86.2 billion, with higher lending in SME driven by Government-backed lending, more than offset by lower Corporate and Institutional lending due to the continued optimisation of the asset portfolio
Customer deposits grew by 1 per cent to £145.6 billion, as optimisation within the term deposit book was more than offset by growth in SME deposits, given the partial retention of Government-backed lending on deposit and growth in SME deposits generally
Risk-weighted assets decreased 3 per cent to £75.0 billion, driven by ongoing optimisation in the Corporate book, partly offset by regulatory headwinds and credit migrations
20162017201820192020 3.7
2.61.51.11.4
Funding for UK manufacturers£bn cumulative total (2018 - 2020)
3.7

Strategic reportFinancial results
Governance
Risk manag
ement
Financial statements
Other inform
ation Lloyds Banking Group Annual Report and Accounts 2020 55
Insurance and Wealth
Insurance and Wealth offers insurance, investment and wealth management products and services. It supports over 10 million customers with assets under administration of £172 billion and annualised annuity payments of over £1.1 billion. The Group continues to invest significantly in the development of the business, with the aims of capturing the considerable opportunities in pensions and financial planning, whilst meeting more of our customers’ financial needs and improving their financial resilience throughout their lifetime.
£338 millionUnderlying profit decreased by 68 per cent
69 per centGrowth in open book AuA over the GSR3 period
15 per centAchieved GSR3 target market share in workplace pensions
1.5 millionnew pension customers in GSR3 period
For 16 years, Scottish Widows has been researching the savings habits of women in the UK. Tracking retirement planning over the years means we can see patterns of behaviour evolve over a long period of time.
The good news is that the gender pensions gap is now the narrowest on record, with just a 1 per cent difference between the proportion of men and women putting enough money aside for a comfortable retirement. Almost three in five (59 per cent) women – the highest since we began this research – are saving adequately, compared to 60 per cent of men.
Scottish Widows is continuing its call for a series of pension reforms to remove the persistent barriers to more women saving more money for retirement. This includes enhanced pensions for those on maternity leave, the mandatory inclusion of pensions in divorce proceedings and scrapping the minimum earnings threshold for of auto-enrollment to make pensions more inclusive for part-time workers.Saving for
the future
Progress against strategic prioritiesLeading customer experience
Achieved 5 stars for the fifth consecutive year in the Financial Adviser Service Awards in Investments, Pensions and Protection, and Mortgages, together with the Editor’s Achievement Award for 30 years’ Consistent Service
Being the first major pensions and insurance provider to target halving the carbon footprint of its investments by 2030 on its path to net zero by 2050
Commenced £2 billion investment in BlackRock's Climate Transition fund expected to deliver c.50 per cent carbon reduction compared to benchmark; helping customers save for retirement, whilst investing in sustainable businesses
Achieved GSR3 target of 15 per cent market share of workplace business, up from 10 per cent at start of 2018
Supported customers throughout the pandemic, including free additional insurance cover to NHS workers and reducing medical evidence requirements to help alleviate pressures on GPs
Digitising the Group Launched Scottish Widows app in the fourth quarter to c.500,000 customers. Customers are able to engage with their retirement planning, representing a key strengthening of the Group's proposition
Single Customer View expanded to include stockbroking portfolios with c.6.5 million customers able to access their insurance and wealth products alongside their bank account, up from over 5 million at the end of 2019
Maximising Group capabilities Grew open book assets under administration by £46 billion, or 69 per cent, over the GSR3 period to £113 billion, narrowly missing the £50 billion growth target despite challenging market conditions
Further exceeded GSR3 target of 1 million new pension customers, with 1.5 million now added Completed migration to Schroders Personal Wealth. Continue to target becoming a top 3 financial planning business
Financial performance Underlying profit fell to £338 million, driven by impact of reduced market activity, lower non-recurring items and adverse assumption changes in 2020 (versus net positive in 2019) Sales in individual annuities, non-branch protection, and workplace, planning and retirement, excluding auto-enrolment step-ups, have increased despite pandemic headwinds Life and pensions experience and other items includes adverse impacts from assumption changes (further details of which are included in Other Financial Information) and the response to the Asset Management Market Review General insurance combined operating ratio remains strong at 85 per cent in the context of absorbing £36 million claims due to storms in 2020. Total gross written premiums remain resilient despite the reduction in branch footfall Reduction in Wealth income reflects the transfer of business to Schroders Personal Wealth in 2019, and lower net interest income as a result of the lower rate environment. Stockbroking other income more than double prior year Costs reduced by £80 million, c.£60 million of which reflects the transfer of business to Schroders Personal Wealth
Insurance capital Estimated Solvency II ratio of 151 per cent, reflects the dividend paid in February 2020, continued investment in new business, and the impact of lower interest rates Credit asset portfolio is average ‘A’ rated, well diversified and non-cyclical, with less than 1 per cent sub investment grade or unrated. No Insurance ordinary dividend will be paid for 2020
20162017201820192020 5
181321
Strong open book AUA(customer net inflows)£bn
5

56 Lloyds Banking Group Annual Report and Accounts 2020
Simplified approach to managing risksOver the course of the year, there has been a strong focus on simplifying and enhancing the enterprise risk management framework. A One Risk and Control Self Assessment (One RCSA) approach to managing risks across the Group has been adopted, which supports the proactive identification of risks to customers and the Group's business objectives, as well as enabling a strong control framework. More information on One RCSA is available on page 145.
Risk culture and the customerA transparent risk culture resonates across the organisation and is supported by the Board and its tone from the top.
Risk management requires all colleagues to play their part with individuals taking responsibility for their actions.
Within our approach there is a strong focus on building and sustaining long-term relationships with customers through the economic cycle.
Senior Management articulate the core risk values to which the Group aspires, based on the Group's conservative business model, prudent approach to risk management and the Board's guidance.
As a Group, we are open, honest and transparent with colleagues working in collaboration with business areas to:
support effective risk management and provide constructive challenge
share lessons learned and understand root causes when things go wrong
consider horizon risks and opportunities
Connectivity of risks and our strategic risk management frameworkThe unprecedented events of this year have demonstrated how individual risks in aggregate can place significant pressure on the Group's strategy, business model and performance. It is essential that we not only manage our individual risks, but understand how emerging and strategic risks are connected, and how they impact either existing principal risks or create new risks. By doing so we can ensure we continue to respond dynamically and protect our customers and support our colleagues and stakeholders.
Connectivity of risks is very much at the forefront of the Group’s thinking and additional work is being launched in 2021 to further embed this into our risk management framework.
Our approach to riskRisk management is at the heart of Helping Britain Recover and building the UK's preferred financial partner.
Our mission is to protect our customers, colleagues, the Group, investors and society, while enabling sustainable growth. This is achieved through informed risk decision-making and robust risk management, supported by a consistent risk-focused culture.
A prudent approach to risk is fundamental to our business model and drives our participation choices.
The risk management section from pages 143 to 204 provides an in-depth picture of how risk is managed within the Group, including the approach to stress testing, risk governance, Committee structure, risk appetite and detailed analysis of the principal risk categories, the framework by which risks are identified, managed, mitigated and monitored.
Our enterprise risk management frameworkRisks are identified, managed, mitigated and monitored using our comprehensive enterprise risk management framework. This is the foundation for the delivery of effective risk control.
The Group's risk appetite, principles, policies, procedures, controls and reporting are regularly reviewed and updated when needed to ensure they remain fully in line with regulation, law, corporate governance and industry good practice.
The Board is responsible for approving the Group's risk appetite statement annually. Board-level metrics are cascaded into more detailed business appetite metrics and limits. Regular close monitoring and comprehensive reporting to all levels of management and the Board ensures appetite limits are maintained and subject to stress analysis at a risk-type and portfolio level, as appropriate.
Governance is maintained through delegation of authority from the Board down to individuals. Senior executives are supported by a Committee based structure which is designed to ensure open challenge and enable effective decision-making. More information on our Risk Committees can be found on pages 150 to 152.
Risk overview
Effective risk management and control
Principal RisksThe Board-approved enterprise-wide risk categories used to monitor and report the risk exposures posing the greatest impact to the Group.
Emerging RiskA future internal or external event or trend, which could have a material positive or adverse impact on the Group and our customers, but where the probability, timescale and/or materiality may be difficult to accurately assess.
Strategic RiskA principal risk arising from:
A failure to understand the potential impact of strategic responses on existing risk types Incorrect assumptions about internal or external operating environments Inappropriate strategic responses and business plans
StrategicRisk
Principal Risks
Impact on other existingprincipal risks
Emerging Risk
Connectivity of risks: The impact of emerging and strategic risks on the Group's principal risks

Strategic reportFinancial results
Governance
Risk manag
ement
Financial statements
Other inform
ation Lloyds Banking Group Annual Report and Accounts 2020 57
2020 has been a year of significant uncertainty, including the spread of COVID-19 and its impact on global and domestic economies and the UK's exit from the European Union.
COVID-19 has had a significant impact on all risk types in 2020. Understanding and managing its impacts dynamically has been a major area of focus. The Group has responded quickly to the challenges faced, putting in place risk mitigation strategies and refining its investment and strategic plans.
All of the Group's principal risks, which are outlined on this page, are reported regularly to the Board.
The risk management section from pages 143 to 204 provides a more in-depth picture of how risk is managed within the Group.
Key focus areas during 2020Climate – newThe Group recognises the evolving pace of climate risk and has adopted a comprehensive approach to embedding this risk within its enterprise risk management framework. This includes the creation of a new principal risk as well as its integration into our existing principal risks. Work has also continued to develop scenario modelling and other analytical tools and to increase the level of external disclosure to further align to the Task Force on Climate-related Financial Disclosures (TCFD) recommendations.
MarketThe Group’s structural hedge, nominal balance £186 billion (2019: £179 billion), provides protection against margin compression caused by falling interest rates. In addition, customer deposits have seen significant growth in 2020 which creates near-term interest rate exposure. Customer behaviour and hedging of these balances are reviewed regularly.The Group’s defined benefit pension schemes have seen an improvement in IAS19 accounting surplus to £1.6 billion (2019: £0.5 billion), as a result of deficit reduction contributions and greater than expected asset returns partially offset by the impact of the Retail Price Index (RPI) reform announced by the Chancellor of the Exchequer in November 2020.CreditA range of measures have been deployed to help support customers, including around 1.3 million of payment holidays, over £12 billion of additional Government support scheme lending through the Bounce Back Loan (BBLS) and Coronavirus Business Interruption Loan (CBILS) schemes, together with liquidity facilities for larger clients.
This support together with the wide array of public policy interventions, such as the job retention scheme, has limited the increase in unemployment, and helped to suppress credit defaults and business failures.
The Group has responded dynamically to mitigate and address credit risk, with specific focus on higher risk segments, sectors and counterparties, as well as undertaking extensive preparation to support the expected increase in customers who may experience financial difficulty.
The 2020 full year impairment charge of £4,247 million (2019: £1,291 million) reflects the
weaker economic outlook, with reserves built in anticipation of an increase in losses during 2021 as unemployment increases and more business failures are seen.Funding and liquidityThe Group maintained its strong funding and liquidity position in 2020, with the loan to deposit ratio decreasing to 98 per cent (2019: 107 per cent). Customer deposits increased significantly as spending reduced and customers deposited Government lending scheme balances. During the year, the Group repaid all outstanding amounts of its Term Funding Scheme (TFS) and Funding for Lending Scheme (FLS) drawings and drew £13.7 billion from the Term Funding Scheme with additional incentives for SMEs (TFSME).Total wholesale funding reduced by £14.8 billion principally as a result of the growth in customer deposits.
CapitalCapital build was adversely impacted by impairment provisions in 2020, however the year end capital position is significantly strengthened due to the earlier reversal of the 2019 full year ordinary dividend accrual and enhanced IFRS 9 transitional relief, which partially offset the increase in impairment provisions. Closing CET1 ratio of 16.21 per cent (15.01 per cent excluding transitional relief). The Group’s capital requirements have reduced in 2020 due to lower Pillar 2A requirements and the reduction in the UK countercyclical capital buffer rate in response to the impact of COVID-19. The Group therefore has significant headroom to absorb further potential losses and to continue to support households and businesses as they recover from the COVID-19 pandemic.Insurance underwritingLower market activity as a result of the pandemic and noting the one-off 2019 benefit from workplace auto-enrolment step-ups, saw Life and Pensions present value of new business premium fall to £14.5 billion in 2020 (2019: £17.5 billion). Near-term underwriting risk increased, reflecting policyholder behaviour on workplace savings products. Significant amounts of life and morbidity risk continued to be re-insured. No material change to General Insurance underwriting risk in 2020, with total gross written premium falling slightly to £662 million (2019: £671 million) due to the reduction in branch footfall.Change/executionThe Change/execution risk profile has remained stable in the year. The Group’s change portfolio was reprioritised at pace to support critical and COVID-19 related activities. Enhanced, targeted control monitoring was implemented to ensure safe delivery of change during the year.ConductThe Group has adapted quickly to the impacts of the pandemic, providing significant support to impacted customers. Comprehensive preparations have been undertaken to help identify and further support those customers in financial difficulty.DataThe Group continues to improve its capabilities in the management of data risk, with an improvement seen in the regular half yearly capability assessment.
Areas of improvement include delivery of a new data risk and control library, embedding data by design and ethics principles into the data science lifecycle, increasing capabilities and broader awareness.GovernanceGovernance risk has remained stable, despite the need for accelerated decision-making and a significant increase in the amount of remote working, together with a number changes to GEC and Board members throughout the year. Ensuring appropriate and efficient governance remains a key priority. People2020 has seen increased colleague workloads and significant changes to ways of working, with more than 50,000 colleagues working from home. Improved colleague sentiment demonstrates that the extensive support measures deployed by the Group, with a continued focus on colleague wellbeing and resilience, are helping to mitigate these risks.Operational resilienceBusiness continuity plans have proved resilient, with particular attention applied to heightened risks in the supply chain.OperationalDespite anticipated heightened operational risks in the areas of cyber, fraud and technology, the volume of operational loss events has remained broadly consistent in 2020 compared to 2019.ModelModel risk has increased due to the nature and uncertainty of the economic outlook. The effect of Government-led customer support initiatives have weakened established relationships between model inputs and outputs, reducing the ability to forecast using models alone. While underlying model drivers are expected to remain valid in the longer-term, year end impairment reporting contains a greater element of governed judgement to reflect current conditions.Regulatory and legalRegulatory risk has been impacted by a small number of instances of non-compliance, requiring forbearance from regulators. Forbearance requirements have been due to the reprioritisation of resource to support the provision of essential services to customers and to respond to new regulatory requirements, such as payment holidays. Legal risk has been impacted by the UK’s exit from the EU, in particular continued uncertainty of the future UK legal and regulatory financial services framework.StrategicStrategic risk is a significant source of risk for the Group, influencing the Group’s strategy, business model, performance and risk profile. The development of our strategic risk framework is a key priority for the Group.Significant work has been undertaken during 2020 to understand the risk implications of the Group’s strategy and the key drivers of strategic risk. These are outlined in more detail on the following pages and will be further developed and embedded across the Group during 2021.
Principal risks
1 Includes a 0.5 per cent benefit following the implementation of the revised capital treatment of intangible software assets which the PRA is proposing to reverse.

58 Lloyds Banking Group Annual Report and Accounts 2020
Strategic risk
Risk overview continued
In addition to the principal risks, the Group takes a proactive approach to horizon scanning and assessing the potential impact of an existing or future trend which could have a material impact on the Group, where the probability, timescale and/or materiality may be difficult to accurately assess.
The Board Risk Committee approved the Group’s enhanced definition for emerging risks in October 2020.
Internal working groups have been established to regularly scan the horizon and identify emerging risks. In addition the working groups have sought to analyse the impact of material events, such as COVID-19, on those trends and assess whether those have accelerated the impact of existing risks on our customers, colleagues and wider stakeholders.
The key areas of focus in 2020 are broadly unchanged from 2019. In addition, three themes have been magnified and exacerbated as a result of the pandemic:
Technology: Which considers the long-term technology changes disrupting the industry, the emergence of new technology-driven business models, and the likely impact of technology change on our customers.
Societal expectations: Which reflects the expectations of the role the Group can play in supporting society across a range of issues such as housing, environmental sustainability and helping customers in financial difficulty.
People, ways of working and skills: Trends include the significant acceleration in remote working due to COVID-19 and higher demand for workers with digital and analytical skills.
Some emerging risks, such as data, have materialised and are recognised by the Group as principal risks. However, with risks continuing to evolve there will be important aspects of these risks that will need to continue to be captured through our emerging risks framework.
The emerging risks that the Group have monitored during 2020 are outlined in more detail in pages 147 to 149 of the risk management section.
Risk view of key Strategic Review 2021 themesThe Group’s strategy plays an important role in managing our strategic risks, responding to the priorities identified by the Board, and transforming our capabilities to deliver on these priorities. Some of the key themes from our strategy, as outlined on pages 36 to 45, represent new opportunities, while also posing corresponding risks that need to be understood.
In 2020 the Group undertook an initiative to enhance our framework and approach for identifying and understanding our strategic risks, with particular focus on the connectivity of risks.
Our understanding of the relationship and impact amongst emerging risks, strategic responses and principal risks played a key role in the development of our strategy. This was supplemented with engagement across the Group’s businesses and functions, to establish a strong understanding of the Group’s strategic challenges.
In line with the Group’s strategy to gain greater organisational value from data and advanced analytics, we are also developing a quantitative approach to further strengthen our strategic risk management framework.
The health of the UK economy and the financial health and wellbeing of our customers are core influences on the Group’s principal and strategic risks. We are therefore committed to Helping Britain Prosper and placing this purpose at the heart of our strategy.
We are well-positioned to respond to potential challenges posed by increased customer financial vulnerability and societal disparity, ensuring our proposition resonates with evolving customer needs.
Significant investment is planned to reimagine our customer offerings. Transforming our technology architecture, appropriately and securely using data science and upskilling our colleagues, we aim to deliver a holistic proposition, together with an excellent customer experience.
The Group’s strategy aims to support a more sustainable future, while diversifying our income streams. The Group is working hard to ensure that our purpose, commitment to Helping Britain Prosper and delivery are harmonious with the expectations of our colleagues, customers and other key stakeholders, all the while adapting to changing societal expectations and customer and colleague preferences.
ILLUSTRATIVE MAP OF EMERGING RISKS – NON EXHAUSTIVE
Trade corridors and geopolitics
Scarcity of natural resources
Future pandemics
Ageing population
Deflationary vs. inflationary shocks
Skills gap and changing employment trends
Data protection and remediation
Cyber resilience and security
Most pertinent trends
Pote
ntia
l im
pac
t
Trends impacting the Group
Lower
Low
er
Higher
Hig
her
Low growth and rates
Acceleration of digitisation
Increased inequality and financial vulnerability
Changing ways of workingIncreased pace
of change
Big tech and international incumbent threat
Greater Government role
Rising societal expectations
Likelihood
Emerging risks
Emerging risks are assessed through an impact/likelihood matrix whereby the most pertinent trends are considered when shaping and refreshing our major strategic priorities and responses.
Key emerging risks are outlined in more detail in pages 147 to 149 of the risk management section.
Internal External
People/Ways of Working and Skills
IT and Data/Cyber
Geopolitical
Financial and macroeconomic
Competition and customer trends
Natural environment/climate
Societal expectations

Strategic reportFinancial results
Governance
Risk manag
ement
Financial statements
Other inform
ation Lloyds Banking Group Annual Report and Accounts 2020 59
Strategic risk drivers Potential risk implications Strategy and Mitigation
Strategic risk impacts
Implications of COVID-19 and our responses
Acceleration of underlying growth in economic and societal disparity Customer and colleague resilience heading into longer-term uncertain future Impact of prolonged remote working
– Misalignment of customer proposition, product and service offerings
– Potential failure to address customers’ personal and financial resilience needs
– Adverse impacts on productivity, creativity, customer treatment, colleague wellbeing and data security
Sustainability initiatives responding to societal and Government expectations
Desire to establish and build market share in sustainable sectors Impact of evolving regulatory requirements Shifting consumer and colleague expectations
– Calibration of risk appetite, pricing and model approach to achieve external commitments
– Risk arising from participation choices in respect of green economy and sustainability
– Recruitment and retention of customers and colleagues dependent on the Group's response to evolving societal expectations
Implications of low long-term economic growth
Structural challenge for Group’s business model and revenue streams due to low growth and low or negative interest rates
– Risk of disrupting traditional banking models, creating unfavourable customer responses
– Inability to sufficiently diversify income streams to mitigate the challenges of a low growth environment
Legacy systems and ageing technology
Managing through ageing platforms Complex and inefficient technology architecture and systems
– Increased risk of outages and system failure impacting operational resilience risk, and inability to respond in an agile, efficient manner to growing threats from modern competitors
– Greater costs and operational risks due to duplication or complexity of infrastructure and processes and the need to retain legacy skills
Evolving challenges amid backdrop of digitisation and pace of change
Changing consumer behaviour, with customer expectations increasingly shaped by their experiences elsewhere Larger and more diverse threat landscape Skills requirements in response to changing environment
– Failure to keep pace with peers and competitors poses potential for loss of income
– Greater volumes of data at risk, with more challenging control environment
– Evolution of colleague skills to deliver and maintain new systems, processes and transitioning to the cloud
Strategy and mitigation key
Preferred financial partner for personal customers
Best bank for business
Integrated payments
Data-driven organisation
Modernised technology architecture
Reimagined ways of working
HBR Helping Britain Recover
Strategic risk impacts key
Financial risks
Conduct, compliance, operational and data risks
People risk
Change/execution risk
Climate risk
Other risks
Strategic risk
Understanding the potential risk implications of Strategic Review 2021 is an important area of focus. The key strategic risk drivers outlined below have been assessed as part of the development of our strategic themes and objectives.
HBR
HBR

60 Lloyds Banking Group Annual Report and Accounts 2020
2020 CAPTURED BY LLOYDS BANKING GROUP COLLEAGUES
Financial resultsResults for the full year 61Summary of Group results 62Divisional results 73Other financial information 77
Michael Bond Estelle Nicol Eleanor Brown Christopher Hall
Amanda Gamble Catherine Allnutt Chanel Dixson
Julia Newell Helen Cockcroft Emma Dare Georgia Kemp

Lloyds Banking Group Annual Report and Accounts 2020 61Strateg
ic report
Financial resultsG
overnanceRisk m
anagem
entFinancial statem
entsO
ther information
Successfully supporting customers, colleagues and communities through the pandemic Over £12 billion lending to businesses through Government-backed schemes, including Bounce Back Loan, Coronavirus Business Interruption Loan and Coronavirus Large Business Interruption Loan schemes
Around 1.3 million payment holidays granted to retail customers and 34,000 capital repayment holidays to small businesses and corporates to alleviate temporary financial pressures whilst also supporting a number of Corporate and Institutional clients with Covid Corporate Financing Facility advances
More than 50,000 colleagues working from home for most of 2020, increased from up to 15,000 before the pandemic
c.90 per cent of branches remained open through the pandemic, enabling the Group to continue to serve customers
Resilient financial performance in a highly challenging macroeconomic environment Net income of £14.4 billion, down 16 per cent with net interest income of £10.8 billion, down 13 per cent. Net interest margin of 2.52 per cent, reflecting lower rates, actions taken to support customers and changes in asset mix, including growth in high quality UK mortgages and lower levels of unsecured lending; average interest-earning assets stable at £435 billion. Other income of £4.5 billion, impacted by lower levels of customer activity, the impact of negative assumption changes in Insurance and Wealth and lower non-recurring items
Total costs of £8.0 billion, 4 per cent lower, enabling continued investment in digital projects and enhanced support for customers during the pandemic
Trading surplus of £6.4 billion, a reduction of 27 per cent although providing significant capacity to absorb impairment impact of the coronavirus crisis
Impairment charge of £4.2 billion, including £3.8 billion in the first half, primarily reflecting a significant deterioration in the economic outlook and including a management overlay of £400 million applied in the second half, given ongoing uncertainties as a result of coronavirus
Statutory profit before tax of £1.2 billion and statutory profit after tax of £1.4 billion, both impacted by lower income and the increased impairment charge; tangible net asset value per share of 52.3 pence
Strong balance sheet and capital position Loans and advances broadly in line with prior year at £440.2 billion with growth in the open mortgage book and Government-backed lending of £11.1 billion (£12.4 billion approved at 12 February 2021), more than offsetting lower balances in unsecured Retail, Corporate and Institutional, and the closed mortgage book
Open mortgage book up £7.2 billion in the year, including £10.2 billion in the second half and with a strong pipeline
Customer deposits up £38.9 billion in the year to £450.7 billion with Retail current accounts up 27 per cent having grown ahead of the market
Loan to deposit ratio of 98 per cent, providing a strong liquidity position and significant potential to lend into recovery
Board has recommended a final ordinary dividend of 0.57 pence per share, the maximum allowed under the regulator’s guidelines
CET1 ratio of 16.4 per cent before dividends and 16.2 per cent after, both significantly ahead of the ongoing target of c.12.5 per cent, plus a management buffer of c.1 per cent and regulatory requirements of c.11 per cent
Significant transformation achieved under the third phase of the Group’s strategy (GSR3)In 2018 we launched our ambitious strategy to transform the Group for success in a digital world and over the last three years we have invested £2.8 billion across our four strategic pillars, enabling us to:
Develop a leading customer experience; including the largest digital bank in the UK with 17.4 million digitally active customers and 12.5 million mobile app users with record NPS, alongside the largest UK branch network
Further digitise the Group; by progressively modernising and simplifying the IT architecture across 78 per cent of the Group’s cost base whilst continuing to migrate applications to private cloud
Maximise Group capabilities; by exceeding the £6 billion target for increasing net lending to start-ups, SMEs and Mid Market clients over the three years, whilst surpassing the 2020 target of £18 billion gross new lending to these businesses and also extending the Group’s unique Single Customer View functionality to c.6.5 million customers
Transform ways of working; by delivering 5.3 million hours of future skills training and 65 per cent of change using agile methodologies
Strategic Review 2021Strategic Review 2021 builds on our core capabilities and the strong foundations from previous strategic reviews, while reinforcing our customer focus. We have made significant progress in recent years, leveraging the unique strengths and assets of the Group, including our purpose driven and customer-focused business model, our low risk approach to business, our market leading efficiency and our leading multi-channel propositions, including the largest digital bank and branch network in the UK. Strategic Review 2021 will deliver co-ordinated growth opportunities in our two core customer segments, supported by enhanced capabilities in four areas. With 2021 execution underpinned by long-term strategic vision, we aim to:
Significantly deepen our customer relationships across banking, insurance and wealth, building our position as the preferred financial partner for personal customers
Build a leading digital SME proposition and a disciplined and strengthened Corporate and Institutional client offering, enabling the Group to be the best bank for business
Further enhance and leverage core capabilities, including through a modernised technology architecture, integrated payment solutions, a truly data-driven organisation and reimagined ways of working for our colleagues
2021 guidance, based on our current economic assumptions, reflects confidence in the Group’s unique business model and customer focused strategy
Net interest margin to be in excess of 240 basis points
Operating costs to reduce further to c.£7.5 billion
Net asset quality ratio to be below 40 basis points
Improving profitability with statutory return on tangible equity of between 5 and 7 per cent (on the new basis)
Risk-weighted assets in 2021 to be broadly stable on 2020
Intention to accrue dividends and resume progressive and sustainable ordinary dividend policy
Results for the full year

62 Lloyds Banking Group Annual Report and Accounts 2020
Summary of Group results Financial performance reflects the challenging economic environment The Group’s statutory profit before tax for the year was £1,226 million with statutory profit after tax of £1,387 million. Both measures were impacted by the significant impairment charge taken during the year, the majority of which was recognised during the first half and reflected the Group’s revised economic outlook for the UK, following the outbreak of the coronavirus pandemic. In the fourth quarter, statutory profit before tax was £792 million and statutory profit after tax was £680 million, both benefiting from improved business conditions and a reduced impairment charge.
Trading surplus for the year was £6,440 million, a reduction of 27 per cent on 2019, reflecting the challenging external environment. Net income was down 16 per cent to £14,404 million, driven by both lower net interest income and lower other income. The Group has maintained its focus on delivering cost savings, with total costs down 4 per cent, while continuing to invest in the Group’s digital propositions.
The Group’s underlying profit was £2,193 million for the year, compared to an underlying profit of £7,531 million in 2019, reflecting lower net income and the significant impairment charge of £4,247 million taken in 2020.
The Group’s balance sheet remains very strong. Loans and advances to customers were flat on prior year at £440 billion. This includes an increase in open mortgage book net lending of £7.2 billion in the year, with £6.7 billion growth in the fourth quarter, reflecting the strength of the UK housing market. Total customer deposits increased by £38.9 billion in the year, to £450.7 billion. Retail current account growth was £20.5 billion in 2020 and ahead of the market, driven by lower levels of customer spending during the pandemic and inflows to the Group’s trusted brands. Commercial Banking current account growth also illustrates the Group’s strong customer relationships and a proportion of the Government-backed lending being retained on deposit by SME customers.
The Group’s CET1 capital ratio post dividend increased 242 basis points over the year, from 13.8 per cent (on a pro forma basis) to 16.2 per cent, or 16.4 per cent pre dividend accrual.
Net income
2020 £m
2019 £m
Change %
Net interest income 10,773 12,377 (13)
Other income 4,515 5,732 (21)
Operating lease depreciation (884) (967) 9
Net income 14,404 17,142 (16)
Banking net interest margin 2.52% 2.88% (36) bp
Average interest-earning banking assets £435.0bn £434.7bn –
Net income of £14,404 million was 16 per cent lower than in the prior year, reflecting both lower net interest income and lower other income in the period, partially offset by a decrease in operating lease depreciation.
Net interest income of £10,773 million was down 13 per cent, driven by a reduction in the banking net interest margin and stable average interest-earning banking assets. The net interest margin was down 36 basis points to 2.52 per cent. This reflected the lower rate environment, actions taken during the year to support customers and a change in asset mix, largely as a result of reduced levels of customer activity and demand during the coronavirus pandemic. The net interest margin in the fourth quarter of 2.46 per cent, up 4 basis points on the third quarter, reflected the positive impact of deposit repricing and improved mortgage pricing, together with reduced funding costs, partially offset by lower income from the Group’s structural hedge.
In 2021, based on current economic assumptions, the Group expects a net interest margin of in excess of 240 basis points.
The Group manages the risk to its earnings and capital from movements in interest rates centrally by hedging the net liabilities which are stable or less sensitive to movements in rates. As at 31 December 2020 the Group’s structural hedge had an approved capacity of £210 billion (increased from the prior year reflecting account management and core deposit growth in 2020), a nominal balance of £186 billion (31 December 2019: £179 billion) and a weighted-average duration of around two and a half years (31 December 2019: around three years). The Group generated £2.4 billion of gross income from the structural hedge balances in 2020 (2019: £2.7 billion). In 2021, based on current economic assumptions, the Group expects c.£60 billion of maturities and c.£400 million lower income from the structural hedge, with lower maturities in 2022 and 2023.
Average interest-earning banking assets were stable compared to prior year at £435 billion, with growth due to Government-backed lending to support business clients through the coronavirus crisis, open mortgage book growth and the full impact of the 2019 Tesco mortgage book acquisition. This was offset by lower balances in the closed mortgage book and in credit cards, as well as reductions in revolving credit facilities (RCFs) and the continued optimisation of the Corporate and Institutional book within Commercial Banking. Average interest-earning banking assets in the fourth quarter increased marginally to £437 billion as the Group continued to benefit from strong growth in the open mortgage book (lending balances up £6.7 billion in the fourth quarter), offset by further RCF reductions in Commercial Banking. The Group expects average interest-earning assets in 2021 to be flat to modestly higher than in 2020.
Other income of £4,515 million in 2020 was 21 per cent lower than in 2019 reflecting lower levels of customer activity across the Group’s main business lines, largely due to the coronavirus pandemic, combined with an adverse impact from assumption changes in Insurance and Wealth and lower non-recurring items. Within Retail, other income fell as a result of reduced customer spending and the continuing impact of a lower Lex fleet size. Commercial Banking saw lower transaction banking income as a consequence of coronavirus-related activity levels, with resilience in markets income. Insurance and Wealth income was lower than the prior year, impacted by reduced new business given the effects of the pandemic, the non-recurrence of c.£140 million of new business income associated with workplace pensions auto-enrolment benefits in 2019 and £60 million of negative methodology and assumption changes in 2020 versus £336 million of positive assumption changes, including the benefit of the change in investment management provider in 2019. In addition, across the Group a £77 million charge was incurred as a consequence of the response to the Asset Management Market Review, largely incurred in Insurance and Wealth. Income associated with the Group’s equity investments business, including Lloyds Development Capital, was £281 million (2019: £341 million), with £166 million recognised in the fourth quarter.
Other income includes a gain of £149 million (2019: £185 million) on the sale of gilts and other liquid assets. 2019 also benefited from the non-recurrence of a £50 million performance related earn-out following the sale of Vocalink.
Operating lease depreciation reduced to £884 million (2019: £967 million) as a result of the continued impact of a smaller Lex fleet size, combined with the benefit of resilient used car prices.

Lloyds Banking Group Annual Report and Accounts 2020 63Strateg
ic report
Financial resultsG
overnanceRisk m
anagem
entFinancial statem
entsO
ther information
Total costs
2020 £m
2019 £m
Change %
Operating costs 7,585 7,875 4Remediation 379 445 15
Total costs 7,964 8,320 4
Business as usual costs 5,233 5,478 4
Cost: income ratio 55.3% 48.5% 6.8pp
Total costs of £7,964 million were 4 per cent lower than in 2019, driven by continued reductions in operating costs and lower levels of remediation. Operating costs of £7,585 million were 4 per cent lower, in the context of continued investment in the Group’s digital transformation. Business as usual costs were down 4 per cent, driven by ongoing cost management as well as lower remuneration and reduced travel costs, partially offset by increased pension costs and coronavirus-related expenses.
Total investment spend in 2020 amounted to £2.0 billion, down 14 per cent on 2019. This included £0.9 billion relating to strategic investment, taking the cumulative strategic spend since the start of GSR3 to £2.8 billion. Although investment spend continues to be managed carefully in response to the current operating environment, the Group has continued to prioritise technology and digital projects and will continue to invest in the long-term success of the business.
During 2020 the Group capitalised c.£1.3 billion of investment spend, of which c.£0.9 billion related to intangible assets. Total capitalised spend was equivalent to c.60 per cent of above the line investment, in line with prior periods.
Despite the continued delivery of cost savings, the lower net income over the period meant that the Group’s cost:income ratio of 55.3 per cent was higher than in 2019.
The Group now expects operating costs to reduce further to c.£7.5 billion in 2021.
Remediation charges were £379 million (2019: £445 million) and down 15 per cent on 2019, including additional charges of £125 million in the fourth quarter relating to pre-existing programmes. During the year additional charges, both redress and operational costs, of £159 million, have been taken in relation to HBOS Reading, as well as further costs in relation to arrears handling, packaged bank account complaints and various settlements in relation to historic claims. A number of programmes are now close to conclusion. Others, such as HBOS Reading, including the conclusion of the recommendations from the Cranston Review, are still ongoing and further costs are likely to be incurred.
ImpairmentThe impairment charge for the year was £4,247 million, an increase of £2,956 million compared to 2019. This was primarily driven by the charge in the first half reflecting potential future losses in light of the Group’s revised economic outlook for the UK as a consequence of the coronavirus pandemic. The charge of £128 million taken in the fourth quarter was below typical pre-crisis levels and reflected the relative economic stability in the quarter.
The Group’s net asset quality ratio was 0.96 per cent compared with 0.29 per cent in 2019, largely driven by increases in expected credit loss (ECL) allowance in the first half of the year. Excluding the updated economic assumptions and coronavirus-impacted restructuring cases, the asset quality ratio would not have been materially higher than in 2019.
Charges of £403 million were taken in the year on restructuring cases whose recovery strategies were affected more immediately by the coronavirus pandemic. Aside from these cases, observed credit performance has remained stable, in part as a result of the continued effectiveness of Government support schemes and payment holidays extended by the Group. Additional funding has been made available by those schemes to businesses impacted by lockdown restrictions which has prevented a more material increase in business failures and unemployment.
Observed credit quality remains stable with the flow of assets into arrears, defaults and write-offs remaining at low levels. The Group has built a significant ECL allowance in the expectation that when the support schemes unwind, insolvencies and unemployment will consequently increase. The Group’s total ECL allowance across all asset classes has increased from £4.2 billion to £6.9 billion in the year, with the majority of the increase in provisions established for up to date assets in Stage 1 and Stage 2. This increase was established in the first half of 2020 in response to changes in the Group’s economic outlook. Subsequent improvements to the economic outlook are redicated upon coronavirus vaccine developments which have emerged, reversing some of the ECL increases in the second half, including in the fourth quarter.
Overall the Group’s loan portfolio continues to be well-positioned, reflecting a prudent through-the-cycle approach to credit risk and high levels of security. The Retail portfolio is heavily weighted toward high quality mortgage lending where low loan-to-value ratios provide security against potential risks. The prime consumer finance portfolio also benefits from high quality growth in past periods in the context of the Group’s prudent risk appetite. The commercial portfolio reflects a diverse client base with relatively limited exposure to the most vulnerable sectors so far affected by the coronavirus outbreak. Within Commercial Banking, the Group’s management of concentration risk includes single name and country limits as well as controls over the overall exposure to certain higher risk and vulnerable sectors or asset classes.
2020 £m
2019 £m
Change %
Charges pre-updated multiple economic scenarios1
Retail 1,359 1,038 (31)
Commercial Banking 252 306 18
Other (1) (53) 98
1,610 1,291 (25)
Coronavirus impacted restructuring cases2 403 – –
Updated economic outlook
Retail 1,025 – –
Commercial Banking 809 – –
Other 400 – –
2,234 – –
Impairment charge 4,247 1,291 (229)
Asset quality ratio 0.96% 0.29% 67bp
Gross asset quality ratio 0.99% 0.37% 62bp
1 Represents charge excluding impact of updating for economic outlook in 2020.
2 Additional charges made during 2020 on cases subject to restructuring at the end of 2019, where the coronavirus pandemic is considered to have had a direct effect upon the recovery strategy.

64 Lloyds Banking Group Annual Report and Accounts 2020
Summary of Group results continued
At 31Dec 20201
%
At 31Dec 20191
%Change
%
Stage 2 gross loans and advances to customers 60,514 38,440 57
Stage 2 loans and advances to customers as % of total 12.0% 7.7% 4.3pp
Stage 2 ECL allowances2 2,727 1,423 92
Stage 2 ECL allowances2 as % of Stage 2 drawn balances 4.5% 3.7% 0.8pp
Stage 3 gross loans and advances to customers 9,089 8,754 4
Stage 3 loans and advances to customers as a % of total 1.8% 1.8% –
Stage 3 ECL allowances2 2,508 1,922 30
Stage 3 ECL allowances2 as % of Stage 3 drawn balances3 28.1% 22.5% 5.6pp
Total loans and advances to customers4 505,129 498,805 1
Total ECL allowance on loans and advances to customers2 6,832 4,142 65
Total ECL allowances on loans and advances to customers2 as % of drawn balances3 1.4% 0.8% 0.6pp
1 Underlying basis. Refer to basis of presentation.
2 Expected credit loss allowances on loans and advances to customers (drawn and undrawn).
3 Total and Stage 3 ECL allowances as a percentage of drawn balances are calculated excluding loans in recoveries in Retail of £179 million (31 December 2019: £205 million).
4 Includes reverse repos of £58.6 billion (31 December 2019: £54.6 billion).
The updated economic outlook in the fourth quarter drove a £659 million ECL release which was partially offset by a central overlay of £400 million. This overlay was added in recognition of the significant uncertainty that remains as to the efficacy of the vaccine, the vaccination programme, potential virus mutation, further lockdowns and economic performance post lockdown restrictions and Government support, recognising that the full range of these risks is not captured in the Group’s method of generating alternative scenarios around its base case. The previous £200 million central overlay noted at the half-year for the severe scenario is now included in model outputs within divisional ECL provisions. The scale of the current uncertainty overlay approximately equates to a c.1 percentage point increase in unemployment allied with a 5 per cent lower HPI in 2021, or a c.10 percentage point higher weighting of the severe downside scenario.
The resulting ECL on drawn and undrawn loans and advances to customers of £6.8 billion represents 1.4 per cent coverage of gross loans and advances to customers, up 0.6 percentage points from 0.8 per cent at 31 December 2019. The ECL allowance remains high by historical standards and consistent with the Group’s updated macroeconomic projections, assumes that a large proportion of expected losses will crystallise over the next 12 to 18 months as support measures subside and unemployment increases.
The ECL allowance continues to reflect a probability-weighted view of future economic scenarios with a 30 per cent weighting applied to base case, upside and downside scenarios and a 10 per cent weighting to the severe downside. All scenarios have deteriorated since the start of the year, following the changes made to the base case. They also reflect a widening of the range of potential outcomes, following changes to the generation of scenarios around the base case.
Stage 2 loans and advances increased to £60.5 billion (31 December 2019: £38.4 billion), equivalent to 12.0 per cent (31 December 2019: 7.7 per cent) of total loans and advances to customers, as a result of the deterioration in economic outlook. Of these, 89 per cent are up to date (31 December 2019: 79 per cent, 30 September 2020: 89 per cent). Stage 3 loans and advances as a proportion of the portfolio have remained stable at 1.8 per cent in 2020 with limited increase in flows to default, given the availability of Government support and payment holidays. Approximately 90 per cent of payment holidays have now recommenced payment, with only £5.8 billion outstanding as at 16 February 2021. At 31 December £6.4 billion remained outstanding, of which 31 per cent was included in the £60.5 billion of Stage 2 assets. If those Retail customers in Stage 1 with payment holidays still in place at 31 December 2020 were moved to Stage 2, the impact on ECL would be less than £50 million.
The Group’s ECL coverage of Stage 2 assets increased to 4.5 per cent (31 December 2019: 3.7 per cent), again reflecting the updated economic outlook. Coverage of Stage 3 assets has also increased to 28.1 per cent (31 December 2019: 22.5 per cent) primarily due to an increase in ECL of £403 million on distressed existing clients whose recovery strategies were affected by the coronavirus pandemic.
Despite action taken to mitigate the significant levels of uncertainty through the use of the central overlay, the extent of the impairment charge in 2021 will depend on the potential severity and duration of the economic shock in the UK. Based on current macroeconomic assumptions, the Group expects the 2021 net asset quality ratio to be below 40 basis points.
Commercial Banking lending in key coronavirus-impacted sectors1
At 31 December 2020 At 30 June 2020
Drawn£bn
Undrawn£bn
Drawn and undrawn
£bn
Drawn asa % of
loans andadvances
%Drawn
£bnUndrawn
£bn
Drawn and undrawn
£bn
Drawn as a% of
loans andadvances
%
Retail non-food 2.2 1.7 3.9 0.5 2.4 1.8 4.2 0.5
Automotive dealerships2 1.8 2.0 3.8 0.4 2.4 1.5 3.9 0.5
Oil and gas 1.1 2.7 3.8 0.2 1.4 2.7 4.1 0.3
Construction 1.2 1.7 2.9 0.2 1.3 1.7 3.0 0.3
Passenger transport 1.2 1.1 2.3 0.2 1.3 0.6 1.9 0.4
Hotels 1.9 0.3 2.2 0.4 1.9 0.3 2.2 0.3
Leisure 0.7 0.7 1.4 0.1 0.8 0.5 1.3 0.2
Restaurants and bars 0.7 0.5 1.2 0.1 0.8 0.5 1.3 0.2
Total 10.8 10.7 21.5 2.1 12.3 9.6 21.9 2.7
1 Lending classified using ONS SIC codes at legal entity level.
2 Automotive dealerships includes Black Horse Motor Wholesale lending (within Retail Division).

Lloyds Banking Group Annual Report and Accounts 2020 65Strateg
ic report
Financial resultsG
overnanceRisk m
anagem
entFinancial statem
entsO
ther information
Retail payment holiday characteristics1
Mortgages Cards Loans Motor Total
000s £bn 000s £bn 000s £bn 000s £bn 000s £bn
Total payment holidays granted 489 61.9 338 1.7 298 2.4 155 2.3 1,279 68.3
First payment holiday still in force 10 1.4 14 0.1 11 0.1 9 0.1 44 1.7
Matured payment holidays – repaying 428 53.8 276 1.4 248 2.0 127 1.8 1,079 58.9
Matured payment holidays – extended 26 3.7 11 0.1 18 0.2 9 0.2 64 4.1
Matured payment holidays – missed payment 24 3.1 36 0.2 20 0.2 10 0.2 91 3.6
As a percentage of total matured
Matured payment holidays – repaying 89% 89% 85% 85% 87% 86% 87% 83% 87% 89%
Matured payment holidays – extended 5% 6% 3% 4% 6% 7% 6% 9% 5% 6%
Matured payment holidays – missed payment 5% 5% 11% 11% 7% 7% 7% 8% 7% 5%
1 Mortgages, credit cards and personal loans at 16 February 2021; Motor finance at 16 February 2021. Analysis of mortgage payment holidays excludes St James Place, Intelligent Finance and Tesco; Motor finance payment holidays excludes Lex Autolease. Total payment holidays granted are equal to the sum of first payment holiday still in force and matured payment holidays Totals and percentages calculated using unrounded numbers.
Government-backed loan scheme approvals and value1
000s £bn
Coronavirus Business Interruption Loan Scheme 10.1 2.4
Bounce Back Loan Scheme 327.0 9.3
Coronavirus Large Business Interruption Loan Scheme 0.1 0.7
Total 337.2 12.4
1 Data as at 12 February 2021.
Around 1.3 million Retail payment holidays, on £68.3 billion of lending, have been granted to help alleviate temporary financial pressure on customers during the crisis. Payment holidays of up to three months have been granted across Retail mortgages, personal loans, credit cards and motor finance, with extensions available of up to three months should customers request them. There are c.44,000 (£1.7 billion) payment holidays where the first payment holiday is still in force and 1.2 million (£66.6 billion) that have matured, including c.64,000 (£4.1 billion) that have then been extended.
The vast majority of first payment holidays (98 per cent) have now matured, of which 89 per cent by value have restarted payments, 6 per cent have been extended and 5 per cent have missed payment when due.
Mortgages account for the largest proportion of payment holidays, with a total of around 489,000 having been granted, equating to customer balances of £61.9 billion. As at 16 February 2021, 98 per cent, or c.479,000, have matured with 89 per cent, or 428,000, of those having resumed repayments, 5 per cent having extended and 5 per cent having missed payment. The average LTV of customers extending their mortgage payment holidays and still in extension remains relatively low at 50 per cent, compared to 44 per cent for the total mortgage book.
The Group also granted c.338,000 payment holidays on £1.7 billion of credit card balances, 298,000 payment holidays on £2.4 billion of unsecured personal loans and c.155,000 payment holidays on £2.3 billion of motor finance products. These products have experienced c.85 per cent of customers resuming payments at the end of their payment holidays. Only £0.1 billion of credit card balances have been subject to a payment holiday extension and are still in extension. £0.2 billion of total credit card payment holidays granted have missed payment.
Across all products, customers who are in extension remain of a typically lower credit quality than the wider book and tend to have higher average balances than customers who have not requested payment holidays. It should also be noted that of the customers missing payments after conclusion of the payment holiday, typically one third were in arrears at the start of the payment holiday.
Following the announcement of the latest national coronavirus-related lockdown, since 1 January 2021, the Group has granted c.28,000 new payment holidays on £0.8 billion of Retail balances.
For the duration of the payment holiday the Group continues to recognise interest on the loan under the effective interest rate method.
The Group has approved c.337,000 loans with a total value of £12.4 billion to customers under Government-backed loan schemes including c.327,000 loans totalling £9.3 billion approved under the Bounce Back Loan Scheme.

66 Lloyds Banking Group Annual Report and Accounts 2020
Statutory profit
2020 £m
2019 £m
Change %
Underlying profit 2,193 7,531 (71)
Restructuring (521) (471) (11)
Volatility and other items
Market volatility and asset sales (59) 126
Amortisation of purchased intangibles (69) (68) (1)
Fair value unwind (233) (275) 15
(361) (217) (66)
Payment protection insurance provision (85) (2,450)
Statutory profit before tax 1,226 4,393 (72)
Tax credit (expense) 161 (1,387)
Statutory profit after tax 1,387 3,006 (54)
Earnings per share 1.2p 3.5p (66)
Return on tangible equity – existing basis1 3.7% 7.8% (4.1)pp
Return on tangible equity – new basis1 2.3% 6.6% (4.3)pp
1 Calculation shown on page 79.
Further information on the reconciliation of underlying to statutory results is included on page 77.
Restructuring
2020 £m
2019 £m
Change %
Severance costs (156) (97) (61)
Property transformation (146) (121) (21)
Technology research and development (61) (6)
Regulatory programmes (42) (63) 33
Mergers and acquisitions, integration and other restructuring costs (116) (184) 37
Total restructuring (521) (471) (11)
Restructuring costs of £521 million were 11 per cent higher than in 2019 with £233 million incurred in the fourth quarter, as the Group resumed the property transformation programme and role reduction activities that were paused earlier in the year and also as a function of increased investment in technology research and development. The Group expects to increase its investment in technology research and development in 2021 and as a result expects restructuring costs to be higher in 2021 than in 2020.
Volatility and other items at a net loss of £361 million in 2020 comprised £59 million of negative market volatility and asset sales, £69 million of amortisation of purchased intangibles and £233 million of fair value unwind. Market volatility and asset sales included £222 million of negative insurance volatility, driven mainly by falling equity markets and a loss of £106 million relating to liability management exercises largely occurring in the fourth quarter. This was offset against positive banking volatility of £392 million, primarily reflecting exchange rate and interest rate movements. Comparatives for 2019 include a one-off charge for exiting the Standard Life Aberdeen investment management agreement.
The Group recognised a charge of £85 million for PPI in the final quarter of the year. This charge was driven by the impact of coronavirus delaying operational activities during 2020, the final stages of work to ensure operational completeness and final validation of information requests and complaints with third parties that resulted in a limited number of additional complaints to be handled. Of the approximately six million enquiries received pre-deadline, more than 99 per cent have now been processed. A small part of the costs incurred during the year also reflect the costs associated with litigation activity to date.
The return on tangible equity for 2020 was 3.7 per cent (2019: 7.8 per cent) and earnings per share were 1.2 pence (2019: 3.5 pence). In the fourth quarter of the year, return on tangible equity was 7.2 per cent.
Going forward and in order to aid comparability across the banking sector, the Group will report its statutory return on tangible equity without adding back the post-tax amortisation of intangible assets to the return. On this new basis and given improving profitability, the Group is targeting a return on tangible equity of between 5 and 7 per cent in 2021 and in excess of the cost of equity in the medium-term.
TaxThe Group recognised a tax credit of £161 million in the period, which was impacted by an uplift in the value of deferred tax assets of c.£350 million recognised in the first half of 2020. This credit reflected the UK corporation tax rate being held at 19 per cent, as substantively enacted on 17 March 2020. The Group continues to expect a medium-term effective tax rate around 25 per cent.
Summary of Group results continued

Lloyds Banking Group Annual Report and Accounts 2020 67Strateg
ic report
Financial resultsG
overnanceRisk m
anagem
entFinancial statem
entsO
ther information
Balance sheet
At 31 Dec2020
At 31 Dec2019
Change %
Loans and advances to customers1 £440bn £440bn –
Customer deposits2 £451bn £412bn 9
Loan to deposit ratio 98% 107% (9)pp
Wholesale funding £109bn £124bn (12)
Wholesale funding <1 year maturity £34bn £39bn (13)
Of which money-market funding <1 year maturity 3 £22bn £25bn (14)
Liquidity coverage ratio – eligible assets4 £142bn £130bn 9
Liquidity coverage ratio5 136% 137% (1)pp
1 Excludes reverse repos of £58.6 billion (31 December 2019: £54.6 billion).
2 Excludes repos of £9.4 billion (31 December 2019: £9.5 billion).
3 Excludes balances relating to margins of £5.3 billion (31 December 2019: £4.2 billion).
4 Eligible assets are calculated as an average of month-end observations over the previous 12 months post any liquidity haircuts. 2019 assets have been restated accordingly.
5 The Liquidity coverage ratio is calculated as a simple average of month end observations over the previous 12 months.
Loans and advances to customers were stable at £440.2 billion (31 December 2019: £440.4 billion). Within Retail, the open mortgage book increased by £10.2 billion in the second half of 2020 with £6.7 billion in the fourth quarter, reflecting the strength of the UK housing market. Commercial Banking loans, including Retail Business Banking, reduced by £2.2 billion in 2020 as the continued optimisation of the portfolio and reduced revolving credit facilities balances more than offset support provided to clients through Government-backed lending schemes.
Total customer deposits increased by £38.9 billion in the year, to £450.7 billion. The Group continues to target current account balance growth and optimise funding with Retail current accounts up 27 per cent at £97.4 billion (31 December 2019: £76.9 billion), having grown ahead of the market in the year. The Group’s loan to deposit ratio of 98 per cent, down 9 percentage points on 2019, was driven by increased customer deposits and evidences a strong liquidity position and significant potential to lend into an economic recovery. The Group continues to access wholesale funding markets across a variety of currencies and markets. During the year, the Group repaid all outstanding amounts of its Term Funding Scheme (TFS) drawings of £15.4 billion and the remaining £1 billion outstanding of its Funding for Lending Scheme (FLS) drawings. In addition to the £1 billion drawn in the first half of the year, the Group has made drawings of £12.7 billion in the second half from the new Term Funding Scheme with additional incentives for SMEs (TFSME), taking the total outstanding amount to £13.7 billion at 31 December 2020. Overall, total wholesale funding has reduced to £109.4 billion at 31 December 2020 (31 December 2019: £124.2 billion) principally as a result of the growth in customer deposits.
Capital
At 31 Dec 2020
At 31 Dec2019
Change %
CET1 ratio1,2 16.2% 13.8% 2.4pp
CET1 ratio pre IFRS 9 transitional relief1,2 15.0% 13.4% 1.6pp
Transitional total capital ratio1,2 23.3% 21.5% 1.8pp
Transitional MREL ratio1,2 36.4% 32.6% 3.8pp
UK leverage ratio1,2 5.8% 5.2% 0.6pp
Risk-weighted assets1 £203bn £203bn –
Shareholders' equity £43bn £42bn 4
Tangible net assets per share 52.3p 50.8p 1.5p
1 The CET1, total capital, MREL and leverage ratios and risk-weighted assets at 31 December 2019 are reported on a pro forma basis, reflecting the dividend paid up by the Insurance business in the subsequent first quarter period. The CET1 ratio pre IFRS 9 transitional relief reflects the full impact of IFRS 9, prior to the application of transitional arrangements. Excluding dividend accrual, the CET1 ratio at 31 December 2020 was 16.4 per cent.
2 CET1 ratios at 31 December 2020 include an increase of 51 basis points following the implementation of the revised capital treatment of intangible software assets. The benefit through CET1 capital is reflected through the total capital, MREL and leverage ratios.
Capital movements bps
Banking business capital build excluding impairment 192
Impairment charge (174)
Banking business underlying capital build 18
IFRS 9 transitional relief 83
RWA and other movements 28
Capital build pre software change 129
Revised treatment of intangible software assets 51
Reversal of FY 2019 ordinary dividend accrual 83
Capital build pre dividend 263 Ordinary dividend accrual (21)
Capital build post dividend 242

68 Lloyds Banking Group Annual Report and Accounts 2020
The Group’s CET1 capital ratio post dividend increased 242 basis points over the year, from 13.8 per cent on a pro forma basis to 16.2 per cent. Capital build prior to the dividend accrual of 21 basis points, the impact of the revised treatment of intangible software assets of 51 basis points and the 2019 full year dividend reversal of 83 basis points, was 129 basis points. Banking business capital build of 192 basis points was largely offset by the 174 basis point impact of impairment in the year, mitigated by the benefit of the IFRS 9 transitional relief (83 basis points). RWA and other movements contributed 28 basis points, with pension contributions (equivalent to 46 basis points) more than offset by reductions in underlying risk-weighted assets and excess expected losses as well as favourable market and other movements.
The increase in the CET1 ratio of 118 basis points in the fourth quarter (pre dividend accrual) reflected underlying profitability, risk-weighted asset reductions and the introduction of the revised capital treatment of intangible software assets.
The PRA is consulting on a proposal to reverse the revised capital treatment of software assets (which currently follows EU capital regulations). Should the PRA proceed with their proposal then the reinstatement of the original requirement to deduct these assets from capital will come into force during 2021. This could lead to a c.50 basis points reduction in the Group’s CET1 capital ratio (net of a reduction in associated RWAs), and based on the position at 31 December 2020 the ratio would reduce to 15.7 per cent.
The Group applies the revised IFRS 9 transitional arrangements for capital as set out under current capital regulations. The arrangements provide for temporary capital relief for the increase in accounting impairment provisions following the initial implementation of IFRS 9 (‘static’ relief) and subsequent relief for any increases in Stage 1 and Stage 2 expected credit losses since 1 January 2020 (‘dynamic’ relief). The transitional arrangements do not cover Stage 3 expected credit losses.
Whilst the net increase in IFRS 9 transitional relief over the year amounted to 83 basis points, the Group’s total relief recognised at 31 December 2020 amounted to 115 basis points, including static relief.
Risk-weighted assets reduced by £0.7 billion over the year from £203.4 billion to £202.7 billion. Increases were from credit migrations and model calibrations (c.£2.5 billion); regulatory changes, including the revised capital treatment of intangible software assets (net £2.2 billion); and other movements, including Retail model updates (c.£1.9 billion). In addition, there were increases in risk-weighted assets attributable to deferred tax assets and the risk-weighted element of the Group’s investment in Insurance following the increase in the Group’s capital base (£1.6 billion). These were more than offset by reductions in lending balances outside Government-backed schemes (£3.6 billion) and optimisation activity undertaken in Commercial Banking (c.£5.3 billion).
Risk-weighted assets reduced by £2.5 billion in the fourth quarter, largely reflecting reductions from credit migrations and model calibrations (including HPI improvement), continued optimisation of the Commercial Banking portfolio and the disposal of a legacy equity investment in Visa Inc., offset in part by an increase as a result of the revised capital treatment of intangible software assets.
Whilst credit migration in 2020 has been less than expected, it is expected to have a fuller impact in 2021 and into 2022, consistent with economic forecasts. It is also expected that a material part of the Group’s IFRS 9 dynamic relief that built up during 2020 will unwind in 2021 with the remainder expected to largely unwind in 2022, impacting CET1 ratios. As a result, based on current economic forecasts, the Group expects capital build in 2021 to be impacted by the expected unwind of IFRS 9 transitional relief, as well as profitability.
The deferral of the UK implementation of the remainder of CRR 2 means that expected risk-weighted asset inflation driven by changes to the new standardised approach for calculating counterparty credit risk exposure (SA-CCR) will now impact in 2022, with no significant regulatory changes expected in 2021, other than the PRA’s proposed reversal of the revised treatment of software assets. Given these movements, as well as continued optimisation in the Commercial Banking portfolio, the Group expects risk-weighted assets in 2021 to be broadly stable on 2020, but with headwinds from regulatory changes in 2022.
During the first half of 2020 the PRA reduced the Group’s Pillar 2A CET1 requirement from 2.6 per cent to 2.3 per cent. In December 2020 the PRA further reduced the requirement to c.2.1 per cent in the context of a higher UK countercyclical capital buffer rate, which in normal conditions will be set at 2 per cent (currently set at zero per cent). In line with PRA policy, the latter reduction is currently fully offset by other regulatory capital requirements at the CET1 level.
Following the decision by the PRA to reduce the UK countercyclical capital buffer rate to zero earlier in the year, combined with the initial Pillar 2A reduction noted above, the Group’s CET1 capital regulatory requirement has reduced to c.11 per cent. Consequently, current CET1 headroom over requirements has increased.
The Board’s view of the ongoing level of CET1 capital required by the Group to grow the business, meet regulatory requirements and cover uncertainties remains at c.12.5 per cent, plus a management buffer of c.1 per cent.
The transitional total capital ratio increased to 23.3 per cent (31 December 2019: 21.5 per cent on a pro forma basis) and the Group’s transitional minimum requirement for own funds and eligible liabilities (MREL), which came into force on 1 January 2020, is 36.4 per cent (31 December 2019: 32.6 per cent on a pro forma basis). The UK leverage ratio increased to 5.8 per cent.
PensionsTerms have now been agreed in principle with the Group Pensions Trustee in respect of the valuations of the Group’s three main defined benefit pension schemes. The valuations showed an aggregate ongoing funding deficit of £7.3 billion as at 31 December 2019 (£7.3 billion deficit at 31 December 2016). The revised deficit now includes an allowance for the impact of RPI reform announced by the Chancellor of the Exchequer in November 2020.
Under the previous recovery plan, deficit contributions were committed of c.£0.8 billion in 2020 and c.£1.3 billion per annum from 2021 to 2024. Under the new recovery plans, c.£0.8 billion was paid in 2020 with contributions looking forward equating to c.£0.8 billion per annum, plus a further 30 per cent of in year capital distributions to ordinary shareholders, up to a limit on total deficit contributions of £2.0 billion per annum payable until this deficit has been removed. The Group continues to provide security to these pension schemes, with corporate guarantees and collateral pledged, while also making additional annual contributions for future service and scheme running costs.
DividendFollowing a request made by the PRA to large UK banks in March 2020, the Group suspended the payment of dividends on ordinary shares for the remainder of the year and cancelled the payment of the final dividend for 2019. These actions were undertaken as a precautionary measure to preserve capital as the spread of the coronavirus pandemic led to a UK-wide lockdown, with the potential to create a significant and prolonged downturn.
In December 2020, the PRA announced that dividend payments could recommence, provided that this was subject to a prudent framework for the setting of such distributions. As a result the PRA has established a cap on distributions for year end 2020.
Given the Group’s strong capital position at the year end and the regulator’s clarification that banks may resume capital distributions, the Board has recommended a final ordinary dividend of 0.57 pence per share, the maximum allowed under the PRA’s guidelines.
The PRA has additionally noted its intention to provide a further update on distributions ahead of the 2021 half year results for the large UK banks. It is expected that the PRA will take account of the outcome of the first stage of the Bank of England 2021 solvency stress test exercise in informing its approach to half year distributions. Ahead of the update at half year, dividends may be accrued for via capital, provided this is undertaken on an appropriately prudent basis, but may not be paid.
The Group will update the market on interim dividend payments with the half year results, following receipt of the update from the regulator and based on macroeconomic conditions at the time.
The Board remains committed to future capital returns. In 2021, the Board intends to accrue dividends and resume its progressive and sustainable ordinary dividend policy with the dividend at a higher level than 2020. As normal, the Board will give due consideration at year end to the size of the final dividend payment and any return of surplus capital in addition to the ordinary dividend, based on circumstances at the time.
Summary of Group results continued

Lloyds Banking Group Annual Report and Accounts 2020 69Strateg
ic report
Financial resultsG
overnanceRisk m
anagem
entFinancial statem
entsO
ther information
Income statement – underlying basis
2020£m
2019£m
Change%
Net interest income 10,773 12,377 (13)
Other income 4,515 5,732 (21)
Operating lease depreciation (884) (967) 9
Net income 14,404 17,142 (16)
Operating costs (7,585) (7,875) 4
Remediation (379) (445) 15
Total costs (7,964) (8,320) 4
Trading surplus 6,440 8,822 (27)
Impairment (4,247) (1,291)
Underlying profit 2,193 7,531 (71)
Restructuring (521) (471) (11)
Volatility and other items (361) (217) (66)
Payment protection insurance provision (85) (2,450)
Statutory profit before tax 1,226 4,393 (72)
Tax credit (expense) 161 (1,387)
Statutory profit after tax 1,387 3,006 (54)
Earnings per share 1.2p 3.5p (66)
Dividends per share – ordinary 0.57p 1.12p –
Banking net interest margin 2.52% 2.88% (36)bp
Average interest-earning banking assets £435bn £435bn –
Cost:income ratio 55.3% 48.5% 6.8pp
Asset quality ratio 0.96% 0.29% 67bp
Return on tangible equity – existing basis 3.7% 7.8% (4.1)pp
Return on tangible equity – new basis 2.3% 6.6% (4.3)pp
Key balance sheet metricsAt 31 Dec
2020 At 31 Dec
2019Change
%
Loans and advances to customers1 £440bn £440bn –
Customer deposits2 £451bn £412bn 9
Loan to deposit ratio 98% 107% (9)pp
CET1 ratio3,4 16.2% 13.8% 2.4pp
CET1 ratio pre IFRS 9 transitional relief3,4 15.0% 13.4% 1.6pp
Transitional MREL ratio3,4 36.4% 32.6% 3.8pp
UK leverage ratio3,4 5.8% 5.2% 0.6pp
Risk-weighted assets3 £203bn £203bn –
Tangible net assets per share 52.3p 50.8p 1.5p
1 Excludes reverse repos of £58.6 billion (31 December 2019: £54.6 billion).
2 Excludes repos of £9.4 billion (31 December 2019: £9.5 billion).
3 The CET1, MREL and leverage ratios and risk-weighted assets at 31 December 2019 are reported on a pro forma basis, reflecting the dividend paid up by the Insurance business in the subsequent first quarter period. The CET1 ratio pre IFRS 9 transitional relief reflects the full impact of IFRS 9, prior to the application of transitional arrangements. Excluding dividend accrual, the CET1 ratio at 31 December 2020 was 16.4 per cent.
4 CET1 ratios at 31 December 2020 include an increase of 51 basis points following the implementation of the revised capital treatment of intangible software assets. The benefit through CET1 capital is reflected through the MREL and leverage ratios.

70 Lloyds Banking Group Annual Report and Accounts 2020
Quarter ended 31 Dec
2020 £m
Quarterended
30 Sept 2020
£m
Quarterended
30 June 2020
£m
Quarterended 31 Mar
2020 £m
Quarterended31 Dec
2019£m
Quarterended
30 Sept2019
£m
Quarterended
30 June2019
£m
Quarterended31 Mar
2019£m
Net interest income 2,677 2,618 2,528 2,950 3,102 3,130 3,062 3,083
Other income 1,066 988 1,235 1,226 1,267 1,315 1,594 1,556
Operating lease depreciation (150) (208) (302) (224) (236) (258) (254) (219)
Net income 3,593 3,398 3,461 3,952 4,133 4,187 4,402 4,420
Operating costs (2,028) (1,858) (1,822) (1,877) (2,058) (1,911) (1,949) (1,957)
Remediation (125) (77) (90) (87) (219) (83) (123) (20)
Total costs (2,153) (1,935) (1,912) (1,964) (2,277) (1,994) (2,072) (1,977)
Trading surplus 1,440 1,463 1,549 1,988 1,856 2,193 2,330 2,443
Impairment (128) (301) (2,388) (1,430) (341) (371) (304) (275)
Underlying profit 1,312 1,162 (839) 558 1,515 1,822 2,026 2,168
Restructuring (233) (155) (70) (63) (191) (98) (56) (126)
Volatility and other items (202) 29 233 (421) 122 126 (126) (339)
Payment protection insurance provision (85) – – – – (1,800) (550) (100)
Statutory profit (loss) before tax 792 1,036 (676) 74 1,446 50 1,294 1,603
Tax (expense) credit (112) (348) 215 406 (427) (288) (269) (403)
Statutory profit (loss) after tax 680 688 (461) 480 1,019 (238) 1,025 1,200
Banking net interest margin 2.46% 2.42% 2.40% 2.79% 2.85% 2.88% 2.89% 2.91%
Average interest-earning banking assets £437bn £436bn £435bn £432bn £437bn £435bn £433bn £433bn
Cost:income ratio 59.9% 56.9% 55.2% 49.7% 55.1% 47.6% 47.1% 44.7%
Asset quality ratio 0.11% 0.27% 2.16% 1.30% 0.30% 0.33% 0.27% 0.25%
Gross asset quality ratio 0.16% 0.28% 2.19% 1.35% 0.39% 0.40% 0.38% 0.30%
Return on tangible equity – existing basis 7.2% 7.4% (4.8%) 5.0% 11.0% (2.8%) 10.5% 12.5%
Return on tangible equity – new basis 5.9% 6.0% (6.1%) 3.7% 9.8% (4.0%) 9.3% 11.4%
Loans and advances to customers1 £440bn £439bn £440bn £443bn £440bn £447bn £441bn £441bn
Customer deposits2 £451bn £447bn £441bn £428bn £412bn £419bn £418bn £417bn
Loan to deposit ratio 98% 98% 100% 103% 107% 107% 106% 106%
Risk-weighted assets3 £203bn £205bn £207bn £209bn £203bn £209bn £207bn £208bn
Tangible net assets per share 52.3p 52.2p 51.6p 57.4p 50.8p 52.0p 53.0p 53.4p
1 Excludes reverse repos.
2 Excludes repos.
3 Risk-weighted assets at 30 June 2019 and 31 December 2019 are reported on a pro forma basis reflecting the Insurance dividend paid to the Group in the subsequent reporting period.
Quarterly information

Lloyds Banking Group Annual Report and Accounts 2020 71Strateg
ic report
Financial resultsG
overnanceRisk m
anagem
entFinancial statem
entsO
ther information
At 31 Dec2020£bn
At 30 Sept2020£bn
Change%
At 30 June2020£bn
Change%
At 31 Dec2019£bn
Change%
Loans and advances to customers
Open mortgage book 277.3 270.6 2 267.1 4 270.1 3
Closed mortgage book 16.5 17.0 (3) 17.5 (6) 18.5 (11)
Credit cards 14.3 14.8 (3) 15.2 (6) 17.7 (19)
UK Retail unsecured loans 8.0 8.2 (2) 8.2 (2) 8.4 (5)
UK Motor Finance 14.7 14.8 (1) 15.3 (4) 15.6 (6)
Overdrafts 0.9 1.0 (10) 1.0 (10) 1.3 (31)
Retail other1 10.4 10.2 2 9.7 7 9.0 16
SME2 40.6 40.0 2 38.4 6 32.1 26
Mid Corporates3 4.1 4.4 (7) 4.6 (11) 5.3 (23)
Corporate and Institutional3 46.0 50.2 (8) 55.0 (16) 54.6 (16)
Commercial Banking other 4.3 4.6 (7) 5.0 (14) 5.2 (17)
Wealth 0.9 0.9 – 0.9 – 0.9 –
Central items 2.2 2.5 (12) 2.5 (12) 1.7 29
Loans and advances to customers4 440.2 439.2 – 440.4 – 440.4 –
Customer deposits
Retail current accounts 97.4 91.7 6 87.5 11 76.9 27
Commercial current accounts2,5 47.6 45.7 4 44.2 8 34.9 36
Retail relationship savings accounts 154.1 149.9 3 148.5 4 144.5 7
Retail tactical savings accounts 14.0 12.5 12 12.7 10 13.3 5
Commercial deposits2,6 122.7 132.9 (8) 133.8 (8) 127.6 (4)
Wealth 14.1 13.6 4 13.5 4 13.7 3
Central items 0.8 0.9 (11) 0.9 (11) 0.9 (11)
Total customer deposits7 450.7 447.2 1 441.1 2 411.8 9
Total assets 871.3 868.9 – 873.0 – 833.9 4
Total liabilities 821.9 819.4 – 824.1 – 786.1 5
Shareholders’ equity 43.3 43.4 – 42.8 1 41.7 4
Other equity instruments 5.9 5.9 – 5.9 – 5.9 –
Non-controlling interests 0.2 0.2 – 0.2 – 0.2 –
Total equity 49.4 49.5 – 48.9 1 47.8 3
Ordinary shares in issue, excluding own shares 70,812m 70,776m – 70,735m – 70,031m 11 Primarily Europe.
2 Includes Retail Business Banking.
3 Commercial Banking segmentation has been updated to reflect new client coverage model.
4 Excludes reverse repos.
5 Primarily non-interest-bearing Commercial Banking current accounts.
6 Primarily Commercial Banking interest-bearing accounts.
7 Excludes repos.
Balance sheet analysis

72 Lloyds Banking Group Annual Report and Accounts 2020
2020Retail
£m
Commercial Banking
£m
Insurance and Wealth
£m
Central items
£mGroup
£m
Net interest income 8,384 2,357 49 (17) 10,773
Other income 1,733 1,292 1,250 240 4,515
Operating lease depreciation (856) (28) – – (884)
Net income 9,261 3,621 1,299 223 14,404
Operating costs (4,761) (1,851) (902) (71) (7,585)
Remediation (125) (210) (50) 6 (379)
Total costs (4,886) (2,061) (952) (65) (7,964)
Trading surplus 4,375 1,560 347 158 6,440
Impairment (2,384) (1,464) (9) (390) (4,247)
Underlying profit 1,991 96 338 (232) 2,193
Banking net interest margin 2.52% 2.83% 2.52%
Average interest-earning banking assets £345.5bn £88.6bn £0.9bn – £435.0bn
Asset quality ratio 0.69% 1.53% 0.96%
Return on risk-weighted assets 2.01% 0.12% 1.07%
Loans and advances to customers1 £350.9bn £86.2bn £0.9bn £2.2bn £440.2bn
Customer deposits2 £290.2bn £145.6bn £14.1bn £0.8bn £450.7bn
Risk-weighted assets £99.0bn £75.0bn £1.3bn £27.4bn £202.7bn
2019Retail3
£m
Commercial Banking3
£m
Insurance and Wealth3
£m
Central items3
£mGroup
£m
Net interest income 9,184 2,892 77 224 12,377
Other income 2,019 1,417 2,021 275 5,732
Operating lease depreciation (946) (21) – – (967)
Net income 10,257 4,288 2,098 499 17,142
Operating costs (4,768) (2,073) (982) (52) (7,875)
Remediation (238) (155) (50) (2) (445)
Total costs (5,006) (2,228) (1,032) (54) (8,320)
Trading surplus 5,251 2,060 1,066 445 8,822
Impairment (1,038) (306) – 53 (1,291)
Underlying profit 4,213 1,754 1,066 498 7,531
Banking net interest margin 2.77% 3.22% 2.88%
Average interest-earning banking assets £341.9bn £91.9bn £0.9bn – £434.7bn
Asset quality ratio 0.30% 0.30% 0.29%
Return on risk-weighted assets 4.36% 2.14% 3.65%
Loans and advances to customers1 £342.6bn £95.2bn £0.9bn £1.7bn £440.4bn
Customer deposits2 £253.2bn £144.0bn £13.7bn £0.9bn £411.8bn
Risk-weighted assets £98.4bn £77.4bn £1.3bn £26.3bn £203.4bn
1 Excludes reverse repos.
2 Excludes repos.
3 Prior period segmental comparatives restated. See note 4 on page 240.
Alternative performance measuresThe Group uses a number of alternative performance measures, including underlying profit in the discussion of its business performance and financial position. Further information is provided on page 348.
Underlying basisIn order to allow a comparison of the Group’s underlying performance, the results are adjusted for certain items including restructuring, including severance-related costs, property transformation, technology research and development, regulatory programmes and merger, acquisition and integration costs, volatility and other items, which includes the effects of certain asset sales, the volatility relating to the Group’s hedging arrangements and that arising in the insurance businesses, insurance gross up, the unwind of acquisition related fair value adjustments and the amortisation of purchased intangible assets and payment protection insurance provisions.
Segmental analysis – underlying basis

Lloyds Banking Group Annual Report and Accounts 2020 73Strateg
ic report
Financial resultsG
overnanceRisk m
anagem
entFinancial statem
entsO
ther information
Retail performance summary
2020 £m
20191
£m Change
%
Net interest income 8,384 9,184 (9)
Other income 1,733 2,019 (14)
Operating lease depreciation (856) (946) 10
Net income 9,261 10,257 (10)
Operating costs (4,761) (4,768) –
Remediation (125) (238) 47
Total costs (4,886) (5,006) 2
Trading surplus 4,375 5,251 (17)
Impairment (2,384) (1,038)
Underlying profit 1,991 4,213 (53)
Banking net interest margin 2.52% 2.77% (25) bp
Average interest-earning banking assets £345.5bn £341.9bn 1
Asset quality ratio 0.69% 0.30% 39bp
Return on risk-weighted assets 2.01% 4.36% (235) bp
At 31 Dec 2020 £bn
At 31 Dec 20191
£bnChange
%
Open mortgage book 277.3 270.1 3
Closed mortgage book 16.5 18.5 (11)
Credit cards 14.3 17.7 (19)
UK unsecured loans 8.0 8.4 (5)
UK Motor Finance 14.7 15.6 (6)
Business Banking 8.8 2.0
Overdrafts 0.9 1.3 (31)
Other2 10.4 9.0 16
Loans and advances to customers 350.9 342.6 2
Operating lease assets 3.9 4.3 (9)
Total customer assets 354.8 346.9 2
Current Accounts 97.4 76.9 27
Relationship savings3 178.8 163.0 10
Tactical savings 14.0 13.3 5
Customer deposits 290.2 253.2 15
Risk-weighted assets 99.0 98.4 1
1 Restated to reflect migration of certain customer relationships from the SME business within Commercial Banking to Business Banking within Retail and to reflect the Group’s adoption of the Sterling Overnight Index Average (SONIA).
2 Includes Europe and run-off.
3 Includes Business Banking.
Retail

74 Lloyds Banking Group Annual Report and Accounts 2020
Commercial Banking performance summary
2020 £m
20191
£m Change
%
Net interest income 2,357 2,892 (18)
Other income 1,292 1,417 (9)
Operating lease depreciation (28) (21) (33)
Net income 3,621 4,288 (16)
Operating costs (1,851) (2,073) 11
Remediation (210) (155) (35)
Total costs (2,061) (2,228) 7
Trading surplus 1,560 2,060 (24)
Impairment (1,464) (306)
Underlying profit 96 1,754 (95)
Banking net interest margin 2.83% 3.22% (39)bp
Average interest-earning banking assets £88.6bn £91.9bn (4)
Asset quality ratio 1.53% 0.30% 123bp
Return on risk-weighted assets 0.12% 2.14% (202)bp
At 31 Dec 2020 £bn
At 31 Dec20191
£bnChange
%
SME 31.8 30.1 6
Mid Corporates 4.1 5.3 (23)
Corporate and Institutional 46.0 54.6 (16)
Other 4.3 5.2 (17)
Loans and advances to customers 86.2 95.2 (9)
SME loans and advances including Retail Business Banking 40.6 32.1 26
Customer deposits 145.6 144.0 1
Current accounts including Retail Business Banking 47.6 34.9 36
Other customer deposits including Retail Business Banking 122.7 127.6 (4)
Risk-weighted assets 75.0 77.4 (3)
1 Restated to reflect migration of certain customer relationships from the SME business within Commercial Banking to Business Banking within Retail and to reflect the Group’s adoption of the Sterling Overnight Index Average (SONIA).
Commercial Banking

Lloyds Banking Group Annual Report and Accounts 2020 75Strateg
ic report
Financial resultsG
overnanceRisk m
anagem
entFinancial statem
entsO
ther information
Insurance and Wealth performance summary
2020 £m
20191
£m Change
%
Net interest income 49 77 (36)
Other income 1,250 2,021 (38)
Net income 1,299 2,098 (38)
Operating costs (902) (982) 8
Remediation (50) (50) –
Total costs (952) (1,032) 8
Trading surplus 347 1,066 (67)
Impairment (9) –
Underlying profit 338 1,066 (68)
Life and pensions sales (PVNBP)2 14,529 17,515 (17)
General insurance underwritten new gross written premiums 111 127 (13)
General insurance underwritten total gross written premiums 662 671 (1)
General insurance combined ratio 85% 82% 3pp
At 31 Dec2020£bn
At 31 Dec2019£bn
Change %
Insurance Solvency II ratio3 151% 170% (19)pp
UK Wealth Loans and advances to customers 0.9 0.9 –
UK Wealth Customer deposits 14.1 13.7 3
UK Wealth Risk-weighted assets 1.3 1.3 –
Total customer assets under administration 171.9 170.0 1
Income by product group
2020 20191
New business
£m
Existing business
£mTotal
£m
New business
£m
Existing business
£mTotal
£m
Workplace, planning and retirement 203 124 327 387 120 507
Individual and bulk annuities 166 84 250 209 68 277
Protection 16 21 37 21 24 45
Longstanding LP&I 9 346 355 11 384 395
394 575 969 628 596 1,224
Life and pensions experience and other items (195) 220
General insurance 309 326
1,083 1,770
Wealth4 216 328
Net income 1,299 2,098
1 Restated to reflect the Group’s adoption of the Sterling Overnight Index Average (SONIA).
2 Present value of new business premiums. Further information on page 348.
3 Equivalent estimated regulatory view of ratio (including With Profits funds) was 144 per cent (31 December 2019: 154 per cent).
4 2019 wealth income includes c.£70 million relating to business that was transferred to Schroders Personal Wealth in October 2019.
Insurance and Wealth

76 Lloyds Banking Group Annual Report and Accounts 2020
2020 £m
20191 £m
Change %
Net income 223 499 (55)
Operating costs (71) (52) (37)
Remediation 6 (2)
Total costs (65) (54) (20)
Trading surplus 158 445 (64)
Impairment (390) 53
Underlying (loss) profit (232) 498
1 Prior period restated. See note 4 on page 240.
Central items includes income and expenditure not attributed to divisions, including residual net interest income after transfer pricing (including the central recovery of the Group’s distributions on other equity instruments), in period gains from gilt sales and the unwind of associated hedging costs, as well as the Group’s equities business, including Lloyds Development Capital.
During 2020, net income included a gain of £149 million on the sale of gilts and other liquid assets, compared with a £185 million gain on sale of such assets in 2019. The Group’s equities business, including Lloyds Development Capital, contributed net income of £150 million compared to £223 million in the prior year. In addition, the net income comparative for 2019 included a gain of £50 million relating to the sale of the Group’s interest in Vocalink.
The impairment charge incurred in 2020 includes a £400 million central uncertainty overlay applied in respect of uncertainty in the economic outlook not captured within the modelled divisional ECL allowances. In 2019 impairment included releases relating to the reassessment of credit risk associated with debt instruments held within the Group’s equity investment business.
Central items

Lloyds Banking Group Annual Report and Accounts 2020 77Strateg
ic report
Financial resultsG
overnanceRisk m
anagem
entFinancial statem
entsO
ther information
1. Reconciliation between statutory and underlying basis financial informationThe tables below set out the reconciliation from the statutory results to the underlying basis results, the principles of which are set out in the basis of presentation.
Removal of:
2020
Statutorybasis
£m
Volatility and other
items1,2
£m
Insurancegross up3
£mPPI£m
Underlyingbasis
£m
Net interest income 10,749 174 (150) – 10,773
Other income, net of insurance claims 4,377 165 (27) – 4,515
Operating lease depreciation (884) – – (884)
Net income 15,126 (545) (177) – 14,404
Operating expenses4 (9,745) 1,522 174 85 (7,964)
Impairment5 (4,155) (95) 3 – (4,247)
Profit before tax 1,226 882 – 85 2,193
2019
Net interest income 10,180 379 1,818 – 12,377
Other income, net of insurance claims 8,179 (426) (2,021) – 5,732
Operating lease depreciation (967) – – (967)
Net income 18,359 (1,014) (203) – 17,142
Operating expenses4 (12,670) 1,697 203 2,450 (8,320)
Impairment (1,296) 5 – – (1,291)
Profit before tax 4,393 688 – 2,450 7,531
The table below sets out the reconciliation from statutory profit before tax to underlying trading surplus.
2020 £m
2019 £m
Statutory profit before tax 1,226 4,393
Add back: impairment 4,155 1,296
Volatility and other items1,2 977 683
Insurance gross up (3) –
Payment protection insurance 85 2,450
Underlying trading surplus 6,440 8,822
1 In the year ended 31 December 2020 this comprises the effects of market volatility and asset sales (loss of £59 million); the amortisation of purchased intangibles (£69 million); restructuring (£521 million, including severance costs, property transformation, technology research and development, regulatory programmes and merger, acquisition and integration costs); and fair value unwind (losses of £233 million).
2 In the year ended 31 December 2019 this comprises the effects of market volatility and asset sales (gains of £126 million); the amortisation of purchased intangibles (£68 million); restructuring (£471 million, including severance, property optimisation, technology research and development, regulatory programmes and merger, acquisition and integration costs; and fair value unwind (losses of £275 million).
3 The Group’s insurance businesses’ income statements include income and expense attributable to the policyholders of the Group’s long-term assurance funds. These items have no impact in total upon profit attributable to equity shareholders and, to provide a clearer representation of the underlying trends within the business, these items are shown net within the underlying results.
4 The statutory basis figure is the aggregate of operating costs and operating lease depreciation.
5 Certain derivative valuation adjustments associated with credit-impaired customers are included within the impairment charge on an underlying basis but reported within other income, net of insurance claims on a statutory basis.
Other financial information

78 Lloyds Banking Group Annual Report and Accounts 2020
2. Banking net interest margin and average interest-earning assets
2020 2019
Group net interest income – statutory basis (£m) 10,749 10,180
Insurance gross up (£m) (150) 1,818
Volatility and other items (£m) 174 379
Group net interest income – underlying basis (£m) 10,773 12,377
Non-banking net interest expense (£m) 177 145
Banking net interest income – underlying basis (£m) 10,950 12,522
Net loans and advances to customers (£bn)1 440.2 440.4
Impairment provision and fair value adjustments (£bn) 6.3 3.9
Non-banking items:
Fee-based loans and advances (£bn) (5.1) (6.3)
Other non-banking (£bn) (2.6) (3.1)
Gross banking loans and advances (£bn) 438.8 434.9
Averaging (£bn)2 (3.8) (0.2)
Average interest-earning banking assets (£bn) 435.0 434.7
Banking net interest margin (%) 2.52 2.88
1 Excludes reverse repos.
2 2020 includes the effects of the growth in the open mortgage book towards the end of the year.
3. Volatility arising in the insurance businessVolatility included in the Group’s statutory results before tax comprises the following:
2020 £m
2019 £m
Insurance volatility (220) 230
Policyholder interests volatility (74) 193
Total volatility (294) 423
Insurance hedging arrangements 72 (347)
Total (222) 76
The Group’s insurance business has policyholder liabilities that are supported by substantial holdings of investments. IFRS requires that the changes in both the value of the liabilities and investments are reflected within the income statement. The value of the liabilities does not move exactly in line with changes in the value of the investments. As the investments are substantial, movements in their value can have a significant impact on the profitability of the Group. Management believes that it is appropriate to disclose the division’s results on the basis of an expected return. The impact of the actual return on these investments differing from the expected return is included within insurance volatility.
Insurance volatility movements in 2020 were largely driven by significant movements in global equity markets, credit spreads and interest rate movements. Although the Group manages its exposures to equity, interest rate, foreign currency exchange rate, inflation and market movements within the Insurance division, it does so by balancing the importance of managing the impacts on both capital and earnings volatility. For example, equity market movements are hedged within Insurance on a Solvency II capital basis and whilst this also reduces the IFRS earnings exposure to equity market movements, the hedge works to a lesser extent from an IFRS earnings perspective.
4. Changes in Insurance assumptionsThe following impacts from assumption changes are included within Insurance and Wealth other operating income.
2020 £m
2019 £m
Persistency (74) (67)
Mortality, longevity and morbidity 52 164
Expense assumptions (124) 208
Other (5) 31
Total (151) 336
Key life and pensions assumptions and methodologies are reviewed through the annual basis review in the fourth quarter of each year, however assumptions are monitored continuously and updated when necessary.
Current year changes reflect the macroeconomic impacts of the pandemic such as redundancies and furlough; prior year included annuitant longevity benefit from updates to the industry standard model for the projection of future mortality rates. The changes in expense assumptions reflect lower in-year new business volumes impacting average per policy administration costs, reallocation of costs between business lines and future short-term committed expenditure on specific projects. 2019 included the benefit of the change in investment management provider.
The above table excludes a c.£91 million benefit from methodology changes recognised in the first half of 2020.
Other financial information continued

Lloyds Banking Group Annual Report and Accounts 2020 79Strateg
ic report
Financial resultsG
overnanceRisk m
anagem
entFinancial statem
entsO
ther information
5. Tangible net assets per shareThe table below sets out a reconciliation of the Group’s shareholders’ equity to its tangible net assets.
At 31 Dec2020
£m
At 31 Dec2019
£m
Shareholders’ equity 43,278 41,697
Goodwill (2,320) (2,324)
Intangible assets (4,140) (3,808)
Purchased value of in-force business (221) (247)
Other, including deferred tax effects 459 269
Tangible net assets 37,056 35,587
Ordinary shares in issue, excluding own shares 70,812m 70,031m
Tangible net assets per share 52.3p 50.8p
6. Return on tangible equity
2020 2019
Average shareholders' equity (£bn) 43.5 43.0
Average intangible assets (£bn) (6.2) (5.9)
Average tangible equity (£bn) 37.3 37.1
Group statutory profit after tax (£m) 1,387 3,006
Less profit attributable to non-controlling interests and other equity holders (£m) (522) (547)
Adjusted statutory profit after tax (£m) – new basis 865 2,459
Add back amortisation of intangible assets (post tax) (£m) 502 438
Adjusted statutory profit after tax (£m) – existing basis 1,367 2,897
Return on tangible equity – existing basis (%) 3.7 7.8
Return on tangible equity – new basis (%) 2.3 6.6
Under the existing definition of return on tangible equity, statutory profit after tax is adjusted to remove profit attributable to non-controlling interests and other equity holders and to add back the post-tax amortisation of intangible assets, before being divided by average tangible equity. Under the new basis, the post-tax amortisation of intangible assets is no longer added back. Going forward the Group will adopt this revised basis in order to aid comparability across the banking sector.
Number of employees (full-time equivalent)
At 31 Dec 2020
At 31 Dec 20191
Retail 33,426 35,359
Commercial Banking 6,487 6,573
Insurance and Wealth 4,903 5,246
Other 18,024 17,797
Total inc. PPI 62,840 64,975
Agency staff, interns and scholars (1,264) (1,906)
Total number of employees 61,576 63,069
1 2019 figures restated to reflect the Group’s current structure.

80 Lloyds Banking Group Annual Report and Accounts 2020
2020 CAPTURED BY LLOYDS BANKING GROUP COLLEAGUES
Adam Backshall Shauni Uttley Vicky Taylor
Steven Cachia Gemma McCartney John Shearer Adrian Simmonds
Suzanne Bennett Eleanor Brown Patrick So Matthew De Monte
GovernanceA letter from our Chair 81Our Board 82Group Executive Committee 84Corporate governance report 86Directors’ report 111Directors’ remuneration report 115Other remuneration disclosure 138

Strategic rep
ortFinancial results
Governance
Risk manag
ement
Financial statements
Other inform
ationStrateg
ic report
Governance
Risk manag
ement
Financial statements
Other inform
ation Lloyds Banking Group Annual Report and Accounts 2020 81
As I write my introduction to this Corporate Governance Report, the pandemic continues to have a major impact on society and on how companies operate. In these times, the Board believes that good governance and stakeholder engagement are more important than ever and key to the Group achieving its purpose of Helping Britain Prosper and to the successful delivery of its strategy. Further information about our oversight of the Group’s response to the pandemic can be found on pages 90 to 91.
Set out below are some of the Group's key corporate governance activities during the year.
Stakeholder engagementWhile supporting customers and colleagues has been a key focus during these troubling times, the Board has remained aware of the need for the Group to continue to engage effectively with all its stakeholders. Meeting the Group’s responsibilities and duties both to shareholders and the communities we serve is central to our purpose of Helping Britain Prosper. Details of how the Board takes account of shareholder and wider stakeholder interests in its strategic planning and decision-making processes are set out on pages 46 to 51.
Succession planningSuccession planning, both in respect of Non-Executive Directors and the executive, is a key component of good governance and was in focus during 2020 when the Board approved the appointment of a new Group Chair and Group Chief Executive. Further information about these appointment processes and succession planning can be found on pages 99 to 100.
CultureThe Board supports the Group’s aim to develop its values-led culture. That culture needs to continue to develop to ensure that the business can adapt rapidly to a changing environment while delivering the best outcome for customers. During the year, the Board has regularly assessed and monitored the Group’s progress on culture. Further information about our oversight of the Group’s culture journey can be found on page 92.
Inclusion & DiversityApproaching diversity as a business issue reflects our firm view that diverse teams, working within inclusive environments, are more innovative, engaged and deliver better outcomes for our customers. The Board was pleased to endorse a Race Action plan in support of Black colleagues to drive cultural change, recruitment and progression across the Group. Further information about the Race Action plan can be found on page 25.
Climate changeThe Board is conscious of the impact of climate change on the Group’s business and how the Group’s activities affect the environment. These topics have been discussed by the Board and a number of its Committees. Further information about the Group’s new pledges to reduce the emissions that the Group finances and the carbon footprint and energy consumption of its own operations can be found on pages 20 to 24.
A letter from our Chair
Engaging with our stakeholders to Help Britain Recover
The Board believes that good governance and stakeholder engagement are more important than ever and key to the Group achieving its purpose of Helping Britain Prosper.Robin Budenberg Chair
Board and Committee changesThere have been a number of changes to the Board and its Committees during 2020.
Catherine Woods joined the Board as a Non-Executive Director in March and I joined the Board as a Non-Executive Director in October ahead of succeeding Lord Blackwell as Chair of the Group on his retirement on 1 January 2021.
Juan Colombás retired as Chief Operating Officer in September. Juan played key roles in turning the Group around after the financial crisis and in the Group's initial response to the pandemic. Juan left with our thanks and we wish him every success for the future.
Anita Frew retired as Deputy Chair and a Non-Executive Director at the Company’s AGM in May 2020 and was succeeded by Alan Dickinson. As part of these changes, Nick Prettejohn took on Alan's previous role as Chair of the Board Risk Committee for a limited time. Catherine Woods succeeded Nick Prettejohn in that role on 1 January 2021. Simon Henry retired as a Non-Executive Director in September and was succeeded as Chair of the Audit Committee by Sarah Legg. Anita and Simon both made significant contributions to the Board and left with our thanks and best wishes.
Full details of the changes are set out on page 98.
Although this is the Company's Corporate Governance Report, I would also like to take the opportunity to thank Nigel Hinshelwood, Sarah Bentley and Brendan Gilligan for their huge contribution as ongoing board members of Lloyds Bank plc and Bank of Scotland plc.
Board evaluationThe Board carried out an annual evaluation of its effectiveness during the year. This year’s was an internal evaluation overseen by the Nomination and Governance Committee. The process which was undertaken, and the findings of the review, can be found on pages 94 to 95, together with information about our progress against the 2019 review actions.
Corporate Governance CodeDuring the year under review, the UK Corporate Governance Code 2018 applied to the Company. Our statement of compliance with the Code and a summary of the requirements of the Code can be found on pages 96 to 97. Details of the Group’s approach to workforce engagement and further information on this can be found on page 48.
Robin Budenberg Chair
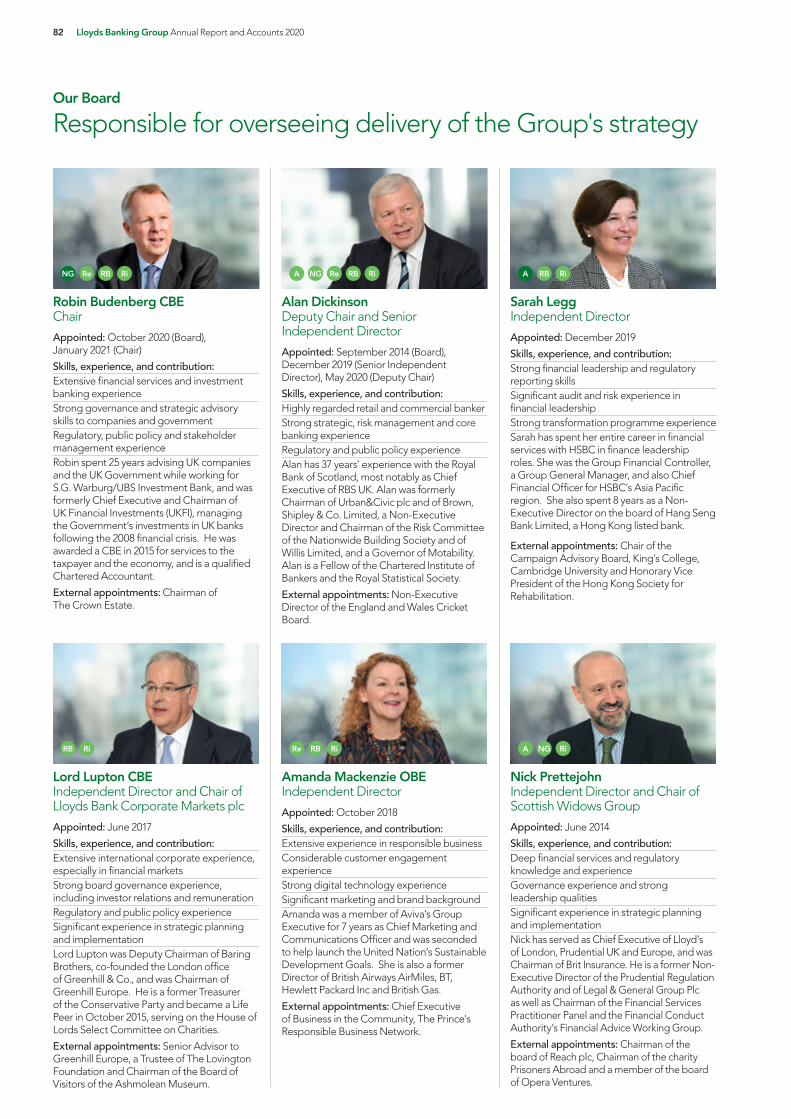
82 Lloyds Banking Group Annual Report and Accounts 2020
Our Board
Responsible for overseeing delivery of the Group's strategy
Robin Budenberg CBE Chair
Appointed: October 2020 (Board), January 2021 (Chair)
Skills, experience, and contribution: Extensive financial services and investment banking experience Strong governance and strategic advisory skills to companies and governmentRegulatory, public policy and stakeholder management experienceRobin spent 25 years advising UK companies and the UK Government while working for S.G. Warburg/UBS Investment Bank, and was formerly Chief Executive and Chairman of UK Financial Investments (UKFI), managing the Government’s investments in UK banks following the 2008 financial crisis. He was awarded a CBE in 2015 for services to the taxpayer and the economy, and is a qualified Chartered Accountant.
External appointments: Chairman of The Crown Estate.
Nick Prettejohn Independent Director and Chair of Scottish Widows Group
Appointed: June 2014
Skills, experience, and contribution: Deep financial services and regulatory knowledge and experienceGovernance experience and strong leadership qualitiesSignificant experience in strategic planning and implementationNick has served as Chief Executive of Lloyd’s of London, Prudential UK and Europe, and was Chairman of Brit Insurance. He is a former Non-Executive Director of the Prudential Regulation Authority and of Legal & General Group Plc as well as Chairman of the Financial Services Practitioner Panel and the Financial Conduct Authority’s Financial Advice Working Group.
External appointments: Chairman of the board of Reach plc, Chairman of the charity Prisoners Abroad and a member of the board of Opera Ventures.
Amanda Mackenzie OBE Independent Director
Appointed: October 2018
Skills, experience, and contribution: Extensive experience in responsible businessConsiderable customer engagement experienceStrong digital technology experienceSignificant marketing and brand backgroundAmanda was a member of Aviva's Group Executive for 7 years as Chief Marketing and Communications Officer and was seconded to help launch the United Nation’s Sustainable Development Goals. She is also a former Director of British Airways AirMiles, BT, Hewlett Packard Inc and British Gas.
External appointments: Chief Executive of Business in the Community, The Prince's Responsible Business Network.
Alan Dickinson Deputy Chair and Senior Independent Director
Appointed: September 2014 (Board), December 2019 (Senior Independent Director), May 2020 (Deputy Chair)
Skills, experience, and contribution: Highly regarded retail and commercial banker Strong strategic, risk management and core banking experience Regulatory and public policy experienceAlan has 37 years’ experience with the Royal Bank of Scotland, most notably as Chief Executive of RBS UK. Alan was formerly Chairman of Urban&Civic plc and of Brown, Shipley & Co. Limited, a Non-Executive Director and Chairman of the Risk Committee of the Nationwide Building Society and of Willis Limited, and a Governor of Motability. Alan is a Fellow of the Chartered Institute of Bankers and the Royal Statistical Society.
External appointments: Non-Executive Director of the England and Wales Cricket Board.
Sarah Legg Independent Director
Appointed: December 2019
Skills, experience, and contribution: Strong financial leadership and regulatory reporting skillsSignificant audit and risk experience in financial leadership Strong transformation programme experienceSarah has spent her entire career in financial services with HSBC in finance leadership roles. She was the Group Financial Controller, a Group General Manager, and also Chief Financial Officer for HSBC’s Asia Pacific region. She also spent 8 years as a Non-Executive Director on the board of Hang Seng Bank Limited, a Hong Kong listed bank.
External appointments: Chair of the Campaign Advisory Board, King’s College, Cambridge University and Honorary Vice President of the Hong Kong Society for Rehabilitation.
Lord Lupton CBE Independent Director and Chair of Lloyds Bank Corporate Markets plc
Appointed: June 2017
Skills, experience, and contribution: Extensive international corporate experience, especially in financial marketsStrong board governance experience, including investor relations and remunerationRegulatory and public policy experienceSignificant experience in strategic planning and implementationLord Lupton was Deputy Chairman of Baring Brothers, co-founded the London office of Greenhill & Co., and was Chairman of Greenhill Europe. He is a former Treasurer of the Conservative Party and became a Life Peer in October 2015, serving on the House of Lords Select Committee on Charities.
External appointments: Senior Advisor to Greenhill Europe, a Trustee of The Lovington Foundation and Chairman of the Board of Visitors of the Ashmolean Museum.
RB Re A
Ri
Ri RB NGRi Ri
A NG ReNG Re RB Ri ARB RBRi
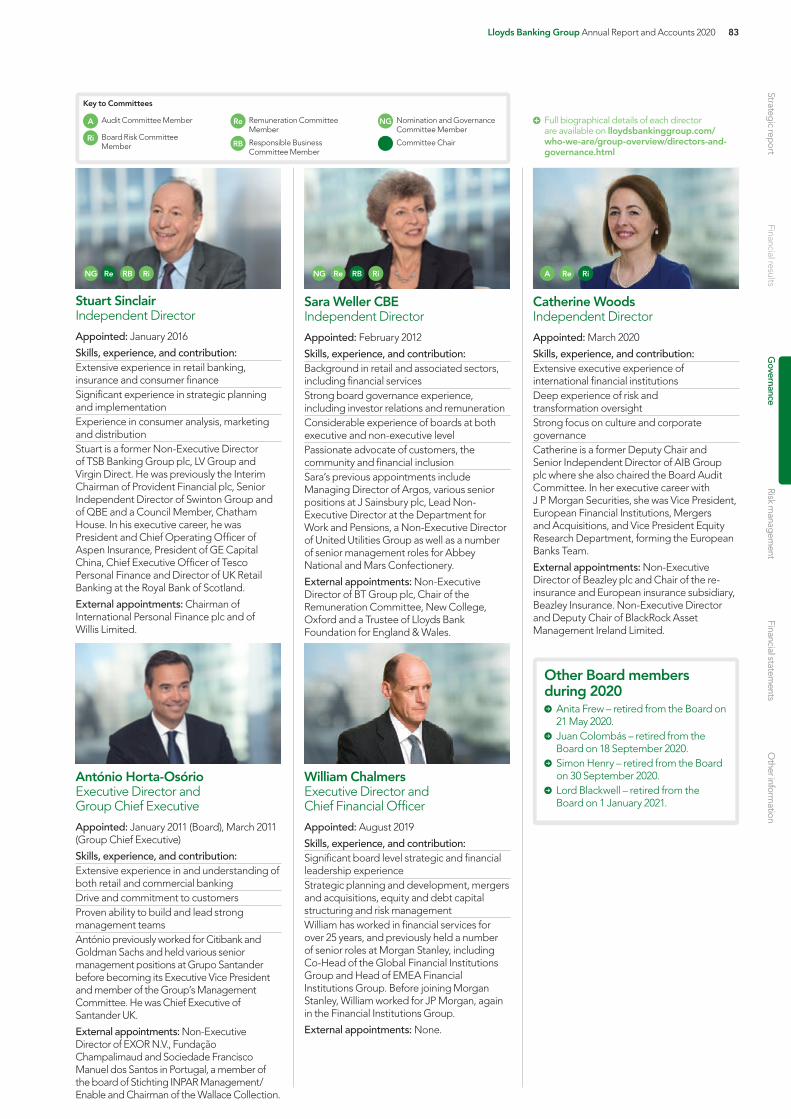
Strategic rep
ortFinancial results
Governance
Risk manag
ement
Financial statements
Other inform
ationStrateg
ic report
Governance
Risk manag
ement
Financial statements
Other inform
ation Lloyds Banking Group Annual Report and Accounts 2020 83
António Horta-Osório Executive Director and Group Chief Executive
Appointed: January 2011 (Board), March 2011 (Group Chief Executive)
Skills, experience, and contribution: Extensive experience in and understanding of both retail and commercial bankingDrive and commitment to customersProven ability to build and lead strong management teamsAntónio previously worked for Citibank and Goldman Sachs and held various senior management positions at Grupo Santander before becoming its Executive Vice President and member of the Group’s Management Committee. He was Chief Executive of Santander UK.
External appointments: Non-Executive Director of EXOR N.V., Fundação Champalimaud and Sociedade Francisco Manuel dos Santos in Portugal, a member of the board of Stichting INPAR Management/Enable and Chairman of the Wallace Collection.
Stuart Sinclair Independent Director
Appointed: January 2016
Skills, experience, and contribution: Extensive experience in retail banking, insurance and consumer financeSignificant experience in strategic planning and implementationExperience in consumer analysis, marketing and distributionStuart is a former Non-Executive Director of TSB Banking Group plc, LV Group and Virgin Direct. He was previously the Interim Chairman of Provident Financial plc, Senior Independent Director of Swinton Group and of QBE and a Council Member, Chatham House. In his executive career, he was President and Chief Operating Officer of Aspen Insurance, President of GE Capital China, Chief Executive Officer of Tesco Personal Finance and Director of UK Retail Banking at the Royal Bank of Scotland.
External appointments: Chairman of International Personal Finance plc and of Willis Limited.
William Chalmers Executive Director and Chief Financial Officer
Appointed: August 2019
Skills, experience, and contribution: Significant board level strategic and financial leadership experience Strategic planning and development, mergers and acquisitions, equity and debt capital structuring and risk managementWilliam has worked in financial services for over 25 years, and previously held a number of senior roles at Morgan Stanley, including Co-Head of the Global Financial Institutions Group and Head of EMEA Financial Institutions Group. Before joining Morgan Stanley, William worked for JP Morgan, again in the Financial Institutions Group.
External appointments: None.
Sara Weller CBE Independent Director
Appointed: February 2012
Skills, experience, and contribution:Background in retail and associated sectors, including financial servicesStrong board governance experience, including investor relations and remunerationConsiderable experience of boards at both executive and non-executive levelPassionate advocate of customers, the community and financial inclusionSara’s previous appointments include Managing Director of Argos, various senior positions at J Sainsbury plc, Lead Non-Executive Director at the Department for Work and Pensions, a Non-Executive Director of United Utilities Group as well as a number of senior management roles for Abbey National and Mars Confectionery.
External appointments: Non-Executive Director of BT Group plc, Chair of the Remuneration Committee, New College, Oxford and a Trustee of Lloyds Bank Foundation for England & Wales.
Catherine Woods Independent Director
Appointed: March 2020
Skills, experience, and contribution: Extensive executive experience of international financial institutionsDeep experience of risk and transformation oversightStrong focus on culture and corporate governanceCatherine is a former Deputy Chair and Senior Independent Director of AIB Group plc where she also chaired the Board Audit Committee. In her executive career with J P Morgan Securities, she was Vice President, European Financial Institutions, Mergers and Acquisitions, and Vice President Equity Research Department, forming the European Banks Team.
External appointments: Non-Executive Director of Beazley plc and Chair of the re-insurance and European insurance subsidiary, Beazley Insurance. Non-Executive Director and Deputy Chair of BlackRock Asset Management Ireland Limited.
Key to Committees
A Audit Committee Member
Ri Board Risk Committee Member
Re Remuneration Committee Member
RB Responsible Business Committee Member
NG Nomination and Governance Committee Member
Committee Chair
Full biographical details of each director are available on lloydsbankinggroup.com/who-we-are/group-overview/directors-and-governance.html
Re RB RiNG RBNG Re Ri
Other Board members during 2020
Anita Frew – retired from the Board on 21 May 2020.
Juan Colombás – retired from the Board on 18 September 2020.
Simon Henry – retired from the Board on 30 September 2020.
Lord Blackwell – retired from the Board on 1 January 2021.
A Re Ri

84 Lloyds Banking Group Annual Report and Accounts 2020
Group Executive Committee
Delivering our vision and managing a more agile organisation
António Horta-OsórioExecutive Director and Group Chief Executive
António joined the Board as an Executive Director in January 2011 and became Group Chief Executive in March 2011. Read his biography on page 83
William Chalmers Executive Director and Chief Financial Officer
William joined the Board in August 2019 as an Executive Director and the Chief Financial Officer. Read his biography on page 83
Carla Antunes da Silva Group Strategy, Corporate Development and Investor Relations Director
Appointed June 2018
Skills and experience Carla joined in October 2015 and since then has led the Group’s strategic work, as well as the Group’s mergers, acquisitions/disposals and corporate ventures, and oversees the Group’s relationships with shareholders, analysts and the wider investment community. Prior to Lloyds, Carla spent 18 years as an equity analyst at Credit Suisse, JP Morgan and Deutsche Bank. Carla is a Non-Executive Director of Lloyds Bank Corporate Markets plc.
Antonio Lorenzo Chief Executive, Scottish Widows and Group Director, Insurance and Wealth
Appointed March 2011
Skills and experience Antonio joined the Group in 2011 and is currently responsible for the insurance, investment and wealth management businesses. Antonio is also Chairman of Schroders Personal Wealth and a Board member of the Association of British Insurers. Prior to his current role, Antonio led Group Corporate Development, Group Strategy and the former Consumer Finance Division. Antonio also led the IPO and divestment of TSB and reshaped the Group’s international presence. Before joining the Group, Antonio was Chief Financial Officer of Santander UK.
Vim Maru Group Director, Retail
Appointed September 2013
Skills and experience Vim joined the Group in 2011 and is responsible for Retail products and distribution, customer services and brands and marketing. Vim has worked in financial services for over 20 years and prior to joining the Group, spent 12 years at Santander UK in a range of roles. Vim is a Chartered Accountant, and sits on the UK Finance Board, the FCA’s Practitioner Panel and supports HM Treasury’s Financial Inclusion Policy Forum and the Money and Pensions Service Advisory Group.
Kate Cheetham Group General Counsel and Company Secretary
Appointed July 2017
Skills and experience Kate was appointed Group General Counsel in January 2015 and Group Company Secretary in July 2019. Kate joined the Group in 2005 from Linklaters, where she was a corporate lawyer specialising in mergers and acquisitions transactions. Before her current role, Kate held a number of senior positions including Deputy Group General Counsel and General Counsel for Group Legal. Kate is a trustee of the Lloyds Bank Foundation for England and Wales and is a Non-Executive Director of Scottish Widows.
John Chambers Group Chief Information Officer
Appointed June 2018
Skills and experience John joined the Group in February 2015 as Chief Information Officer for Group Operations, Functions and Enterprise and was appointed as the Group’s Chief Information Officer in September 2017. Over 25 years in the IT industry John has been responsible for delivering large scale IT solutions across enterprise application platforms, infrastructure and data analytics, working as part of global operating environments such as Barclays, Capita and business process outsourcing firms.
Paul Day Chief Internal Auditor
Appointed September 2016
Skills and experience Paul joined the Group in June 2017 as Chief Internal Auditor. He joined from Deloitte where Paul was a partner in the UK Financial Services practice and led the UK Financial Services Internal Audit business. Paul has specialised in internal and external audit roles across financial services for over 20 years, including 10 years in various leadership roles in Barclays Internal Audit.
C M A A
A A M M

Strategic rep
ortFinancial results
Governance
Risk manag
ement
Financial statements
Other inform
ationStrateg
ic report
Governance
Risk manag
ement
Financial statements
Other inform
ation Lloyds Banking Group Annual Report and Accounts 2020 85
Janet Pope Chief of Staff and Group Director, Sustainable Business
Appointed January 2015
Skills and experience Janet joined in 2008 to run the Group’s Savings business. Janet was previously Chief Executive at Alliance Trust Savings and EVP Global Strategy at Visa. Janet held a variety of roles at Standard Chartered Bank including Retail Banking MD for Africa and Non-Executive Director positions at Standard Chartered Bank Zimbabwe, Kenya, Zambia and Botswana. Janet is Chair of the Charities Aid Foundation Bank, a Non-Executive Director of the Banking Standards Board and is the Group’s Executive Sponsor for Sexual Orientation and Gender Identity.
Matthew Sinnott Group Director of People and Property
Appointed April 2020
Skills and experience Matthew was appointed as Group People and Property Director in April 2020 and is responsible for the Group’s strategy on skills, culture, and the future of work and the workplace. Matthew joined the Group in early 2017 as Reward Director, Governance and Executive Reward, and was subsequently promoted to Group Reward Director in October 2017. Prior to joining the Group, Matthew held senior positions in specialist reward, finance and broader HR roles across a number of Financial Services companies, including RBS, Nomura International and Merrill Lynch.
Stephen Shelley Chief Risk Officer
Appointed September 2017
Skills and experience Stephen was appointed Chief Risk Officer in September 2017. Stephen joined the Group in May 2011 as Chief Credit Officer for Wholesale and International. In October 2012 he became Risk Director, Commercial Banking Risk. Previously Stephen was Chief Risk Officer at Barclays Corporate, and prior to that Chief Credit Officer UK Retail and Corporate. In his 21-year career, Stephen undertook a variety of roles in the front office and risk. Stephen is the Group’s Executive Sponsor for Gender Diversity and Equality.
Letitia Smith Group Director, Conduct, Compliance and Operational Risk
Appointed June 2019
Skills and experience Letitia joined the Group in 2014, undertaking Conduct, Compliance and Operational Risk roles across various divisions before being appointed as the Group Director, CCOR in 2016. Letitia is also a Non-Executive Director of Lloyds Bank Corporate Markets plc. Prior to joining the Group, Letitia was Chief Risk Officer at Kleinwort Benson Private Bank. She previously worked at RBS for 11 years, latterly as the Chief Risk Officer of the Wealth Division. Letitia is a qualified accountant with a background in forensic accountancy.
David Oldfield Group Director, Commercial Banking
Appointed May 2014
Skills and experience David was appointed Group Director, Commercial Banking in September 2017 responsible for supporting corporate clients from SMEs through to Large Corporates and Financial Institutions. David started his career with Lloyds Bank in 1984 on the graduate programme and has held key leadership roles across the Group. Immediately prior to his current role he was Group Director Retail and Consumer Finance. David is a Fellow of the Chartered Institute of Bankers, Group Executive Sponsor for Disability and Chairs the Wellbeing leadership group for Business in The Community.
Andrew Walton Group Corporate Affairs Director
Appointed September 2018
Skills and experience Andrew joined the Group in September 2018, as Group Corporate Affairs Director, with responsibility for internal and external communications, reputation management and public affairs. Prior to joining the Group, Andrew was Senior Managing Director and Global Head of Financial Services for the strategic communications segment of FTI Consulting.
Zak Mian Group Director, Transformation
Appointed August 2016
Skills and experience Zak joined the Group in 1989 as a Business Analyst in IT and has carried out multiple roles involving Retail Chief Information Office, Head of IT Architecture and leading the Digital Transformation programme. He was appointed Group Director, Digital and Transformation in 2016 and his responsibilities increased in September 2017 as the Group Director, Transformation. He is responsible for the digital transformation of the Group, including all IT and business change, and ensuring we are ready to meet the future expectations of our customers.
Full biographical details of each GEC member or attendee are available on lloydsbankinggroup.com/who-we-are/group-overview/group-executive-committee.html
Key
C Group Executive Committee Chair
M Group Executive Committee Member
A Group Executive Committee Attendee
M M M M
A A M

86 Lloyds Banking Group Annual Report and Accounts 2020
Corporate governance report
Our Board in 20201
Board and Committee composition and attendance at meetings in 202013
Board member BoardNomination and Governance Committee
Audit Committee
Board Risk Committee
Remuneration Committee
Responsible Business Committee
Lord Blackwell (C) 13/13 7/7 C – 8/8 7/7 4/4
António Horta-Osório 13/13 – – – – –
William Chalmers 13/13 – – – – –
Juan Colombás1 9/9 – – – – –
Robin Budenberg2 3/3 1/1 – 2/2 2/2 1/1
Alan Dickinson3 13/13 7/7 6/6 8/8 7/7 1/1
Anita Frew4 5/610 3/3 3/3 4/4 3/410 2/2
Simon Henry5 10/10 – 5/5 5/612 – –
Sarah Legg6 13/13 – 6/6 C 8/8 – –
Lord Lupton 13/13 – – 8/8 – 4/4
Amanda Mackenzie 13/13 – – 8/8 7/7 4/4
Nick Prettejohn7 12/1311 5/611 6/6 8/8 C – –
Stuart Sinclair 12/1310 6/712 – 8/8 7/7 C 4/4
Sara Weller8 13/13 5/711 12 – 7/812 7/7 4/4 C
Catherine Woods7 9 11/11 – 1/1 6/6 5/5 –
C Chair 1 Juan Colombás retired from the Board on 18 September 2020.2 Robin Budenberg joined the Board and respective Committees on 1 October 2020 and became Chair of the Nomination and Governance Committee on 1 January 2021.3 Alan Dickinson succeeded Anita Frew as Deputy Chair on 21 May 2020.4 Anita Frew retired from the Board on 21 May 2020.5 Simon Henry retired from the Board on 30 September 2020.6 Sarah Legg succeeded Simon Henry as Chair of the Audit Committee with effect from 1 October 2020 and became a member of the Responsible Business Committee on 1 February 2021.7 Nick Prettejohn succeeded Alan Dickinson as Chair of the Board Risk Committee on 21 May 2020 and was succeeded in that role by Catherine Woods on 1 January 2021.8 Sara Weller plans to retire as Chair of the Responsible Business Committee and a Non-Executive Director at the AGM in May 2021. Amanda Mackenzie will take on the role of Chair of the
Responsible Business Committee following Sara's retirement from the Board.9 Catherine Woods joined the Board and the Board Risk and Remuneration Committees on 1 March 2020 and the Audit Committee on 10 September 2020.10 Unable to attend due to illness.11 Unable to attend ad hoc meeting scheduled on a Sunday evening at short notice.12 Unable to attend due to another business commitment.13 Where a Director is unable to attend a meeting s/he receives papers in advance and has the opportunity to provide comments to the Chair of the Board or to the relevant Committee Chair.
Our Board meetings in 2020During the year, there were 13 Board meetings, including three ad hoc meetings called at short notice to consider matters of a time-sensitive nature such as the appointments of the new Group Chair and Group Chief Executive. Details of attendance at Board meetings is shown above.
The Board recognises the need to be adaptable and flexible to respond to changing circumstances, such as switching to virtual meetings because of the pandemic, and to emerging business priorities, while ensuring the continuing monitoring and oversight of core issues, such as the impact of, and the Group’s response to, the pandemic.
The Group has a comprehensive and continuous agenda setting and escalation process in place to ensure that the Board has the right information at the right time and in the right format to enable the Directors to make the right decisions. The Chair leads the process, assisted by the Group Chief Executive and Group Company Secretary. The process ensures that sufficient time is being set aside for strategic discussions and business critical items. The Chair and the Chairs of each Committee ensure Board and Committee meetings are structured to facilitate open discussion, debate and challenge.
The process of escalating issues and agenda setting is reviewed at least annually as part of the Board evaluation with enhancements made to the process, where necessary, to ensure it remains effective.
The Non-Executive Directors also receive regular updates from management to give context to current issues. In-depth and background materials are regularly provided via a designated area on the secure Board portal.
1 Data as at 31 December 2020 (and therefore includes Lord Blackwell).2 Non-Executive Directors; during 2021 the Group will be reviewing its skills matrix to explicitly consider
environmental and climate change skills and experience.3 Comprising Lord Blackwell (who retired from the Board on 1 January 2021), António Horta-Osório
(an Executive Director, who has announced that he will retire from the Group on 30 April 2021) and Sara Weller (who the Group has announced intends to stand down at the Company’s 2021 AGM).
Skills and experience2 Gender diversity Board tenure Age
9 out of 10
9 out of 10
9 out of 10
8 out of 10
8 out of 10
10 out of 10
10 out of 10
10 out of 10
6 out of 10
4 out of 10
Retail/Commercial banking
Financial markets/wholesale banking
Insurance
Prudential and conduct riskin financial institutions
Core technology operations
Government/regulatory
Consumer/marketing/distribution
Strategic thinking
Digital impact
Major change programmes
A
A Male: 8
B Female: 4
B
A 0-2 years: 5
B 2-4 years: 1
C 4-6 years: 1
D 6-8 years: 2
E 8+ years: 33
A
BCD
E
A 45-55: 2
B 56-65: 7
C 66-75: 3
A
BC
Ethnic diversityThe Board currently meets the recommendation of the Parker Review of at least one member of the Board (8.3% of the Board as at 31 December 2020) being of Black, Asian or Minority Ethnic background, and the Group intends to continue to meet that recommendation.

Strategic rep
ortFinancial results
Governance
Risk manag
ement
Financial statements
Other inform
ationStrateg
ic report
Governance
Risk manag
ement
Financial statements
Other inform
ation Lloyds Banking Group Annual Report and Accounts 2020 87
OUR BOARD AND GOVERNANCE STRUCTURE
CHAIR INDUCTION
The Board is supported by its Committees which make decisions and recommendations on matters delegated to them under the Corporate Governance Framework, including Board appointments, internal control risk, financial reporting, governance and remuneration issues. This enables the Board to spend a greater proportion of its time on strategic, forward-looking agenda items. Each Board Committee comprises Non-Executive Directors only and has an experienced Chair. Each Committee Chair reports to the Board on the activities of their Committee at a subsequent Board meeting.
The management of all Committees is on the same basis as the Board. Each of the Committees’ structures facilitates open discussion and debate, and ensures adequate time for members of the Committees to consider all proposals.
The Executive Directors make decisions within the parameters and principles set out in the Corporate Governance Framework. However, where appropriate, any activity can be brought to the full Board for consideration, even if the matter falls within agreed parameters. The Corporate
Governance Framework seeks to ensure that decisions are made by management under the correct authority. In the rare event of a Director being unable to attend a meeting, wherever possible the Chair of the meeting discusses the matters proposed with the Director concerned, seeking their views. The Chair subsequently represents those views to the meeting.
A full schedule of matters reserved can be found at https://www.lloydsbankinggroup.com/who-we-are/group-overview/corporate-governance.html
Robin Budenberg Non-Executive Director and Chair
Robin Budenberg, an experienced Non-Executive Director with extensive financial services experience, received a tailored induction that focused on the Group’s culture and values, stakeholders, strategy, structure, operations and governance. As Chair Designate, Robin worked closely with Lord Blackwell, the Group’s former Chairman, in ensuring an effective handover of responsibilities.
Robin’s induction included:
An Induction Pack containing key corporate documents and information relating to the Group covering aspects such as the role of a director (including relevant Group policies such as anti-bribery, conflicts of interest, expenses, gifts and hospitality and share dealing), the Board and its Committees, financials and strategy, governance, risk management, culture, shareholders and training.
Meetings with Senior Management and Board Directors held in October through December 2020 with all GEC members, Board Directors, the Group Company Secretary and other senior managers to discuss aspects including:
– The UK banking regulatory framework and corporate governance including ring-fencing requirements, the Senior Managers and Certification Regime, culture and conduct expectations and whistleblowing
– Strategic challenges facing the Group (including, for example, the impact of COVID-19 and the operational and conduct challenges it presents and targets and risks associated with managing the Group’s response to climate change)
– Culture and values – Group Operations – Risk Management (including consideration of operational risk, conduct risk and customer
outcomes) – Financials (including meetings with internal and external auditors) – Capital management and liquidity – Inclusion & Diversity – Retail Banking (including Digital Transformation) and Wealth Management – Commercial Banking – Scottish Widows Group Limited and the Insurance sub-group – Lloyds Bank Corporate Markets plc and the Non Ring-Fenced Bank sub-group – LBG Equity Investments and the Equity sub-group
Meetings with Major Shareholders held in October and November 2020
During 2021, Robin will continue his programme of visits (either in person or virtually) with customers, service providers and key stakeholders across the retail, commercial and insurance sectors to build upon and deepen his understanding of the customer offering and experience. Robin will continue to develop his knowledge of the Group and its people through site visits (either in person or virtually) to the Group’s regional offices as well as through focused discussions with smaller teams and individual colleagues.
Lloyds Banking Group Board
Group Chief Executive
Board Risk Committee
Read more on pages 105 to 109
Remuneration Committee
Read more on pages 115 to 116 and 134
Nomination and Governance Committee
Read more on pages 98 to 100
Group Chief Executive Committees
Read more on pages 150 to 151
Audit Committee
Read more on pages 101 to 104
Responsible Business Committee
Read more on page 110

88 Lloyds Banking Group Annual Report and Accounts 2020
How our Board works
Key focus areasKey: GSR3 strategic priorities
Leading customer experience
Digitising the Group Customers
Community and Environment
Colleagues
Shareholders
Suppliers
Regulatory and Government
Maximising Group capabilities
Transforming ways of working
CULTURE AND VALUES
The Board sets the strategy, oversees its delivery and establishes the culture, values and standards of the Group. The Board ensures that the Group manages risk effectively, monitors financial performance and reporting and ensures that appropriate and effective succession planning arrangements and remuneration policies are in place. It provides and encourages entrepreneurial leadership across the Group within this framework.
This page 88 and page 89 show the key focus areas of the Board during the year and highlight the link between those focus areas and our strategic priorities. Also listed are stakeholder groups central to the matters considered and decisions taken.
The agenda for each Board meeting is discussed in advance with the Chair, Group Chief Executive and Group Company Secretary and reviewed at Group Executive Committee meetings. Regular updates are provided to the Board by the Chairs of the Audit, Nomination and Governance, Remuneration, Responsible Business and Board Risk Committees as well as by the Group Chief Executive, the Chief Financial Officer, the Chief Risk Officer and the Chair and the Chairs of the Lloyds Bank Corporate Markets plc and Scottish Widows Group Limited boards.
Approved the Helping Britain Prosper Plan Strategic priorities Stakeholder groups
Discussed conduct, culture and values, cultural transformation initiatives and the Group's Society of the Future plansStrategic priorities Stakeholder groups
Considered and discussed climate change risk and pledgesStrategic priorities Stakeholder groups
Approved the Group’s diversity policy including a discussion on Black Lives Matter and endorsement of the Race Action planStrategic priorities Stakeholder groups
Considered the operation and effectiveness of the remuneration policy Stakeholder groups
Considered workforce engagement mechanisms and engagement resultsStrategic priorities Stakeholder groups
Considered retail customer and supplier support during the pandemic including financial, operational and customer treatmentStrategic priorities Stakeholder groups
Discussed financial support for businesses through Government-backed schemesStrategic priorities Stakeholder groups
Discussed the Group’s performance against customer dashboard and targets for 2020Strategic priorities Stakeholder groups
Considered the recovery of SME customers affected by the pandemic Strategic priorities Stakeholder groups
Discussed the annual review of customer conduct framework and riskStrategic priorities Stakeholder groups
Discussed the Group's approach to customer communicationsStrategic priorities Stakeholder groups
Discussed customers in financial difficultyStrategic priorities Stakeholder groups
Stakeholders
CUSTOMERS
Approved the income statement, draft results and presentations to analystsStakeholder groups
Approved the 2020 budget and the operating plan
Strategic priorities Stakeholder groups
Discussed the regular finance report, forecasts and capital and liquidity positions
Stakeholder groups
Approved funding and liquidity plans and capital plan including capital risk appetite Stakeholder groups
Approved a request from the PRA on suspension of dividend payments for 2020Stakeholder groups
FINANCIAL
Deep dive on ways of working post pandemicStrategic priorities Stakeholder groups
Approved large transactions and contractsStrategic priorities Stakeholder groups
Deep dive on economics and financial impactsStrategic priorities Stakeholder groups
Deep dive on payments propositionStrategic priorities Stakeholder groups
Deep dive on Insurance and WealthStrategic priorities Stakeholder groups
Two day meeting to review the Group’s strategy and progressStrategic priorities Stakeholder groups
Considered the Group’s EU exit preparationsStrategic priorities Stakeholder groups
STRATEGY
Discussions and decisions
Discussed progress against Group Strategic Review 3 objectivesStrategic priorities Stakeholder groups

Strategic rep
ortFinancial results
Governance
Risk manag
ement
Financial statements
Other inform
ationStrateg
ic report
Governance
Risk manag
ement
Financial statements
Other inform
ation Lloyds Banking Group Annual Report and Accounts 2020 89
Reviewed an annual update on pension scheme and valuationStakeholder groups
Considered updates on structural hedging strategy and Group Corporate Treasury’s regular management information reportStakeholder groups
Discussions and decisions
Deep dive sessionsThe Board regularly holds deep dive sessions with senior management outside formal Board meetings. The purpose of the sessions is to provide the Board with deeper insight into key areas of strategic focus, while providing Directors with a greater understanding and appreciation for the subject matter to help drive better quality of debate and enhance knowledge. The sessions are structured to allow plenty of opportunity for discussion and include presentations and videos.
Details of the deep dive sessions that were held in 2020 are set out in the key focus areas section on page 88 and this page 89. In addition, detailed updates were received from Scottish Widows Group Limited and Lloyds Bank Corporate Markets plc and joint discussions held with Scottish Widows Group Limited.
Approved the attestation of ring-fencing compliance application to PRA to renew modifications to ring-fencing governance rulesStakeholder groups
Approved the whistleblowing policy and considered whistleblowing updatesStakeholder groups
Considered regulatory updates Stakeholder groups
Received updates on the Senior Managers and Certification Regime Stakeholder groups
Approved an update to the statements on Modern Slavery and Human Rights Stakeholder groups
Considered updates on the Group’s progress towards resolvability as required under the Bank of England Resolvability Assessment Framework Stakeholder groups
Discussed the FCA firm evaluation letter and agreed ownership of actionsStakeholder groups
Held discussions with the PRA and FCAStakeholder groups
Approved Basel Pillar 3 disclosuresStakeholder groups
Approved Annual Report and Form 20-FStakeholder groups
Approved various Group policies including signing authorities and the Board and Group Executive Committee dealing policy Stakeholder groups
Discussed the outcome of the annual Board evaluation and agreed actions arising from itStakeholder groups
Discussed how to hold the Annual General Meeting during the pandemic, approved revised arrangements for it and received an update on votingStakeholder groups
Discussed the update on Banking Standards Board 2019 surveyStakeholder groups
Approved the Corporate Governance FrameworkStakeholder groups
Discussed the review of the Chairman’s effectivenessStakeholder groups
Reviewed the Chairman’s fee (without the Chairman present) and Non-Executive Directors’ fees (with Non-Executive Directors abstaining)
Approved going concern and viability statement
Approved Board and Board Committee appointments Stakeholder groups
Discussed Board and executive succession planning and approved the appointment of the new Chair and Group Chief ExecutiveStakeholder groups
GOVERNANCE AND STAKEHOLDERS
REGULATORY
Approved Group risk appetiteStakeholder groups
Approved the risk management frameworkStakeholder groups
Considered cloud services strategy and cyber security Strategic priorities Stakeholder groups
Considered the key areas of conduct riskStakeholder groups
RISK MANAGEMENT
More detailKey Board Decisions
Read more on pages 46 to 51
Approved actions in relation to the PRA Periodic Summary Meeting letterStakeholder groups

90 Lloyds Banking Group Annual Report and Accounts 2020
Governance in action
Board oversight of pandemic response
FEBRUARY
MARCH
APRIL
MAY
Gradual increase in UK confirmed cases with 23 UK confirmed cases as at month end
The pandemic has had a profound effect on the way we live. The Board has monitored the impact of the pandemic on the Group’s business and its stakeholders and the Group’s response as the situation evolved, seeking to ensure that the risks posed by the pandemic are mitigated. All Board meetings have been held virtually since (and including) the March Board meeting with Board and Board Committee agendas flexed to consider COVID-related matters. The Board considered frequent COVID updates from management (both formally and informally) as events unfolded covering matters such as the impact on customers, colleagues, suppliers and other stakeholders and on funding and liquidity. These pages provide an overview of how the Board has overseen the Group’s response to the pandemic.
UK lockdown measures continued with a three week extension announced and daily testing capacity was ramped up as the total number of recorded deaths passed 20,000
Bank of England made emergency base rate cuts, Chancellor announced furlough scheme and Prime Minister announced UK lockdown measures
The Prime Minister announced plans to gradually ease restrictions and contact tracing systems went live in England and Scotland
3 February – the Group invoked its incident management process to co-ordinate Group activity relating to the coronavirus with the incident team providing weekly updates to the Group Executive Committee.
19 February – the Board considered an update indicating that the coronavirus outbreak was being closely monitored, including the impact on industry sectors and that a scenario exercise had been undertaken to simulate the Group’s response. The Board emphasised at its Board meeting the need for contingency plans for staff protection and mass absences to be in place, the importance of maintaining IT resilience and the potential impact on the financial systems in terms of cash flow, supply chain and commodities.
8 April – the Board held an informal update call to discuss the Group’s response to the crisis, including business continuity planning and operational impact and to provide a briefing on customer support and business support schemes as well as on economic and financial projections.
28 April – the Board Risk Committee extensively discussed the impact of the pandemic at its meeting. The Audit Committee discussed at its meeting the Group’s draft Q1 interim management statement (including COVID-related disclosures) and recommended that the Board approve the statement.
29 April – the Board discussed the Government schemes for SME, business and corporate support at its Board meeting and the Group’s operational approach to implementing the schemes and approved the Group’s participation in each of the CBILS, CLBILS and BBL schemes and equivalent Government backed support schemes. The Board approved the Group’s Q1 interim management statement, which, given the significant change in the operating environment and economic expectations, withdrew the Group’s previous guidance in light on the ongoing uncertainty caused by the pandemic.
4 March – the Board considered the first of many updates dedicated to the Group’s response to the pandemic focusing on business continuity plans to ensure that the Group could continue to serve customers and co-ordination of responses to a series of localised scenarios.
5 March – the Board reviewed an update from the Group Corporate Treasurer on the Group’s funding position and capital contingency level.
26 March – the Board Risk Committee discussed the Group’s operational response to the pandemic and highlighted the importance of continued focus on customers and colleagues (in particular colleague mental and physical wellbeing) and regular communication to colleagues as well as contingency planning on the Group’s ways of working.
31 March – the Board met at short notice to discuss the PRA’s request to banks to suspend dividend payments and share buybacks. The Board agreed to suspend dividends and buybacks on ordinary shares until the end of 2020.
1 May – the Group announced that its Chief Operating Officer and Director, Juan Colombás, had agreed to delay his retirement and to remain in post and on the Board until 18 September 2020 to enable him to continue to play a key role in the Group's response to the pandemic.
12 May – COVID-compliant AGM arrangements were announced following Board approval.
19 May – the Board Risk Committee discussed the impact of the pandemic with a focus on the economic impact.
20 May – the Board discussed a proposed multi-step transition back to the office in line with Government guidance and noted the importance of wellbeing desks for colleagues struggling to work from home and of support for customers, in particular personal customers in financial difficulty and SMEs.

Strategic rep
ortFinancial results
Governance
Risk manag
ement
Financial statements
Other inform
ationStrateg
ic report
Governance
Risk manag
ement
Financial statements
Other inform
ation Lloyds Banking Group Annual Report and Accounts 2020 91
JUNE
JULY AND AUGUST
SEPTEMBER
OCTOBER
NOVEMBER AND DECEMBER
As restrictions were gradually eased, primary schools and general retail reopened
“Rule of six” was introduced as cases started rising again with local restrictions imposed; schools returned
Easing of restrictions continued as restaurants, pubs and hotels could open and two households could meet indoors; face coverings were introduced; the number of cases appeared to have stabilised
As England entered a second national lockdown, Pfizer and BioNTech announced a vaccine with the UK vaccination programme starting in early December; a new strain of the virus prompted creation of a new “tier 4”
Tier regulations came into effect with differing levels of restrictions as the NHS came under pressure due to the “second wave”
11 June – informal Board update call held to brief the Board on an analysis of economic scenarios and the key assumptions underpinning them in relation to matters such as the continued closure of the economy, the process for the UK's exit from the EU and the likelihood of a second wave.
24 June – the Board considered an update from the Group Chief Executive at its Board meeting, including on COVID transition planning, payment holidays and the impact of the pandemic on colleague ways of working.
23 September – the Board Risk Committee discussed an update on the impact of the pandemic, in particular from customers in financial difficulty and risk appetite perspectives.
24 September – the Board discussed at its meeting customer sentiment through the pandemic, and colleague ways of working, during the pandemic and on the Group’s customer support measures.
28 July – the Audit Committee discussed at its meeting the Group’s draft half-year results news release (including COVID-related disclosures) and recommended that the Board approve the news release. The Board Risk Committee discussed a COVID-specific credit update and the impact of the pandemic and emerging risks across a number of sectors.
29 July – the Board reviewed a specific paper on SME customers and participated in a deep dive on ways of working after the pandemic. The Board also considered a summary of key feedback and viewpoints relating to the wider workforce and the Group’s further response to the pandemic in respect of actions taken to support colleagues and Pulse Survey results. The Board approved the Group’s half-year news release, which included revised 2020 guidance.
6 August 2020 – the Board considered a briefing on the Bank of England’s Financial Stability Report, which provided an update to its previous desktop stress test and commentary on the ability of banks to withstand the current economic stress.
25 November – the Board Risk Committee discussed a COVID-specific credit update.
26 November – the Board discussed an update on the impact of the pandemic on the Group and, in particular, on its progress with its strategy at its Board meeting.
9 December – the Board took part in a deep dive on economic forecasts, including a focus on the impact of the pandemic on the economy and digital structural transformation and assumptions around vaccine roll-out.
6 October – the Board discussed on a Board call an update on analysis of economic scenarios and the underlying assumptions in relation to the pandemic and the UK's exit from the EU ahead of the release of the Group’s Q3 interim management statement later that month.
27 October – the Board discussed at its meeting the Group’s priorities from a culture perspective post pandemic and areas of focus for the Group on the exit from the pandemic. The Board Risk Committee discussed a COVID-specific credit update and a briefing on the Group’s programme to support Commercial Banking customers.
28 October – the Audit Committee discussed at its meeting the Group’s draft Q3 interim management statement (including COVID-related disclosures) and recommended that the Board approve the statement. The Board approved the Group’s Q3 interim management statement, which included updated 2020 guidance in light of the highly uncertain economic outlook.
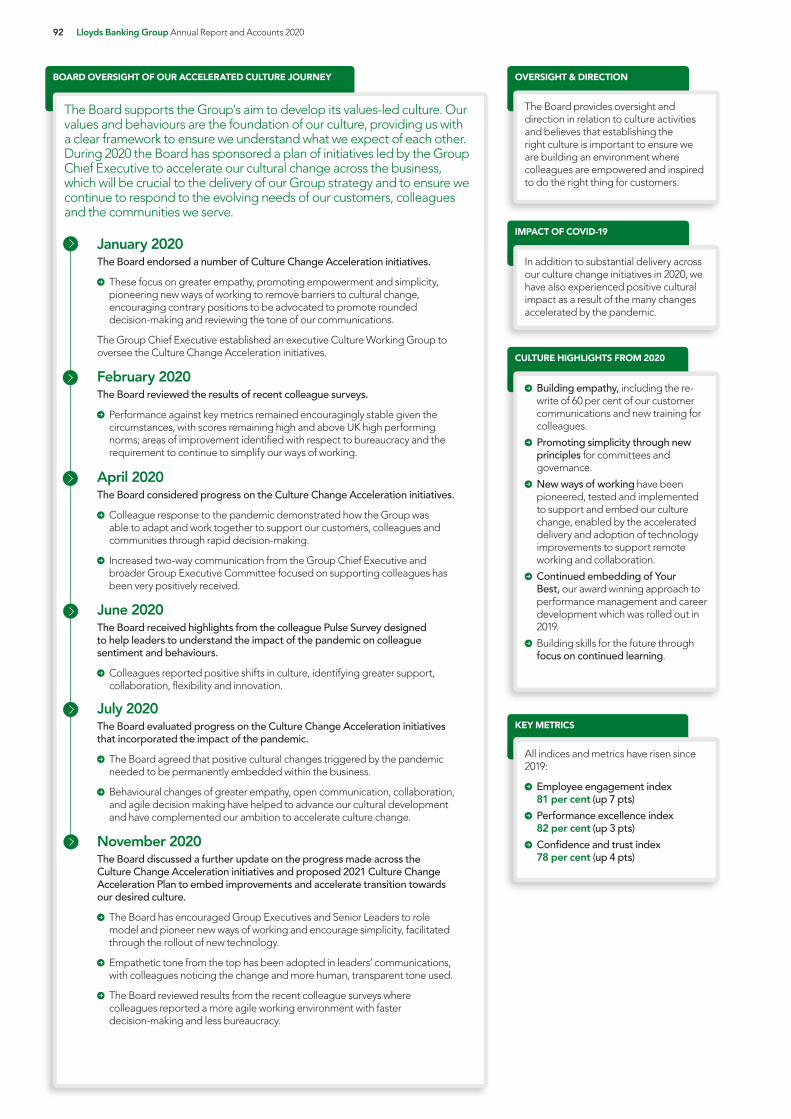
92 Lloyds Banking Group Annual Report and Accounts 2020
BOARD OVERSIGHT OF OUR ACCELERATED CULTURE JOURNEY
The Board supports the Group's aim to develop its values-led culture. Our values and behaviours are the foundation of our culture, providing us with a clear framework to ensure we understand what we expect of each other. During 2020 the Board has sponsored a plan of initiatives led by the Group Chief Executive to accelerate our cultural change across the business, which will be crucial to the delivery of our Group strategy and to ensure we continue to respond to the evolving needs of our customers, colleagues and the communities we serve.
January 2020The Board endorsed a number of Culture Change Acceleration initiatives.
These focus on greater empathy, promoting empowerment and simplicity, pioneering new ways of working to remove barriers to cultural change, encouraging contrary positions to be advocated to promote rounded decision-making and reviewing the tone of our communications.
The Group Chief Executive established an executive Culture Working Group to oversee the Culture Change Acceleration initiatives.
February 2020The Board reviewed the results of recent colleague surveys.
Performance against key metrics remained encouragingly stable given the circumstances, with scores remaining high and above UK high performing norms; areas of improvement identified with respect to bureaucracy and the requirement to continue to simplify our ways of working.
April 2020The Board considered progress on the Culture Change Acceleration initiatives.
Colleague response to the pandemic demonstrated how the Group was able to adapt and work together to support our customers, colleagues and communities through rapid decision-making.
Increased two-way communication from the Group Chief Executive and broader Group Executive Committee focused on supporting colleagues has been very positively received.
OVERSIGHT & DIRECTION
IMPACT OF COVID-19
CULTURE HIGHLIGHTS FROM 2020
KEY METRICS
The Board provides oversight and direction in relation to culture activities and believes that establishing the right culture is important to ensure we are building an environment where colleagues are empowered and inspired to do the right thing for customers.
In addition to substantial delivery across our culture change initiatives in 2020, we have also experienced positive cultural impact as a result of the many changes accelerated by the pandemic.
Building empathy, including the re-write of 60 per cent of our customer communications and new training for colleagues.
Promoting simplicity through new principles for committees and governance.
New ways of working have been pioneered, tested and implemented to support and embed our culture change, enabled by the accelerated delivery and adoption of technology improvements to support remote working and collaboration.
Continued embedding of Your Best, our award winning approach to performance management and career development which was rolled out in 2019.
Building skills for the future through focus on continued learning.
All indices and metrics have risen since 2019:
Employee engagement index 81 per cent (up 7 pts)
Performance excellence index 82 per cent (up 3 pts)
Confidence and trust index 78 per cent (up 4 pts)
June 2020The Board received highlights from the colleague Pulse Survey designed to help leaders to understand the impact of the pandemic on colleague sentiment and behaviours.
Colleagues reported positive shifts in culture, identifying greater support, collaboration, flexibility and innovation.
July 2020The Board evaluated progress on the Culture Change Acceleration initiatives that incorporated the impact of the pandemic.
The Board agreed that positive cultural changes triggered by the pandemic needed to be permanently embedded within the business.
Behavioural changes of greater empathy, open communication, collaboration, and agile decision making have helped to advance our cultural development and have complemented our ambition to accelerate culture change.
November 2020The Board discussed a further update on the progress made across the Culture Change Acceleration initiatives and proposed 2021 Culture Change Acceleration Plan to embed improvements and accelerate transition towards our desired culture.
The Board has encouraged Group Executives and Senior Leaders to role model and pioneer new ways of working and encourage simplicity, facilitated through the rollout of new technology.
Empathetic tone from the top has been adopted in leaders’ communications, with colleagues noticing the change and more human, transparent tone used.
The Board reviewed results from the recent colleague surveys where colleagues reported a more agile working environment with faster decision-making and less bureaucracy.

Strategic rep
ortFinancial results
Governance
Risk manag
ement
Financial statements
Other inform
ationStrateg
ic report
Governance
Risk manag
ement
Financial statements
Other inform
ation Lloyds Banking Group Annual Report and Accounts 2020 93
GROUP STRUCTURE AND RING-FENCING GOVERNANCE ARRANGEMENTS
Since 1 January 2019 UK legislation has required large UK banks to separate personal banking services, such as current and savings accounts, from riskier activities, such as investment banking, in other parts of their business. This is called ring-fencing. The Group’s structure and governance arrangements meet these regulatory requirements. Lloyds Bank plc and Bank of Scotland plc are the banks, within the Group, which have been included within the ring-fence (together, the Ring-Fenced Banks). The governance structure focuses on ensuring:
Independent decision-making by the Ring-Fenced Bank Boards – on any matters where there might be a conflict between the interests of the Ring-Fenced Banks and the interests of another part of the Group.
Risks affecting the Ring-Fenced Banks are considered and managed from the Ring-Fenced Banks’ perspective – including maintenance of the capital adequacy and liquidity of the Ring-Fenced Banks.
Clear and effective governance at both Ring-Fenced Bank and Lloyds Banking Group plc level – including second and third lines of defence in respect of risk management.
Group StructureThe subsidiaries of the Group are structured into the following sub-groups under Lloyds Banking Group plc providing effective governance for the business undertaken in each sub-group:
Ring-Fenced Banks sub-group containing Lloyds Bank plc and Bank of Scotland plc (including the Halifax and MBNA businesses), serving both their UK personal and commercial customers.
Non Ring-Fenced Bank sub-group – Lloyds Bank Corporate Markets plc – which provides products and services to Group customers that are not allowed within the ring-fence as well as serving Financial Institutions customers and holding certain of the Group’s subsidiaries and branches outside the UK.
Insurance sub-group under Scottish Widows Group Limited (including Scottish Widows Limited).
Equity sub-group under LBG Equity Investments Limited, for which the principal subsidiary is Lloyds Development Capital Limited.
The Ring-Fenced Bank Boards have three additional independent Non-Executive Directors to the Group Board: Nigel Hinshelwood (Senior Independent Director), Sarah Bentley and Brendan Gilligan. These Ring-Fenced Bank only directors are independent of the management and the rest of the Group and play a crucial role in the governance structure, with an enhanced role in managing any potential conflicts between the Ring-Fenced Banks and the Group.
Lloyds Banking Group plc
Lloyds Bank Corporate Markets plc
Lloyds Bank plc1
HBOS plc
Bank of Scotland plc1
Scottish Widows Group
Limited
LBG Equity Investments
Limited
Aligned Boards
1Ring-Fenced Banks Non Ring-Fenced Bank
Insurance Equity Investments
CLIMATE CHANGE INCLUSION & DIVERSITY
WORKFORCE ENGAGEMENT
Board oversight of sustainability and climate-related risksThe Board has a key role in overseeing how the Group’s activities affect the environment and the impact of climate change on the Group’s business. The Responsible Business Committee oversees and monitors the Group’s sustainability strategy and the Board Risk Committee oversees and monitors the Group’s approach to managing risks arising from climate change, with both Committees reporting regularly to the Board. Further details of the governance structure for the oversight and ownership of the Group’s sustainability strategy and management of climate-related risks can be found on page 22.
During the year the Board approved: an ambitious goal, working with customers, Government and the market to help reduce the emissions we finance by more than 50 per cent by 2030, on the path to net zero by 2050 or sooner – read more on this Key Board Decision on page 50 and read more on the Metrics and Targets on page 22.
three new operational pledges to accelerate the Group’s plan to tackle climate change – read more on pages 22 to 23.
the creation of a new principal risk for climate risk in the Group’s Enterprise Risk Management Framework and integration of climate risk into all existing principal risks – read more on page 57.
In addition, in January 2021 the Board approved a Risk Appetite metric for climate risk to ensure the Group continues to progress activities at pace.
The Board Risk Committee receives regular detailed updates regarding the Group’s climate risk management and key developments and will continue to closely monitor climate change and sustainability risks, looking at the impact on both the Group and our customers, and the delivery of the Task Force on Climate-related Financial Disclosures (TCFD) recommendations and other commitments.
The Audit Committee considers climate-related disclosures in the Group’s financial statements.
More detailGroup’s environmental and social progress
Read more on pages 20 to 31 and in our 2020 Lloyds Banking Group ESG Report.
Board oversight of Inclusion & Diversity initiativesThe Board believes an inclusive and diverse workforce is vital to the Group’s success, and values the differences each colleague brings to their role, making the Group stronger and better able to meet the needs of our customers.
In support of this the Board approved in July 2020 the introduction of our Race Action plan, designed to drive race-related cultural change, recruitment and progression across the Group.
The Board also approved a target to increase Black representation in senior roles to at least 3 per cent by 2025. This complemented the Group’s broader 2018 Black, Asian and Minority Ethnic representation targets of 10 per cent overall, and 8 per cent at senior roles.
More detailChampioning Inclusion & Diversity
Read more on pages 25 to 26
Board Diversity Policy Read more on page 100
Please refer to page 48 for details of how the Board engages with the Group’s workforce and why the Board considers these arrangements to be effective.
Climate change impacts are becoming ever clearer and need urgent action. The Group has ambitious plans to further reduce our own emissions and those we finance.
Sara Weller Chair, Responsible Business Committee

94 Lloyds Banking Group Annual Report and Accounts 2020
INTERNAL EVALUATION PROCESS
HIGHLIGHTS FROM THE 2020 BOARD EVALUATION
Board evaluationHow the Board performs and is evaluated The annual evaluation, which is facilitated externally at least once every three years, provides an opportunity to consider ways of identifying greater efficiencies, maximising strengths and highlighting areas of further development to enable the Board continuously to improve its own performance and the performance of the Group.
The Chair of the Board, with the support of the Nomination and Governance Committee, leads the Board in considering and responding to the annual evaluation of the Board’s effectiveness, which includes a review of its Committees and individual Directors. Performance evaluation of the Chair is carried out by the Non-Executive Directors, led by the Senior Independent Director, taking into account the views of the Executive Directors.
The Board is in the final year of the three year evaluation cycle recommended by the UK Corporate Governance Code 2018. An external evaluation was last conducted in 2018, facilitated by Egon Zehnder1, an external board review specialist, with internal evaluations being carried out in 2020 and 2019. The 2021 evaluation is currently expected to be externally facilitated, with the Nomination and Governance Committee beginning the search process for the external facilitators in the due course.
2020 evaluation of the Board’s performanceThe 2020 evaluation was conducted internally between November 2020 and January 2021 by the Group Company Secretary, and was overseen by the Nomination and Governance Committee.
The 2020 review sought the Directors’ views on a range of topics including: strategy; planning and performance; risk and control; Board composition and size; balance of
skills, experience and knowledge; diversity; culture; how members work together, and with executive management, to achieve objectives; the Board’s calendar and agenda; the quality and timeliness of information; and support for Directors and Committees. The topics were selected by the Chair of the Nomination and Governance Committee and the Group Company Secretary as being the most pertinent when considering the Board’s effectiveness, and also referenced previous years’ topics to track trends and improvements.
If Directors have concerns about the Company or a proposed action which cannot be resolved, their concerns are recorded in the Board minutes. Also on resignation, Non-Executive Directors are encouraged to provide a written statement of any concerns to the Chair, for circulation to the Board. No such concerns were raised in 2020 and up to the date of this report.
1 At the time of the 2018 review Egon Zehnder provided certain Board and senior management level services from time to time, including in respect of succession planning as detailed on page 67 of the 2018 Annual Report and Accounts, otherwise Egon Zehnder had no other connection with the Group.
November 2020Detailed online questionnaire issued to all Directors by the Group Company Secretary.
November 2020 to January 2021Individual meetings held between each Director and the Group Company Secretary or Corporate Governance Director to discuss responses and opportunity for Directors to raise any other matters concerning the Board or its Committees.
December 2020 to January 2021Report prepared by the Group Company Secretary based on the questionnaire results and matters raised in individual meetings.
January 2021Draft report discussed by the Group Company Secretary with the Chair.
Final report reviewed at a meeting of the Board, following its consideration by the Nomination and Governance Committee.
The evaluation concluded that the performance of the Board, its Committees, the Chair and each of the Directors continues to be effective.
All Directors demonstrated commitment to their roles and contributed effectively. The Board is also regarded as very able, collegiate and well-run, with an open and supportive culture and strong governance relating to risks and controls and managing the regulatory requirements of the ring-fencing regime.
The key findings and areas for consideration include the following:
Theme Findings Areas for consideration
Board discussion and debate
Call for further strategic, forward-looking discussion. Further refine Board and Committee meetings in terms of timings, agendas, papers and discussions to permit greater strategic and forward-looking discussion and debate.
Board papers Improve quality of Board papers. Sharpen the focus of papers to:
show more of the thinking behind proposals, including trade-offs and options considered and give unvarnished accounts, always sharing bad news as well as good.
be less formal and shorter. make the ‘ask’ of the Board clearer in the paper, together with the reason Board approval was requested, rather than delegating authority to a committee or elsewhere.
Training Further formal technical training for members of Boards and Committees.
To leverage internal and external expertise, as well as to widen existing Non-Executive Director training curriculum, both online and (when conditions permit) in person.
Assessing our effectiveness

Strategic rep
ortFinancial results
Governance
Risk manag
ement
Financial statements
Other inform
ationStrateg
ic report
Governance
Risk manag
ement
Financial statements
Other inform
ation Lloyds Banking Group Annual Report and Accounts 2020 95
PROGRESS AGAINST THE 2019 BOARD EVALUATION
The main focus in improvements to Board effectiveness in 2020 have been in the technology area, including improving Non-Executive Director access to Group IT systems with more powerful and modern devices and tools, balancing convenience and ease of access with the need to ensure compliance with Group security policies and procedures. Enhancements to Board and Committee meeting technology, tools and procedures were accelerated as a result of the pandemic, with considerable success and without impact on the twin focus on streamlining meeting agendas, papers and presentations to allow deeper strategic discussion by the Board. Details of specific actions taken and enhancements made during 2020 are set out below:
Theme Feedback from the 2019 evaluation Actions taken in 2020
Ring-fencing governance
Ring-fenced governance requirements require individual Directors, the Chair and Committee Chairs to manage meetings, to ensure all Directors can contribute fully and effectively.
Agendas and papers are carefully structured to provide clarity in relation to the action required for each entity.
Strategy The Board’s detailed engagement in the formulation of strategy is seen as a key strength, with the strategy days playing an important role in this.
More frequent deep dives were diarised together with free discussion time for strategic discussion of core business activities.
Board papers and presentations
Further streamline meeting agendas, papers and presentations to enable more expansive discussion.
Stricter guidelines on papers and presentations were developed in conjunction with the Chair of the Board and each Committee Chair to permit more time for discussion.
IT tools and access
Access to Group IT systems, especially encrypted systems, cumbersome or not user friendly.
Control relaxations focused on user experience, while maintaining compliance with Bank of England security framework.
Virtual Board and Committee meetings
Enhance technology and processes to enable more effective virtual meetings.
All Board and Committee meetings since (and including) March 2020 have been held remotely, with the 2020 Board Evaluation feedback noting how effectively these had operated during the period. In addition, the Non-Executive Director training curriculum was delivered online for the majority of the year.
Internal controlBoard responsibilityThe Board is responsible for the Group’s risk management and internal control systems, which are designed to facilitate effective and efficient operations and to ensure the quality and integrity of internal and external reporting and compliance with applicable laws and regulations, and for the determination of the nature and extent of the principal risks the Group is willing to take in order to achieve its strategy. The Directors and senior management are committed to maintaining a robust control framework as the foundation for the delivery of effective risk management. The Directors acknowledge their responsibilities in relation to the Group’s risk management and internal control systems and for reviewing their effectiveness.
In establishing and reviewing the risk management and internal control systems, the Directors carried out a robust assessment of the emerging and principal risks facing the Company, including those that would threaten its business model, future performance, solvency or liquidity and reputation, the likelihood of a risk event occurring and the costs of control. The process for identification, evaluation and management of the emerging and principal risks faced by the Group is integrated into the Group’s overall framework for risk governance. The risk identification, evaluation and management process also identifies whether the controls in place result in an acceptable level of risk. At Group level, a consolidated risk report and risk appetite
dashboard are reviewed and regularly debated by the Group Risk Committee, Board Risk Committee and the Board to ensure that they are satisfied with the overall risk profile, risk accountabilities and mitigating actions. The report and dashboard provide a monthly view of the Group’s overall risk profile, key risks and management actions, together with performance against risk appetite and an assessment of emerging risks which could affect the Group’s performance over the life of the operating plan. Information regarding the main features of the internal control and risk management systems in relation to the financial reporting process is provided within the risk management report on pages 143 to 204. The Board concluded that the Group’s risk management arrangements are adequate to provide assurance that the risk management systems put in place are suitable with regard to the Group’s profile and strategy.
Control effectiveness reviewAll key controls are recorded and assessed on a regular basis, either in response to triggers or at a minimum annually. Control assessments consider both the adequacy of the design and operating effectiveness. Where a control is not effective, the root cause is established and action plans implemented to improve control design or performance. Control Effectiveness against all residual risks is reported and monitored via the monthly Consolidated Risk Report (CRR). The CRR is reviewed and independently challenged by the Risk Division and provided to the Risk Division Executive Committee and Group
Risk Committee. On an annual basis, a point in time assessment is made for control effectiveness against each risk category and across the 4 sub-groups. The CRR data is the primary source used for this point in time assessment and a year on year comparison on control effectiveness is reported to the Board.
Reviews by the BoardThe effectiveness of the risk management and internal control systems is reviewed regularly by the Board and the Audit Committee, which also receive reports of reviews undertaken by the Risk Division and Group Internal Audit. The Audit Committee receives reports from the Company’s auditor, PricewaterhouseCoopers LLP (which include details of significant internal control matters that they have identified), and has a discussion with the auditor at least once a year without executives present, to ensure that there are no unresolved issues of concern.
The Group’s risk management and internal control systems are regularly reviewed by the Board and are consistent with the Guidance on Risk Management, Internal Control and Related Financial and Business Reporting issued by the Financial Reporting Council and compliant with the requirements of CRD IV. They have been in place for the year under review and up to the date of the approval of the annual report. The Group has determined a pathway to compliance with BCBS 239 risk data aggregation and risk reporting requirements and continues to actively manage enhancements.

96 Lloyds Banking Group Annual Report and Accounts 2020
Complying with the UK Corporate Governance Code 2018The UK Corporate Governance Code 2018 (the ‘Code’) applied to the financial year ended 31 December 2020. The Company confirms that it applied the principles and complied with all the provisions of the Code throughout the year except in relation to that part of provision 36 that provides that the remuneration committee should develop a formal policy for post-employment shareholding requirements encompassing both unvested and vested shares and, in one instance, in relation to that part of provision 15 that provides that additional external appointments should not be undertaken without prior approval of the Board. In relation to provision 36, while the Remuneration Committee has not introduced a formal post-employment shareholding policy, the existing reward structure ensures that Executive Directors will continue to meet the Group’s shareholding requirements for a minimum of two years after leaving the Group. On this basis, the Group believes that it already complies with best practice and with the spirit of provision 36 notwithstanding the fact that a specific formal policy has not been introduced. Please refer to the Directors' Remuneration Policy which is set out in the 2019 annual report and accounts (pages 115 to 123) which is available at: www.lloydsbankinggroup.com/investors/annual-report/annual-report-archive.html for a more detailed explanation of the Group’s approach to post-employment shareholding requirements. In relation to provision 15, the Chair approved Nick Prettejohn taking on the role of Chairman of the charity, Prisoners Abroad, but due to timing constraints, the Board did not approve the appointment in advance but ratified it after Nick Prettejohn had taken on the role. The role is not considered a significant appointment for the purposes of provision 15 of the Code.
The Code is publicly available at www.frc.org.uk. This page and the following page, together with the rest of the Corporate Governance Report, explain and illustrate how we have applied the principles and related provisions of the Code during the year. The alphabetical references in the paragraphs below correspond to the principles, and related provisions, of the Code. The Group has adopted the UK Finance Code for Financial Reporting Disclosure and its 2020 financial statements have been prepared in compliance with its principles.
1. Board Leadership and Company Purpose
Independent Responsibilities
ChairLord Blackwell/Robin Budenberg
Robin Budenberg succeeded Lord Blackwell as Chair on 1 January 2021. The Chair leads the Board and promotes the highest standards of corporate governance. He leads in building an effective and complementary Board, and sets the Board’s agenda. The Chair also leads Board succession planning and ensures effective communication with shareholders.
Executive DirectorsGroup Chief ExecutiveAntónio Horta-Osório
António Horta-Osório manages and leads the Group on a day-to-day basis, making decisions on matters affecting the operation and performance of the Group’s business and the delivery of the Board’s approved strategy. He delegates aspects of his authority, as permitted under the Corporate Governance Framework, to other members of the Group Executive Committee.
Chief Financial Officer William Chalmers
Under the leadership of the Group Chief Executive, William Chalmers makes and implements decisions in all matters affecting the management of financial resources. He provides specialist knowledge and experience to the Board. Together with António Horta-Osório, William Chalmers designs, develops and implements strategic plans and deals with day-to-day operations of the Group.
Non-Executive DirectorsDeputy Chair and Senior Independent DirectorAlan Dickinson
As Deputy Chair, Alan Dickinson supports the Chair in representing the Board, and acts as a spokesperson for the Group. He deputises for the Chair and is available to the Board for consultation and advice. The Deputy Chair may also represent the Group’s interests to official enquiries and review bodies.As Senior Independent Director, Alan Dickinson is a sounding board for the Chair and Group Chief Executive. He acts as a conduit for the views of other Non-Executive Directors and conducts the Chair’s annual performance appraisal. He is available to help resolve shareholders’ concerns and attends meetings with major shareholders and financial analysts to understand issues and concerns.
Sarah Legg
The Non-Executive Directors challenge management constructively and help develop and set the Group’s strategy. They actively participate in Board decision-making and scrutinise management performance.
The Non-Executive Directors satisfy themselves on the integrity of financial information and review the Group’s risk exposures and controls. The Non-Executive Directors, through the Remuneration Committee, also determine the remuneration of Executive Directors.
Lord Lupton
Amanda Mackenzie
Nick Prettejohn
Stuart Sinclair
Sara Weller
Catherine Woods
Group Company SecretaryKate Cheetham
The Group Company Secretary advises the Board on matters relating to governance, ensuring good information flows and comprehensive practical support is provided to Directors. The Group Company Secretary maintains the Group’s Corporate Governance Framework and organises Directors’ induction and training. Both the appointment and removal of the Group Company Secretary is a matter for the Board as a whole.
A. The Group is led by an effective, committed Board, which is collectively responsible for the long-term, sustainable success of the Group, ensuring due regard is paid to the interests of the Group’s stakeholders, with its effectiveness assessed annually, discussed further on page 94 to 95. The Group’s Corporate Governance Framework, which is reviewed annually by the Board, sets out the key decisions and matters reserved for the Board’s approval, which includes matters relating to the Group’s long-term strategy and priorities. Further details of the Corporate Governance Framework can be found on page 99.B. The Board assumes responsibility for establishing the purpose of the Company, setting its strategy, establishing its culture, and determining the values to be observed in achieving that strategy. Central to this is the Company’s role as a trusted and responsible business, with the Board’s Responsible Business Committee overseeing the Group’s ambitions in this regard. The Group’s approach to acting as a responsible business is discussed in detail on pages 20 to 31, and in the report of the Responsible Business Committee on page 110.C. The Board retains ultimate responsibility for ensuring adequate resource is available to meet agreed objectives and strategy, and ensures such resources are responsibly and effectively deployed. The effective management of risk is central to the Company’s strategy, supported by the Group’s enterprise risk management framework, as discussed in the risk management report on pages 144 to 204.
D. The Board recognises that engaging with and acting on the needs of the Group’s stakeholders is key to achieving the strategy and long-term objectives of the Company. Engagement with stakeholders, across the organisation and including that of the Board, is discussed further on pages 46 to 51, and in the Directors’ statement of compliance with their duties under section 172 of the Companies Act 2006, also on pages 46 to 51. A final summary of the impact of the voting outcomes at the 2020 AGM for the Group’s Directors’ Remuneration Policy and Long Term Share Plan has had on the decisions the Board has taken and the actions or resolutions now proposed are set out on pages 118 and 119.
E. All policy and practice relating to Group colleagues is developed and implemented in a way which is consistent with the Group’s purpose and values, with the Board receiving regular updates on matters relevant to colleagues. The Board has appointed Alan Dickinson as its whistleblowing champion, with responsibility for overseeing the integrity, independence and effectiveness of the Group’s whistleblowing procedures. In addition, the Audit Committee reviews reports on whistleblowing to ensure there are arrangements in place which colleagues can use in confidence to report relevant concerns, as discussed on page 104 and reports on its review to the Board.

Strategic rep
ortFinancial results
Governance
Risk manag
ement
Financial statements
Other inform
ationStrateg
ic report
Governance
Risk manag
ement
Financial statements
Other inform
ation Lloyds Banking Group Annual Report and Accounts 2020 97
2. Division of Responsibilities
F. The Chair has overall responsibility for the leadership of the Board and for ensuring its effectiveness in all aspects of its operation. These responsibilities are formalised within the Corporate Governance Framework. Lord Blackwell and Robin Budenberg were both independent on appointment.
G. The balance of skills, experience, independence and knowledge on the Board is the responsibility of the Nomination and Governance Committee, and is reviewed annually or whenever appointments are considered. Having the right balance of skills and experience helps to ensure Directors discharge their duties effectively. The Nomination and Governance Committee monitors whether there are any relationships or circumstances which may affect a Director’s independence. Following the most recent review of independence, the Committee concluded that all Non-Executive Directors are independent in character and judgement, as shown on page 99. As of 1 February 2021, Sara Weller had spent nine years on the Board and will retire at the AGM in May. In relation to the period from 1 February 2021, being the ninth anniversary of Sara Weller’s appointment to the Board, to retirement at the AGM in May, the Board considered and agreed the continuing independence of Sara as a Non-Executive Director of the Company for that period. The decision was based on a number of factors including the continued challenge and oversight Sara provides in the role and the other external roles she holds, while noting the benefits of enabling the transition of her responsibilities as Chair of the Responsible Business Committee during this short period. More information on the annual Board evaluation can be found on pages 94 to 95 and information on the Board Diversity Policy can be found on page 100.
H. Non-Executive Directors are advised of time commitments prior to their appointment and are required to devote such time as is necessary to discharge their duties effectively. The time commitments of the Directors are considered by the Board on appointment and annually thereafter, and, following the most recent review, the Board is satisfied there are no directors whose time commitments are considered to be a matter for concern. External appointments, which may affect existing time commitments relevant to the Board, must be agreed with the Chair, and prior Board approval must be obtained before taking on any new external appointments. The Chair approved Nick Prettejohn taking on the role of Chairman of the charity, Prisoners Abroad, but due to timing constraints, the Board did not approve the appointment in advance but ratified it after Nick Prettejohn took on the role. The role is not considered a significant appointment. During 2020, Stuart Sinclair was appointed a Non-Executive Director and subsequently Chairman of each of International Personal Finance plc and Willis Limited and Sara Weller a Non-Executive Director of BT Group plc. The Board considered the time commitments and potential conflicts involved in Stuart and Sara taking up these significant roles prior to them accepting the roles and were satisfied that they would continue to have sufficient time to commit to their respective Group Board and Committee appointments. No Executive Director has taken up more than one Non-Executive Director role at a FTSE100 company or taken up the chair of such a company. More information on Directors’ attendance at meetings can be found on page 86.
I. The Chair, supported by the Group Company Secretary, ensures that Board members receive appropriate and timely information. The Group provides access, at its expense, to the services of independent professional advisers in order to assist Directors in their role. Board Committees are also provided with sufficient resources to discharge their duties.
3. Composition, Succession and Evaluation
J. The process for Board appointments is led by the Nomination and Governance Committee, which makes recommendations to the Board. Open advertising and/or an external search consultancy is used for the appointment of the Chair and Non-Executive Directors. More details about the appointment process for the Chair and Group Chief Executive and succession planning can be found on pages 98, 99 and 100. More information about the work of the Nomination and Governance Committee can be found on pages 98 to 100.
K. The Chair leads the training and development of Directors and the Board regularly reviews and agrees with each Director their individual and combined training and development needs. The Chair personally ensures that on appointment each Director receives a full, formal and tailored induction. The emphasis is on ensuring the induction brings the business and its issues alive, taking account of the specific role the Director has been appointed to fulfil and their skills and experience to date. More information on the new Chair’s tailored induction programme can be found on page 87. Directors who take on or change roles during the year attend induction meetings in respect of those new roles.
At the 2021 AGM all Directors will seek re-election or election save for António Horta-Osório, who will be stepping down with effect from 30 April 2021 and Sara Weller, who will be stepping down at the 2021 AGM. The Board believes that all Directors continue to be effective and committed to their roles.
L. An internally facilitated Board evaluation was completed in 2020, with an externally facilitated evaluation last having taken place in 2018. Individual evaluation is carried out by the Chair on behalf of the Board. Performance evaluation of the Chair is carried out by the Non-Executive Directors, led by the Senior Independent Director, taking into account the views of the Executive Directors. More information on the 2020 Board evaluation can be found on pages 94 to 95, along with the findings, actions, and progress made during the year.
4. Audit, Risk and Internal Control
M. The Board has delegated a number of responsibilities to the Audit Committee, including oversight of financial reporting processes, the effectiveness of internal controls and the risk management framework, whistleblowing arrangements and the work undertaken by the external and internal auditors. The Audit Committee reports regularly to the Board on its activities, and its report for 2020, confirming how it has discharged its duties can be found on pages 101 to 104.
N. Requirements that the Annual Report is fair, balanced and understandable are considered throughout the drafting and reviewing process and the Board has concluded that the 2020 Annual Report meets this requirement. The Board is supported in this by its Audit Committee and a sign off process involving different sections of the annual report being approved for inclusion by senior management, with additional review by the Group Disclosure Committee. The Directors’ and Auditor’s Statements of Responsibility can be found on page 114 and page 206 respectively. Related information on the Company’s business model and strategy can be found on pages 1 to 59.
O. The Board is responsible for the Group’s risk management and internal controls systems, including the determination of the nature and extent of risk the Company is willing to take. Risk is further managed through the Board approved Risk Control Framework, as discussed in the risk management report on pages 144 to 204. The Audit Committee assumes further responsibility for the effectiveness of internal controls, with the Board Risk Committee assuming responsibility for the review of the risk culture of the Group, ensuring the correct ‘tone from the top’ in respect of risk management. The related Directors’ Viability Statement can be found on pages 112 to 113 and confirmation that the business is a going concern can be found on page 113.
5. Remuneration
P. The Group is committed to offering all colleagues a reward package that is competitive, performance-driven and fair and its Remuneration Policy is designed to promote the long-term and sustainable success of the Company. The Directors’ Remuneration Report on pages 115 to 142 provides further details regarding the remuneration of Directors. The current Remuneration Policy can be found in the 2019 Annual Report and Accounts and remains unchanged since last approved by shareholders at the 2020 AGM.
Q. The Remuneration Committee seeks to ensure all remuneration policy, including that relevant to executive remuneration, is fair and transparent. The work of the Remuneration Committee during the year is discussed further in its report on page 115.
R. The Remuneration Policy seeks to ensure all remuneration decisions made by Directors fully consider the wider circumstances as relevant to that decision, including, but not limited to, individual performance. The Remuneration Committee’s decision-making in respect of remuneration outcomes is discussed further in the Directors’ Remuneration Report on pages 115 to 142 which includes additional confirmation of the use of remuneration consultants, including where any such consultant has another connection to the Company.

98 Lloyds Banking Group Annual Report and Accounts 2020
IntroductionIn the months since my appointment to the Board and, more recently, as Chair of the Committee I have been impressed by the level of commitment shown by Board members, the executive and colleagues in delivery of the Group’s aims, and support for customers and each other during these unprecedented times. These qualities, together with our focus on diverse teams and inclusive environments, will help to drive the continued transformation of the Group and the best outcomes for customers.
Succession planningMy introduction to the Governance Report on page 81 highlighted a number of changes to the Board and its Committees during the year; all of these have been overseen by the Committee. Strong succession planning has been a key focus in helping to ensure the appropriate mix of skills, experience and backgrounds has continued. Further details on the Committee’s approach to succession planning can be found on page 100.
Consideration was given to planned Board retirements and the impact of these on membership of the Board and its Committees. The Committee’s ongoing review of the structure, size and composition of the Board and its Committees helps ensure that the appropriate mix of knowledge, skills, experience and diversity is maintained. A number of other changes, beyond those set out below, have also been made to the membership of Board Committees during the year as a result of this ongoing review.
As indicated in last year’s report, Catherine Woods formally joined the Board on 1 March 2020, as a Non-Executive Director. Anita Frew retired from the Board at the AGM in May as planned, with Alan Dickinson succeeding her as Deputy Chair in addition to his existing role of Senior Independent Director. Nick Prettejohn temporarily took on Alan’s role as Chair of the Board Risk Committee, with this role having now passed to Catherine Woods with effect from 1 January 2021. Simon Henry retired as a Non-Executive Director in September, with Simon’s role as Audit Committee Chair passing to Sarah Legg. The experience which Catherine and Sarah bring to the Board, made them ideal candidates to Chair these important Committees. As announced on 29 January 2021, Sara Weller will retire from the Board, and as Chair of the Responsible Business Committee, at the AGM in May 2021. Amanda Mackenzie will take on the role of Chair of the Responsible Business Committee following Sara’s retirement.
After kindly agreeing to delay his departure, allowing him to continue to play a key role in the Group’s response to the pandemic, Juan Colombás retired from his role as the Chief Operating Officer with effect from 18 September 2020.
Nomination and Governance Committee report
Succession planning is a key component of good governance
As also discussed in last year’s report, Lord Blackwell announced his plan to retire as Group Chairman in 2021. The Committee undertook a thorough search process which culminated in my appointment as his successor. I was appointed as a Non-Executive Director effective from 1 October 2020. Subsequently, Lord Blackwell’s retirement and my succession both as Group Chair and Chair of the Committee, became effective on 1 January 2021.
Alongside confirmation of my appointment, António Horta-Osório’s decision to step down as Group Chief Executive in 2021 was also announced. The Committee undertook a similarly thorough process to identify António’s successor, culminating in the decision to appoint Charlie Nunn as Group Chief Executive. Subject to regulatory approval, Charlie will join the Board in August 2021. As announced on 1 December 2020 António will step down from his role on 30 April 2021. The Board has agreed that during any interim period between António stepping down and Charlie joining the Board, William Chalmers, Chief Financial Officer will, subject to regulatory approval, take on the role of acting Group Chief Executive in addition to his ongoing responsibilities, with a range of measures put in place to provide appropriate support. Further details of the selection process for these appointments can be found on page 99.
In addition to a focus on succession planning at Board level, the Committee also has a strong focus on succession planning at an executive level. The Committee continues to consider the overall health of the executive talent pipeline, together with detailed executive succession planning. Key considerations include, for example, cultural and strategic capabilities which will help ensure the continued transformation of the Group and the delivery of its strategic aims.
Board effectiveness and trainingAs referred to in my introduction to the Governance Report on page 81, this year an internal Board Evaluation has been undertaken, overseen by the Committee. The Committee also considered, and recommended to the Board, actions arising from the previous internal review undertaken in 2019. Full details are provided on pages 94 and 95. The 2021 Board Evaluation is currently expected to be facilitated externally, in line with the recommended approach set out in the UK Corporate Governance Code.
Annually, as part of the Board Evaluation, the Committee also undertakes a review of its own effectiveness. The findings of this review, which were considered by the Committee at its meeting in January 2021, found that the Committee had met its key objectives and carried out its responsibilities effectively.
Q&A WITH ROBIN BUDENBERG, CHAIR OF NOMINATION AND GOVERNANCE COMMITTEE
Q. As the new Chair of the Nomination and Governance Committee (the ‘Committee’), and the Group, what do you see as being the Board’s key strengths?Collectively the Board has excellent breadth and depth of experience and strong commitment to the Group’s strategic aims. This commitment has helped to ensure that the Group plays a successful role in Helping Britain Prosper and, more immediately, recovering from the pandemic.
Q. How will your appointment, and that of the new Group Chief Executive, further complement these qualities?At the time of my appointment, Lord Blackwell commented on my knowledge of the Group combined with broad experience in both financial services and other strategic roles. This, together with Charlie Nunn’s vision for the Group, passion and commitment to our purpose of Helping Britain Recover and Prosper, and his track record which brings world class operational, technology and strategic expertise, will all help build on the strengths of the existing management team in continuing to drive forward the strategic transformation of the Group.
Q. What are the key areas of focus for the Committee in 2021?Given the remit of the Committee, the core areas of focus for 2021 will continue to be succession planning at both Board and executive level, managing Board (and Committee) composition and skills, driving diversity and inclusion at Board level and beyond, and overseeing Board effectiveness.
Key activities in 2020
Succession planning and Board and executive changes
Board effectiveness and training Corporate governance review Diversity and inclusion

Strategic rep
ortFinancial results
Governance
Risk manag
ement
Financial statements
Other inform
ationStrateg
ic report
Governance
Risk manag
ement
Financial statements
Other inform
ation Lloyds Banking Group Annual Report and Accounts 2020 99
The Group’s commitment to building a diverse Board and workforce will help support the continuing transformation of the Group and strengthen the embedding of cultural change.
Robin Budenberg Chair, Nomination and Governance Committee
The Committee also oversees training undertaken by the Non-Executive Directors. Learning and engagement opportunities have been undertaken by all Non-Executive Directors in relation to material aspects of the Group’s business.
Independence and time commitmentsBased on its assessment for 2020, the Committee is satisfied that, throughout the year, all Non-Executive Directors remained independent1 in character and judgement. The Committee, and the Board, gave specific consideration to Sara Weller’s continuing independence as detailed on page 97.
In recommending Directors for election and re-election at the AGM, the Committee has reviewed the performance of each Non-Executive Director and their ability to continue meeting the time commitments required, taking into consideration individual capabilities, skills and experiences and any potential conflicts of interest that have been disclosed. The external roles held by all Directors were considered to be appropriate. Fuller details of any conflicts of interest can be found on page 111.
The Group’s Corporate Governance FrameworkThe annual review of the Corporate Governance Framework was undertaken during the year. There were no material changes, with updates this year focusing on simplification and clarity, together with various other minor amendments, and revision of committee terms of reference driven by recommended best practice and the aim of maintaining good governance standards.
As part of its broader governance responsibilities, the Committee considered regular updates on developments in corporate governance, including BEIS and FRC guidance on shareholder meetings and FRC views on corporate reporting, and also considered correspondence with shareholders.
UK Corporate Governance CodeThe Company applied the UK Corporate Governance Code 2018 for the year-ending 31 December 2020 and complied with all the provisions with two exceptions. A detailed summary setting out the Company’s compliance, together with details of these exceptions, can be found on pages 96 and 97.
Committee purpose and responsibilitiesThe purpose of the Committee is to keep the Board’s governance, composition, skills, experience, knowledge, independence and succession arrangements under review and to make appropriate recommendations to the Board to ensure the Company’s arrangements are consistent with the highest corporate governance standards.
The Committee reports to the Board on how it discharges its responsibilities and makes recommendations to the Board, all of which have been accepted during the year. The Committee’s terms of reference can be found at www.lloydsbankinggroup.com/who-we-are/group-overview/corporate-governance.html
Committee composition, skills and experienceTo ensure a broad representation of experienced and independent Directors, membership of the Committee currently comprises the Chair, Deputy Chair (who is also the Senior Independent Director), the Chairs of each of the Remuneration Committee and the Responsible Business Committee, and the Chair of our Insurance sub-group.
The Group Chief Executive attends meetings as appropriate. Details of Committee membership and meeting attendance can be found on page 86.
1 The former Chairman was independent on appointment. Under the Code, thereafter the test of independence is not appropriate in relation to the former Chairman.
Appointment Process – Chair and Group Chief ExecutiveFollowing the announcement of Lord Blackwell’s intention to retire, the Board initiated a search process at the start of 2020, led by the Senior Independent Director, to identify his successor. Following a competitive tender process, Heidrick & Struggles were appointed to assist the Board in identifying a diverse list of potential candidates with the experience and personal qualities to become Chair. The Senior Independent Director kept the Board and the Committee informed on progress, with regular discussions being held throughout. A long list of candidates was considered and narrowed down to a diverse short list. All interested candidates had preliminary meetings with the Senior Independent Director and were interviewed by Heidrick & Struggles. Further detailed consideration of each of the interested candidates led to a final shortlist of three for interview, with each being scored and assessed formally against defined competencies. Robin Budenberg was identified as the preferred candidate on the basis of his broad experience in both financial services and other strategic
advisory roles, combined with his knowledge of the Group and leadership qualities. Lord Blackwell was not involved in the selection or appointment of his successor.
Once the Chair succession was in place, António Horta-Osório informed the Board of his intention to step down as Group Chief Executive during 2021. Timing of this would help support a smooth transition and allow the new Group Chief Executive to work with the new Chair in the next stage of the Group’s development and transformation. The Committee delegated authority to the (now former) Chairman and Deputy Chair, working closely with Robin Budenberg, to begin the process. After a competitive tender process Russell Reynolds were appointed, with an instruction to produce a diverse list of individuals with the experience and personal qualities to become Group Chief Executive. Emphasis was also placed on strategic capabilities and relevant experience to lead the organisation through the significant technology transformation currently in progress. A long list of potential candidates was identified
and narrowed down to an initial short list with diverse backgrounds, characteristics and experience. A series of rounds of interviews led to a final shortlist of three, who were further considered by Committee members. Following this process, the Committee recommended to the Board that Charlie Nunn be appointed as the new Group Chief Executive, recognising the particular strengths that Mr. Nunn would bring to the role including his world class operational, technology and strategic expertise, combined with his passion for and commitment to the Group’s purpose and strategic aims.
Throughout each of these formal, rigorous and transparent appointment processes, consideration was given to a broad range of factors such as merit and objective criteria, consideration of diversity of gender, social and ethnic backgrounds, cognitive and personal strengths, and the Group’s future strategic direction. Neither search firm has any further connection with the Group or individual Directors beyond undertaking search and recruitment related activity.

100 Lloyds Banking Group Annual Report and Accounts 2020
Board Diversity PolicyThe Board Diversity Policy (the ‘Policy’) sets out the Board’s approach to diversity and provides a high level indication of the Board’s approach to inclusion and diversity in senior management roles which is governed in greater detail through the Group’s policies.
The Board places great emphasis on ensuring that its membership reflects diversity in its broadest sense. Consideration is given to the combination of demographics, skills, experience, race, age, gender, educational and professional background and other relevant personal attributes on the Board to provide the range of perspectives, insights and challenge needed to support good decision-making.
New appointments are made on merit, taking account of the specific skills and experience, independence and knowledge needed to ensure a rounded Board and the diverse benefits each candidate can bring to the overall Board composition.
Objectives for achieving Board diversity may be set on a regular basis. In January 2021 the Board considered and approved updates to aspirations set out in the Board Diversity Policy relating to gender diversity and the number of senior roles held by Black, Asian and Minority Ethnic executives.
On gender diversity the Board is committed to maintaining at least three female Board members and over time will aim to reach 50 per cent female representation on the Board to match the 50 per cent ambition that the Group has set for female senior roles.
Reflecting these aspirations, the Board will aim to continue to meet the Hampton-Alexander objective of 33 per cent female representation. Female representation on the Board is currently 36.4 per cent (based on 4 female Directors and 7 male Directors).
The Group has also set a target of 13 per cent of senior roles to be held by Black, Asian and Minority Ethnic executives by 2025. The Board currently meets, and will aim to continue to meet, the objectives of the Parker review with at least one Black, Asian and Minority Ethnic Board member.
The Board places high emphasis on ensuring the development of diversity in senior management roles within the Group and supports and oversees the Group’s ambition of achieving 50 per cent of senior roles held by female executives by 2025, and of 13 per cent of senior roles held by Black, Asian and Minority Ethnic executives by 2025. This is underpinned by a range of policies within the Group to help provide mentoring and development opportunities for female and Black, Asian and Minority Ethnic executives
and to ensure unbiased career progression opportunities. Progress on this objective is monitored by the Board and built into its assessment of executive performance.
As at 31 December 2020, female representation within Group Executive Committee and their direct reports was 32.3 per cent in total (with 26.7 per cent for Group Executive Committee and 33.0 per cent for their direct reports ). Female representation across all senior roles was 37.0 per cent, and Black, Asian and Minority Ethnic representation in senior roles was 7.7 per cent. The Group also launched its Race Action plan during 2020, which aims to drive cultural change, recruitment and progression across the Group, including a new public goal to increase Black representation in senior roles from 0.6 per cent to at least 3 per cent by 2025, aligning the Group with the overall UK labour market. Further details of the Race Action plan, and the Group’s further achievements in championing inclusion and diversity in its widest sense can be found on pages 25.
A copy of the Policy is available on our website at www.lloydsbankinggroup.com/who-we-are/responsible-business.html and further information on the Board’s broader approach to diversity and inclusion as part of its strategic priorities, and continued investment in being a leading inclusive employer can be found on pages 25 and 26.
Nomination and Governance Committee report continued
Succession PlanningEffective succession planning is a key component of good governance. With the appointment of a new Chair and the announcement of a new Group Chief Executive during the year, this has been a particular area of focus for the Committee. The arrangements being put in place to cover any interim period before Charlie Nunn joins the Group help illustrate how effective succession planning can be used to address short-term requirements. Effective succession planning also contributes to the ability of the Group to deliver on its strategic objectives by ensuring the desired mix of skills and experience of Board members now and in the future. The Board is also committed to recognising and nurturing talent within the executive and management levels across the Group to ensure that the Group creates opportunities to develop current and future leaders.
The Committee supports the Chair in keeping the composition of the Board and its Committees under regular review and in leading the appointment process for
nominations to the Board. This helps ensure continued focus on increasing the overall diversity of the Board, and capacity for future succession planning. The appointment process for the new Chair and Group Chief Executive, set out on the previous page, helps illustrate how the appointment process works in practice.
Central to the Group’s approach to succession planning is an ongoing assessment, led by the Chair, of the collective Board’s technical and governance skill set. From this, the Chair creates a Board skills matrix which is used to track the Board’s strengths and identify any gaps in the desired collective skills profile of the Board. Various factors are taken into consideration such as the Group’s future strategic direction, and helping ensure due weight is given to diversity in its broadest sense. The skills matrix is considered in the appointment of all Board members. The Group’s diversity commitments and outcomes of the annual Board Evaluation process are also taken into consideration.
The role of succession planning in promoting diversity is fully recognised. The Group has a range of policies which promote the engagement of under-represented groups within the business in order to build a diverse talent pipeline.
The Committee also continued to consider the adequacy of succession arrangements for key senior management roles. During the year, additional focus was given to development plans together with cultural and capability assessments, which will help nurture talent and drive cultural transformation across the Group, and support the ongoing delivery of the Group’s strategy.
The Chair is responsible for developing and maintaining a succession plan for the Group Chief Executive who is, in turn, primarily responsible for developing and maintaining succession plans for key leadership positions in the senior executive team.

Strategic rep
ortFinancial results
Governance
Risk manag
ement
Financial statements
Other inform
ationStrateg
ic report
Governance
Risk manag
ement
Financial statements
Other inform
ation Lloyds Banking Group Annual Report and Accounts 2020 101
Henry to myself, and I would like to take the opportunity to note my thanks to Simon on behalf of the Board and the Company for his excellent work in chairing the Committee over the preceding three years.
The impacts of the COVID pandemic have been a key focus during the year across the Group, and continue to be felt as we go into 2021, and I am pleased to report that the Committee has played its part in supporting the Group’s response to the crisis. I am also pleased to report that the opinion of the Audit Committee continues to be that the Company has met its obligations for financial reporting and disclosure, and that the internal control framework is both effectively designed and operated.
Committee purpose and responsibilitiesThe purpose of the Committee is to monitor and review the Group’s financial and narrative reporting arrangements, the effectiveness of the internal controls (including over financial reporting) and the risk management framework, whistleblowing arrangements and each of the internal and external audit processes, including the statutory audit of the consolidated financial statements and the independence of the statutory external auditor.
The Committee reports to the Board on how it discharges its responsibilities and makes recommendations to the Board, all of which have been accepted during the year. A full list of responsibilities is detailed in the Committee’s terms of reference, which can be found at www.lloydsbankinggroup.com/who-we-are/group-overview/corporate-governance.html. In satisfying its purpose, the Committee undertakes the functions detailed within Disclosure Guidance and Transparency Rule 7.1.3R.
During the year the Committee considered a number of issues relating to the Group’s financial reporting. These issues are summarised on the following pages, including discussion of the conclusions the Committee reached, and the key factors considered in reaching these conclusions.
In addition, the Committee considered a number of other issues not related directly to financial reporting, including internal controls, internal
Audit Committee report
Ensuring oversight of financial reporting and the control environment
The strength of the Group's internal control environment and our ongoing commitment to improving this end to end will be key in supporting the Group's ongoing transformation.
Sarah Legg Chair, Audit Committee
audit and external audit. These issues are also discussed in detail on the final page of the report.
Committee composition, skills, experience and operationThe Committee acts independently of the executive to ensure the interests of the shareholders are properly protected in relation to financial reporting and internal control.
All members of the Committee are independent Non-Executive Directors with competence in the financial sector, and their biographies can be found on pages 82 to 83.
Sarah Legg is a Fellow of the Chartered Institute of Management Accountants and of the Association of Corporate Treasurers, with extensive knowledge of financial markets, treasury, risk management and international accounting standards. She is a member having recent and relevant financial experience for the purposes of the UK Corporate Governance Code, and is the Audit Committee financial expert for SEC purposes.
During the course of the year, the Committee held separate sessions with the internal and external audit teams, without members of the executive management present. For details of how the Committee was run, see page 87.
The Committee undertakes an annual review of its effectiveness, the review forming part of the Board evaluation process with Directors being asked to complete parts of the questionnaire relating to the Committees of which they were members. The findings of the review were considered by the Committee at its January 2021 meeting. On the basis of the evaluation, the feedback was that the performance of the Committee continues to be effective.
While the Committee’s membership comprises the Non-Executive Directors noted on page 86, all Non-Executive Directors may attend meetings as agreed with the Chair of the Committee. The Group Financial Controller, Chief Internal Auditor, the external auditor, the Group Chief Executive, the Chief Financial Officer and the Chief Risk Officer also attend meetings as appropriate. Details of Committee membership and meeting attendance can be found on page 86.
Q&A WITH SARAH LEGG, CHAIR OF AUDIT COMMITTEE
Q. How has the work of the Audit Committee (the 'Committee') supported the Group’s response to the pandemic?Having effective controls is invaluable in times such as these, ensuring we mitigate the impacts of the pandemic wherever it’s possible to do so. The Committee’s work in this regard has therefore been particularly important. This, along with our review of the implications of the pandemic from a disclosure perspective, have been key contributions to the considerable Group wide efforts to respond to the crisis.
Q. What have been the other significant challenges the Committee has faced this year?The Committee has spent a significant amount of time considering the key judgements in respect of financial reporting matters, including economic assumptions. Our oversight of the control environment and the Group’s internal and external auditors has had the added challenge of remote working, where the response has been both agile and adaptive. The Committee has continued to oversee the transition from our existing external auditor to our new external auditors, Deloitte, with focus on the 2021 audit plan in support of a smooth transition.
Q. What do you see as the Committee’s key priorities and challenges in the coming year?Assessing the ongoing impact of the pandemic on the Group’s reporting and controls will, of course, continue to be a priority in 2021. In addition to the Committee’s standing obligations, I expect there to be increased focus on the evolving areas of climate-related disclosures and audit reform. Continuous improvement in our ability to report in an agile and well-controlled manner will also be a priority.
Key activities in 2020
Responding to the pandemic, including assessing its impact on loan loss provisions, and other key aspects of the Group’s financial reporting.
Ensuring the effectiveness of the Group’s internal control systems, and of the Group’s Internal Audit function, key in delivering the Group’s strategic priorities.
Overseeing the important relationship with the Group’s external auditor, and ensuring a smooth transition to our new external auditor, Deloitte.
IntroductionI am pleased to report, for the first time since assuming the role of Chair of the Audit Committee, on how the Committee has discharged its responsibilities during what has and continues to be very challenging times. I assumed the role of Chair of the Committee in October 2020, following a comprehensive handover of responsibilities from Simon

102 Lloyds Banking Group Annual Report and Accounts 2020
Activities for the yearKey issues Committee review and conclusion
Allowance for impairment on loans and advances
The Group’s impairment provision is dependent on management’s judgements on matters such as future interest rates, house prices and unemployment rates, as well as its assessment of a customer’s current financial position and whether the exposure has suffered a significant increase in credit risk.
The allowance for impairment losses on loans and advances to customers at 31 December 2020 was £5,760 million (2019: £3,259 million).
During the year, the Committee has challenged both the level of provision held by the Group, and the judgements and estimates used to calculate the provision.
The Committee has regularly reviewed management’s allocation of exposures between different stages and considered the appropriateness of the indicators for a significant increase in credit risk, particularly where customers have been granted a payment holiday.
The Committee has also reviewed the economic assumptions used to calculate the impairment allowance as it has been updated during the year to reflect the Group’s expectations of the impact of COVID-19 as the pandemic has evolved. It has reviewed the adjustments made by management to the output from the models to confirm the adjustments were appropriate and had been properly calculated.
Conclusion: The Committee was satisfied that the impairment provision and associated disclosures, including those recommended by the Taskforce on Disclosures about Expected Credit Losses, were appropriate. The disclosures relating to impairment provision are set out in note 18: ‘Financial assets at amortised cost' and note 51: ‘Financial risk management’ of the financial statements.
Conduct risk provisions
Management judgement is used to determine the population likely to be impacted by conduct risk matters, the cost of remediation and, where appropriate, any related administration costs.
During 2020, the Group made provisions of £464 million (2019: £2,895 million), including £85 million for PPI (2019: £2,450 million).
In relation to PPI, the Committee has continued to receive regular updates on the progress being made processing the customer information requests received before the industry deadline in 2019. These have included operational updates given the coronavirus pandemic, and an assessment of the continuing adequacy of the provision held.
In respect of other conduct related matters, the Committee reviewed updates on the actions being undertaken and the estimated cost to resolve the issues.
Conclusion: The Committee was satisfied with the adequacy of the provisions held at 31 December 2020 for conduct related issues; the related disclosures are set out in note 36.
Going concern and viability statement
The Directors are required to confirm whether they have a reasonable expectation that the Company and the Group will be able to continue to operate and meet their liabilities as they fall due for a specified period.
The viability statement must also disclose the basis for the Directors’ conclusions and explain why the period chosen is appropriate.
The Committee assisted the Board in determining the appropriateness of adopting the going concern basis of accounting and in performing the assessment of the viability of the Company and the Group. These assessments were based on the Group’s operating plan which considered the implications of the COVID-19 pandemic on the Group’s performance, projected funding and capital position. The Committee also took into account the results of the Group’s stress testing activities and the principal and emerging risks, which are set out on pages 152 to 153, page 57 and pages 147 to 149 respectively.
Conclusion: The Committee determined that the going concern basis of accounting was appropriate, advised the Board that three years was a suitable period of review for the viability statement, and that the viability statement could be provided. The viability statement is disclosed within the Directors’ report on pages 112 to 113.
Recoverability of deferred tax assets
A deferred tax asset can be recognised only to the extent that it is more likely than not to be recoverable. The recoverability of the deferred tax asset in respect of carry forward losses requires consideration of the future levels of the Group’s taxable profit and the legal entities in which the profit will arise.
The Group’s net deferred tax asset at 31 December 2020 was £2,696 million (31 December 2019: £2,622 million).
The Committee has reviewed management’s assessment of forecast taxable profits based on the Group’s operating plan, the split of these forecasts by legal entity, and the Group’s long-term financial and strategic plans. Management’s forecasts included estimates of both the immediate impact on the economy of the COVID-19 pandemic and the subsequent economic recovery.
Conclusion: The Committee agreed with management’s judgement that the deferred tax assets were appropriately supported by forecast taxable profits, taking into account the Group’s long-term financial and strategic plans. The disclosures relating to deferred tax are set out in note 35: ‘Deferred tax’ of the financial statements.
Uncertain tax provisions
The Group has open tax matters which require it to make judgements about the most likely outcome for the purposes of calculating its tax position.
The Committee reviewed management’s assessment of the Group’s uncertain tax positions, which took into account the views of the relevant tax authorities and any external advice it received. In particular, it considered the Group’s claim for group relief of losses incurred in its former Irish banking subsidiary.
Conclusion: The Committee was satisfied that the provisions and disclosures made in respect of uncertain tax positions were appropriate. The relevant disclosures are set out in note 46: ‘Contingent liabilities, commitments and guarantees’ of the financial statements.
Financial ReportingDuring the year, the Committee has spent a significant amount of time discussing the financial reporting implications of the COVID-19 pandemic, and in particular its impact upon the Group’s loan loss provisions, the fair value of its financial instruments and the assessment of the carrying value of its deferred tax asset, goodwill and other intangible assets. These are discussed below in more detail, together with other key issues which have impacted the Group’s financial statements in 2020.
Audit Committee report continued

Strategic rep
ortFinancial results
Governance
Risk manag
ement
Financial statements
Other inform
ationStrateg
ic report
Governance
Risk manag
ement
Financial statements
Other inform
ation Lloyds Banking Group Annual Report and Accounts 2020 103
Key issues Committee review and conclusion
Retirement benefit obligations
The value of the Group’s defined benefit pension plan obligations is determined by making financial and demographic assumptions, both of which are significant estimates made by management.
The defined benefit obligation at 31 December 2020 was £49,549 million (31 December 2019: £45,241 million).
The Committee reviewed the process used by management to determine appropriate assumptions to calculate the Group’s defined benefit liabilities. During 2020, these included the discount rate, the future rate of inflation and expected mortality rates. In addition, the Committee considered management’s assessment of the impact of the UK Statistics Authority’s consultation on changes to Retail Price Index on the Group’s retirement benefit obligations.
Conclusion: The Committee was satisfied that management had used appropriate assumptions that reflected the Group’s most recent experience and were consistent with market data and other information.
The Committee was also satisfied that the Group’s disclosures made in respect of retirement benefit obligations are appropriate. The relevant disclosures are set out in note 34: ‘Retirement benefit obligations’ of the financial statements.
Value-In-Force (VIF) asset and insurance liabilities
Determining the value of the VIF asset and insurance liabilities requires management to make significant estimates for both economic and non-economic actuarial assumptions.
At 31 December 2020, the Group’s VIF asset was £5,617 million (2019: £5,558 million) and its liabilities arising from insurance contracts and participating investment contracts were £116,060 million (2019: £111,449 million).
The Committee considered updates from management and from the Group’s Insurance Audit Committee summarising its activities, which included a review of the economic and non-economic assumptions made by management to determine the Group’s VIF asset and insurance liabilities. The most significant assumptions were in respect of workplace pension persistency, annuitant longevity, and expenses.
Conclusion: The Committee was satisfied that the assumptions used to calculate the VIF asset and liabilities arising from insurance contracts and participating investment contracts were appropriate. The disclosures are set out in notes 23 and 30.
Balance Sheet Substantiation and Control
Focus within the Group remains on operating a strong Financial Control Framework, ensuring that appropriate controls are in place. Balance sheet substantiation forms a key component of this framework, with regular reporting to Senior Management on its effectiveness. Where control issues do arise, they are addressed appropriately.
Balance Sheet Substantiation and Control forms part of the Group’s wider risk management process, detailed on pages 144 to 204.
Regular updates are given to the Committee on the status of key balance sheet substantiation metrics and key control issues.
During the year the Committee reviewed key balance sheet substantiation metrics, covering ownership of general ledger balances, reconciliation, and independent quality review status. The Committee noted the improvement in these metrics over the last few years. The Committee also considered a summary of a small number of specific key control matters, including remediation thereof.
Consideration was given to the Group’s approach to financial control, which has been enhanced in the year due to the rollout of a number of thematic initiatives. This review of the Group’s Financial Control and Reporting Framework focused on areas such as data and metrics, basis of substantiation, End User Computing and manual workarounds, 3rd party and non-finance reconciliation activity.
Conclusion: The Committee was satisfied with the approach to Balance Sheet Substantiation and Control.

104 Lloyds Banking Group Annual Report and Accounts 2020
Other significant issuesThe following matters were also considered by the Committee.
Risk management and internal control systemsFull details of the internal control and risk management systems in relation to the financial reporting process are given within the risk management section on pages 144 to 204. Specific related matters that the Committee considered for the year included:
The effectiveness of systems for internal control, financial reporting and risk management
The extent of the work undertaken by the Finance teams across the Group to ensure that the control environment continued to operate effectively
The major findings of internal investigations into control weaknesses, fraud or misconduct and management’s response along with any control deficiencies identified through the assessment of the effectiveness of the internal controls over financial reporting under the US Sarbanes-Oxley Act
The Committee was satisfied that internal controls over financial reporting were appropriately designed and operating effectively.
Risk-weighted assets (RWA) and regulatory reportingIn 2019, the Committee commissioned work to commence on external RWA Assurance and a programme of agreed internal second and third line activity. In addition to this, following the industry wide Dear CEO letter on Regulatory Reporting, management also commissioned a programme to review and strengthen the quality of Regulatory Reporting across the Group. Management provided regular updates to the Committee over the year. These highlighted the progress made in both the development of a principles based framework and improvements in the reporting control environment across a number of regulatory reports.
Group Internal Audit In monitoring the activity, role and effectiveness of the internal audit function and their audit programme the Committee:
Monitored the effectiveness of Group Internal Audit and their audit programme through quarterly reports on the activities undertaken and a report from the Quality Assurance function within Group Internal Audit
Considered the major findings of significant internal audits, and management’s response
Monitored the progress of internal audit’s coverage of key risk themes across the Group, including Delivery of Strategic Change, Cyber & Information Security, Data Management, Operational Resilience, Third Party Management and Credit Risk Management
Approved the annual audit plan and budget, including resource and reviewed progress against the plan through the year
Assessed Group Internal Audit’s resources and skills (supplemented by externally sourced subject matter experts as required) as adequate to fulfil its mandate. Group Internal Audit reports on its detailed internal skills assessment including on the availability of specialist skills. The Group Internal Audit Quality Assurance function separately reports to the Committee giving a view on the adequacy of Group Internal Audit resource and skills.
Monitored and assessed the independence of Group Internal Audit
Speak Up (the Group’s whistleblowing service)The Committee received and considered reports from management on the Group’s whistleblowing arrangements.
The Committee reviewed the reports to ensure there are arrangements in place which colleagues can use in confidence to report concerns about inappropriate and unacceptable practices, and that there is proportionate and independent investigation of such matters or appropriate follow up.
The Committee reported on its consideration of whistleblowing arrangements to the Board. The Committee also continued to operate an interim sub-committee to consider whistleblowing cases where allegations relate to Material Risk Takers or Senior Managers, and to oversee improvements being made to the Group’s whistleblowing arrangements.
Auditor independence and remunerationBoth the Board and the external auditor have policies and procedures designed to protect the independence and objectivity of the external auditor. In January 2020, the Committee amended its non-audit service policy (the Policy) to reflect changes to the FRC’s rules on auditor independence and to require Deloitte, who will be appointed as the Group’s auditors during 2021, to comply with the Policy.
In addition to detailing those services that the Committee prohibits the external auditor from providing to the Group, the Policy pre-approves certain services provided the fee is below a threshold; all other permitted services must be specifically approved in advance by the Committee. The Policy will be reviewed again in April 2021. Prior to engagement of the auditor for a permitted service, the Policy requires that senior management confirms whether the Committee has pre-approved the service or specific approval is required. The total amount of fees paid to the auditor for both audit and non-audit related services in 2020 and further information on the Policy is disclosed in note 12 to the financial statements.
External auditorPricewaterhouseCoopers (PwC) has been the auditor of the Company and the Group since 1995, and in accordance with legal and regulatory requirements, will be resigning as auditor following completion of the audit for the year ended 31 December 2020. Following a tender process in 2018, the Committee recommended to the Board that Deloitte be appointed as the Group’s auditor for the financial year beginning on 1 January 2021.
The Committee received confirmation from Deloitte that it was independent of the Group as at 1 January 2020 and, as a result, Deloitte was able to commence its planning activities in the first half of 2020. During the year, regular meetings have been held with Deloitte’s audit engagement team to assist in its development of the 2021 external audit plan. The Committee has recommended to the Board that Deloitte be recommended for appointment at the forthcoming Annual General Meeting.
The Committee oversees the relationship with the external auditor including its terms of engagement and remuneration, and monitors its independence and objectivity; PwC was the Group’s auditor for the year ended 31 December 2020. Mark Hannam has been PwC’s senior statutory audit partner for the Group and the Company since the beginning of 2016, and attends all meetings of the Committee. During 2020, the Committee reviewed PwC’s audit plan, including the underlying methodology, and PwC’s risk identification processes. In its assessment of PwC’s performance and effectiveness, the Committee has considered: PwC’s interactions with the Committee; the responses to a questionnaire issued to the Group’s businesses, Finance, Risk and Internal Audit; and the Financial Reporting Council’s (FRC) Audit Quality Inspection Report published in July 2020. In addition, the FRC’s Audit Quality Review team reviewed PwC’s audit of the Group’s 2019 financial statements as part of its latest annual inspection of audit firms. The Committee received a copy of the findings and discussed them with PwC. While there were no significant findings, some areas of PwC’s audit procedures were identified as needing limited improvements only. The Committee concluded that it was satisfied with the auditor’s performance.
Statutory Audit Services compliance The Company and the Group confirm compliance with the provisions of The Statutory Audit Services for Large Companies Market Investigation (Mandatory Use of Competitive Tender Processes and Audit Committee Responsibilities) Order 2014 for the year to 31 December 2020.
Subject to shareholder approval, Deloitte will undertake the audit of the Company and the Group for the year ended 31 December 2021. There are no plans as at the date of this report to conduct a tender exercise for external audit services.
Audit Committee report continued

Strategic rep
ortFinancial results
Governance
Risk manag
ement
Financial statements
Other inform
ationStrateg
ic report
Governance
Risk manag
ement
Financial statements
Other inform
ation Lloyds Banking Group Annual Report and Accounts 2020 105
Key activities in 2020
Considering the impacts of the pandemic on credit quality and customers in financial difficulty
Focusing on the operational resilience of the Group and strengthening of the Group’s control environment
Reviewing the Group’s response to the heightened People risks, and colleague impacts, of the pandemic
Continued focus on the Group’s management of customer rectifications and complaints
Board Risk Committee report
Making the right decisions and doing the right things for customers
IntroductionI was delighted to take on the role of Chair of the Committee with effect from 1 January 2021, and am pleased to report on how the Committee has discharged its responsibilities throughout 2020.
The past year has been unprecedented with the impacts of the pandemic being felt by all. The Group, and the Committee, have responded to the additional challenges which this has driven, taking actions to mitigate the impacts for the Group, and its customers, wherever possible. These areas, together with the impacts of EU exit, will continue to be a key focus for the Committee in the near term.
I would also like to place on record my thanks to Alan Dickinson and Nick Prettejohn for their chairmanship of the Committee, particularly during what has been an unprecedented year, and for the support provided during the transition of the Chair role.
Committee purpose and responsibilitiesThe overriding purpose of the Committee is to assist the Group's Board in fulfilling its risk governance and oversight roles and responsibilities. The Committee is also responsible for ensuring the risk culture is fully embedded and supports at all times the Group’s agreed risk appetite, covering the extent and categories of risk which the Board considers as acceptable for the Group.
In seeking to achieve this, the Committee is responsible for reviewing and reporting its conclusions to the Board on the Group’s risk management framework, which embraces risk principles, policies, methodologies, systems, processes, procedures and people. It also includes the review of new, or material amendments to risk principles and policies, and overseeing any action resulting from material breaches of such policy.
More details on the Group’s wider approach to risk management can be found in the risk management section on pages 143 to 204. Full details of the Committee’s responsibilities are set out in its terms of reference, which can
be found at https://www.lloydsbankinggroup.com/who-we-are/group-overview/corporate-governance.html
Committee composition, skills, experience and operationThe Committee is composed of Non-Executive Directors, who provide core banking and risk knowledge, together with breadth of experience which brings knowledge from other sectors, and a clear awareness of the importance of putting the customer at the centre of all that the Group does.
All Non-Executive Directors are members of the Committee, and the three designated independent Non-Executive Directors of the Ring-Fenced Banks also attend. The Chief Risk Officer has full access to the Committee and attends all meetings. The Chief Internal Auditor and members of the executive also attend meetings, as appropriate.
The Committee undertakes an annual effectiveness review. This review forms part of the Board Evaluation process with Directors being asked to complete parts of the questionnaire relating to the Committees of which they were members. The findings of the review were considered by the Committee at its January 2021 meeting. On the basis of the evaluation, the feedback was that the performance of the Committee continues to be effective. Details of Committee membership and meeting attendance can be found on page 86.
As the most senior risk committee in the Group, the Committee interacts with other related risk committees, including the executive Group Risk Committee. These interactions assist with the agenda planning process, where matters considered by the Group Risk Committee are reviewed to ensure escalation of all relevant matters to the Committee.
Q&A WITH CATHERINE WOODS, CHAIR OF BOARD RISK COMMITTEE
Q. How has the Board Risk Committee (the ‘Committee’) responded to the additional challenges faced during 2020 arising from the pandemic? A. As identified in the following pages, the Committee has considered the impacts of the pandemic on the existing risk profile, and reviewed actions taken by management to mitigate. The most significant areas have included the financial impacts for our customers, the wellbeing and resilience of our colleagues, and ensuring their ability to continue to safely help and support our customers.
Q. How is the Committee addressing risks associated with climate change which the Group will face? A. Climate change is a top issue for the Group and the Committee. The Committee continues to increase its focus on climate risk, ensuring that the Group’s risk management capabilities are developed at pace. This helps ensure a proactive response overall, and allows the Committee to closely monitor impacts for both the Group and its customers, together with delivery of climate change commitments by the Group.
Q. What are the key areas of focus for the Committee in 2021?A. The Committee will continue to consider the following important areas:
Broader impacts of the pandemic on the Group’s risk profile.
Macroeconomic factors including the impact from the UK’s exit from the EU.
The treatment of customers in financial difficulty where increased focus is required.
The management of Cyber and Technology risks.
The strengthening of the Group’s risk culture and control environment.
Effective control of Change and Execution risk.
Management of strategic and emerging risks for the Group in support of the Group’s strategic aims.
The Committee continues to closely monitor emerging risks, including those impacted by the pandemic, and the potential impacts for both the Group and its customers
Catherine Woods Chair, Board Risk Committee

106 Lloyds Banking Group Annual Report and Accounts 2020
Activities during the yearKey issues Committee review and conclusion
Conduct Risk
Customers in Financial Difficulty (CiFD)
The Group’s management of conduct risks, plus issues associated with customers in financial difficulty and customer vulnerability.
During 2020, the Committee has considered reports on the ongoing activity to improve the way we support customers experiencing financial difficulties as well as the heightened risks the increased volume of these customers are facing as a result of the pandemic. The Committee also recognises the importance of the Group’s strategy for both customers in financial difficulty and recently bereaved customers, in delivering good outcomes for those most vulnerable, against a backdrop of continued regulatory focus.
Frequent reviews have allowed the Committee to assess the plans to support customers in need with easy access to payment holidays and improved self-support and digital journeys. The Committee has assessed the risks of introducing strategic changes such as a new vulnerable customer strategy and new treatments and toolkits while recruiting and training new colleagues to meet increased collections demand. Regular monitoring of the key changes have been reviewed by the Committee ensuring that focus is maintained on how changes are improving customer outcomes.
Conclusion: While the Committee has observed that considerable changes have been made to improve the treatment of customers in financial difficulty, there will be increased emphasis throughout 2021 to enhance and improve customer outcomes.
Rectifications The Group’s management of customer rectifications.
Throughout 2020 the Committee has considered updates on the Group’s rectifications portfolio performance, with particular interest in reducing the number of customers awaiting remediation. The Committee has noted continued progress in the pace and quality of remediations, delivering a reduction in the number of customers awaiting redress and improvements in customer outcomes. The Committee has also noted that prioritisation principles were agreed and implemented to reflect the impacts of the pandemic during the year.
The Committee has also remained close to progress on material rectifications, including implementation of the recommendations in the Cranston report, arising from the review of the Group’s management of the HBOS Reading incident.
Conclusion: Root cause analysis and read-across activity continues to improve and embed across the Group. This will remain a key focus for the Committee in 2021, along with rectifications impacted by the pandemic.
Complaints Ensuring the Group is resolving customer complaints in a timely and fair manner and eradicating the causes for complaints through root cause analysis.
The Committee continues to focus on ensuring the Group has an effective framework for managing complaints including root cause analysis to establish lessons learned and help prevent similar issues in the future.
Conclusion: The Committee is satisfied with the good progress made by the Group in reducing the causes for customer complaints, and work is underway to address the impacts the pandemic has had on the Group’s ability to resolve complaints as efficiently as possible.
Climate Risk
Climate risk Climate change, sustainability and the impact to the Group and on our customers.
Climate change and sustainability are established top issues for the Group, elevating climate risk to a principal risk type in 2020.
Following its specific request, the Committee considered regular detailed updates regarding the Group’s climate risk management and key developments. The Group is committed to delivering the Task Force on Climate-related Financial Disclosures (TCFD) recommendations and is working to ensure compliance with regulatory expectations by end 2021, as well as wider stakeholder requirements. Accordingly, the Committee continues to ensure that the Group’s risk management capabilities are developing at pace, and that it is adopting a proactive response to the challenges, risks and opportunities arising from climate change.
Conclusion: The Committee is satisfied with the progress made in 2020. The Committee will continue to closely monitor climate change and sustainability risks, looking at the impact on both the Group and our customers, and the delivery of TCFD and other commitments.
Matters considered by the CommitteeOver the course of the year the Committee considered a wide range of risks facing the Group, both standing and emerging, across all key areas of risk management, in addition to risk culture and risk appetite, as noted on the previous page.
As part of this review, certain risks were identified which required further detailed
consideration, not least of which were the impacts of the pandemic. Set out below and on the following pages is a summary of these risks, with an outline of the material factors considered by the Committee, and the conclusions which were ultimately reached.
During 2020, the Committee continued to use established sub-committees and fora to provide additional focus on areas such as IT resilience and cyber, and stress testing and recovery planning. These sub-committees
and fora enable members of the Committee to dedicate additional time and resource to achieving a more in-depth understanding of the topics covered, and enable further review and challenge of the associated risks. The Committee also reviewed regular updates from the Non Ring-Fenced Bank and Insurance sub-groups, headed up by Lloyds Bank Corporate Markets plc and Scottish Widows Group Limited respectively, summarising key discussions and decisions taken at the relevant entities’ risk committees.
Board Risk Committee report continued

Strategic rep
ortFinancial results
Governance
Risk manag
ement
Financial statements
Other inform
ationStrateg
ic report
Governance
Risk manag
ement
Financial statements
Other inform
ation Lloyds Banking Group Annual Report and Accounts 2020 107
Key issues Committee review and conclusion
Financial Risks – covering credit and market risk
Commercial credit quality
Risks and external threats to the Commercial credit portfolio performance, including pandemic related impacts, together with sectors potentially exposed to the impact of EU exit and climate risks.
The Committee provided oversight of the Commercial portfolios via regular credit quality papers, sector deep dives, spotlight reviews and additional pandemic and climate risk updates.
Detailed reviews allowed the Committee to assess risk levels and credit exposures, including increased pandemic related lending and Government-backed funding granted, as well as levels of downgrades and clients requiring closer management via Watchlist or Business Support Unit; noting that pandemic related liquidity and support schemes are likely to be masking true underlying risk. The Committee noted that defaults are expected to increase as support schemes unwind.
The Committee reviewed pandemic impacts and emerging risks across a range of sectors considered more vulnerable, including non-essential retail, passenger transport, travel agents and hotels. Other sector concentrations also considered were automotives and commercial real estate (including Office and Retail commercial real estate), sectors also impacted by the pandemic and structural changes. Sectors potentially exposed to the impacts of the UK’s exit from the EU have been identified with credit appetite being adjusted where appropriate.
Conclusion: Proactive risk management and close monitoring continues, with consideration given to the macroeconomic outlook, and evolving climate risks and opportunities. While recognising the risks in the portfolio, the Committee were satisfied that management were continuing to take appropriate action to mitigate and address risks, while preparing to manage a substantial increase in defaults and clients requiring additional support.
Retail credit quality
Risks relating to retail lending, including impacts of the pandemic. Areas such as Retail Secured lending, Buy-to-Let, Motor, Business Banking and Unsecured portfolios, together with customer indebtedness.
Attention focused on lending controls, risk appetite monitoring, and new lending quality across Retail portfolios.
Credit performance remained in appetite as economic impacts of the pandemic were mitigated through Government support and payment holidays. The Committee noted that withdrawal of these exceptional levels of support was expected to lead to rising arrears in 2021, and that management had meanwhile taken extensive action to prepare for future risk emergence, while continuing to ensure provision of credit to the economy. The Group continued to closely monitor and manage higher risk segments such as customers on payment breaks, those with reduced incomes due to the pandemic, and those with higher levels of indebtedness.
Owing to guarantees, direct financial risk posed by the Group’s active support for Bounce Back Loans and Coronavirus Business Interruption Loans was considered manageable, however customer support and management of future defaults were flagged as future potential issues. The Committee fully appreciates the Group will take appropriate steps to ensure repayment of loans from customers.
General economic impacts arising through the UK’s exit from the EU will be addressed through broad based risk appetite controls, as used successfully through the pandemic. Where exposures may be at risk through legal uncertainty, additional appetite and lending controls will also be in place.
Conclusion: The Committee was satisfied that appropriate lending controls and monitoring were in place to control risks across the Retail lending portfolios, and that actions taken to manage economic risks were proportionate.
Operational Risk
One RCSA implementation
One Risk and Control Self-Assessment (One RCSA) is part of the Group’s Risk and Control Strategy to deliver a stronger risk culture and simplified risk and control environment.
The three lines of defence have worked together to identify improvements to the Group’s approach to risk management. Following pilot activity, this new approach (One RCSA) is being adopted across the Group through a phased plan. The Committee supports the revised approach, the required cultural change to ensure successful adoption, as well as the Group’s plans for implementation. In light of the pandemic, the Committee gave direction to continue with the implementation, while recognising that potential pressures on key business resource may require adjustments to the plan.
Conclusion: All aspects of the 2020 plan for One RCSA have been delivered. The Committee supports the 2021 plans for capturing the remaining highest risks to customers and the business, and will continue to review progress on embedding the cultural change and improving the risk and control environment.
Operational resilience
Operational resilience is one of the Group’s most important non-financial risks, as exemplified during the pandemic.
A key focus for the Group in 2020 has been to manage the resilience risks from the pandemic as well as enhancing the existing approach to operational resilience and strengthening the control environment, improving the Group’s ability to respond to incidents, and to continue delivering key services to our customers. Multiple updates were presented to the Committee relating to the impact of the pandemic covering operational impacts, cyber, fraud and sourcing. Given the significance of the risk to the Group, the Committee is supported by the IT and Cyber Advisory Forum specifically focused on IT and cyber risks.
Conclusion: The Committee takes the operational resilience of the Group’s services very seriously and has drawn valuable insight from the discussions this year. The Committee considers that governance of operational resilience risk is robust and that activities in plan will ensure the ongoing resilience of key services to the Group’s customers.

108 Lloyds Banking Group Annual Report and Accounts 2020
Key issues Committee review and conclusion
Data risk Data governance, privacy and data ethics risks including oversight of the Group’s compliance with the General Data Protection Regulation (GDPR), Basel Committee of Banking Supervision (BCBS) and the associated risks and controls.
Data risk continues to be an area of significant regulatory and media attention. The Group has developed a data management strategy to provide the common framework and direction required to improve data management across the Group. The Committee is supportive of this strategy which includes uplifting data quality, simplifying data architecture and enhancing data governance, in order to mature data capability and deliver a data-first culture, facilitated by a simplified modern IT architecture. The Committee acknowledges the need for continued investment in managing risks relating to the ethical use of data, in particular, advanced analytics and artificial intelligence together with continued monitoring of regulatory developments.
Conclusion: The Group successfully implemented the 2020 Data Risk and Control Library as part of the One RCSA programme and continues to develop risk metrics to ensure that data risks are managed within appetite. The Committee supports the 2021 strategy of uplifting data capability in order to deliver the digital Bank of the Future.
People risk Ensuring the Group has the right capabilities and culture as we continue to build the Bank of the Future.
Throughout 2020, there has been heightened attention on the People risk profile in view of the longevity of the pandemic and the impacts on colleagues. The Group recognises the increased demands and outside pressures on colleagues, as a result of the pandemic, and there has been significant focus on colleague wellbeing and resilience in light of prolonged periods of home working. Particular consideration is given to critical populations and high performing individuals to support the Group’s core commitments and the retention risk of certain groups of SMEs is being closely monitored. A strategy for Reimagined ways of working is being developed, and the Committee will continue to oversee these developments, monitoring closely the impacts on colleague sentiment and engagement.
Conclusion: The Committee is satisfied that the People risk profile is being managed effectively. The Committee ensures the necessary risk oversight as the Group manages the impact of the pandemic, monitors retention, develops new ways of working and develops plans to build the right skills and capabilities for the future.
Change and execution risk
Risks associated with the extensive current and future Group strategic change agenda, recognising challenges faced in ensuring both successful delivery and embedding of change.
The Group has further matured its ability to define, measure and report execution risk. The articulation and quantification of this risk continues to be managed through consolidated reporting of the execution risk dashboard and its related Board Risk Appetite Metrics, as well as through the implementation of the change and execution risk and control library across the Group. The Committee considers change and execution risk management within other linked risk types, such as operational resilience and supplier risks; and when investment activities are discussed. A focus this year has been effective and efficient reprioritisation of change activity during the pandemic, where execution risks were proactively managed and enhanced control monitoring was put in place. This ensured safe, prioritised change activity in 2020.
Conclusion: Change and execution risk has been managed within appetite and will remain an area of attention for the Committee as the Group moves into its next phase of strategic change.
As the Group further evolves its change delivery approach, control of these risks will continue to mature, particularly as risk libraries embed within business areas. The Committee will further consider the interconnectedness of change risk appetite with areas such as technology risk, supplier risk and operational resilience to support strategic change activities.
EU Exit planning/preparedness
The uncertainty regarding the practical implications could affect the outlook for the UK and global economy.
The key risks for the Group, including volatility and possible discontinuities in financial markets, impact on our customers’ trading performance, financial position and credit profile, and ability to continue to operate in line with current practice across borders, have continued to be closely monitored. When reviewing the possible impacts, while noting the Group’s strong UK focus and UK-centric strategy, the Committee has given particular consideration to the treatment of its EU based clients and customers where continuity of certain aspects of its business has not been permitted.
Conclusion: The UK’s ongoing negotiations, the Group’s EU exit contingency plans and risk mitigation responses have been closely monitored by the Committee via specific regular updates, covering both operational status and external developments.
Fraud The Group’s management of fraud risk, while minimising the impact of controls on genuine customer journeys.
The Committee considered the challenging and evolving nature of the fraud risk environment influenced by factors such as the pandemic, Government-backed lending schemes and the continuing growth of Authorised Push Payment (APP) scams.
The Committee acknowledged that the Group reduced its market share of fraud, measured against published industry numbers. With regards to the Government-backed lending schemes, the Committee takes the Group’s responsibilities with respect to fraud detection very seriously, and noted that fraud within these lending schemes was within risk appetite and aligned with market share. The Committee acknowledged the continued investment in fraud defences and tools, and the work being done with industry bodies to reduce the impact of fraud on customers.
Conclusion: The Committee noted the positive work undertaken in the detection and prevention of fraud. The Group’s continuous efforts to recognise and protect genuine customer journeys was acknowledged, as was its strategic plans to reflect the comprehensive nature of the challenge, that requires both internal evolution and external engagement.
Board Risk Committee report continued

Strategic rep
ortFinancial results
Governance
Risk manag
ement
Financial statements
Other inform
ationStrateg
ic report
Governance
Risk manag
ement
Financial statements
Other inform
ation Lloyds Banking Group Annual Report and Accounts 2020 109
Key issues Committee review and conclusion
Money laundering and financial crime
The Group’s management of financial crime risk considering continuous legislative change and regulatory scrutiny.
The Committee acknowledged the Group’s continued efforts to fight financial crime and to develop its intelligence capability to ensure that the programme is intelligence-led.
The Committee considered the Group’s response to several high-profile industry money laundering events such as allegations of money laundering through Baltic banks and the leak of Financial Crimes Enforcement Network (FinCEN) files and was provided assurance that the Group’s risk exposure was very low. Finally, the Committee acknowledged the contributions being made by the Group to the UK Government’s Economic Crime Reform Programme.
Conclusion: The Committee noted satisfaction with the standard of compliance documented in the Money Laundering Reporting Officer report and acknowledged the action plans in place across the Group to further enhance the Group’s position. The Committee noted the conclusion of the investigations into Baltic money laundering and FinCEN files.
Other Risk Categories
Regulatory and legal risk
Managing regulatory risk within the Group with a significant amount of highly complex and interdependent regulatory interactions managed during 2020, which will continue to require management into 2021. This is in addition to continuing to fulfil regulatory obligations against a backdrop of industry wide challenges faced as a result of the pandemic and EU exit.
The Committee has provided effective oversight and ensured effective controls are in place to comply with existing regulatory obligations, including greater consideration of these at an individual legal entity level. The Committee considered regular updates on emerging regulatory and legal risks and continued to closely monitor a number of significant regulatory change and oversight programmes to ensure successful execution such as IBOR Transition, CRDIV, BCBS 239, EU exit and customers in financial difficulty. In addition, the Committee has focused on understanding and oversighting activities undertaken by the Group in response to the pandemic and EU exit.
Conclusion: The Group places significant focus on complex regulatory changes, as well as ensuring effective horizon scanning of upcoming trends and evolving risks. The Committee has discussed the topics raised, and will continue to closely monitor compliance with regulatory requirements, including ring-fencing, in 2021. Regulatory risk will remain a priority area of focus for the Committee in 2021.
Emerging and strategic risk categories
Significance to the Group of strategic risk, strategic choices and ability to effectively respond to material changes in internal and external factors.
Strategic and emerging risks are significant sources of risk to the Group. The Committee recognised this in 2019, elevating strategic risk to a principal risk type. Work has continued through 2020 to refine the Group’s definitions and enhance the framework for managing strategic and emerging risk. This will continue to be an area of focus in 2021.
The unprecedented events of 2020 have highlighted interconnectivity as a key factor in the acceleration or amplification of risks. The Committee has considered this, together with emerging trends influencing our strategic themes and potential consequences of the Group’s strategic decisions.
The Committee discussed the evolution of risks under the latest strategy refresh and considered key strategic risk drivers, identified by business leaders as being especially pertinent, warranting the Committee’s attention. The Committee noted the key findings from the review of strategic and emerging risk and supported the proposals for evolving the Group’s strategic risk management framework.
Conclusion: Managing individual risks, as well as the cumulative challenges of connected risks, will be essential for protecting the Group’s customers, while delivering the Group’s strategic vision. With this in mind, the Committee supported major work commencing in 2021, for incorporating risk connectivity into the Group’s strategic risk management framework.

110 Lloyds Banking Group Annual Report and Accounts 2020
Responsible Business Committee report
Being a responsible business is at the core of our purpose to Help Britain Prosper
Committee purpose and responsibilitiesThe Committee supports the Board in overseeing the Group’s performance as a responsible business by providing oversight of, and support for, the Group’s strategy and plans for embedding responsible business as part of the Group’s purpose to Help Britain Prosper. The Committee provides oversight and challenge on activities which impact the Group’s trust and reputation and by considering and recommending to the Board
for approval the Environmental, Social and Governance (ESG) Report and the Helping Britain Prosper Plan. The Committee’s terms of reference can be found at www.lloydsbankinggroup.com/who-we-are/group-overview/corporate-governance.html
Committee composition, skills, experience and operationThe Committee is composed of Non-Executive Directors ensuring a broad spread of differing perspectives, insight and experience with representatives from Group Internal Audit and the Chief Operating Office attending meetings as appropriate. The Committee met on four occasions in 2020. Details of Committee membership and meeting attendance can be found on page 86.
During the year, the Committee met its key objectives and carried out its responsibilities effectively, as confirmed by the findings of the annual effectiveness review, which were considered by the Committee at its January 2021 meeting.
Key activities in 2020Charitable Foundations: The Group’s independent Charitable Foundations do critical work to tackle disadvantage across the UK and are often the first responders in a crisis. The Committee:
met with Paul Streets, Chief Executive Officer of the Lloyds Bank Foundation for England and Wales, to discuss how the Group’s support for the Charitable Foundations could be magnified at this time
spent time discussing how the Group planned to provide a broader societal response to the pandemic crisis
considered the current work on Digital Skills alongside the Mental Health initiatives as core responses in the crisis phase
Society of the future: The Committee considered the development of our Society of the Future ambitions and the aim to fully integrate the Group’s societal objectives with its business objectives which will be key in the next phase of our Group strategy. Shaping of the Group strategy was a significant area of discussion and debate, with regular updates provided on the direction and the progress of the strategy. The Committee provided insight and challenge to the executive on the strategy and on how the Group could support the recovery and new economic environment.
Sustainability: The Committee provided oversight of the overall approach, progress to date, targets and metrics and provided input and challenge to the team working on the sustainability strategy wanting to understand the methodology more fully and gain confidence in the proposed approach and data.
Q&A WITH SARA WELLER, CHAIR OF RESPONSIBLE BUSINESS COMMITTEE
Q. How do you feel the Group has responded to the unprecedented demands on it during the pandemic?A. The Group moved quickly to support colleagues so that they could work safely to serve customers with emergency loans and repayment holidays to tide them over the very difficult period. That support will continue to be vital as hopefully the situation gradually improves through the year and customers look to put their finances back on an even keel, and plan for the future.
Q. This is your last year chairing the Responsible Business Committee (the 'Committee'). What are your reflections on the last five years?A. Being a responsible business has long been core to the Group’s work, and, since the financial crash a decade or more ago, the Group has renewed its focus on its purpose, to Help Britain Prosper. In this year’s discussions about the Group’s strategic response to the Group’s Society of the Future ambitions, it’s been great to see issues such as Inclusion & Diversity, helping vulnerable customers, responding to climate change and supporting regional growth through SME lending, digital skills provision, and housing investment, being put at the heart of the Group’s plans.
Q, What are the Committee’s priorities for next year?A. The Committee will seek to ensure that the Helping Britain Recover commitments are fully embedded into business plans, that these plans stay flexible to respond to changing needs and that they are actually delivering real impact for the individuals, businesses and communities who need our support the most.
Taken together, the effects of the COVID pandemic and advancing climate change bring fundamental shifts in our economy and society. The Group’s role is more vital than ever, and the Responsible Business Committee will support the Board in developing and overseeing the business’s plans to play its part in Helping Britain Recover.
Sara Weller Chair, Responsible Business Committee
More detailBoard oversight of our accelerated culture journey
Read more on page 92 Race Action plan
Read more on page 25Diversity policy
Read more on page 100
Culture and colleague engagement: The Board and senior management have a vital role to play in shaping and embedding a healthy corporate culture. The Committee received regular updates on colleague engagement and the evolution of the Group’s culture plan, discussing the progress being made in reimagining ways of working and what can be done to support colleagues during the current crisis and what it would take to deliver an enduring solution post COVID.
Inclusion and diversity: The Committee received updates on:
proposed actions to enable the Group to respond to the issues raised by the Black Lives Matter movement, including key insights from our Black colleagues
the development of the Race Action plan, supporting the setting of a 3% target of Black senior leaders by 2025
our aim to have more women in senior roles and the representation of colleagues from Black, Asian and Minority Ethnic backgrounds at all levels
Helping Britain Prosper Plan: Regular updates have been provided on performance against the metrics within the Helping Britain Prosper Plan, on which a report is provided on pages 17 and 20 to 31 and further detail is provided in our 2020 Lloyds Banking Group ESG Report.

Strategic rep
ortFinancial results
Governance
Risk manag
ement
Financial statements
Other inform
ationStrateg
ic report
Governance
Risk manag
ement
Financial statements
Other inform
ation Lloyds Banking Group Annual Report and Accounts 2020 111
Corporate governance statementThe Corporate Governance report found on pages 81 to 110, together with this Directors’ report, of which it forms part, fulfils the requirements of the Corporate Governance Statement for the purpose of the Financial Conduct Authority’s Disclosure Guidance and Transparency Rules (DTR).
Profit and dividendsThe consolidated income statement shows a statutory profit before tax for the year ended 31 December 2020 of £1,226 million (2019 £4,393 million). The Directors have recommended a final dividend for 2020 which is subject to approval by the shareholders at the AGM, of 0.57 pence per share totalling £404 million. The final dividend will be paid on 25 May 2021.
No final dividend was paid in respect of 2019, and no interim dividends have been paid during 2020. Further information on dividends is shown in note 43 on page 291 and is incorporated by reference.
Appointment and retirement of DirectorsThe appointment and retirement of Directors is governed by the Company’s articles of association, the UK Corporate Governance Code 2018 and the Companies Act 2006. The Company’s articles of association may only be amended by a special resolution of the shareholders in a general meeting.
Robin Budenberg has been appointed to the Board since the 2020 AGM and will therefore stand for election at the forthcoming AGM. Sara Weller will retire at the AGM. In the interests of good governance and in accordance with the provisions of the UK Corporate Governance Code 2018, all other Directors will retire, and those wishing to serve again will submit themselves for re-election at the forthcoming AGM.
Biographies of current Directors are set out on pages 82 to 83. Details of the Directors seeking election or re-election at the AGM are set out in the Notice of Meeting.
Board composition changesChanges to the composition of the Board since 1 January 2020 up to the date of this report are shown in the table below:
Joined the Board Left the Board
Catherine Woods 1 March 2020
Anita Frew 21 May 2020
Juan Colombás 18 September 2020
Simon Henry 30 September 2020
Robin Budenberg 1 October 2020
Lord Blackwell 1 January 2021
As announced in December 2020, António Horta-Osório will step down as a Director of the Company and as Group Chief Executive on 30 April 2021, to be succeeded by Charlie Nunn, who will as announced in November 2020, and subject to regulatory approval, join the Group in August 2021 as a Director of the Company and as Group Chief Executive. As announced in January 2021, Sara Weller will retire at the forthcoming AGM.
Directors’ and Officers’ liability insuranceThroughout 2020 the Group had appropriate insurance cover in place to protect Directors, including the Directors who retired during the year and since year end, from liabilities that may arise against them personally in connection with the performance of their role.
As well as insurance cover, the Group agrees to indemnify the Directors to the maximum extent permitted by law. Further information on the Group’s indemnity arrangements is provided in the Directors’ indemnities section.
Capital Requirements (Country-by-Country Reporting)As required under the Capital Requirements (Country-by-Country Reporting) Regulations 2013, the Group’s related disclosures may be found online, at www.lloydsbankinggroup.com/investors/financial-downloads.html
Directors’ indemnitiesThe Directors of the Company, including the former Directors who retired during the year and since year end, have entered into individual deeds of indemnity with the Company which constituted ‘qualifying third-party indemnity provisions’ for the purposes of the Companies Act 2006. The deeds indemnify the Directors to the maximum extent permitted by law and remain in force. The deeds were in force during the whole of the financial year or from the date of appointment in respect of the Director appointed during 2020. Deeds for existing Directors are available for inspection at the Company’s registered office.
The Company has also granted deeds of indemnity by deed poll and by way of entering into individual deeds, which constitute ‘qualifying third-party indemnity provisions’ to the Directors of the Group’s subsidiary companies, including to former Directors who retired during the year and since the year end, and to Group colleagues subject to the provisions of the Senior Managers and Certification Regime. Such deeds were in force during the financial year ended 31 December 2020 and remain in force as at the date of this report.
Qualifying pension scheme indemnities have also been granted to the Trustees of the Group’s Pension Schemes, which were in force for the whole of the financial year and remain in force as at the date of this report.
Change of controlThe Company is not party to any significant agreements which take effect, alter or terminate upon a change of control of the Company following a takeover bid. There are no agreements between the Company and its Directors or employees providing compensation for loss of office or employment that occurs because of a takeover bid.
Power of Directors in relation to sharesThe Board manages the business of the Company under the powers set out in the articles of association, which include the Directors’ ability to issue or buyback shares. The Directors were granted authorities to issue and allot shares and to buyback shares at the 2020 AGM. Shareholders will be asked to renew these authorities at the 2021 AGM. The authority in respect of purchase of the Company’s ordinary shares is limited to 7,044,210,261 ordinary shares, equivalent to 10 per cent of the issued ordinary share capital of the Company as at the latest practicable date prior to publication of the 2020 AGM circular.
Conflicts of interestThe Board has a comprehensive procedure for reviewing, and as permitted by the Companies Act 2006 and the Company’s articles of association, approving actual and potential conflicts of interest.
Directors have a duty to notify the Chair and Group Company Secretary as soon as they become aware of actual or potential conflict situations. Changes to commitments of all Directors are approved by the Board and a register of potential conflicts and time commitments is regularly reviewed and authorised by the Board to ensure the authorisation status remains appropriate.
Lord Lupton is a senior advisor to Greenhill Europe, an investment bank focused on providing financial advice on significant mergers, acquisitions, restructurings, financings and capital raising to corporations, partnerships, institutions and governments. The Board has recognised that potential conflicts may arise as a result of this position. The Board has authorised the potential conflicts and requires Lord Lupton to recuse himself from discussions, should the need arise.
Directors’ report

112 Lloyds Banking Group Annual Report and Accounts 2020
BranchesThe Group provides a wide range of banking and financial services through branches and offices in the UK and overseas.
Research and development activitiesDuring the ordinary course of business the Group develops new products and services within the business units.
Information incorporated by referenceContent Pages
Group results Summary of Group Results 52 to 55
Ordinary dividends Dividends on ordinary shares 291
Directors’ biographies
Board of Directors 82 to 83
Directors in 2020 Board of Directors 82 to 83
Directors’ emoluments
Directors’ remuneration report 115 to 142
Internal control and financial risk management
Financial reporting risk Risk management Financial instruments
145 to 146 144 to 204 298 to 310 314 to 332
Information included in the strategic report
Future developmentsSupporting people with disabilitiesEngagement with colleaguesEngagement with customers, suppliers and others
1 to 59 26 48 46 to 51
Disclosures required under Listing Rule 9.8.4R
Significant contracts 294 to 295
Dividend waivers 291
Principal risks and uncertainties
Funding and liquidity 57 and 183 to 187
Capital position 188 to 196
Share capital and control
Share capital and restrictions on the transfer of shares or voting rights
287
Special rights with regard to the control of the Company
287
Employee share schemes –exercise of voting rights
287
Substantial shareholdersInformation provided to the Company by substantial shareholders pursuant to the DTR is published via a Regulatory Information Service.
As at 31 December 2020, the Company had been notified by its substantial shareholders under Rule 5 of the DTR of the following interests in the Company’s shares:
Interest in shares
% of issued share capital withrights to vote in all circumstances at
general meetings1
BlackRock, Inc. 3,668,756,7652 5.14%
Harris Associates L.P. 3,523,149,1613 5.00%
1 Percentage provided was correct at the date of notification.
2 The most recent notification provided by BlackRock, Inc. under Rule 5 of the DTR identifies (i) an indirect holding of 3,599,451,380 shares in the Company representing 5.04 per cent of the voting rights in the Company, and (ii) a holding of 69,305,385 in other financial instruments in respect of the Company representing 0.09 per cent of the voting rights of the Company. BlackRock, Inc.’s holding most recently notified to the Company under Rule 5 of the DTR varies from the holding disclosed in BlackRock, Inc.’s Schedule 13-G filing with the US Securities and Exchange Commission dated 29 January 2021, which identifies beneficial ownership of 5,443,120,289 shares in the Company representing 7.7 per cent of the issued share capital in the Company. This variance is attributable to different notification and disclosure requirements between these regulatory regimes.
3 An indirect holding.
No further notifications have been received under Rule 5 of the DTR as at the date of this report.
Viability statementThe Directors have an obligation under the UK Corporate Governance Code to state whether they believe the Company and the Group will be able to continue in operation and meet their liabilities as they fall due over a specified period determined by the Directors, taking account of the current position and the principal risks of the Company and the Group.
In making this assessment, the Directors have considered a wide range of information, including:
The principal and emerging risks which could impact the performance of the Group
The 2021 Strategic Review which sets out the Group's customer and business strategy for the year ahead
The Group’s operating plan which comprises detailed customer, financial, capital and funding projections together with an assessment of relevant risk factors for the period from 2020 to 2023 inclusive
In particular, the assessment included consideration of the impact from the pandemic, the UK’s recovery thereafter and the UK’s exit from the EU on the economy and regulatory agenda, and included the volatility experienced in interest rate markets.
Group, divisional and business unit operating plans are produced and subject to rigorous stress testing on an annual basis. The planning process takes account of the Group’s business objectives, the risks taken to seek to meet those objectives and the controls in place to mitigate those risks to remain within the Group’s overall risk appetite.
The Group’s annual planning process comprises the following key stages:
The Board reviews and revises the Group’s strategy, risk appetite and objectives in the context of the operating environment and external market commitments
The divisional teams develop their operating plans based on the Board’s objectives ensuring that they are in line with the Group’s strategy and risk appetite
The financial projections and the underlying assumptions in respect of expected market and business changes, and future expected legal, accounting and regulatory changes are subject to rigorous review and challenge from both divisional and Group executives
In addition, the Board obtains independent assurance from Risk Division over the alignment of the plan with Group strategy and the Board’s risk appetite. This assessment performed by Risk Division also identifies the key risks to delivery of the Group’s operating plan
The planning process is also underpinned by a robust capital and funding stress testing framework. This framework allows the Group to assess compliance of the operating plan with the Group’s risk appetite
The scenarios used for stress testing are designed to be severe but plausible, and take account of the availability and likely effectiveness of mitigating actions that could be taken by management to avoid or reduce the impact or occurrence of the underlying risks. In considering the likely effectiveness of such actions, the conclusions of the Board’s regular monitoring and review of risk and internal control systems, as discussed on page 95, is taken into account. Further information on stress testing and reverse stress testing is provided on pages 152 to 153
In 2020, the operating plan has been subject to revision to reflect the volatility in the economic environment. This has allowed the Board to consider in November 2020 a scenario which recognised the downside impacts from further lockdowns and the positive aspects from the vaccine rollout, and a further refresh in January 2021 recognising the latest assessment of the economy
The final operating plan, Risk Division assessment and the results of the stress testing are presented to the Board for approval. Once approved, the operating plan drives detailed divisional and Group targets for the following year
Directors’ report continued

Strategic rep
ortFinancial results
Governance
Risk manag
ement
Financial statements
Other inform
ationStrateg
ic report
Governance
Risk manag
ement
Financial statements
Other inform
ation Lloyds Banking Group Annual Report and Accounts 2020 113
The Directors have specifically assessed the prospects of the Company and the Group over the current plan period. The Board considers that a three year period continues to present a reasonable degree of confidence over expected events and macroeconomic assumptions, while still providing an appropriate longer-term outlook. Information relevant to the assessment can be found in the following sections of the annual report and accounts:
The Group’s principal activities, business and operating models and strategic direction are described in the strategic report on pages 1 to 59
Emerging risks are disclosed on pages 147 to 149
The principal risks, including the Group’s objectives, policies and processes for managing credit, capital, liquidity and funding, are provided in the risk management section on pages 144 to 204
The Group’s approach to stress testing and reverse stress testing, including both regulatory and internal stresses, is described on pages 152 to 153
Based upon this assessment, the Directors have a reasonable expectation that the Company and the Group will be able to continue in operation and meet its liabilities as they fall due over the next three years to 31 December 2023.
Going concernThe going concern of the Company and the Group is dependent on successfully funding their respective balance sheets and maintaining adequate levels of capital. In order to satisfy themselves that the Company and the Group have adequate resources to continue to operate for the foreseeable future, the Directors have considered the implications of the COVID-19 pandemic upon the Group’s performance and projected funding and capital positions and also taken into account the impact of further stress scenarios as well as a number of other key dependencies which are set out in the risk management section under principal risks and uncertainties: funding and liquidity on page 57 and pages 183 to 187 and capital position on pages 188 to 196. Additionally, the Directors have considered the capital and funding projections of the Company and Group. Accordingly, the Directors conclude that the Company and the Group have adequate resources to continue in operational existence for a period of at least 12 months from the date of the approval of the financial statements and therefore it is appropriate to continue to adopt the going concern basis in preparing the accounts.
Scope 1, 2 and 3 emissions Greenhouse gas emissionsThe Group has reported greenhouse gas emissions and environmental performance since 2009, and since 2013 this has been reported in line with the requirements of the Companies Act 2006 and its applicable regulations. Our total emissions, in tonnes of CO2 equivalent, are reported in the table below. Deloitte LLP has provided limited level ISAE 3000 (Revised) assurance over selected non-financial indicators as noted by . Their full, independent assurance statement is available online at www.lloydsbankinggroup.com/who-we-are/responsible-business/downloads.html
MethodologyThe Group follows the principles of the Greenhouse Gas (GHG) Protocol Corporate Accounting and Reporting Standard to calculate Scope 1, 2 and 3 emissions from our worldwide operations. The reporting period is 1 October 2019 to 30 September 2020, which is different to that of our Directors’ report (January to December 2020). This is in line with the regulations in that the majority of the emissions reporting year falls within the period of the Directors’ Report. Emissions are reported based on the operational control approach.
Reported Scope 1 emissions are those generated from gas and oil used in buildings, emissions from fuels used in UK company owned vehicles used for business travel and fugitive emissions from the use of air conditioning and chiller/refrigerant plant. Reported Scope 2 emissions are generated from the use of electricity and are calculated using both the location and market-based methodologies. Reported Scope 3 emissions relate to business travel and commuting undertaken by colleagues, waste and the extraction and distribution of each of our energy sources – electricity, gas and oil. This year, in light of the coronavirus pandemic’s impacts on Group operations, we have included the emissions of colleagues working from home before and during the pandemic in our Scope 3 totals.
Intensity ratio
Legacy ScopeOct19-Sep20
Oct18-Sep19
Oct17-Sep18
GHG emissions (CO2e) per £m of underlying income (Location Based)* 10.4 11.5 13.0
GHG emissions (CO2e) per £m of underlying income (Market Based)* 4.7 5.6 6.2
Expanded ScopeOct19-Sep20
Oct18-Sep19
Oct17-Sep18
GHG emissions (CO2e) per £m of underlying income (Market Based) – expanded scope** 13.6 15.8 17.3
GHG emissions (CO2e) per £m of underlying income (Location Based) – expanded scope** 7.9 9.9 10.6
* Intensities have been restated for 2017-2018 and 2018-2019 to reflect changes to emissions data only, replacing estimated data with actuals; underlying income figures for those years have not changed.
**Scope 3 emissions have been expanded to include additional elements within the Group’s own operations including emissions from waste, colleague commuting and additional elements of business travel, (including taxis, tube, well to tank emissions of business travel and hotels). We have disclosed these figures parallel to legacy scope numbers to allow fairer comparison to numbers previously disclosed and to demonstrate performance versus our previous targets. Additionally, October 19-Sep 20 scope 3 figures include an allowance for emissions from homeworkers not previously accounted for, owing to the significant increase in materiality year to year due to the impacts of coronavirus. Previous years have not been restated.
This year, our overall location-based carbon emissions were 159,487 tCO2e; a 24 per cent decrease since 2019 and 72 per cent against our 2009 baseline (legacy scope). Significant reductions were achieved between October and March of this reporting year. These are attributable to our programme of environmental action since 2010, which has delivered a reduction in gas and electricity consumption through extensive energy management, alongside decarbonisation of the UK electricity grid from October to March 2020. Further reductions have been caused by the impact of coronavirus on our operations and reported emissions. A large proportion of our colleagues worked from home in 2020 in line with travel restrictions and advice, which has led to a considerable reduction in both scope 1 and 3 business travel numbers reported. Group building energy, gas and electricity, also reduces in part due to the impacts of this operational shift, though impacts are not as significant.
Our scope 2 market-based emissions figure is zero tCO2e, as we have procured renewable energy certificates equal to our total electricity consumption in each of the markets we operate since January 2019.
OmissionsEmissions associated with joint ventures and investments are not included in this disclosure as they fall outside the scope of our operational boundary. The Group does not have any emissions associated with imported heat, steam or imported cooling and is not aware of any other material sources of omissions from our reporting.

114 Lloyds Banking Group Annual Report and Accounts 2020
Carbon Emissions (tonnes CO2e)
Legacy ScopeOct19- Sep20
Oct18- Sep191
Oct17- Sep181
Total CO2e (market based) 71,704 101,856 116,100
Total CO2e (location based) 159,487 208,495 243,028
Total Scope 1 & 2 (location-based) 126,890 155,270 178,378
– Of Which UK Scope 1 & 2 (location-based) 126,209 152,893 176,676
Total Scope 1 & 2 (market-based) 39,107 48,631 51,450
– Of Which UK Scope 1 & 2 (market-based) 38,806 47,946 49,213
Total Scope 1 39,107 48,246 49,505
Total Scope 2 (market based) – 385 1,945
Total Scope 2 (location-based) 87,783 107,025 128,873
Total Scope 3 32,597 53,225 64,650
Expanded ScopeOct19- Sep20
Oct18- Sep191
Oct17- Sep181
Total CO2e (market based) 120,308 180,153 197,623
Total CO2e (location based) 208,092 286,792 324,551
Total Scope 3 81,202 131,522 146,173
Global Energy Use (kWhs)Oct19- Sep20
Oct18- Sep191
Oct17- Sep181
Total Global Energy Use 524,024,822 591,341,929 623,467,500
– Of Which UK Energy Use 518,717,523 585,136,101 617,185,723
Total Building Energy 503,709,548 551,778,914 577,606,213
Total Company Owned Vehicle Energy 14,436,436 29,987,906 34,889,251
Total Grey Fleet Vehicle Energy2 5,878,838 9,575,109 10,972,036
1 – Restated 2018/2017 emissions data to improve the accuracy of reporting, using actual data to replace estimates.
2 – Grey fleet refers to colleague and hired road vehicles being used for a business purpose. Emissions in tonnes CO2e in line with the GHG Protocol Corporate Standard (2004). We are
reporting to the revised Scope 2 guidance, disclosing a market-based figure in addition to the location-based figure.
The measure and report Scope 1, 2, 3 emissions is provided in the Lloyds Banking Group Reporting Criteria statement available online at www.lloydsbankinggroup.com/who-we-are/responsible-business.html
Scope 1 emissions include mobile and stationary combustion of fuel and operation of facilities.
Scope 2 emissions have been calculated in accordance with GHG Protocol guidelines, in both location and market based methodologies.
Scope 3 emissions reported are disclosed in line with our legacy target, per the expanded to include additional elements within the group’s own operations including emissions from waste, colleague commuting and additional elements of business travel (including taxis, tube, well to tank emissions of business travel and hotels). We have also disclosed legacy scope numbers to allow fairer comparison to numbers previously disclosed and to demonstrate performance versus our previous targets. Indicator is subject to Limited ISAE3000 (revised) assurance by Deloitte LLP for the 2020 Annual Responsible Business Reporting. Deloitte’s 2020 assurance statement and the 2020 Reporting Criteria are available online at www.lloydsbankinggroup.com/who-we-are/responsible-business.html
Energy efficiencyWhile coronavirus has significantly impacted our energy performance year on year, we did see a 4 per cent year to year energy consumption reduction achieved in a 6 month period prior to the impacts of coronavirus, largely due to our energy reduction initiatives. These initiatives include an energy optimisation programme; an energy intervention scheme that includes remote and onsite optimisation and strategic alterations of BMS and controls systems to match the run hours of plant to core operating hours and ensure temperature settings are aligned with Group comfort guidelines. In 2020, 89 deep-dives, 88 onsite optimisations, 13 remote optimisations and 550 bank holiday programming were completed, which resulted in a 105 GWh saving. Additionally, the Group saw a 14% year to year energy reduction in our company owned vehicles energy usage in the 6 month period prior to April 2020, due to our ongoing focus on reducing business travel.
Independent auditor and audit informationEach person who is a Director at the date of approval of this report confirms that, so far as the Director is aware, there is no relevant audit information of which the Company’s auditor is unaware and each Director has taken all the steps that he or she ought to have taken as a Director to make himself or herself aware of any relevant audit information and to establish that the Company’s auditor is aware of that information.
This confirmation is given and should be interpreted in accordance with the provisions of the Companies Act 2006. Resolutions concerning the appointment of Deloitte LLP as auditor and authorising the Audit Committee to set its remuneration will be proposed at the AGM.
Statement of directors’ responsibilitiesThe Directors are responsible for preparing the annual report, including the Directors’ remuneration report, and the financial statements in accordance with applicable law and regulations. Company law requires the Directors to prepare financial statements for each financial year. Under that law, the Directors have prepared the Group and parent Company financial statements in accordance with international accounting standards in conformity with the requirements of the Companies Act 2006. Additionally, the Financial Conduct Authority’s Disclosure Guidance and Transparency Rules require the Directors to prepare the group financial statements in accordance with international financial reporting standards adopted pursuant to Regulation (EC) No 1606/2002 as it applies in the European Union.
Under company law, the Directors must not approve the financial statements unless they are satisfied that they give a true and fair view of the state of affairs of the Group and the Company and of the profit or loss of the Company and Group for that period. In preparing these financial statements, the Directors are required to: select suitable accounting policies and then apply them consistently; make judgements and accounting estimates that are reasonable and prudent; and state whether for the Group and Company, international accounting standards in conformity with the requirements of the Companies Act 2006 and, for the Group, international financial reporting standards adopted pursuant to Regulation (EC) No 1606/2002 as it applies in the European Union have been followed.
The Directors are responsible for keeping adequate accounting records that are sufficient to show and explain the Company’s transactions and disclose with reasonable accuracy at any time the financial position of the Company and the Group and enable them to ensure that the financial statements and the Directors’ remuneration report comply with the Companies Act 2006 and, as regards the Group financial statements, international financial reporting standards adopted pursuant to Regulation (EC) No 1606/2002 as it applies in the European Union. They are also responsible for safeguarding the assets of the Company and the Group and hence for taking reasonable steps for the prevention and detection of fraud and other irregularities.
A copy of the financial statements is placed on our website at www.lloydsbankinggroup.com/investors. The Directors are responsible for the maintenance and integrity of the Company’s website. Legislation in the UK governing the preparation and dissemination of financial statements may differ from legislation in other jurisdictions.
Each of the current Directors who are in office as at the date of this report, and whose names and functions are listed on pages 82 to 83 of this annual report, confirm that, to the best of his or her knowledge:
The Group financial statements, which have been prepared in accordance with international accounting standards in conformity with the requirements of the Companies Act 2006 and in accordance with international financial reporting standards adopted pursuant to Regulation (EC) No 1606/2002 as it applies in the European Union and the Company financial statements which have been prepared in accordance with international accounting standards in conformity with the requirements of the Companies Act 2006, give a true and fair view of the assets, liabilities, financial position and profit or loss of the Group and the Company.
The management report contained in the strategic report and the Directors’ report includes a fair review of the development and performance of the business and the position of the Company and the Group together with a description of the principal risks and uncertainties they face.
The Directors consider that the annual report and accounts, taken as a whole, is fair, balanced and understandable and provides the information necessary for shareholders to assess the Company and the Group’s position, performance, business model and strategy. The Directors have also separately reviewed and approved the strategic report.
On behalf of the Board
Kate Cheetham, Company Secretary
23 February 2021
Lloyds Banking Group plc Registered in Scotland, No. SC095000
Directors’ report continued

Strategic rep
ortFinancial results
Governance
Risk manag
ement
Financial statements
Other inform
ation Lloyds Banking Group Annual Report and Accounts 2020 115
Dear ShareholderOn behalf of the Board we are pleased to present the Directors’ Remuneration Report for the year ended 31 December 2020.
The unprecedented events of 2020 and the impact of the coronavirus pandemic have led the Remuneration Committee to make decisions on remuneration outcomes that reflect the experiences of our customers, colleagues and shareholders. We recognise the need for restraint in the remuneration outcomes for Executive Directors and other senior colleagues, while ensuring additional support was targeted toward our customer-facing colleagues in recognition of their tremendous efforts in continuing to support our customers.
As we move into the next phase of the Group’s strategy, we recognise more than ever the need to incentivise and retain critical talent while maintaining a direct alignment to the experience of our shareholders and responding to the broader societal challenges we face.
2020 – an unprecedented yearWe knew as the pandemic developed that in order to support our customers in the best possible way, we would first need to support our colleagues through the uncertainty that they were facing. We therefore confirmed in March 2020 that all colleagues would continue to be paid in full, no matter how the pandemic affected them. This meant that colleagues who were sick or shielding and unable to work at all, or had to change their working arrangements for caring responsibilities or their personal wellbeing, were able to do so whilst continuing to be paid and receiving the support they needed.
Members of our Group Executive Committee confirmed in April 2020 that, regardless of Group and individual performance through the remainder of 2020, they would waive their right to be considered for a bonus award; an early decision that the Committee welcomed.
Consistent with the framework set by the Remuneration Committee at the start of the year, the impact of the pandemic on our financial results means that there will be no annual bonus pool (Group Performance Share) for 2020 as the profit threshold has not been met. Full details are provided on page 121. In keeping with our approach to timely, open and honest communication with colleagues, we communicated this outcome in December
Directors' remuneration report
Remuneration Committee Chair's statement
In this unprecedented year, we continue to strive for a simple reward package with clear alignment to our purpose that rewards and drives the right behaviours and outcomes.Stuart Sinclair Chair, Remuneration Committee
2020. This outcome is in no way reflective of the hard work, commitment and sacrifice our colleagues have made throughout the year to keep our business running and help our customers.
The Remuneration Committee acknowledges that colleague reward was considerably affected by external factors in 2020 and intends that for fairness, just as colleague awards absorbed the impact of the fall in profitability, they should participate in any recovery in profitability in 2021.
Our wider workforceMeasured against our core principle of ensuring there is fairness in our remuneration structure, the Remuneration Committee has paid particular regard to the impact its decisions have had for all colleagues. We made an above inflation pay award to our lowest paid colleagues in April 2020, and paid a one-off £250 cash recognition award to nearly 40,000 predominantly customer-facing colleagues in July 2020. This means for almost half of our colleagues, their total remuneration has stayed flat from 2019 to 2020 despite the absence of any bonus pool.
For the April 2021 pay review, the average pay award for our lowest-paid colleagues will be 1.7 per cent and up to 2.2 per cent again, above inflation. There are no increases for Executive Directors.
To recognise further the considerable role that all colleagues have played in supporting customers in 2020, and the part they will play in delivering the next phase of the Group’s strategy, every permanent eligible colleague across the Group will receive a £400 share award. These free shares that vest after three years ensure that each and every colleague has a personal interest in the longer-term success of the Group.
Remuneration Content Chair's statement pages 115 - 116 Remuneration at a glance page 117 Engaging with our shareholders and responding to feedback pages 118 - 119 Other Remuneration disclosures (Pillar III reporting) pages 138 - 142
Q. How has the Remuneration Committee and the Group supported colleagues through COVID-19? We committed to colleagues that we would support them during this unprecedented time. Our priority was to take away as much uncertainty as possible when it came to work, their families and remuneration. This at times meant making some difficult but important decisions, but ones we feel were in the interest of shareholders, colleagues and the communities we serve.The Group is continuing to provide support on mental and physical wellbeing as well as continuing to pay colleagues their full salary, no matter how the outbreak affects what they do for the Group or what their personal circumstances are.In July, 40,000 predominantly customer-facing colleagues, received a £250 award to say thank you for the support and to recognise the incredible commitment shown to our customers and communities throughout the pandemic. Q. How have we responded to shareholder concerns following the 2020 AGM? During 2020 in total we engaged with shareholders representing more than 60 per cent of our register, as well as the proxy agencies, including both those who voted 'for' and 'against' our remuneration resolutions at the 2020 AGM. I am very grateful to shareholders for their engagement on a broad range of remuneration issues including our new Policy. Following extensive and productive discussions additional clarity has been provided regarding the discount applied to the Long Term Share Plan (LTSP), as well as detail regarding our simplified balanced scorecard for 2021.
2020 IN SUMMARY
There are no annual bonus (Group Performance Share) awards for 2020 Group Chief Executive total remuneration is down 22 per cent year-on-year We have protected the total remuneration for our lowest paid colleagues and are awarding above-inflation pay increases in April 2021 All eligible colleagues will receive a £400 recognition share award 2018 Executive Group Ownership Share vesting at 33.75 per cent reflecting strong strategic progress

116 Lloyds Banking Group Annual Report and Accounts 2020
Executive Director remuneration decisions and outcomesThe Remuneration Committee considers the need for significant restraint in respect of remuneration outcomes. There are no pay increases proposed for Executive Directors and only limited awards made to other senior colleagues where they are paid below market rate, creating a retention risk.
In order to ensure the continued long-term motivation and retention of key staff the Remuneration Committee supported making awards under the new Long Term Share Plan (LTSP) introduced at the AGM in May 2020. The LTSP is subject to underpins for three years, with vesting spread between the third and seventh anniversary of award for Executive Directors.
Awards will be granted to a small number of senior colleagues, to ensure there is alignment to shareholder experience and retain critical talent through the next phase of the Group’s strategic delivery. In deciding to make the LTSP awards, the Remuneration Committee has taken into account the Group’s performance during 2020 (as set out in full on pages 121 to 122) and the current share price.
The Remuneration Committee carefully considered the impact of a lower share price on award sizes in assessing the ‘pre-grant test’ as outlined and explained in more detail on page 118. The decision has been taken that adjusting awards upfront for a potential increase in the share price over time would not be appropriate, but instead took the decision that the level of LTSP awards should be reduced by 40 per cent to reflect the Group’s performance in 2020, the current share price and the wider experience of shareholders.
This in-year adjustment applies in addition to the 50 per cent discount applied from the previous long term incentive plan as explained on page 118. In making this assessment, the Committee reviewed the scorecard outcome (see pages 121 to 122) and took into account the fact that while there has been weak performance against financial metrics set before the true impact of the pandemic was known, the overall performance against customer and other non-financial metrics is strong. In particular, the Committee considered that risk and conduct have been adequately reflected in the scorecard outcome and the Group has lived up to its ambition to be the Best Bank for Customers, as evidenced by performance against the Customer and Conduct dimension of the scorecard, and materially lower conduct-related costs for 2020. The purpose of the LTSP is to reward long-term performance rather than short-term financial outcomes.
There is no LTSP award for the Group Chief Executive as he will leave the Group in April 2021. In setting the award size for the Chief Financial Officer, the Remuneration Committee considered the award range for normal performance of 125 per cent to 150 per cent (see page 132) and considered an award of 125 per cent was appropriate to reflect Group and individual contribution in 2020 (see page 122) alongside the need to incentivise delivery of the next phase of strategy aligned to long-term shareholder returns. A further adjustment of 40 per cent was applied to scale the award in line with the overall budget for LTSP awards, resulting in a final award of 75 per cent of salary for the Chief Financial Officer. This adjustment ensures there is a consistent approach applied for all recipients of LTSP awards and supports a ‘one team’ ethos across the Group’s senior management team.
Full details of the 2021 LTSP award, including the factors supporting the pre-grant assessment and the underpins that apply, are included on page 132.
The Remuneration Committee has been mindful that in-flight awards made under the Group Ownership Share plan for performance in 2019 to 2020 remain in place (and will run until the end of 2022) and the Committee has confirmed that there has not been, nor will be, any softening of the performance measures for these awards despite the unprecedented impact of external events and economic volatility. Under these circumstances, we believe that re-alignment of these targets would compromise the alignment of these awards with the interests of our shareholders.
Strong delivery of the non-financial measures in the Executive Group Ownership Share awards made in 2018 resulted in vesting at 33.75 per cent as shown in the table on page 123.
Board changesWith the departure of the Chief Operating Officer in September 2020 and the announcement of the Group Chief Executive’s retirement in 2021, supporting the Board in the search for a new Chief Executive has been a significant focus for the Remuneration Committee. The Committee was mindful of the need to keep narrowing the gap in total remuneration between Executive Directors and the wider workforce, while not compromising on the quality of the candidate pool. The total maximum reward package for the new Group Chief Executive has therefore been reduced by approximately 20 per cent from the current Directors’ Remuneration Policy maximum that was approved at the 2020 AGM and is a total reduction of over 40 per cent from the Policy in force until as recently as 2019.Each component of the package for the new Group Chief Executive, Charlie Nunn, has been set in accordance with the approved Policy.
Responding to shareholder feedback and the challenges aheadIn addition to our deliberate efforts to support and reward our colleagues during this unprecedented time, 2020 has also marked the first year of implementation of our updated Directors’ Remuneration Policy. We welcomed receiving majority votes in support of both the Policy and Long Term Share Plan, though recognise that there were a significant number of votes opposing both these resolutions. As a result, we have consulted widely on the changes we are making to the implementation of the approved Policy in 2021 and thank those shareholders and proxy agencies that we have met for their feedback.
When designing the new Policy, we thought carefully about how we could achieve our core aim of creating a simple reward package with clear alignment to our Group's purpose and shareholders’ interests. On page 118 under ‘Engaging with our shareholders and responding to feedback’, we explain the main feedback received and our response.
In particular, I would like to draw your attention to the new approach to the Group balanced scorecard on page 119 where I hope you will agree we have taken on board specific feedback that we should have fewer and simpler quantitative metrics that have clear alignment to the purpose of the Group and shareholders’ interests. We have also responded to feedback that there should be specific and identifiable measures of performance against our inclusion and diversity objectives (in support of our ethnic and gender diversity goals) and our long-term sustainability agenda.
We know that 2021 will not be a normal year as we start delivering on our revised strategy and Help Britain Recover, while adapting to the changing needs of our customers, colleagues and societal expectations resulting from the pandemic. We believe that our balanced scorecard for 2021, which will drive the reward outcomes for our whole Group Executive Committee, not just the Group Chief Executive, ensures that management is focused as ‘one team’ on the right behaviours and delivering sustainable results.
Together with my Committee members, I look forward to hearing your views on the remuneration arrangements outlined in the report and hope we will receive your support at the upcoming AGM.
On behalf of the Board
Stuart Sinclair Chair, Remuneration Committee
Directors’ remuneration report continued

Strategic rep
ortFinancial results
Governance
Risk manag
ement
Financial statements
Other inform
ation Lloyds Banking Group Annual Report and Accounts 2020 117
£0m
3.13
2020 Group Performance Share (GPS) Pool
2020 Group balanced scorecard performance
Underlying profit of £2.2bn was below the threshold required under our GPS plan rules and so has resulted in no GPS (bonus) pool being payable in respect of 2020 full year performance.
Group balanced scorecard performance: Despite the challenging economic conditions and the resulting impact on our financial measures, our Group balanced scorecard reflects an otherwise resilient performance with the score being marginally down on the prior year score of 3.20. Further details can be found on page 121.
Single total figure for 2020 remuneration (£000)António Horta-Osório Group Chief Executive
William Chalmers Chief Financial Officer
Fixed Pay Short Term Variable Long Term Variable
Fixed Pay: includes Base Salary, Fixed Share Award, Pension and Benefits
20202019
£1,518
£2,904
£740
£2,698
£4,422
£3,438(22%)
Year on year reduction
20202019
£81
£685
£1,477£766*
£1,477
2018 Executive Group Ownership Share performance and vesting
Total vesting
33.75%
Customer satisfaction(10% weighting)
10%
Statutory economic profit(25% weighting)
0%
Absolute TSR(30% weighting)
0%
Cost:income ratio(10% weighting)
0%
Employee engagement(7.5% weighting)
7.5%
Digital net promoter score(7.5% weighting)
7.5%
FCA reportable complaints(5% weighting)
5%
FOS uphold rate(5% weighting)
3.75%
2020 Remuneration at a glance
Base SalaryTo support the recruitment and retention of Executive Directors of the calibre required to develop and deliver the Group's strategic priorities.
Base salary reflects the role of the individual, taking account of market competitiveness, responsibilities and experience, and pay in the Group as a whole.
Fixed Share AwardTo ensure that total fixed remuneration is commensurate with role and to provide a competitive reward package for Executive Directors with an appropriate balance of fixed and variable remuneration, in line with regulatory requirements.
PensionTo provide cost effective and market competitive retirement benefits, supporting Executive Directors in building long-term retirement savings.
BenefitsTo provide flexible benefits as part of a competitive remuneration package.
Group Performance Share (Bonus)To incentivise and reward the achievement of the Group's annual financial and strategic targets whilst supporting the delivery of long term superior and sustainable returns.
Long Term Share PlanLong term variable reward opportunity to align executive management incentives and behaviours to the Group's objectives of delivering long-term superior and sustainable returns. The Long Term Share Plan will incentivise stewardship over a long time horizon and promote good governance through a simple alignment with the interest of shareholders.This replaces Group Ownership Share Plan/LTIP.
Fixed Share Award
Base Salary
Pension
Benefits
Short Term
Variable
Long Term
Variable
Our remuneration packageThe below summarises the different remuneration elements for Executive Directors.
2021 Long Term Share PlanThe Remuneration Committee decided to make an award under the 2021 Long Term Share Plan to the Chief Financial Officer. In setting the award size the Remuneration Committee considered an award of 125 per cent was appropriate to reflect Group and individual contribution in 2020 (see page 122). A further adjustment of 40 per cent was applied, resulting in a final award of 75 per cent of salary for the Chief Financial Officer.
For additional information see page 132.
* Part year, joined in June 2019

118 Lloyds Banking Group Annual Report and Accounts 2020
Directors’ remuneration report continued
1. THE NEW LONG TERM SHARE PLAN
Engaging with our shareholders and responding to feedback
The inclusion of the pre-grant test A number of shareholders expressed confusion over the need for, and operation of, the pre-grant test to determine LTSP award levels, particularly as other companies have recently introduced restricted share plans that do not include this feature.
Under the regulatory requirements that apply to large UK banks, in order for variable remuneration to count within the ‘bonus cap’ for the year of grant it must include in some way a measure of the performance of the year of grant, among other gateways which will normally be conduct risk and
customer outcomes. Under the GOS plan, this resulted in the possibility of awards to the Group Chief Executive being lower than 300 per cent, notably for 2019 when to reflect the reduction in statutory profit his award was reduced to 250 per cent. We will reflect this approach under the LTSP, with awards, subject to appropriate gateways, expected to be in the range of 125 per cent to 150 per cent as shown in the table below.
When considering the use of discretion in conjunction with the balanced scorecard assessment, the Committee will consider the following key questions:
Do the Group’s financial results and capital position adequately reflect risk, conduct and any other non-financial considerations?
Has the Group suffered a serious conduct event or has severe reputational damage arisen from the Group not living its values?
Has the bank lived up to its ambition to be the Best Bank for Customers?
These same questions are repeated at vesting to ensure that performance has been sustainable, and nothing has subsequently arisen that would give a different outcome if known at the point of award.
The use of the balanced scorecard in determining LTSP awardsThe balanced scorecard will continue to play a role, however the long-term focus of this plan means that there would be only limited variability in the size of the award based on performance in the year of grant. We expect that this approach will provide greater clarity to the way in which awards are determined, whilst bringing it closer to the ‘restricted share’ model and reflecting regulatory
requirements. We are now focusing on how we can improve the simplicity and transparency of the way in which the pre-grant test is set out as outlined above.
The following table provides an indication of scorecard performance outcomes and resulting LTSP awards. The Remuneration Committee will use this as a guide although will make any discretionary adjustment to the final grant size based on factors that are considered important outside of the scorecard.
For 2021 LTSP awards, performance was measured against the 'old style' scorecard for 2020, as outlined in full on page 121. The Remuneration Committee considered that the performance outcome was at the lower end of the range of normal performance (a score of 3 to 4) and accordingly set the award at 125 per cent before adjusting for other factors in the pre-grant assessment, as outlined on page 132. By comparison, the award for similar performance in 2019 under the GOS was 250 per cent, demonstrating a real discount of 50 per cent has been applied.
We gained support at the 2020 AGM for the amendments we made to our Directors’ Remuneration Policy and welcomed the majority votes for both the Policy and Long Term Share Plan (LTSP). The Policy became effective for 2020 however we recognise that there were a significant number of votes opposing these resolutions indicating that there were concerns with some aspects of our policy’s design.
During 2020 we engaged with shareholders representing more than 60 per cent of our register, which has provided us with a thorough indication of the main areas of concern to reflect on. We value the opinions of all our stakeholders and thank all our shareholders, regulators, Unions and others for their input and collaboration. As a result we have made some key changes to how we intend to implement the Policy in 2021 and
beyond that seek to address these concerns and continue to support our aim of delivering a simple reward package with clear alignment to the Group’s purpose. The main concerns related to the new Long Term Share Plan and also a simpler performance assessment approach with clear alignment to reward outcomes.
The discount applied to the new LTSP awardA number of shareholders expressed concern over the way in which the discount of 50 per cent from the previous Group Ownership Share (GOS) was applied to reach the maximum opportunity under the new plan. Under the previous GOS plan, the Remuneration Committee had the right to grant an award of up to 400 per cent in
exceptional circumstances (for example, in the context of hiring a new CEO), or where individual performance had been deemed exceptional, and therefore the normal maximum award level under the GOS plan was 300 per cent. We acknowledge that a 50 per cent discount from that level would mean that the LTSP policy should provide for a normal maximum award of no more than 150 per cent.
We have confirmed that the maximum opportunity for the Group Chief Executive will be 150 per cent of salary not 200 per cent. Our Policy maximum will continue to be 200 per cent, however any awards made above 150 per cent of salary would be reserved for truly exceptional circumstances only, and with clear justification.
Performance outcome
All LTSP grant (up to % of Base Salary)
* Awards above 150 per cent and up to 200 per cent in line with Policy maximum reserved for exceptional circumstance or exceptional performance for all eligible colleagues other than the incoming Group Chief Executive who has agreed to cap his maximum award at 150 per cent of salary.
0% – 50%
0% – 125%
50% – 100%
125% – 150%*
Scorecard outcomes

Strategic rep
ortFinancial results
Governance
Risk manag
ement
Financial statements
Other inform
ation Lloyds Banking Group Annual Report and Accounts 2020 119
2. A SIMPLE PERFORMANCE ASSESSMENT APPROACH WITH CLEAR ALIGNMENT TO REWARD OUTCOMES
Greater transparency to substantiate our performance assessmentWe have always tried to be as transparent as possible to disclose all our Group scorecard measures and what would be required to meet threshold or maximum performance.
We accept however that the presentation of our scorecard outputs in the past has made it difficult for our shareholders to comfortably come to the same performance conclusion as the Remuneration Committee using simply the level of information previously disclosed. This is particularly the case where internally-facing measures have been used.
Moving forward we would like to present a far more qualitative disclosure to support our predominantly quantitative metrics, to provide key insights into how the Remuneration Committee has chosen certain measures and how performance has been assessed.
We hope you find the disclosure of our old style 2020 balanced scorecard assessment on page 121 has improved in this regard and we will continue to focus on improving the quality of our disclosure in the 2021 Annual Report and Accounts when the new scorecard structure is presented in full.
Clearer pay for performance alignmentWe hope the proposed changes will be supported by our shareholders as they will provide further clarity that performance outputs and GPS and LTSP award outcomes directly align. However, we have also accepted the feedback that the four step approach we have used to go from a Group balanced scorecard score to a final award as a percentage of maximum for our Executive Directives could be simplified further.For 2021, all Executive Directors and the Group Executive Committee will be assessed based on the same single Group balanced scorecard. This supports a 'one team' ethos in the Group's leadership team. GPS awards as a percentage of maximum will then directly correlate to final performance outcomes. The Remuneration Committee will continue to be able to use their discretion to adjust awards should they believe other factors outside of the scorecard measures should be considered when determining a final award and we will always disclose this rationale as part of the remuneration report. This judgment may include consideration of performance against personal and business area objectives and long-term strategic ambitions.
Clearer alignment to purpose Consistent feedback suggested the structure of our balanced scorecard with 15 equally weighted measures, made it difficult for shareholders to determine how these measures clearly linked to the Group’s strategy and performance. Providing equal weighting to all measures was criticised, with the view that some measures, in particular the core financial measures, should have greater influence on reward outcomes. We have thought hard about the right choice and balance of measures for 2021 and have consulted with a large proportion of shareholders and other stakeholders to get input into the design. As a result, we have significantly reduced the number of measures and rebalanced the scorecard to ensure there is a clear weighting between financial and non-financial metrics while appropriately capturing ESG and customer dimensions. In addition all measures are subject to consideration of risk and conduct.
The targets and the level of performance achieved, will be disclosed in the 2021 Annual Report and Accounts.
We know that most shareholders would like to see further simplification of the balanced scorecard and the way in which variable pay awards are decided, with greater weighting to financial performance.
As the Group moves towards a new strategic phase, we have thought carefully about how we should design a new, simplified balanced scorecard, with the objective of having simple metrics that incentivise the right behaviours and results.
Our 2021 balanced scorecard
Financial (50%)Delivery of core financial measures is key to the sustainability of our business and to delivering long-term shareholder value. We have therefore increased the weighting for Financial measures from 33 per cent to 50 per cent and each of the three simple measures chosen for 2021 will have their own individual weighting for additional transparency on pay for performance alignment.
Strategic (50%)As the Group moves into a new strategic phase (see pages 36 to 45 for full details), focused in 2021 on our ‘Helping Britain Recover’ priorities, we have chosen four measures that we consider best demonstrate delivery against and alignment to our strategic ambitions.
We have consulted widely on the use of ESG metrics and whether these should be captured within our overall strategy or separately identifiable. On balance, we have determined that these measures should be separately identified and quantifiable to ensure we are specifically held to account for delivery against these factors. For 2021, we believe this focus should be ensuring management delivers its commitments centred around making the Group an inclusive and diverse workplace and our journey toward delivering zero carbon operations by 2030. We expect the specific measures for these commitments to evolve over time, most notably to reflect our increasing role in supporting the UK’s climate change goals.
Measure Weighting Quantitative
Statutory Profit After Tax 20% Yes
Statutory ROTE 20% Yes
Operating Costs (excl. remediation) 10% Yes
Measure Weighting Quantitative
Helping Britain
Recover
Reducing operational carbon emissions 7.5% Yes
Increasing our gender and ethnic representation in senior roles 7.5% Yes
Group Customer Dashboard – our assessment of how effectively we are serving customers across all brands, products and services
25% Yes
Colleague engagement – our performance relative to external benchmark scores 10% Yes
Risk
/ C
ondu
ct

120 Lloyds Banking Group Annual Report and Accounts 2020
Directors’ remuneration report continued
2020 annual report on remuneration
Executive Director single total figure of remuneration (audited)
£000
António Horta-Osório William Chalmers Juan Colombás Totals
2020 2019 2020 2019 2020 2019 2020 2019
Base salary 1,295 1,269 807 331 572 795 2,674 2,395
Fixed Share Award 1,050 1,050 504 252 357 497 1,911 1,799
Benefits 159 166 45 19 71 74 275 259
Pension 194 419 121 83 85 199 400 701
Total Fixed Pay 2,698 2,904 1,477 685 1,085 1,565 5,260 5,154
Group Performance Share1 – – – 81 – – – 81
Long-term incentive2,3 740 1,518 – – 384 843 1,124 2,361
Total Variable Pay 740 1,518 – 81 384 843 1,124 2,442
Other remuneration4 2 2 – – – 1 2 3
Buy out – – – 4,378 – – – 4,378
Total remuneration 3,440 4,424 1,477 5,144 1,469 2,409 6,386 11,977
Less: Performance adjustment – – – – 415 – 415 –
Total remuneration less buy-outs and performance adjustment 3,440 4,424 1,477 766 1,428 2,409 6,345 7,599
1 The Remuneration Committee set a policy at the start of 2020 that if Underlying Profit was 20 per cent below target, no GPS awards would be payable. The Group’s underlying profit was £2.2bn, 62 per cent below the £5.7bn target. The threshold was not met and therefore there are no GPS awards for 2020 performance.
2 The 2018 Group Ownership Share (GOS) vesting (see page 123) at 33.75 per cent was confirmed by the Remuneration Committee at its meeting on 19 February 2021. The total number of shares vesting were 2,269,762 for António Horta-Osório and 1,177,883 shares vesting for Juan Colombás. This award was pro-rated to reflect Juan Colombás leaving date. The average share price between 1 October 2020 and 31 December 2020 32.62 pence has been used to indicate the value. No part of the reported value is attributable to share price appreciation. Shares were awarded based on a Share price of 68.027, as regulations prohibited the payment of dividend equivalents on awards in 2018 and subsequent years, the number of Shares subject to award was determined by applying a 25 percentage discount factor to the Share price on award, as previously disclosed.
3 LTIP and dividend equivalent figures for 2019 have been adjusted to reflect the share price on the date of vesting (6 March) 49.48 pence instead of the average price 59.34 pence reported in the 2019 report.
4 Other remuneration payments comprise income from all employee share plans, which arises through employer matching or discounting of employee purchases.5 In June 2020, the Financial Conduct Authority (FCA) fined the Group for failures in relation to the handling of mortgage customers in payment difficulties or arrears. As a result, the Committee
decided to apply a performance adjustment in respect of bonuses awarded to the Chief Risk Officer (among other senior colleagues) from 2011 to 2015 given his ultimate oversight. The number of shares adjusted was 68,536, and the value shown is calculated using the relevant deferred bonus award share price for each respective year.
Pension and benefits (audited)
Pension/Benefits £
António Horta-Osório William Chalmers Juan Colombás
2020 2020 2020
Cash allowance in lieu of pension contribution 194,201 121,028 85,456
Car or car allowance 12,000 12,000 8,636
Flexible benefits payments 50,772 31,798 23,848
Private medical insurance 20,980 1,130 20,980
Tax preparation 39,600 – 14,640
Transportation (Chauffeur) 35,908 – 3,358
Subtotal for Total Benefits less pension 159,260 44,928 71,462
Defined benefits pension arrangements (audited)António Horta-Osório has a conditional unfunded pension commitment. This was a partial buy-out of a pension forfeited on joining from Santander Group. It is an Employer-Financed Retirement Benefits Scheme (EFRBS). The EFRBS provides benefits on a defined benefit basis at a normal retirement age of 65. The benefit in the EFRBS accrued during the six years following commencement of employment, therefore ceasing to accrue as of 31 December 2016.
The EFRBS was subject to performance conditions and it provided for a percentage of the Group Chief Executive's base salary or reference salary in the 12 months before retirement or leaving. No additional benefit is due in the event of early retirement. The rate of pension accrued in each year depended on, share price conditions being met. In March 2019, the Group Chief Executive asked that his defined benefit pension be based on a percentage of his pensionable salary in 2014. The total pension due is now fixed at 6 per cent of his 2014 reference salary of £1,220,000, or £73,200.
There are no other Executive Directors with defined benefit pension entitlements.
Under terms agreed when joining the Group, Juan Colombás is entitled to a conditional lump sum benefit of £718,996 on reaching normal retirement age of 65.

Strategic rep
ortFinancial results
Governance
Risk manag
ement
Financial statements
Other inform
ation Lloyds Banking Group Annual Report and Accounts 2020 121
2020 Group balanced scorecard 15 equally weighted measures
Calculating the 2020 Group performance share outcome (audited)
There are no Group performance share awards payable in respect of 2020 performance
Measurement of performance against balanced scorecard objectives Regardless of the Group’s performance against 2020 balanced scorecard objectives, no GPS awards will be payable to colleagues or Executive Directors as per step 1, but in the interest of transparency, the 2020 balanced scorecard performance assessment is disclosed below. Individual awards for Executive Directors would have been determined through the assessment of individual performance using the Group balanced scorecard for the Group Chief Executive, or Divisional balanced scorecards for the Chief Financial Officer and Chief Operating Officer in conjunction with an assessment of their personal contribution and proactive management of any risk and conduct issues. A score of 1 – 5 is attributed to each scorecard measure based on its performance relative to target, resulting in an overall score ranging from a minimum of 1 to a maximum of 5, and hence with 3 being classed as ‘at target’.
Underlying profit threshold The threshold below which no Group Performance Share awards were payable remained set at 20 per cent below target Underlying Profit. The Group’s underlying profit was £2.2bn, 62 per cent below the £5.7bn target set at the start of 2020. The threshold was not met and therefore there are no GPS awards for 2020 performance.
STEP 1
STEP 1
STEP 2
STEP 2
1. Underlying profit 2. Balanced scorecard assessment
3. Risk and conduct considerations
Total GPS pool
Financial measures Weighting 33%
MeasureTarget
performanceActual
performancePerformance
score Performance commentaryTotal block
score
Cost:Income Ratio: Total Cost as a % of net income
48.2% 55.3% 1 The Finance measures were heavily impacted by COVID-19 and the resulting economic downturn, resulting in income being £2.1bn below budget.
1.40
Statutory Profit after tax: Statutory measure of Group profitability after costs incl. tax
£4,677m £1,387m 1 The most significant impact is seen in the impairment charge of £4.3billion, which includes £2.9billion not in budget.
Capital Build: Basis points of capital build (excl. intangibles)
181bps 129bps 1 The Group’s balance sheet remains strong, with capital build of 129bps before dividend accrual (excluding any benefit from the revised treatment of intangible software assets or reversal of the FY2019 dividend) and CET1 ratio remaining well ahead of regulatory requirements.
Statutory Return on Tangible Equity: Statutory measure of shareholder value creation
12.6% 3.7% 1 The Return on Tangible Equity was impacted by COVID-19 in terms of both lower income and higher impairment charges as the economic outlook deteriorated.
Investment Performance: Measures the Group’s investment portfolio through 3 lenses of Benefits, Cost and Delivery
11 8 3 The Investment Performance measure was impacted by the Group’s decision to re-prioritise the investment portfolio and divert resources to support the response to the pandemic.
Customer measures Weighting 33% Chosen to align to our KPI's and strategic objective of delivering a leading customer experience. Inclusion of performance against our Helping Britain Prosper Plan also aligns reward outcomes with our core purpose.
MeasureTarget
performanceActual
performancePerformance
score Performance commentaryTotal block
score
Customer dashboard outputs: Assessment of how effectively we are meeting the needs of customers across brands, channels and products
70 74 4 Improvement in Group Customer Dashboard performance with a score of 74 up from 64 in 2019.
4.00
Segmented Customer Index: Measures customer experience and account growth amongst our targeted segments
4.0 5.0 5 Service NPS scores amongst our targeted customer segments were up, at 30.7 vs. target of 28.6.
Deliver Helping Britain Prosper Plan: Wide ranging plan with 22 objectives in support of our Group purpose
85% of Helping Britain Prosper
Plan metrics Green
77.3% Green
2 Helping Britain Prosper plan activity was significantly impacted by the pandemic, but we reported 17 out of 22 measures as ‘Green’.
Total FCA Complaints per ‘000 customers: Reportable complaints per ‘000 customers excluding PPI cases
2.64 2.47 5 Total FCA Complaints were 2.47 per ‘000 customers, well ahead of the 2.64 per ‘000 target and reflecting an 8.9% reduction year on year.
FOS Change Rate (ex PPI): Ensures focus on customer outcomes by measuring the complaints referred to the ombudsman which result in the original outcome being amended
29% 26% 4 FOS change rate of 26% was ahead of the 29% target and maintains our position ahead of the accepted industry benchmark of 30%.

122 Lloyds Banking Group Annual Report and Accounts 2020
Directors’ remuneration report continued
Colleague and conduct measures Weighting 33% We believe colleagues are critical to the delivery of the Group’s long-term strategy and measures to understand how our colleagues are feeling about working for the Group and our commitments to invest in our colleagues and their development have been chosen in support of strategy to transform our ways of working.
Ensuring the way we operate is aligned with the Group’s low-risk appetite, as well as in line with the Group’s cultural aspiration, values and behaviours is key to our long-term success. The inclusion of conduct metrics in the performance assessment supports this.
MeasureTarget
performanceActual
performancePerformance
score Performance commentaryTotal block
score
Colleague Culture & Engagement survey: Combined culture and engagement score incorporating results from our Colleague Survey and the Banking Standards Board survey
71 74 5 Significant increase in Colleague Culture & Engagement survey scores to 74 vs. 69 in 2019, ahead of the UK average for high performing companies.
4.00
Board Risk Appetite: Comprehensive suite of metrics across all key risk categories including credit, people and operational resilience
6% Red metrics
9% Red 2 Board Risk Appetite was reported with 8 out of 89 (9%) Red metrics vs. target of 6%.
Change Execution Risk: Designed to ensure that the Group executes its broad change transformation programme safely
Green >87.5% and Red < 10%
97.5% Green and 1.3% Red
5 Change Execution Risk metric performance has remained stable and strong throughout 2020 with over 97.5% metrics reported as ‘Green’ compared to target of 87.5%.
Reputation with External Stakeholders (Including Regulators): Measure reputation and the effectiveness of our engagement across various media, political and regulatory audiences
8 6 3 Reputation with external stakeholders was managed effectively, particularly with political and media audiences and a positive and strengthening relationship with regulators.
Colleagues successfully completing upskilling/retraining: GSR3 measure to develop the digital and leadership skills of the future across the Group
4.75 million hours
5.28 million hours
5 5.28m colleague development hours successfully delivered over the 3 years to end 2020, vs. target of 4.75m hours.
Personal performance and contribution
Group Chief Executive António Horta-Osório
The Group Chief Executive’s balanced scorecard assessment for 2020 reflects the Group's scorecard for which he has overall accountability.
Detail of the Group balanced scorecard performance can be found above.
Decisive leadership throughout the COVID-19 pandemic, co-ordinating the Group's wide-ranging response to evolving customer and colleague needs
Group financial results adversely impacted by pandemic balanced with strong results across non-financial performance areas
Ongoing improvement in customer satisfaction rankings and Net Promoter Scores, particularly via digital channels
Improvement in colleague engagement scores, up significantly year on year, reflecting the support provided to colleagues working in branches and offices, and the significant number working remotely
Launched the Group’s Race Action plan to ensure greater representation of ethnic minorities amongst our colleague and senior leadership populations
Personal performance and contribution
Chief Financial Officer William Chalmers
Finance Division scorecard rating
Balanced scorecard category Assessment
Customer 4.00
Colleague and conduct 3.29
Finance 2.67
Continued strong cost discipline, despite the unprecedented economic challenges created by the pandemic, with costs £111m below budget, maintaining market leading operating model efficiency
Strong balance sheet management with CET1 ratio of 16.2% significantly ahead of regulatory requirements
Prioritisation of the Group’s investment portfolio, ensuring allocation of resources to support customers through the pandemic
Leadership of culture change initiatives, driving simplification and greater business ownership of risk management
Successful expansion of accountabilities to incorporate leadership of Chief Operating Office functions (incl. Group Transformation and Chief Information Office) following the retirement of Juan Colombás
Overall score 3.13
Overall Score 3.36/5Overall Score 3.13/5

Strategic rep
ortFinancial results
Governance
Risk manag
ement
Financial statements
Other inform
ation Lloyds Banking Group Annual Report and Accounts 2020 123
2018 Executive Group Ownership Share (audited)The 2018 EGOS targets were set at the time of grant three years ago. The outcome against the targets has been influenced by the COVID-19 pandemic which has significantly impacted the macro-economic landscape and in turn our financial performance. The Remuneration Committee took an early decision not to re-base any in-flight targets or apply upward discretion in terms of vesting outcomes. Although the financial measures have therefore all vested at zero at the end of 2020, it is reassuring that the non-financial measures have performed so strongly as we believe this reflects our ongoing strategic progress, our commitment to driving better customer outcomes and to ensuring we continue to build a values led culture among our colleagues.
Measure (and weighting) Threshold Maximum Actual Vesting
Absolute TSR (30%)p.a. 8% p.a. 12.0% p.a. -15.1% 0%
Statutory economic profit (25%) £2,300m £3,451m £688m 0%
Cost:cost/income (10%) 46.4% 43.9% 55.3% 0%
Customer satisfaction (10%) 3rd 1st 1st 10%
Digital NPS score (7.5%) 64.0 67.0 67.6 7.5%
Employee engagement (7.5%) +5% vs. UK norm +2% vs. UK high performing norm
+6% vs. UK high performing norm
7.5%
FCA reportable complaints per 1,000 (5%) 2.97 2.69 2.47 5%
FOS uphold rate (5%) 29% 25% 26% 3.75%
Payments for loss of office (audited) Award (% maximum) vesting: 33.75%
Juan Colombás retired as an Executive Director on the 18th September 2020 and retired from the Group. Employees taking retirement are treated as ‘good leavers’ under the Company’s Group Performance Share Plan (GPS Plan) Rules.
He received a payment of £45,188 in lieu of unused annual leave entitlement up to the Retirement Date.
As part of Juan Colombás’ buyout of retirement benefits from his employment with Santander, the Group agreed to make an unfunded promise of a lump-sum payment of £718,996 at a defined Normal Retirement Age (‘NRA’) of 65. The deed of terms between the Group and Juan provides that where his service ends before NRA for any reason other than Ill-Health Retirement, Dismissal for Cause or Voluntary Resignation, that the entitlement to the lump-sum payment continues and will be paid at NRA.
Juan was entitled to a capped contribution of up to £10,000 (excluding VAT) towards legal fees incurred in connection with his retirement from the Company. Juan will be provided with Tax Assistance from the Group’s preferred supplier for tax years 2020/2021 and 2021/2022 of up to £15,000 each tax year. Private medical cover will also be provided until the end of 2020.
In accordance with retirement provisions, Juan has maintained outstanding deferred Group Performance Share awards under the 2017 GPS Plan (124,370 Shares) and under the 2018 GPS Plan (501,341 Shares) which continue to be released on their scheduled release dates, subject to the relevant terms (including post-vesting retention periods, malus and, where applicable, clawback and to deductions for national insurance and income tax).
Juan will remain entitled to his Fixed Share Award, time pro-rated to his retirement date. The award is paid in Shares in quarterly instalments and the final award of £108,125 was made in Shares in September 2020 and restricted over three years.
His outstanding 2018 and 2019 Executive GOS awards will be time pro-rated to his retirement date (2018 becomes 3,490,027 Shares and 2019 becomes 2,573,717 Shares). The awards remain subject to the performance measures which apply to the relevant awards and will continue to vest at the normal vesting dates and be released on their scheduled release dates, subject to the relevant terms (including post-vesting retention periods, malus and, where applicable, clawback and to deductions for national insurance and income tax).
In relation to the 2017 Executive Group Ownership Share which achieved a performance outcome of 49.7 per cent, Juan received the first 20 per cent of the award in March 2020. The remaining four outstanding tranches will not be time pro-rated as the three year performance period has been achieved and will continue to vest at the normal vesting times and be released on their scheduled release dates, subject to the relevant terms (as outlined above).
Juan did not receive an Executive Group Ownership Share for 2020.
No other payment for loss of office were made in 2020.
Payments made to Juan Colombás related to his retirement from the Group and not for loss of office.
Payments within the reporting year to past Directors (audited)There were no payments made to past directors in 2020.
External appointmentsAntónio Horta-Osório – During the year ended 31 December 2020, the Group Chief Executive served as a Non- Executive Director of Exor, Fundacao Champalimaud, Stichting INPAR Management/Enable and Sociedade Francisco Manuel dos Santos. The Group Chief Executive is entitled to retain the fees, which were £317, 989 in total.
No other Executive Director served as a Non-Executive Director in 2020.

124 Lloyds Banking Group Annual Report and Accounts 2020
Directors’ remuneration report continued
Relative importance of spend on payThe graphs illustrate the total remuneration of all Group employees compared with returns of capital to shareholders in the form of dividends and share buyback.
2019
2020
Dividend £m
789
404(49%)
1
2019
2020
Salaries and performance-based compensation2 £m
2,919
2,685(8%)
1 In response to the PRA request in March 2020 to cancel capital distributions, the final 2019 dividend was cancelled and accordingly this value has been restated from £2,375m as previously reported. The Board also took the decision not to make quarterly or interim dividend payments during 2020 in line with the PRA request, however has agreed a final dividend for 2020 of 0.57 pence per share in line with the revised PRA guidance issued in December 2020.
2 Performance-based compensation includes expense for the following plans: Group Performance Share (2020: £81.3m, 2019: £338.5m), Executive Group Ownership Share (2020: £23.3m, 2019: £30.8m), Executive Share Awards (2020: £0.4m, 2019: £0.6m) and LDC Assets under Management Plan (2020: £12m, 2019: £10m). The expenses for Group Performance Share in 2020 relate to prior year deferrals. For the 2020 performance year, the face value of awards was £0 for Group Performance Share and £32.9m for the Long Term Share Plan.
Comparison of returns to shareholders and Group Chief Executive total remunerationThe chart below shows the historical total shareholder return (TSR) of Lloyds Banking Group plc compared with the FTSE 100 as required by the regulations.
The FTSE 100 index has been chosen as it is a widely recognised equity index of which Lloyds Banking Group plc has been a constituent throughout this period.
TSR indices – Lloyds Banking Group and FTSE 100
Lloyds Banking Group FTSE 100 index
Historical TSR PerformanceGrowth in the value of a hypothetical £100 holding since 31 December 2010 (to 31 December 2020)
Valu
e of
£10
0 in
vest
ed o
n 31
Dec
embe
r 201
0
0
20
40
60
80
100
120
140
160
180
200
Dec 2020Dec 2019Dec 2018Dec 2017Dec 2016Dec 2015Dec 2014Dec 2013Dec 2012Dec 2011Dec 2010
CEO 2011 2012 2013 2014 2015 2016 2017 2018 2019 2020
GCE single figure of remuneration £000
J E Daniels 855 – – – – – – – – –
António Horta-Osório 1,765 3,398 7,475 11,540 8,704 5,791 6,434 6,544 4,424 3,440
Annual bonus/GPS payout (% of maximumopportunity)
J E Daniels 0% – – – – – – – – –
António Horta-Osório – 62% 71% 54% 57% 77% 77% 67.60% – –
Long-termincentive vesting(% of maximumopportunity)
J E Daniels 0% – – – – – – – – –
António Horta-Osório 0% 0% 54% 97% 94.18% 55% 66.30% 68.70% 49.7% 33.75%
TSR component vesting (% of maximum)
J E Daniels 0% – – – – – – – – –
António Horta-Osório 0% 0% 25.30% 30% 30% 0% 0% 0% 0% 0%
Notes: J E Daniels served as Group Chief Executive until 28 February 2011; António Horta-Osório was appointed Group Chief Executive from 1 March 2011. António Horta-Osório declined to take a bonus in 2011 and independently requested that he be withdrawn from consideration for a Group Performance Share award in 2019 and 2020. There are no GPS awards for 2020 performance.

Strategic rep
ortFinancial results
Governance
Risk manag
ement
Financial statements
Other inform
ation Lloyds Banking Group Annual Report and Accounts 2020 125
Single total figure of remuneration for Chairman and Non-Executive Directors (audited)Fees (£000) Benefits (£000)3 Total (£000)
2020 2019 2020 2019 2020 2019
Chairman and current Non–Executive Directors
Lord Blackwell 773 758 12 12 785 770
Robin Budenberg CBE1 45 – – – 45 –
Alan Dickinson 347 240 1 1 348 241
Anita Frew2 120 356 – 1 120 357
Simon Henry2 142 186 – – 142 186
Lord Lupton CBE 313 314 4 1 317 315
Amanda Mackenzie OBE 165 156 – – 165 156
Nick Prettejohn 508 471 8 5 516 476
Stuart Sinclair 254 210 – – 254 210
Sara Weller CBE 207 203 3 4 210 207
Sarah Legg 166 6 – – 166 6
Catherine Woods 135 – – – 135 –
1 Robin Budenberg was appointed on 1 October 2020. 2 Anita Frew retired 21 May 2020 and Simon Henry retired 30 September 2020.3 The Chairman receives a car allowance of £12,000. Other benefits relate to reimbursement for expenses incurred in the course of duties. 4 Non- Executive Directors do not receive variable pay.
Directors’ share interests and share awardsDirectors’ interests (audited)
Number of shares Number of options Total shareholding1 Value
Owned outright
Unvested subject to continued
employment
Unvested subject to
performance
Unvested subject to continued
employmentVested
unexercised
Totals at 31 December
2020
Totals at 23 February
2021
Expected value at 31 December
2020 (£000s)2
Executive Directors
António Horta-Osório 23,271,908 373,566 24,806,584 68,754 – 48,520,812 48,521,8597 13,175
William Chalmers 3,454,344 237,342 4,927,191 1,857,029 – 10,475,906 10,475,9067 2,926
Juan Colombás3 11,793,272 167,117 9,393,097 – – 21,353,486 21,353,4867 5,696
Non-Executive Directors
Lord Blackwell 150,000 – – – – 150,000 n/a7 n/a
Robin Budenberg CBE4 500,410 – – – – 500,410 n/a7 n/a
Alan Dickinson 200,000 – – – – 200,000 n/a7 n/a
Sarah Legg 200,000 – – – – 200,000 n/a7 n/a
Lord Lupton CBE 2,250,000 – – – – 2,250,000 n/a7 n/a
Amanda Mackenzie OBE 63,567 – – – – 63,567 n/a7 n/a
Nick Prettejohn5 69,280 – – – – 69,280 n/a7 n/a
Stuart Sinclair 362,664 – – – – 362,664 n/a7 n/a
Sara Weller CBE 372,988 – – – – 372,988 n/a7 n/a
Catherine Woods 100,000 – – – – 100,000 n/a7 n/a
Anita Frew 450,000 – – – – 450,000 n/a6,7 n/a
Simon Henry 250,000 – – – – 250,000 n/a6,7 n/a
1 Including holdings of connected persons.2 Awards granted under the 2017 GOS vested at 49.7 per cent, awards under the 2018 GOS will vest at 33.75 per cent and all other GOS awards have an expected value of 50 per cent of face value at
grant (in line with the 2017 Remuneration Policy). All values are based on the mid closing price on the 31 December closing price of 36.515 pence.3 Juan Colombás retired as Chief Operating Officer and an Executive Director with effect from 18 September 2020. The number of shares in respect of any GOS Awards (in line with the applicable
Remuneration Policy) due to vest, will be reduced to reflect the period from the start of the Performance Period to 18 September 2020, date of leaving. 4 Appointed 1 October 2020.5 In addition, Nick Prettejohn held 400 (6.475 per cent) preference shares at 1 January 2020 and 31 December 2020.6 Anita Frew retired 21 May 2020 and Simon Henry retired 30 September 2020. Shares held at date of resignation.7 The changes in beneficial interests for António Horta-Osório (1,047) shares) relate to ’partnership’ and ’matching’ shares acquired under the Lloyds Banking Group Share Incentive Plan between
31 December 2020 and 23 February 2021. There have been no other changes up to 23 February 2021. Non-Executive Directors are not eligible to participate in these schemes, therefore, changes non-applicable.

126 Lloyds Banking Group Annual Report and Accounts 2020
Directors’ remuneration report continued
Outstanding share plan interests (audited)
At 1 January
2020Granted/ awarded
Dividends awarded
Vested / released / exercised Lapsed
At 31 December
2020Exercise
price
Exercise periods
NoteFrom To
António Horta-Osório
GOS 2017-2019 5,318,685 – 85,082 528,677 2,675,300 2,114,708 1,2,3
GOS 2018-2020 6,725,221 – – – – 6,725,221 3
GOS 2019 - 2021 7,685,276 – – – – 7,685,276 3
GOS 2020 - 2022 8,281,379 – – – 8,281,379 3,4
Deferred GPS awarded in 2018 388,822 – – 388,822 – 10
Deferred GPS awarded in 2019 1,120,694 – – 747,128 – 373,566 11
2016 Sharesave 14,554 – – – 14,554 47.49p 01/01/2020 30/06/2020 5
2017 Sharesave 21,728 – – – – 21,728 51.03p 01/01/2021 30/06/2021
2019 Sharesave 17,336 – – – – 17,336 39.87p 01/01/2023 30/06/2023
2020 Sharesave 29,690 – – – 29,690 24.25p 01/01/2024 30/06/2024
William Chalmers
GOS 2020-2022 4,927,191 – – – 4,927,191 3,4
Deferred GPS awarded in 2020 316,456 – 79,114 – 237,342 6
Share Buy-Out 7
1,457,748 – – 1,457,748 – 28/01/2020 27/01/2025 7,8
1,124,627 – – – – 1,124,627 28/01/2021 27/01/2026 7
686,085 – – – – 686,085 28/01/2022 27/01/2027 7
2020 Sharesave 46,317 – – – 46,317 24.25p 01/01/2024 30/06/2024
Juan Colombás
GOS 2017-2019 2,951,987 – 47,222 293,427 1,484,851 1,173,709 1,2,3
GOS 2018-2020 3,807,302 – – – – 3,807,302 3,9
GOS 2019 -2021 4,412,086 – – – – 4,412,086 3,9
Deferred GPS awarded in 2018 176,108 – – 124,370 51,738 – 10
Deferred GPS awarded in 2019 501,341 – – 334,224 – 167,117 11
2016 Sharesave 29,109 – – – 29,109 47.49p 01/01/2020 30/06/2020 5
1 The shares awarded in March 2017 vested on 6 March 2020. The closing market price of the Group's ordinary shares on that date was 45.68 pence. Shares vested are subject to a further two-year holding period. Remaining shares will vest over a period of 4 years and are subject to holding periods.
2 2017 GOS award was eligible to receive an amount equal in value to any dividends paid during the performance period. Dividend equivalents have been paid based on the number of shares vested and have been paid in shares. The dividend equivalent shares were paid on 6 March 2020. The closing market price of the Group's ordinary shares on that date was 45.68 pence. The dividend equivalent shares are not subject to any holding period.
3 All GOS have performance periods ending 31 December at the end of the three-year period. Awards were made in the form of conditional rights to free shares. 4 In 2020, awards (in the form of conditional rights to free shares) were made with a value of 250 per cent of salary for António Horta-Osório (8,281,379 shares with a face value of £4,093,453) and
237.5 per cent for William Chalmers (4,927,191 shares with a face value of £2,435,491). No award was made to Juan Colombás. The share price used to calculate face value was 49.429 pence, the average mid market closing share price over the five days prior to grant (27 February to 4 March 2020). As regulations prohibit the payment of dividend on such awards, the number of shares awarded has been determined by applying a share price adjusted to exclude the value of estimated future dividends (38.3175 pence).
5 2016 Sharesave options were not exercised due to the prevailing share price and lapsed on 1 July 2020.6 Part of GPS deferred into shares. The face value of the share awards in respect of deferred GPS granted in March 2020 was £156,423 (316,456 shares) for William Chalmers. The share price used to
calculate the face value is the average price over the five days prior to grant (27 February to 4 March 2020), which was 49.4296 pence. António Horta-Osório and Juan Colombás waived their 2019 GPS The first tranche vested on 6 March 2020 the closing market price of the Group's ordinary shares on that date was 45.68 pence. Shares vested are subject to a further one-year holding period.
7 William Chalmers joined the Group on 3 June 2019 and was appointed as Chief Financial Officer on 1 August 2019 on the retirement of George Culmer. He was granted deferred cash of £2,046,097 and deferred share awards over 4,086,632 Shares, to replace unvested awards from his former employer, Morgan Stanley, that were forfeited as a result of him joining the Group. The deferred cash and the number of Shares over which the deferred share awards were granted was calculated using the USD:GBP exchange rate of 1.2664 and the respective mid-market closing prices of William Chalmers' previous employer and the Group on 3 June 2019 (57.05 pence) resulting in a face value of the awards of £4,377,521. The award is subject to vesting terms in line with those forfeited as set out above, and is on materially the same terms as the Executive Group Ownership Share (GOS), including the discretions as summarised on page 93 of the 2017 Annual Report, but as the award is a buy-out it is not subject to performance conditions and is not subject to time pro-rating in a good leaver circumstances. The award is subject to malus and clawback on the same terms as GOS awards, and in addition is subject to clawback in the event of resignation within one year of grant. The value of the award is not pensionable.
8 Options vested on 27 January 2020 and William Chalmers exercised on 6 March 2020. The closing market price of the Group’s ordinary shares on that date was 45.68 pence. Mr Chalmers retained all the shares apart form 685,366 shares which were sold to meet income tax and National Insurance contributions. 176,593 shares are subject to a six month holding period and 595,789 shares are subject to a 12 month holding period from the date of vesting on 27 January 2020.
9 The number of Shares in respect of the 2018 and 2019 GOS Awards are stated in full and will be reduced to reflect the period from the start of the Performance Period to the date of leaving (18 September 2020) at the point of vest in accordance with the appropriate plan rules.
10 Part of GPS is deferred into shares. The face value of the share awards in respect of GPS granted in March 2018 was £1,058,016 (1,555,288 shares) for António Horta-Osório; £479,200 and (704,426 shares) for Juan Colombás. The share price used to calculate the face value is the average price over the five days prior to grant (27 February to 5 March 2019), which was 63.052 pence. The final tranche of this award vested on 6 March 2020. The closing market price of the Group’s ordinary shares on that date was 45.68 pence. 50 per cent of the final tranche is subject to a one year holding period. The Financial Conduct Authority (FCA) fined the Group for failures in relation to the handling of mortgage customers in payment difficulties or arrears. As a result the Chief Risk Officer had a total adjustment of 68,536 shares (16,798 shares were adjusted in relation to the award made in 2017 and 51,738 shares adjusted in relation to the award made in 2018).
11 Part of GPS is deferred into shares. The face value of the share awards in respect of GPS granted in March 2019 was £942,160 (1,494,258 shares) for António Horta-Osório; £421,473 and (668,453 shares) for Juan Colombás. The share price used to calculate the face value is the average price over the five days prior to grant (27 February to 5 March 2019), which was 63.052 pence. The second tranche of this award vested on 6 March 2020. The closing market price of the Group’s ordinary shares on that date was 45.68 pence. 50 per cent of the final tranche is subject to a one year holding period.

Strategic rep
ortFinancial results
Governance
Risk manag
ement
Financial statements
Other inform
ation Lloyds Banking Group Annual Report and Accounts 2020 127
Shareholding requirements (audited)Executives are expected to build and maintain a company shareholding in direct proportion to their remuneration in order to align their interests to those of shareholders. The minimum shareholding requirements Executive Directors are expected to meet are as follows: 350 per cent of base salary for the Group Chief Executive and 250 per cent of base salary for other Executive Directors. Newly appointed individuals will have three years from appointment to achieve the shareholding requirement. In the event that exceptional individual circumstances exist resulting in an Executive not being able to comply with the Policy, the Remuneration Committee will consider whether an exception should apply.
In addition to the Group’s shareholding requirements, shares vesting are subject to holding periods in line with regulatory requirements. For the year ending 31 December 2020, the Group Chief Executive continued to meet his shareholding requirements, as detailed within the illustration below. The Chief Financial Officer currently holds 153 per cent of his salary in shares and has until 2 June 2022 to achieve the requirement. At the time of his departure in September 2020 the Chief Operating Officer, Juan Colombás held 531 per cent of his salary in shares.
The Group does not operate a formal post-employment shareholding policy. Existing reward structures and the Long Term Share Plan under the proposed new Policy have been designed in line with regulatory requirements and ensure that a substantial proportion of variable reward for Executive Directors and other senior employees takes the form of shares deferred and held over a period of up to eight years. These structures already ensure that Executive Directors continue to meet our shareholding requirements for a minimum of two years after leaving the Group.
None of those who were Directors at the end of the year had any other interest in the capital of Lloyds Banking Group plc or its subsidiaries.
Shareholding requirement
Actual shareholding1
Shareholding requirement
Actual shareholding1
0 130 260 390 520 650 780 910 1040 1170 1300
0 130 260 390 520 650 780 910 1040 1170 1300
Shareholding requirement2
Actual shareholding1
0 130 260 390 520 650 780 910 1040 1170 1300
350%António Horta-Osório
250%
531%
643%
Juan Colombás
250%
153%
William Chalmers
1 Calculated using the average share price for the period 1 January 2020 to 31 December 2020 (35.79 pence). Includes ordinary shares acquired through the vesting of the deferred Group Performance Share plan, Fixed Share Awards as the shares have no performance conditions; American Deposit Receipts (ADRs) with each one ADR equating to four shares, Executive Share Awards which have vested but have not been exercised; shares held in the Share Incentive Plan (SIP) Trust, i.e. Free, Partnership, Matching and Dividend shares which are no longer subject to forfeiture, as defined in the SIP Rules. Shares held by Connected Persons, as defined by the Companies Act, but broadly meaning spouse or partner and children, may also be included.
2 The Chief Financial Officer has until 2 June 2022 to achieve the requirement.

128 Lloyds Banking Group Annual Report and Accounts 2020
Directors’ remuneration report continued
2020 Group Ownership share performance measures (for awards made in March 2020) (audited)Meeting threshold performance will result in 25 per cent vesting of each metric, relative to each weighting.
Strategic priorities Measure Basis of payout range Metric Weighting
Creating the best customer experience
Customer satisfaction Major Group average ranking over 2022
Threshold: 3rdMaximum: 1st
10%
Digital net promoter score Set relative to 2022 targets Threshold: 65.3Maximum: 68.3
7.5%
FCA total reportable complaints and Financial Ombudsman Service (FOS) change rate
Set relative to 2022 targetsAverage rates over 2022
Threshold: 2.65Maximum: 2.52 Threshold: 30%Maximum: 25%
10%
Becoming simpler and more efficient
Statutory economic profit1 Set relative to 2022 targets Threshold: £1,965mMaximum: £2,948m
15%
Cost:income ratio Set relative to 2022 targets Threshold: 46.4%Maximum: 43.9%
10%
Delivering sustainable growth
Absolute total shareholder return (TSR) Growth in share price including dividends over 3-year period
Threshold: 8% Maximum: 16%
40%
Building the best team Employee engagement index Set relative to 2022 markets norms
Threshold: +5% vs. UK NormMaximum: +2% vs. UK High Performing Norm
7.5%
1 A measure of profit taking into account expected losses, tax and a charge for equity utilisation.
Chair and Non-Executive Director fees in 2020The annual fee for the Chair will remain at £618,230 and there will be no increase in Non-Executive Directors fees for 2021, in line with executive population.
2021 2020
Basic Non-Executive Director fee £81,200 £81,200
Deputy Chair £106,000 £106,000
Senior Independent Director £63,600 £63,600
Audit Committee Chair £74,300 £74,300
Remuneration Committee Chair £74,300 £74,300
Risk Committee Chair £74,300 £74,300
Responsible Business Committee Chair £42,400 £42,400
IT Forum Chair £42,400 £42,400
Audit Committee Member £34,000 £34,000
Remuneration Committee Member £34,000 £34,000
Risk Committee Member £34,000 £34,000
Responsible Business Committee Member £15,900 £15,900
Nomination and Governance Committee Member £15,900 £15,900
Non-Executive Directors may receive more than one of the above fees.

Strategic rep
ortFinancial results
Governance
Risk manag
ement
Financial statements
Other inform
ation Lloyds Banking Group Annual Report and Accounts 2020 129
Percentage change in remuneration levelsFigures for ‘All employees’ are calculated using figures for all colleagues eligible for the GPS plan. This population is considered to be the most appropriate group of employees for these purposes because its remuneration structure is consistent with that of the Group Chief Executive. For 2020, 69,147 colleagues were included in this category.
% change inbase salary/fees
(2019 to 2020)% change in GPS
(2019 to 2020)% change in benefits
(2019 to 2020)
All employees4 2.4%2 (100)%2,3 2.4%2
Executive Directors
António Horta-Osório 2% 0%1,3 2%
Juan Colombás 0% 0%1,3 0%
William Chalmers 2% (100)%1,3 2%
Non-Executive Directors
Robin Budenberg CBE NA NA NA
Alan Dickinson 2% NA NA
Simon Henry 2% NA NA
Sarah Legg 2% NA NA
Lord Lupton CBE 2% NA NA
Amanda Mackenzie OBE 2% NA NA
Nick Prettejohn 2% NA NA
Stuart Sinclair 2% NA NA
Sara Weller CBE 2% NA NA
Catherine Woods 2% NA NA
1 Reflects the increase in base salary from 1 January 2020 against which the award is determined.2 Adjusted for movements in colleagues numbers and other impacts to ensure a like-for-like comparison. Salary increases effective 1 April 2020.3 The Remuneration Committee set a policy at the start of 2020 that if Underlying Profit was 20 per cent below target, no GPS awards would be payable. The threshold was not met and therefore
there are no GPS awards for 2020 performance. 4 Lloyds Banking Group is not a contracting entity but considered this population to be appropriate for purposes of a 'All employees' calculation.
Gender payWhile we have further reduced the mean pay gap this year to 30.5 per cent from 32.8 per cent in 2017 the pay gaps are still larger than we would like.
Our ambitious goal of women comprising 40 per cent of our senior management by the end of 2020 has seen us advance from 27 per cent in 2014 to 37 per cent at the end of 2019. This demonstrates the significant progress we have made, and it would not have happened without the goal and all the measures we put into place. Further information is available at https://www.lloydsbankinggroup.com/assets/pdfs/who-we-are/responsible-business/downloads/lbg-gender-pay-gap-report-2019-20.pdf/lloydsbankinggroup.com)
2019
2020
Mean pay gap%
30.9%
30.5%
2019
2020
Mean bonus gap%
64.2%
62.5%
Ethnicity payWhile there is currently no legal requirement to publish Ethnicity Pay Data in the UK, we are publishing this data not only because it is the right thing to do, but it also holds us to account for the goals we have set.
On average, and at all grades within Lloyds Banking Group, our Black, Asian and Minority Ethnic colleagues are not paid less than White colleagues. Instead our Ethnicity pay and bonus gaps reflect our organisational makeup. Further information is available at https://www.lloydsbankinggroup.com/who-we-are/responsible-business/inclusion-and-diversity/ethnicity/ethnicity-pay-gap-report.html
2020
Mean pay gap%
6.8%
2019
2020
Mean bonus gap%
26.3%
Group wide remuneration

130 Lloyds Banking Group Annual Report and Accounts 2020
Directors’ remuneration report continued
Chief Executive Officer pay ratioThe Remuneration Committee views pay ratios as a useful reference point to inform policy setting, but also takes into consideration a number of other factors. The table below shows the ratios of the Group Chief Executive’s total remuneration to the remuneration of colleagues since 2017. The change in the pay ratios for 2020 is explained in more detail below.
Year
Total Compensation Fixed pay
MethodologyP25
(Lower Quartile)P50
(Median)P75
(Upper Quartile)P25
(Lower Quartile)P50
(Median)P75
(Upper Quartile)
2020 A 132:1 95:1 54:1 103:1 75:1 42:1
2019 A 179:1 128:1 71:1 114:1 82:1 47:1
2018 A 237:1 169:1 93:1 113:1 81:1 48:1
2017 A 245:1 177:1 97:1 113:1 82:1 48:1
Y-o-Y (2019 v 2020) (26%) (9%)
Notes to the table: The 2020 total remuneration for the colleagues identified at P25, P50 and P75 are as follows: £26,135, £ 36,165, £63,522 The 2020 base salary for the colleagues identified at P25, P50 and P75 are as follows: £22,617, £31,953, £53,857 The P25, P50 and P75 colleagues were determined on 31 December 2020 based on calculating total remuneration for all UK employees for the 2020 financial year. Payroll data from 1 January 2020 to 31 December 2020.
Methodology option A has been used and was selected on the basis that it provided the most accurate means of identifying the median, lower and upper quartile colleagues.
Colleague total remuneration has been calculated in line with the single total figure of remuneration. The single total figure of remuneration has been calculated for 64,767 UK colleagues within the Group for a full year including full-time equivalent base pay, vesting Group Ownership Share awards (for eligible colleagues), core benefits, pension, overtime and shift payments, travel/relocation payments (for eligible colleagues) and private medical benefit.
The average share price between 1 October 2020 and 31 December 2020 (32.62 pence) has been used to indicate the value of vesting Group Ownership Share awards.
The colleague identified at P50 did not receive a separate car benefit and does not participate in the long term incentive plan. As a result, the ratio does not provide a direct comparison to the total remuneration of the Group Chief Executive.
Due to operational constraints, the calculation of the colleague Pension Input Figure excludes inflationary adjustments for those on the defined benefit scheme. The omission of this factor does not materially affect the outcome of the ratio and/or distort the validity of the valuation.
All other data has been calculated in line with the methodology for the single total figure of remuneration for the Group Chief Executive.
The median ratio has decreased 26 per cent year-on-year. The reduction can be attributed to the decision not to make awards under the Group Performance Share Plan; the reduction in the performance of vesting LTIP; reduced performance in the vesting of the 2018 Group Ownership plan compared to 2017 and the reduction in the Group Chief Executive's pension allowance from 33 per cent to 15 per cent of salary.
The Committee is thoughtful of the volatility in pay ratios due to variable reward outcomes. Although the pay ratio is used as a useful reference point to inform policy-setting, the Committee takes into account a number of other factors to assess colleague pay progression.
For the majority of colleagues, year-on-year changes in remuneration are principally driven by pay increases and the impacts of Group performance and collective adjustment which has resulted in a reduction in the bonus pool. The Group has a commitment to pay progression and a continued focus on ensuring higher pay awards for colleagues who are lower paid, or paid lower within their pay range. We are committed to reducing the pay gap between executives and wider colleagues and continue to remain focused on addressing the gap from the bottom up and not just from the top down. To support, the Group has a commitment to pay progression and a continued focus on ensuring higher pay awards for colleagues who are lower paid, or paid lower within their pay range.
For 2021, the pay budget has been set at 1.2 per cent, with the vast majority of colleagues receiving an above inflation pay increase. In addition a minimum pay award of £400 will apply for all eligible colleagues and pay awards of up to 2.2 per cent for the lowest paid colleagues. There was no pay budget for senior colleagues.
We believe our approach to pay progression has contributed to the reduction of the 2020 median pay ratio and supports reducing the gap between executive and wider colleague pay over time.
We are proud to be an accredited Living Wage employer since 2015, and from April 2021 we will go further and raise the minimum salary for all full-time colleagues to £18,385, reflecting a rate of £10.10 per hour which is 16 per cent greater than the National Living Wage1 and 60 pence greater than current Living Wage Foundation’s UK wide real Living Wage2.
1 National Living wage rate of £8.72 per hour2 National Real Living Wage rate of £9.50 per hour

Strategic rep
ortFinancial results
Governance
Risk manag
ement
Financial statements
Other inform
ation Lloyds Banking Group Annual Report and Accounts 2020 131
Implementation of the policy in 2021
Base SalaryThe Group has applied a total pay budget of 1.2 per cent including a minimum pay award of £400 for eligible colleagues. The approach focuses on lower paid colleagues and colleagues lower in their pay range.
It was agreed that no salary increases would apply for the Group Chief Executive (GCE) and Chief Financial Officer (CFO).Salaries will therefore be as follows:Current Group Chief Executive: £1,294,674Chief Financial Officer: £810,837
Incoming Group Chief ExecutiveSalary: £1,125,000 a reduction of 13 per cent compared to current incumbent.
Fixed Share AwardAwards remain unchanged from 2020 as follows:Current Group Chief Executive: £1,050,000 Chief Financial Officer: £504,000
Shares will be released in equal tranches over three years. (See page 135 for further details).
Incoming Group Chief ExecutiveFixed Share Award: £1,050,000 no change compared to current incumbent.
PensionPension allowances for all Executive Directors is set at 15 per cent of base salary. Any new Executive Director appointments in 2021 will also attract a maximum allowance of 15 per cent of base salary, this include the incoming Group Chief Executive.
Over 50,000 colleagues participate in the Group’s Defined Contribution (DC) Pension scheme where the maximum opportunity for the workforce is 15 per cent of base salary. Executive Directors employer pension contributions are therefore aligned with those available to the majority of the workforce.
In addition to the DC arrangement, the Group currently has almost 14,000 active members in defined benefit plans, with the effective cost of employer contributions into these arrangements being 38 per cent of salary.
BenefitsBenefits remain unchanged from 2020. Executive Directors receive a flexible benefit allowance in line with colleagues, (4 per cent of base salary).
This can be used to select benefits including life assurance and critical illness cover. Other benefits include car allowance, transportation, tax preparation and private medical cover.
Group Performance Share (Bonus)The performance measures for determining any individual 2021 Group Performance Share awards for Executive Directors are outlined in the 2021 balanced scorecard below.
Individual maximum opportunities for Executive Directors remain unchanged from 2020 at 140 per cent of base salary for the current and incoming Group Chief Executive and 100 per cent for other Executive Directors.
Individual awards as a percentage of maximum will directly correlate to the overall performance assessment outcome.
For the 2021 performance year, any Group Performance Share opportunity will be awarded in March 2022 in a combination of cash (up to 50 per cent) and shares.
In accordance with the Policy, deferral and vesting of any Group Performance Share awards will be structured so that in
combination with any award under the Long Term Share Plan, there will be a deferral of variable remuneration in line with applicable regulatory requirements (currently requiring a deferral of 60 per cent of variable remuneration for executive directors).
The 2020 Directors’ Remuneration Policy was approved at the 2020 AGM in May. The Group proposes to operate the policy in the following way for 2021. No decisions have been reached on how the current Group Chief Executive will be treated for variable remuneration during 2021 (prior to departure), and this will be communicated in the normal course of business during 2021.

132 Lloyds Banking Group Annual Report and Accounts 2020
Directors’ remuneration report continued
Long Term Share PlanIt is an important feature of the LTSP that performance is assessed and appropriately recognised upfront in the award size as there are no performance conditions that apply after the award is granted (only underpins – see below). This is not however a mechanical outturn, as with GPS, and the Remuneration Committee may exercise its judgement.
Pre-grant testThe decision to award Long Term Share Plan awards for 2021 is based on the performance assessment from the 2020 balanced scorecard provided on page 121.
The Remuneration Committee concluded that the Group’s score of 3.13 (out of 5) and specifically the performance of non-financial and strategic components within the scorecard which remain strong, supported making awards at the lower end of the range for normal expected performance (125 – 150 per cent of salary for Executive Directors). However, the Remuneration Committee considers that restraint should be shown in any reward for 2020 performance, and therefore has reduced the award recommended for the Chief Financial Officer from 125 per cent of salary to 75 per cent of salary. This reduction of 40 per cent is consistent with awards made to other members of senior management and applies in addition to the 50 per cent discount applied in setting the policy maximum when converting from the old LTIP to the new LTSP awards. There is no award for the Group Chief Executive.
In deciding to make this reduction in award size, the Group’s share price was considered, as well as the following three questions:
Do the Group’s financial results and capital position adequately reflect risk, conduct and any other non-financial considerations, including ESG?
Has the Group suffered a serious conduct event or has severe reputational damage arisen from the Group not living its values?
Has the bank lived up to its ambition to be the Best Bank for Customers?
The Committee concluded that the Group’s strong capital position, positive reputation through 2020 and the support for customers and businesses during 2020 supported the making of awards. Risk was well managed and there was a material reduction in conduct-related costs. The Committee noted that there was still work to do toward achieving the Group’s gender and diversity goals, but felt comfortable that these were reflected in stretch targets in the 2021 balanced scorecard.
UnderpinsThe underpins that will apply to the 2021 LTSP awards are:
CET 1 ratio – Group CET1 ratio above the guided management target each year, including all regulatory buffers
ROTE – Group ROTE exceeds the average for UK peer banks over the three years
Ordinary Dividend – Increased ordinary dividend payments over the plan period (subject to any further sector-wide regulatory constraints).
The peer comparator group for the ROTE underpin is set at Barclays Group PLC, HSBC Holdings PLC, Natwest Group PLC, Santander UK PLC and Virgin Money UK PLC. ROTE will be measured on the new basis adopted from 2021 and will take into
account adjustments (as appropriate) for methodology differences between peers and any other factors the Remuneration Committee considers should reasonably be reflected, including relative under or out-performance or change in business mix.
Awards will not be subject to further performance conditions however vesting will be subject to three underpins thresholds applicable for the first three years from grant. Each year the Remuneration Committee will monitor the Group’s progress in relation to the underpins. An assessment will be made at the end of the three year period to determine whether the underpins have been successfully maintained over the three years and to what extent the LTSP award should vest. The Remuneration Committee also will retain the right to consider other factors and apply discretion prior to making a decision on vesting.
Pre-vest testIn conjunction with the assessment of performance against the underpins, the Remuneration Committee will consider the three core questions above to satisfy itself that the performance considered in the pre-grant test has been sustainable. The Remuneration Committee will retain the right to consider other factors and apply general discretion in making a decision on the vesting of awards. This approach helps to avoid any potential unintended outcomes that might arise from the application of formulaic performance criteria in the underpins and ensure that there is a fair outcome. The Committee will explain its reasons for applying discretion in either direction, or for not doing so
Incoming Group Chief ExecutiveSalary: see table above
Fixed Share Award: see table above
Pension:15 per cent of salary, in accordance with the level set in the Directors' Remuneration Policy that aligns with arrangements for the majority of the workforce.
Group performance share: Maximum Group Performance Share award of 140 per cent of base salary.
Long Term Share Plan:Maximum award of 150 per cent of base salary.
Buy out / lost opportunity award:On appointment, Mr. Nunn will be granted deferred cash and share awards to replace, like for like, unvested HSBC awards that are forfeited as a result of him joining Lloyds Banking Group. The awards to be granted match the vesting and retention period attached to the awards being forfeited.
In addition, to acknowledge the loss in expected bonus awards from HSBC for the 2020 performance year, a 'lost opportunity' bonus award will be made on hire or as soon as reasonably practicable thereafter. The value of this award will be calculated by reference to the 2019 bonus, adjusted as appropriate by reference to HSBC's total Group bonus pool as disclosed in their 2020
Annual Report and Accounts. The awards granted will be delivered in a mixture of cash and shares in accordance with the rules generally applicable to Lloyds Banking Group awards.
Details of these awards will be published during 2021.
Total reward:The total maximum reward package for the incoming Group Chief Executive has been reduced by approximately 20 per cent from the current Directors’ Remuneration Policy maximum that was approved at the 2020 AGM and is a total reduction of over 40 per cent from the Policy in force until as recently as 2019.

Strategic rep
ortFinancial results
Governance
Risk manag
ement
Financial statements
Other inform
ation Lloyds Banking Group Annual Report and Accounts 2020 133
2021 Group Performance ScorecardThe performance measures for determining any 2021 Group performance share awards and 2022 long term share plan awards for the Executive Directors are shown in the table below.
The measures and targets are set annually by the Remuneration Committee to reflect the strategic priorities of the Group and take into account both the annual financial plan and operating plan against the backdrop of the rapidly evolving external economic and societal landscape.
Quantitative financial measures make up 50 per cent of the scorecard, with the remaining 50 per cent made up of strategic measures assessed by the Remuneration Committee using quantitative inputs. When determining the final outcome, the Remuneration Committee may consider any personal or business area objectives and whether there has been effective, consistent and proactive risk management and conduct outcomes across all dimensions.
When assessing performance, the Committee can exercise its judgment to determine the appropriate outcome. This helps to avoid any potential unintended outcomes that might arise from the application of formulaic performance criteria.
Performance AdjustmentPerformance adjustment is determined by the Remuneration Committee and/or Board Risk Committee and may result in a reduction of up to 100 per cent variable remuneration opportunity for the relevant period. It can be applied on a collective or individual basis. When considering collective adjustment, the Remuneration Committee and Board Risk Committee regarding any adjustments required to balanced scorecards or the overall GPS and/or LTSP outcome to reflect in-year or prior year risk matters.
The application of malus will generally be considered when:
there is reasonable evidence of employee misbehaviour or material error or that they participated in conduct which resulted in losses for the Group or failed to meet
appropriate standards of fitness and propriety;
there is material failure of risk management at a Group, business area, division and/or business unit level;
the Committee determines that the financial results for a given year do not support the level of variable remuneration awarded; and/or
any other circumstances where the Committee consider adjustments should be made.
Judgement on individual performance adjustment is informed by taking into account the severity of the issue, the individual’s proximity to the issue and the individual’s behaviour in relation to the issue. Individual adjustment may be applied
through adjustments to balanced scorecard assessments and/or through reducing the variable remuneration outcome.
Awards are subject to clawback for a period of up to seven years after the date of award which may be extended to 10 years where there is an ongoing internal or regulatory investigation.
The application of clawback will generally be considered when:
there is reasonable evidence of employee misbehaviour or material error; or
there is material failure of risk management at a Group, business area, division and/or business unit level.
TargetsProposed measures and weightings
Targets will be disclosed retrospectively in the 2021 Annual Report alongside the level of performance achieved, as the Remuneration Committee considers such targets to be commercially sensitive. However a target range has been set in line with our operating plan and, where applicable, forward-looking guidance.
Measures of strategic non-financial performance have been agreed by the Remuneration Committee to evaluate performance during 2021.
50% Financial
50% Strategic
Operating costs (excl. remediation)
Increasing our gender and ethnic representation in senior roles
Customer Dashboard – our assessment of how effectively we are serving customers across all brands, products and services
Culture and colleague engagement – our performance relative to external benchmark scores
Reducing operational carbon emissions
Statutory ROTE
Statutory profit after tax 20%
20%
25%
10%
10%
7.5%
7.5%
Risk
/ C
ondu
ct

134 Lloyds Banking Group Annual Report and Accounts 2020
Directors’ remuneration report continued
Remuneration Committee The Committee comprises of six Non-Executive Directors from a wide background to provide a balanced and independent view on remuneration matters. Lord Blackwell retired from the Board and the Committee on 1 January 2021. Anita Frew retired from the Board and the Committee on 21 May 2020. Stuart Sinclair has been Chair of the Committee since 1 September 2018 and has been a member of the Committee since January 2016. For further details of Committee membership and attendance at meetings, please see page 86.
The purpose of the Committee is to set the remuneration for all Executive Directors and the Chair, including pension rights and any compensation payments. It recommends and monitors the level and structure of remuneration for senior management and material risk takers. It also considers, agrees and recommends to the Board an overall remuneration policy and philosophy for the Group that is aligned with its long-term business strategy, its business objectives, its risk appetite, purpose and values and the long-term interests of the Group, and recognises the interests of relevant stakeholders, including the wider workforce. The Committee's operation is designed to ensure that no conflicts of interest arise, and in particular, the Committee ensures that no individual is present when matters relating to their own remuneration are discussed.
Mercer was appointed by the Committee in 2016 following a competitive tender process and was retained for 2020. The Committee is of the view that Mercer provides independent remuneration advice to the Committee and does not have any connections with the Group or any director that may impair its independence. The broader Mercer company provides unrelated advice on accounting and investments. During the year the Committee requested advice and independent research on market and best practice in relation to fixed and variable reward structures to support formulating the Policy. Mercer attended Committee meetings upon invitation and fees payable for the provision of services in 2020 were £14,921.
How the Remuneration Committee spent its time in 2020 and compliance with the 2018 Corporate Governance Code
Key Highlights Oversight and approval
Incoming Group Chief Executive
The total maximum reward package for the new Group Chief Executive has been reduced by approximately 20 per cent from the current Policy maximum that was approved at the 2020 AGM
The search for a new Chief Executive has been a significant focus for the Remuneration Committee.
Each component of the package for the new Group Chief Executive, Charlie Nunn, have been set in accordance with the approved Policy and as announced on 30 November 2020 will include a basic salary of £1,125,000 and a Fixed Share Award of £1,050,000. The pension contribution has also been set at 15 per cent of salary, in line with the majority of the workforce. He will be eligible for a maximum Group Performance Share award of 140 per cent of basic salary and has agreed to limit the maximum award under the LTSP to 150 per cent.
Executive Pay Zero pay increases for 2021
The Remuneration Committee considers the need for significant restraint and as such there are no pay increases proposed for Executive Directors and only limited awards made to other senior colleagues where they are paid below market rate, creating a retention risk.
Long Term Share Plan
Awards will be granted to a small number of senior colleagues
Remuneration Committee supported making awards under the new Long Term Share Plan (LTSP) introduced at the AGM in May 2020.
Awards will be granted to a small number of leaders, to ensure colleagues, to ensure there is alignment to shareholder experience and retain critical talent through the next phase of the Group’s strategic delivery.
Colleague and wider workforce
Colleague Fixed Pay
Above inflation pay award to our lowest paid colleagues
Measured against our core principle of ensuring there is fairness in our remuneration structure, the Remuneration Committee has paid particular regard to the impact its decisions have had for all colleagues.
We made an above inflation pay award to our lowest paid colleagues in April 2020, and paid a one-off £250 cash recognition award to nearly 40,000 predominantly customer-facing colleagues in July 2020. This means that, on average, the total remuneration of the lowest paid colleagues has stayed flat from 2019 to 2020.
2020 Group Performance Share Outcome
£0m 2020 Group Performance Share pool
The Remuneration Committee set a policy at the start of 2020 that if Underlying Profit (UP) was 20 per cent below target, no GPS awards would be payable.
The impact of the pandemic on our financial results meant there was no annual bonus pool.
In keeping with our approach to timely, open and honest communication with colleagues, we decided to communicate this outcome in December 2020. This is in no way reflective of the hard work, commitment and sacrifice our colleagues have made throughout the year to keep our business running and help our customers.
Colleague Recognition Award
£400 share award to all colleagues
To recognise further the considerable role that all colleagues have played in supporting customers in 2020, and the part they will play in delivering the next phase of the Group’s strategy, every permanent colleague across the Group will receive a £400 share award.
Shareholders
Shareholder Engagement
Responding to Shareholder Feedback
We were pleased to gain support at the 2020 AGM for the amendments we made to our Directors’ Remuneration Policy. However we recognise that there were a significant number of votes opposing these resolutions indicating that there were concerns with some aspect of our policy’s design.
Following extensive and productive discussions additional clarity has been provided in the 2020 Directors Remuneration Report regarding the 50 per cent discount applied to the Long Term Share Plan (LTSP), as well as detail regarding our proposed simplified balanced scorecard for 2021.
Statement of voting at Annual General MeetingThe table below sets out the voting outcome at the Annual General Meeting in May 2020 in relation to the annual report on remuneration and the Remuneration Policy. Extensive and productive discussions have been held with our shareholders and further information can be found on page 118
Votes cast in favour Votes cast against Votes withheld
Number of shares (millions)
Percentage of votes cast
Number of shares (millions)
Percentage of votes cast
Number of shares (millions)
2019 annual report on remuneration (advisory vote) 44,123 94.97% 2,338 5.03% 171
Directors’ remuneration policy (binding vote in 2020) 29,212 63.82% 16,562 36.18% 858

Strategic rep
ortFinancial results
Governance
Risk manag
ement
Financial statements
Other inform
ation Lloyds Banking Group Annual Report and Accounts 2020 135
Directors’ Remuneration Policy
Base salaryPurpose and link to strategyTo support the recruitment and retention of Executive Directors of the calibre required to develop and deliver the Group’s strategic priorities. Base salary reflects the role of the individual, taking account of market competitiveness, responsibilities and experience, and pay in the Group as a whole.
OperationBase salaries are typically reviewed annually with any increases normally taking effect from 1 April for Executive Directors. When determining and reviewing base salary levels, the Committee takes into account base salary increases for employees throughout the Group and ensures that decisions are made within the following two parameters:
An objective assessment of the individual’s responsibilities and the size and scope of their role, using objective job-sizing methodologies.
Pay for comparable roles in comparable publicly listed financial services groups of a similar size.
Salary may be paid in sterling or other currency and at an exchange rate determined by the Committee.
Maximum Potential The Committee will make no increase which it believes is inconsistent with the two parameters above. Increases will normally be in line with the increase awarded to the overall employee population. However, a
greater salary increase may be appropriate in certain circumstances, such as a new appointment made on a salary below a market competitive level, where phased increases are planned, or where there has been an increase in the responsibilities of an individual. Where increases are awarded in excess of the wider employee population, the Committee will provide an explanation in the relevant annual report on remuneration.
Performance measuresN/A
Fixed share awardPurpose and link to strategyTo ensure that total fixed remuneration is commensurate with role and to provide a competitive reward package for Executive Directors with an appropriate balance of fixed and variable remuneration, in line with regulatory requirements.
OperationThe fixed share award will be delivered entirely in Lloyds Banking Group shares, released over three years with 33 per cent being released each year following the year of award. The Committee can, however, decide to deliver some or all of it in the form of cash.
Maximum Potential The maximum award is 100 per cent of base salary.
Performance measuresN/A
PensionPurpose and link to strategyTo provide cost effective and market competitive retirement benefits, supporting Executive Directors in building long-term retirement savings.
OperationExecutive Directors are entitled to participate in the Group’s defined contribution scheme with company contributions set
as a percentage of salary. An individual may elect to receive some or all of their pension allowance as cash in lieu of pension contribution.
Maximum Potential The maximum allowance for all Executive Directors is 15 per cent of base salary. All future appointments as Executive Directors will also attract a maximum allowance
of 15 per cent of base salary in line with the majority of the workforce. Maximum allowance may be increased or decreased in order to remain aligned.
Performance measuresN/A
BenefitsPurpose and link to strategyTo provide flexible benefits as part of a competitive remuneration package.
OperationBenefits may include those currently provided and disclosed in the annual report on remuneration.
Core benefits include a company car or car allowance, private medical insurance, life insurance and other benefits that may be selected through the Group’s flexible benefits plan.
Additional benefits may be provided to individuals in certain circumstances such as
relocation. This may include benefits such as accommodation, relocation, and travel. The Committee retains the right to provide additional benefits depending on individual circumstances.
When determining and reviewing the level of benefits provided, the Committee ensures that decisions are made within the following two parameters:
An objective assessment of the individual’s responsibilities and the size and scope of their role, using objective job-sizing methodologies.
Benefits for comparable roles in comparable publicly listed financial services groups of a similar size.
Maximum Potential The Committee will only make increases in the benefits currently provided which it believes are consistent with the two parameters above. Executive Directors receive a flexible benefits allowance, in line with all other colleagues. The flexible benefits allowance does not currently exceed 4 per cent of base salary.
Performance measuresN/A
The Group’s remuneration policy was approved at the AGM on 21 May 2020 and took effect from that date. It is intended that approval of the remuneration policy will be sought at three-year intervals, unless amendments to the policy are required, in which case further shareholder approval will be sought; no changes are proposed for 2020. The full policy is set out in the 2019 annual report and accounts (pages 115 to 123) which is available at: 2019_lbg_annual_report.pdf (lloydsbankinggroup.com)
The tables in this section provide a summary of the Directors’ remuneration policy. There is no significant difference between the policy for Executive Directors and that for other colleagues. Further information about the remuneration policy for other colleagues is set out in section ‘Other remuneration disclosures' on page 138.
Remuneration policy table for Executive Directors

136 Lloyds Banking Group Annual Report and Accounts 2020
Directors’ remuneration report continued
All-employee plansPurpose and link to strategy Executive Directors are eligible to participate in HMRC-approved share plans which promote share ownership by giving employees an opportunity to invest in Group shares.
Operation Executive Directors may participate in these plans in line with HMRC guidelines currently
prevailing (where relevant), on the same basis as other eligible employees.
Maximum potential Participation levels may be increased up to HMRC limits as amended from time to time. The monthly savings limits for Save As You Earn (SAYE) is currently £500. The maximum value of shares that may be purchased under the Share Incentive Plan (SIP) in any year is
currently £1,800 with a two-for-one match. Currently a three-for-two match is operated up to a maximum colleague investment of £30 per month. The maximum value of free shares that may be awarded in any year is £3,600.
Performance measures N/A
Group Performance Share PlanPurpose and link to strategy To incentivise and reward the achievement of the Group’s annual financial and strategic targets whilst supporting the delivery of long-term superior and sustainable returns.
Operation Measures and targets are set annually and awards are determined by the Committee after the year end based on performance against the targets set. The Group Performance Share may be delivered partly in cash, shares, notes or other debt instruments including contingent convertible bonds. Where all or part of any award is deferred, the Committee may adjust these deferred awards in the event of any variation of share capital, demerger, special dividend or distribution or amend the terms of the plan in accordance with the plan rules.
Where an award or a deferred award is in shares or other share-linked instrument, the number of shares to be awarded may be calculated using a fair value or based on discount to market value, as appropriate. The Committee applies its judgement to
determine the payout level commensurate with business and/or individual performance or other factors as determined by the Committee. The Committee may reduce the level of award (including to zero), apply additional conditions to the vesting, or delay the vesting of deferred awards to a specified date or until conditions set by the Committee are satisfied, where it considers it appropriate. Awards may be subject to malus and clawback for a period of up to seven years after the date of award which may be extended to 10 years where there is an ongoing internal or regulatory investigation.
Maximum potential The maximum Group Performance Share opportunities are 140 per cent of base salary for the Group Chief Executive and 100 per cent of base salary for other Executive Directors.
Performance measures Measures and targets are set annually by the Committee in line with the Group’s strategic business plan and further details are set out in the annual report on remuneration
for the relevant year. Measures consist of both financial and non-financial measures and the weighting of these measures will be determined annually by the Committee.
All assessments of performance are ultimately subject to the Committee’s judgement, but no award will be made if threshold performance (as determined by the Committee) is not met for financial measures or the individual receives less than 40 per cent out of 100 per cent. The normal ‘target’ level of the Group Performance Share is 50 per cent of maximum opportunity.
The Committee is committed to providing transparency in its decision making in respect of Group Performance Share awards and will disclose historic measures and target information together with information relating to how the Group has performed against those targets in the annual report on remuneration for the relevant year except to the extent that this information is deemed to be commercially sensitive, in which case it will be disclosed once it is deemed not to be sensitive.
Long Term Share PlanPurpose and link to strategy Long term variable reward opportunity to align executive management incentives and behaviours to the Group’s objectives of delivering long-term superior and sustainable returns. The Long Term Share Plan will incentives stewardship over a long time horizon and promote good governance through a simple alignment with the interest of shareholders.
OperationFrom 2021, awards will be granted under the rules of the 2020 Long-Term Share Plan, that were approved at the AGM on 21 May 2020. Awards are made in the form of conditional shares and award levels are set at the time of grant, in compliance with regulatory requirements, and may be subject to a discount in determining total variable remuneration under the rules set by the European Banking Authority. The number of shares to be awarded may be calculated using a fair value or based on a discount to market value, as appropriate.
Vesting will be subject to an assessment of underpin thresholds being maintained measured over a period of three years, or such longer period, as determined by the Committee.
The Committee retains full discretion to amend the payout levels should the award not reflect business and/or individual performance. The Committee may reduce (including to zero) the level of the award, apply additional conditions to the vesting, or delay the vesting of awards to a specified date or until conditions set by the Committee are satisfied, where it considers it appropriate.
Awards may be subject to malus and clawback for a period of up to seven years after the date of award which may be extended to 10 years where there is an ongoing internal or regulatory investigation.
Maximum potential The maximum Long Term Share Plan opportunity is 200 per cent of base salary for all Executive Directors including the current Group Chief Executive.
The maximum for the incoming Group Chief Executive will be 150 per cent of base salary.
Performance measuresAn award may be granted by the Remuneration Committee taking into account an assessment of performance of the Company, any Member of the Group or business unit or team, and/or the performance, conduct or capability of the Participant, on such basis as the Committee determine. The normal ‘target’ level of the Long Term Share award is 150 per cent of base salary.
No further performance conditions will apply. However vesting will be subject to the underpins and Remuneration Committee discretion as described on page 132.

Strategic rep
ortFinancial results
Governance
Risk manag
ement
Financial statements
Other inform
ation Lloyds Banking Group Annual Report and Accounts 2020 137
Service agreements The service contracts of all current Executive Directors are terminable on 12 months’ notice from the Group and six months’ notice from the individual. The Chair also has a letter of appointment. His engagement may be terminated on six months’ notice by either the Group or him.
Letters of appointmentThe Non-Executive Directors all have letters of appointment and are appointed for an initial term of three years after which their appointment may continue subject to an annual review. Non-Executive Directors may have their appointment terminated, in accordance with statute and the articles of association, at any time with immediate effect and without compensation.
All Directors are subject to annual re-election by shareholders.
The service contracts and letters of appointments are available for inspection at the Company’s registered office.
Deferral of variable remuneration and holding periodsOperation The Group Performance Share and Long Term Share plans are both considered variable remuneration for the purpose of regulatory payment and deferral requirements. The payment of variable remuneration and deferral levels are determined at the time of award and in compliance with regulatory requirements
(which currently require that at least 60 per cent of total variable remuneration is deferred for seven years with pro rata vesting between the third and seventh year, and at least 50 per cent of total variable remuneration is paid in shares or other equity linked instruments subject to a holding period in line with current regulatory requirements).
A proportion of the aggregate variable remuneration may vest immediately on award. The remaining proportion of the variable remuneration is then deferred in line with regulatory requirements.
Chairman and Non-Executive Director feesPurpose and link to strategyTo provide an appropriate reward to attract and retain a high-calibre individual with the relevant skills, knowledge and experience
OperationThe Committee is responsible for evaluating and making recommendations to the Board with regards to the Chair’s fees. The Chair does not participate in these discussions. The Group Chief Executive and the Chair are responsible for evaluating and making recommendations to the Board in relation to the fees of the Non-Executive Directors. When determining and reviewing fee and benefit levels, the Committee ensures that decisions are made within the following parameters:
The individual’s skills and experience. An objective assessment of the individual’s responsibilities and the size and scope of their role, using objective job sizing methodologies. Fees and benefits for comparable roles in comparable publicly listed financial services groups of a similar size.
The Chair receives an all-inclusive fee, which is reviewed periodically plus benefits including life insurance, car allowance, medical insurance and transportation. The Committee retains the right to provide additional benefits depending on individual circumstances. Non-Executive Directors are paid a basic fee plus additional fees for the chairmanship/membership of committees and for membership of Group companies/boards/non-board level committees.
Additional fees are also paid to the senior independent director and to the deputy chair to reflect additional responsibilities. Any increases normally take effect from 1 January of a given year.
The Chair and the Non-Executive Directors are not entitled to receive any payment for loss of office (other than in the case of the Chair’s fees for the six month notice period) and are not entitled to participate in the Group’s bonus, share plan or pension arrangements. Non-Executive Directors are reimbursed for expenses incurred in the course of their duties, such as travel and
accommodation expenses, on a grossed-up basis (where applicable).
Maximum potentialThe Committee will make no increase in fees or benefits currently provided which it believes is inconsistent with the parameters above.
Performance metricsN/A

138 Lloyds Banking Group Annual Report and Accounts 2020
This section discloses the remuneration awards made by the Group to Material Risk Takers (MRTs) in respect of the 2020 performance year. Additional information summarising the Group’s remuneration policies, structure and governance is also provided. These disclosures should be read in conjunction with the disclosures for Executive Directors contained in the Directors’ Remuneration Report (DRR) on pages 115 to 137 and the Directors’ Remuneration Policy (DRP) on pages 115 to 123 of the 2019 Annual Report. Together these disclosures comply with the requirements of Article 450 of the Capital Requirements Regulation (EU) No. 575/2013 (CRR).
The remuneration principles and practices detailed in the DRR apply to MRTs and non-MRTs in the same way as to Executive Directors (other than where stated in this disclosure).
The Group has applied the EBA Delegated Regulation (EU) No 604/2014 to determine which colleagues should be identified as MRTs. MRTs are colleagues who are considered to have a material impact on the Group’s risk profile, and include, but are not limited to:
Senior management, Executive Directors, members and attendees of the Group Executive Committee (GEC) and their respective executive level direct reports
Non-Executive Directors
Approved persons performing significant influence functions (SIFs) and/ or all colleagues performing a senior management function
Other highly remunerated individuals whose activities could have a material impact on the Group’s risk profile
Decision making process for remuneration policy The Group has a strong belief in aligning the remuneration delivered to the Group’s executives with the successful performance of the business and, through this, the delivery of long-term, superior and sustainable returns to shareholders. It has continued to seek the views of shareholders and other key stakeholders with regard to remuneration policy and seeks to motivate, incentivise and retain talent while being mindful of the economic outlook.
The overarching purpose of the Remuneration Committee is to consider, agree and recommend to the Board an overall remuneration policy and philosophy for the Group that is defined by, supports and is closely aligned to its long-term business strategy, business objectives, risk appetite and values and recognises the interests of relevant stakeholders. The remuneration policy governs all aspects of remuneration and applies in its entirety to all divisions, business units and companies in the Group, including wholly-owned overseas businesses and all colleagues, contractors and temporary staff. The Committee reviews the policy
annually and Committee pays particular attention to the top management population, including the highest paid colleagues in each division, those colleagues who perform senior management functions for the Group and MRTs. During 2020 the Committee had 7 scheduled meetings. Further details on the operation of the Remuneration Committee and independent advise received during the year can be found on page 134 of the DRR.
The Group has a robust governance framework, with the Remuneration Committee reviewing all compensation decisions for Executive Directors, senior management, senior risk and compliance officers, high earners and any other MRTs. This approach to governance is cascaded through the Group with the Group People Committee having oversight for all other colleagues.
Governance and risk managementAn essential component of the approach to remuneration is the governance process that underpins it. This ensures that the policy is robustly applied and risk is managed appropriately. In addition to setting the overall remuneration policy and philosophy for the Group, the Remuneration Committee ensures that colleagues who could have a material impact on the Group’s risk profile are provided with appropriate incentives and reward to encourage them to enhance the performance of the Group and that they are recognised for their individual contribution to the success of the organisation, whilst ensuring that there is no reward for excessive risk taking. The Remuneration Committee works closely with the Risk Committee in ensuring the Group Performance Share (GPS) plan outcome is moderated. The two Committees determine whether the proposed GPS outcome and performance assessments adequately reflect the risk appetite and framework of the Group; whether it took account of current and future risks; and whether any further adjustment is required or merited. The Group and the Remuneration Committee are determined to ensure that the aggregate of the variable remuneration for all colleagues is appropriate and balanced with the interests of shareholders and all other stakeholders.
The Remuneration Committee’s terms of reference are available from the Company Secretary and are displayed on the Group’s website, www.lloydsbankinggroup.com/ourgroup/ corporate-governance. These terms are reviewed each year to ensure compliance with the remuneration regulations and were last updated in November 2020.
Link between pay and performanceThe Group’s approach to reward is intended to provide a clear link between remuneration and delivery of its key strategic objectives, supporting the aim of becoming the best bank for customers, and through that, for shareholders. To this end, the performance management process has been developed,
with the close participation of the Group’s Risk team, to ensure there is a clear alignment between award outcomes and individual performance, growth and development, whilst also reflecting divisional achievement.
The use of a balanced scorecard approach to measure performance enables the Remuneration Committee to assess the performance of the Group and its senior executives in a consistent and performance-driven way. The Group’s remuneration policy supports the business values and strategy, based on building long-term relationships with customers and colleagues and managing the financial consequences of business decisions across the entire economic cycle. Further detail can be found in the DRR and the DRP. In particular, see pages 121 to 122.
Design and structure of remunerationWhen establishing the remuneration policy and associated frameworks, the Group is required to take into account its size, organisation and the nature, scope and complexity of its activities. For the purpose of remuneration regulation, Lloyds Bank plc is treated as a Proportionality level I firm and therefore subject to the more onerous remuneration rules.
Remuneration is delivered via a combination of fixed and variable remuneration. Fixed remuneration reflects the role, responsibility and experience of a colleague. Variable remuneration is based on an assessment of individual, business area and Group performance. The mix of variable and fixed remuneration is driven by seniority, grade and role. Taking into account the expected value of awards, the performance-related elements of pay make up a considerable proportion of the total remuneration package for MRTs, whilst maintaining an appropriate balance between the fixed and variable elements. The maximum ratio of variable to fixed remuneration for MRTs is 200 per cent, which has been approved by shareholders (98.77 per cent of votes cast) at the AGM on 15 May 2014.
Remuneration for control functions is set in relation to benchmark market data to ensure that it is possible to attract and retain staff with the appropriate knowledge, experience and skills. An appropriate balance between fixed and variable compensation supports this approach. Generally, control function staff receive a higher proportion of fixed remuneration than other colleagues and the aggregate ratio of fixed to variable remuneration for all control function staff does not exceed 100 per cent. Particular attention is paid to ensure remuneration for control function staff is linked to the performance of their function and independent from the business areas they control.
Other remuneration disclosures

Strategic rep
ortFinancial results
Governance
Risk manag
ement
Financial statements
Other inform
ation Lloyds Banking Group Annual Report and Accounts 2020 139
Base salaryBase salaries are reviewed annually, taking into account individual performance and market information. Further information on base salaries can be found on page 115 of the DRP.
Applies to:– Senior Management, Executive Directors,
members/attendees of the Group Chief Executive and their respective direct reports
– Approved Persons performing SIFs and/or all colleagues performing a Senior Management Function
– Other MRTs– Non-MRTs
FeesNon-Executive Director fees are reviewed periodically by the Board. Further information on fees can be found on page 128 of the DRR and page 123 of the DRP.
Applies to:– Non-Executive Directors
Fixed share awardThe fixed share award, made annually, delivers Lloyds Banking Group shares over a period of five years. With effect from 2020 fixed share awards will be delivered over a period of three years (subject to shareholder approval for Executive Directors). Its purpose is to ensure that total fixed remuneration is commensurate with the role, responsibilities and experience of the individual; provides a competitive reward package; and is appropriately balanced with variable remuneration, in line with regulatory requirements.
The fixed share award can be amended or withdrawn in the following circumstances: – to reflect a change in role;– to reflect a Group leave policy (e.g. parental
leave or sickness absence);
– termination of employment with the Group;– if the award would be inconsistent with
any applicable legal, regulatory or tax requirements or market practice.
Further information on fixed share awards can be found on page 116 of the DRP.
Applies to:– Senior Management, Executive Directors,
members/attendees of the Group Executive Committee and their respective direct reports
– Approved Persons performing SIFs and/or all colleagues performing a Senior Management Function1
– Other MRTs1
– Non-MRTs1
Group Performance ShareThe Group Performance Share (GPS) plan is an annual discretionary bonus plan. The plan is designed to reflect specific goals linked to the performance of the Group. The majority of colleagues and all MRTs participate in the GPS plan.
Individual GPS awards are based upon individual contribution, overall Group financial results and performance conversations over the past financial year. The Group’s total risk-adjusted GPS outcome is determined by the Remuneration Committee annually as a percentage of the Group’s underlying profit, modified for:
– Group balanced scorecard performance – Collective and discretionary adjustments to
reflect risk matters and/or other factors.
The Group applies deferral arrangements to GPS and variable pay awards made to colleagues. GPS awards for MRTs are subject to deferral and a holding period in line with regulatory requirements and market practice.
Further information on the GPS plan can be found on page 136 of the DRR as well as page 117 of the DRP.
Applies to:– Senior Management, Executive Directors,
members/attendees of the Group Executive Committee and their respective direct reports
– Approved Persons performing SIFs and/or all colleagues performing a Senior Management Function
– Other MRTs– Non-MRTs
BenefitsCore benefits for UK-based colleagues include pension, private medical insurance, life insurance and other benefits that may be selected through the Group’s flexible benefits plan. Further information on benefits and all-employee share plans can be found on page 116 of the DRP. Benefits can be amended or withdrawn in the following circumstances: – to reflect a change to colleague contractual
terms;
– to reflect a change of grade;– termination of employment with the Group;– to reflect a change of Reward Strategy/
benefit provision;– if the award would be inconsistent with any
statutory or tax requirements.
Details of Non-Executive Directors’ benefits are set out on page 123 of the DRP.
Applies to:– Non-Executive Directors– Senior Management, Executive Directors,
members/attendees of the Group Executive Committee and their respective direct reports
– Approved Persons performing SIFs and/or all colleagues performing a Senior Management Function
– Other MRTs– Non-MRTs
The table below summarises the different remuneration elements for MRTs (this includes control function staff) and non-MRTs.
Directors’ remuneration report continued

140 Lloyds Banking Group Annual Report and Accounts 2020
Directors’ remuneration report continued
Long Term Share PlanThe Long Term Share Plan is the Group’s long-term incentive opportunity to align executive management and behaviour to the Group’s objectives of delivering long-term superior and sustainable returns. Senior colleagues, including MRTs, are eligible to participate in the plan. Individual awards are based upon individual contribution.
Awards are made in the form of conditional shares and award levels are set at the time of grant, in compliance with regulatory requirements, and may be subject to a discount in determining total variable remuneration under the rules set by the European Banking Authority. The number of shares to be awarded may be calculated using a fair value or based on a discount to market value, as appropriate.
Vesting of awards will be subject to an assessment of underpin thresholds being maintained measured over a period of three years, or such longer period, as determined by the Committee. Awards for MRTs are subject to deferral and a holding period in line with regulatory requirements and market practice.
Further detail of the awards made in 2021 can be found on page 132
Applies to:– Senior Management, Executive Directors,
members/attendees of the Group Executive Committee and their respective direct reports1
– Approved Persons performing SIFs and/or all colleagues performing a Senior Management Function1
– Other MRTs1
– Non-MRTs1
Deferral, vesting and performance adjustmentAt least 40 per cent of MRTs’ variable remuneration above certain thresholds is deferred into Lloyds Banking Group Shares. For all MRTs, variable remuneration is deferred in line with the regulatory requirements for three, five or seven years, (depending on MRT category). At least 50 per cent of each release is subject to a 12 month holding period.
For all colleagues, any deferred variable remuneration amount is subject to performance adjustment (malus) in accordance with the Group’s Deferral and Performance Adjustment Policy.
MRTs’ vested variable remuneration (including variable remuneration subject to a holding period) can be recovered from colleagues up to seven years after the date of award in the case of a material or severe risk event (clawback). This period may be extended to ten years where there is an ongoing internal or regulatory investigation. Clawback is used alongside other performance adjustment processes.
Further information on deferral, vesting and performance adjustment can be found in the DRR on pages 133 and 118 of the DRP.
Guaranteed variable remunerationGuarantees, such as sign-on awards, may only be offered in exceptional circumstances to new hires for the first year of service and in accordance with regulatory requirements.
Any awards made to new hires to compensate them for unvested variable remuneration they forfeit on leaving their previous employment (‘buy-out awards’) will
be subject to appropriate retention, deferral, performance and clawback arrangements in accordance with applicable regulatory requirements.
Retention awards may be made to existing colleagues in limited circumstances and are subject to prior regulatory approval in line with applicable regulatory requirements.
Applies to:– Senior Management, Executive Directors,
members/attendees of the GEC and their respective direct reports
– Approved Persons performing SIFs and/or all colleagues performing a Senior Management Function
– Other MRTs– Non-MRTs
Shareholding requirementExecutive Directors: see DRR page 127.
All other MRTs and non-MRTs: 25 per cent to 100 per cent of the aggregate of base salary and fixed share award depending on grade.
Applies to:– Senior Management, Executive Directors,
members/attendees of the GEC and their respective direct reports
– Approved Persons performing SIFs and/or all colleagues performing a Senior Management Function2
– Other MRTs2
– Non-MRTs2
Termination paymentsExecutive Directors and GEC members: see pages 121 to 123 of the 2019 DRR.
All other termination payments comply with the Group’s contractual, legal and regulatory requirements and are made in such a way as to ensure they do not reward failure or misconduct and reflect performance over time.
Applies to:– Senior Management, Executive Directors,
members/attendees of the GEC and their respective direct reports
– Approved Persons performing SIFs and/or all colleagues performing a Senior Management Function
– Other MRTs– Non-MRTs
1 Eligibility based on seniority, grade and role.2 Requirement based on seniority and grade.

Strategic rep
ortFinancial results
Governance
Risk manag
ement
Financial statements
Other inform
ation Lloyds Banking Group Annual Report and Accounts 2020 141
Table 1 Analysis of high earners by band
Number of Material Risk Takers paid €1 million1,2 or more
2020 Material Risk
Takers3,4
2019 Material Risk
Takers4
€1.0m – €1.5m 10 30
€1.5m – €2.0m 0 5
€2.0m – €2.5m 6 0
€2.5m – €3.0m 0 4
€3.0m – €3.5m 1 3
€3.5m – €4.0m 0 0
€4.0m – €4.5m 0 0
€4.5m – €5.0m 0 0
€5.0m – €6.0m 0 1
€6.0m – €7.0m 0 0
€7.0m – €8.0m 0 0
1 Converted to Euros using the exchange rate €1 = £1.11804 (average exchange rate 1 December 2020 – 31 December 2020 based on the European Commission Budget exchange rates). The exchange rate used for 2019 was €1 = £0.8518.
2 Values for Long Term Share Plan awards based on face value at grant. An EBA discount factor has not been applied to awards made in 2021 in respect of performance year 2020.3 Total number of Material Risk Takers earning more than €1m has decreased from 43 in 2019 to 17 in 2020.4 2020 and 2019 data has been calculated using methodology consistent with EBA guidelines.
Table 2 Aggregate remuneration expenditure (Material Risk Takers)Analysis of aggregate remuneration expenditure by division1
Retail and Community
Banking £m
Commercial Banking
£m
Insurance and Wealth
£m
Chief Operating Office and
Group Functions1
£mTotal
£m
Aggregate remuneration expenditure 11.2 29.5 6.2 62.7 109.6
1 Chief Operating Office comprises People and Property, Group Transformation, Chief Information Office, Chief Security Office and COO Business Risk. Group Functions comprises Risk, Finance, Legal, Strategy, Group Corporate Affairs, Group Internal Audit, Company Secretarial, Responsible Business and Inclusion and Diversity.
Table 3 Fixed and variable remuneration (Material Risk Takers)Analysis of remuneration between fixed and variable amounts
Remuneration £m Awarded in relation to the 2020 performance year
Management body
Senior Management2 Other MRTs 2020 Total
Executive Directors
Non-Executive Directors
Fixed Remuneration £m
Number of employees 3 20 113 132 268
Total fixed remuneration £4,288,996 – £46,719,147 £35,704,477 £86,712,620
Of which: Cash based £2,734,996 – £42,757,547 £34,549,477 £80,042,020
Of which: Shares1 £1,554,000 – £3,961,600 £1,155,000 £6,670,600
Variable Remuneration £m
Total variable remuneration £608,128 – £14,468,710 £8,686,245 £23,763,083
Of which: Upfront cash based £0 – £0 £735,268 £735,268
Of which: Share based3 £608,128 – £14,468,710 £7,950,977 £23,027,815
Of which: Deferred
Vested £0 – £0 £0 £0
Unvested £608,128 – £14,468,710 £7,950,977 £23,027,815
Total remuneration £m £4,897,124 – £61,187,857 £44,390,722 £110,475,703
1 Released over a five year period.2 Senior Management are defined as Group Executive Committee (GEC) members/attendees (excluding Group Executive Directors and Non-Executive Directors) and their direct reports
(excluding those direct reports who do not materially influence the risk profile of any in-scope group firm).3 Values for Long Term Share Plan awards are based on face value at grant. An EBA discount factor has not been applied to awards made in 2021 in respect of performance year 2020.

142 Lloyds Banking Group Annual Report and Accounts 2020
Table 4 Total outstanding deferred variable remunerationRemuneration £m Total outstanding deferred variable remuneration at 31 December 2020
Management body
Senior Management Other MRTs 2020 Total
Executive Directors
Non-Executive Directors
Variable Remuneration £m
Number of employees 3 20 113 132 268
Total outstanding deferred variable remuneration 16.6 – 94.8 38 149.4
Of which: Vested 1.4 – 11.5 8 20.9
Of which: Unvested 15.2 – 83.3 30 128.5
Table 5 Other payments awarded in relation to the 2020 performance yearGuaranteed bonuses Sign-on awards Severance payments
Number of awards made
Total £m
Number of awards made
Total £m
Number of awards made
Total £m
Management body 0 0 0 0 0 0
Senior management 0 0 0 0 0 0
Other Material Risk Takers 0 0 0 0 0 0
Table 6 Deferred remunerationAnalysis of deferred remuneration at 31 December 2020
Remuneration £m
Total amount of outstanding deferred1 and retained2
remuneration
Of which: Total amount of outstanding remuneration
exposed to ex-post explicit and/or implicit adjustment
Total amount of amendment during the year due to ex-post explicit adjustments
Total amount of deferred remuneration paid out in the
performance year
Management body3 16.6 16.6 0.04 0.4
Senior management 94.8 94.8 0.1 4.1
Other Material Risk Takers 38.0 38.0 – 4.1
1 Deferred in this context refers only to any unvested remuneration.2 Retained refers to any variable remuneration for which the deferral period has ended but which is still subject to a holding period before release. 3 Reference to the ‘Management Body’ relates to Executive Directors only. Non-Executive Directors are not eligible to receive variable remuneration.

Strategic rep
ortFinancial results
Governance
Risk managem
entO
ther information
Financial statements
Lloyds Banking Group Annual Report and Accounts 2020 143
2020 CAPTURED BY LLOYDS BANKING GROUP COLLEAGUES
Risk managementAll narrative and quantative tables are unaudited unless otherwise stated. The audited information is required to comply with the requirements of relevant International Financial Reporting standards.
Further information on risk management can be found:
Risk overview 56Note 51: Financial risk management 314Pillar 3 report: www.lloydsbankinggroup.com
The Group’s approach to risk 144Emerging risks 147Risk governance 150Capital stress testing 152Full analysis of risk categories 153
Noshaba Butt David Atherton Kimberley Johnston
Julia Newell Shona Brown David Braithwaite Charlotte Cartwright
John Edwards Stuart Mason Thomas Holmes Scott Mankellar

144 Lloyds Banking Group Annual Report and Accounts 2020
Risk management is at the heart of Helping Britain Recover and building the UK's preferred financial partner.
Our mission is to protect our customers, shareholders, colleagues and the Group, while enabling sustainable growth in targeted segments. This is achieved through informed risk decisions and robust risk management, supported by a consistent risk-focused culture.
The risk overview (pages 56 to 59) provides a summary of risk management within the Group and the key focus areas for 2020, including the significant impact that COVID-19 has had on all principal risks faced by the Group. The risk overview also highlights the importance of the connectivity of principal, emerging and strategic risks and how they are embedded in to the Group's strategic risk management framework.
This full risk management section provides a more in-depth picture of how risk is managed within the Group, detailing the Group’s emerging risks, approach to stress testing, risk governance, committee structure, appetite for risk and a full analysis of the principal risk categories (pages 153 to 204), the framework by which risks are identified, managed, mitigated and monitored.
Each principal risk category is described and managed using the following standard headings: definition, exposures, measurement, mitigation and monitoring.
The Group’s approach to riskThe Group operates a prudent approach to risk with rigorous management controls to support sustainable business growth and minimise losses. Through a strong and independent risk function (Risk division), a robust control framework is maintained to identify and escalate current and emerging risks, support sustainable growth within the Group's risk appetite, and to drive and inform good risk reward decision-making.
To meet ring-fencing requirements, core UK retail financial services and ancillary retail activities are ring-fenced from other activities of the Group. The Group's enterprise risk management framework (ERMF) and Group risk appetite apply across the Group and are supplemented by risk management frameworks and risk appetites for the sub-groups to meet sub-group specific needs. In each case these operate within the Group parameters. The Group’s corporate governance framework applies across Lloyds Banking Group plc, Lloyds Bank plc, Bank of Scotland plc and HBOS plc. It is tailored where needed to meet the entity specific needs of Lloyds Bank plc and Bank of Scotland plc, and supplementary corporate governance frameworks are in place to address sub-group specific requirements of the other sub-groups (Lloyds Bank Corporate Markets, Insurance and Lloyds Banking Group Equity Investments).
The Group’s ERMF is structured to align with the industry-accepted internal control framework standards.
The ERMF applies to every area of the business and covers all types of risk. It is reviewed, updated and approved by the Board at least annually to reflect any changes in the nature of the Group's business and external regulations, law, corporate governance and industry best practice. The ERMF provides the Group with an effective mechanism for developing and embedding risk policies and risk management strategies which are aligned with the risks faced by its businesses. It also seeks to facilitate effective communication on these matters across the Group.
Role of the Board and senior managementKey responsibilities of the Board and senior management include:
approval of the ERMF and Board risk appetite
approval of Group-wide risk principles and policies
the cascade of delegated authority (for example to Board sub- committees and the Group Chief Executive)
effective oversight of risk management consistent with risk appetite
Risk appetiteRisk appetite is defined within the Group as ‘the amount and type of risk that the Group is prepared to seek, accept or tolerate’ in delivering its strategy.
Group strategy and risk appetite are developed in tandem. Business planning aims to optimise value within the Group's risk appetite parameters and deliver on its promise to Help Britain Prosper.
The Group’s risk appetite statement details the risk parameters within which the Group operates. The statement forms part of the Group's control framework and is embedded into its policies, authorities and limits, to guide decision-making and risk management. The Board is responsible for approving the Group’s risk appetite statement at least annually. Group Board-level metrics are cascaded into more detailed business appetite metrics and limits.
Group risk appetite includes the following areas:
Climate: the Group takes action to identify, manage and mitigate its climate risk and support the Group and its customers in transitioning to a low carbon economy
Market: the Group has robust controls in place to manage its inherent market risk and does not engage in any proprietary trading, reflecting the customer focused nature of the Group’s activities
Credit: the Group has a conservative and well balanced credit portfolio through the economic cycle, generating an appropriate return on equity, in line with the Group’s target return on equity in aggregate
Funding and liquidity: the Group maintains a prudent liquidity profile and a balance sheet structure that limits its reliance on potentially volatile sources of funding
Capital: the Group maintains capital levels commensurate with a prudent level of solvency to achieve financial resilience and market confidence
Change/execution: the Group has limited appetite for negative impacts on customers, colleagues, or the Group as a result of change activity
Conduct: the Group delivers fair outcomes for its customers
Data: the Group has zero appetite for material regulatory breaches and material legal incidents
People: the Group leads responsibly and proficiently, manages people resource effectively, supports and develops colleague talent, and meets legal and regulatory obligations related to its people
Operational resilience: the Group has a limited appetite for disruption to services to customers and stakeholders from significant unexpected events
Operational: the Group has robust controls in place to manage operational losses, reputational events and regulatory breaches. It identifies and assesses emerging risks and acts to mitigate these
Model: material models are performing in line with expectations
Regulatory and legal: the Group interprets and complies with all relevant regulation and all applicable laws (including codes of conduct which could have legal implications) and/or legal obligations
Risk management

Strategic rep
ortFinancial results
Governance
Risk managem
entO
ther information
Financial statements
Lloyds Banking Group Annual Report and Accounts 2020 145
Governance frameworksThe Group’s approach to risk is founded on a robust control framework and a strong risk management culture which are the foundation for the delivery of effective risk management and guide the way all employees approach their work, behave and make decisions.
Governance is maintained through delegation of authority from the Board to individuals through the management hierarchy. Senior executives are supported where required by a committee based structure which is designed to ensure open challenge and support effective decision-making.
The Group’s risk appetite, principles, policies, procedures, controls and reporting are regularly reviewed and updated where needed to ensure they remain fully in-line with regulation, law, corporate governance and industry good practice.
The interaction of the executive and non-executive governance structures relies upon a culture of transparency and openness that is encouraged by both the Board and senior management.
Board-level engagement, coupled with the direct involvement of senior management in Group-wide risk issues at Group Executive Committee level, ensures that escalated issues are promptly addressed and remediation plans are initiated where required.
Line managers are directly accountable for identifying and managing risks in their individual businesses, ensuring that business decisions strike an appropriate balance between risk and reward and are consistent with the Group’s risk appetite.
Clear responsibilities and accountabilities for risk are defined across the Group through a three lines of defence model which ensures effective independent oversight and assurance in respect of key decisions.
The risk committee governance framework is outlined on page 150.
Three lines of defence modelThe ERMF is implemented through a ‘three lines of defence’ model which defines clear responsibilities and accountabilities and ensures effective independent oversight and assurance activities take place covering key decisions.
Business lines (first line) have primary responsibility for risk decisions, identifying, measuring, monitoring and controlling risks within their areas of accountability. They are required to establish effective governance and control frameworks for their business to be compliant with Group policy requirements, to maintain appropriate risk management skills, mechanisms and toolkits, and to act within Group risk appetite parameters set and approved by the Board.
Risk division (second line) is a centralised function, headed by the Chief Risk Officer, providing oversight and independent constructive challenge to the effectiveness of risk decisions taken by business management, providing proactive advice and guidance, reviewing, challenging and reporting on the risk profile of the Group and ensuring that mitigating actions are appropriate.
It also has a key role in promoting the implementation of a strategic approach to risk management reflecting the risk appetite and ERMF agreed by the Board that encompasses:
overseeing embedding of effective risk management processes
transparent, focused risk monitoring and reporting
provision of expert and high quality advice and guidance to the Board, executives and management on strategic issues and horizon scanning, including pending regulatory changes
a constructive dialogue with the first line through provision of advice, development of common methodologies, understanding, education, training, and development of new risk management tools
The primary role of Group Internal Audit (third line) is to help the Board and executive management protect the assets, reputation and sustainability of the Group. Group Internal Audit is led by the Group Chief Internal Auditor. Group Internal Audit provides independent assurance to the Audit Committee and the Board through performing reviews and engaging with committees and executive management, providing opinion, challenge and informal advice on risk and the state of the control environment. Group Internal Audit is a single independent internal audit function, reporting to the Audit Committee of the Group and the Audit Committees of the key subsidiaries.
Risk and control cycle from identification to reportingTo allow senior management to make informed risk decisions, the business follows a continuous risk management approach which includes producing appropriate, accurate and focused risk reporting. The risk and control cycle sets out how this should be approached, with the appropriate controls and processes in place. This cycle, from identification to reporting, ensures consistency and is intended to manage and mitigate the risks impacting the Group.
The process for risk identification, measurement and control is integrated into the overall framework for risk governance. Risk identification processes are forward-looking to ensure emerging risks are identified. Risks are captured and measured using robust and consistent quantification methodologies. The measurement of risks includes the application of stress testing and scenario analysis, and considers whether relevant controls are in place before risks are incurred.
Identified risks are reported on a monthly basis or as frequently as necessary to the appropriate committee. The extent of the risk is compared to the overall risk appetite as well as specific limits or triggers. When thresholds are breached, committee minutes are clear on the actions and time frames required to resolve the breach and bring risk within tolerances. There is a clear process for escalation of risks and risk events.
All key controls are recorded and assessed on a regular basis, in response to triggers or minimum annually. Control assessments consider both the adequacy of the design and operating effectiveness. Where a control is not effective, the root cause is established and action plans implemented to improve control design or performance. Control Effectiveness against all residual risks is reported and monitored via the monthly Consolidated Risk Report (CRR). The CRR is reviewed and independently challenged by the Risk Division and provided to the Risk Division Executive Committee and Group Risk Committee. On an annual basis, a point in time assessment is made for control effectiveness against each risk category and across sub-groups. The CRR data is the primary source used for this point in time assessment and a year on year comparison on control effectiveness is reported to the Board.
One Risk and Control Self-Assessment (One RCSA) is part of the Group’s Risk and Control Strategy to deliver a stronger risk culture and simplified risk and control environment. The three lines of defence have worked together to identify improvements to the Group’s approach to risk management. Following pilot activity, this new approach (One RCSA) is being adopted across the Group through a phased implemented plan. All aspects of the 2020 Plan for implementation of One RCSA have been delivered. The 2021 plans capture the remaining highest risks to customers and the business, and the Board will continue to review progress with embedding the cultural change and improving the risk and control environment.
Risk cultureBased on the Group’s prudent business model, prudent approach to risk management, and guided by the Board, the senior management articulates the core risk values to which the Group aspires, and sets the tone at the top. Senior Management establishes a strong focus on building and sustaining long-term relationships with customers, through the economic cycle. The Group’s Code of Responsibility reinforces colleagues’ accountability for the risks they take and their responsibility to prioritise their customers’ needs.
Risk resources and capabilitiesAppropriate mechanisms are in place to avoid over-reliance on key personnel or system/technical expertise within the Group. Adequate resources are in place to serve customers both under normal working conditions and in times of stress, and monitoring procedures are in place to ensure that the level of available resource can be increased if required. Colleagues undertake appropriate training to ensure they have the skills and knowledge necessary to enable them to deliver fair outcomes for customers.
There is ongoing investment in risk systems and models alongside the Group’s investment in customer and product systems and processes. This drives improvements in risk data quality, aggregation and reporting leading to effective and efficient risk decisions.

146 Lloyds Banking Group Annual Report and Accounts 2020
Risk management continued
Financial reporting risk management systems and internal controlsThe Group maintains risk management systems and internal controls relating to the financial reporting process which are designed to:
ensure that accounting policies are appropriately and consistently applied, transactions are recorded accurately, and undertaken in accordance with delegated authorities, that assets are safeguarded and liabilities are properly stated
enable the calculation, preparation and reporting of financial, prudential regulatory and tax outcomes in accordance with applicable International Financial Reporting Standards, statutory and regulatory requirements
enable certifications by the Senior Accounting Officer relating to maintenance of appropriate tax accounting and in accordance with the 2009 Finance Act
ensure that disclosures are made on a timely basis in accordance with statutory and regulatory requirements (for example UK Finance Code for Financial Reporting Disclosure and the US Sarbanes Oxley Act)
ensure ongoing monitoring to assess the impact of emerging regulation and legislation on financial, prudential regulatory and tax reporting
ensure an accurate view of the Group’s performance to allow the Board and senior management to appropriately manage the affairs and strategy of the business as a whole and each of its sub-groups
Exposure to risk arising from the business activities of the Group
The table below provides a high level guide to how the Group’s business activities are reflected through its risk-weighted assets. Details of the business activities for each division are provided in the Financial Performance Overview on pages 53 to 55.
RetailCommercial
BankingInsurance
and Wealth1Centralitems2 Group
£bn £bn £bn £bn £bn
Risk-weighted assets (RWAs)
Credit risk 79.6 62.9 0.8 13.7 157.0
Counterparty credit risk3 — 5.4 — 1.3 6.7
Market risk — 2.2 — — 2.2
Operational risk 19.4 4.5 0.5 0.5 24.9
Total (excluding threshold) 99.0 75.0 1.3 15.5 190.8
Threshold4 — — — 11.9 11.9
Total 99.0 75.0 1.3 27.4 202.7
1 As a separate regulated business, Insurance (excluding Wealth) maintains its own solvency requirements, including appropriate management buffers, and reports directly to the Insurance Board. Insurance does not hold any RWAs as its assets are removed from the Group's regulatory capital calculations. However, in accordance with capital rules part of the Group's equity investment in Insurance is included in the calculation of threshold RWAs, while the remainder is taken as a deduction from common equity tier 1 (CET1) capital.
2 Central items include assets held outside the main operating divisions, including the assets of Group Corporate Treasury which holds the Group's liquidity portfolio, and other supporting functions.3 Exposures relating to the default fund of a central counterparty and credit valuation adjustment risk are included in counterparty credit risk.4 Threshold RWAs reflect the proportion of significant investments and deferred tax assets that are permitted to be risk-weighted instead of deducted from CET1 capital. Significant investments
primarily arise from the investment in the Group’s Insurance business.
The Group has a Disclosure Committee which assists the Group Chief Executive and Chief Financial Officer in fulfilling their disclosure responsibilities under relevant listing and other regulatory and legal requirements. In addition, the Audit Committee reviews the quality and acceptability of the Group’s financial disclosures. For further information on the Audit Committee’s responsibilities relating to financial reporting see pages 101 to 104.
Risk decision-making and reportingRisk analysis and reporting enables better understanding of risks and returns, supporting the identification of opportunities as well as better management of risks.
An aggregate view of the Group’s overall risk profile, key risks and management actions, and performance against risk appetite is reported to and discussed monthly at the Group Risk Committee with regular reporting to the Board Risk Committee and the Board.
Rigorous stress testing exercises are carried out to assess the impact of a range of adverse scenarios with different probabilities and severities to inform strategic planning.
The Chief Risk Officer regularly informs the Board Risk Committee of the aggregate risk profile and has direct access to the Chair and members of Board Risk Committee.

Strategic rep
ortFinancial results
Governance
Risk managem
entO
ther information
Financial statements
Lloyds Banking Group Annual Report and Accounts 2020 147
Emerging risksThe Group considers the following to be risks that have the potential to increase in significance and affect the performance of the Group. These risks are considered alongside the Group’s operating plan. Additional information on emerging risks and how they are connected to principal and strategic risks is outlined in the risk overview on pages 56 to 59.
Risk Key mitigating actions
Climate: The key risks are financial, derived from both physical risks (climate and weather-related events) and transition risks resulting from the process of adjustment towards a low carbon economy. Climate change extends across multiple risk types e.g. credit, market, conduct and operational. For example, physical and transition risks could result in the impairment of asset values, which may impact the creditworthiness of our clients, and the products and services our customers require.
The focus on these risks by key stakeholders including businesses, clients, shareholders, governments and regulators is increasing, aligned to the evolving societal, regulatory and political landscape. There also remains a risk that the level and pace of responses taken by the Group are insufficient to mitigate risk. This could lead to campaign groups or other bodies seeking to take action against the Group or the financial services industry for funding organisations that they deem to be contributing to climate change.
– The Group’s risk management approach to climate change is outlined in the Strategic Report (page 20) and reflects its commitment to adopting the framework set out by the Financial Stability Board’s Task Force on Climate-related Financial Disclosures (TCFD)
– The Group Chief Risk Officer (CRO) alongside the CROs for key legal entities, has assumed responsibility for identifying and managing the risks arising from climate change
– Integrating the risk management of the financial risks posed by climate change into the Group's existing enterprise risk management framework, including policies, sector and credit risk appetite and controls
– 12 external sector statements have been published to help articulate appropriate areas of environment and climate related risk appetite. Credit risk policy has introduced mandatory requirements to consider environmental risks in key risk management activities
– The Group continues to develop its climate risk management framework to ensure all our activities appropriately consider climate-related risks and opportunities and as part of this supports its customers and clients’ transition to a low carbon economy
Technology: The rapid pace of technology in the financial services industry creates a challenge for complex organisations with ageing systems. With the slower adoption of new technologies there is a risk that the Group is less able to compete with new entrants to attract customers with innovative future products, and participate in emerging business models.
Legacy systems also create increasing operational resilience risks due to fewer specialists with the appropriate expertise and risks to ongoing supplier support.
Progressive deployment of new technologies in the Group, including the scaling of public cloud usage, will also change the Group’s risk profile, including increased supplier risks, evolved data risks, and enhanced cost risks where new technologies are running in parallel with existing architecture.
– In Strategic Review 2021, the Group is embarking on an ambitious multi-year programme to transform critical infrastructure and platforms to take advantage of new technologies such as the public cloud and simplify the application landscape. This will reduce legacy operational overheads, increase business agility, and improve operational resilience
– The Group has established strategic partnerships with global technology leaders to leverage their experience and best in class capabilities
– The Group has established strategic partnerships with leading fintechs (such as Form3 and Thought Machine) who are developing the next generation of core financial services technology. solutions. In 2021 the Group will migrate customers to a pilot of a new bank architecture using these technologies
– The Group is partnering with fintechs to rapidly deploy best in class technology and propositions to targeted domains.
– The Group is building senior technology skills through executive training and consideration of technology knowledge in senior appointments
– The Group is creating a Cloud Centre of Excellence, operating new financial control processes and working closely with the regulator on new technology deployment
Societal expectations: There are increasing expectations for the financial services sector to make positive social and environmental contributions. While these expectations are closely aligned with the Group’s purpose of Helping Britain Prosper, there is the potential for them to generate risks.
Poorly targeted regulation can reduce operational flexibility. The Group’s ability to attract and retain high quality talent may become increasingly dependent on being able to demonstrate that we are meeting societal expectations.
As technology and innovation moves at pace, there is the risk of systematic, unintended consequences within decision-making undertaken by machine learning, creating new operational risks that affect outcomes, for example credit portfolio anomalies or conduct impacts.
As technology enables broader use of customer data, it is vital that data is managed ethically and in line with customer and regulatory expectations.
– The Group has a long-established purpose of Helping Britain Prosper that is well recognised across the business divisions and with a positive track record of demonstrating action
– Alignment of the Group’s 2021 Strategy around Helping Britain Recover, with focus on responding to key societal trends and issues
– Strong Group action in response to key areas of societal concern, including the Group Sustainability and Vulnerable Customer strategies
– The Group continues to engage across all stakeholder groups to understand current and emerging areas of concern and priority. Technology risks, including those related to machine learning, and data ethics are escalated and discussed through governance to ensure ongoing monitoring of any emerging unintended consequences
– Continued focus on ensuring the quality of customer outcomes is maintained through robust risk management

148 Lloyds Banking Group Annual Report and Accounts 2020
Risk management continued
Risk Key mitigating actions
People/Ways of working and skills: Successful and sustainable adoption of remote working and new ways of working is pivotal to ensuring customer needs and expectations are met during and after the COVID-19 pandemic. This requires creating a safe physical environment that promotes colleague wellbeing within a workplace that enables all colleagues to work and collaborate effectively together.
Inability to provide the necessary training and technologies for our colleagues to support the cultural shift could lead to reduced colleague engagement and loss of trust.
The Group must capitalise on the benefit of greater remote working to attract and retain talent while ensuring effective capacity planning and provision of future skills to meet Strategic Review 2021 objectives. Maintaining quality, productivity and a robust control environment within these new ways of working is essential to ensure customers are not adversely impacted.
– Support for colleague wellbeing and mental health continues to be paramount, with a range of support measures and training available to colleagues and line managers
– The Group continues to utilise remote working and adapt the office and branch estate to protect colleagues and customers, while delivering on customer expectations through the provision of technology and equipment to support remote working
– Regular, responsive communications in an evolving landscape provide reassurance to colleagues alongside colleague surveys to gauge sentiment and deployment of mitigants to address concerns
– Incorporating operational resilience into future design thinking and facilitation of office and remote experiments are designed to support increased collaboration and support new ways of working
– Effective capacity planning and provision of future skills to fulfil resource requirements and support the Strategic Review 2021 objectives
Cyber: Increases in the volume and sophistication of cyber-attacks alongside the growth in connected devices continues to heighten the potential for cyber-enabled crime. The Group can be impacted directly or through attacks on its supply chain.
Geopolitical tensions increases the risk of the Group being impacted directly or indirectly, by a sophisticated cyber-attack. The capability of organised crime groups is growing rapidly, which along with the commoditisation of cyber crime increases the likelihood that the Group or one of its suppliers will be the target of a sophisticated attack.
– Continued investment in and focus on the Group’s Cyber programme to ensure the confidentiality and integrity of data and the availability of systems. Key areas of focus relate to access controls, network security, disruptive technology and the denial of service capability
– Embedding of the Group Cyber control framework which is aligned to the industry recognised cyber security framework (National Institute of Standards and Technology, NIST)
– Three year cyber strategy to deliver an industry-leading approach across the Group and to embed innovation in our approach to cyber
– Structured approach to embed a cloud control framework to support the Group’s public cloud ambitions
– Increased business and colleague engagement through education and awareness, phishing testing and cultural indicators. Cyber risk is governed through all key risk committees and reviewed quarterly
Competition: Adoption of technological trends is accelerating with customer preferences changing. There has been considerable growth of new business models such as Buy Now Pay Later.
The FCA has signalled possible concerns around the impact of new products and business models, and the conduct of providers, and is investigating these issues further as part of the Unsecured Credit Review.
Further changes to the regulatory landscape, including prudential and capital rules, have the potential to create additional competitive pressures for the Group.
Operational complexity has the potential to restrict our speed of response to market trends.
Inability to leverage data and innovate could lead to a loss of market share as challengers capitalise on Open Banking. Although Open Banking has had a relatively modest uptake to date, there remains significant scope for new products and propositions to emerge.
– The Group continues to transform in order to improve its customer experience by digitising customer journeys and leveraging branches for complex needs, in response to customers’ evolving needs and expectations. During the pandemic, digitised customer journeys have been used at greater scale
– The Group will deepen its insight into customer segments, their perception of brands and what they value
– Agility will be increased by consolidating platforms and building new architecture aligned with customer journeys
– The Group is responsive to changing customer behaviour/ business models and adjusts its risk management approach as appropriate
– The Strategic Review 2021 is designed to support the Group to strengthen its competitive position
Data: Advancements in new technologies and services, increasing external risks such as cyber and conduct, and changing regulatory requirements all increase the need for the Group to effectively govern, manage and protect its data (or the data shared with third-party suppliers). Failure to manage data risk effectively can result in unethical decisions, poor customer outcomes, loss of value to the Group and mistrust.
– The Group has developed a data management strategy to provide the common framework and direction by uplifting data quality, simplifying data architecture, enhancing data governance and implementing market leading tools to enhance its ability to deliver a data-first culture
– To support the data management strategy, the Group continues to invest in managing the risks posed by its new technologies and services. This includes a data ethics framework, strong governance for the advanced analytics programme and cloud programmes
– The Group continues to monitor changes in legal and regulatory requirements and maintain close engagement with the regulators; Information Commissioner's Office (ICO), Prudential Regulatory Authority (PRA) and the Financial Conduct Authority (FCA) in order to monitor external developments within data risk

Strategic rep
ortFinancial results
Governance
Risk managem
entO
ther information
Financial statements
Lloyds Banking Group Annual Report and Accounts 2020 149
Risk Key mitigating actions
Regulatory and legal: The financial sector continues to experience increasing regulation from various bodies, including the Government and regulators.
Following the UK’s exit from the EU, there is uncertainty as to what the future UK legal and regulatory framework will look like, noting the potential for the UK to deviate from the EU’s legal and regulatory system.
Regulatory rules and laws from both the UK and overseas are likely to impact the Group’s operation, placing pressure on expert resource and investment priorities.
– The Group works closely with regulatory authorities and industry bodies to ensure that the Group can identify and respond to the evolving regulatory and legal landscape
– Following the UK’s exit from the EU, continued monitoring of new EU and UK legislation
– The Group actively implements programmes to deliver legal, regulatory and mandatory change requirements
Macroeconomic headwinds: There are large uncertainties for the global and UK economic outlook. The pandemic-driven recession has increased corporate and government indebtedness, raising the risk that inappropriately quick fiscal tightening or corporate cost cutting and investment postponement could hinder the economic recovery. Recovery is also dependent on the successful roll-out of COVID-19 vaccines.
The inflation and interest rates outlook is also uncertain. Weak demand could cause entrenched deflation if constrained monetary policy loosening struggles to stimulate demand, with policy interest rates stuck close to zero or negative. Conversely, there may be upward pressure on inflation and interest rates due to COVID-19 impacts, or from review of monetary policy frameworks around the world. Higher interest rates could trigger vulnerabilities within highly indebted companies and households, and to asset prices which have been boosted by high levels of liquidity provided by central banks.
There are also risks to the UK economy from changes in trading arrangements between the UK and EU, and longer term there is uncertainty around the impact of those new arrangements on the economy via domestic and net inward foreign investment.
– Wide array of risks considered in setting strategic plans
– Maintaining a high level of liquidity
– Capital and liquidity are reviewed regularly through committees, ensuring compliance with risk appetite and regulatory requirements
– The Group has a robust through the cycle credit risk appetite, including appropriate product, sector and single name concentration parameters, robust sector appetite statements and policies, as well as affordability and indebtedness controls at origination. In addition to ongoing focused monitoring, portfolio deep dives and regular larger exposure reviews are conducted. Enhancements have been made to the use of early warning indicators, including sector-specific indicators
Geopolitical: Current geopolitical uncertainties or political upheavals could further impede the global economic recovery, heighten instability and impact markets. The global reach of the COVID-19 pandemic continues to have a profound impact on economies around the world. Terrorist activity including cyber-attacks also has the potential to trigger changes in the economic outlook, market risk pricing and funding conditions.
Additionally, following the UK’s exit from the EU, the long-term implications of the new EU-UK Trade and Cooperation Agreement still bring some uncertainty for the UK’s economic outlook and relationship with the EU. There also remains the possibility of a further referendum on Scottish independence.
– Engagement with politicians, regulators, officials, media, trade and other bodies to monitor external developments and reassure our commitment to Helping Britain Prosper
– The Chief Resilience and Security Office (CRSO) develops and maintains a framework for external incidents, including financial stability, to ensure the incident response team convenes and acts rapidly during an external crisis. In conjunction CRSO also maintain an operational resilience framework to embed resilience activities across the Group and limit the impact of internal or external events
– The Group Corporate Treasury tracks market conditions closely and actively manage the Group’s balance sheet
– Hedging of market risk considers, inter alia, potential shocks as a result of geopolitical events
– The Group’s sector strategies and appetite look to help mitigate risks associated with geopolitical shocks. Credit applications and sector reviews include assessment of any relevant geopolitical risk including the UK’s exit from the EU
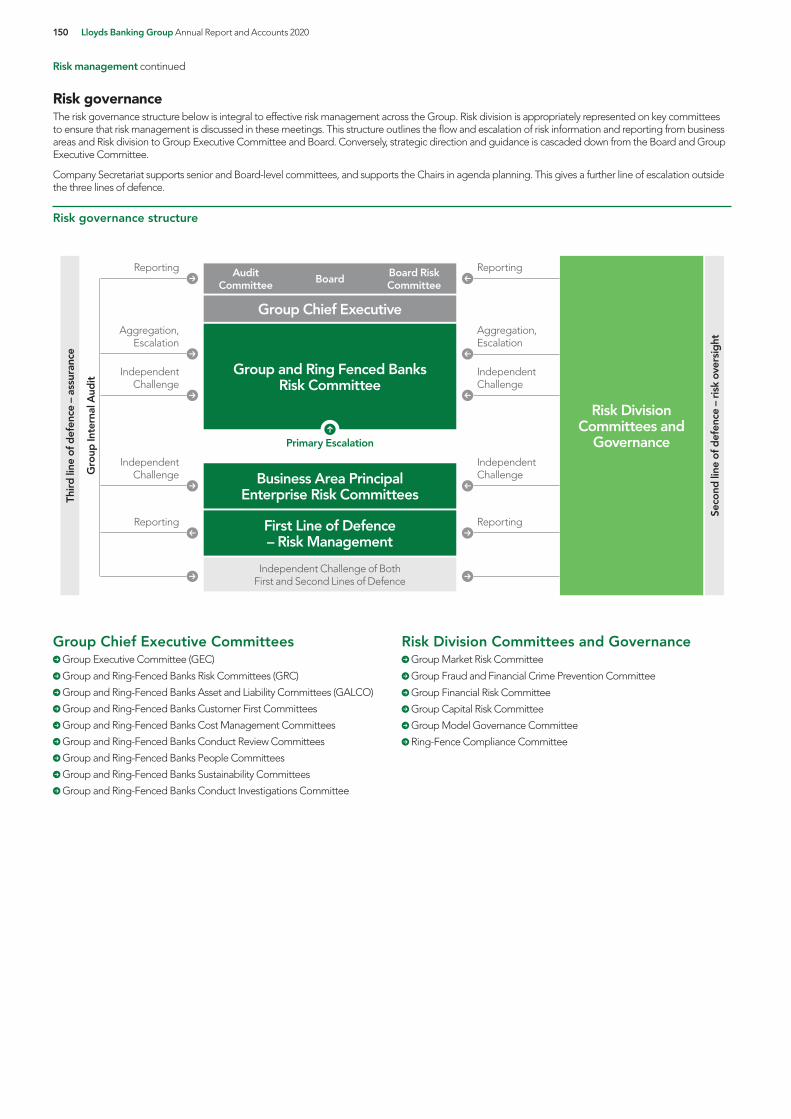
150 Lloyds Banking Group Annual Report and Accounts 2020
Risk management continued
Risk governanceThe risk governance structure below is integral to effective risk management across the Group. Risk division is appropriately represented on key committees to ensure that risk management is discussed in these meetings. This structure outlines the flow and escalation of risk information and reporting from business areas and Risk division to Group Executive Committee and Board. Conversely, strategic direction and guidance is cascaded down from the Board and Group Executive Committee.
Company Secretariat supports senior and Board-level committees, and supports the Chairs in agenda planning. This gives a further line of escalation outside the three lines of defence.
Risk governance structure
Business Area Principal Enterprise Risk Committees
First Line of Defence – Risk Management
Audit Committee Board Board Risk
Committee
Group Chief Executive
Reporting
Reporting
Reporting
Reporting
Thir
d lin
e of
def
ence
– a
ssur
ance
Gro
up In
tern
al A
udit
Seco
nd li
ne o
f def
ence
– r
isk
over
sig
ht
Independent Challenge of Both First and Second Lines of Defence
Group and Ring Fenced Banks Risk Committee
Aggregation, Escalation
Independent Challenge
Independent Challenge
Aggregation, Escalation
Primary Escalation
Independent Challenge
Independent Challenge
Risk Division Committees and
Governance
Group Chief Executive Committees Group Executive Committee (GEC)
Group and Ring-Fenced Banks Risk Committees (GRC)
Group and Ring-Fenced Banks Asset and Liability Committees (GALCO)
Group and Ring-Fenced Banks Customer First Committees
Group and Ring-Fenced Banks Cost Management Committees
Group and Ring-Fenced Banks Conduct Review Committees
Group and Ring-Fenced Banks People Committees
Group and Ring-Fenced Banks Sustainability Committees
Group and Ring-Fenced Banks Conduct Investigations Committee
Risk Division Committees and Governance Group Market Risk Committee
Group Fraud and Financial Crime Prevention Committee
Group Financial Risk Committee
Group Capital Risk Committee
Group Model Governance Committee
Ring-Fence Compliance Committee

Strategic rep
ortFinancial results
Governance
Risk managem
entO
ther information
Financial statements
Lloyds Banking Group Annual Report and Accounts 2020 151
Board, Executive and Risk CommitteesThe Group’s risk governance structure strengthens risk evaluation and management, while also positioning the Group to manage the changing regulatory environment in an efficient and effective manner.
Assisted by the Board Risk and Audit Committees, the Board approves the Group’s overall governance, risk and control frameworks and risk appetite. Refer to the Corporate Governance section on pages 86 to 97, for further information on Board committees.
The divisional and functional risk committees review and recommend divisional and functional risk appetite and monitor local risk profile and adherence to appetite.
Executive and Risk Committees
The Group Chief Executive is supported by the following:
Committees Risk focus
Group Executive Committee (GEC) Assists the Group Chief Executive in exercising their authority in relation to material matters having strategic, cross-business area or Group-wide implications.
Group and Ring-Fenced Banks Risk Committees (GRC)
Responsible for the development, implementation and effectiveness of the Group’s enterprise risk management framework, the clear articulation of the Group’s risk appetite and monitoring and reviewing of the Group’s aggregate risk exposures and concentrations of risk.
Group and Ring-Fenced Banks Asset and Liability Committees (GALCO)
Responsible for the strategic direction of the Group’s assets and liabilities and the profit and loss implications of balance sheet management actions. The committee reviews and determines the appropriate allocation of capital, funding and liquidity, and market risk resources and makes appropriate trade-offs between risk and reward.
Group and Ring-Fenced Banks Customer First Committees
Provides a Group-wide perspective of customer experience and the governing body of customer plans and targets including governing targets and plans, oversight of customer outcomes and experience, and learning through best practice externally and leveraging Group memberships and partnerships.
Group and Ring-Fenced Banks Cost Management Committees
Leads and shapes the Group’s approach to cost management, ensuring appropriate governance and process over Group-wide cost management activities and effective control of the Group’s cost base.
Group and Ring-Fenced Banks Conduct Review Committees
Provides senior management oversight, challenge and accountability in connection with the Group’s engagement with conduct review matters as agreed with the Group Chief Executive.
Group and Ring-Fenced Banks People Committees
Supporting the Group People & Property Director in exercising their responsibilities in relation to the Group’s people and colleague policies, overseeing the development of and monitoring adherence to the remuneration policy, oversees compliance with Senior Manager and Certification Regime (SM&CR) and other regulatory requirements, monitors colleague engagement surveys, progress of the Group towards its culture targets and oversees the implementation of action plans.
Group and Ring-Fenced Banks Sustainability Committees
Recommends and implements the strategy and plans for delivering the Group’s aspiration to be viewed as a trusted responsible business as part of the purpose of Helping Britain Prosper, reporting to the GEC, GRC, Responsible Business Committee where appropriate on material sustainability related risk and opportunities across the Group; and recommending to the GEC and Responsible Business Committee the Group's Responsible Business Report and Helping Britain Prosper Plan.
Group and Ring-Fenced Banks Conduct Investigations Committee
Responsible for providing recommendations regarding performance adjustment, including the individual risk-adjustment process and risk-adjusted performance assessment, and making final decisions on behalf of the Group on the appropriate course of action relating to conduct breaches, under the formal scope of the SM&CR.
In addition, the Strategic Review 2021 Forum provides strategic deep dives across priority areas to support the Group Chief Executive and accountable executives in monitoring strategic progress and challenges in focus areas.
The Group Risk Committee is supported through escalation and ongoing reporting by business area risk committees, cross-divisional committees addressing specific matters of Group-wide significance and the following second line of defence Risk committees which ensure effective oversight of risk management:
Group Market Risk Committee Responsible for monitoring, oversight and challenge of market risk exposures across the Group. Reviews and proposes changes to the market risk management framework, and reviews the adequacy of data quality needed for managing market risks. It is also responsible for escalating issues of Group level significance to GEC level (usually via GALCO) relating to the management of the Group's market risks, including those held in the Group's insurance companies.
Group Fraud and Financial Crime Prevention Committee
Brings together accountable stakeholders and subject matter experts to ensure that the development and application of fraud and financial crime risk management complies with the Group's Strategic Aims, Group Corporate Responsibility, Group Risk Appetite and Group Fraud and Financial Crime (AML, Anti-bribery and Sanctions) policies. It provides direction and appropriate focus on priorities to enhance the Group's fraud and financial crime risk management capabilities in line with business and customer objectives while aligning to the Group's target operating model.
Group Financial Risk Committee Responsible for overseeing, reviewing, challenging and recommending to GEC / Board Risk Committee / Board for the Group and Ring-Fenced Bank (i) Annual Internal Stress Tests, (ii) All Prudential Regulation Authority (PRA) / European Banking Authority (EBA) and any other regulatory stress tests, (iii) Annual Liquidity Stress Tests, (iv) Reverse Stress Tests, (v) Individual Liquidity Adequacy Assessment (ILAA), (vi) Internal Capital Adequacy Assessment Process (ICAAP), (vii) Pillar 3, (viii) Recovery / Resolution Plans, and (ix) relevant ad hoc Stress Tests or other analysis as and when required by the Committee.
Group Capital Risk Committee Responsible for providing oversight of all relevant capital matters within the Group, Ring-Fenced Bank and material subsidiaries, including latest capital position and plans, capital risk appetite proposals, Pillar 2 developments (including stress testing), Recovery and Resolution matters and the impact of regulatory reforms and developments specific to capital.

152 Lloyds Banking Group Annual Report and Accounts 2020
Risk management continued
Capital stress testing
OverviewStress testing is recognised as a key risk management tool by the Boards, senior management, the businesses and the Risk and Finance functions of all parts of the Group and its legal entities. It is fully embedded in the planning process of the Group and its legal entities as a key activity in medium-term planning, and senior management is actively involved in stress testing activities via a strict governance process.
Scenario stress testing is used for:
Risk Identification:
Understand key vulnerabilities of the Group and its key legal entities under adverse economic conditions
Risk Appetite:
Assess the results of the stress test against the risk appetite of all parts of the Group to ensure the Group and its legal entities are managed within their risk parameters
Inform the setting of risk appetite by assessing the underlying risks under stress conditions
Strategic and Capital Planning:
Allow senior management and the Boards of the Group and its applicable legal entities to adjust strategies if the plan does not meet risk appetite in a stressed scenario
Support the Internal Capital Adequacy Assessment Process (ICAAP) by demonstrating capital adequacy, and meet the requirements of regulatory stress tests that are used to inform the setting of the Prudential Regulation Authority (PRA) and management buffers (see capital risk on pages 188 to 196) of the Group and its separately regulated legal entities
Risk Mitigation:
Drive the development of potential actions and contingency plans to mitigate the impact of adverse scenarios. Stress testing also links directly to the recovery planning process of the Group and its legal entities
Regulatory stress testsThe PRA have launched the 2021 Solvency Stress test which the Group will participate in. Their objective is to update the Bank of England's Financial Policy Committee (FPC) view on how the banking system can support the economy, ensure banks have built up buffers of capital to be drawn on in a stress and input into the PRA’s transition back to its standard approach to capital-setting and shareholder distributions through 2021. Industry level credit risk will be published in July with Bank level results published in December. The scenario requires the bank to show how resilient it is to a severe economic shock in addition to what has been experienced over 2020; House Price Index (HPI) and Commercial Real Estate (CRE) values fall a further 33 per cent and unemployment peaks at 11.9 per cent.
Internal stress testsOn at least an annual basis, the Group conducts macroeconomic stress tests of the operating plan, which are supplemented with higher-level refreshes if necessary. The exercise aims to highlight the key vulnerabilities of the Group’s and its legal entities’ business plans to adverse changes in the economic environment, and to ensure that there are adequate financial resources in the event of a downturn.
Reverse stress testingReverse stress testing is used to explore the vulnerabilities of the Group’s and its key legal entities’ strategies and plans to extreme adverse events that would cause the businesses to fail. Where this identifies plausible scenarios with an unacceptably high risk, the Group or its entities will adopt measures to prevent or mitigate that and reflect these in strategic plans.
Other stress testing activityThe Group’s stress testing programme also involves undertaking assessments of liquidity scenarios, market risk sensitivities and scenarios, and business specific scenarios (see the principal risk categories on pages 153 to 204 for further information on risk-specific stress testing). If required, ad hoc stress testing exercises are also undertaken to assess emerging risks, as well as in response to regulatory requests. This wide ranging programme provides a comprehensive view of the potential impacts arising from the risks to which the Group is exposed and reflects the nature, scale and complexity of the Group. The Group will undertake the Bank of England’s Climate Biennial Exploratory Stress test in 2021 and will leverage the experience gained through that exercise to further embed climate risk into stress testing activities.
MethodologyThe stress tests at all levels must comply with all regulatory requirements, achieved through the comprehensive construction of macroeconomic scenarios and a rigorous divisional, functional, risk and executive review and challenge process, supported by analysis and insight into impacts on customers and business drivers.
The engagement of all required business, Risk and Finance teams is built into the preparation process, so that the appropriate analysis of each risk category’s impact upon the business plans is understood and documented. The methodologies and modelling approach used for stress testing ensure that a clear link is shown between the macroeconomic scenarios, the business drivers for each area and the resultant stress testing outputs. All material assumptions used in modelling are documented and justified, with a clearly communicated review and sign-off process. Modelling is supported by expert judgement and is subject to the Group Model Governance Policy.
GovernanceClear accountabilities and responsibilities for stress testing are assigned to senior management and the Risk and Finance functions throughout the Group and its key legal entities. This is formalised through the Group Business Planning and Stress Testing Policy and Procedure, which are reviewed at least annually.
The Group Financial Risk Committee (GFRC), chaired by the Chief Risk Officer and attended by the Chief Financial Officer and other senior Risk and Finance colleagues, is the committee that has primary responsibility for overseeing the development and execution of the Group’s and Ring-Fenced Bank’s stress tests. Lloyds Bank Corporate Markets (LBCM) Risk Committee performs a similar function within the scope of LBCM.
The review and challenge of the Group’s and Ring-Fenced Bank’s detailed stress forecasts, the key assumptions behind these, and the methodology used to translate the economic assumptions into stressed outputs conclude with the appropriate Finance and Risk Directors’ sign-off. The outputs are then presented to GFRC and Board Risk Committee for review and challenge, before being approved by the Board. There is a similar process within LBCM for the governance of the LBCM-specific results.
Committees Risk focus
Group Model Governance Committee Responsible for supporting the Model Risk and Validation Director in fulfilling their responsibilities, from a Group-wide perspective, under the Group Model Governance Policy through provision of debate, challenge and support of decisions. The committee will be held as required to facilitate approval of models, model changes and model related items as required by Model Policy, including items related to the governance framework as a whole and its application.
Ring-Fence Compliance Committee This Committee is designed to provide executive sponsorship and strategic direction to ongoing Perimeter Compliance, the closure and remediation of breaches, monitoring and reporting of new breaches and associated governance and delivery enhancements to the Ring-Fencing Compliance Risk Framework.

Strategic rep
ortFinancial results
Governance
Risk managem
entO
ther information
Financial statements
Lloyds Banking Group Annual Report and Accounts 2020 153
Full analysis of risk categoriesThe Group’s risk framework covers all types of risk which affect the Group and could impact on the achievement of its strategic objectives. A detailed description of each category is provided on pages 154 to 204.
Risk categories recognised by the Group are periodically reviewed to ensure that they reflect the Group risk profile in light of internal and external factors, such as the Group strategy and the regulatory environment in which it operates. The only change to the risk categories during 2020 has been the addition of Climate risk.
Principal risk categories Secondary risk categories
Climate risk – Climate
Page 154
Market risk – Trading book – Pensions
Page 155 – Banking book – Insurance
Credit risk – Retail credit – Commercial credit
Page 160
Funding and liquidity risk – Funding and liquidity
Page 183
Capital risk – Capital
Page 188
Insurance underwriting risk – Insurance underwriting
Page 196
Change/execution risk – Change/execution
Page 197
Conduct risk – Conduct
Page 197
Data risk – Data
Page 199
Governance risk – Governance
Page 199
People risk – People
Page 200
Operational resilience risk – Operational resilience
Page 200
Operational risk – Business process – Financial reporting – Physical security/health and safety
Page 201 – Cyber and information security – Fraud – Sourcing
– External service provision – Internal service provision
– Financial crime – IT systems
Model risk – Model
Page 203
Regulatory and legal risk – Regulatory compliance – Legal
Page 203
Strategic risk – Strategic
Page 204
The Group considers both reputational and financial impact in the course of managing all its risks and therefore does not classify reputational impact as a separate risk category.

154 Lloyds Banking Group Annual Report and Accounts 2020
Risk management continued
Climate riskDefinitionClimate risk is defined as the risk that the Group experiences losses and/or reputational damage as a result of climate change, either directly or through its customers. These losses may be realised from physical events, the required adaptation in transitioning to a low carbon economy, or as a consequence of the responses to managing these changes.
ExposuresClimate risk can arise from:
Physical risks - changes in climate or weather patterns which are acute, event driven (e.g. flood), or chronic, longer term shifts (e.g. rising sea levels)
Transition risks - associated with the move towards a low carbon economy, e.g. changes to policy, legislation and regulation, technology and changes to customer preferences. Failure to manage these changes and adapt to climate change could then result in legal risks
Climate risk manifests through, and has potential to impact, the Group’s existing principal financial and non-financial risks. Climate risk is included as both a principal and emerging risk this year given it is such a new and fast moving area. The Group has undertaken an analysis of how the its principal risks are impacted by climate change. For further information see page 26 in the 2020 Lloyds Banking Group ESG Report.
The Group has identified loans and advances to customers in sectors at increased risk from the impacts of climate change, see page 23.
MeasurementThe Group is continuing to develop its modelling and assessment capabilities for quantifying climate risk, including building a greater understanding through climate scenario analysis.
In 2020, the Group has approved a Risk Appetite Statement for climate risk, as well as an interim metric to ensure the Group continues to progress activities at pace, and also included commentary on climate-related risks as part of the Group's annual ICAAP, using expert judgement to assess the financial impacts under a number of different climate scenarios.
The Group has also developed and is piloting a tool in Commercial Banking to qualitatively assess the physical and transition risks relating to the Group's clients.
MitigationThe Group has twelve external sector statements that help articulate appropriate areas of climate related risk appetite and the Group's approach to the risk assessment of its customers. The Group is continuing to refine and enhance these statements.
As part of the Group’s credit risk policy, we have mandatory requirements to consider environmental risks in key risk management activities. In Commercial Banking, Relationship Managers must ensure that sustainability risk is considered for all new and renewal facilities, and specifically commented on where credit limits exceed £500,000.
Other initiatives to further embed climate risk factors into the risk management activities across the Group include: development of a risk mitigation strategy for vehicle finance and home loans in Retail; and further development of the Group's weather modelling capabilities in Insurance, where an assessment of climate-related risks to General Insurance liabilities is integrated into the internal model governance process.
The Group is continuing to develop its climate risk management framework to ensure all activities consider the appropriate climate-related risks and opportunities and the Group’s processes will continue to evolve as it embeds its approach.
MonitoringGovernance for climate-related risk is embedded into the Group’s existing governance structure and is complementary to governance of the Group’s sustainability strategy.
Climate risk is monitored in the Group’s risk reporting and more detailed updates are provided regularly to the Group and Ring-Fenced Banks Board Risk Committees regarding the Group’s climate risk management activities and key developments.

Strategic rep
ortFinancial results
Governance
Risk managem
entO
ther information
Financial statements
Lloyds Banking Group Annual Report and Accounts 2020 155
Market risk
DefinitionMarket risk is defined as the risk that the Group's capital or earnings profile is affected by adverse market rates or prices, in particular interest rates and credit spreads in the Banking business, interest rates, equity prices and credit spreads in the Insurance business, and credit spreads in the Group’s Defined Benefit Pension Schemes.
Balance sheet linkagesThe information provided in the table below aims to facilitate the understanding of linkages between banking, trading, and insurance balance sheet items and the positions disclosed in the Group’s market risk disclosures.
Market risk linkage to the balance sheetBanking
TotalTrading
book1 Non-trading Insurance2020 £m £m £m £m Primary market risk factor
Assets
Cash and balances at central banks 73,257 — 73,257 — Interest rate
Financial assets at fair value through profit or loss 171,626 20,234 5,487 145,905
Interest rate, foreign exchange, credit spread
Derivative financial instruments 29,613 21,773 4,729 3,111 Interest rate, foreign exchange, credit spread
Financial assets at amortised cost
Loans and advances to banks 10,746 — 10,651 95 Interest rate
Loans and advances to customers 498,843 — 498,807 36 Interest rate
Debt securities 5,405 — 5,405 — Interest rate, credit spread
514,994 — 514,863 131
Financial assets at fair value through other comprehensive income 27,603 — 27,603 —
Interest rate, foreign exchange, credit spread
Value of in-force business 5,617 — — 5,617 Equity
Other assets 48,559 — 21,837 26,722 Interest rate
Total assets 871,269 42,007 647,776 181,486
Liabilities
Deposit from banks 31,465 — 31,465 — Interest rate
Customer deposits 460,068 — 460,068 — Interest rate
Financial liabilities at fair value through profit or loss 22,646 15,818 6,828 —
Interest rate, foreign exchange
Derivative financial instruments 27,313 17,429 6,819 3,065 Interest rate, foreign exchange, credit spread
Debt securities in issue 87,397 — 87,397 — Interest rate, credit spread
Liabilities arising from insurance and investment contracts 154,512 — — 154,512
Credit spread
Subordinated liabilities 14,261 — 12,369 1,892 Interest rate, foreign exchange
Other liabilities 24,194 — 9,244 14,950 Interest rate
Total liabilities 821,856 33,247 614,190 174,419
1 Assets and liabilities are only classified as Trading book if they meet the requirements as set out in the Capital Requirements Regulation, article 104.
The defined benefit pension schemes’ assets and liabilities are included under Other assets and Other liabilities in this table and note 34 on page 277 provides further information.
The Group’s trading book assets and liabilities are originated within the Commercial Banking division. Within the Group’s balance sheet these fall under the trading assets and liabilities and derivative financial instruments. The assets and liabilities are classified as trading book if they meet the requirements as set out in the Capital Requirements Regulation, article 104. Further information on these activities can be found under the Trading portfolios section on page 159.
Derivative assets and liabilities are held by the Group for three main purposes; to provide risk management solutions for clients, to manage portfolio risks arising from client business and to manage and hedge the Group’s own risks. Insurance business assets and liabilities relate to policyholder funds, as well as shareholder invested assets, including annuity funds. The Group recognises the value of
in-force business in respect of Insurance’s long-term life assurance contracts as an asset in the balance sheet (see note 23, page 267).
The Group ensures that it has adequate cash and balances at central banks and stocks of high quality liquid assets (e.g. gilts or US Treasury securities) that can be converted easily into cash to meet liquidity requirements. The majority of these assets are asset swapped and held at fair value through other comprehensive income with the remainder held as financial assets at fair value through profit and loss. Further information on these balances can be found under funding and liquidity risk on page 183.
The majority of debt issuance originates from the Group’s capital and funding activities and the interest rate risk of the debt issued is hedged by swapping them into a floating rate.
The non-trading book primarily consists of customer on-balance sheet activities and the Group’s capital and funding activities, which expose it to the risk of adverse movements in market rates or prices, predominantly interest rates, credit spreads, exchange rates and equity prices, as described in further detail within the Banking activities section (page 156).

156 Lloyds Banking Group Annual Report and Accounts 2020
Risk management continued
MeasurementIn addition to measuring single factors, Group risk appetite is calibrated primarily to five multi-risk Group economic scenarios, and is supplemented with sensitivity-based measures. The scenarios assess the impact of unlikely, but plausible, adverse stresses on income with the worst case for banking activities, defined benefit pensions, insurance and trading portfolios reported against independently, and across the Group as a whole.
The Group risk appetite is cascaded first to the Group Asset and Liability Committee (GALCO), chaired by the Chief Financial Officer, where risk appetite is approved and monitored by risk type, and then to the Group Market Risk Committee (GMRC) where risk appetite is sub-allocated by division. These metrics are reviewed regularly by senior management to inform effective decision-making.
MitigationGALCO is responsible for approving and monitoring group market risks, management techniques, market risk measures, behavioural assumptions, and the market risk policy. Various mitigation activities are assessed and undertaken across the Group to manage portfolios and seek to ensure they remain within approved limits. The mitigation actions will vary dependent on exposure but will, in general, look to reduce risk in a cost effective manner by offsetting balance sheet exposures and externalising to the financial markets dependent on market liquidity. The market risk policy is owned by Group Corporate Treasury (GCT) and refreshed annually. The policy is underpinned by supplementary market risk procedures, which define specific market risk management and oversight requirements.
MonitoringGALCO and GMRC regularly review high level market risk exposure as part of the wider risk management framework. They also make recommendations to the Board concerning overall market risk appetite and market risk policy. Exposures at lower levels of delegation are monitored at various intervals according to their volatility, from daily in the case of trading portfolios to monthly or quarterly in the case of less volatile portfolios. Levels of exposures compared to approved limits and triggers are monitored by Risk and appropriate escalation procedures are in place.
How market risks arise and are managed across the Group’s activities is considered in more detail below.
Banking activitiesExposuresThe Group’s banking activities expose it to the risk of adverse movements in market rates or prices, predominantly interest rates, credit spreads, exchange rates and equity prices. The volatility of market rates or prices can be affected by both the transparency of prices and the amount of liquidity in the market for the relevant asset, liability or instrument.
Interest rate riskYield curve risk in the Group’s divisional portfolios, and in the Group’s capital and funding activities arises from the different repricing characteristics of the Group’s non-trading assets, liabilities and off-balance sheet positions.
Basis risk arises from the potential changes in spreads between indices, for example where the bank lends with reference to a central bank rate but funds with reference to LIBOR, and the spread between these two rates widens or tightens.
Optionality risk arises predominantly from embedded optionality within assets, liabilities or off-balance sheet items where either the Group or the customer can affect the size or timing of cash flows. One example of this is mortgage prepayment risk where the customer owns an option allowing them to prepay when it is economical to do so. This can result in customer balances amortising more quickly or slowly than anticipated due to customers’ response to changes in economic conditions.
Foreign exchange riskEconomic foreign exchange exposure arises from the Group’s investment in its overseas operations (net investment exposures are disclosed in note 51 on page 314). In addition, the Group incurs foreign exchange risk through non-functional currency flows from services provided by customer-facing divisions, the Group’s debt and capital management programmes and is exposed to volatility in its CET1 ratio, due to the impact of changes in foreign exchange rates on the retranslation of non-sterling- denominated RWAs.
Equity riskEquity risk arises primarily from three different sources:
the Group’s private equity investments held by Lloyds Development Capital within the Equities sub-group
the Group’s strategic equity holdings, for example Visa Inc Preference Shares, now held in the Equities sub-group
a small exposure to Lloyds Banking Group share price through deferred shares and deferred options granted to employees as part of their benefits package
Credit spread riskCredit spread risk arises largely from (i) the liquid asset portfolio held in the management of Group liquidity, comprising of government, supranational and other eligible assets; (ii) the Credit Valuation Adjustment (CVA) and Debt Valuation Adjustment (DVA) sensitivity to credit spreads; (iii) a number of the Group’s structured medium-term notes where the Group has elected to fair value the notes through the profit and loss account; and (iv) banking book assets in Commercial Banking held at fair value under IFRS 9.
MeasurementInterest rate risk exposure is monitored monthly using, primarily:
Market value sensitivity: this methodology considers all repricing mismatches (behaviourally adjusted where appropriate) in the current balance sheet and calculates the change in market value that would result from an instantaneous 25, 100 and 200 basis points parallel rise or fall in the yield curve. GBP interest rates are modelled with a floor at zero per cent, with negative rate floors modelled for non-GBP currencies where appropriate (product-specific floors apply). The market value sensitivities are calculated on a static balance sheet using principal cash flows excluding interest, commercial margins and other spread components and are therefore discounted at the risk free rate.
Interest income sensitivity: this measures the 12 month impact on future net interest income arising from various economic scenarios. These include instantaneous 25, 100 and 200 basis point parallel shifts in all yield curves and the five Group economic scenarios. GBP interest rates are modelled with a floor at zero per cent, with negative rate floors modelled for non-GBP currencies where appropriate (product-specific floors apply). These scenarios are reviewed every year and are designed to replicate severe but plausible economic events, capturing risks that would not be evident through the use of parallel shocks alone such as basis risk and steepening or flattening of the yield curve. Additional negative rate scenarios are also used, where floors are removed or lowered, to ensure that this risk is monitored; however these are not measured against the limit framework for the purposes of Risk Appetite.
Unlike the market value sensitivities, the interest income sensitivities incorporate additional behavioural assumptions as to how and when individual products would reprice in response to changing rates. In addition a dynamic balance sheet is used which includes the run-off of current assets and liabilities and the addition of planned new business.
Reported sensitivities are not necessarily predictive of future performance as they do not capture additional management actions that would likely be taken in response to an immediate, large, movement in interest rates. These actions could reduce the net interest income sensitivity, help mitigate any adverse impacts or they may result in changes to total income that are not captured in the net interest income.
Structural hedge: the structural hedging programme managing interest rate risk in the banking book relies on assumptions made around customer behaviour. A number of metrics are in place to monitor the risks within the portfolio.

Strategic rep
ortFinancial results
Governance
Risk managem
entO
ther information
Financial statements
Lloyds Banking Group Annual Report and Accounts 2020 157
The Group has an integrated Asset and Liability Management (ALM) system which supports non-traded asset and liability management of the Group. This provides a single consolidated tool to measure and manage interest rate repricing profiles (including behavioural assumptions), perform stress testing and produce forecast outputs. The Group is aware that any assumptions based model is open to challenge. A full behavioural review is performed annually, or in response to changing market conditions, to ensure the assumptions remain appropriate and the model itself is subject to annual re-validation, as required under the Group Model Governance Policy. The key behavioural assumptions are:
embedded optionality within products
the duration of balances that are contractually repayable on demand, such as current accounts and overdrafts, together with net free reserves of the Group
the re-pricing behaviour of managed rate liabilities, such as variable rate savings
The table below shows, split by material currency, the Group’s market value sensitivities to an instantaneous parallel up and down 25 and 100 basis points change to all interest rates.
Group Banking activities: market value sensitivity (audited)
2020 2019
Up 25bps
Down 25bps
Up 100bps
Down 100bps
Up 25bps
Down 25bps
Up 100bps
Down 100bps
£m £m £m £m £m £m £m £m
Sterling 69.7 7.8 279.1 10.9 13.6 (13.6) 52.7 (47.4)
US Dollar (3.6) 4.7 (13.6) 11.1 (5.6) 5.8 (21.3) 24.3
Euro (6.0) (5.4) (23.0) (9.3) (7.2) 2.3 (27.0) 11.1
Other 0.2 (0.1) 0.9 (0.1) 0.2 (0.2) 0.8 (0.8)
Total 60.3 7.0 243.4 12.6 1.0 (5.7) 5.2 (12.8)
This is a risk based disclosure and the amounts shown would be amortised in the income statement over the duration of the portfolio.
The market value sensitivity is driven by temporary customer flow positions not yet hedged plus other positions occasionally held, within limits, in order to minimise overall funding and hedging costs. The sensitivity, to up 100bps, increased in 2020 due to customer balance sheet changes and the associated hedging, in particular growth in fixed rate mortgages. The level of risk remains low relative to the size of the total balance sheet.
The table below shows supplementary value sensitivity to a steepening and flattening (c.100 basis points around the 3 year point) in the yield curve. This ensures there are no unintended consequences to managing risk to parallel shifts in rates.
Group Banking activities: market value sensitivity to a steepening and flattening of the yield curve (audited)
2020 2019
Steepener Flattener Steepener Flattener£m £m £m £m
Sterling (56.8) 20.1 46.6 (47.5)
US Dollar (9.4) 10.0 (13.2) 15.3
Euro (16.6) (4.3) (15.5) 9.7
Other 0.2 0.4 0.4 (0.4)
Total (82.6) 26.2 18.3 (22.9)
The table below shows the banking book net interest income sensitivity to an instantaneous parallel up and down 25 and 100 basis points change to all interest rates.
Group Banking activities: net interest income sensitivity (audited)
2020 2019
Up 25bps
Down 25bps
Up 100bps
Down 100bps
Up 25bps
Down 25bps
Up 100bps
Down 100bps
£m £m £m £m £m £m £m £m
Client facing activity and associated hedges 260.9 (137.5) 1,065.3 (142.3) 109.4 (147.9) 430.8 (702.8)
Income sensitivity is measured on a rolling 12 month basis.

158 Lloyds Banking Group Annual Report and Accounts 2020
Risk management continued
Net interest income sensitivity, to up 100bps, has increased year-on-year in part due to the growth in customer deposits and account management activity during 2020. This would result in widening margins in a rates up scenario, increasing net interest income.
The decrease in risk sensitivity year-on-year, to down 100bps, is driven by a reduction in modelled margin compression risk following the fall in interest rates in 2020. This is due to the Group’s assumptions for modelling GBP interest rates with a floor of zero per cent (product-specific floors apply) which limits the down-shock applied.
Basis risk, foreign exchange, equity, and credit spread risks are measured primarily through scenario analysis by assessing the impact on profit before tax over a 12 month horizon arising from a change in market rates, and reported within the Board risk appetite on a monthly basis. Supplementary measures such as sensitivity and exposure limits are applied where they provide greater insight into risk positions. Frequency of reporting supplementary measures varies from daily to quarterly appropriate to each risk type.
MitigationThe Group’s policy is to optimise reward whilst managing its market risk exposures within the risk appetite defined by the Board. The Group Market Risk Policy and procedures outlines the hedging process, and the centralisation of risk from divisions into GCT, e.g. via the transfer pricing framework. GCT is responsible for managing the centralised risk and does this through natural offsets of matching assets and liabilities, and appropriate hedging activity of the residual exposures, subject to the authorisation and mandate of GALCO within the Board risk appetite. The hedges are externalised to the market by derivative desks within GCT and the Commercial Bank. The Group mitigates income statement volatility through hedge accounting. This reduces the accounting volatility arising from the Group’s economic hedging activities and any hedge accounting ineffectiveness is continuously monitored.
The largest residual risk exposure arises from balances that are deemed to be insensitive to changes in market rates (including current accounts, a portion of variable rate deposits and investable equity), and is managed through the Group’s structural hedge. Consistent with the Group’s strategy to deliver stable returns, GALCO seeks to minimise large reinvestment risk, and to smooth earnings over a range of investment tenors. The structural hedge consists of longer-term fixed rate assets or interest rate swaps and the amount and duration of the hedging activity is reviewed regularly by GALCO.
Whilst the bank faces margin compression in low rate environments, its exposure to pipeline and prepayment risk are not considered material and are hedged in line with expected customer behaviour. These are appropriately monitored and controlled through divisional Asset and Liability Committees (ALCOs).
Net investment foreign exchange exposures are managed centrally by GCT, by hedging non-sterling asset values with currency borrowing. Economic foreign exchange exposures arising from non-functional currency flows are identified by divisions and transferred and managed centrally. The Group also has a policy of forward hedging its forecasted currency profit and loss to year end. The Group makes use of both accounting and economic foreign exchange exposures, as an offset against the impact of changes in foreign exchange rates on the value of non-sterling-denominated RWAs. This involves the holding of a structurally open currency position; sensitivity is minimised where, for a given currency, the ratio of the structural open position to RWAs equals the CET1 ratio. Continually evaluating this structural open currency position against evolving non-sterling-denominated RWAs, mitigates volatility in the Group’s CET1 ratio.
MonitoringThe appropriate limits and triggers are monitored by senior executive committees within the banking divisions. Banking assets, liabilities and associated hedging are actively monitored and if necessary rebalanced to be within agreed tolerances.
Defined benefit pension schemesExposuresThe Group’s defined benefit pension schemes are exposed to significant risks from their assets and liabilities. The liability discount rate exposes the Group to interest rate risk and credit spread risk, which are partially offset by fixed interest assets (such as gilts and corporate bonds) and swaps.
Equity and alternative asset risk arises from direct asset holdings. Scheme membership exposes the Group to longevity risk.
For further information on defined benefit pension scheme assets and liabilities please refer to note 34 on page 277.
MeasurementManagement of the schemes’ assets is the responsibility of the Trustees of the schemes who are responsible for setting the investment strategy and for agreeing funding requirements with the Group. The Group will be liable for meeting any funding deficit that may arise. As part of the triennial valuation process, the Group will agree with the Trustees a funding strategy to eliminate the deficit over an appropriate period.
Longevity risk is measured using both 1-in-20 year stresses (risk appetite) and 1-in-200 year stresses (regulatory capital).
MitigationThe Group takes an active involvement in agreeing mitigation strategies with the schemes’ Trustees. An interest rate and inflation hedging programme is in place to reduce liability risk. The schemes have also reduced equity allocation and invested the proceeds in credit assets. The Trustees have put in place a longevity swap to mitigate longevity risk. The merits of longevity risk transfer and hedging solutions are reviewed regularly.
MonitoringIn addition to the wider risk management framework, governance of the schemes includes two specialist pensions committees.
The surplus, or deficit, in the schemes is tracked monthly along with various single factor and scenario stresses which consider the assets and liabilities holistically. Key metrics are monitored monthly including the Group’s capital resources of the scheme, the performance against risk appetite triggers, and the performance of the hedged asset and liability matching positions.
Insurance portfoliosExposuresThe main elements of market risk to which the Group is exposed through the Insurance business are equity, credit default spread, interest rate and inflation.
Equity risk arises indirectly through the value of future management charges on policyholder funds. These management charges form part of the value of in-force business (see note 23 on page 267. Equity risk also arises in the with-profits funds but is less material
Credit default spread risk mainly arises from annuities where policyholders’ future cash flows are guaranteed at retirement. Exposure arises if the market value of the assets, which are mainly corporate bonds and loans, move differently to the liabilities they back. This exposure arises from credit downgrades and defaults
Interest rate risk arises through holding credit and interest assets mainly in the annuity book and also to cover general insurance liabilities, capital requirements and risk appetite
Inflation exposure arises from a combination of inflation linked policyholder benefits and inflation assumptions used to project future expenses
MeasurementCurrent and potential future market risk exposures within Insurance are assessed using a range of techniques including stress, reverse stress and scenario testing, as well as stochastic modelling.
Risk measures include 1-in-200 year stresses used for regulatory capital assessments and single factor stresses for profit before tax.
The table below demonstrates the impact of the Group’s UK Recession scenario on the Insurance business’ portfolio (with no diversification benefit). The amounts include movements in assets, liabilities and the value of in-force business in respect of insurance contracts and participating investment contracts.

Strategic rep
ortFinancial results
Governance
Risk managem
entO
ther information
Financial statements
Lloyds Banking Group Annual Report and Accounts 2020 159
Insurance business: profit before tax sensitivities
Increase (reduction) in profit before tax
2020 2019£m £m
Interest rates – decrease 100 basis points 134 116
Inflation – increase 50 basis points 44 30
Credit default spreads – Double (1,105) (1,006)
Equity – 30% fall 20 (68)
Property – 25% fall (58) (47)
Further stresses that show the effect of reasonably possible changes in key assumptions, including the risk-free rate, equity investment volatility, widening of credit default spreads on credit assets and an increase in illiquidity premium, as applied to profit before tax are set out in note 31 on page 276.
MitigationEquity and credit spread risks are closely monitored and, where appropriate, asset liability matching is undertaken to mitigate risk. Unit matching is used to reduce the sensitivity of equity movements by matching unit-linked liabilities on a best-estimate view. Hedging strategies are also in place to reduce exposure from unit-linked funds and the with-profit funds.
Interest rate risk in the annuity book is mitigated by investing in assets whose cash flows closely match those on the projected future liabilities. It is not possible to eliminate risk completely as the timing of insured events is uncertain and bonds are not available at all of the required maturities. The cash flows are matched within regulatory tolerance.
Other market risks (e.g. interest rate exposure outside the annuity book and inflation) are also closely monitored and where considered appropriate, hedges are put in place to reduce exposure.
MonitoringMarket risks in the Insurance business are monitored by Insurance senior executive committees and ultimately the Insurance Board. Monitoring includes the progression of market risk capital against risk appetite limits, as well as the sensitivity of profit before tax to combined market risk stress scenarios and in year market movements. Asset and liability matching positions and hedges in place are actively monitored and if necessary rebalanced to be within agreed tolerances. In addition market risk is controlled via approved investment policies and mandates.
Trading portfoliosExposuresThe Group’s trading activity is small relative to its peers and does not engage in any proprietary trading activities. The Group’s trading activity is undertaken solely to meet the financial requirements of commercial and retail customers for foreign exchange, credit and interest rate products. These activities support customer flow and market making activities.
All trading activities are performed within the Commercial Banking division. While the trading positions taken are generally small, any extreme moves in the main risk factors and other related risk factors could cause significant losses in the trading book depending on the positions at the time. The average 95 per cent 1-day trading VaR (Value at Risk; diversified across risk factors) was £0.9 million for 31 December 2020 compared to £0.9 million for 31 December 2019.
Trading market risk measures are applied to all of the Group’s regulatory trading books and they include daily VaR (see Trading Portfolios: VaR table), sensitivity based measures, and stress testing calculations.
MeasurementThe Group internally uses VaR as the primary risk measure for all trading book positions.
The Trading Portfolios: VaR table shows some relevant statistics for the Group’s 1-day 95 per cent confidence level VaR that are based on 300 historical consecutive business days to year end 2020 and year end 2019.
The risk of loss measured by the VaR model is the minimum expected loss in earnings given the 95 per cent confidence. The total and average trading VaR numbers reported below have been obtained after the application of the diversification benefits across the five risk types, but does not reflect any diversification between Lloyds Bank Corporate Markets and any other entities. The maximum and minimum VaR reported for each risk category did not necessarily occur on the same day as the maximum and minimum VaR reported at Group level.
Trading portfolios: VaR (1-day 95 per cent confidence level) (audited)
At 31 December 2020 At 31 December 2019
Close Average Maximum Minimum Close Average Maximum Minimum£m £m £m £m £m £m £m £m
Interest rate risk 1.2 0.9 1.3 0.6 0.6 0.8 1.6 0.4
Foreign exchange risk 0.3 0.1 0.3 — 0.1 0.1 0.3 —
Equity risk — — — — — — — —
Credit spread risk 0.2 0.2 0.3 0.1 0.1 0.2 0.3 0.1
Inflation risk 0.1 0.2 0.4 0.1 0.4 0.2 0.6 0.1
All risk factors before diversification 1.8 1.4 1.8 1.0 1.2 1.3 2.2 0.9
Portfolio diversification (0.7) (0.5) (0.4) (0.4)
Total VaR 1.1 0.9 1.3 0.6 0.8 0.9 1.6 0.5

160 Lloyds Banking Group Annual Report and Accounts 2020
Risk management continued
Credit Risk
DefinitionCredit risk is defined as the risk that parties with whom the Group has contracted fail to meet their financial obligations (both on and off- balance sheet).
ExposuresThe principal sources of credit risk within the Group arise from loans and advances, contingent liabilities, commitments, debt securities and derivatives to customers, financial institutions and sovereigns. The credit risk exposures of the Group are set out in note 51 on page 314.
In terms of loans and advances, (for example mortgages, term loans and overdrafts) and contingent liabilities (for example credit instruments such as guarantees and documentary letters of credit), credit risk arises both from amounts advanced and commitments to extend credit to a customer or bank. With respect to commitments to extend credit, the Group is also potentially exposed to an additional loss up to an amount equal to the total unutilised commitments. However, the likely amount of loss may be less than the total unutilised commitments, as most retail and certain commercial lending commitments may be cancelled based on regular assessment of the prevailing creditworthiness of customers. Most commercial term commitments are also contingent upon customers maintaining specific credit standards.
Credit risk also arises from debt securities and derivatives. The total notional principal amount of interest rate, exchange rate, credit derivative and other contracts outstanding at 31 December 2020 is shown on page 175. The notional principal amount does not, however, represent the Group’s credit risk exposure, which is limited to the current cost of replacing contracts with a positive value to the Group. Such amounts are reflected in note 51 on page 314.
Additionally, credit risk arises from leasing arrangements where the Group is the lessor. Note 2(J) on page 227 provides details on the Group’s approach to the treatment of leases.
Credit risk exposures in the Insurance and Wealth division relate mostly to bond and loan assets which, together with some related swaps, are used to fund annuity commitments within Shareholder funds; plus balances held in liquidity funds to manage Insurance division’s liquidity requirements, and exposure to reinsurers.
The investments held in the Group’s defined benefit pension schemes also expose the Group to credit risk. Note 34 on page 277 provides further information on the defined benefit pension schemes’ assets and liabilities.
Loans and advances, contingent liabilities, commitments, debt securities and derivatives also expose the Group to refinance risk. Refinance risk is the possibility that an outstanding exposure cannot be repaid at its contractual maturity date. If the Group does not wish to refinance the exposure then there is refinance risk if the obligor is unable to repay by securing alternative finance. This may occur for a number of reasons which may include: the borrower is in financial difficulty, because the terms required to refinance are outside acceptable appetite at the time or the customer is unable to refinance externally due to a lack of market liquidity. Refinance risk exposures are managed in accordance with the Group’s existing credit risk policies, processes and controls, and are not considered to be material given the Group’s prudent and through the cycle credit risk appetite. Where heightened refinance risk exists exposures are minimised through intensive account management and, where appropriate, are classed as impaired and/or forborne.
MeasurementThe process for credit risk identification, measurement, and control is integrated into the Board-approved framework for credit risk appetite and governance.
Credit risk is measured from different perspectives using a range of appropriate modelling and scoring techniques at a number of levels of granularity, including total balance sheet, individual portfolio, pertinent concentrations and individual customer - for both new business and existing lending. Key metrics, such as total exposure, expected credit loss (ECL), risk-weighted assets, new business quality, concentration risk and portfolio performance, are reported monthly to Risk Committees and Forums.
Measures such as ECL, risk-weighted assets, observed credit performance, predicted credit quality (usually from predictive credit scoring models), collateral cover and quality, and other credit drivers (such as cash flow, affordability, leverage and indebtedness) have been incorporated into the Group's credit risk management practices to enable effective risk measurement across the Group.
In addition, stress testing and scenario analysis are used to estimate impairment losses and capital demand forecasts for both regulatory and internal purposes and to assist in the formulation of credit risk appetite.
As part of the ‘three lines of defence’ model, Risk division is the second line of defence providing oversight and independent challenge to key risk decisions taken by business management. Risk division also tests the effectiveness of credit risk management and internal credit risk controls. This includes ensuring that the control and monitoring of higher risk and vulnerable portfolios and sectors is appropriate and confirming that appropriate loss allowances for impairment are in place. Output from these reviews helps to inform credit risk appetite and credit policy.
As the third line of defence, Group Internal Audit undertakes regular risk-based reviews to assess the effectiveness of Credit risk management and controls.
MitigationThe Group uses a range of approaches to mitigate Credit risk.
Prudent, through the cycle credit principles, risk policies and appetite statements: the independent Risk division sets out the credit principles, credit risk policies and credit risk appetite statements. These are subject to regular review and governance, with any changes subject to an approval process. Risk teams monitor credit performance trends and the outlook. Risk teams also test the adequacy of and adherence to credit risk policies and processes throughout the Group. This includes tracking portfolio performance against an agreed set of credit risk appetite tolerances.
Robust models and controls: see model risk on page 203.
Limitations on concentration risk: there are portfolio controls on certain industries, sectors and products to reflect risk appetite as well as individual, customer and bank limit risk tolerances. Credit policies and appetite statements are aligned to the Group’s risk appetite and restrict exposure
The market risk for the trading book continues to be low with respect to the size of the Group and in comparison to peers. This reflects the fact that the Group’s trading operations are customer-centric and focused on hedging and recycling client risks.
Although it is an important market standard measure of risk, VaR has limitations. One of them is the use of a limited historical data sample which influences the output by the implicit assumption that future market behaviour will not differ greatly from the historically observed period. Another known limitation is the use of defined holding periods which assumes that the risk can be liquidated or hedged within that holding period. Also calculating the VaR at the chosen confidence interval does not give enough information about potential losses which may occur if this level is exceeded. The Group fully recognises these limitations and supplements the use of VaR with a variety of other measurements which reflect the nature of the business activity. These include detailed sensitivity analysis, position reporting and a stress testing programme.
Trading book VaR (1-day 99 per cent) is compared daily against both hypothetical and actual profit and loss. The 1-day 99 per cent VaR charts for Lloyds Bank Group and Lloyds Bank Corporate Markets can be found in the Group’s Pillar 3 Report.
MitigationThe level of exposure is controlled by establishing and communicating the approved risk limits and controls through policies and procedures that define the responsibility and authority for risk taking. Market risk limits are clearly and consistently communicated to the business. Any new or emerging risks are brought within risk reporting and defined limits.
MonitoringTrading risk appetite is monitored daily with 1-day 95 per cent VaR and stress testing limits. These limits are complemented with position level action triggers and profit and loss referrals. Risk and position limits are set and managed at both desk and overall trading book levels. They are reviewed at least annually and can be changed as required within the overall Group risk appetite framework.

Strategic rep
ortFinancial results
Governance
Risk managem
entO
ther information
Financial statements
Lloyds Banking Group Annual Report and Accounts 2020 161
to higher risk countries and potentially vulnerable sectors and asset classes. Note 51 on page 314 provides an analysis of loans and advances to customers by industry (for commercial customers) and product (for retail customers). Exposures are monitored to prevent both an excessive concentration of risk and single name concentrations. These concentration risk controls are not necessarily in the form of a maximum limit on exposure, but may instead require new business in concentrated sectors to fulfil additional minimum policy and/or guideline requirements. The Group’s largest credit limits are regularly monitored by the Board Risk Committee and reported in accordance with regulatory requirements.
Defined country risk management framework: the Board sets a broad maximum country risk appetite. Risk based appetite for all countries is set within the independent Risk division, taking into account economic, financial, political and social factors as well as the approved business and strategic plans of the Group.
Specialist expertise: credit quality is managed and controlled by a number of specialist units within the business and Risk division, which provide for example: intensive management and control; security perfection; maintenance of customer and facility records; expertise in documentation for lending and associated products; sector-specific expertise; and legal services applicable to the particular market segments and product ranges offered by the Group.
Stress testing: the Group’s credit portfolios are subject to regular stress testing. In addition to the Group led, PRA and other regulatory stress tests, exercises focused on individual divisions and portfolios are also performed. For further information on stress testing process, methodology and governance see page 152.
Frequent and robust Credit risk assurance: assurance of credit risk is undertaken by an independent function operating within the Risk division which are part of the Group’s second line of defence. Their primary objective is to provide reasonable and independent assurance and confidence that credit risk is being effectively managed and to ensure that appropriate controls are in place and being adhered to. Group Internal Audit also provides assurance to the Audit Committee on the effectiveness of credit risk management controls across the Group’s activities.
CollateralThe principal types of acceptable collateral include:
residential and commercial properties
charges over business assets such as premises, inventory and accounts receivable
financial instruments such as debt securities vehicles
cash
guarantees received from third-parties
The Group maintains appetite parameters on the acceptability of specific classes of collateral.
For non-mortgage retail lending to small businesses, collateral may include second charges over residential property and the assignment of life cover.
Collateral held as security for financial assets other than loans and advances is determined by the nature of the underlying exposure. Debt securities, including treasury and other bills, are generally unsecured, with the exception of asset-backed securities and similar instruments such as covered bonds, which are secured by portfolios of financial assets. Collateral is generally not held against loans and advances to financial institutions. However, securities are held as part of reverse repurchase or securities borrowing transactions or where a collateral agreement has been entered into under a master netting agreement. Derivative transactions with financial counterparties are typically collateralised under a Credit Support Annex (CSA) in conjunction with the International Swaps and Derivatives Association (ISDA) Master Agreement. Derivative transactions with non-financial customers are not usually supported by a CSA.
The requirement for collateral and the type to be taken at origination will be based upon the nature of the transaction and the credit quality, size and structure of the borrower. For non-retail exposures if required, the Group will often seek that any collateral include a first charge over land and buildings owned and occupied by the business, a debenture over the assets of a company or limited liability partnership, personal guarantees, limited in amount, from the directors of a company or limited liability partnership and key man insurance. The Group maintains policies setting out which types of collateral valuation are acceptable, maximum loan to value (LTV) ratios and other criteria that are to be considered when reviewing an application. The fundamental business proposition must evidence the ability of the business
to generate funds from normal business sources to repay a customer or counterparty’s financial commitment, rather than reliance on the disposal of any security provided.
The extent to which collateral values are actively managed will depend on the credit quality and other circumstances of the obligor and type of underlying transaction. Although lending decisions are primarily based on expected cash flows, any collateral provided may impact the pricing and other terms of a loan or facility granted. This will have a financial impact on the amount of net interest income recognised and on internal loss given default estimates that contribute to the determination of asset quality and returns.
The Group requires collateral to be realistically valued by an appropriately qualified source, independent of both the credit decision process and the customer, at the time of borrowing. In certain circumstances, for Retail residential mortgages this may include the use of automated valuation models based on market data, subject to accuracy criteria and LTV limits. Where third-parties are used for collateral valuations, they are subject to regular monitoring and review. Collateral values are subject to review, which will vary according to the type of lending, collateral involved and account performance. Such reviews are undertaken to confirm that the value recorded remains appropriate and whether revaluation is required, considering for example, account performance, market conditions and any information available that may indicate that the value of the collateral has materially declined. In such instances, the Group may seek additional collateral and/or other amendments to the terms of the facility. The Group adjusts estimated market values to take account of the costs of realisation and any discount associated with the realisation of the collateral when estimating credit losses.
The Group considers risk concentrations by collateral providers and collateral type with a view to ensuring that any potential undue concentrations of risk are identified and suitably managed by changes to strategy, policy and/or business plans.
The Group seeks to avoid correlation or wrong-way risk where possible. Under the Group’s repurchase (repo) policy, the issuer of the collateral and the repo counterparty should be neither the same nor connected. The same rule applies for derivatives. Risk division has the necessary discretion to extend this rule to other cases where there is significant correlation. Countries with a rating equivalent to AA- or better may be considered to have no adverse correlation between the counterparty domiciled in that country and the country of risk (issuer of securities).
Refer to note 51 on page 314 for further information on collateral.
Additional mitigation for Retail customersThe Group uses a variety of lending criteria when assessing applications for mortgages and unsecured lending. The general approval process uses credit acceptance scorecards and involves a review of an applicant’s previous credit history using internal data and information held by Credit Reference Agencies (CRA).
The Group also assesses the affordability and sustainability of lending for each borrower. For secured lending this includes use of an appropriate stressed interest rate scenario. Affordability assessments for all lending are compliant with relevant regulatory and conduct guidelines. The Group takes reasonable steps to validate information used in the assessment of a customer’s income and expenditure.
In addition, the Group has in place quantitative limits such as maximum limits for individual customer products, the level of borrowing to income and the ratio of borrowing to collateral. Some of these limits relate to internal approval levels and others are policy limits above which the Group will typically reject borrowing applications. The Group also applies certain criteria that are applicable to specific products for example applications for buy-to-let mortgages.
For UK mortgages, the Group’s policy permits owner occupier applications with a maximum loan to value (LTV) of 95 per cent. This can increase to 100 per cent for specific products where additional security is provided by a supporter of the applicant and held on deposit by the Group. Applications with an LTV above 90 per cent are subject to enhanced underwriting criteria, including higher scorecard cut-offs and loan size restrictions.
Buy-to-let mortgages within Retail are limited to a maximum loan size of £1,000,000 and 75 per cent LTV. Buy-to-let applications must pass a minimum rental cover ratio of 125 per cent under stressed interest rates, after applicable tax liabilities. Portfolio landlords (customers with four or more

162 Lloyds Banking Group Annual Report and Accounts 2020
Risk management continued
mortgaged buy-to-let properties) are subject to additional controls including evaluation of overall portfolio resilience.
The Group’s policy is to reject any application for a lending product where a customer is registered as bankrupt or insolvent, or has a recent County Court Judgment or financial default registered at a CRA used by the Group above de minimis thresholds. In addition, the Group typically rejects applicants where total unsecured debt, debt-to-income ratios, or other indicators of financial difficulty exceed policy limits.
Where credit acceptance scorecards are used, new models, model changes and monitoring of model effectiveness are independently reviewed and approved in accordance with the governance framework set by the Group Model Governance Committee.
Additional mitigation for Commercial customersIndividual credit assessment and independent sanction of customer and bank limits: with the exception of small exposures to SME customers where certain relationship managers have limited delegated sanctioning authority, credit risk in commercial customer portfolios is subject to sanction by the independent Risk division, which considers the strengths and weaknesses of individual transactions, the balance of risk and reward, and how credit risk aligns to the Group and Divisional risk appetite. Exposure to individual counterparties, groups of counterparties or customer risk segments is controlled through a tiered hierarchy of delegated sanctioning authorities and risk based recommended maximum limit parameters. Approval requirements for each decision are based on a number of factors including, but not limited to, the transaction amount, the customer’s aggregate facilities, any risk mitigation in place, credit policy, risk appetite, credit risk ratings and the nature and term of the risk. The Group’s credit risk appetite criteria for counterparty and customer loan Underwriting is generally the same as that for loans intended to be held to maturity. All hard loan/bond Underwriting must be sanctioned by Risk division. A pre-approved credit matrix may be used for ‘best efforts’ underwriting.
Counterparty credit limits: limits are set against all types of exposure in a counterparty name, in accordance with an agreed methodology for each exposure type. This includes credit risk exposure on individual derivatives and securities financing transactions, which incorporates potential future exposures from market movements against agreed confidence intervals. Aggregate facility levels by counterparty are set and limit breaches are subject to escalation procedures.
Daily settlement limits: settlement risk arises in any situation where a payment in cash, securities or equities is made in the expectation of a corresponding receipt in cash, securities or equities. Daily settlement limits are established for each relevant counterparty to cover the aggregate of all settlement risk arising from the Group’s market transactions on any single day. Where possible, the Group uses Continuous Linked Settlement in order to reduce foreign exchange (FX) settlement risk.
Master netting agreementsIt is credit policy that a Group approved master netting agreement must be used for all derivative and traded product transactions and must be in place prior to trading, with separate documentation required for each Group entity providing facilities. This requirement extends to trades with clients and the counterparties used for the Bank’s own hedging activities, which may also include clearing trades with Central Counterparties (CCPs).
Any exceptions must be approved by the appropriate credit sanctioner. Master netting agreements do not generally result in an offset of balance sheet assets and liabilities for accounting purposes, as transactions are usually settled on a gross basis. However, within relevant jurisdictions and for appropriate counterparty types, master nettings agreements do reduce the credit risk to the extent that, if an event of default occurs, all trades with the counterparty may be terminated and settled on a net basis. The Group’s overall exposure to credit risk on derivative instruments subject to master netting agreements can change substantially within a short period, since this is the net position of all trades under the master netting agreement.
Other credit risk transfersThe Group also undertakes asset sales, credit derivative based transactions, securitisations (including Significant Risk Transfer transactions), purchases of credit default swaps and purchase of credit insurance as a means of mitigating or reducing credit risk and/or risk concentration, taking into account the nature of assets and the prevailing market conditions.
MonitoringIn conjunction with Risk division, businesses identify and define portfolios of credit and related risk exposures and the key behaviours and characteristics by which those portfolios are managed and monitored. This entails the production and analysis of regular portfolio monitoring reports for review by senior management. Risk division in turn produces an aggregated view of credit risk across the Group, including reports on material credit exposures, concentrations, concerns and other management information, which is presented to the divisional risk committees and forums, Group Risk Committee and the Board Risk Committee.
ModelsThe performance of all models used in credit risk is monitored in line with the Group’s model governance framework - see model risk on page 203.
Intensive care of customers in financial difficultyThe Group operates a number of solutions to assist borrowers who are experiencing financial stress. The material elements of these solutions through which the Group has granted a concession, whether temporarily or permanently, are set out below.
ForbearanceThe Group’s aim in offering forbearance and other assistance to customers in financial distress is to benefit both the customer and the Group by supporting its customers and acting in their best interests by, where possible, bringing customer facilities back into a sustainable position.
The Group offers a range of tools and assistance to support customers who are encountering financial difficulties. Cases are managed on an individual basis, with the circumstances of each customer considered separately and the action taken judged as being appropriate and sustainable for both the customer and the Group.
Forbearance measures consist of concessions towards a debtor that is experiencing or about to experience difficulties in meeting its financial commitments. This can include modification of the previous terms and conditions of a contract or a total or partial refinancing of a troubled debt contract, either of which would not have been required had the debtor not been experiencing financial difficulties.
The provision and review of such assistance is controlled through the application of an appropriate policy framework and associated controls. Regular review of the assistance offered to customers is undertaken to confirm that it remains appropriate, alongside monitoring of customers’ performance and the level of payments received.
The Group classifies accounts as forborne at the time a customer in financial difficulty is granted a concession. However, where customers have been temporarily impacted by COVID-19, the Group has looked to follow regulator principles and guidance on the granting of concessions resulting from the impact of the pandemic.
Balances in default or classified as Stage 3 are always considered to be non-performing. Balances are non-performing, but not in default or Stage 3, if they are greater than 90 days past due (compared with 180 days past due for Stage 3 mortgages) or if they are within their 12 month non-performing forbearance cure period.
Non-performing exposures can be reclassified as Performing Forborne after a minimum 12 month cure period, providing there are no past due amounts or concerns regarding the full repayment of the exposure. A minimum of a further 24 months must pass from the date the forborne exposure was reclassified as Performing Forborne before the account can exit forbearance. If conditions to exit forbearance are not met at the end of this probation period, the exposure shall continue to be identified as forborne until all the conditions are met.
The Group’s treatment of loan renegotiations is included in the impairment policy in note 2(H) on page 226.
Customers receiving support from UK Government sponsored programmesTo assist customers in financial distress, the Group participates in UK Government sponsored programmes for households, including the Income Support for Mortgage Interest programme, under which the Government pays the Group all or part of the interest on the mortgage on behalf of the customer. This is provided as a government loan which the customer must repay.

Strategic rep
ortFinancial results
Governance
Risk managem
entO
ther information
Financial statements
Lloyds Banking Group Annual Report and Accounts 2020 163
Support for customers during the COVID-19 pandemicWorking closely with the UK Government and regulators, the Group has continued to support its retail, small business and commercial customers through a comprehensive and unprecedented range of flexible measures to help alleviate temporary financial pressure on customers during the crisis.
For retail customers, the Group has provided payment holidays of up to three months across a range of products including mortgages, personal loans, credit cards and motor finance, with extensions available of up to six months in total, should customers request them.
The Group has also supported its retail customers with access to a £500 interest free overdraft facility and access to fixed term savings accounts without charge.
Similarly, the Group is providing significant support for its small business and commercial customers and has provided loans to businesses under the different government schemes, including Bounce Back Loan Scheme (BBLS), Coronavirus Business Interruption Loan Scheme (CBILS) and Coronavirus Large Business Interruption Loan Scheme (CLBILS). The Group has also supported its customers through repayment holidays and its own COVID-19 fund which includes fee-free lending for new overdrafts or overdraft limit increases as well as new or increased invoice discounting and finance facilities. The Group is also offering SME customers a mentoring service to help navigate a path beyond the pandemic.
The Group credit risk portfolio in 2020
Overview The Group has continued to actively support its customers during the crisis through a range of flexible options and payment holidays across major products, as well as lending through the various UK Government support schemes
With c.85 per cent of the Group's lending secured, with robust LTVs, and a prudent approach to credit risk appetite and risk management, the credit portfolios were well positioned entering the crisis. Considering the external environment, flows of accounts into arrears and defaults remain low
However, the Group recognises and has provisioned on the basis that payment holidays granted and other Government support measures mean that the true underlying risk is not reflected and there is an expectation of increased arrears and defaults as these various arrangements, designed to alleviate short term financial pressure, come to an end
The impairment charge for the year has increased significantly to £4,247 million (2019: £1,291 million). This is due to higher expected credit loss allowances taken predominantly in the first half of the year. These reflected the deterioration in economic outlook as a consequence of the coronavirus pandemic, as well as the charges taken on restructuring cases in the Commercial Business Support Unit (BSU)
As a result, expected credit losses on loans and advances to customers increased to £6,832 million at 31 December 2020 (31 December 2019: £4,142 million). Notwithstanding the likelihood of rising defaults, the impairment impacts are expected largely to be covered by the forward-looking provisions built up in 2020, subject to there being no material changes to the Group's overall expectations of the severity of the pandemic impact on the economy
Stage 2 loans and advances to customers as a percentage of total lending have increased by 4.3 percentage points to 12.0 per cent at 31 December 2020 (31 December 2019: 7.7 per cent), reflecting the deterioration of the Group’s forward-looking economic assumptions. Of these, 88.9 per cent are up to date (31 December 2019: 78.9 per cent). Stage 2 coverage increased to 4.5 per cent (31 December 2019: 3.7 per cent)
Stage 3 loans and advances increased by £335 million to £9,089 million (31 December 2019: £8,754 million), although as a percentage of total lending remained stable at 1.8 per cent. Stage 3 coverage increased by 5.6 percentage points to 28.1 per cent (31 December 2019: 22.5 per cent) largely driven by additional provisions predominantly raised against pre-existing restructuring cases in Commercial Banking’s BSU and to a lesser extent in Retail, due to the change in the Group’s economic forecast of collateral values for UK Mortgages and UK Motor Finance
Low risk culture and prudent risk appetite The Group continues to take a prudent approach to credit risk and a through the cycle credit risk appetite, whilst working closely with customers to support them over this challenging period
Although not immune, the Group's credit portfolios are well positioned against an uncertain economic outlook and potential market volatility
The Group’s effective risk management seeks to ensure early identification and management of customers and counterparties who may be showing signs of distress
Sector and asset class concentrations within the portfolios are closely monitored and controlled, with mitigating actions taken where appropriate. Sector and product caps limit exposure to certain higher risk and vulnerable sectors and asset classes

164 Lloyds Banking Group Annual Report and Accounts 2020
Risk management continued
Group impairment charge (underlying basis)
Loans and advances to
customers
Loans and advances to
banksDebt
securities
Financial assets at fair value
through other comprehensive
income OtherUndrawn balances 2020 2019
£m £m £m £m £m £m £m £m
Retail
UK Mortgages 475 — — — — 3 478 (167)
Credit cards 721 — — — — 79 800 503
Loans and overdrafts 702 — — — — 37 739 445
UK Motor Finance 224 — — — — 2 226 203
Other 117 — — — — 24 141 54
2,239 — — — — 145 2,384 1,038
Retail asset quality ratio 0.69% 0.30%
Commercial Banking
SME 244 — — — — 20 264 (65)
Other 1,067 5 1 4 — 123 1,200 371
1,311 5 1 4 — 143 1,464 306
Commercial Banking asset quality ratio 1.53% 0.30%
Insurance and Wealth 6 — — — 2 1 9 —
Central Items 389 — — 1 — — 390 (53)
Total impairment charge 3,945 5 1 5 2 289 4,247 1,291
Asset quality ratio 0.96% 0.29%
Gross asset quality ratio 0.99% 0.37%
Group loans and advances to customersThe following pages contain analysis of the Group’s loans and advances to customers by sub-portfolio. Loans and advances to customers are categorised into the following stages:
Stage 1 assets comprise of newly originated assets (unless purchased or originated credit impaired), as well as those which have not experienced a significant increase in credit risk. These assets carry an expected credit loss allowance equivalent to the expected credit losses that result from those default events that are possible within 12 months of the reporting date (12 month expected credit losses).
Stage 2 assets are those which have experienced a significant increase in credit risk since origination. These assets carry an expected credit loss allowance equivalent to the expected credit losses arising over the lifetime of the asset (lifetime expected credit losses).
Stage 3 assets have either defaulted or are otherwise considered to be credit impaired. These assets carry a lifetime expected credit loss.
Purchased or originated credit-impaired assets (POCI) are those that have been originated or acquired in a credit impaired state. This includes within the definition of credit impaired the purchase of a financial asset at a deep discount that reflects impaired credit losses.
Credit risk basis of presentationThe analyses which follow have been presented on two bases; the statutory basis which is consistent with the presentation in the Group’s accounts and the underlying basis which is used for internal management purposes. Reconciliations between the two bases have been provided.
In the following statutory basis tables, purchased or originated credit- impaired (POCI) assets include a fixed pool of mortgages that were purchased as part of the HBOS acquisition at a deep discount to face value reflecting credit losses incurred from the point of origination to the date of acquisition. The residual ECL allowance and resulting low coverage ratio on POCI assets reflects further deterioration in the creditworthiness from the date of acquisition. Over time, these POCI assets will run off as the loans redeem, pay down or losses crystallise.
The Group uses the underlying basis to monitor the creditworthiness of the lending portfolio and related ECL allowances because it provides a better indication of the credit performance of the POCI assets purchased as part of the HBOS acquisition. The underlying basis assumes that the lending assets acquired as part of a business combination were originated by the Group and are classified as either Stage 1, 2 or 3 according to the change in credit risk over the period since origination. Underlying ECL allowances have been calculated accordingly.

Strategic rep
ortFinancial results
Governance
Risk managem
entO
ther information
Financial statements
Lloyds Banking Group Annual Report and Accounts 2020 165
Group’s total expected credit loss allowance
Statutory basis Underlying basis
At 31 Dec 2020
At 31 Dec 2019
At 31 Dec 2020
At 31 Dec 2019
£m £m £m £m
Customer related balances
Drawn 5,760 3,259 6,373 3,965
Undrawn 459 177 459 177
6,219 3,436 6,832 4,142
Other assets 28 19 28 19
Total expected credit loss allowance 6,247 3,455 6,860 4,161
Reconciliation between statutory and underlying basis of Group gross loans and advances to customers and expected credit loss allowances on drawn balances
Gross loans and advances to customers Expected credit loss allowances on drawn balances
Stage 1 Stage 2 Stage 3 POCI Total Stage 1 Stage 2 Stage 3 POCI Total£m £m £m £m £m £m £m £m £m £m
At 31 December 2020
Underlying basis 435,526 60,514 9,089 — 505,129 1,385 2,493 2,495 — 6,373
POCI assets (1,625) (8,864) (2,600) 13,089 — (3) (330) (506) 839 —
Acquisition fair value adjustment 42 9 1 (578) (526) (10) (18) (7) (578) (613)
(1,583) (8,855) (2,599) 12,511 (526) (13) (348) (513) 261 (613)
Statutory basis 433,943 51,659 6,490 12,511 504,603 1,372 2,145 1,982 261 5,760
At 31 December 2019
Underlying basis 451,611 38,440 8,754 — 498,805 702 1,346 1,917 — 3,965
POCI assets (1,718) (9,903) (2,740) 14,361 — — (334) (455) 789 —
Acquisition fair value adjustment 82 6 1 (647) (558) (27) (17) (15) (647) (706)
(1,636) (9,897) (2,739) 13,714 (558) (27) (351) (470) 142 (706)
Statutory basis 449,975 28,543 6,015 13,714 498,247 675 995 1,447 142 3,259

166 Lloyds Banking Group Annual Report and Accounts 2020
Risk management continued
Movements in Group total expected credit loss allowance (statutory basis)
ECL at 31 Dec
2020Net ECL increase
Write-offs and other
Income statement
charge
ECL at 31 Dec
2019£m £m £m £m £m
Retail
UK Mortgages 1,027 458 (20) 478 569
Credit cards 923 377 (423) 800 546
Loans and overdrafts 715 254 (485) 739 461
UK Motor Finance 501 114 (112) 226 387
Other 229 102 (39) 141 127
3,395 1,305 (1,079) 2,384 2,090
Commercial Banking 2,402 1,087 (282) 1,369 1,315
Other 450 400 (2) 402 50
Total1 6,247 2,792 (1,363) 4,155 3,455
1 Total ECL includes £28 million relating to other non customer-related assets (31 December 2019: £19 million).
Movements in Group total expected credit loss allowance (underlying basis)
ECL at 31 Dec
2020Net ECL increase
Write-offs and other
Income statement
charge
ECL at 31 Dec
2019£m £m £m £m £m
Retail
UK Mortgages 1,605 389 (89) 478 1,216
Credit cards 958 352 (448) 800 606
Loans and overdrafts 715 254 (485) 739 461
UK Motor Finance 501 114 (112) 226 387
Other 229 103 (38) 141 126
4,008 1,212 (1,172) 2,384 2,796
Commercial Banking 2,402 1,087 (377) 1,464 1,315
Other 450 400 1 399 50
Total1 6,860 2,699 (1,548) 4,247 4,161
1 Total ECL includes £28 million relating to other non customer-related assets (31 December 2019: £19 million).

Strategic rep
ortFinancial results
Governance
Risk managem
entO
ther information
Financial statements
Lloyds Banking Group Annual Report and Accounts 2020 167
Group loans and advances to customers and expected credit loss allowances (statutory basis)
Stage 1 Stage 2 Stage 3 POCI Total
Stage 2 as % of
total
Stage 3 as % of
total£m £m £m £m £m % %
At 31 December 2020
Loans and advances to customers
Retail
UK Mortgages 251,418 29,018 1,859 12,511 294,806 9.8 0.6
Credit cards 11,496 3,273 340 — 15,109 21.7 2.3
Loans and overdrafts 7,710 1,519 307 — 9,536 15.9 3.2
UK Motor Finance 12,786 2,216 199 — 15,201 14.6 1.3
Other 17,879 1,304 184 — 19,367 6.7 1.0
301,289 37,330 2,889 12,511 354,019 10.5 0.8
Commercial Banking
SME 27,015 4,500 791 — 32,306 13.9 2.4
Other 43,543 9,816 2,733 — 56,092 17.5 4.9
70,558 14,316 3,524 — 88,398 16.2 4.0
Insurance and Wealth 832 13 70 — 915 1.4 7.7
Central items1 61,264 — 7 — 61,271 — —
Total gross lending 433,943 51,659 6,490 12,511 504,603 10.2 1.3
ECL allowance on drawn balances (1,372) (2,145) (1,982) (261) (5,760)
Net balance sheet carrying value 432,571 49,514 4,508 12,250 498,843
Group ECL allowance (drawn and undrawn)
Retail
UK Mortgages 107 468 191 261 1,027 45.6 18.6
Credit cards 240 530 153 — 923 57.4 16.6
Loans and overdrafts 224 344 147 — 715 48.1 20.6
UK Motor Finance2 197 171 133 — 501 34.1 26.5
Other 46 124 59 — 229 54.1 25.8
814 1,637 683 261 3,395 48.2 20.1
Commercial Banking
SME 142 234 126 — 502 46.6 25.1
Other 217 507 1,169 — 1,893 26.8 61.8
359 741 1,295 — 2,395 30.9 54.1
Insurance and Wealth 11 1 11 — 23 4.3 47.8
Central items 400 — 6 — 406 — 1.5
Total ECL allowance (drawn and undrawn) 1,584 2,379 1,995 261 6,219 38.3 32.1
Group ECL allowances (drawn and undrawn) as a % of loans and advances to customers3
Retail
UK Mortgages — 1.6 10.3 2.1 0.3
Credit cards 2.1 16.2 56.0 — 6.1
Loans and overdrafts 2.9 22.6 64.2 — 7.6
UK Motor Finance 1.5 7.7 66.8 — 3.3
Other 0.3 9.5 39.3 — 1.2
0.3 4.4 25.2 2.1 1.0
Commercial Banking
SME 0.5 5.2 15.9 — 1.6
Other 0.5 5.2 42.8 — 3.4
0.5 5.2 36.7 — 2.7
Insurance and Wealth 1.3 7.7 15.7 — 2.5
Central items 0.7 — 85.7 — 0.7
Total 0.4 4.6 31.6 2.1 1.2
1 Includes reverse repos of £58.6 billion.2 UK Motor Finance for Stages 1 and 2 include £192 million relating to provisions against residual values of vehicles subject to finance leasing agreements. These provisions are included within the
calculation of coverage ratios.3 Total and Stage 3 ECL allowances as a percentage of drawn balances are calculated excluding loans in recoveries in Credit cards of £67 million, £78 million in Loans and overdrafts and £34 million in
Business Banking within Retail other.

168 Lloyds Banking Group Annual Report and Accounts 2020
Risk management continued
Stage 1 Stage 2 Stage 3 POCI Total
Stage 2 as % of
total
Stage 3 as % of
total£m £m £m £m £m % %
At 31 December 20191
Loans and advances to customers
Retail
UK Mortgages 257,043 16,935 1,506 13,714 289,198 5.9 0.5
Credit cards 16,132 1,681 385 — 18,198 9.2 2.1
Loans and overdrafts 8,788 1,131 293 — 10,212 11.1 2.9
UK Motor Finance 13,884 1,942 150 — 15,976 12.2 0.9
Other 9,904 845 150 — 10,899 7.8 1.4
305,751 22,534 2,484 13,714 344,483 6.5 0.7
Commercial Banking
SME 27,206 2,507 720 — 30,433 8.2 2.4
Other 59,868 3,470 2,727 — 66,065 5.3 4.1
87,074 5,977 3,447 — 96,498 6.2 3.6
Insurance and Wealth 753 32 77 — 862 3.7 8.9
Central items2 56,397 — 7 — 56,404 — —
Total gross lending 449,975 28,543 6,015 13,714 498,247 5.7 1.2
ECL allowance on drawn balances (675) (995) (1,447) (142) (3,259)
Net balance sheet carrying value 449,300 27,548 4,568 13,572 494,988
Group ECL allowance (drawn and undrawn)
Retail
UK Mortgages 24 281 122 142 569 49.4 21.4
Credit cards 203 218 125 — 546 39.9 22.9
Loans and overdrafts 160 193 108 — 461 41.9 23.4
UK Motor Finance3 216 87 84 — 387 22.5 21.7
Other 36 40 51 — 127 31.5 40.2
639 819 490 142 2,090 39.2 23.4
Commercial Banking
SME 45 127 101 — 273 46.5 37.0
Other 70 125 845 — 1,040 12.0 81.3
115 252 946 — 1,313 19.2 72.0
Insurance and Wealth 6 1 10 — 17 5.9 58.8
Central items 10 — 6 — 16 — 37.5
Total ECL allowance (drawn and undrawn) 770 1,072 1,452 142 3,436 31.2 42.3
Group ECL allowances (drawn and undrawn) as a % of loans and advances to customers4
Retail
UK Mortgages — 1.7 8.1 1.0 0.2
Credit cards 1.3 13.0 41.0 — 3.0
Loans and overdrafts 1.8 17.1 57.1 — 4.6
UK Motor Finance 1.6 4.5 56.0 — 2.4
Other 0.4 4.7 39.5 — 1.2
0.2 3.6 21.5 1.0 0.6
Commercial Banking
SME 0.2 5.1 14.0 — 0.9
Other 0.1 3.6 31.0 — 1.6
0.1 4.2 27.4 — 1.4
Insurance and Wealth 0.8 3.1 13.0 — 2.0
Central items — — 85.7 — —
Total 0.2 3.8 25.0 1.0 0.7
1 Prior period segmental comparatives restated. See note 4 on page 240. 2 Includes reverse repos of £54.6 billion.3 UK Motor Finance for Stages 1 and 2 include £201 million relating to provisions against residual values of vehicles subject to finance leasing agreements. These provisions are included within the
calculation of coverage ratios.4 Total and Stage 3 ECL allowances as a percentage of drawn balances are calculated excluding loans in recoveries in Credit cards of £80 million, £104 million in Loans and overdrafts and £21 million in
Business Banking within Retail other.

Strategic rep
ortFinancial results
Governance
Risk managem
entO
ther information
Financial statements
Lloyds Banking Group Annual Report and Accounts 2020 169
Group loans and advances to customers and expected credit loss allowances (underlying basis)
Stage 1 Stage 2 Stage 3 Total
Stage 2 as % of
total
Stage 3 as % of
total£m £m £m £m % %
At 31 December 2020
Retail1
UK Mortgages 253,043 37,882 4,459 295,384 12.8 1.5
Credit cards 11,454 3,264 339 15,057 21.7 2.3
Loans and overdrafts 7,710 1,519 307 9,536 15.9 3.2
UK Motor Finance 12,786 2,216 199 15,201 14.6 1.3
Other 17,879 1,304 184 19,367 6.7 1.0
302,872 46,185 5,488 354,545 13.0 1.5
Commercial Banking
SME 27,015 4,500 791 32,306 13.9 2.4
Other 43,543 9,816 2,733 56,092 17.5 4.9
70,558 14,316 3,524 88,398 16.2 4.0
Insurance and Wealth 832 13 70 915 1.4 7.7
Central items2 61,264 — 7 61,271 — —
Total gross lending 435,526 60,514 9,089 505,129 12.0 1.8
ECL allowance on drawn balances (1,385) (2,493) (2,495) (6,373)
Net balance sheet carrying value 434,141 58,021 6,594 498,756
Group ECL allowance (drawn and undrawn)
Retail1
UK Mortgages 110 798 697 1,605 49.7 43.4
Credit cards 250 548 160 958 57.2 16.7
Loans and overdrafts 224 344 147 715 48.1 20.6
UK Motor Finance3 197 171 133 501 34.1 26.5
Other 46 124 59 229 54.1 25.8
827 1,985 1,196 4,008 49.5 29.8
Commercial Banking
SME 142 234 126 502 46.6 25.1
Other 217 507 1,169 1,893 26.8 61.8
359 741 1,295 2,395 30.9 54.1
Insurance and Wealth 11 1 11 23 4.3 47.8
Central items 400 — 6 406 — 1.5
Total ECL allowance (drawn and undrawn) 1,597 2,727 2,508 6,832 39.9 36.7
Group ECL allowances (drawn and undrawn) as a percentage of loans and advances to customers4
Retail1
UK Mortgages — 2.1 15.6 0.5
Credit cards 2.2 16.8 58.8 6.4
Loans and overdrafts 2.9 22.6 64.2 7.6
UK Motor Finance 1.5 7.7 66.8 3.3
Other 0.3 9.5 39.3 1.2
0.3 4.3 22.5 1.1
Commercial Banking
SME 0.5 5.2 15.9 1.6
Other 0.5 5.2 42.8 3.4
0.5 5.2 36.7 2.7
Insurance and Wealth 1.3 7.7 15.7 2.5
Central items 0.7 — 85.7 0.7
Total ECL allowances (drawn and undrawn) as a percentage of loans and advances to customers 0.4 4.5 28.1 1.4
1 Retail balances exclude the impact of the HBOS and MBNA acquisition related adjustments.2 Includes reverse repos of £58.6 billion.3 UK Motor Finance for Stages 1 and 2 include £192 million relating to provisions against residual values of vehicles subject to finance leasing agreements. These provisions are included within the calculation of
coverage ratios.4 Total and Stage 3 ECL allowances as a percentage of drawn balances are calculated excluding loans in recoveries in Credit cards of £67 million, £78 million in Loans and overdrafts and £34 million in Business
Banking within Retail other.

170 Lloyds Banking Group Annual Report and Accounts 2020
Risk management continued
Stage 1 Stage 2 Stage 3 Total
Stage 2 as % of
total
Stage 3 as % of
total£m £m £m £m % %
At 31 December 20191
Retail2
UK Mortgages 258,760 26,838 4,247 289,845 9.3 1.5
Credit cards 16,052 1,675 383 18,110 9.2 2.1
Loans and overdrafts 8,788 1,131 293 10,212 11.1 2.9
UK Motor Finance 13,884 1,942 150 15,976 12.2 0.9
Other 9,903 845 150 10,898 7.8 1.4
307,387 32,431 5,223 345,041 9.4 1.5
Commercial Banking
SME 27,206 2,507 720 30,433 8.2 2.4
Other 59,868 3,470 2,727 66,065 5.3 4.1
87,074 5,977 3,447 96,498 6.2 3.6
Insurance and Wealth 753 32 77 862 3.7 8.9
Central items3 56,397 — 7 56,404 — —
Total gross lending 451,611 38,440 8,754 498,805 7.7 1.8
ECL allowance on drawn balances (702) (1,346) (1,917) (3,965)
Net balance sheet carrying value 450,909 37,094 6,837 494,840
Group ECL allowance (drawn and undrawn)
Retail2
UK Mortgages 26 614 576 1,216 50.5 47.4
Credit cards 230 236 140 606 38.9 23.1
Loans and overdrafts 160 193 108 461 41.9 23.4
UK Motor Finance4 216 87 84 387 22.5 21.7
Other 34 40 52 126 31.7 41.3
666 1,170 960 2,796 41.8 34.3
Commercial Banking
SME 45 127 101 273 46.5 37.0
Other 70 125 845 1,040 12.0 81.3
115 252 946 1,313 19.2 72.0
Insurance and Wealth 6 1 10 17 5.9 58.8
Central items 10 — 6 16 — 37.5
Total ECL allowance (drawn and undrawn) 797 1,423 1,922 4,142 34.4 46.4
Group expected credit loss allowances (drawn and undrawn) as a percentage of loans and advances to customers5
Retail2
UK Mortgages — 2.3 13.6 0.4
Credit cards 1.4 14.1 46.2 3.4
Loans and overdrafts 1.8 17.1 57.1 4.6
UK Motor Finance 1.6 4.5 56.0 2.4
Other 0.3 4.7 40.3 1.2
0.2 3.6 19.1 0.8
Commercial Banking
SME 0.2 5.1 14.0 0.9
Other 0.1 3.6 31.0 1.6
0.1 4.2 27.4 1.4
Insurance and Wealth 0.8 3.1 13.0 2.0
Central items — — 85.7 —
Total ECL allowances (drawn and undrawn) as a percentage of loans and advances to customers 0.2 3.7 22.5 0.8
1 Prior period segmental comparatives restated. See note 4 on page 240. 2 Retail balances exclude the impact of the HBOS and MBNA acquisition related adjustments.3 Includes reverse repos of £54.6 billion.4 UK Motor Finance for Stages 1 and 2 include £201 million relating to provisions against residual values of vehicles subject to finance leasing agreements. These provisions are included within the
calculation of coverage ratios.5 Total and Stage 3 ECL allowances as a percentage of drawn balances are calculated excluding loans in recoveries in Credit cards of £80 million and £104 million in Loans and overdrafts and £21 million
in Business Banking within Retail other.

Strategic rep
ortFinancial results
Governance
Risk managem
entO
ther information
Financial statements
Lloyds Banking Group Annual Report and Accounts 2020 171
Group Stage 2 loans and advances to customers (statutory basis)
Up to date 1-30 days past due2 Over 30 days past due Total
PD movements Other1
Gross lending ECL3
As % of gross
lendingGross
lending ECL3
As % of gross
lendingGross
lending ECL3
As % of gross
lendingGross
lending ECL3
As % of gross
lendingGross
lending ECL3
As % of gross
lending£m £m % £m £m % £m £m % £m £m % £m £m %
At 31 December 2020
Retail
UK Mortgages 22,569 215 1.0 3,078 131 4.3 1,648 43 2.6 1,723 79 4.6 29,018 468 1.6
Credit cards 2,924 408 14.0 220 76 34.5 93 27 29.0 36 19 52.8 3,273 530 16.2
Loans and overdrafts 959 209 21.8 388 68 17.5 126 45 35.7 46 22 47.8 1,519 344 22.6
UK Motor Finance 724 62 8.6 1,321 55 4.2 132 37 28.0 39 17 43.6 2,216 171 7.7
Other 512 56 10.9 651 44 6.8 69 14 20.3 72 10 13.9 1,304 124 9.5
27,688 950 3.4 5,658 374 6.6 2,068 166 8.0 1,916 147 7.7 37,330 1,637 4.4
Commercial Banking
SME 4,229 219 5.2 150 6 4.0 40 5 12.5 81 4 4.9 4,500 234 5.2
Other 9,505 501 5.3 97 3 3.1 37 2 5.4 177 1 0.6 9,816 507 5.2
13,734 720 5.2 247 9 3.6 77 7 9.1 258 5 1.9 14,316 741 5.2
Insurance and Wealth 1 — — 12 1 8.3 — — — — — — 13 1 7.7
Central items — — — — — — — — — — — — — — —
Total 41,423 1,670 4.0 5,917 384 6.5 2,145 173 8.1 2,174 152 7.0 51,659 2,379 4.6
At 31 December 2019
Retail
UK Mortgages 10,846 83 0.8 2,593 107 4.1 1,876 33 1.8 1,620 58 3.6 16,935 281 1.7
Credit cards 1,093 129 11.8 423 47 11.1 124 26 21.0 41 16 39.0 1,681 218 13.0
Loans and overdrafts 569 88 15.5 348 42 12.1 158 41 25.9 56 22 39.3 1,131 193 17.1
UK Motor Finance 543 27 5.0 1,232 30 2.4 135 21 15.6 32 9 28.1 1,942 87 4.5
Other 324 14 4.3 363 12 3.3 80 9 11.3 78 5 6.4 845 40 4.7
13,375 341 2.5 4,959 238 4.8 2,373 130 5.5 1,827 110 6.0 22,534 819 3.6
Commercial Banking
SME 2,014 104 5.2 410 17 4.1 56 6 10.7 27 — — 2,507 127 5.1
Other 1,881 75 4.0 1,290 47 3.6 61 2 3.3 238 1 0.4 3,470 125 3.6
3,895 179 4.6 1,700 64 3.8 117 8 6.8 265 1 0.4 5,977 252 4.2
Insurance and Wealth — — — 28 1 3.6 1 — — 3 — — 32 1 3.1
Central items — — — — — — — — — — — — — — —
Total 17,270 520 3.0 6,687 303 4.5 2,491 138 5.5 2,095 111 5.3 28,543 1,072 3.8
1 Includes forbearance, client and product-specific indicators not reflected within quantitative PD assessments.2 Includes assets that have triggered PD movements, or other rules, given that being 1-29 days in arrears in of itself is not a stage 2 trigger.3 Expected credit loss allowances on loans and advances to customers (drawn and undrawn).

172 Lloyds Banking Group Annual Report and Accounts 2020
Risk management continued
Group Stage 2 loans and advances to customers (underlying basis)
Up to date 1-30 days past due2 Over 30 days past due Total
PD movements Other1
Gross lending ECL3
As % of gross
lendingGross
lending ECL3
As % of gross
lendingGross
lending ECL3
As % of gross
lendingGross
lending ECL3
As % of gross
lendingGross
lending ECL3
As % of gross
lending£m £m % £m £m % £m £m % £m £m % £m £m %
At 31 December 2020
Retail
UK Mortgages 28,049 354 1.3 4,067 189 4.6 2,663 82 3.1 3,103 173 5.6 37,882 798 2.1
Credit cards 2,916 422 14.5 220 78 35.5 92 28 30.4 36 20 55.6 3,264 548 16.8
Loans and overdrafts 959 209 21.8 388 68 17.5 126 45 35.7 46 22 47.8 1,519 344 22.6
UK Motor Finance 724 62 8.6 1,321 55 4.2 132 37 28.0 39 17 43.6 2,216 171 7.7
Other 512 56 10.9 651 44 6.8 69 14 20.3 72 10 13.9 1,304 124 9.5
33,160 1,103 3.3 6,647 434 6.5 3,082 206 6.7 3,296 242 7.3 46,185 1,985 4.3
Commercial Banking
SME 4,229 219 5.2 150 6 4.0 40 5 12.5 81 4 4.9 4,500 234 5.2
Other 9,505 501 5.3 97 3 3.1 37 2 5.4 177 1 0.6 9,816 507 5.2
13,734 720 5.2 247 9 3.6 77 7 9.1 258 5 1.9 14,316 741 5.2
Insurance and Wealth 1 — — 12 1 8.3 — — — — — — 13 1 7.7
Central items — — — — — — — — — — — — — — —
Total 46,895 1,823 3.9 6,906 444 6.4 3,159 213 6.7 3,554 247 6.9 60,514 2,727 4.5
At 31 December 2019
Retail
UK Mortgages 16,100 192 1.2 3,730 171 4.6 3,517 84 2.4 3,491 167 4.8 26,838 614 2.3
Credit cards 1,088 139 12.8 422 49 11.6 124 30 24.2 41 17 41.5 1,675 235 14.0
Loans and overdrafts 569 88 15.5 348 42 12.1 158 41 25.9 56 22 39.3 1,131 193 17.1
UK Motor Finance 543 27 5.0 1,232 30 2.4 135 21 15.6 32 9 28.1 1,942 87 4.5
Other 323 15 4.6 364 12 3.3 80 8 10.0 78 6 7.7 845 41 4.9
18,623 461 2.5 6,096 304 5.0 4,014 184 4.6 3,698 221 6.0 32,431 1,170 3.6
Commercial Banking
SME 2,014 104 5.2 410 17 4.1 56 6 10.7 27 — — 2,507 127 5.1
Other 1,881 75 4.0 1,290 47 3.6 61 2 3.3 238 1 0.4 3,470 125 3.6
3,895 179 4.6 1,700 64 3.8 117 8 6.8 265 1 0.4 5,977 252 4.2
Insurance and Wealth — — — 28 1 3.6 1 — — 3 — — 32 1 3.1
Central items — — — — — — — — — — — — — — —
Total 22,518 640 2.8 7,824 369 4.7 4,132 192 4.6 3,966 222 5.6 38,440 1,423 3.7
1 Includes forbearance, client and product-specific indicators not reflected within quantitative PD assessments.2 Includes assets that have triggered PD movements, or other rules, given that being 1-29 days in arrears in of itself is not a stage 2 trigger.3 Expected credit loss allowances on loans and advances to customers (drawn and undrawn).
The Group’s assessment of a significant increase in credit risk, and resulting categorisation of Stage 2, includes customers moving into early arrears as well as a broader assessment that an up to date customer has experienced a level of deterioration in credit risk since origination. A more sophisticated assessment is required for up to date customers, which varies across divisions and product type. This assessment incorporates specific triggers such as a significant proportionate increase in probability of default relative to that at origination, recent arrears, forbearance activity, internal watch lists and external bureau flags. Up to date exposures in Stage 2 are likely to show lower levels of expected credit loss (ECL) allowance relative to those that have already moved into arrears given that an arrears status typically reflects a stronger indication of future default and greater likelihood of credit losses.
Additional information
ECL sensitivity to economic assumptionsThe measurement of ECL reflects an unbiased probability-weighted range of possible future economic outcomes. The Group achieves this by generating four economic scenarios to reflect the range of outcomes; the central scenario reflects the Group’s base case assumptions used for medium-term planning purposes, an upside and a downside scenario are also selected together with a severe downside scenario. The base case, upside and downside scenarios carry a 30 per cent weighting; the severe downside is weighted at 10 per cent.

Strategic rep
ortFinancial results
Governance
Risk managem
entO
ther information
Financial statements
Lloyds Banking Group Annual Report and Accounts 2020 173
The table below shows the Group’s ECL for the upside, base case, downside and severe downside scenarios. The stage allocation for an asset is based on the overall scenario probability-weighted PD and, hence, the Stage 2 allocation is constant across all the scenarios. ECL applied through individual assessments and post-model adjustments is reported flat against each economic scenario, reflecting the basis on which they are evaluated.
Probability- weighted Upside Base case Downside
Severe downside
£m £m £m £m £m
Statutory basis
UK Mortgages 1,027 614 804 1,237 2,306
Other Retail 2,368 2,181 2,310 2,487 2,745
Commercial Banking 2,402 1,910 2,177 2,681 3,718
Other 450 448 450 450 456
At 31 December 2020 6,247 5,153 5,741 6,855 9,225
UK Mortgages 569 317 464 653 1,389
Other Retail 1,521 1,443 1,492 1,564 1,712
Commercial Banking 1,315 1,211 1,258 1,382 1,597
Other 50 50 50 50 50
At 31 December 2019 3,455 3,021 3,264 3,649 4,748
Probability- weighted Upside Base case Downside
Severe downside
£m £m £m £m £m
Underlying basis
UK Mortgages 1,605 1,192 1,382 1,815 2,884
Other Retail 2,403 2,216 2,345 2,522 2,780
Commercial Banking 2,402 1,910 2,177 2,681 3,718
Other 450 448 450 450 456
At 31 December 2020 6,860 5,766 6,354 7,468 9,838
UK Mortgages 1,216 964 1,111 1,300 2,036
Other Retail 1,580 1,502 1,551 1,623 1,771
Commercial Banking 1,315 1,211 1,258 1,382 1,597
Other 50 50 50 50 50
At 31 December 2019 4,161 3,727 3,970 4,355 5,454

174 Lloyds Banking Group Annual Report and Accounts 2020
Risk management continued
The table below shows the Group’s ECL for the upside, base case, downside and severe downside scenarios, with stage allocation based on each specific scenario. ECL applied through individual assessments and post-model adjustments is reported flat against each economic scenario, reflecting the basis on which they are evaluated. A probability-weighted scenario is not shown as this does not reflect the basis on which ECL is reported.
At 31 December 2020 At 31 December 2019
Upside Base case DownsideSevere
downside Upside Base case DownsideSevere
downside£m £m £m £m £m £m £m £m
Statutory basis
UK Mortgages 602 797 1,269 2,578 311 461 670 1,667
Other Retail 2,154 2,299 2,509 2,819 1,435 1,486 1,570 1,740
Commercial Banking 1,892 2,157 2,738 4,155 1,206 1,254 1,387 1,625
Other 448 449 450 457 49 50 50 51
Total 5,096 5,702 6,966 10,009 3,001 3,251 3,677 5,083
Underlying basis
UK Mortgages 1,180 1,375 1,847 3,156 958 1,108 1,317 2,314
Other Retail 2,189 2,334 2,544 2,854 1,494 1,545 1,629 1,799
Commercial Banking 1,892 2,157 2,738 4,155 1,206 1,254 1,387 1,625
Other 448 449 450 457 49 50 50 51
Total 5,709 6,315 7,579 10,622 3,707 3,957 4,383 5,789
The impact of changes in the UK unemployment rate and House Price Index (HPI) have also been assessed. Although such changes would not be observed in isolation, as economic indicators tend to be correlated in a coherent scenario, this gives insight into the sensitivity of the Group’s ECL to gradual changes in these two critical economic factors. The assessment has been made against the base case with the reported staging unchanged.
The table below shows the impact on the Group’s ECL in respect of UK mortgages resulting from a decrease/increase in Loss Given Default for a 10 percentage point (pp) increase or decrease in the UK House Price Index (HPI). The increase/decrease is presented based on the adjustment phased evenly over the first ten quarters of the base case scenario.
At 31 December 2020 At 31 December 2019
10pp increase in HPI
10pp decrease in HPI
10pp increase in HPI
10pp decrease in HPI
ECL impact, £m (206) 284 (110) 147
The table below shows the impact on the Group’s ECL resulting from a 1 percentage point (pp) increase or decrease in the UK unemployment rate. The increase or decrease is presented based on the adjustment phased evenly over the first ten quarters of the base case scenario. An immediate increase or decrease would drive a more material ECL impact as it would be fully reflected in both 12 month and lifetime PDs.
At 31 December 2020 At 31 December 2019
1pp increase in unemployment
1pp decrease in unemployment
1pp increase in unemployment
1pp decrease in unemployment
£m £m £m £m
UK mortgages 25 (23) 33 (34)
Other Retail 54 (54) 39 (54)
Commercial Banking 125 (112) 68 (54)
Other 1 (1) 1 (1)
ECL impact 205 (190) 141 (143)

Strategic rep
ortFinancial results
Governance
Risk managem
entO
ther information
Financial statements
Lloyds Banking Group Annual Report and Accounts 2020 175
Group derivative credit risk exposures
Derivative credit risk exposure
2020 2019
Traded over the counter Traded over the counter
Traded on recognised exchanges
Settled by central
counterparties
Not settled by central
counterparties Total
Traded on recognised exchanges
Settled by central
counterparties
Not settled by central
counterparties Total£m £m £m £m £m £m £m £m
Notional balances
Foreign exchange — 20 419,456 419,476 — 8 421,143 421,151
Interest rate 275,386 6,647,014 241,340 7,163,740 199,986 6,211,948 250,392 6,662,326
Equity and other 5,264 — 4,794 10,058 4,820 — 6,594 11,414
Credit — — 7,707 7,707 — — 16,959 16,959
Total 280,650 6,647,034 673,297 7,600,981 204,806 6,211,956 695,088 7,111,850
Fair values
Assets 931 28,627 1,820 24,499
Liabilities (965) (26,290) (1,794) (23,928)
Net (liability) asset (34) 2,337 26 571
The total notional principal amount of interest rate, exchange rate, credit derivative and equity and other contracts outstanding at 31 December 2020 and 31 December 2019 is shown in the table above. The notional principal amount does not, however, represent the Group’s credit risk exposure, which is limited to the current cost of replacing contracts with a positive value to the Group. Such amounts are reflected in note 51 on page 314.
Retail The Retail portfolio has remained robust and well positioned throughout the COVID-19 pandemic. Risk management has been enhanced since the last financial crisis, with strong affordability and indebtedness controls for both new and existing lending and a prudent risk appetite approach. This is evident in the significant improvement in credit quality and low arrears rates. However, customers have been significantly impacted by the pandemic and credit performance is expected to worsen as a result
The Group has provided significant levels of support to Retail customers through 2020. Since March 2020, the Group has approved over 1.3 million payment holidays, while personal current accounts customers have had access to up to £500 interest free arranged overdrafts and repossession activity has been suspended
As a result of payment holidays, the arrears rate across the portfolios is below pre-crisis levels
The Group has taken targeted steps across the Retail product offering to implement tighter credit quality controls on key risk indicators such as indebtedness and credit scores to ensure that customers and the bank are protected
The Group has participated fully in the Bounce Back Loan Scheme (BBLS) and the Coronavirus Business Interruption Loan Scheme (CBILS) for Retail Business Banking customers, where government guarantees are in place at 100 per cent and 80 per cent, respectively
The Retail impairment charge increased to £2,384 million for 2020 compared to £1,038 million for 2019, largely driven by updates to the Group’s economic forecast following the coronavirus outbreak
Existing IFRS 9 staging rules and triggers have been maintained across Retail, with additional tightening on the credit cards portfolio. Transfers between stages have been primarily driven by credit risk rating movements and the estimated impact of the economic factors on a customer’s forward-looking default risk
Total Retail expected credit loss (ECL) allowance as a percentage of drawn loans and advances (coverage) increased to 1.1 per cent (31 December 2019: 0.8 per cent) due to the updates in the Group’s economic forecast. As at 31 December 2020, the majority of ECL increases are reflected within Stage 2 under IFRS 9, representing cases which have observed a Significant Increase in Credit Risk since origination (SICR). As such the proportion of Stage 2 loans and advances comprises 13.0 per cent of the Retail portfolio (31 December 2019: 9.4 per cent), of which 86.2 per cent are up to date, performing loans
Stage 2 ECL coverage increased to 4.3 per cent (31 December 2019: 3.6 per cent), following updates to the Group’s economic forecast. This was offset by a slight reduction in UK Mortgages Stage 2 ECL coverage where a greater proportion of Stage 2 balances was from lower risk and up to date accounts, transferred into Stage 2 based on the forward-looking view of their credit performance
Stage 3 loans and advances have remained flat at 1.5 per cent of total loans and advances (31 December 2019: 1.5 per cent, Stage 3 ECL coverage increased to 22.5 per cent (31 December 2019: 19.1 per cent) due to a combination of the UK Mortgages and Motor Finance portfolios where the impact of the coronavirus outbreak on collateral values is expected to result in increased loss given default (LGD), in addition to the impact of changes to collections processes within the credit cards portfolio

176 Lloyds Banking Group Annual Report and Accounts 2020
Risk management continued
Portfolios
UK Mortgages The UK Mortgages portfolio is well positioned with low arrears and a strong Loan to Value (LTV) profile. The Group has actively improved the quality of the portfolio over the years using robust affordability and credit controls, whilst the balances of higher risk portfolios originated prior to 2008 have continued to reduce
Whilst the housing market has remained resilient throughout 2020 with strong customer demand, the Group has taken action to protect credit quality, for example by reducing the maximum LTV on new lending to 85 per cent for the majority of 2020
Total loans and advances increased to £295.4 billion (31 December 2019: £289.8 billion), with a small reduction in average LTV to 43.5 per cent (31 December 2019: 44.9 per cent). The proportion of balances with an LTV greater than 90 per cent decreased to 0.6 per cent (31 December 2019: 2.5 per cent). The average LTV of new business decreased to 63.9 per cent (31 December 2019: 64.3 per cent)
The impairment charge was £478 million for 2020 compared to a release of £167 million for 2019, reflecting charges due to the weaker economic outlook. Total ECL coverage increased to 0.5 per cent (31 December 2019: 0.4 per cent)
Stage 2 loans and advances increased to 12.8 per cent of the portfolio (31 December 2019: 9.3 per cent) which has contributed to a slight reduction in Stage 2 ECL coverage to 2.1 per cent (31 December 2019: 2.3 per cent) given a greater proportion of Stage 2 balances from lower risk up to date accounts, transferred into Stage 2 based on the forward-looking view of their credit performance
Stage 3 ECL Coverage increased to 15.6 per cent (31 December 2019: 13.6 per cent) largely due to the revised outlook for house prices across the multiple economic scenarios utilised for IFRS 9 provisioning
Credit cards
Credit cards balances decreased to £15.1 billion (31 December 2019: £18.1 billion) due to reduced levels of customer spend, resulting in a reduction in the volume of customers with highly utilised cards
The credit card book has performed well in recent years, with lower arrears rates compared to the High Street Bank peer group
The impairment charge was £800 million for 2020 (2019: £503 million), with overall ECL coverage increasing to 6.4 per cent (31 December 2019: 3.4 per cent) and Stage 2 ECL coverage increasing to 16.8 per cent (31 December: 14.1 per cent). The increases were largely due to the weaker outlook within our economic forecasts
In addition to increases caused by the weakening economic outlook, Stage 2 loans and advances also increased due to a stricter criteria adopted to trigger movements from Stage 1 to Stage 2. As a result, Stage 2 loans and advances as a percentage of total loans and advances increased to 21.7 per cent (31 December 2019: 9.2 per cent)
Stage 3 ECL coverage increased to 58.8 per cent (31 December 2019: 46.2 per cent). This resulted from a refresh of data used to calculate loss rates that reflects changes in collections policy, some realignment of coverage across stages and a strengthening of coverage given the current environment
Loans and overdrafts Loans and advances for personal current account and the personal loans portfolios decreased to £9.5 billion (31 December 2019: £10.2 billion) due to reduced customer spend and demand for credit
The impairment charge was £739 million for the full year 2020 compared to £445 million for the full year 2019. This increase is primarily due to the weaker outlook within our economic forecasts, increasing both Stage 2 ECL coverage to 22.6 per cent (31 December 2019: 17.1 per cent) and overall ECL coverage to 7.6 per cent (31 December 2019: 4.6 per cent)
UK Motor Finance
The UK Motor Finance portfolio decreased slightly from £16.0 billion for 2019 to £15.2 billion for 2020 due to reduced market activity as a result of the pandemic
The impairment charge increased to £226 million for 2020 compared to £203 million for 2019, due to the weaker outlook within our economic forecasts. ECL coverage increased to 3.3 per cent (31 December 2019: 2.4 per cent)
Updates to Residual Value (RV) and Voluntary Termination (VT) risk held against Personal Contract Purchase (PCP) and Hire Purchase (HP) lending included within the impairment charge, however because the Group has adopted a prudent approach to modelling this risk in recent years, the updates to the Group’s economic outlook have not resulted in a material change to provisions, which remained relatively unchanged at £192 million as at 31 December 2020 (31 December 2019: £201 million)
Stage 2 ECL coverage increased to 7.7 per cent (31 December 2019: 4.5 per cent) and Stage 3 ECL coverage increased to 66.8 per cent (31 Dec 2019: 56.0 per cent) both of which were due principally to the impact on Credit ECL from updates to the Group’s outlook on used car prices. Credit and RV provisioning are aligned in the assumption of an anticipated near-term reduction in car prices, with an expected slow recovery until 2024
Other Other loans and advances increased to £19.4 billion (31 December 2019: £10.9 billion). The increase was largely driven by increased lending to Retail Business Banking customers; £7.1 billion Bounce Back Loans, which are fully guaranteed by the UK Government, and £254 million Coronavirus Business Interruption Loans which are 80 per cent guaranteed
The impairment charge was £141 million for 2020 compared to £54 million for 2019, primarily due to the weaker outlook within our economic forecasts
Retail UK Mortgages loans and advances to customers (statutory basis)
At 31 Dec 20201
At 31 Dec 20191
£m £m
Mainstream 234,273 227,975
Buy-to-let 49,634 49,086
Specialist 10,899 12,137
Total 294,806 289,198
1 Balances include the impact of HBOS related acquisition adjustments.

Strategic rep
ortFinancial results
Governance
Risk managem
entO
ther information
Financial statements
Lloyds Banking Group Annual Report and Accounts 2020 177
Mortgages greater than three months in arrears (excluding repossessions, underlying basis)
Number of cases Total mortgage accounts Value of loans1 Total mortgage balances
2020 2019 2020 2019 2020 2019 2020 2019At 31 December Cases Cases % % £m £m % %
Mainstream 25,014 24,393 1.4 1.3 2,777 2,619 1.2 1.1
Buy-to-let 4,598 3,863 1.1 0.9 602 502 1.2 1.0
Specialist 6,294 6,059 7.6 6.6 1,056 998 9.6 8.2
Total 35,906 34,315 1.5 1.4 4,435 4,119 1.5 1.4
1 Value of loans represents total gross book value of mortgages more than three months in arrears; the balances exclude the impact of HBOS acquisition adjustments.
The stock of repossessions decreased to 343 cases at 31 December 2020 compared to 1,171 cases at 31 December 2019.
In line with regulatory guidance, the Group has suspended all repossession activity on mortgage accounts from March 2020. As a consequence of this, the volume of cases in late stage arrears has increased.
Period end and average LTVs across the Retail mortgage portfolios (underlying basis)
Mainstream Buy-to-let Specialist Total% % % %
At 31 December 2020
Less than 60% 53.8 61.5 70.1 55.8
60% to 70% 18.3 25.0 16.1 19.3
70% to 80% 17.8 12.1 8.0 16.5
80% to 90% 9.6 0.9 2.3 7.8
90% to 100% 0.3 0.2 1.0 0.3
Greater than 100% 0.2 0.3 2.5 0.3
Total 100.0 100.0 100.0 100.0
Average loan to value1:
Stock of residential mortgages 42.5 49.7 40.9 43.5
New residential lending 65.1 58.2 n/a 63.9
Mainstream Buy-to-let Specialist Total% % % %
At 31 December 2019
Less than 60% 51.8 54.1 62.7 52.7
60% to 70% 16.4 25.1 17.5 18.0
70% to 80% 16.9 18.0 11.7 16.8
80% to 90% 12.0 2.0 4.1 10.0
90% to 100% 2.6 0.4 1.2 2.1
Greater than 100% 0.3 0.4 2.8 0.4
Total 100.0 100.0 100.0 100.0
Average loan to value1:
Stock of residential mortgages 43.6 52.3 44.0 44.9
New residential lending 65.2 58.2 n/a 64.3
1 Average loan to value is calculated as total loans and advances as a percentage of the total indexed collateral of these loans and advances; the balances exclude the impact of HBOS acquisition adjustments.

178 Lloyds Banking Group Annual Report and Accounts 2020
Risk management continued
Interest-only mortgagesThe Group provides interest-only mortgages to owner occupier mortgage customers whereby only payments of interest are made for the term of the mortgage with the customer responsible for repaying the principal outstanding at the end of the loan term. At 31 December 2020, owner occupier interest-only balances as a proportion of total owner occupier balances had reduced to 21.6 per cent (31 December 2019: 23.9 per cent). The average indexed loan to value remained low at 39.0 per cent (31 December 2019: 41.2 per cent).
For existing interest-only mortgages, a contact strategy is in place during the term of the mortgage to ensure that customers are aware of their obligations to repay the principal upon maturity of the loan.
Treatment strategies are in place to help customers anticipate and plan for repayment of capital at maturity and support those who may have difficulty in repaying the principal amount. A dedicated specialist team supports customers who have passed their contractual maturity date and are unable to fully repay the principal. A range of treatments are offered to customers based on their individual circumstances to create fair and sustainable outcomes.
Analysis of owner occupier interest-only mortgages (statutory basis)
At 31 Dec 2020
At 31 Dec 2019
Total Total
Interest-only balances (£m) 53,077 57,437
Stage 1 (%) 69.0 75.6
Stage 2 (%) 16.3 10.0
Stage 3 (%) 1.7 1.2
Purchased or originated credit-impaired (%) 13.0 13.2
Average loan to value (%) 39.0 41.2
Maturity profile (£m)
Due 1,626 1,459
1 year 2,045 1,968
2-5 years 9,450 9,852
6-10 years 18,351 18,606
>11 years 21,605 25,552
Past term interest-only balances (£m)1 1,715 1,677
Stage 1 (%) 0.7 0.9
Stage 2 (%) 28.9 23.9
Stage 3 (%) 24.2 21.8
Purchased or originated credit-impaired (%) 46.2 53.4
Average loan to value (%) 34.4 35.7
Negative equity (%) 2.5 2.8
1 Balances where all interest-only elements have moved past term. Some may subsequently have had a term extension, so are no longer classed as due.

Strategic rep
ortFinancial results
Governance
Risk managem
entO
ther information
Financial statements
Lloyds Banking Group Annual Report and Accounts 2020 179
Retail forbearanceThe basis of disclosure for forbearance is aligned to definitions used in the European Banking Authority’s FINREP reporting. On an underlying basis, total forbearance for the major retail portfolios has improved by £286 million to £6.2 billion driven primarily by a reduction in customers where arrears are written on to the loan balance (capitalisations). On a statutory basis the equivalent total forbearance position improved by £259million to £5.9 billion.
The main customer treatments included are: repair, where arrears are written on to the loan balance and the arrears position cancelled; instances where there are suspensions of interest and/or capital repayments; past term interest-only mortgages; and refinance personal loans.
As a percentage of loans and advances, forbearance loans improved to 1.7 per cent at 31 December 2020 (31 December 2019: 1.9 per cent).
As at 31 December 2020, 98.3 per cent of forbearance loans are captured in Stage 2 or Stage 3 for IFRS 9 and hold provision on a lifetime basis (31 December 2019: 98.8 per cent).
Total expected credit losses (ECL) as a proportion of loans and advances which are forborne has increased to 12.2 per cent (31 December 2019: 9.3 per cent).
Retail forborne loans and advances (statutory basis) (audited)
TotalOf which Stage 2
Of which Stage 3
Of which POCI
Expected credit losses as a % of total loans and
advances which are forborne1
£m £m £m £m %
At 31 December 20202
UK Mortgages 5,106 1,192 823 3,081 3.6
Credit cards 356 130 191 — 40.0
Loans and overdrafts 353 154 146 — 36.5
UK Motor Finance 88 50 34 — 36.3
Total 5,903 1,526 1,194 3,081 7.0
At 31 December 2019
UK Mortgages 5,559 1,156 736 3,659 2.1
Credit cards 321 65 210 — 32.8
Loans and overdrafts 219 103 95 — 28.8
UK Motor Finance 63 35 26 — 30.4
Total 6,162 1,359 1,067 3,659 5.0
1 Expected credit loss allowance as a percentage of total loans and advances which are forborne is calculated excluding loans in recoveries for Credit cards, Loans and overdrafts (31 December 2020: £75 million; 31 December 2019: £82 million).
2 In line with FINREP reporting and regulatory guidelines, Retail forborne loans and advances do not include COVID-19 moratoria.
Retail forborne loans and advances (underlying basis)
TotalOf which Stage 2
Of which Stage 3
Expected credit losses as a % of total loans and
advances which are forborne1
£m £m £m %
At 31 December 20202,3
UK Mortgages 5,377 3,054 2,313 8.4
Credit cards 356 130 191 40.0
Loans and overdrafts 353 154 145 36.5
UK Motor Finance 88 50 34 36.3
Total 6,174 3,388 2,683 12.2
At 31 December 20192
UK Mortgages 5,857 3,467 2,379 7.1
Credit cards 321 65 210 32.8
Loans and overdrafts 219 103 95 28.8
UK Motor Finance 63 35 26 30.4
Total 6,460 3,670 2,710 9.3
1 Expected credit losses as a percentage of total loans and advances which are forborne are calculated excluding loans in recoveries for Credit cards, Loans and overdrafts (31 December 2020: £75 million; 31 December 2019: £82 million).
2 Balances exclude the impact of HBOS and MBNA acquisition related adjustments.3 In line with FINREP reporting and regulatory guidelines, Retail forborne loans and advances do not include COVID-19 moratoria.

180 Lloyds Banking Group Annual Report and Accounts 2020
Risk management continued
Commercial BankingPortfolio Management and Supporting the Group's Customers
Commercial Banking has actively supported its customers during this difficult time, through a range of propositions, including capital repayment holidays, working capital line increases and financial covenant waivers, as well as supporting small businesses and corporates through full use of UK Government schemes
The coronavirus has resulted in widespread industry disruption, with some sectors such as travel, transportation, non-essential retail and hospitality particularly impacted, although as a proportion of the Group’s overall lending, these sectors remain relatively modest. The Group expects recovery to be slow in a number of vulnerable sectors and anticipates longer term structural changes in a number of these. Sector and credit risk appetite continue to be proactively managed to ensure the Group is protected and clients are supported in the right way
As the crisis has developed, Commercial Banking has continued to support its more vulnerable clients early through focused risk management via the Group’s Watchlist and Business Support framework
With the exception of certain risk appetite extensions made to accommodate UK Government scheme guidelines, particularly Bounce Back Loans and to a lesser extent, Coronavirus Business Interruption Loans (where government guarantees are in place at 100 per cent and 80 per cent, respectively), lending continues to be in line with the usual approach to credit risk and through the cycle credit risk appetite: credit analysis is undertaken to ensure continued financial viability, notwithstanding any short-term coronavirus related pressure
Although the portfolios were well positioned pre crisis, as expected, deterioration has been seen with downgrades in credit risk ratings observed, although more so in the larger corporates segment, than in the SME book, which remains predominantly a secured portfolio. Risk rating downgrades to sub investment grade or equivalent have, however, been more modest
Credit impacts were relatively muted in the SME portfolio in 2020. Observed credit quality is likely to be influenced by the significant temporary support provided by the Government in light of the COVID-19 pandemic, which has the potential to distort underlying credit risk. The Group expects arrears and defaults to increase in 2021 as this support comes to an end. Crystallisation of these impacts is expected to start from the second quarter of 2021 as payments start to fall due, and are anticipated to be protracted over a number of years, given the flexible payment deferral options available under the various government lending schemes
Significant uncertainties remain, relating to both the coronavirus pandemic and the full impact of the UK's exit from the European Union on the portfolios. Notwithstanding this, the Group will continue to balance prudent risk appetite with ensuring support for financially viable clients on their road to recovery
Impairments The net impairment charge increased to £1,464 million in 2020, compared with £306 million in 2019. The increase largely reflects charges of £809 million following updates to the economic outlook, together with £403 million for a small number of existing Stage 3 large corporate restructuring cases in the Business Support Unit (BSU), where coronavirus has directly hampered the client’s existing recovery strategy. The remaining charge of £252 million was largely as a result of impairments crystallising on a small number of single name charges in the BSU
As a result, expected credit loss allowances increased by £1,082 million to £2,395 million at 31 December 2020. The Group recognises that credit quality has been supported by the temporary measures provided by the UK Government schemes and the existing expected credit loss provision balance as at 31 December 2020 assumes additional losses will emerge as the support subsides and structural change emerges in some sectors
Stage 3 loans and advances remained broadly flat at £3,524 million (31 December 2019: £3,447 million) although given the overall Commercial portfolio reduction, as a proportion of total loans and advances to customers, increased to 4.0 per cent (31 December 2019: 3.6 per cent). SME flows to Stage 3 remain suppressed and non-SME flows were offset by repayments and write-offs. Stage 3 ECL coverage increased to 36.7 per cent (31 December 2019: 27.4 per cent) predominantly driven by the additional provisions raised against the existing restructuring cases in the BSU
Stage 2 loans and advances have increased by £8,339 million to £14,316 million at 31 December 2020, largely driven by the IFRS 9 forward look PD staging trigger, rather than actual PD deterioration, with 98 per cent of Stage 2 balances being current and up to date. As a result, Stage 2 loans as a proportion of total loans and advances to customers increased to 16.2 per cent (31 December 2019: 6.2 per cent). Stage 2 ECL coverage was higher at 5.2 per cent (31 December 2019: 4.2 per cent) with the increase in coverage a direct result of the forward look multiple economic scenarios
Commercial Banking UK Direct Real Estate Commercial Banking UK Direct Real Estate gross lending stood at £13.1 billion at 31 December 2020 (net of exposures subject to protection through Significant Risk Transfer securitisations). The Group has a further £1.0 billion of UK Direct Real Estate exposure in Business Banking within the Retail division
The Group classifies Direct Real Estate as exposure which is directly supported by cash flows from property activities (as opposed to trading activities, such as hotels, care homes and housebuilders). Exposures of £6.0 billion to social housing providers are also excluded
Recognising this is a cyclical sector, appropriate caps are in place to control origination and exposure. Focus remains on the UK market and business propositions have been written in line with a prudent, through the cycle risk appetite with conservative LTVs, strong quality of income and proven management teams
Overall performance has remained generally acceptable, although an increase in cases moving to Watchlist has been seen, with some transfers to BSU concentrated in the retail/shopping centres sub sector. This is somewhat to be expected, as overall rent collection has been impacted by COVID-19, particularly in the retail space given the number of closed stores throughout the lockdowns, though the office sub sector has been reasonably resilient. Despite these challenges the portfolio is relatively well positioned and proactively managed with appropriate risk mitigants in place:
– Exposures over £1 million continue to be heavily weighted towards investment real estate (c.90 per cent) over development. Of these investment exposures, over 75 per cent have an LTV of less than 60 per cent, with an average LTV of 50 per cent
– C.90 per cent of exposures greater than £5 million have an interest cover ratio of greater than 2.0 times and in SME, LTV at origination has been typically limited to c.55 per cent, given prudent repayment cover criteria (including a notional base rate stress)
– Approximately 65 per cent of exposures over £1 million relate to commercial real estate (with no speculative development lending) with the remainder related to residential real estate. The underlying sub-sector split is diversified with c.13 per cent of exposures secured by Retail assets, with appetite tightened since 2018
– The Office portfolio is focused on prime locations with strong sponsors and low LTVs, as well as no speculative commercial development
– Use of Significant Risk Transfer (SRT) securitisations also acts as a risk mitigant, with run off of these carefully managed and tracked
– Both investment and development lending is subject to specific credit risk appetite criteria. Development lending criteria includes maximum loan to gross development value and maximum loan to cost, with funding typically only released against completed work, as confirmed by the Group’s monitoring quantity surveyor

Strategic rep
ortFinancial results
Governance
Risk managem
entO
ther information
Financial statements
Lloyds Banking Group Annual Report and Accounts 2020 181
LTV – UK Direct Real Estate
At 31 December 20201,2 At 31 December 20191,2
Stage 1/2 Stage 3 Total Stage 1/2 Stage 3 Total£m £m £m % £m £m £m %
Investment Exposures > £1m
Less than 60% 5,967 48 6,015 77.2 6,136 89 6,225 79.2
60% to 70% 883 7 890 11.4 917 14 931 11.8
70% to 80% 143 — 143 1.8 117 7 124 1.6
80% to 100% 48 4 52 0.7 138 38 176 2.2
100% to 120% 69 70 139 1.8 26 37 63 0.8
120% to 140% — 40 40 0.5 4 12 16 0.2
Greater than 140% — 47 47 0.6 18 1 19 0.2
Unsecured3 367 97 464 6.0 311 — 311 4.0
Total Investment >£1m 7,477 313 7,790 100.0 7,667 198 7,865 100.0
Investment <£1m 3,238 41 3,279 3,455 88 3,543
Total Investment 10,715 354 11,069 11,122 286 11,408
Development 1,620 27 1,647 1,805 58 1,863
Total 12,335 381 12,716 12,927 344 13,271
1 Excludes Commercial Banking UK Direct Real Estate exposures subject to protection through Significant Risk Transfer transactions.2 Excludes Islands Commercial UK Direct Real Estate of £0.36 billion (31 December 2019: £0.35 billion).3 Predominantly Investment grade corporate CRE lending where the Group is relying on the corporate covenant.
Commercial Banking forbearance
Commercial Banking forborne loans and advances (audited)
TotalOf which Stage 3
£m £m
At 31 December 2020
Type of forbearance
Refinancing 16 15
Modification 4,309 3,509
Total 4,325 3,524
At 31 December 2019
Type of forbearance
Refinancing 70 41
Modification 4,216 3,322
Total 4,286 3,363
Commercial Banking lending in key coronavirus-impacted sectors1
Drawn UndrawnDrawn and
undrawn
Drawn as a % of Group
loans and advances
£bn £bn £bn %
At 31 December 2020
Retail non-food 2.2 1.7 3.9 0.5
Automotive dealerships2 1.8 2.0 3.8 0.4
Oil and gas 1.1 2.7 3.8 0.2
Construction 1.2 1.7 2.9 0.2
Passenger transport 1.2 1.1 2.3 0.2
Hotels 1.9 0.3 2.2 0.4
Leisure 0.7 0.7 1.4 0.1
Restaurants and bars 0.7 0.5 1.2 0.1
Total 10.8 10.7 21.5 2.1
1 Lending classified using ONS SIC codes at legal entity level.2 Automotive dealerships includes Black Horse Motor Wholesale lending (within Retail Division).

182 Lloyds Banking Group Annual Report and Accounts 2020
Risk management continued
Environmental risk managementThrough 2020 the Group has strengthened capacity for identifying, assessing and managing environmental risks across its lending activity. Group-wide credit risk principles require all credit risk to be incurred with regard to environmental legislation and the Group's Code of Responsibility.
Environmental risk is embedded in credit policy and must be assessed at origination and monitored on an ongoing basis throughout the customer lifecycle.
The Group continues to embed the risks and opportunities from climate change into its business and credit risk processes, with a robust programme underway to analyse and proactively manage business strategy and risk appetite response for financing high-carbon intensive sectors, while emphasising its commitment to support clients transitioning to more sustainable, low-carbon activities.
In 2020 the Group has developed and piloted a Climate Risk Assessment tool, and has continued to develop guidance and tools to help Relationship Managers and Credit Officers identify and manage the climate risk associated with its customers. This includes analysing actions being taken by customers to reduce greenhouse gas emissions, reviewing and responding to exposure to physical and transitional risks from climate change; and understanding and managing potential opportunities to support customers in their transition journey. Further detail is provided in the Responsible Business section (see pages 16 to 31).
Lloyds Banking Group is a signatory to the Equator Principles, which is a risk management framework for managing environmental and social risks in Project Finance transactions, such as large scale energy, industrial, or infrastructure projects. It ensures that such deals, where the Group provides finance or advice, meet minimum standards for due diligence and monitoring in keeping with responsible finance.
In 2020, the Group implemented the enhanced requirements of Equator Principles 4. This strengthens the due diligence requirements for signatories to consider the environmental and social risk impacts of projects specifically on human rights, climate change and biodiversity, including aligning climate change risk assessments with the physical and transition risk categories recommended by the Task Force on Climate-related Financial Disclosures.
The Group has also been a signatory to the UN Principles for Responsible Investment (UNPRI) since 2012, which incorporate environmental, social and governance (ESG) risk considerations in asset management. Scottish Widows is responsible for the annual UNPRI reporting process.
The risk-based environmental policy was simplified in 2020, to ensure focus on higher risk sectors and transactions. All cases that are identified as higher risk are subject to further review. Where specific or material environmental risks or concerns are identified by the Group's in-house team, cases are referred to environmental risk consultants for an opinion on the adequacy of the mitigants in place or recommendations on managing the environmental risk. The key findings from such due diligence must be factored into credit applications which inform lending decisions.
The Group provides colleague training on environmental risk management as part of the standard suite of Commercial Banking credit risk courses. To support this training, a range of online resources are available to colleagues, including environmental risk theory, procedural guidance, and information on environmental legislation and sector-specific environmental impacts.
The Group continues to partner with the Cambridge Institute for Sustainability Leadership to provide high quality training to executives and colleagues focused on risk management, product development and in client-facing roles.
Group Credit Principle
Environmental risk
Credit policies
Business unitprocesses
Initialtransaction
screening to assess against
criteria ofEnvironmental
Risk policy
RelationshipTeams
InputEnvironmentalRisk Screening
Tool
RelationshipTeams
Mannual Review& Analysis of
Documentation
In-house specialistteam
AdditionalEnvironmentalDue Diligence
Retained panelenvironmental
consultants
EnvironmentalRisk ReviewComplete
Recommendationsmade by in-housespecialist team if
applicable
Environmental risk process flowEnvironmental risk management approach

Strategic rep
ortFinancial results
Governance
Risk managem
entO
ther information
Financial statements
Lloyds Banking Group Annual Report and Accounts 2020 183
Funding and liquidity risk
DefinitionFunding risk is defined as the risk that the Group does not have sufficiently stable and diverse sources of funding or the funding structure is inefficient. Liquidity risk is defined as the risk that the Group has insufficient financial resources to meet its commitments as they fall due, or can only secure them at excessive cost.
ExposureLiquidity exposure represents the potential stressed outflows in any future period less expected inflows. The Group considers liquidity exposure from both an internal and a regulatory perspective.
MeasurementLiquidity risk is managed through a series of measures, tests and reports that are primarily based on contractual maturities with behavioural overlays as appropriate. Note 51 on page 314 sets out an analysis of assets and liabilities by relevant maturity grouping. The Group undertakes quantitative and qualitative analysis of the behavioural aspects of its assets and liabilities in order to reflect their expected behaviour.
MitigationThe Group manages and monitors liquidity risks and ensures that liquidity risk management systems and arrangements are adequate with regard to the internal risk appetite, Group strategy and regulatory requirements. Liquidity policies and procedures are subject to independent internal oversight by Risk. Overseas branches and subsidiaries of the Group may also be required to meet the liquidity requirements of the entity’s domestic country. Management of liquidity requirements is performed by the overseas branch or subsidiary in line with Group policy. Liquidity risk of the Insurance business is actively managed and monitored within the Insurance business. The Group plans funding requirements over its planning period, combining business as usual and stressed conditions. The Group manages its liquidity position both with regard to its internal risk appetite and the Liquidity Coverage Ratio (LCR) as required by the PRA and Capital Requirements Directive and Regulation (CRD IV) liquidity requirements.
The Group’s funding and liquidity position is underpinned by its significant customer deposit base, and is supported by strong relationships across customer segments. The Group has consistently observed that in aggregate the retail deposit base provides a stable source of funding. Funding concentration by counterparty, currency and tenor is monitored on an ongoing basis and where concentrations do exist, these are managed as part of the planning process and limited by the internal funding and liquidity risk monitoring framework, with analysis regularly provided to senior management.
To assist in managing the balance sheet, the Group operates a Liquidity Transfer Pricing (LTP) process which: allocates relevant interest expenses from the centre to the Group’s banking businesses within the internal management accounts; helps drive the correct inputs to customer pricing; and is consistent with regulatory requirements. LTP makes extensive use of behavioural maturity profiles, taking account of expected customer loan prepayments and stability of customer deposits, modelled on historic data.
The Group can monetise liquid assets quickly, either through the repurchase agreements (repo) market or through outright sale. In addition, the Group has pre-positioned a substantial amount of assets at the Bank of England’s Discount Window Facility which can be used to access additional liquidity in a time of stress. The Group considers diversification across geography, currency, markets and tenor when assessing appropriate holdings of liquid assets. The Group’s liquid asset buffer is available for deployment at immediate notice, subject to complying with regulatory requirements.
Liquidity risk within the Insurance business may result from: the inability to sell financial assets quickly at their fair values; an insurance liability falling due for payment earlier than expected; the inability to generate cash inflows
as anticipated; an unexpected large operational event; or from a general insurance catastrophe, for example, a significant weather event. Liquidity risk is actively managed and monitored within the Insurance business to ensure that it remains within approved risk appetite, so that even under stress conditions, there is sufficient liquidity to meet obligations.
MonitoringDaily monitoring and control processes are in place to address internal and regulatory liquidity requirements. The Group monitors a range of market and internal early warning indicators on a daily basis for early signs of liquidity risk in the market or specific to the Group. This captures regulatory metrics as well as metrics the Group considers relevant for its liquidity profile. These are a mixture of quantitative and qualitative measures, including: daily variation of customer balances; changes in maturity profiles; funding concentrations; changes in LCR outflows; credit default swap (CDS) spreads; and basis risks.
The Group carries out internal stress testing of its liquidity and potential cash flow mismatch position over both short (up to one month) and longer-term horizons against a range of scenarios forming an important part of the internal risk appetite. The scenarios and assumptions are reviewed at least annually to ensure that they continue to be relevant to the nature of the business including reflecting emerging horizon risks to the Group. For further information on the Group’s 2020 liquidity stress testing results refer to page 186.
The Group maintains a Contingency Funding Framework as part of the wider Recovery Plan which is designed to identify emerging liquidity concerns at an early stage, so that mitigating actions can be taken to avoid a more serious crisis developing. Contingency Funding Plan invocation and escalation processes are based on analysis of five major quantitative and qualitative components, comprising assessment of: early warning indicators; prudential and regulatory liquidity risk limits and triggers; stress testing results; event and systemic indicators; and market intelligence.
Funding and liquidity management in 2020The Group has maintained its strong funding and liquidity position with the loan to deposit ratio falling to 98 per cent (107 per cent as at 31 December 2019). This was largely driven by a £38.9 billion increase in customer deposits given reduced customer spending and customers depositing government lending scheme balances.
During 2020, the Group repaid all outstanding amounts of its Term Funding Scheme (TFS) drawings of £15.4 billion and the remaining £1 billion outstanding of its Funding for Lending Scheme (FLS) drawings. The Group has drawn £13.7 billion from the Term Funding Scheme with additional incentives for SMEs (TFSME). Overall, total wholesale funding has reduced to £109.4 billion as at 31 December 2020 (31 December 2019: £124.2 billion) principally as a result of growth in customer deposits.
The Group’s liquidity coverage ratio (LCR) was 136 per cent (based on a monthly rolling average over the previous 12 months) as at 31 December 2020 (31 December 2019: 137 per cent) calculated on a consolidated basis based on the EU Delegated Act. Net liquidity outflows increased as a result of a higher volume of short notice customer deposits and higher derivative margin volatility. Following the implementation of structural reform, liquidity risk is managed at a legal entity level with the Group consolidated LCR representing the composite of the Ring-Fenced Bank and Non Ring-Fenced Bank entities.
The Group’s credit ratings continue to reflect the resilience of the Group's business model and the strength of the balance sheet. In October, Moody's downgraded Lloyds Bank plc from Aa3/Negative to A1/Stable due to the removal of the uplift for government support. This impacted a number of other UK peers and was triggered by the downgrade of the UK sovereign rating a few days earlier given the agency's concerns around the pandemic and the UK's exit from the European Union, but did not impact the standalone rating of the bank. Over the year both S&P and Fitch have affirmed the Group's ratings, albeit with negative outlooks to reflect their concerns over the UK economy.

184 Lloyds Banking Group Annual Report and Accounts 2020
Risk management continued
Group funding position
At 31 Dec 2020
At 31 Dec 2019 Change
£bn £bn %
Funding requirement
Loans and advances to customers1 440.2 440.4 —
Loans and advances to banks2 7.8 8.1 (4)
Debt securities at amortised cost 3.3 3.9 (15)
Financial assets at fair value through other comprehensive income – non-LCR eligible3 0.7 0.1
Cash and balances at central bank – non-LCR eligible4 6.4 5.7 12
Funded assets 458.4 458.2 —
Other assets5 265.9 251.7 6
724.3 709.9 2
On balance sheet LCR eligible liquid assets
Reverse repurchase agreements 61.3 56.2 9
Cash and balances at central banks4 66.8 49.4 35
Debt securities at amortised cost 2.1 1.6 31
Financial assets at fair value through other comprehensive income 26.9 25.0 8
Trading and fair value through profit and loss 4.4 4.0 10
Repurchase agreements (14.5) (12.2) 19
147.0 124.0 19
Total Group assets 871.3 833.9 4
Less: other liabilities5 (248.1) (234.7) 6
Funding requirement 623.2 599.2 4
Funded by
Customer deposits6 450.7 411.8 9
Wholesale funding7 109.4 124.2 (12)
560.1 536.0 4
Term funding scheme8 13.7 15.4 (11)
Total equity 49.4 47.8 3
Total funding 623.2 599.2 4
1 Excludes reverse repos of £58.6 billion (31 December 2019: £54.6 billion).2 Excludes £0.2 billion (31 December 2019: £0.1 billion) of loans and advances to banks within the Insurance business and £2.7 billion (31 December 2019: £1.6 billion) of reverse repurchase agreements.3 Non-LCR eligible liquid assets comprise a diversified pool of highly rated unencumbered collateral (including retained issuance). 4 Cash and balances at central banks are combined in the Group’s balance sheet.5 Other assets and other liabilities primarily include balances in the Group’s Insurance business and the fair value of derivative assets and liabilities. 6 Excludes repos of £9.4 billion (31 December 2019: £9.5 billion).7 The Group’s definition of wholesale funding aligns with that used by other international market participants; including bank deposits, debt securities in issue and subordinated liabilities. 31 December
2019 has been restated to exclude margins.8 Includes the Bank of England's Term Funding Scheme (TFS) and Term Funding Scheme with additional incentives for SMEs (TFSME).

Strategic rep
ortFinancial results
Governance
Risk managem
entO
ther information
Financial statements
Lloyds Banking Group Annual Report and Accounts 2020 185
Reconciliation of Group funding to the balance sheet (audited)
Included in funding analysis
Repos and cash collateral
received by Insurance
Fair value and other
accounting methods
Balance sheet
£bn £bn £bn £bn
At 31 December 2020
Deposits from banks 6.1 24.3 1.1 31.5
Debt securities in issue 89.7 — (2.3) 87.4
Subordinated liabilities 13.6 — 0.7 14.3
Total wholesale funding 109.4 24.3
Customer deposits 450.7 9.4 — 460.1
Total 560.1 33.7
At 31 December 20191
Deposits from banks 5.5 22.8 (0.1) 28.2
Debt securities in issue 102.1 — (4.4) 97.7
Subordinated liabilities 16.6 — 0.5 17.1
Total wholesale funding 124.2 22.8
Customer deposits 411.8 9.5 — 421.3
Total 536.0 32.3
1 2019 restated to exclude margins.
Analysis of 2020 total wholesale funding by residual maturity
Less than one
month
One to three
months
Three to six
months
Six to nine months
Nine months to
one yearOne to
two yearsTwo to
five yearsMore than five years
Total at 31 Dec
2020
Total at 31 Dec
2019£bn £bn £bn £bn £bn £bn £bn £bn £bn £bn
Deposits from banks 3.1 0.9 1.5 0.1 — 0.2 0.3 — 6.1 5.5
Debt securities in issue:
Certificates of deposit 1.6 1.4 3.7 0.4 0.7 — 0.2 — 8.0 10.6
Commercial paper 1.3 1.3 4.7 0.6 0.2 — — — 8.1 8.9
Medium-term notes 0.9 0.1 1.3 1.2 1.7 3.3 25.5 13.5 47.5 48.0
Covered bonds 2.3 — 0.8 2.0 0.5 4.3 8.5 4.8 23.2 28.7
Securitisation 0.2 — 0.2 0.6 0.5 0.9 0.5 — 2.9 5.9
6.3 2.8 10.7 4.8 3.6 8.5 34.7 18.3 89.7 102.1
Subordinated liabilities — — 0.5 — — 1.4 5.0 6.7 13.6 16.6
Total wholesale funding1 9.4 3.7 12.7 4.9 3.6 10.1 40.0 25.0 109.4 124.2
1 The Group’s definition of wholesale funding aligns with that used by other international market participants; including bank deposits, debt securities and subordinated liabilities. Excludes balances relating to margins of £5.3 billion (31 December 2019: £4.2 billion). 2019 restated to exclude margins.
Total wholesale funding by currency (audited)
Sterling US Dollar EuroOther
currencies Total£bn £bn £bn £bn £bn
At 31 December 2020 28.2 41.4 32.1 7.7 109.4
At 31 December 20191 28.3 49.3 37.5 9.1 124.2
1 2019 restated to exclude margins.
Analysis of 2020 term issuance (audited)
Sterling US Dollar EuroOther
currencies Total£bn £bn £bn £bn £bn
Medium-term notes 1.3 2.8 2.7 — 6.8
Covered bonds 1.0 — — — 1.0
Private placements1 0.1 0.3 0.1 — 0.5
Subordinated liabilities 1.3 — 0.3 — 1.6
Total issuance 3.7 3.1 3.1 — 9.9
1 Private placements include structured bonds.

186 Lloyds Banking Group Annual Report and Accounts 2020
Risk management continued
During 2020, the Group continued to access wholesale funding markets across a variety of currencies and markets. Despite the more challenging funding conditions around the end of the first quarter, the Group saw strong demand in a number of public issuances, and completed £9.9 billion of long-term funding throughout 2020 across the Group's main issuing entities. This was below the Group's guidance (of the lower end of a £10-15 billion range) given the availability of more cost effective funding via the TFSME. In addition, the Group has been active in offering liquidity to investors through buyback and liability management activity, whilst maintaining a prudent approach to managing funding and liquidity with long-term funding buyback volumes of £7.0 billion during 2020. Overall, total wholesale funding volumes totalled £109.4 billion as at 31 December 2020. The Group plans to continue to access wholesale funding markets in 2021. The continued availability of TFSME will limit the overall wholesale funding requirements of Lloyds Bank plc.
Liquidity PortfolioAt 31 December 2020, the banking business had £141.7 billion of highly liquid unencumbered LCR eligible assets, based on a monthly rolling average over the previous 12 months post any liquidity haircuts (31 December 2019: £130.3 billion), of which £140.3 billion is LCR level 1 eligible (31 December 2019: £129.1 billion) and £1.4 billion is LCR level 2 eligible (31 December 2019: £1.2 billion). These assets are available to meet cash and collateral outflows and regulatory requirements. The Insurance business manages a separate liquidity portfolio to mitigate insurance liquidity risk.
LCR eligible assets
Average 20201
Average 20191 Change
£bn £bn %
Level 1
Cash and central bank reserves 69.3 50.9 36
High quality government/MDB/agency bonds2 68.1 76.4 (11)
High quality covered bonds 2.9 1.8 61
Total 140.3 129.1 9
Level 23 1.4 1.2 17
Total LCR eligible assets 141.7 130.3 9
1 Based on 12 months rolling average to 31 December. Eligible assets are calculated as an average of month-end observations over the previous 12 months post any liquidity haircuts. 2019 assets have been restated accordingly.
2 Designated multilateral development bank (MDB).3 Includes Level 2A and Level 2B.
LCR eligible assets by currency
Sterling US Dollar EuroOther
currencies Total£bn £bn £bn £bn £bn
At 31 December 2020
Level 1 109.7 15.6 15.0 — 140.3
Level 2 0.9 0.3 0.2 — 1.4
Total1 110.6 15.9 15.2 — 141.7
At 31 December 2019
Level 1 100.5 15.6 13.0 — 129.1
Level 2 0.7 0.5 — — 1.2
Total1 101.2 16.1 13.0 — 130.3
1 Based on 12 months rolling average to 31 December. Eligible assets are calculated as an average of month-end observations over the previous 12 months post any liquidity haircuts. 2019 assets have been restated accordingly.
The banking business also has a significant amount of non-LCR eligible liquid assets which are eligible for use in a range of central bank or similar facilities, including the Bank of England's Term Funding Scheme with additional incentives for SMEs (TFSME). Future use of such facilities will be based on prudent liquidity management and economic considerations, having regard for external market conditions.
Stress testing resultsInternal liquidity stress testing results at 31 December 2020 (calculated as an average of month end observations over the previous 12 months) showed that the banking business had liquidity resources representing 137 per cent of modelled outflows over a three month period from all wholesale funding sources, retail and corporate deposits, intraday requirements and rating dependent contracts under the Group’s most severe liquidity stress scenario.
This scenario includes a two notch downgrade of the Group’s current long-term debt rating and accompanying one notch short-term downgrade implemented instantaneously by all major rating agencies.
Encumbered assetsThis disclosure provides further detail on the availability of assets that could be used to support potential future funding requirements of the Group.
The disclosure is not designed to identify assets that would be available in the event of a resolution or bankruptcy.
The Board and the Group Asset and Liability Committee (GALCO) monitor and manage total balance sheet encumbrance using a number of risk appetite metrics. At 31 December 2020, the Group had £46.9 billion (31 December 2019: £60.6 billion) of externally encumbered on-balance sheet assets with counterparties other than central banks. The decrease in encumbered assets was primarily driven by securitisation and covered bond redemptions. The Group also had £707.2 billion (31 December 2019: £639.5 billion) of unencumbered on-balance sheet assets, and £117.2 billion (31 December 2019: £133.7 billion) of pre-positioned and encumbered assets held with central banks, the reduction in the latter was primarily driven by the amortisation of the asset portfolios pledged to access Bank of England funding schemes. Primarily, the Group encumbers mortgages, unsecured lending and credit card receivables through the issuance programmes and tradable securities through securities financing activity. The Group mainly positions mortgage assets at central banks.

Strategic rep
ortFinancial results
Governance
Risk managem
entO
ther information
Financial statements
Lloyds Banking Group Annual Report and Accounts 2020 187
On balance sheet encumbered and unencumbered assets
Pre- positioned
and encumbered
assets held with
central banks
Unencumbered assets not pre-positioned with central banks
Securitisations and covered
bonds Other TotalReadily
realisable1
Other realisable
assets2Cannot be
used3 Total Total£m £m £m £m £m £m £m £m £m
At 31 December 2020
Cash and balances at central banks — — — — 66,248 — 7,009 73,257 73,257
Financial assets at fair value through profit or loss 47 6,245 6,292 — 1,424 — 163,910 165,334 171,626
Derivative financial instruments — — — — — — 29,613 29,613 29,613
Financial assets at amortised cost:
Loans and advances to banks — 1 1 — 2,087 4,483 4,175 10,745 10,746
Loans and advances to customers 28,089 4,901 32,990 116,858 13,069 191,456 144,470 348,995 498,843
Debt securities — 942 942 364 2,271 — 1,828 4,099 5,405
28,089 5,844 33,933 117,222 17,427 195,939 150,473 363,839 514,994
Financial assets at fair value through other comprehensive income — 6,655 6,655 — 20,589 — 359 20,948 27,603
Other4 — — — — — 654 53,522 54,176 54,176
Total assets 28,136 18,744 46,880 117,222 105,688 196,593 404,886 707,167 871,269
At 31 December 2019
Cash and balances at central banks — — — — 49,270 — 5,860 55,130 55,130
Trading and other financial assets at fair value through profit or loss 51 4,834 4,885 — 2,469 — 152,835 155,304 160,189
Derivative financial instruments — — — — — — 26,369 26,369 26,369
Financial assets at amortised cost:
Loans and advances to banks — 1 1 — 1,858 3,851 4,065 9,774 9,775
Loans and advances to customers 40,480 7,109 47,589 133,732 14,087 171,370 128,210 313,667 494,988
Debt securities — 553 553 — 3,200 — 1,791 4,991 5,544
40,480 7,663 48,143 133,732 19,145 175,221 134,066 328,432 510,307
Financial assets at fair value through other comprehensive income — 7,617 7,617 — 16,919 — 556 17,475 25,092
Other4 — — — — — 514 56,292 56,806 56,806
Total assets 40,531 20,114 60,645 133,732 87,803 175,735 375,978 639,516 833,893
1 Assets regarded by the Group to be readily realisable in the normal course of business, to secure funding, meet collateral needs, or be sold to reduce potential future funding requirements, and are not subject to any restrictions on their use for these purposes.
2 Assets where there are no restrictions on their use to secure funding, meet collateral needs, or be sold to reduce potential future funding requirements, but are not readily realisable in the normal course of business in their current form.
3 The following assets are classified as unencumbered - cannot be used: assets held within the Group’s Insurance businesses which are generally held to either back liabilities to policyholders or to support the solvency of the Insurance subsidiaries; assets held within consolidated limited liability partnerships which provide security for the Group’s obligations to its pension schemes; assets segregated in order to meet the Financial Resilience requirements of the PRA’s Supervisory Statement 9/6 ‘Operational Continuity in Resolution’; assets pledged to facilitate the use of intra-day payment and settlement systems; and reverse repos and derivatives balance sheet ledger items.
4 Other comprises: items in the course of collection from banks; investment properties; goodwill; value in-force business; other intangible assets; tangible fixed assets; current tax recoverable; deferred tax assets; retirement benefit assets; investments in joint ventures and associates; assets arising from contracts held with reinsurers and other assets.
The above table sets out the carrying value of the Group’s encumbered and unencumbered assets, separately identifying those that are available to support the Group’s funding needs. The table does not include collateral received by the Group (i.e. from reverse repos) that is not recognised on its balance sheet, the vast majority of which the Group is permitted to repledge.

188 Lloyds Banking Group Annual Report and Accounts 2020
Risk management continued
Capital risk
DefinitionCapital risk is defined as the risk that the Group has a sub-optimal quantity or quality of capital or that capital is inefficiently deployed across the Group.
ExposuresA capital risk exposure arises when the Group has insufficient capital resources to support its strategic objectives and plans, and to meet both regulatory and external stakeholder requirements and expectations. This could arise due to a depletion of the Group’s capital resources as a result of the crystallisation of any of the risks to which it is exposed, or through a significant increase in risk-weighted assets as a result of rule changes or economic deterioration. Alternatively a shortage of capital could arise from an increase in the minimum requirements for capital, leverage or MREL either at Group, Ring-Fenced Bank (RFB) sub-group or regulated entity level. The Group’s capital management approach is focused on maintaining sufficient and appropriate capital resources across all regulated levels of its structure in order to prevent such exposures while optimising value for shareholders.
MeasurementThe Group maintains capital levels across all regulated entities commensurate with a prudent level of solvency to achieve financial resilience and market confidence. To support this, capital risk appetite is calibrated by taking into consideration both an internal view of the amount of capital to hold as well as external regulatory requirements.
The Group measures both its capital requirements and the amount of capital resources it holds to meet those requirements through applying the regulatory framework defined by the Capital Requirements Directive and Regulation (CRD IV), as amended by revisions to the Capital Requirements Directive implemented in December 2020 (CRD V) and by those provisions of the revised Capital Requirements Regulation (CRR II) that came into force in June 2019 and December 2020. The requirements are implemented in the UK by the Prudential Regulation Authority (PRA) and supplemented through additional regulation under the PRA Rulebook. Further details of the regulatory capital and leverage frameworks that the Group is subject to, including the means by which its capital and leverage requirements and capital resources are calculated, will be provided in the Group’s Pillar 3 Report.
During 2020 regulators undertook a series of measures in response to the coronavirus pandemic. This included supportive revisions made to the IFRS 9 transitional arrangements for capital, which the Group applies in full. Over the short to medium-term, these arrangements will provide some stability in capital requirements against the increased provisioning and subsequent volatility connected to the impact of IFRS 9. This is particularly evident from the current application of the arrangements which has seen the significant increase in Stage 1 and Stage 2 expected credit losses during the first half of 2020 partially offset for capital purposes.
The UK left the EU on 31 January 2020 but remained subject to changes to EU capital regulation until the end of the transition period on 31 December 2020. Under temporary transitional powers (TTP) granted to the PRA, EU capital rules that existed on 31 December 2020 will continue to generally apply until 31 March 2022. This is subject to revision following any significant changes introduced by UK regulators, including changes which implement the remaining parts of CRR II that are not yet in force.
The minimum amount of total capital, under Pillar 1 of the regulatory framework, is set at 8 per cent of total risk-weighted assets. At least 4.5 per cent of risk-weighted assets are required to be covered by common equity tier 1 (CET1) capital and at least 6 per cent of risk-weighted assets are required to be covered by tier 1 capital. These minimum Pillar 1 requirements are supplemented by additional minimum requirements under Pillar 2A of the regulatory framework, the aggregate of which is referred to as the Group’s Total Capital Requirement (TCR), and a number of regulatory capital buffers as described below.
Additional minimum requirements under Pillar 2A are set by the PRA as a firm-specific Individual Capital Requirement (ICR) reflecting a point in time estimate, which may change over time, of the minimum amount of capital to cover risks that are not fully covered by Pillar 1, such as credit concentration and operational risk, and those risks not covered at all by Pillar 1, such as pensions and interest rate risk in the banking book (IRRBB). During the year the PRA reduced the Group’s total Pillar 2A capital requirement from c.4.6 per cent to c.3.8 per cent of risk-weighted assets at 31 December 2020, of which c.2.1 per cent of risk-weighted assets must be met by CET1 capital.
This comprised of both the initial reduction applied in the first half of 2020 and a second reduction applied in December 2020 which is designed to reflect the additional resilience from the higher UK countercyclical capital buffer rate which in normal conditions will be set at 2 per cent (currently set at 0 per cent). The latter reduction is currently fully offset at CET1 level by other regulatory capital requirements as at 31 December 2020.
The Group is also required to hold a number of regulatory capital buffers which are required to be met with CET1 capital.
Systemic buffers are designed to hold systemically important banks to higher capital standards, so that they can withstand a greater level of stress before requiring resolution.
Although the Group is not currently classified as a global systemically important institution (G-SII) under the Capital Requirements Directive, it has been classified as an ‘other’ systemically important institution (O-SII) by the PRA.
The O-SII buffer (formerly referred to as the systemic risk buffer) applies to the Group's RFB sub-group and is currently set at 2.0 per cent of the RFB sub-group's risk- weighted assets. The size of the buffer applied to the RFB sub-group is dependent upon the level of its total assets. The O-SII buffer equates to 1.7 per cent of risk-weighted assets at Group level, with the difference reflecting the risk-weighted assets of the Group that are not in the RFB sub-group and for which the O-SII buffer does not therefore apply. It is the PRA’s policy to include this in the Group’s PRA buffer.
The capital conservation buffer (CCB) is a standard buffer of 2.5 per cent of risk-weighted assets designed to provide for losses in the event of stress.
The countercyclical capital buffer (CCYB) is time-varying and is designed to require banks to hold additional capital to remove or reduce the build-up of systemic risk in times of credit boom, providing additional loss absorbing capacity and acting as an incentive for banks to constrain further credit growth. The amount of the buffer is determined by reference to buffer rates applied by the Bank of England’s Financial Policy Committee (FPC) for the individual countries where the Group has relevant credit exposures. The CCYB rate for the UK is currently set at 0 per cent as a result of the measures introduced by UK regulators during the first half of 2020 in response to the coronavirus pandemic. Given the Group’s UK focused business model, the overall countercyclical capital buffer at 31 December 2020 for the Group was around 0 per cent of risk-weighted assets. In December 2020, the FPC confirmed that it expects the UK CCYB rate to remain at 0 per cent until at least Q4 2021 and due to the usual 12-month implementation lag, any subsequent increase would not take effect until Q4 2022 at the earliest. The FPC also noted that the eventual pace of return to a standard 2 per cent UK CCYB rate will depend on banks’ ability to rebuild capital while continuing to support households and businesses.
As part of the Group's capital planning process, forecast capital positions are subjected to stress testing to determine the adequacy of the Group’s capital resources against minimum requirements, including the ICR. The PRA considers outputs from both the Group’s internal stress tests and Bank of England stress tests, in conjunction with other information, as part of the process for informing the setting of a bank-specific capital buffer for the Group, known as the PRA Buffer. The PRA requires this buffer to remain confidential.
Under previous Bank of England stress tests, the BoE has taken action to avoid an unwarranted de facto increase in capital requirements that could result from the interaction of IFRS 9. The stress hurdle rates for banks participating in past exercises were adjusted to recognise the additional resilience provided by the earlier provisions taken under IFRS 9. A similar approach will be applied for the forthcoming 2021 solvency stress test. The Bank is continuing to work on a more enduring treatment of IFRS 9 for the purposes of future stress tests and will collect additional data during the 2021 solvency stress test to help inform a future approach.
All buffers are required to be met with CET1 capital. Usage of the PRA Buffer would trigger a dialogue between the Group and the PRA to agree what action is required whereas a breach of the combined buffer (all other regulatory buffers, as referenced above) would give rise to mandatory restrictions upon any discretionary capital distributions. As part of the regulatory response to the coronavirus pandemic the PRA has communicated its expectation that banks' capital and liquidity buffers can be drawn down as necessary to support the real economy through the shock and that sufficient time will be made available to restore buffers in a gradual manner.
In addition to the risk-based capital framework outlined above, the Group is also subject to minimum capital requirements under the UK Leverage Ratio

Strategic rep
ortFinancial results
Governance
Risk managem
entO
ther information
Financial statements
Lloyds Banking Group Annual Report and Accounts 2020 189
Framework. The leverage ratio is calculated by dividing fully loaded tier 1 capital resources by the leverage exposure which is a defined measure of on-balance sheet assets and off-balance sheet items.
The minimum leverage ratio requirement under the UK Leverage Ratio Framework is 3.25 per cent. This is supplemented by a time-varying countercyclical leverage buffer (CCLB) which is determined by multiplying the leverage exposure measure by 35 per cent of the countercyclical capital buffer (CCYB) rate. As at 31 December 2020 the CCLB for the Group was 0 per cent. An additional leverage ratio buffer (ALRB) of 0.7 per cent applies to the RFB sub-group and is determined by multiplying the RFB sub-group leverage exposure measure by 35 per cent of the O-SII buffer. This equates to 0.6 per cent of the total leverage exposure measure at Group level.
At least 75 per cent of the 3.25 per cent minimum leverage ratio requirement as well as 100 per cent of regulatory leverage buffers must be met by CET1 capital.
The leverage ratio framework does not currently give rise to higher regulatory capital requirements for the Group than the risk-based capital framework.
MitigationThe Group has a capital management framework that includes the setting of capital risk appetite and capital planning and stress testing activities. Close monitoring of capital and leverage ratios is undertaken to ensure the Group meets regulatory requirements and risk appetite levels and deploys its capital resources efficiently.
The Group monitors early warning indicators and maintains a Capital Contingency Framework as part of a Recovery Plan which are designed to identify emerging capital concerns at an early stage, so that mitigating actions can be taken, if needed. The Recovery Plan sets out a range of potential mitigating actions that could be taken in response to a stress. For example, the Group is able to accumulate additional capital through the retention of profits over time, which can be enhanced through reducing or cancelling proposed dividend payments and share buybacks, by raising new equity via, for example, a rights issue or debt exchange and by raising additional tier 1 or tier 2 capital securities. The cost and availability of additional capital is dependent upon market conditions and perceptions at the time. This type of activity was demonstrated in Q3 2019 with the cancellation of the remaining share buy-back programme and more recently in Q1 2020 with the announcement to cancel the planned 2019 year-end dividend.
The Group is also able to manage the demand for capital through management actions including adjusting its lending strategy, risk hedging strategies and through business disposals.
Capital policies and procedures are well established and subject to independent oversight.
MonitoringThe Group’s capital is actively managed and monitoring capital ratios is a key factor in the Group’s planning processes, which separately cover the RFB sub-group and key individual banking entities. Multi-year base case forecasts of the Group’s capital position, based upon the Group’s operating plan, are produced at least annually to inform the Group’s capital plan whilst shorter term forecasts are more frequently undertaken to understand and respond to variations of the Group’s actual performance against the plan. This has been a particular focus recently given the significant uncertainties caused by the coronavirus pandemic. The Group’s capital plan is tested for capital adequacy using relevant stress scenarios and sensitivities covering adverse economic conditions as well as other adverse factors that could impact the Group.
Regular monitoring of the capital position is undertaken by a range of committees, including Group Capital Risk Committee (GCRC), Group Financial Risk Committee (GFRC), Group and Ring-Fenced Bank Asset and Liability Committee (GALCO), Group Risk Committee (GRC), Board Risk Committee (BRC) and the Board. This includes reporting of actual ratios against forecasts and risk appetite, base case and stress scenario projected ratios, and review of early warning indicators and assessment against the Capital Contingency Framework.
The regulatory framework within which the Group operates continues to evolve and further detail on this will be provided in the Group’s Pillar 3 report. The Group continues to monitor prudential developments very closely, analysing the potential capital impacts to ensure that, through organic capital generation and management actions, the Group continues to maintain a strong capital position that exceeds both minimum regulatory
requirements and the Group’s risk appetite and is consistent with market expectations.
Target capital ratiosThe Board’s view of the ongoing level of CET1 capital required by the Group to grow the business, meet regulatory requirements and cover uncertainties continues to be around 12.5 per cent plus a management buffer of around 1 per cent.
This takes into account, amongst other things:
the minimum Pillar 1 CET1 capital requirement of 4.5 per cent of risk-weighted assets
the Group’s Pillar 2A requirement set by the PRA. During the year the PRA reduced the Group’s CET1 Pillar 2A capital requirement from c.2.6 per cent to c.2.1 per cent of risk-weighted assets at 31 December 2020
the CCB requirement of 2.5 per cent of risk-weighted assets
the Group’s current CCYB requirement which is around 0 per cent of risk-weighted assets
the RFB sub-group’s O-SII buffer of 2.0 per cent of risk-weighted assets, which equates to 1.7 per cent of risk-weighted assets at Group level
the Group’s PRA Buffer
Dividend policyFollowing a request made by the PRA to large UK banks in March 2020, the Group suspended the payment of dividends on ordinary shares for the remainder of the year and cancelled the payment of the final dividend for 2019. These actions were undertaken as a precautionary measure to preserve capital as the spread of the coronavirus pandemic led to a UK-wide lockdown, with the potential to create a significant and prolonged downturn.
In December 2020, the PRA announced that dividend payments could recommence, provided that this was subject to a prudent framework for the setting of such distributions. The framework established by the PRA in respect of any distributions for 2020 requires banks to take into account the ongoing economic uncertainties and the need for banks to continue to support the re-build of the UK economy through lending, particularly in the event of a more severe and prolonged downturn. As a result the PRA established a cap on distributions for year end 2020, based on the higher of i) 20 basis points of total risk-weighted assets at 31 December 2020, or ii) 25 per cent of cumulative profits for 2019 and 2020 after deducting prior shareholder distributions covering the two year period.
Given the Group's strong capital position at year end and the regulator's removal of the prohibition on capital distributions, the Board has recommended a final ordinary dividend of 0.57 pence per share, the maximum allowed under the PRA's framework.
In addition the PRA has noted its intent to provide a further update on distributions ahead of the 2021 half-year results for the large UK banks. It is expected that the PRA will take account of the outcome of the first stage of the BoE 2021 solvency stress test exercise in informing its approach to half-year distributions. Ahead of the update banks may accrue for (on an appropriately prudent basis) but not pay out any dividends. The Group will update the market on any potential interim dividend with the half year results, following receipt of this update from the regulator.
The Board remains committed to future capital returns. In 2021, subject to regulatory guidance, the Board intends to grow the dividend from 2020, in line with its progressive and sustainable ordinary dividend policy, and to accrue dividends. As normal, the Board will give due consideration at year end to the size of the final dividend payment based on circumstances at the time.
Surplus capital represents capital over and above the amount management wish to retain to grow the business, meet regulatory requirements and cover uncertainties. The amount of required capital may vary from time to time depending on circumstances and by its nature there can be no guarantee that any return of surplus capital will be made.
The ability of the Group to pay a dividend is also subject to constraints including the availability of distributable reserves, legal and regulatory restrictions and the Group's financial and operating performance.
Distributable reserves are determined as required by the Companies Act 2006 by reference to a company’s individual financial statements. At 31 December 2020 Lloyds Banking Group plc (‘the Company’) had accumulated distributable reserves of approximately £10 billion. Substantially all of the Company’s merger reserve is available for distribution under UK company law as a result of transactions undertaken to recapitalise the Company in 2009.

190 Lloyds Banking Group Annual Report and Accounts 2020
Risk management continued
Lloyds Banking Group plc acts as a holding company which also issues capital and other securities to capitalise and fund the activities of the Group. The profitability of the holding company, and its ability to sustain dividend payments, is therefore dependent upon the continued receipt of dividends and interest from its main operating subsidiaries, including Lloyds Bank plc (the Ring-Fenced Bank), Lloyds Bank Corporate Markets plc (the non-ring-fenced bank), LBG Equity Investments Limited and Scottish Widows Group Limited (the insurance business). The principal operating subsidiary is Lloyds Bank plc which, at 31 December 2020, had a consolidated CET1 capital ratio of 15.5 per cent (31 December 2019: 14.3 per cent). A number of Group subsidiaries, principally those with banking and insurance activities, are subject to regulatory capital requirements which require minimum amounts of capital to be maintained relative to their size and risk. The Group actively manages the capital of its subsidiaries, which includes monitoring the regulatory capital ratios for its banking and insurance subsidiaries and, on a consolidated basis, the RFB sub-group against approved risk appetite levels. The Group operates a formal capital management policy which requires all subsidiary entities, subject to agreement by their governing bodies, to remit surplus capital to their parent companies.
Minimum requirement for own funds and eligible liabilities (MREL)In 2015, the Financial Stability Board established an international standard for the total loss absorbing capacity (TLAC) of global systemically important banks (G-SIBs). The standard, which first applied from 1 January 2019, is designed to enhance the resilience of the global financial system by ensuring that failing G-SIBs have sufficient capital to absorb losses and recapitalise under resolution, whilst continuing to provide critical banking services.
G-SIBs are subject to the framework for the minimum requirements for own funds and eligible liabilities (MREL) that came into force in June 2019 following the implementation of CRR II. The MREL framework reflects the European implementation of the global TLAC standard. The purpose of MREL is to require firms to maintain sufficient own funds and eligible liabilities that are capable of credibly bearing losses or recapitalising a bank whilst in resolution. MREL can be satisfied by a combination of regulatory capital and certain unsecured liabilities (which must be subordinate to a firm’s operating liabilities).
As the Group is not classified as a G-SIB it is not directly subject to the CRR II MREL.
In the UK the Bank of England has implemented MREL through the Banking Act and a statement of policy on MREL (MREL SoP). The Group is subject to these requirements and must therefore maintain a minimum level of MREL resources. The Group operates a single point of entry (SPE) resolution strategy, with Lloyds Banking Group plc as the designated resolution entity.
Applying the Bank of England’s MREL SoP to current minimum capital requirements, the Group’s MREL from 1 January 2020, excluding regulatory capital and leverage buffers, is the higher of 2 times Pillar 1 plus Pillar 2A, equivalent to 19.8 per cent of risk-weighted assets, or 6.5 per cent of the UK leverage ratio exposure measure.
From 1 January 2022 the Group's indicative MREL, excluding regulatory capital and leverage buffers, will increase to the higher of 2 times Pillar 1 plus 2 times Pillar 2A, equivalent to 23.6 per cent of risk-weighted assets, or 6.5 per cent of the UK leverage ratio exposure measure.
In addition, CET1 capital cannot be used to meet both MREL and capital or leverage buffers.
The BoE has commenced a review of the current MREL framework and expects to consult on proposed changes during the year with a view to setting final end-state requirements for 1 January 2022.
Internal MREL also apply to the Group’s material sub-groups and entities, including the RFB sub-group, Lloyds Bank plc, Bank of Scotland plc and Lloyds Bank Corporate Markets plc.
Analysis of capital positionThe Group’s CET1 capital ratio increased to 16.2 per cent after the accrual for ordinary dividends (31 December 2019: 13.8 per cent on a pro forma basis), amounting to a capital build for the year of 242 basis points (263 basis points prior to the accrual for the full year ordinary dividend).
Excluding the impact of the revised capital treatment for intangible software assets of 51 basis points and the reversal of the full year 2019 ordinary dividend accrual of 83 basis points, the capital build for the year prior to the accrual for the current full year ordinary dividend was 129 basis points, reflecting the following:
banking business capital build before impairment charge of 192 basis points, which was largely offset by the impairment charge for the year of 174 basis points
the application of IFRS 9 transitional arrangements for capital, which have provided an in-year benefit amounting to 83 basis points in the form of relief against the impact of the increase in the impairment charge
a net increase of 28 basis points resulting from the reduction in underlying risk-weighted assets and excess expected losses as well as favourable market and other movements, partially offset by pension contributions (equivalent to 46 basis points) made during the year
The accrual for foreseeable dividends reflects the recommended final ordinary dividend of 0.57 pence per share.
Excluding the application of the IFRS 9 transitional arrangements for capital the Group's CET1 capital ratio after ordinary dividends would be 15.0 per cent (31 December 2019: 13.4 per cent on a pro forma basis).
The PRA is consulting on a proposal to reverse the revised capital treatment of intangible software assets (which currently follows EU capital regulations), thereby reinstating the original requirement to deduct in full. Excluding the impact of the revised capital treatment the Group's CET1 capital ratio after ordinary dividends would be 15.7 per cent.
The transitional total capital ratio, after ordinary dividends, increased to 23.3 per cent (31 December 2019: 21.5 per cent on a pro forma basis), largely reflecting the increase in CET 1 capital, offset in part by the reduction in tier 2 capital, the latter reflecting instrument calls, regulatory amortisation and other movements, partially offset by the net outcome of subordinated liability exchange exercises undertaken during the year.
The Group's transitional minimum requirement for own funds and eligible liabilities (MREL), after ordinary dividends, increased to 36.4 per cent (31 December 2019: 32.6 per cent on a pro forma basis), reflecting the increase in transitional total capital and an increase in senior unsecured securities driven by net new issuance.
The UK leverage ratio, after ordinary dividends, increased from 5.2 per cent on a pro forma basis to 5.8 per cent, largely reflecting the increase in the fully loaded tier 1 capital position, partially offset by the increase in the leverage exposure measure reflecting movements in securities financing transactions and off-balance sheet items.
Total capital requirementThe Group's total capital requirement (TCR) as at 31 December 2020, being the aggregate of the Group's Pillar 1 and current Pillar 2A capital requirements, was £23,918 million (31 December 2019: £25,608 million).
Capital resourcesAn analysis of the Group’s capital position as at 31 December 2020 is presented in the following section on both a transitional arrangements basis and a fully loaded basis in respect of legacy capital securities subject to current grandfathering provisions. In addition the Group’s capital position under both bases reflects the application of the separate transitional arrangements for IFRS 9.

Strategic rep
ortFinancial results
Governance
Risk managem
entO
ther information
Financial statements
Lloyds Banking Group Annual Report and Accounts 2020 191
Capital resources (audited)
The table below summarises the consolidated capital position of the Group. The Group’s Pillar 3 Report will provide a comprehensive analysis of the own funds of the Group.
Transitional Fully loaded
At 31 Dec 2020
At 31 Dec 2019
At 31 Dec 2020
At 31 Dec 2019
£m £m £m £m
Common equity tier 1
Shareholders’ equity per balance sheet 43,278 41,697 43,278 41,697
Adjustment to retained earnings for foreseeable dividends (404) (1,586) (404) (1,586)
Deconsolidation adjustments1 2,333 2,337 2,333 2,337
Adjustment for own credit 81 26 81 26
Cash flow hedging reserve (1,629) (1,504) (1,629) (1,504)
Other adjustments3 1,721 247 1,721 247
45,380 41,217 45,380 41,217
less: deductions from common equity tier 1
Goodwill and other intangible assets (3,120) (4,179) (3,120) (4,179)
Prudent valuation adjustment (445) (509) (445) (509)
Excess of expected losses over impairment provisions and value adjustments — (243) — (243)
Removal of defined benefit pension surplus (1,322) (531) (1,322) (531)
Securitisation deductions — (185) — (185)
Significant investments1 (4,109) (4,626) (4,109) (4,626)
Deferred tax assets (3,562) (3,200) (3,562) (3,200)
Common equity tier 1 capital 32,822 27,744 32,822 27,744
Additional tier 1
Other equity instruments 5,881 5,881 5,881 5,881
Preference shares and preferred securities2 2,705 4,127 — —
Transitional limit and other adjustments (1,604) (2,474) — —
6,982 7,534 5,881 5,881
less: deductions from tier 1
Significant investments1 (1,138) (1,286) — —
Total tier 1 capital 38,666 33,992 38,703 33,625
Tier 2
Other subordinated liabilities2 11,556 13,003 11,556 13,003
Deconsolidation of instruments issued by insurance entities1 (1,892) (1,796) (1,892) (1,796)
Adjustments for transitional limit and non-eligible instruments 1,474 2,278 (1,346) (2,204)
Amortisation and other adjustments (1,694) (3,101) (1,694) (3,101)
9,444 10,384 6,624 5,902
less: deductions from tier 2
Significant investments1 (942) (960) (2,080) (2,246)
Total capital resources 47,168 43,416 43,247 37,281
Risk-weighted assets (unaudited) 202,747 203,431 202,747 203,431
Common equity tier 1 capital ratio 16.2% 13.6% 16.2% 13.6%
Tier 1 capital ratio 19.1% 16.7% 19.1% 16.5%
Total capital ratio 23.3% 21.3% 21.3% 18.3%
1 For regulatory capital purposes, the Group’s Insurance business is deconsolidated and replaced by the amount of the Group’s investment in the business. A part of this amount is deducted from capital (via ‘significant investments’ in the table above) and the remaining amount is risk-weighted, forming part of threshold risk-weighted assets.
2 Preference shares, preferred securities and other subordinated liabilities are categorised as subordinated liabilities in the balance sheet.3 Includes an adjustment applied to reserves to reflect the application of the IFRS 9 transitional arrangements for capital.

192 Lloyds Banking Group Annual Report and Accounts 2020
Risk management continued
Movements in capital resourcesThe key difference between the transitional capital calculation as at 31 December 2020 and the fully loaded equivalent is primarily related to capital securities that previously qualified as tier 1 or tier 2 capital, but that do not fully qualify under the regulation, and which can be included in additional tier 1 (AT1) or tier 2 capital (as applicable) up to specified limits which reduce by 10 per cent per annum until 2022. In addition, following revisions to eligibility criteria for capital instruments under CRR II, certain tier 1 capital instruments of the Group that will transition to tier 2 capital by 2022 will cease to qualify as regulatory capital in June 2025. The key movements on a transitional basis are set out in the table below.
Movements in capital resources
Common equity tier 1
Additional tier 1 Tier 2
Total capital
£m £m £m £m
At 31 December 2019 27,744 6,248 9,424 43,416
Banking business profits1 1,538 — — 1,538
Movement in foreseeable dividends2 1,182 — — 1,182
Dividends received from the Insurance business1 250 — — 250
IFRS 9 transitional adjustment to retained earnings 1,529 — — 1,529
Pension movements:
Removal of defined benefit pension surplus (791) — — (791)
Movement through other comprehensive income 113 — — 113
Fair value through other comprehensive income reserve (90) — — (90)
Prudent valuation adjustment 64 — — 64
Deferred tax asset (362) — — (362)
Goodwill and other intangible assets 1,059 — — 1,059
Securitisation deductions 185 — — 185
Excess of expected losses over impairment provisions and value adjustments 243 — — 243
Significant investments 517 148 18 683
Movements in other equity, subordinated liabilities, other tier 2 items and related adjustments — (552) (940) (1,492)
Other movements3 (359) — — (359)
At 31 December 2020 32,822 5,844 8,502 47,168
1 Under the regulatory framework, profits made by Insurance are removed from CET1 capital. However, when dividends are paid to the Group by Insurance these are recognised through CET1 capital. 2 Reflects the accrual for the 2020 full year ordinary dividend and the reversal of the accrual for the 2019 full year ordinary dividend which was cancelled.3 Includes distributions on other equity instruments.
CET1 capital resources have increased by £5,078 million over the year, primarily reflecting:
underlying banking business profits (pre impairment charge) with the impairment charge partially offset through the increase in IFRS 9 transitional relief
the reversal of the brought forward foreseeable dividend accrual following the cancellation of the 2019 full year ordinary dividend
dividends received from the Insurance business following payment of their 2019 full year ordinary dividend
the introduction of the revised capital treatment of intangible software assets
the reduction in excess expected losses following the increase in offsetting IFRS 9 expected credit losses
a reduction in the amount of significant investments deducted from capital as a result of the increase in the underlying capital base
offset in part by pensions contributions made during the year, an increase in deferred tax assets and other movements
AT1 capital resources have reduced by £404 million over the year, primarily reflecting the annual reduction in the transitional limit applied to grandfathered AT1 capital instruments, offset in part by a reduction in the significant investments deduction.
Tier 2 capital resources have reduced by £922 million over the year, largely reflecting instrument calls, regulatory amortisation and other movements, partially offset by the net outcome of subordinated liability exchange exercises undertaken during the year.
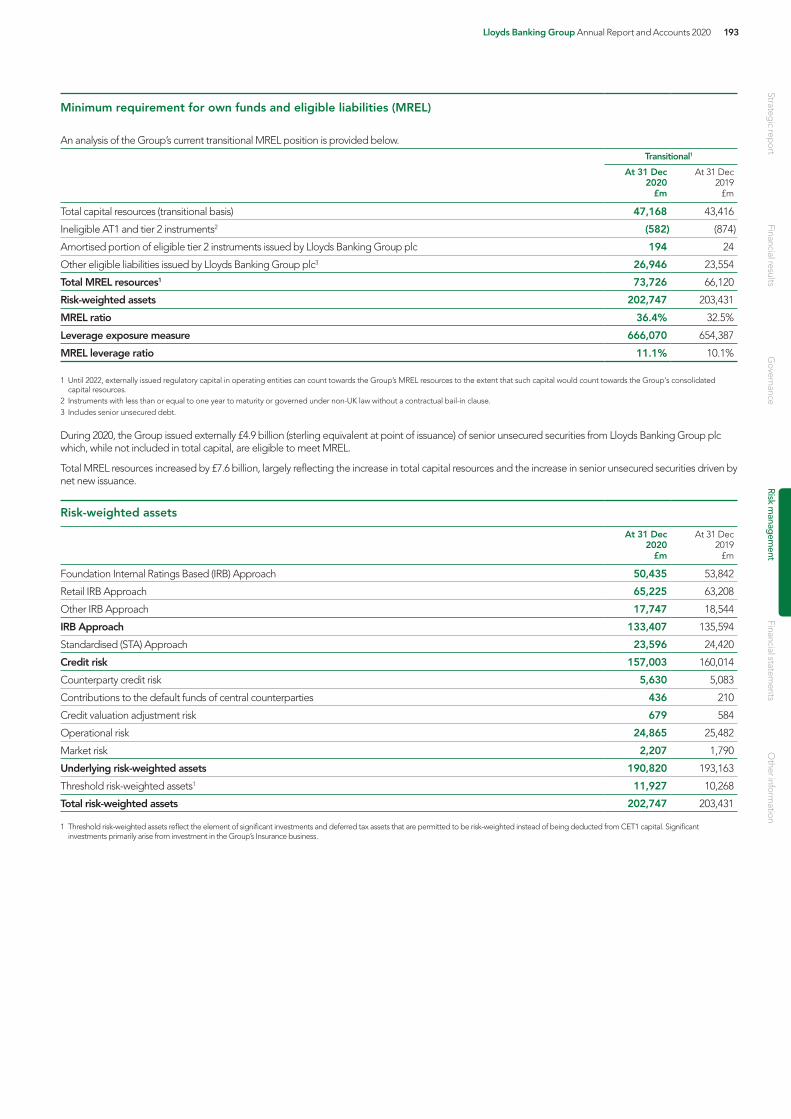
Strategic rep
ortFinancial results
Governance
Risk managem
entO
ther information
Financial statements
Lloyds Banking Group Annual Report and Accounts 2020 193
Minimum requirement for own funds and eligible liabilities (MREL)
An analysis of the Group’s current transitional MREL position is provided below.Transitional1
At 31 Dec 2020
At 31 Dec 2019
£m £m
Total capital resources (transitional basis) 47,168 43,416
Ineligible AT1 and tier 2 instruments2 (582) (874)
Amortised portion of eligible tier 2 instruments issued by Lloyds Banking Group plc 194 24
Other eligible liabilities issued by Lloyds Banking Group plc3 26,946 23,554
Total MREL resources1 73,726 66,120
Risk-weighted assets 202,747 203,431
MREL ratio 36.4% 32.5%
Leverage exposure measure 666,070 654,387
MREL leverage ratio 11.1% 10.1%
1 Until 2022, externally issued regulatory capital in operating entities can count towards the Group’s MREL resources to the extent that such capital would count towards the Group's consolidated capital resources.
2 Instruments with less than or equal to one year to maturity or governed under non-UK law without a contractual bail-in clause.3 Includes senior unsecured debt.
During 2020, the Group issued externally £4.9 billion (sterling equivalent at point of issuance) of senior unsecured securities from Lloyds Banking Group plc which, while not included in total capital, are eligible to meet MREL.
Total MREL resources increased by £7.6 billion, largely reflecting the increase in total capital resources and the increase in senior unsecured securities driven by net new issuance.
Risk-weighted assets
At 31 Dec 2020
At 31 Dec 2019
£m £m
Foundation Internal Ratings Based (IRB) Approach 50,435 53,842
Retail IRB Approach 65,225 63,208
Other IRB Approach 17,747 18,544
IRB Approach 133,407 135,594
Standardised (STA) Approach 23,596 24,420
Credit risk 157,003 160,014
Counterparty credit risk 5,630 5,083
Contributions to the default funds of central counterparties 436 210
Credit valuation adjustment risk 679 584
Operational risk 24,865 25,482
Market risk 2,207 1,790
Underlying risk-weighted assets 190,820 193,163
Threshold risk-weighted assets1 11,927 10,268
Total risk-weighted assets 202,747 203,431
1 Threshold risk-weighted assets reflect the element of significant investments and deferred tax assets that are permitted to be risk-weighted instead of being deducted from CET1 capital. Significant investments primarily arise from investment in the Group’s Insurance business.

194 Lloyds Banking Group Annual Report and Accounts 2020
Risk management continued
Risk-weighted assets movement by key driver
Credit risk IRB
Credit risk STA
Credit risk total1
Counterparty credit risk2
Market risk
Operational risk Total
£m £m £m £m £m £m £m
Total risk-weighted assets as at 31 December 2019 203,431
Less threshold risk-weighted assets3 (10,268)
Risk-weighted assets as at 31 December 2019 135,594 24,420 160,014 5,877 1,790 25,482 193,163
Asset size (8,004) (1,253) (9,257) 754 — — (8,503)
Asset quality 2,665 126 2,791 (232) — — 2,559
Model updates 1,770 — 1,770 — — — 1,770
Methodology and policy 1,445 248 1,693 — — — 1,693
Acquisitions and disposals — — — — — — —
Movements in risk levels (market risk only) — — — — 417 — 417
Foreign exchange movements (63) 55 (8) 346 — — 338
Other — — — — — (617) (617)
Risk-weighted assets as at 31 December 2020 133,407 23,596 157,003 6,745 2,207 24,865 190,820
Threshold risk-weighted assets3 11,927
Risk-weighted assets as at 31 December 2020 202,747
1 Credit risk includes securitisation risk-weighted assets.2 Counterparty credit risk includes movements in contributions to the default funds of central counterparties and movements in credit valuation adjustment risk.3 Threshold risk-weighted assets reflect the element of significant investments and deferred tax assets that are permitted to be risk-weighted instead of being deducted from CET1 capital. Significant
investments primarily arise from investments in the Group’s Insurance business.
The risk-weighted assets movement table provides analysis of the movement in risk-weighted assets in the period by risk type and an insight into the key drivers of the movements. The key driver analysis is compiled on a monthly basis through the identification and categorisation of risk-weighted asset movements and is subject to management judgment.
Credit risk, risk-weighted assets:
Asset size reduction of £9.3 billion includes lower levels of retail unsecured lending and reductions in non-government related commercial lending, together with continued optimisation in Commercial Banking and the exit of equity investments
Asset quality increase of £2.8 billion includes the impact of credit migration and model calibrations, partially offset by the benefit from House Price Index increases during 2020
Model updates increase of £1.8 billion relates to changes to the retail mortgage models
Methodology and policy increase of £1.7 billion reflects the full implementation of the new securitisation framework on 1 January 2020 and the recognition of the revised capital treatment of intangible software assets, partially offset by the impact of revisions to the SME scalar
Counterparty credit risk, risk-weighted assets increased by £0.9 billion due to movements in market rates during the year.
Market risk, risk-weighted assets increased by £0.4bn driven by a modest increase in interest rate risk exposure from a low risk base and COVID-19 related volatility entering the VaR model.
Leverage ratioAnalysis of leverage movementsThe Group’s fully loaded UK leverage ratio increased to 5.8 per cent during the period, primarily driven by the increase in tier 1 capital. The leverage exposure measure increased by £11.7 billion during the period, largely reflecting the increase in the SFT and off-balance sheet exposure measures. Following a direction received from the PRA the Group is permitted to exclude lending under the UK Government’s Bounce Back Loan Scheme (BBLS) from the leverage exposure measure.
The derivatives exposure measure, representing derivative financial instruments per the balance sheet net of deconsolidation and derivatives adjustments, reduced by £2.1 billion during the period, largely as a result of a reduction in the regulatory potential future exposure add-on following trade compressions through central counterparties.
The SFT exposure measure, representing SFT assets per the balance sheet net of deconsolidation and other SFT adjustments, increased by £7.8 billion during the period, primarily reflecting an increase in volumes.
Off-balance sheet items increased by £7.7 billion during the period, largely reflecting new residential mortgage offers placed and an increase in corporate facilities.
The average UK leverage ratio was 5.6 per cent over the quarter, with the actual ratio increasing to 5.8 per cent in the final month of the quarter which largely reflected the increase in tier 1 capital in December following the introduction of the revised capital treatment of intangible software assets.

Strategic rep
ortFinancial results
Governance
Risk managem
entO
ther information
Financial statements
Lloyds Banking Group Annual Report and Accounts 2020 195
Leverage ratio
Fully loaded
At 31 Dec 2020
At 31 Dec 2019
£m £m
Total tier 1 capital for leverage ratio
Common equity tier 1 capital 32,822 27,744
Additional tier 1 capital 5,881 5,881
Total tier 1 capital 38,703 33,625
Exposure measure
Statutory balance sheet assets
Derivative financial instruments 29,613 26,369
Securities financing transactions 74,322 67,424
Loans and advances and other assets 767,334 740,100
Total assets 871,269 833,893
Qualifying central bank claims (67,093) (49,590)
Deconsolidation adjustments1
Derivative financial instruments (1,549) (1,293)
Securities financing transactions — (334)
Loans and advances and other assets (171,183) (167,410)
Total deconsolidation adjustments (172,732) (169,037)
Derivatives adjustments
Adjustments for regulatory netting (12,444) (11,298)
Adjustments for cash collateral (12,679) (12,551)
Net written credit protection 455 458
Regulatory potential future exposure 12,535 16,337
Total derivatives adjustments (12,133) (7,054)
Securities financing transactions adjustments 1,713 1,164
Off-balance sheet items 60,882 53,191
Regulatory deductions and other adjustments3 (15,836) (8,180)
Total exposure measure 666,070 654,387
Average exposure measure2 680,067
UK Leverage ratio 5.8% 5.1%
Average UK leverage ratio2 5.6%
1 Deconsolidation adjustments relate to the deconsolidation of certain Group entities that fall outside the scope of the Group’s regulatory capital consolidation, being primarily the Group’s Insurance business.
2 The average UK leverage ratio is based on the average of the month end tier 1 capital position and average exposure measure over the quarter (1 October 2020 to 31 December 2020). The average of 5.6 per cent compares to 5.6 per cent at the start and 5.8 per cent at the end of the quarter.
3 Includes adjustments to exclude lending under the UK Government’s Bounce Back Loan Scheme (BBLS) and the accelerated implementation for the netting of regular-way purchases and sales awaiting settlement in accordance with CRR Article 500d.
Application of IFRS 9 on a full impact basis for capital and leverage
IFRS 9 full impact
At 31 Dec 2020
At 31 Dec 2019
Common equity tier 1 (£m) 30,341 27,002
Transitional tier 1 (£m) 36,185 33,249
Transitional total capital (£m) 46,052 43,153
Total risk-weighted assets (£m) 201,800 203,083
Common equity tier 1 ratio (%) 15.0% 13.3%
Transitional tier 1 ratio (%) 17.9% 16.4%
Transitional total capital ratio (%) 22.8% 21.2%
UK leverage ratio exposure measure (£m) 663,590 653,643
UK leverage ratio (%) 5.5% 5.0%

196 Lloyds Banking Group Annual Report and Accounts 2020
Risk management continued
The Group applies the full extent of the IFRS 9 transitional arrangements for capital as set out under CRR Article 473a (as amended via the CRR 'Quick Fix' revisions published in June 2020). Specifically, the Group has opted to apply both paragraphs 2 and 4 of CRR Article 473a (static and dynamic relief) and in addition to apply a 100 per cent risk weight to the consequential Standardised credit risk exposure add-back as permitted under paragraph 7a of the revisions.
As at 31 December 2020, static relief under the transitional arrangements amounted to £616 million (31 December 2019: £742 million) and dynamic relief under the transitional arrangements amounted to £1,865 million (31 December 2019: nil) through CET 1 capital.
Stress testingThe Group undertakes a wide-ranging programme of stress testing providing a comprehensive view of the potential impacts arising from the risks to which the Group and its key legal entities are exposed. One of the most important uses of stress testing is to assess the resilience of the operational and strategic plans of the Group and its legal entities to adverse economic conditions and other key vulnerabilities. As part of this programme the Group conducted a macroeconomic stress test of the operating plan in the second half of the year which shows that the Group's capital position is resilient to a further severe economic shock over and above the stress in the current economic environment.
The Group also participates in stress tests run by the Bank of England. The forthcoming 2021 solvency stress test aims to update and refine the desktop analysis undertaken by the Bank during 2020. Though it follows a different approach, it will require the Group to show how resilient it is to a severe economic shock in addition to what has been experienced over 2020 (HPI and CRE values are assumed to fall a further 33 per cent and unemployment peaks at 11.9 per cent).
The Climate Biennial Exploratory Scenario (CBES) is scheduled to launch in June 2021. The Group has invested significant resource to prepare for this, in particular in acquiring climate related data, and will leverage the experience gained through that exercise to further embed climate risk into stress testing activities.
G-SIB indicatorsAlthough the Group is not currently classified as a Global Systemically Important Bank (G-SIB), by virtue of the Group’s leverage exposure measure exceeding €200 billion the Group is required to report G-SIB indicator metrics to the PRA. The Group’s indicator metrics used within the 2020 Basel G-SIBs annual exercise will be disclosed from April 2021 and the results are expected to be made available by the Basel Committee later this year.
Insurance businessesThe business transacted by the insurance companies within the Group comprises both life insurance business and General Insurance business. Life insurance business comprises unit-linked business, non-profit business and with-profits business.
Scottish Widows Limited (SW Ltd) holds the only with-profit fund managed by the Group. Each insurance company within the Group is regulated by the PRA.
The Solvency II regime for insurers and insurance groups came into force from 1 January 2016. The insurance businesses are required to calculate solvency capital requirements and available capital on a risk-based approach. The Insurance business of the Group calculates regulatory capital on the basis of an internal model, which was approved by the PRA on 5 December 2015, with the latest major change to the model approved in November 2020.
The minimum required capital must be maintained at all times throughout the year. These capital requirements and the capital available to meet them are regularly estimated in order to ensure that capital maintenance requirements are being met.
All minimum regulatory requirements of the insurance companies have been met during the year.
Insurance underwriting risk
DefinitionInsurance underwriting risk is defined as the risk of adverse developments in the timing, frequency and severity of claims for insured/underwritten events and in customer behaviour, leading to reductions in earnings and/or value.
ExposuresThe major source of insurance underwriting risk within the Group is the Insurance business.
Longevity and persistency are key risks within the life and pensions business. Longevity risk arises from the annuity portfolios where policyholders’ future cash flows are guaranteed at retirement and increases in life expectancy, beyond current assumptions, will increase the cost of annuities. Longevity risk exposures are expected to increase with the Insurance business growth in the annuity market. Persistency assumptions are set to give a best estimate, however customer behaviour may result in increased cancellations or cessation of contributions.
The Group’s defined benefit pension schemes also expose the Group to longevity risk. For further information please refer to the defined benefit pension schemes component of the market risk section and note 34 to the financial statements.
Property insurance risk is a key risk within the General Insurance business, through Home Insurance. Exposures can arise, for example, in extreme weather conditions such as flooding, when property damage claims are higher than expected.
MeasurementInsurance underwriting risks are measured using a variety of techniques including stress, reverse stress and scenario testing, as well as stochastic modelling. Current and potential future insurance underwriting risk exposures are assessed and aggregated on a range of stresses including risk measures based on 1-in-200 year stresses for the Insurance business' regulatory capital assessments and other supporting measures where appropriate, including those set out in note 31 to the financial statements.
MitigationInsurance underwriting risk in the Insurance business is mitigated in a number of ways:
General Insurance exposure to accumulations of risk and possible catastrophes is mitigated by reinsurance arrangements broadly spread over different reinsurers. Detailed modelling, including that of the potential losses under various catastrophe scenarios, supports the choice of reinsurance arrangements
Insurance processes on underwriting, claims management, pricing and product design
Longevity risk transfer and hedging solutions are considered on a regular basis and since 2017 the Group has reinsured £4.2 billion of annuitant longevity. An established team of longevity and pricing experts supports the annuity proposition
Exposure limits by risk type are assessed through the business planning process and used as a control mechanism to ensure risks are taken within risk appetite
MonitoringInsurance underwriting risks in the Insurance business are monitored by Insurance senior executive committees and ultimately the Insurance Board. Significant risks from the Insurance business and the defined benefit pension schemes are reviewed by the Group Executive and Group Risk Committees and Board.
Insurance underwriting risk exposures within the Insurance business are monitored against risk appetite. The Insurance business monitors experiences against expectations, for example business volumes and mix, claims and persistency experience. The effectiveness of controls put in place to manage insurance underwriting risk is evaluated and significant divergences from experience or movements in risk exposures are investigated and remedial action taken.
Strategic rep
ortFinancial results
Governance
Risk managem
entO
ther information
Financial statements
Lloyds Banking Group Annual Report and Accounts 2020 197
Change/execution risk
DefinitionChange/execution risk is defined as the risk that, in delivering its change agenda, the Group fails to ensure compliance with laws and regulation, maintain effective customer service and availability, and/or operation within the Group’s risk appetite.
ExposuresChange/execution risks arise when the Group undertakes activities which require products, processes, people, systems or controls to change. These changes can be as a result of external drivers (for example, a new piece of regulation that requires the Group to put in place a new process or reporting) and internal drivers (such as the strategic transformation that is outlined in the Group's Strategic Review 2021).
MeasurementThe Group currently measures change/execution risk against a defined risk appetite metric which is a combination of leading, quality and delivery indicators across the investment portfolio. These indicators are reported through defined internal governance structures in the form of a monthly execution risk dashboard. An associated measure, based on the aggregate performance of the dashboard is included in the Group balanced scorecard.
MitigationThe Group takes a range of mitigating actions with respect to change/execution risk. These include the following:
The Board establishes a Group-wide risk appetite and metric for change/execution risk
Ensuring compliance with the Change policy and associated policies and procedures, which set out the principles and key controls that apply across the business and are aligned to the Group risk appetite
Businesses assess the potential impacts of undertaking any change activity on their ability to execute effectively, and the potential consequences for existing business risk profiles
The implementation of effective governance and control frameworks to ensure adequate controls are in place to manage change activity and act to mitigate the change/execution risks identified. These controls are monitored in line with the Change policy and any additional monitoring that is deemed necessary
Events related to change activities are escalated and managed appropriately in line with risk framework guidance
MonitoringChange/execution risks from across the Group are monitored and reported through to Board and Group Governance Committees in accordance with the Group's enterprise risk management framework and aligned to the Group's Strategic Review 2021 activities. Risk exposures are discussed monthly through established governance through to Group Transformation Risk Committee with upwards reporting to Board Risk and Executive Committees. In addition, oversight, challenge and reporting are completed at Risk Division level to provide oversight management of risks and the effectiveness of controls, recommending follow up remedial action if required. All material change/execution risk events are escalated in accordance with the formal Group Operational Risk policy and Change policy.
Conduct risk
DefinitionConduct risk is defined as the risk of customer detriment across the customer lifecycle including: failures in product management, distribution and servicing activities; from other risks materialising, or other activities which could undermine the integrity of the market or distort competition, leading to unfair customer outcomes, regulatory censure, reputational damage or financial loss.
ExposuresThe Group faces significant conduct risks, which affect all aspects of the Group’s operations and all types of customers.
Conduct risks can impact directly or indirectly on the Group's customers and could materialise from a number of areas across the Group, including:
Business and strategic planning that does not sufficiently consider customer needs
Ineffective development, management and monitoring of products, their distribution (including the sales process) and post- sales service (including the management of customers in financial difficulties)
Unclear, unfair, misleading or untimely customer communications
A culture that is not sufficiently customer-centric
Poor governance of colleagues’ incentives and rewards and approval of schemes which drive unfair customer outcomes
Ineffective management and oversight of legacy conduct issues
Ineffective management and resolution of customers’ complaints or claims
Outsourcing of customer service and product delivery to third-parties that do not have the same level of control, oversight and culture as the Group
The risks associated with becoming a more digitised bank
Poor management, governance and control of data
There is a high level of scrutiny regarding financial institutions' treatment of customers, including those in vulnerable circumstances, from regulatory bodies, the media, politicians and consumer groups. The COVID-19 pandemic has magnified existing challenges, and brought new challenges for customers, affecting health, income and relationships. The Group continues to apply significant focus to its treatment of customers in financial difficulties and ensuring fair outcomes.
The Group is also exposed to the risk of engaging in or failing to manage conduct which could constitute market abuse, undermine the integrity of a market in which it is active, distort competition or create conflicts of interest.
There continues to be a significant focus on market misconduct, resulting from previous issues such as London Inter-bank Offered Rate (LIBOR) and foreign exchange (FX).
Due to the level of enhanced focus on conduct, there is a risk that certain aspects of the Group's current or legacy business may be determined by the Financial Conduct Authority, other regulatory bodies or the courts as not being conducted in accordance with applicable laws or regulations, in a manner that fails to deliver fair and reasonable customer treatment, or is inconsistent with market integrity or competition requirements.
The evolving COVID-19 situation means increased uncertainty surrounding the future, which poses the risk that increasingly more customers face difficulties, become vulnerable and/or struggle to manage their existing commitments.

198 Lloyds Banking Group Annual Report and Accounts 2020
Risk management continued
MeasurementTo articulate its conduct risk appetite, the Group has sought more granularity through the use of suitable Conduct Risk Appetite Metrics (CRAMs) and tolerances that indicate where it may be operating outside its conduct risk appetite. These include Board-level conduct risk metrics covering an assessment of overall CRAMs performance, out of appetite CRAMs, Financial Ombudsman Service (FoS) change rates and complaints.
CRAMs have been designed for services and product families offered by the Group and are measured by a consistent set of common metrics. These contain a range of product design, sales and process metrics (including outcome testing outputs) to provide a more holistic view of conduct risks; some products also have a suite of additional bespoke metrics.
Each of the tolerances for the metrics are agreed for the individual product or service and are regularly tracked. At a consolidated level these metrics are part of the Board risk appetite. The Group has, and continues to, evolve its approach to conduct risk measurements, including those supporting customer vulnerability, process delivery and other emerging conduct themes.
MitigationThe Group takes a range of mitigating actions with respect to conduct risk and remains focused on delivering a leading customer experience. The Group’s ongoing commitment to good customer outcomes sets the tone from the top and supports the development of the right customer-centric culture, strengthening links between actions to support conduct, culture and customer and enabling more effective control management. Actions to encourage good conduct include:
Conduct risk appetite established at Group and business area level, with metrics included in the Group risk appetite to ensure ongoing focus
Simplified and enhanced conduct policies and procedures in place to ensure appropriate controls and processes that deliver fair customer outcomes, and support market integrity and competition requirements
Customer needs considered through divisional customer plans, with integral conduct lens, reviewed and challenged by Group Customer First Committee (GCFC)
Cultural transformation: achieving a values-led culture through a focus on behaviours to ensure the Group is transforming its culture for success in a digital world. This is supported by strong direction and tone from senior executives and the Board
Continuous embedding of the customer vulnerability framework aligned with the FCA guidance on fair treatment of vulnerable customers launched in January 2021. Development and continued oversight of the implementation of the vulnerability strategy continues through the Group Customer Vulnerability Committee (GCVC) operating at a senior level to prioritise change, drive implementation and ensure consistency across the Group
Enhanced product governance framework to ensure products continue to offer customers fair value, and consistently meet their needs throughout their product life cycle; reviewed and challenged by Group Product Governance Committee (GPGC)
Enhanced complaints management through effectively responding to, and learning from, root causes of complaint volumes and Financial Ombudsman Service (FOS) change rates
Review and oversight of thematic conduct agenda items at senior committees, ensuring holistic consideration of key Group-wide conduct risks
Robust recruitment and training, with a continued focus on how the Group manages colleagues’ performance with clear customer accountabilities
Ongoing engagement with third-parties involved in serving the Group’s customers to ensure consistent delivery
Monitoring and testing of customer outcomes to ensure the Group delivers fair outcomes for customers throughout the product and service lifecycle, and make continuous improvements to products, services and processes
Continued focus on market conduct and member of the Fixed Income, Currencies and Commodities Markets Standard Board
Adoption of robust change delivery methodology to enable prioritisation and delivery of initiatives to address conduct challenges
Continued focus on proactive identification and mitigation of conduct risk in the Group's Strategic Review 2021
Active engagement with regulatory bodies and other stakeholders to develop understanding of concerns related to customer treatment, effective competition and market integrity, to ensure that the Group’s strategic conduct focus continues to meet evolving stakeholder expectations
Adapting quickly to the evolving COVID-19 situation, being swift to offer the new to market products (BBILs, CBILs) and new regulatory requirements (payment holidays). The Group also continued to support customers in challenging times by adapting support, proactively contacting vulnerable customers, and using insight to understand who may become vulnerable and what their needs could be
MonitoringConduct risk is governed through divisional risk committees and significant issues are escalated to the Group Risk Committee, in accordance with the Group's Enterprise Risk Management Framework, as well as through the monthly Consolidated Risk Report. Risk exposures are discussed at divisional risk committees, where oversight, challenge and reporting are completed to assess the effectiveness controls. Remedial action is recommended, if required. All material conduct risk events are escalated in accordance with the Group Operational Risk policy to the respective divisional Managing Directors and Conduct, Compliance and Operational Risk.
GCFC acts as the guardian of customer experience and has responsibility for monitoring and reviewing plans and actions to improve it, providing oversight of customer outcomes and customer experience and providing challenge to divisions to make changes to support the delivery of the Group's vision and foster a customer-centric culture.
A number of activities support the close monitoring of conduct risk including:
The use of CRAMs across the Group, with a clear escalation route to Board
Second line oversight activities
Horizon Scanning

Strategic rep
ortFinancial results
Governance
Risk managem
entO
ther information
Financial statements
Lloyds Banking Group Annual Report and Accounts 2020 199
Data riskDefinitionData risk is defined as the risk of the Group failing to effectively govern, manage and control its data (including data processed by third party suppliers), leading to unethical decisions, poor customer outcomes, loss of value to the Group and mistrust.
ExposuresData risk is present in all aspects of the business where data is processed, both within the Group and by third parties including colleague and contractor, prospective and existing customer lifecycle and insight processes. Data risk manifests:
When personal data is not gathered legally, for a legitimate purpose, or is not managed or protected from misuse and/or processed in a way that complies with General Data Protection Regulations (GDPR) and other data privacy regulatory obligations
When data quality (accuracy, completeness, consistency, uniqueness, validity and timeliness) is not managed, resulting in data used in systems, processes and products not being fit for the intended purpose
When data records are not created, retained, protected, destroyed, or retrieved appropriately
When data governance fails to provide robust oversight of data decision-making and the control mechanisms to ensure strategies and management instructions are implemented effectively
When data standards are not maintained across core data, data management risks are not managed and data related issues are not remediated as a result of poor data management resulting in inaccurate, incomplete data that is not available at the right time, to the right people, to enable business decisions to be made, and regulatory reporting requirements to be fulfilled
When critical data mapping and data information standards are not followed impacting compliance, traceability and understanding of data
For emerging risks relating to Data, please refer to page 148.
MeasurementData risk is measured through a series of quantitative and qualitative indicators, aligned to key sources of data risk for the Group covering data governance, data management and data privacy and ethics. In addition to risk appetite measures and limits, data risks and controls are monitored and governed through Group and Sub-Group Committees on a monthly basis. Significant issues are escalated to Group Risk Committee.
MitigationData risk is a key component of the Group's enterprise risk management framework, where the focus is on the end to end management of data risk. This ensures that risks are identified, assessed, managed, monitored and reported using the risk and control self-assessment process.
Investment continues to be made to enhance the maturity of data risk management. Examples including:
Delivering a data strategy and data risk and control library to ensure data risks are managed within appetite
Enhancing capability and awareness in data management and privacy
Enhancing assurance of suppliers
Delivering enhanced controls and processes for data retention and destruction, deleting large volumes of historic over-retained data
Embedding data by design and ethics principles into the data science lifecycle and progressing opportunities to simplify the completion of privacy records impact assessments
MonitoringData risk is governed through Group and Sub-Group committees and significant issues are escalated to Group Risk Committee, in accordance with the Group’s enterprise risk management framework. Risk exposures are discussed at Group and Sub-Group committees, where oversight, challenge and reporting are completed to assess the effectiveness of controls and agree remedial actions. All material data risk events are escalated in accordance with the Group Operational Risk policy and Data risk policies and where personal data is concerned, the Group Data Protection Officer. In addition, Group-wide data risk issues and the top data risks that Group faces are discussed at Data Cross Divisional Committee and Group Data Committee.
A number of activities support the close monitoring of data risk including:
Implementation of the data risk and control library to ensure greater coverage and insight of data risk, and ensuring data risks are managed within appetite
Design and monitoring of data risk appetite metrics, including key risk indicators and key performance indicators
Monitoring and reporting of progress against the Data Capability Assessment Model
Monitoring of significant data related issues complaints and breaches
Identification and effective mitigation of data risk when planning and implementing transformation or business change
Implementation of effective controls to mitigate data risk, including data privacy, ethics, data management and records management
Effective monitoring and testing of compliance with data privacy and data management regulatory requirements. For example GDPR and Basel Committee on Banking Supervision (BCBS 239) requirements
Horizon scanning for changes in the external environment, including but not limited to changes to laws, rules and regulations, for example, the UK's exit from the EU and ensuring data flows remain unaffected
Governance risk
DefinitionGovernance risk is defined as the risk that the Group’s organisational infrastructure fails to provide robust oversight of decision-making and the control mechanisms to ensure strategies and management instructions are implemented effectively.
ExposuresThe internal and corporate governance arrangements of major financial institutions continue to be subject to a high level of regulatory and public scrutiny. The Group’s exposure to governance risk is also reflective of the significant volume of existing and proposed legislation and regulation, both within the UK and across the multiple jurisdictions within which it operates, with which it must comply.
MeasurementThe Group’s governance arrangements are assessed against new or proposed legislation and regulation and best practice among peer organisations in order to identify any areas of enhancement required.
MitigationThe Group’s enterprise risk management framework (ERMF) establishes robust arrangements for risk governance, in particular by:
Defining individual and collective accountabilities for risk management, risk oversight and risk assurance through a three lines of defence model which supports the discharge of responsibilities to customers, shareholders and regulators
Outlining governance arrangements which articulate the enterprise-wide approach to risk management
Supporting a consistent approach to Group-wide behaviour and risk decision-making through a Group policy framework which helps everyone understand their responsibilities by clearly articulating and communicating rules, standards, boundaries and risk appetite measures which can be controlled, enforced and monitored
Under the banner of the ERMF, training modules are in place to support all colleagues in understanding and fulfilling their risk responsibilities.
The Group’s Code of Responsibility embodies its values and reflects its commitment to operating responsibly and ethically both at a business and an individual level. All colleagues are required to adhere to the code in all aspects of their roles.
Effective implementation of the ERMF mutually reinforces and is reinforced by the Group’s risk culture, which is embedded in its approach to recruitment, selection, training, performance management and reward.

200 Lloyds Banking Group Annual Report and Accounts 2020
Risk management continued
Operational resilience risk
DefinitionOperational resilience risk is defined as the risk that the Group fails to design resilience into business operations, underlying infrastructure and controls (people, process, technology) so that it is able to withstand external or internal events which could impact the continuation of operations, and fails to respond in a way which meets customer and stakeholder expectations and needs when the continuity of operations is compromised.
ExposuresIneffective operational resilience risk management could lead to vital services not being available to customers, and in extreme circumstances, bank failure could result. The Group has in place a transparent and effective operating model to identify and monitor critical business processes from a customer, Group and financial industry perspective. The failure to adequately build resilience into a critical business process may occur in a variety of ways, including:
The Group being overly reliant on one location to deliver a critical business process
The Group not having an adequate succession plan in place for designated subject matter experts
The Group being overly reliant on a supplier which fails to provide a service
A weakness in the Group’s cyber or security defences leaving it vulnerable to an attack
The Group failing to upgrade its IT systems and leaving them vulnerable to failure
Operational resilience and damage to physical assets including: terrorist acts, other acts of war or hostility, geopolitical, pandemic or other such events
Effective operational resilience ensures the Group designs resilience into its systems, is able to withstand and/or recover from a significant unexpected event occurring and can continue to provide services to its customers. A significant outage could result in customers being unable to access accounts or conduct transactions, which as well as presenting significant reputational risk for the Group would negatively impact the Group’s purpose of Helping Britain Prosper. Operational resilience is also an area of continued regulatory and industry focus, similar in importance to financial resilience.
Failure to manage operational resilience effectively could impact the following other risk categories:
Regulatory compliance: non-compliance with new/existing operational resilience regulations, for example, through failure to identify emerging regulation or not embedding regulatory requirements within the Group’s policies, processes and procedures
Operational risk: being unable to safely provide customers with business services
Conduct risk: an operational resilience failure may render the Group liable to fines from the FCA for poor conduct
Market risk: the Group being unable to provide key services could have ramifications for the wider market and could impact share price
People risk
DefinitionPeople risk is defined as the risk that the Group fails to provide an appropriate colleague and customer-centric culture, supported by robust reward and wellbeing policies and processes; effective leadership to manage colleague resources; effective talent and succession management; and robust control to ensure all colleague-related requirements are met.
ExposuresThe Group’s management of material people risks is critical to its capacity to deliver against its strategic objectives, particularly in the context of increasing volumes of organisational, political and external market change and increasing digitisation. The Group is exposed to the following key people risks:
Failure to recruit, develop and retain colleagues, including ineffective management of succession planning or failure to identify appropriate talent pipeline
The increasing digitisation of the business is changing the capability mix required and may impact the Group's ability to attract and retain talent
Senior Managers and Certification Regime (SM&CR) and additional regulatory constraints on remuneration structures may impact the Group’s ability to attract and retain talent
Failure to manage capacity, colleagues having excessive demands placed on them resulting in wellbeing issues and business objectives not being met
Failure to meet all colleague-related legal and regulatory requirements
Ineffective leadership, poor communication, weak performance, inappropriate remuneration policies
Colleague engagement may continue to be challenged by ongoing media attention on culture within the banking sector, conduct and ethical considerations
Inadequately designed people processes that are not resilient to withstand unexpected events
For emerging risks relating to people risk and ways of working, please refer to page 148.
MeasurementPeople risk is measured through a series of quantitative and qualitative indicators, aligned to key sources of people risk for the Group such as succession, retention, colleague engagement and wellbeing. In addition to risk appetite measures and limits, people risks and controls are monitored on a monthly basis via the Group’s risk governance framework and reporting structures.
MitigationThe Group takes many mitigating actions with respect to people risk. Key areas of focus include:
Focusing on leadership and colleague engagement, through delivery of strategies to attract, retain and develop high calibre people together with implementation of rigorous succession planning
Continued focus on the Group’s culture and inclusivity strategy by developing and delivering initiatives that reinforce the appropriate behaviours which generate the best possible long-term outcomes for customers and colleagues
Managing organisational capability and capacity through divisional people strategies to ensure there are the right skills and resources to meet customers’ needs and deliver the Group's strategic plan
Maintaining effective remuneration arrangements to ensure they promote an appropriate culture and colleague behaviours that meet customer needs and regulatory expectations
MonitoringA review of the Group’s ERMF, which includes the status of the Group’s principles and policy framework, and the design and operational effectiveness of key governance committees, is undertaken on an annual basis and the findings are reported to the Group Risk Committee, Board Risk Committee and the Board.
For further information on corporate governance see pages 86 to 97.
Ensuring colleague wellbeing strategies and support are in place to meet colleague needs, and that the skills and capability growth required to build a workforce for the Bank of the Future are achieved
Ensuring compliance with legal and regulatory requirements related to SM&CR, embedding compliant and appropriate colleague behaviours in line with Group policies, values and its people risk priorities
Ongoing consultation with the Group’s recognised unions on changes which impact their members
Reviewing and enhancing people processes to ensure they are fit for purpose and operationally resilient
MonitoringMonitoring and reporting is undertaken at Board, Group, entity and divisional committees. Key people risk metrics are reported and discussed monthly at the Group People Risk Committee with escalation to Group Risk and Executive Committees and the Board where required.
All material people risk events are escalated in accordance with the Group Operational Risk Policy.

Strategic rep
ortFinancial results
Governance
Risk managem
entO
ther information
Financial statements
Lloyds Banking Group Annual Report and Accounts 2020 201
MeasurementOperational resilience risk is managed across the Group through the Group’s enterprise risk management framework and Operational risk policies. The Group’s enterprise risk management framework includes a risk and control self-assessment process, risk impact likelihood matrix, key risk and control indicators, risk appetite, a robust incident management and escalation process, scenario analysis and an operational losses process. Board risk appetite metrics are in place and are well understood. These specific measures are subject to ongoing monitoring and reporting, including a mandatory review of thresholds on at least an annual basis. To strengthen the management of operational resilience risk, the Group mobilised an operational resilience enhancement programme which is designed to focus on end to end resilience and the management of key risks to critical processes.
MitigationThe Group has increased its focus on operational resilience and has updated its operational resilience strategy to reflect changing priorities of both customers and regulators. The Group has carefully considered and provided a response to the publication of the consultation paper by the FCA, PRA and Bank of England (December 2019). Focus will be given to ensure that the Group’s strategy and approach to operational resilience aligns with industry thinking, expectation and anticipated regulatory policy. At the core of its approach to operational resilience are the Group’s critical business processes which drive all activity, including further mapping of the processes to identify any additional resilience requirements such as impact tolerances in the event of a service outage. The Group continues to maintain and develop playbooks that guide its response to a range of interruptions from internal and external threats and tests these through scenario-based testing and exercising.
Strategic Review 2021 considers the changing risk management requirements, adapting the change delivery model to be more agile and develop the people skills and capabilities needed to be a Bank of the Future. The Group continues to review and invest in its control environment to ensure it addresses the risks it faces. Risks are reported and discussed at local governance forums and escalated to executive management and Board as appropriate. The Group employs a range of risk management strategies, including: avoidance, mitigation, transfer (including insurance) and acceptance. Where there is a reliance on third-party suppliers to provide services, the Group’s sourcing policy ensures that outsourcing initiatives follow a defined process including due diligence, risk evaluation and ongoing assurance.
During the COVID-19 pandemic, business continuity plans have proved resilient, with particular attention applied to heightened risks in the supply chain.
Mitigating actions to the principal operational resilience risk are:
Cyber: the threat landscape associated with cyber risk continues to evolve and there is significant regulatory attention on this subject. The Board continues to invest heavily to protect the Group from cyber-attacks. Investment continues to focus on improving the Group’s approach to identity and access management, improving capability to detect and respond to cyber-attacks and improved ability to manage vulnerabilities across the estate. With effect from 1 January 2021, the Group has entered in to a cyber insurance policy, which provides cover for specified information security risks.
IT resilience: the Group continues to optimise its approach to IT and operational resilience by investing in technology improvements and enhancing the resilience of systems that support the Group’s critical business processes, primarily through the technology resilience programme, with independent verification of progress on an annual basis. The Board recognises the role that resilient technology plays in building the UK's preferred financial partner and in maintaining banking services across the wider industry. As such, the Board dedicates considerable time and focus to this subject at both the Board and the Board Risk Committee, and continues to sponsor key investment programmes that enhance resilience.
People: the Group acknowledges the risks associated to the failure to maintain appropriately skilled and available colleagues. The Group continues to optimise its approach to ensure that where applicable, colleagues are capable of supporting a critical business process. Key controls and processes are regularly reported to committee(s) and alignment to the Strategic Review 2021 is closely monitored.
Property: the Group's property portfolio remains a key focus in ensuring resilience requirements are appropriately maintained. Processes are in place
to identify key buildings where a critical business process is performed. Depending on criticality, a number of mitigating controls are in place to manage the risk of severe critical business process disruption. The Group remains committed to investment in the upkeep of the property portfolio, primarily through the Group Property upkeep investment programme.
Sourcing: the threat landscape associated with third-party suppliers and the critical services they provide continues to receive a significant amount of regulatory attention. The Group acknowledges the importance of demonstrating control and responsibility for those critical business services which could cause significant harm to the Group's customers.
MonitoringMonitoring and reporting of operational resilience risk is undertaken at Board, Group, entity and divisional committees. Each committee monitors key risks, control effectiveness, key risk and control indicators, events, operational losses, risk appetite metrics and the results of independent testing conducted by the Risk division and/or Group Internal Audit.
The Group maintains a formal approach to operational resilience risk event escalation, whereby material events are identified, captured and escalated. Root causes are determined, and action plans put in place to ensure an optimum level of control to keep customers and the business safe, reduce costs, and improve efficiency.
Operational risk
DefinitionOperational risk is defined as the risk of loss resulting from inadequate or failed internal processes, people and systems or from external events.
ExposuresThe principal operational risks to the Group which could result in customer detriment, unfair customer outcomes, financial loss, disruption and/or reputational damage are:
A cyber-attack
Failure of IT systems, due to volume of change, and/or aged infrastructure
Internal and/or external fraud or financial crime
Failure to ensure compliance with increasingly complex and detailed regulation including anti-money laundering, anti-bribery, counter-terrorist financing, and financial sanctions and prohibitions laws and regulations
A number of these risks could increase where there is a reliance on third-party suppliers to provide services to the Group or its customers.
MeasurementOperational risk is managed across the Group through an operational risk framework and operational risk policies. The operational risk framework includes a risk and control self-assessment process, risk impact likelihood matrix, key risk and control indicators, risk appetite, a robust operational event management and escalation process, scenario analysis and an operational losses process.
The table below shows high level loss and event trends for the Group using Basel II categories. Based on data captured on the Group’s One Risk and Control Self-Assessment, in 2020 the highest frequency of events occurred in external fraud (73.55 per cent) and execution, delivery and process management (14.14 per cent). Clients, products and business practices accounted for 58.21 per cent of losses by value, driven by legacy issues where impacts materialised in 2020 (excluding PPI).
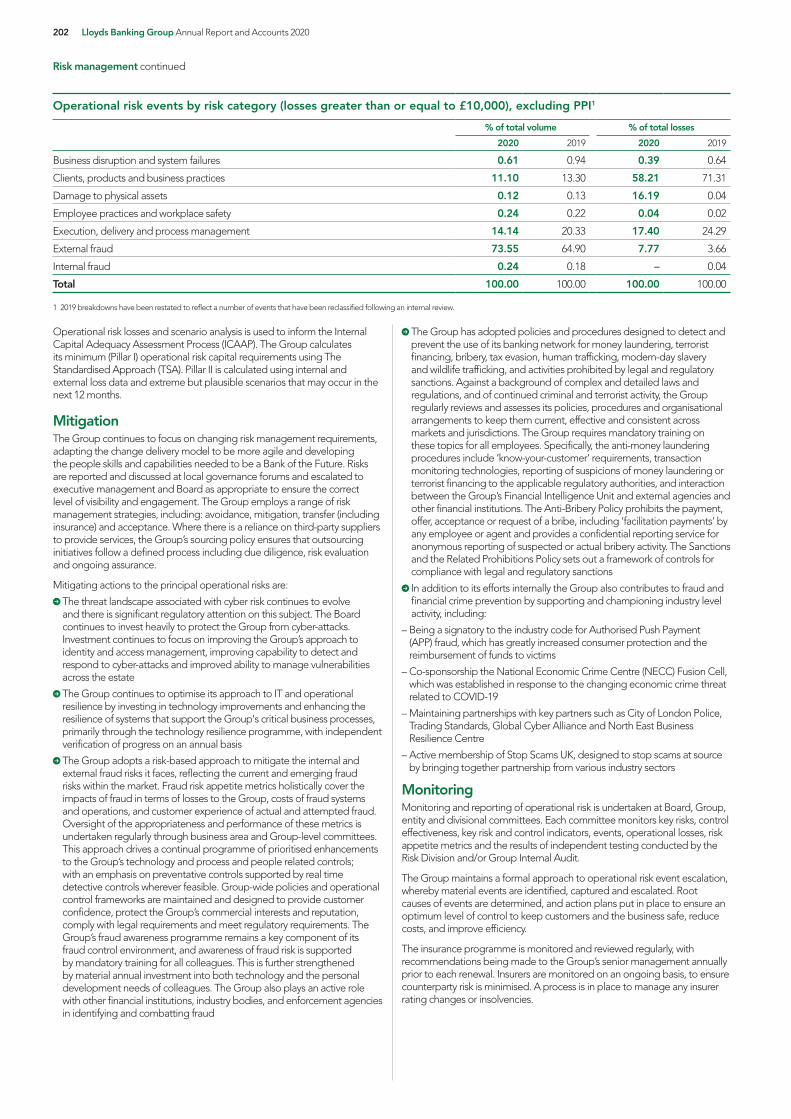
202 Lloyds Banking Group Annual Report and Accounts 2020
Risk management continued
Operational risk losses and scenario analysis is used to inform the Internal Capital Adequacy Assessment Process (ICAAP). The Group calculates its minimum (Pillar I) operational risk capital requirements using The Standardised Approach (TSA). Pillar II is calculated using internal and external loss data and extreme but plausible scenarios that may occur in the next 12 months.
MitigationThe Group continues to focus on changing risk management requirements, adapting the change delivery model to be more agile and developing the people skills and capabilities needed to be a Bank of the Future. Risks are reported and discussed at local governance forums and escalated to executive management and Board as appropriate to ensure the correct level of visibility and engagement. The Group employs a range of risk management strategies, including: avoidance, mitigation, transfer (including insurance) and acceptance. Where there is a reliance on third-party suppliers to provide services, the Group’s sourcing policy ensures that outsourcing initiatives follow a defined process including due diligence, risk evaluation and ongoing assurance.
Mitigating actions to the principal operational risks are:
The threat landscape associated with cyber risk continues to evolve and there is significant regulatory attention on this subject. The Board continues to invest heavily to protect the Group from cyber-attacks. Investment continues to focus on improving the Group’s approach to identity and access management, improving capability to detect and respond to cyber-attacks and improved ability to manage vulnerabilities across the estate
The Group continues to optimise its approach to IT and operational resilience by investing in technology improvements and enhancing the resilience of systems that support the Group's critical business processes, primarily through the technology resilience programme, with independent verification of progress on an annual basis
The Group adopts a risk-based approach to mitigate the internal and external fraud risks it faces, reflecting the current and emerging fraud risks within the market. Fraud risk appetite metrics holistically cover the impacts of fraud in terms of losses to the Group, costs of fraud systems and operations, and customer experience of actual and attempted fraud. Oversight of the appropriateness and performance of these metrics is undertaken regularly through business area and Group-level committees. This approach drives a continual programme of prioritised enhancements to the Group’s technology and process and people related controls; with an emphasis on preventative controls supported by real time detective controls wherever feasible. Group-wide policies and operational control frameworks are maintained and designed to provide customer confidence, protect the Group’s commercial interests and reputation, comply with legal requirements and meet regulatory requirements. The Group’s fraud awareness programme remains a key component of its fraud control environment, and awareness of fraud risk is supported by mandatory training for all colleagues. This is further strengthened by material annual investment into both technology and the personal development needs of colleagues. The Group also plays an active role with other financial institutions, industry bodies, and enforcement agencies in identifying and combatting fraud
The Group has adopted policies and procedures designed to detect and prevent the use of its banking network for money laundering, terrorist financing, bribery, tax evasion, human trafficking, modern-day slavery and wildlife trafficking, and activities prohibited by legal and regulatory sanctions. Against a background of complex and detailed laws and regulations, and of continued criminal and terrorist activity, the Group regularly reviews and assesses its policies, procedures and organisational arrangements to keep them current, effective and consistent across markets and jurisdictions. The Group requires mandatory training on these topics for all employees. Specifically, the anti-money laundering procedures include ‘know-your-customer’ requirements, transaction monitoring technologies, reporting of suspicions of money laundering or terrorist financing to the applicable regulatory authorities, and interaction between the Group’s Financial Intelligence Unit and external agencies and other financial institutions. The Anti-Bribery Policy prohibits the payment, offer, acceptance or request of a bribe, including ‘facilitation payments’ by any employee or agent and provides a confidential reporting service for anonymous reporting of suspected or actual bribery activity. The Sanctions and the Related Prohibitions Policy sets out a framework of controls for compliance with legal and regulatory sanctions
In addition to its efforts internally the Group also contributes to fraud and financial crime prevention by supporting and championing industry level activity, including:
– Being a signatory to the industry code for Authorised Push Payment (APP) fraud, which has greatly increased consumer protection and the reimbursement of funds to victims
– Co-sponsorship the National Economic Crime Centre (NECC) Fusion Cell, which was established in response to the changing economic crime threat related to COVID-19
– Maintaining partnerships with key partners such as City of London Police, Trading Standards, Global Cyber Alliance and North East Business Resilience Centre
– Active membership of Stop Scams UK, designed to stop scams at source by bringing together partnership from various industry sectors
MonitoringMonitoring and reporting of operational risk is undertaken at Board, Group, entity and divisional committees. Each committee monitors key risks, control effectiveness, key risk and control indicators, events, operational losses, risk appetite metrics and the results of independent testing conducted by the Risk Division and/or Group Internal Audit.
The Group maintains a formal approach to operational risk event escalation, whereby material events are identified, captured and escalated. Root causes of events are determined, and action plans put in place to ensure an optimum level of control to keep customers and the business safe, reduce costs, and improve efficiency.
The insurance programme is monitored and reviewed regularly, with recommendations being made to the Group’s senior management annually prior to each renewal. Insurers are monitored on an ongoing basis, to ensure counterparty risk is minimised. A process is in place to manage any insurer rating changes or insolvencies.
Operational risk events by risk category (losses greater than or equal to £10,000), excluding PPI1
% of total volume % of total losses
2020 2019 2020 2019
Business disruption and system failures 0.61 0.94 0.39 0.64
Clients, products and business practices 11.10 13.30 58.21 71.31
Damage to physical assets 0.12 0.13 16.19 0.04
Employee practices and workplace safety 0.24 0.22 0.04 0.02
Execution, delivery and process management 14.14 20.33 17.40 24.29
External fraud 73.55 64.90 7.77 3.66
Internal fraud 0.24 0.18 — 0.04
Total 100.00 100.00 100.00 100.00
1 2019 breakdowns have been restated to reflect a number of events that have been reclassified following an internal review.

Strategic rep
ortFinancial results
Governance
Risk managem
entO
ther information
Financial statements
Lloyds Banking Group Annual Report and Accounts 2020 203
Model risk
DefinitionModel risk is defined as the risk of financial loss, regulatory censure, reputational damage or customer detriment, as a result of deficiencies in the development, application or ongoing operation of models and rating systems.
Models are defined as quantitative methods that process input data into quantitative outputs, or qualitative outputs (including ordinal letter output) which have a quantitative measure associated with them. Model Governance Policy is restricted to specific categories of application of models, principally financial risk, treasury and valuation, with certain exclusions, such as prescribed calculations and project appraisal calculations.
ExposuresThere are over 300 models in the Group performing a variety of functions including:
capital calculation
credit decisioning, including fraud
pricing models
impairment calculation
stress testing and forecasting
market risk measurement
As a result of the wide scope and breadth of coverage, there is exposure to model risk across a number of the Group’s principal risk categories.
Model risk has increased in 2020 due to the nature and uncertainty of the economic outlook, a result of the COVID-19 pandemic. The effect of government-led customer support initiatives have weakened established relationships between model inputs and outputs, reducing the ability to forecast using models alone. While underlying model drivers are expected to remain valid in the longer term, year-end impairment reporting contains a greater element of governed judgement that reflects current conditions.
MeasurementThe Group risk appetite framework is the key component for measuring the Group’s model risk. Reported monthly to the Group Risk Committee and Board, focus is placed on the performance of the Group’s most material models.
MitigationThe model risk management framework, established by and with continued oversight from an independent team in the Risk division, provides the foundation for managing and mitigating model risk within the Group. Accountability is cascaded from the Board and senior management via the Group enterprise risk management framework.
This provides the basis for the Model Governance Policy, which defines the mandatory requirements for models across the Group, including:
the scope of models covered by the policy
model materiality
roles and responsibilities, including ownership, independent oversight and approval
key principles and controls regarding data integrity, development, validation, implementation, ongoing maintenance and revalidation, monitoring, and the process for non-compliance
The model owner takes responsibility for ensuring the fitness for purpose of the models and rating systems, supported and challenged by the independent specialist Group function.
The above ensures all models in scope of policy, including those involved in regulatory capital calculation, are developed consistently and are of sufficient quality to support business decisions and meet regulatory requirements.
MonitoringThe Group Model Governance Committee is the primary body for overseeing model risk. Policy requires that key performance indicators are monitored for every model to ensure they remain fit for purpose and all issues are escalated appropriately. Material model issues are reported to Group and Board Risk Committees monthly with more detailed papers as necessary to focus on key issues.
Regulatory and legal risk
DefinitionRegulatory and legal risk is defined as the risk of financial penalties, regulatory censure, criminal or civil enforcement action or customer detriment as a result of failure to identify, assess, correctly interpret, comply with, or manage regulatory and/or legal requirements.
ExposuresWhilst the Group has a zero risk appetite for material regulatory breaches or material legal incidents, the Group remains exposed to them, driven by significant ongoing and new legislation, regulation and court proceedings in the UK and overseas which in each case needs to be interpreted, implemented and embedded into day-to-day operational and business practices across the Group.
MeasurementRegulatory and legal risks are measured against a defined risk appetite metric, which is an assessment of material regulatory breaches and material legal incidents.
MitigationThe Group undertakes a range of key mitigating actions to manage regulatory and legal risk. These include the following:
The Board has established a Group-wide risk appetite and metric for regulatory and legal risk
Group policies and procedures set out the principles and key controls that should apply across the business which are aligned to the Group risk appetite. Mandated policies and processes require appropriate control frameworks, management information, standards and colleague training to be implemented to identify and manage regulatory and legal risk
Business units identify, assess and implement policy and regulatory requirements and establish local controls, processes, procedures and resources to ensure appropriate governance and compliance
Business units regularly produce management information to assist in the identification of issues and test management controls are working effectively
Risk and Legal departments provide oversight, proactive support and constructive challenge to the business in identifying and managing regulatory and legal issues
Risk department conducts thematic reviews of regulatory compliance and provides oversight of regulatory compliance assessments across businesses and divisions where appropriate
Business units, with the support of divisional and Group-level teams, conduct ongoing horizon scanning to identify and address changes in regulatory and legal requirements
The Group engages with regulatory authorities and industry bodies on forthcoming regulatory changes, market reviews and investigations, ensuring programmes are established to deliver new regulation and legislation
The Group has adapted quickly to evolving regulatory expectations during the COVID-19 pandemic and has engaged with regulatory authorities throughout
MonitoringMaterial risks are managed through the relevant divisional-level committees, with review and escalation through Group level committees where appropriate, including the escalation of any material regulatory breaches or material legal incidents.

204 Lloyds Banking Group Annual Report and Accounts 2020
Risk management continued
Strategic risk
DefinitionStrategic risk is defined as the risk which results from:
Incorrect assumptions about internal or external operating environments
Failure to respond or the inappropriate strategic response to material changes in the external or internal operating environments
Failure to understand the potential impact of strategic responses and business plans on existing risk types
ExposuresThe Group faces significant risks due to the changing regulatory and competitive environments in the financial services sector, with an increased pace, scale and complexity of change. Customers, shareholders and employees expectations continue to evolve and current societal trends are likely to be accelerated by the pandemic.
Strategic risks can manifest themselves in existing principal risks or as new exposures which could adversely impact the Group and its businesses.
In considering strategic risks, a key focus is the interconnectivity of individual risks and the cumulative effect of different risks on the Group’s overall risk profile.
The Group is working actively to implement a robust framework for the identification, assessment and quantification of strategic risks. This framework has been deployed as part of the recent strategic review and is being embedded into the Group's day to day business operations.
Further information on strategic risk drivers and their potential risk implications is outlined in the risk overview on pages 58 and 59.
MeasurementThe Group assesses and monitors strategic risk implications as part of business planning and in its day to day activities, ensuring they respond appropriately to internal and external factors including changes to regulatory, macroeconomic and competitive environments. An assessment is made of the key strategic risks that are considered to impact the Group, leveraging internal and external information and the key mitigants or actions that could be taken in response.
Through 2021, a clear set of strategic risks, mitigants and controls will be embedded to meet divisional, legal entity and Group-wide objectives. The assessment and measurement will be supported by a quantitative risk assessment approach and underpinned by the Group's One Risk and Control Self-Assessment (One RCSA) framework. The Group's quantitative risk assessment will focus specifically on assessing the connectivity of inherent risks, which can magnify their impact and severity.
MitigationThe range of mitigating actions includes:
Horizon scanning is conducted across the Group to identify potential threats, risks, emerging issues, opportunities and explore future trends
The Group’s business planning processes includes formal assessment of the strategic risk implications of new business, product entries and other strategic initiatives
The Group’s governance framework mandates individual's and committee’s responsibilities and decision making rights, to ensure that strategic risks are appropriately reported and escalated
MonitoringA review of the Group’s strategic risks, which includes the risks to the current strategic review and the mitigating actions, is undertaken on an annual basis and the findings are reported to the Group and Board Risk Committees.
Risks, alongside their control effectiveness, are articulated and reported regularly to Group and Board Risk Committees.

2020 CAPTURED BY LLOYDS BANKING GROUP COLLEAGUES
Strategic rep
ortFinancial results
Governance
Risk manag
ement
Other inform
ationFinancial statem
ents Lloyds Banking Group Annual Report and Accounts 2020 205
Financial statements 46. Contingent liabilities, commitments and guarantees 295
47. Structured entities 29748. Financial instruments 29849. Transfers of financial assets 31150. Offsetting of financial assets and
liabilities 31251. Financial risk management 31452. Consolidated cash flow statement 33253. Future accounting developments 334
Parent company balance sheet 335Parent company statement of changes in equity 336Parent company cash flow statement 337
Notes to the parent company financial statements 3381. Basis of preparation and accounting
policies 3382. Financial assets at fair value through
profit or loss 3383. Amounts due from subsidiaries 3384. Share capital, share premium and other
equity instruments 3385. Other reserves 3386. Retained profits 3397. Debt securities in issue 3398. Subordinated liabilities 3399. Financial liabilities at fair value through
profit or loss 33910. Related party transactions 34011. Financial instruments 34112. Other information 342
Independent auditors’ report 206Consolidated income statement 215Consolidated statement of comprehensive income 216Consolidated balance sheet 217Consolidated statement of changes in equity 219Consolidated cash flow statement 222
Notes to the consolidated financial statements 2231. Basis of preparation 2232. Accounting policies 2233. Critical accounting judgements and
estimates 2314. Segmental analysis 2405. Net interest income 2456. Net fee and commission income 2457. Net trading income 2468. Insurance premium income 2469. Other operating income 24710. Insurance claims 24711. Operating expenses 24812. Auditors’ remuneration 24913. Impairment 25014. Tax expense 25215. Earnings per share 25316. Financial assets at fair value through
profit or loss 25317. Derivative financial instruments 254
Martyn Swansborough Kirstene Kettlewell Tony Priceman
Sanka Illangakoon Joel Hamer
Sharon Tyrer Steven Butt
18. Financial assets at amortised cost 25919. Finance lease receivables 26520. Financial assets at fair value through
other comprehensive income 26521. Investments in joint ventures and
associates 26622. Goodwill 26623. Value of in-force business 26724. Other intangible assets 26925. Property, plant and equipment 27026. Other assets 27127. Financial liabilities at fair value
through profit or 27128. Debt securities in issue 27129. Securitisations and covered 27230. Liabilities arising from insurance
contracts and participating investment contracts 273
31. Life insurance sensitivity analysis 27632. Liabilities arising from non-participating
investment contracts 27733. Other liabilities 27734. Retirement benefit obligations 27735. Deferred tax 28336. Other provisions 28437. Subordinated liabilities 28638. Share capital 28739. Share premium account 28740. Other reserves 28841. Retained profits 29042. Other equity instruments 29043. Dividends on ordinary shares 29144. Share-based payments 29145. Related party transactions 294

206 Lloyds Banking Group Annual Report and Accounts 2020
Independent auditors’ report to the members of Lloyds Banking Group plcReport on the audit of the financial statementsOpinionIn our opinion, the financial statements of Lloyds Banking Group plc (the Group) and parent company financial statements (together, the “financial statements”):
– give a true and fair view of the state of the Group’s and of the parent company’s affairs as at 31 December 2020 and of the Group’s profit and the Group’s and parent company’s cash flows for the year then ended; – have been properly prepared in accordance with international accounting standards in conformity with the requirements of the Companies Act 2006; and – have been prepared in accordance with the requirements of the Companies Act 2006.
We have audited the financial statements, included within the Annual Report and Accounts (the “Annual Report”), which comprise: consolidated and parent company balance sheets as at 31 December 2020; the consolidated income statement and the consolidated statement of comprehensive income for the year then ended; the consolidated and parent company cash flow statements for the year then ended; the consolidated and parent company statements of changes in equity for the year then ended; and the notes to the financial statements, which include a description of the significant accounting policies.
Certain required disclosures have been presented elsewhere in the Annual Report, rather than in the notes to the financial statements. These are cross-referenced from the financial statements and are identified as audited.
Our opinion is consistent with our reporting to the Audit Committee.
Separate opinion in relation to international financial reporting standards adopted pursuant to Regulation (EC) No 1606/2002 as it applies in the European UnionAs explained in note 1 to the financial statements, the Group, in addition to applying international accounting standards in conformity with the requirements of the Companies Act 2006, has also applied international financial reporting standards adopted pursuant to Regulation (EC) No 1606/2002 as it applies in the European Union.
In our opinion, the Group financial statements have been properly prepared in accordance with international financial reporting standards adopted pursuant to Regulation (EC) No 1606/2002 as it applies in the European Union.
Separate opinion in relation to IFRSs as issued by the IASBAs explained in note 1 to the financial statements, the Group, in addition to applying international accounting standards in conformity with the requirements of Companies Act 2006, has also applied international financial reporting standards (IFRSs) as issued by the International Accounting Standards Board (IASB).
In our opinion, the financial statements have been properly prepared in accordance with IFRSs as issued by the IASB.
Basis for opinionWe conducted our audit in accordance with International Standards on Auditing (UK) (“ISAs (UK)”) and applicable law. Our responsibilities under ISAs (UK) are further described in the Auditors’ responsibilities for the audit of the financial statements section of our report. We believe that the audit evidence we have obtained is sufficient and appropriate to provide a basis for our opinion.
IndependenceWe remained independent of the Group in accordance with the ethical requirements that are relevant to our audit of the financial statements in the UK, which includes the FRC’s Ethical Standard, as applicable to listed public interest entities, and we have fulfilled our other ethical responsibilities in accordance with these requirements.
To the best of our knowledge and belief, we declare that non-audit services prohibited by the FRC’s Ethical Standard were not provided to the Group.
Other than those disclosed in note 12 to the financial statements, we have provided no non-audit services to the Group in the period under audit.
Our audit approachOverviewAudit scope
– The scope of our audit and the nature, timing and extent of audit procedures performed were determined by our risk assessment, the financial significance of components and other qualitative factors (including history of misstatement through fraud or error). – We performed audit procedures over components considered financially significant in the context of the Group (full scope audit) or in the context of individual primary statement account balances (audit of specific account balances). We performed other procedures including testing entity level controls, information technology general controls and analytical review procedures to address the risk of material misstatement in the residual components above performance materiality.
Key audit matters
– Allowance for Expected Credit Losses (ECL) (Group) – Insurance actuarial assumptions (Group) – Defined benefit obligation (Group) – Valuation of certain level 3 financial instruments (Group) – Hedge accounting (Group) – Privileged access to IT systems (Group and parent) – Impact of COVID-19 (Group and parent)

Strategic rep
ortFinancial results
Governance
Risk manag
ement
Other inform
ationFinancial statem
ents Lloyds Banking Group Annual Report and Accounts 2020 207
Materiality
– Overall Group materiality: £300m (2019: £360m) based on 5 per cent of the four-year average adjusted profit before tax for the financial years ended 31 December 2017, 2018, 2019 and 2020, adjusted to remove the effects of certain items which were considered to have a disproportionate impact. – Overall parent company materiality: £300m (2019: £360m) based on 1 per cent of total assets, but limited to the overall Group materiality. – Performance materiality: £220m (Group and parent company).
The scope of our auditAs part of designing our audit, we determined materiality and assessed the risks of material misstatement in the financial statements.
Capability of the audit in detecting irregularities, including fraudIrregularities, including fraud, are instances of non-compliance with laws and regulations. We design procedures in line with our responsibilities, outlined in the Auditors’ responsibilities for the audit of the financial statements section, to detect material misstatements in respect of irregularities, including fraud. The extent to which our procedures are capable of detecting irregularities, including fraud, is detailed below.
Based on our understanding of the Group and industry, we identified that the principal risks of non-compliance with laws and regulations related to breaches of banking laws and regulations such as, but not limited to, regulations relating to consumer credit and unethical and prohibited business practices, and we considered the extent to which non-compliance might have a material effect on the financial statements. We also considered those laws and regulations that have a direct impact on the preparation of the financial statements such as the Companies Act 2006. We evaluated management’s incentives and opportunities for fraudulent manipulation of the financial statements (including the risk of override of controls), and determined that the principal risks were related to posting manual journal entries to manipulate financial performance, management bias through judgements and assumptions in significant accounting estimates and significant one-off or unusual transactions. The Group engagement team shared this risk assessment with the component auditors so that they could include appropriate audit procedures in response to such risks in their work. Audit procedures performed by the Group engagement team and/or component auditors included:
– Discussions with management and those charged with governance including consideration of known or suspected instances of non-compliance with laws and regulation and fraud. – Evaluation and testing of the operating effectiveness of management’s entity level controls designed to prevent and detect irregularities, in particular their code of conduct and whistleblowing helpline. – Assessment of matters reported on the Group’s whistleblowing helpline and the results of management’s investigation of such matters. – Performing testing over period end adjustments. – Incorporating unpredictability into the nature, timing and/or extent of our testing. – Reviewing key correspondence with the FCA and PRA. – Challenging assumptions and judgements made by management in their significant accounting estimates, in particular in relation to the allowance for ECL; insurance actuarial assumptions; the defined benefit obligation; and the valuation of certain level 3 financial instruments (see related key audit matters below). – Identifying and testing journal entries, in particular any manual journal entries posted by unexpected or unusual users, posted with descriptions indicating a higher level of risk, and posted late with a favourable impact on financial performance.
There are inherent limitations in the audit procedures described above. We are less likely to become aware of instances of non-compliance with laws and regulations that are not closely related to events and transactions reflected in the financial statements. Also, the risk of not detecting a material misstatement due to fraud is higher than the risk of not detecting one resulting from error, as fraud may involve deliberate concealment by, for example, forgery or intentional misrepresentations, or through collusion.
Key audit mattersKey audit matters are those matters that, in the auditors’ professional judgement, were of most significance in the audit of the financial statements of the current period and include the most significant assessed risks of material misstatement (whether or not due to fraud) identified by the auditors, including those which had the greatest effect on: the overall audit strategy; the allocation of resources in the audit; and directing the efforts of the engagement team. These matters, and any comments we make on the results of our procedures thereon, were addressed in the context of our audit of the financial statements as a whole, and in forming our opinion thereon, and we do not provide a separate opinion on these matters.
This is not a complete list of all risks identified by our audit.
The Impact of COVID-19 on the audit is a new key audit matter this year. Payment Protection Insurance (PPI), which was a key audit matter last year, is no longer included because of the significant reduction in the amount and the level of estimation uncertainty of the PPI provision by 31 December 2020. This was a result of the Group processing almost all PPI information requests and complaints. The key audit matter in respect of defined benefit obligations has been extended to include harder to value assets within the pensions asset portfolio. Otherwise, the key audit matters below are consistent with last year.

208 Lloyds Banking Group Annual Report and Accounts 2020
Key audit matter How our audit addressed the key audit matter
Allowance for Expected Credit Losses (ECL) (Group)
Refer to page 102 (Audit Committee report), page 226 (Note 2: Accounting policies), page 231 (Note 3: Critical accounting judgements and estimates) and page 259 (Note 18: Financial assets at amortised cost.
The determination of the allowance for ECL is a judgemental area. A number of judgements and assumptions are outlined in the financial statements, including the definition of significant increases in credit risk, and the application of forward-looking information.
Group economics
The Group’s economics team develops future economic scenarios. The base case economic scenario is determined through the application of judgement. There is a high level of estimation uncertainty in the base case due to the inherent complexity in forecasting future economic outcomes. The impact of COVID-19 on the economy has significantly increased the level of uncertainty in the base case forecasts. A central adjustment to the allowance of ECL of £400 million has been recognised primarily to reflect the level of uncertainty in the conditioning assumptions used to produce the base case.
The outer scenarios are generated and selected through the use of a statistical model that is conditioned on the base case. The four economic scenarios represent distinct parts of the loss distribution which is developed based on historical experience. The scenarios, together with their weightings, are provided to the Retail and Commercial Banking divisions and act as key assumptions for the calculation of the allowance for ECL.
Group economics
We understood management’s process and tested key controls relating to the generation, selection and weighting of economic scenarios. We engaged our internal economic experts and risk modelling specialists to assist us as we evaluated: – The appropriateness of the base case economic scenario, focusing on the key UK economic assumptions (gross domestic product, UK Bank Rate, unemployment rate, house price growth and commercial real estate price growth);
– The approach to the generation and selection of economic scenarios representing the upside, downside and severe downside;
– The Group’s internally developed statistical model, including changes implemented during the year and the Group’s model validation process; and
– The review, challenge and approval of the economic scenarios within the Group’s governance processes.
We found the key controls were designed, implemented and operated effectively, and therefore determined that we could place reliance on these key controls for the purposes of our audit. Where control deficiencies were identified, management identified compensating controls which we tested and were able to place reliance on.We critically assessed the key assumptions adopted in the base case economic scenario by comparing them to our independent view of the economic outlook and market consensus data. We investigated key economic variables outside of our thresholds. We also assessed the risk of bias in the forecasts, as well as the existence of contrary evidence.We independently re-performed the Group’s model and performed testing to evaluate the level of non-linearity captured in the allowance for ECL. We also assessed the appropriateness of the weightings adopted.With respect to the central adjustment of £400m, we evaluated whether the use of a central adjustment was appropriate, the method for measuring the adjustment, the assumptions used in developing the estimate, and assessed the appropriateness of disclosures.Based on the evidence assessed, we found the assumptions to be materially appropriate, and the economic scenarios adopted to reflect an unbiased, probability weighted view, that appropriately captures the impact of non-linearity. We considered that the use of a central adjustment was an appropriate approach.
Retail
The allowance for ECL relating to loans and advances in the Retail division is determined on a collective basis, with the use of impairment models. These models use a number of key assumptions including probability of default, loss given default (including propensity for possession and forced sale discounts for mortgages) and valuation of recoveries. Management also apply judgemental adjustments where they believe the model calculated assumptions and allowances are not appropriate, either due to emerging trends or model limitations. An example of this are adjustments to the impairment model for anticipated increases in account defaults across the portfolio. There has been an increase in adjustments to the modelled ECL in the current year which reflects the fact that the historical data used in the development of the models does not capture conditionsof the COVID-19 pandemic experienced during 2020.Our work therefore focused on the appropriateness of modelling methodologies adopted and significant judgements made in determining adjustments to the modelled ECL as well as the measurement of those adjustments.
Retail
We understood management’s process and evaluated and tested key controls relating to the determination of the allowance for ECL, including controls relating to: – Appropriateness of modelling methodologies and monitoring of model performance;
– Model review and approval;
– The identification of credit impairment events; and
– The review, challenge and approval of the allowances for ECL, including the impairment model outputs, key management judgements and adjustments to modelled ECL applied.
We found key controls that were designed, implemented and operating effectively, and therefore determined that we could place reliance on these key controls for the purposes of our audit. Where control deficiencies were identified, management identified compensating controls which we tested and were able to place reliance on.
We understood and assessed the appropriateness of the impairment models developed and used by management. This included assessing and challenging the appropriateness of key modelling judgements (e.g. criteria used to determine significant increase in credit risk) and quantifying the impact of the use of proxies and simplifications, assessing whether these were appropriate. For selected portfolios, we created our own independent models covering certain parts of the model calculation which enabled us to re-perform management’s calculation and challenge their outputs.
We performed testing over the measurement of the judgemental adjustments to modelled ECLs in place, focusing on the larger adjustments and those which we considered to represent the greatest level of audit risk (e.g. judgements relating to calibration adjustments in respect of payment performance experience in 2020, to past term interest-only exposures and adjustments made to assumptions relating to the probability of accounts defaulting). We assessed the appropriateness of methodologies used to determine and quantify the adjustments required and the reasonableness of key assumptions. Based on our knowledge and understanding of the weaknesses and limitations in management’s models and industry emerging risks, we critically assessed the completeness of the judgemental adjustments proposed by management.
We used credit risk modelling specialists to support the audit team in the performance of these audit procedures.
Based on the evidence assessed, we found the methodologies, modelled assumptions and data used within the allowance for ECL assessment to be materially appropriate and in line with the requirements of IFRS 9.

Strategic rep
ortFinancial results
Governance
Risk manag
ement
Other inform
ationFinancial statem
ents Lloyds Banking Group Annual Report and Accounts 2020 209
Key audit matter How our audit addressed the key audit matter
Commercial Banking
The allowance for ECL relating to ‘good book’ or non-credit impaired loans and advances (referred to as being in Stages 1 and 2) in the Commercial Banking division is determined on a collective basis, with the use of impairment models. These models use a number of key assumptions including probability of default, loss given default and valuation of recoveries. Management also apply judgemental adjustments where they believe the model calculated assumptions and allowances are not appropriate, either due to emerging trends or model limitations. An example of this is adjustments to the impairment model for anticipated increases to account deterioration across the portfolio that have been deferred through the impact of government support schemes. There has been an increase in the use of judgemental adjustments to modelled ECLs in the current year which reflects the fact that the historical data used in the development of the models does not capture all the conditions of the COVID-19 pandemic experienced during 2020.
Our work therefore focused on the appropriateness of modelling methodologies adopted and significant judgements made in determining adjustments as well as the measurement of those adjustments.
The allowance for ECL relating to credit impaired loans and advances (referred to herein also as being in Stage 3) in the Commercial Banking division is primarily estimated on an individual basis. Judgement is required to determine when a loan is considered to be credit impaired, and then to estimate the expected future cash flows related to that loan under multiple weighted scenario outcomes.
Commercial Banking
We understood management’s process and evaluated and tested key controls around the determination of the allowance for ECL. For the Stage 1 and 2 allowance, we focused on:
– The identification and assessment of the completeness and accuracy of critical data applied in the ECL calculation;
– The accuracy and timeliness of updates to credit risk ratings, which are applied in assessing whether loans have suffered a significant increase in credit risk since initial recognition;
– The governance over the ECL determination, including the validation of the ECL methodology, assumptions and inputs, and the annual model performance validation, and;
– The review, challenge and approval processes in place to assess the overall reasonableness of the allowance for ECL, alongside other available credit risk related information within the Group.
For the Stage 3 allowance, we focused on:
– The controls in place for the identification of credit impaired loans and subsequent transfer of these cases to the credit loss assessment team; and
– The review, challenge and approval processes that are in place to assess the overall reasonableness of the allowance for ECL.
We found these key controls were designed, implemented and operated effectively, and therefore determined that we could place reliance on these key controls for the purposes of our audit. Where control deficiencies were identified, management identified compensating controls which we tested and were able to place reliance on.
We performed the following procedures over the Stage 1 and 2 allowance for ECL:
– We critically assessed whether the methodology applied in the calculation is compliant with IFRS 9;
– We tested the formulae applied within the calculation, including the appropriateness, and application of, the quantitative and qualitative criteria used to assess significant increases in credit risk;
– We evaluated the accuracy and timing of the information being used to calculate a borrower’s internal credit risk rating;
– We assessed whether the most recent internal credit risk rating assessment was performed sufficiently timely to incorporate the recent economic environment;
– We critically assessed the impact of identified model limitations and the justification for judgemental adjustments applied by management.
We performed the following procedures to test the completeness of credit impaired assets requiring a Stage 3 allowance for ECL:
– We critically assessed the criteria for determining whether a credit impairment event had occurred; and
– We tested a risk based sample of Stage 1 and 2 loans, utilising industry specialists to support the audit team in identifying sectors or types of borrowers with a heightened risk of weaker financial performance or distress.
For each risk based sample, as well as an additional haphazardly selected sample of Stage 1 and 2 loans, we independently assessed whether there was evidence indicating a credit impairment event (e.g. a customer experiencing significant financial difficulty or in breach of covenant) and therefore whether they were appropriately categorised. Our testing included consideration of events subsequent to the balance sheet date.
Additionally, we selected a sample of borrowers from management’s ‘watchlist’, identified as requiring close credit risk monitoring, but not assessed as credit impaired. We critically assessed the latest information against criteria, as defined by management, for considering whether the borrower is credit impaired, or not.
For a sample of Stage 3 credit impaired loans, we:
– Evaluated the basis on which the allowance was determined, and the evidence supporting the analysis performed by management;
– We independently challenged whether the key assumptions used, such as the recovery strategies, collateral rights and ranges of potential outcomes, were appropriate, given the borrower’s circumstances;
– Re-performed management’s allowance calculation, assessing supporting evidence in relation to key inputs on a case by case basis, that included expected future cash flows, discount rates, valuations of collateral held, and the weightings applied to scenario outcomes; and
– Where relevant, we specifically considered whether valuations were up to date, and consistent with the strategy being followed in respect of the particular borrower and assessed the sensitivity to key assumptions used.
Based on the evidence assessed, we found the methodologies, modelled assumptions and data used within the allowance for ECL assessment to be materially appropriate and in line with the requirements of IFRS 9.

210 Lloyds Banking Group Annual Report and Accounts 2020
Key audit matter How our audit addressed the key audit matter
Insurance actuarial assumptions (Group)
Refer to page 103 (Audit Committee report), page 229 (Note 2: Accounting policies), page 238 (Note 3: Critical accounting judgments and estimates) and pages 247, 267, 273 and 276 (Notes 10, 23, 30 and 31).
The valuations of the Group’s insurance and participating investment contracts (“insurance contract liabilities”) and value of in-force asset are dependent on a number of subjective and complex assumptions about future experience and events, both internal and external to the business. Small changes in some of these assumptions can result in a material impact on the balances within the balance sheet and resulting profit in the period.
In particular, persistency (the retention of policies over time), longevity (the expectation of how long an annuity policyholder will live and how that might change over time), maintenance expenses (future expenses incurred to maintain insurance contracts to maturity), credit default and illiquidity premium (which are adjustments made to the discount rate used in the valuation of the insurance contract liabilities and value of in-force asset). The ongoing COVID-19 pandemic has introduced additional uncertainty to each of the assumptions outlined above
We understood and tested key controls relating to the governance and processes for setting actuarial assumptions. We found these key controls were designed, implemented and operated effectively, and therefore determined that we could place reliance on these key controls for the purposes of our audit.Our actuarial specialists assessed the reasonableness of the actuarial assumptions, including considering and challenging management’s rationale for judgements applied and any reliance placed on industry and publicly available information. Where appropriate, assumptions were benchmarked by comparing to the Group’s peers in the insurance market whilst overlaying an understanding of the specific policy features of the Group’s business.For persistency, we considered the appropriateness of long-term assumptions and associated short term provisions set by management in light of actual experience and regulatory changes. In particular, we considered the impact of the ongoing COVID-19 pandemic on the workplace pensions business and the allowance made for future expected policyholder behaviour.For longevity, we assessed the appropriateness of how the Group’s own experience and industry data were used in setting future assumptions and we compared resulting life expectancies to benchmarking data. We have considered the allowance for socio-economic differences within the longevity basis and the potential impact that the COVID-19 pandemic will have on the future expectation of life on the annuitant portfolio.For maintenance expenses, we assessed the appropriateness of the judgements in respect of costs that are required to administer the long-term insurance contracts and the resulting allocation of costs to product types. We have challenged the treatment of project costs as well as the treatment of Group allocated costs. We assessed the appropriateness of the future per-policy costs assumptions, which are set with reference to the relevant product costs and policy volumes.For credit default and illiquidity premium, we assessed the appropriateness of the methodology against our knowledge and experience with regulatory requirements and industry practice. We challenged whether the change in approach used to calculate the illiquidity premium is market consistent and in line with relevant internal and external accounting policies. We also challenged on the allowance made within the calculation of the illiquidity premium and credit default assumptions for both observed and expected defaults in light of the COVID-19 pandemic.Based on the evidence obtained, we found that the methodologies, assumptions and data used within the models and the calculation of the out of model adjustments to be appropriate.
Defined benefit obligations (Group)
Refer to page 103 (Audit Committee report), page 228 (Note 2: Accounting policies), page 238 (Note 3: Critical accounting judgements and estimates) and page 277 (Note 34: Retirement benefit obligations).
The valuation of the retirement benefit obligations in the Group is determined with reference to various actuarial assumptions including discount rate, rate of inflation and mortality rates. Due to the size of these schemes, small changes in these assumptions can have a material impact on the estimated defined benefit obligation.
Within the pension assets portfolio, the unquoted assets predominantly comprise of Pooled Investment Vehicles (PIVs) valued at £13bn which include harder to value assets. The fair value of these harder to value assets in PIVs is determined based on pricing provided by investment managers.
We understood and tested key controls over the pensions process involving the use of members data, formulation of assumptions and the financial reporting process. We tested the controls for determining the actuarial assumptions and the approval of those assumptions by senior management.We engaged our actuarial experts, met with management and communicated with their actuaries to understand the judgements made in determining key economic assumptions used in the calculation of the liability. In particular, we assessed the reasonableness of the approach taken by management with regard to RPI reform and its implications on the RPI and CPI inflation assumptions.We assessed the reasonableness of these assumptions by comparing to our own independently determined benchmarks and concluded that the assumptions used by management were appropriate.We performed testing over the members data used in calculating the obligation through a combination of substantive testing and consideration of member-related controls at the administrators. Where material, we also considered the treatment of curtailments, settlements, past service costs, remeasurements, benefits paid and any other movement in obligations during the year.From the evidence obtained, we found the data and assumptions used by management in the actuarial valuations for pension obligations to be appropriate. For the valuation of harder to value assets in PIVs, we understood management’s process and evaluated and tested the key controls around monitoring the valuations provided by the investment managers.We found these key controls were designed, implemented and operated effectively, and therefore determined that we could place reliance on these key controls for the purposes of our audit.We obtained pricing confirmations directly from investment managers as primary sources of evidence. We also performed additional procedures to evaluate whether there was any contradictory evidence suggesting that the pricing confirmations did not reflect an appropriate valuation as at the balance sheet date. These procedures included one or more of the following: – Obtaining third party controls assurance reports and bridging letters on the investment managers’ operations for the current financial year;
– Reviewing the pricing of transactions taking place close to the balance sheet date; – Performing back testing of previous valuations provided by investment managers to audited financial statements of the underlying funds;
– Performing an independent web based search for information suggesting any doubts in the investment managers’ capability of pricing; or
– Reviewing investment contributions and distributions between the valuation date and the balance sheet date and obtaining affirmations from investment managers that the price taken is the latest price available to date where the valuation date is different to the balance sheet date.
Based on the evidence obtained, we found the pricing used by management for the valuation of harder to value assets in PIVs to be materially appropriate.
Valuation of certain level 3 financial instruments (Group)
Refer to page 224 (Note 2: Accounting policies), page 239 (Note 3: Critical accounting judgements and estimates) and pages 253, 298 and 314 (Notes 16, 48 and 51).
Within its portfolio of Level 3 financial instruments, the Group holds two loan portfolios (£9.0bn in Insurance, £1.3bn in Commercial Banking) which are each concentrations of similar, non-traded assets. They are classified as Level 3 instruments as their valuation is subjective and determined using bespoke models which rely on a range of unobservable inputs.
We understood management’s process and evaluated and tested the key controls around the financial instruments’ valuation processes including the independent price verification and valuation governance controls.We found these key controls were designed, implemented and operated effectively, and therefore determined that we could place reliance on these key controls for the purposes of our audit.With the support of our valuations specialists, we performed the following further testing: – Evaluated the appropriateness of management’s valuation methodologies, including the impact of COVID-19, and tested their application. For Insurance, this included building an independent model;
– Evaluated and tested key inputs and assumptions, with reference to matters including historic performance, market information and perspectives, servicer and trustee reports and investment prospectuses in Commercial Banking, and market information and credit ratings in Insurance; and
– Assessed the reasonableness of the valuations and performed sensitivity analyses over them.
Based on the evidence obtained, we determined the methodologies, inputs and assumptions to be materially appropriate.

Strategic rep
ortFinancial results
Governance
Risk manag
ement
Other inform
ationFinancial statem
ents Lloyds Banking Group Annual Report and Accounts 2020 211
Key audit matter How our audit addressed the key audit matter
Hedge accounting (Group)
Refer to page 225 (Note 2: Accounting policies) and pages 254 and 314 (Notes 17 and 51).
The Group enters into derivative contracts in order to manage and economically hedge risks such as interest and foreign exchange rate risk. These arrangements create accounting mismatches which are addressed through designating instruments into fair value or cash flow hedge accounting relationships.
Whilst there has been automation of hedging accounting processes in the period, the Group’s application of hedge accounting in the year still relied upon a significant degree of manual processing, which increases the risk of operational errors and hence the risk that financial reporting is not compliant with IFRS requirements.
We understood and tested key controls over the designation and ongoing management of hedge accounting relationships, including those over hedge documentation, hedge effectiveness testing and the recording of hedge accounting adjustments.We found these key controls were designed, implemented and operated effectively, and therefore determined that we could place reliance on these key controls for the purposes of our audit.Our other testing included the following: – Examining selected hedge documentation to assess whether it complies with the requirements of IFRS; – Testing the key year-end reconciliations between underlying source systems and the models used to manage hedging relationships;
– Independently assessing whether management have captured and monitored all material sources of ineffectiveness, including any impact of the interest rate benchmark reform;
– Re-performing a sample of hedge effectiveness calculations; – Re-performing a sample of capacity assessment calculations; and – Testing a sample of manual adjustments posted to record ineffectiveness.
Based on the evidence obtained, we determined the application of hedge accounting to be appropriate.
Privileged access to IT systems (Group and parent)
The Group’s financial reporting processes are reliant on automated processes, controls and data managed by IT systems.
As part of our audit work in prior periods, we identified control matters in relation to the management of IT privileged access to IT platforms supporting a subset of applications in-scope for financial reporting. While there is an ongoing programme of activities to address such control matters across the IT estate, the fact that these were open during the period meant there was a risk that automated functionality, reports or data from the specific systems are not reliable.
For the purposes of our audit, we validate the design, implementation and operating effectiveness of those automated and IT dependent controls that support the in-scope financial statement line items. We also review the supporting IT General Computer Controls (ITGCs) that provide assurance over the effective operation of these controls as well as those controls that manage the integrity of relevant data repositories for the full financial reporting period.
We tested the design and operating effectiveness of those key controls identified that manage IT privileged access across the in-scope IT platforms.
Specifically, we tested foundational controls over:
– Approval, recertification and timely removal of access from IT systems;
– The completeness and accuracy of the Access Controls Lists from IT platforms that are used by downstream IT security processes;
In addition, we tested enhanced controls which act as mitigating controls on any gaps identified in the foundational controls:
– The onboarding and management of IT privileged accounts through the privileged access ‘break-glass tool’ (including static IT privileged accounts); and
– The monitoring of security events on IT platforms by the Security Operations Centre.
As part of our review, we identified a number of entitlements that had not been recertified timely during the period. Consequently we performed an assessment of each of the areas within our audit approach where we place reliance on automated functionality and data within IT systems. In each case we identified a combination of mitigating IT controls, performed targeted audit procedures and assessed other mitigating factors (including business mitigating controls) in order to respond to the impact on our overall audit approach.
Impact of COVID-19 (Group and parent)
The global COVID-19 pandemic, and the associated societal restrictions imposed by the UK Government, have adversely affected the UK population and economy. The virus emerged in the UK in January 2020 and spread quickly, prompting the government to impose widespread restrictions on the population in March 2020, including the first national “lockdown”. Restrictions were eased and re-imposed throughout 2020 and in early 2021, including two further national lockdowns. At the time of issuing this report, the UK remains in its third lockdown.
The UK government has deployed a range of support measures for people and businesses, and the Group has been active in some of these schemes, for example providing payment holidays and in issuing government backed loans.
As at 31 December 2020, two vaccines have received regulatory approval and have begun to be administered to priority groups, such as the elderly. These, and the development of other vaccines, create an expectation that the restrictions will be eased in the foreseeable future. However, there remains significant uncertainty over the successful rollout and efficacy of the vaccines, the future mutation and spread of the virus, the extent and impact of government measures and economic outlook.
The Group has kept most branches open throughout the pandemic, often with reduced hours. The majority of the Group’s other employees have been working remotely since March 2020.
Management has considered the impact of COVID-19 when preparing the financial statements and, where relevant to a key audit matter or other area of this audit report, we have included our considerations therein.
Our planning and execution of our audit has given specific consideration to the impact of COVID-19 on the Group. This has included our materiality decreasing by £60m compared to the previous financial year, due to the reduced profitability of the Group.
In assessing management’s consideration of the impact of COVID-19 on the financial statements, we have undertaken the following procedures:
– In areas where management is required to estimate future financial performance of the Group when preparing the financial statements, we have challenged the forecasts and the extent to which they have been impacted by COVID-19;
– Performed inquiries with management and the Group’s regulators, the PRA and the FCA;
– Assessed the impact of COVID-19 on estimates and the assumptions that underpin them, for example related to expected credit losses and actuarial assumptions as detailed above;
– Reviewed management’s going concern assessment, which considered the potential impact of COVID-19 on future profitability;
– Considered the impact of COVID-19 on the Group’s internal control environment through our audit testing and inquiries of management; and
– Evaluated the adequacy of the disclosures made in the financial statements with respect to the impact of COVID-19.
As a result of these procedures, we concluded that the impact of COVID-19 has been appropriately evaluated and reflected in the preparation of the financial statements.
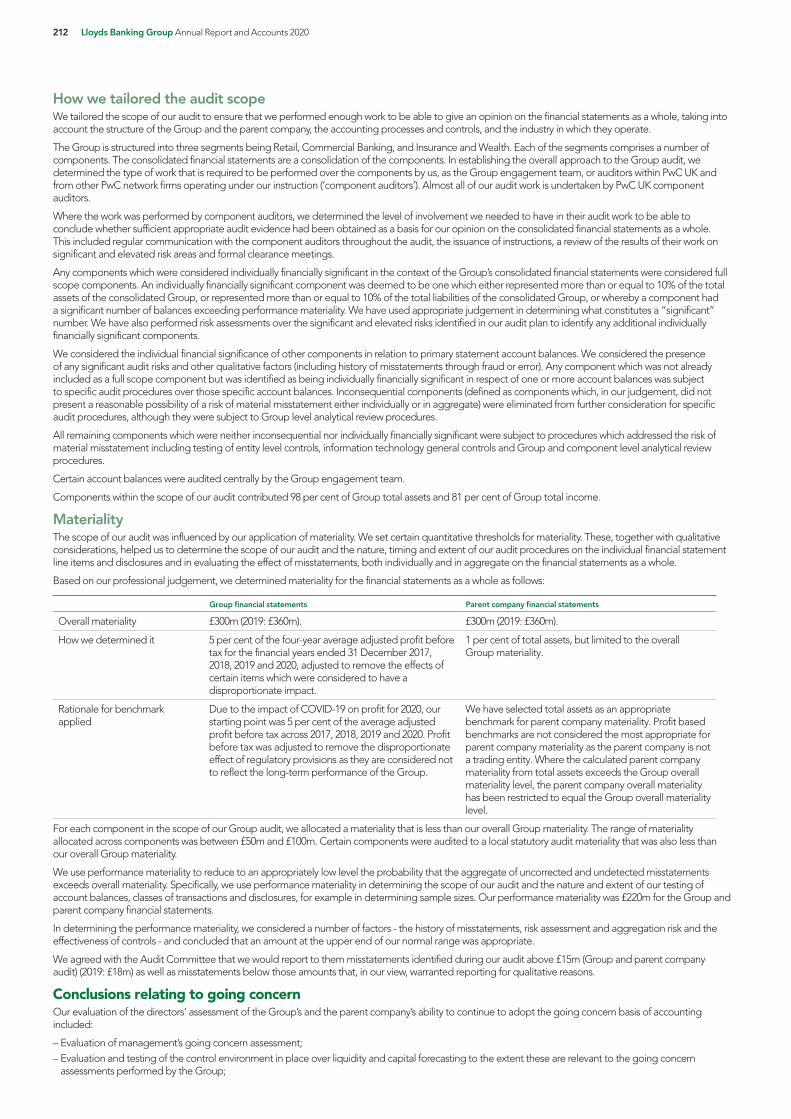
212 Lloyds Banking Group Annual Report and Accounts 2020
How we tailored the audit scopeWe tailored the scope of our audit to ensure that we performed enough work to be able to give an opinion on the financial statements as a whole, taking into account the structure of the Group and the parent company, the accounting processes and controls, and the industry in which they operate.
The Group is structured into three segments being Retail, Commercial Banking, and Insurance and Wealth. Each of the segments comprises a number of components. The consolidated financial statements are a consolidation of the components. In establishing the overall approach to the Group audit, we determined the type of work that is required to be performed over the components by us, as the Group engagement team, or auditors within PwC UK and from other PwC network firms operating under our instruction (‘component auditors’). Almost all of our audit work is undertaken by PwC UK component auditors.
Where the work was performed by component auditors, we determined the level of involvement we needed to have in their audit work to be able to conclude whether sufficient appropriate audit evidence had been obtained as a basis for our opinion on the consolidated financial statements as a whole. This included regular communication with the component auditors throughout the audit, the issuance of instructions, a review of the results of their work on significant and elevated risk areas and formal clearance meetings.
Any components which were considered individually financially significant in the context of the Group’s consolidated financial statements were considered full scope components. An individually financially significant component was deemed to be one which either represented more than or equal to 10% of the total assets of the consolidated Group, or represented more than or equal to 10% of the total liabilities of the consolidated Group, or whereby a component had a significant number of balances exceeding performance materiality. We have used appropriate judgement in determining what constitutes a “significant” number. We have also performed risk assessments over the significant and elevated risks identified in our audit plan to identify any additional individually financially significant components.
We considered the individual financial significance of other components in relation to primary statement account balances. We considered the presence of any significant audit risks and other qualitative factors (including history of misstatements through fraud or error). Any component which was not already included as a full scope component but was identified as being individually financially significant in respect of one or more account balances was subject to specific audit procedures over those specific account balances. Inconsequential components (defined as components which, in our judgement, did not present a reasonable possibility of a risk of material misstatement either individually or in aggregate) were eliminated from further consideration for specific audit procedures, although they were subject to Group level analytical review procedures.
All remaining components which were neither inconsequential nor individually financially significant were subject to procedures which addressed the risk of material misstatement including testing of entity level controls, information technology general controls and Group and component level analytical review procedures.
Certain account balances were audited centrally by the Group engagement team.
Components within the scope of our audit contributed 98 per cent of Group total assets and 81 per cent of Group total income.
MaterialityThe scope of our audit was influenced by our application of materiality. We set certain quantitative thresholds for materiality. These, together with qualitative considerations, helped us to determine the scope of our audit and the nature, timing and extent of our audit procedures on the individual financial statement line items and disclosures and in evaluating the effect of misstatements, both individually and in aggregate on the financial statements as a whole.
Based on our professional judgement, we determined materiality for the financial statements as a whole as follows:
Group financial statements Parent company financial statements
Overall materiality £300m (2019: £360m). £300m (2019: £360m).
How we determined it 5 per cent of the four-year average adjusted profit before tax for the financial years ended 31 December 2017, 2018, 2019 and 2020, adjusted to remove the effects of certain items which were considered to have a disproportionate impact.
1 per cent of total assets, but limited to the overallGroup materiality.
Rationale for benchmark applied
Due to the impact of COVID-19 on profit for 2020, our starting point was 5 per cent of the average adjusted profit before tax across 2017, 2018, 2019 and 2020. Profit before tax was adjusted to remove the disproportionate effect of regulatory provisions as they are considered not to reflect the long-term performance of the Group.
We have selected total assets as an appropriate benchmark for parent company materiality. Profit based benchmarks are not considered the most appropriate for parent company materiality as the parent company is not a trading entity. Where the calculated parent company materiality from total assets exceeds the Group overall materiality level, the parent company overall materiality has been restricted to equal the Group overall materiality level.
For each component in the scope of our Group audit, we allocated a materiality that is less than our overall Group materiality. The range of materiality allocated across components was between £50m and £100m. Certain components were audited to a local statutory audit materiality that was also less than our overall Group materiality.
We use performance materiality to reduce to an appropriately low level the probability that the aggregate of uncorrected and undetected misstatements exceeds overall materiality. Specifically, we use performance materiality in determining the scope of our audit and the nature and extent of our testing of account balances, classes of transactions and disclosures, for example in determining sample sizes. Our performance materiality was £220m for the Group and parent company financial statements.
In determining the performance materiality, we considered a number of factors - the history of misstatements, risk assessment and aggregation risk and the effectiveness of controls - and concluded that an amount at the upper end of our normal range was appropriate.
We agreed with the Audit Committee that we would report to them misstatements identified during our audit above £15m (Group and parent company audit) (2019: £18m) as well as misstatements below those amounts that, in our view, warranted reporting for qualitative reasons.
Conclusions relating to going concernOur evaluation of the directors’ assessment of the Group’s and the parent company’s ability to continue to adopt the going concern basis of accounting included:
– Evaluation of management’s going concern assessment; – Evaluation and testing of the control environment in place over liquidity and capital forecasting to the extent these are relevant to the going concern assessments performed by the Group;

Strategic rep
ortFinancial results
Governance
Risk manag
ement
Other inform
ationFinancial statem
ents Lloyds Banking Group Annual Report and Accounts 2020 213
– Evaluation of stress testing performed by management and consideration of whether the stresses applied are appropriate for assessing going concern; – Evaluation of the Groups forecast financial performance, liquidity and capital positions over the going concern period including an evaluation of the impact of COVID-19 on the financial outlook of the Group; – Review of credit rating agency ratings and actions; and – Substantiation of certain financial resources available to the Group, for example at the Bank of England.
Based on the work we have performed, we have not identified any material uncertainties relating to events or conditions that, individually or collectively, may cast significant doubt on the Group’s and the parent company’s ability to continue as a going concern for a period of at least twelve months from when the financial statements are authorised for issue.
In auditing the financial statements, we have concluded that the directors’ use of the going concern basis of accounting in the preparation of the financial statements is appropriate.
However, because not all future events or conditions can be predicted, this conclusion is not a guarantee as to the Group’s and the parent company’s ability to continue as a going concern.
In relation to the Group’s and the parent company’s reporting on how they have applied the UK Corporate Governance Code, we have nothing material to add or draw attention to in relation to the directors’ statement in the financial statements about whether the directors considered it appropriate to adopt the going concern basis of accounting.
Our responsibilities and the responsibilities of the directors with respect to going concern are described in the relevant sections of this report.
Reporting on other information The other information comprises all of the information in the Annual Report other than the financial statements and our auditors’ report thereon. The directors are responsible for the other information. Our opinion on the financial statements does not cover the other information and, accordingly, we do not express an audit opinion or, except to the extent otherwise explicitly stated in this report, any form of assurance thereon.
In connection with our audit of the financial statements, our responsibility is to read the other information and, in doing so, consider whether the other information is materially inconsistent with the financial statements or our knowledge obtained in the audit, or otherwise appears to be materially misstated. If we identify an apparent material inconsistency or material misstatement, we are required to perform procedures to conclude whether there is a material misstatement of the financial statements or a material misstatement of the other information. If, based on the work we have performed, we conclude that there is a material misstatement of this other information, we are required to report that fact. We have nothing to report based on these responsibilities.
With respect to the Strategic report and Directors’ report, we also considered whether the disclosures required by the UK Companies Act 2006 have been included.
Based on our work undertaken in the course of the audit, the Companies Act 2006 requires us also to report certain opinions and matters as described below.
Strategic report and Directors’ reportIn our opinion, based on the work undertaken in the course of the audit, the information given in the Strategic report and Directors’ report for the year ended 31 December 2020 is consistent with the financial statements and has been prepared in accordance with applicable legal requirements.
In light of the knowledge and understanding of the Group and parent company and their environment obtained in the course of the audit, we did not identify any material misstatements in the Strategic report and Directors’ report.
Directors’ remunerationIn our opinion, the part of the Directors’ remuneration report to be audited has been properly prepared in accordance with the Companies Act 2006.
Corporate governance statementThe Listing Rules require us to review the directors’ statements in relation to going concern, longer-term viability and that part of the corporate governance statement relating to the parent company’s compliance with the provisions of the UK Corporate Governance Code specified for our review. Our additional responsibilities with respect to the corporate governance statement as other information are described in the Reporting on other information section of this report.
Based on the work undertaken as part of our audit, we have concluded that each of the following elements of the corporate governance statement, included within the Annual Report is materially consistent with the financial statements and our knowledge obtained during the audit, and we have nothing material to add or draw attention to in relation to:
– The directors’ confirmation that they have carried out a robust assessment of the emerging and principal risks;
– The disclosures in the Annual Report and Accounts that describe those principal risks, what procedures are in place to identify emerging risks and an explanation of how these are being managed or mitigated;
– The directors’ statement in the financial statements about whether they considered it appropriate to adopt the going concern basis of accounting in preparing them, and their identification of any material uncertainties to the Group’s and parent company’s ability to continue to do so over a period of at least twelve months from the date of approval of the financial statements;
– The directors’ explanation as to their assessment of the Group’s and parent company’s prospects, the period this assessment covers and why the period is appropriate; and
– The directors’ statement as to whether they have a reasonable expectation that the Group and parent company will be able to continue in operation and meet its liabilities as they fall due over the period of its assessment, including any related disclosures drawing attention to any necessary qualifications or assumptions.
Our review of the directors’ statement regarding the longer-term viability of the Group was substantially less in scope than an audit and only consisted of making inquiries and considering the directors’ process supporting their statement; checking that the statement is in alignment with the relevant provisions of the UK Corporate Governance Code; and considering whether the statement is consistent with the financial statements and our knowledge and understanding of the Group and parent company and their environment obtained in the course of the audit.
In addition, based on the work undertaken as part of our audit, we have concluded that each of the following elements of the corporate governance statement is materially consistent with the financial statements and our knowledge obtained during the audit:
– The directors’ statement that they consider the Annual Report, taken as a whole, is fair, balanced and understandable, and provides the information necessary for the members to assess the Group’s and parent company’s position, performance, business model and strategy;
– The section of the Annual Report that describes the review of effectiveness of risk management and internal control systems; and
– The section of the Annual Report describing the work of the Audit Committee.

214 Lloyds Banking Group Annual Report and Accounts 2020
We have nothing to report in respect of our responsibility to report when the directors’ statement relating to the Group and parent company’s compliance with the Code does not properly disclose a departure from a relevant provision of the Code specified under the Listing Rules for review by the auditors.
Responsibilities for the financial statements and the auditResponsibilities of the directors for the financial statementsAs explained more fully in the Statement of directors’ responsibilities, the directors are responsible for the preparation of the financial statements in accordance with the applicable framework and for being satisfied that they give a true and fair view. The directors are also responsible for such internal control as they determine is necessary to enable the preparation of financial statements that are free from material misstatement, whether due to fraud or error.
In preparing the financial statements, the directors are responsible for assessing the Group’s and the parent company’s ability to continue as a going concern, disclosing, as applicable, matters related to going concern and using the going concern basis of accounting unless the directors either intend to liquidate the Group or the parent company or to cease operations, or have no realistic alternative but to do so.
Auditors’ responsibilities for the audit of the financial statementsOur objectives are to obtain reasonable assurance about whether the financial statements as a whole are free from material misstatement, whether due to fraud or error, and to issue an auditors’ report that includes our opinion. Reasonable assurance is a high level of assurance, but is not a guarantee that an audit conducted in accordance with ISAs (UK) will always detect a material misstatement when it exists. Misstatements can arise from fraud or error and are considered material if, individually or in the aggregate, they could reasonably be expected to influence the economic decisions of users taken on the basis of these financial statements.
Our audit testing might include testing complete populations of certain transactions and balances, possibly using data auditing techniques. However, it typically involves selecting a limited number of items for testing, rather than testing complete populations. We will often seek to target particular items for testing based on their size or risk characteristics. In other cases, we will use audit sampling to enable us to draw a conclusion about the population from which the sample is selected.
A further description of our responsibilities for the audit of the financial statements is located on the FRC’s website at: www.frc.org.uk/auditorsresponsibilities. This description forms part of our auditors’ report.
Use of this reportThis report, including the opinions, has been prepared for and only for the parent company’s members as a body in accordance with Chapter 3 of Part 16 of the Companies Act 2006 and for no other purpose. We do not, in giving these opinions, accept or assume responsibility for any other purpose or to any other person to whom this report is shown or into whose hands it may come save where expressly agreed by our prior consent in writing.
Other required reportingCompanies Act 2006 exception reportingUnder the Companies Act 2006 we are required to report to you if, in our opinion:
– we have not obtained all the information and explanations we require for our audit; or – adequate accounting records have not been kept by the parent company, or returns adequate for our audit have not been received from branches not visited by us; or – certain disclosures of directors’ remuneration specified by law are not made; or – the parent company financial statements and the part of the Directors’ remuneration report to be audited are not in agreement with the accounting records and returns.
We have no exceptions to report arising from this responsibility.
AppointmentFollowing the recommendation of the Audit Committee, we were appointed by the members on 21 December 1995 to audit the financial statements for the year ended 31 December 1995 and subsequent financial periods. The period of total uninterrupted engagement is 26 years, covering the years ended 31 December 1995 to 31 December 2020. The audit was tendered in 2014 and we were re-appointed with effect from 1 January 2016. There will be a mandatory rotation for the 2021 audit and we will cease to be auditor of the Group.
Mark Hannam (Senior Statutory Auditor) for and on behalf of PricewaterhouseCoopers LLP Chartered Accountants and Statutory Auditors London 23 February 2021

Strategic rep
ortFinancial results
Governance
Risk manag
ement
Other inform
ationFinancial statem
ents Lloyds Banking Group Annual Report and Accounts 2020 215
Consolidated income statementfor the year ended 31 December
2020 2019 2018Note £ million £ million £ million
Interest income 14,306 16,861 16,349
Interest expense (3,557) (6,681) (2,953)
Net interest income 5 10,749 10,180 13,396
Fee and commission income 2,308 2,756 2,848
Fee and commission expense (1,148) (1,350) (1,386)
Net fee and commission income 6 1,160 1,406 1,462
Net trading income 7 7,220 18,288 (3,876)
Insurance premium income 8 8,615 9,574 9,189
Other operating income 9 1,423 2,908 1,920
Other income 18,418 32,176 8,695
Total income 29,167 42,356 22,091
Insurance claims 10 (14,041) (23,997) (3,465)
Total income, net of insurance claims 15,126 18,359 18,626
Regulatory provisions 36 (464) (2,895) (1,350)
Other operating expenses (9,281) (9,775) (10,379)
Total operating expenses 11 (9,745) (12,670) (11,729)
Impairment 13 (4,155) (1,296) (937)
Profit before tax 1,226 4,393 5,960
Tax credit (expense) 14 161 (1,387) (1,454)
Profit for the year 1,387 3,006 4,506
Profit attributable to ordinary shareholders 865 2,459 3,975
Profit attributable to other equity holders 453 466 433
Profit attributable to equity holders 1,318 2,925 4,408
Profit attributable to non-controlling interests 69 81 98
Profit for the year 1,387 3,006 4,506
Basic earnings per share 15 1.2p 3.5p 5.5p
Diluted earnings per share 15 1.2p 3.4p 5.5p
The accompanying notes are an integral part of the consolidated financial statements.

216 Lloyds Banking Group Annual Report and Accounts 2020
Consolidated statement of comprehensive incomefor the year ended 31 December
2020 2019 2018£ million £ million £ million
Profit for the year 1,387 3,006 4,506
Other comprehensive income
Items that will not subsequently be reclassified to profit or loss:
Post-retirement defined benefit scheme remeasurements:
Remeasurements before tax 138 (1,433) 167
Tax (25) 316 (47)
113 (1,117) 120
Movements in revaluation reserve in respect of equity shares held at fair value through other comprehensive income:
Change in fair value (50) — (97)
Tax (16) 12 22
(66) 12 (75)
Gains and losses attributable to own credit risk:
(Losses) gains before tax (75) (419) 533
Tax 20 113 (144)
(55) (306) 389
Share of other comprehensive income of associates and joint ventures — — 8
Items that may subsequently be reclassified to profit or loss:
Movements in revaluation reserve in respect of debt securities held at fair value through other comprehensive income:
Change in fair value 46 (30) (37)
Income statement transfers in respect of disposals (149) (196) (275)
Income statement transfers in respect of impairment 5 (1) —
Tax 74 71 119
(24) (156) (193)
Movements in cash flow hedging reserve:
Effective portion of changes in fair value taken to other comprehensive income 730 1,209 234
Net income statement transfers (496) (608) (701)
Tax (109) (148) 113
125 453 (354)
Movements in foreign currency translation reserve:
Currency translation differences (tax: £nil) 4 (12) (8)
Transfers to income statement (tax: £nil) 13 — —
17 (12) (8)
Other comprehensive income for the year, net of tax 110 (1,126) (113)
Total comprehensive income for the year 1,497 1,880 4,393
Total comprehensive income attributable to ordinary shareholders 975 1,333 3,862
Total comprehensive income attributable to other equity holders 453 466 433
Total comprehensive income attributable to equity holders 1,428 1,799 4,295
Total comprehensive income attributable to non-controlling interests 69 81 98
Total comprehensive income for the year 1,497 1,880 4,393
The accompanying notes are an integral part of the consolidated financial statements.

Strategic rep
ortFinancial results
Governance
Risk manag
ement
Other inform
ationFinancial statem
ents Lloyds Banking Group Annual Report and Accounts 2020 217
Consolidated balance sheetat 31 December
2020 2019Note £ million £ million
Assets
Cash and balances at central banks 73,257 55,130
Items in the course of collection from banks 299 313
Financial assets at fair value through profit or loss 16 171,626 160,189
Derivative financial instruments 17 29,613 26,369
Loans and advances to banks 10,746 9,775
Loans and advances to customers 498,843 494,988
Debt securities 5,405 5,544
Financial assets at amortised cost 18 514,994 510,307
Financial assets at fair value through other comprehensive income 20 27,603 25,092
Investments in joint ventures and associates 21 296 304
Goodwill 22 2,320 2,324
Value of in-force business 23 5,617 5,558
Other intangible assets 24 4,140 3,808
Property, plant and equipment 25 11,754 13,104
Current tax recoverable 660 7
Deferred tax assets 35 2,741 2,666
Retirement benefit assets 34 1,714 681
Assets arising from contracts held with reinsurers 20,385 23,567
Other assets 26 4,250 4,474
Total assets 871,269 833,893
The accompanying notes are an integral part of the consolidated financial statements.

218 Lloyds Banking Group Annual Report and Accounts 2020
2020 2019Equity and liabilities Note £ million £ million
Liabilities
Deposits from banks 31,465 28,179
Customer deposits 460,068 421,320
Items in course of transmission to banks 306 373
Financial liabilities at fair value through profit or loss 27 22,646 21,486
Derivative financial instruments 17 27,313 25,779
Notes in circulation 1,305 1,079
Debt securities in issue 28 87,397 97,689
Liabilities arising from insurance contracts and participating investment contracts 30 116,060 111,449
Liabilities arising from non-participating investment contracts 32 38,452 37,459
Other liabilities 33 20,347 20,333
Retirement benefit obligations 34 245 257
Current tax liabilities 31 187
Deferred tax liabilities 35 45 44
Other provisions 36 1,915 3,323
Subordinated liabilities 37 14,261 17,130
Total liabilities 821,856 786,087
Equity
Share capital 38 7,084 7,005
Share premium account 39 17,863 17,751
Other reserves 40 13,747 13,695
Retained profits 41 4,584 3,246
Shareholders’ equity 43,278 41,697
Other equity instruments 42 5,906 5,906
Total equity excluding non-controlling interests 49,184 47,603
Non-controlling interests 229 203
Total equity 49,413 47,806
Total equity and liabilities 871,269 833,893
The accompanying notes are an integral part of the consolidated financial statements.
The directors approved the consolidated financial statements on 23 February 2021.
Robin Budenberg António Horta-Osório William ChalmersChair Group Chief Executive Chief Financial Officer

Strategic rep
ortFinancial results
Governance
Risk manag
ement
Other inform
ationFinancial statem
ents Lloyds Banking Group Annual Report and Accounts 2020 219
Consolidated statement of changes in equityfor the year ended 31 December
Attributable to ordinary shareholders
Share capital and
premiumOther
reservesRetained
profits Total
Other equity
instruments
Non- controlling
interests
Total£ million £ million £ million £ million £ million £ million £ million
At 1 January 2020 24,756 13,695 3,246 41,697 5,906 203 47,806
Comprehensive income
Profit for the year — — 865 865 453 69 1,387
Other comprehensive income
Post-retirement defined benefit scheme remeasurements, net of tax — — 113 113 — — 113
Movements in revaluation reserve in respect of financial assets held at fair value through other comprehensive income, net of tax:
Debt securities — (24) — (24) — — (24)
Equity shares — (66) — (66) — — (66)
Gains and losses attributable to own credit risk, net of tax — — (55) (55) — — (55)
Movements in cash flow hedging reserve, net of tax — 125 — 125 — — 125
Currency translation differences (tax: £nil) — 17 — 17 — — 17
Total other comprehensive income — 52 58 110 — — 110
Total comprehensive income1 — 52 923 975 453 69 1,497
Transactions with owners
Dividends (note 43) — — — — — (41) (41)
Distributions on other equity instruments — — — — (453) — (453)
Issue of ordinary shares 191 — — 191 — — 191
Movement in treasury shares — — 293 293 — — 293
Value of employee services:
Share option schemes — — 48 48 — — 48
Other employee award schemes — — 74 74 — — 74
Changes in non-controlling interests — — — — — (2) (2)
Total transactions with owners 191 — 415 606 (453) (43) 110
Realised gains and losses on equity shares held at fair value through other comprehensive income — — — — — — —
At 31 December 2020 24,947 13,747 4,584 43,278 5,906 229 49,413
1 Total comprehensive income attributable to owners of the parent was £1,428 million (2019: £1,799 million; 2018: £4,295 million).
Further details of movements in the Group’s share capital, reserves and other equity instruments are provided in notes 38, 39, 40, 41 and 42.
The accompanying notes are an integral part of the consolidated financial statements.

220 Lloyds Banking Group Annual Report and Accounts 2020
Attributable to ordinary shareholders
Share capital and
premiumOther
reservesRetained
profits Total
Other equity
instruments
Non- controlling
interests
Total£ million £ million £ million £ million £ million £ million £ million
At 1 January 2019 24,835 13,210 5,389 43,434 6,491 274 50,199
Comprehensive income
Profit for the year — — 2,459 2,459 466 81 3,006
Other comprehensive income
Post-retirement defined benefit scheme remeasurements, net of tax — — (1,117) (1,117) — — (1,117)
Movements in revaluation reserve in respect of financial assets held at fair value through other comprehensive income, net of tax:
Debt securities — (156) — (156) — — (156)
Equity shares — 12 — 12 — — 12
Gains and losses attributable to own credit risk, net of tax — — (306) (306) — — (306)
Movements in cash flow hedging reserve, net of tax — 453 — 453 — — 453
Currency translation differences (tax: £nil) — (12) — (12) — — (12)
Total other comprehensive income — 297 (1,423) (1,126) — — (1,126)
Total comprehensive income — 297 1,036 1,333 466 81 1,880
Transactions with owners
Dividends (note 43) — — (2,312) (2,312) — (138) (2,450)
Distributions on other equity instruments — — — — (466) — (466)
Issue of ordinary shares 107 — — 107 — — 107
Share buyback (189) 189 (1,095) (1,095) — — (1,095)
Redemption of preference shares 3 (3) — — — — —
Issue of other equity instruments (note 42) — — (3) (3) 896 — 893
Redemptions of other equity instruments (note 42) — — — — (1,481) — (1,481)
Movement in treasury shares — — (3) (3) — — (3)
Value of employee services:
Share option schemes — — 71 71 — — 71
Other employee award schemes — — 165 165 — — 165
Changes in non-controlling interests — — — — — (14) (14)
Total transactions with owners (79) 186 (3,177) (3,070) (1,051) (152) (4,273)
Realised gains and losses on equity shares held at fair value through other comprehensive income — 2 (2) — — — —
At 31 December 2019 24,756 13,695 3,246 41,697 5,906 203 47,806
The accompanying notes are an integral part of the consolidated financial statements.

Strategic rep
ortFinancial results
Governance
Risk manag
ement
Other inform
ationFinancial statem
ents Lloyds Banking Group Annual Report and Accounts 2020 221
Consolidated statement of changes in equityfor the year ended 31 December
Attributable to ordinary shareholders
Share capital and
premiumOther
reservesRetained
profits Total
Other equity
instruments
Non- controlling
interests
Total£ million £ million £ million £ million £ million £ million £ million
At 1 January 2018 24,831 13,553 3,976 42,360 5,355 237 47,952
Comprehensive income
Profit for the year — — 3,975 3,975 433 98 4,506
Other comprehensive income
Post-retirement defined benefit scheme remeasurements, net of tax — — 120 120 — — 120
Share of other comprehensive income of associates and joint ventures — — 8 8 — — 8
Movements in revaluation reserve in respect of financial assets held at fair value through other comprehensive income, net of tax:
Debt securities — (193) — (193) — — (193)
Equity shares — (75) — (75) — — (75)
Gains and losses attributable to own credit risk, net of tax — — 389 389 — — 389
Movements in cash flow hedging reserve, net of tax — (354) — (354) — — (354)
Currency translation differences (tax: £nil) — (8) — (8) — — (8)
Total other comprehensive income — (630) 517 (113) — — (113)
Total comprehensive income — (630) 4,492 3,862 433 98 4,393
Transactions with owners
Dividends (note 43) — — (2,240) (2,240) — (61) (2,301)
Distributions on other equity instruments — — — — (433) — (433)
Issue of ordinary shares 162 — — 162 — — 162
Share buyback (158) 158 (1,005) (1,005) — — (1,005)
Issue of other equity instruments — — (5) (5) 1,136 — 1,131
Movement in treasury shares — — 40 40 — — 40
Value of employee services:
Share option schemes — — 53 53 — — 53
Other employee award schemes — — 207 207 — — 207
Total transactions with owners 4 158 (2,950) (2,788) 703 (61) (2,146)
Realised gains and losses on equity shares held at fair value through other comprehensive income — 129 (129) — — — —
At 31 December 2018 24,835 13,210 5,389 43,434 6,491 274 50,199
The accompanying notes are an integral part of the consolidated financial statements.

222 Lloyds Banking Group Annual Report and Accounts 2020
Consolidated cash flow statementfor the year ended 31 December
2020 2019 2018Note £ million £ million £ million
Profit before tax 1,226 4,393 5,960
Adjustments for:
Change in operating assets 52(A) (18,650) (11,049) (4,472)
Change in operating liabilities 52(B) 35,737 3,642 (8,673)
Non-cash and other items 52(C) 9,594 15,573 (2,892)
Tax paid (736) (1,278) (1,030)
Net cash provided by (used in) operating activities 27,171 11,281 (11,107)
Cash flows from investing activities
Purchase of financial assets (8,589) (9,730) (12,657)
Proceeds from sale and maturity of financial assets 6,347 9,631 26,806
Purchase of fixed assets (2,901) (3,442) (3,514)
Proceeds from sale of fixed assets 1,146 1,432 1,334
Acquisition of businesses, net of cash acquired 52(E) (3) (21) (49)
Disposal of businesses, net of cash disposed — — 1
Net cash (used in) provided by investing activities (4,000) (2,130) 11,921
Cash flows from financing activities
Dividends paid to ordinary shareholders — (2,312) (2,240)
Distributions on other equity instruments (453) (466) (433)
Dividends paid to non-controlling interests (41) (138) (61)
Interest paid on subordinated liabilities (1,095) (1,178) (1,268)
Proceeds from issue of subordinated liabilities — — 1,729
Proceeds from issue of other equity instruments — 893 1,131
Proceeds from issue of ordinary shares 144 36 102
Share buyback — (1,095) (1,005)
Repayment of subordinated liabilities (3,874) (818) (2,256)
Redemption of other equity instruments — (1,481) —
Net cash used in financing activities (5,319) (6,559) (4,301)
Effects of exchange rate changes on cash and cash equivalents (196) (5) 3
Change in cash and cash equivalents 17,656 2,587 (3,484)
Cash and cash equivalents at beginning of year 57,811 55,224 58,708
Cash and cash equivalents at end of year 52(D) 75,467 57,811 55,224
The accompanying notes are an integral part of the consolidated financial statements.

Strategic rep
ortFinancial results
Governance
Risk manag
ement
Other inform
ationFinancial statem
ents Lloyds Banking Group Annual Report and Accounts 2020 223
Note 1: Basis of preparationThe consolidated financial statements of Lloyds Banking Group plc and its subsidiary undertakings (the Group) comply with international accounting standards in conformity with the requirements of the Companies Act 2006. The financial statements have been prepared in accordance with International Financial Reporting Standards (IFRS). IFRS comprises accounting standards prefixed IFRS issued by the International Accounting Standards Board (IASB) and those prefixed IAS issued by the IASB’s predecessor body as well as interpretations issued by the IFRS Interpretations Committee and its predecessor body. On adoption of IFRS 9 in 2018, the Group elected to continue applying hedge accounting under IAS 39. The financial statements are also compliant with IFRS adopted pursuant to Regulation (EC) No 1606/2002 as it applies in the European Union. The EU endorsed version of IAS 39 Financial Instruments: Recognition and Measurement relaxes some of the hedge accounting requirements; the Group has not taken advantage of this relaxation, and therefore there is no difference in application to the Group between IFRS as adopted by the EU and IFRS as issued by the IASB.
The financial information has been prepared under the historical cost convention, as modified by the revaluation of investment properties, financial assets measured at fair value through other comprehensive income, trading securities and certain other financial assets and liabilities at fair value through profit or loss and all derivative contracts. As stated on page 113, the directors consider that it is appropriate to continue to adopt the going concern basis in preparing the financial statements. In reaching this assessment, the directors have considered the implications of the COVID-19 pandemic upon the Group's performance and projected funding and capital position and have also taken into account the impact of further stress scenarios. On this basis, the directors are satisfied that the Group will maintain adequate levels of funding and capital for the foreseeable future. Further details of the Group's funding and capital position are set out on pages 183 to 196.
Details of those IFRS pronouncements which will be relevant to the Group but which were not effective at 31 December 2020 and which have not been applied in preparing these financial statements are given in note 53.
In 2019 the Group adopted IFRS 16 and amendments to IAS 12 and early-adopted the hedge accounting amendments Interest Rate Benchmark Reform issued by the IASB.
Note 2: Accounting policiesThe Group’s accounting policies are set out below. These accounting policies have been applied consistently.
(A) ConsolidationThe assets, liabilities and results of Group undertakings (including structured entities) are included in the financial statements on the basis of accounts made up to the reporting date. Group undertakings include subsidiaries, associates and joint ventures. Details of the Group’s subsidiaries and related undertakings are given on pages 349 to 354.
(1) SubsidiariesSubsidiaries are entities controlled by the Group. The Group controls an entity when it has power over the entity, is exposed to, or has rights to, variable returns from its involvement with the entity, and has the ability to affect those returns through the exercise of its power. This generally accompanies a shareholding of more than one half of the voting rights although in certain circumstances a holding of less than one half of the voting rights may still result in the ability of the Group to exercise control. The existence and effect of potential voting rights that are currently exercisable or convertible are considered when assessing whether the Group controls another entity. The Group reassesses whether or not it controls an entity if facts and circumstances indicate that there are changes to any of the above elements. Subsidiaries are fully consolidated from the date on which control is transferred to the Group; they are de-consolidated from the date that control ceases.
The Group consolidates collective investment vehicles if its beneficial ownership interests give it substantive rights to remove the external fund manager over the investment activities of the fund. Where a subsidiary of the Group is the fund manager of a collective investment vehicle, the Group considers a number of factors in determining whether it acts as principal, and therefore controls the collective investment vehicle, including: an assessment of the scope of the Group’s decision making authority over the investment vehicle; the rights held by other parties including substantive removal rights without cause over the Group acting as fund manager; the remuneration to which the Group is entitled in its capacity as decision maker; and the Group’s exposure to variable returns from the beneficial interest it holds in the investment vehicle. Consolidation may be appropriate in circumstances where the Group has less than a majority beneficial interest. Where a collective investment vehicle is consolidated the interests of parties other than the Group are reported in other liabilities and the movement in these interests in interest expense.
Structured entities are entities that are designed so that their activities are not governed by way of voting rights. In assessing whether the Group has power over such entities in which it has an interest, the Group considers factors such as the purpose and design of the entity; its practical ability to direct the relevant activities of the entity; the nature of the relationship with the entity; and the size of its exposure to the variability of returns of the entity.
The treatment of transactions with non-controlling interests depends on whether, as a result of the transaction, the Group loses control of the subsidiary. Changes in the parent’s ownership interest in a subsidiary that do not result in a loss of control are accounted for as equity transactions; any difference between the amount by which the non-controlling interests are adjusted and the fair value of the consideration paid or received is recognised directly in equity and attributed to the owners of the parent entity. Where the Group loses control of the subsidiary, at the date when control is lost the amount of any non-controlling interest in that former subsidiary is derecognised and any investment retained in the former subsidiary is remeasured to its fair value; the gain or loss that is recognised in profit or loss on the partial disposal of the subsidiary includes the gain or loss on the remeasurement of the retained interest.
Intercompany transactions, balances and unrealised gains and losses on transactions between Group companies are eliminated.
The acquisition method of accounting is used to account for business combinations by the Group. The consideration for the acquisition of a subsidiary is the fair value of the assets transferred, the liabilities incurred and the equity interests issued by the Group. The consideration includes the fair value of any asset or liability resulting from a contingent consideration arrangement. Acquisition related costs are expensed as incurred except those relating to the issuance of debt instruments (see (E)(4) below) or share capital (see (P) below). Identifiable assets acquired and liabilities assumed in a business combination are measured initially at their fair value at the acquisition date.
Notes to the consolidated financial statementsfor the year ended 31 December

224 Lloyds Banking Group Annual Report and Accounts 2020
(2) Joint ventures and associatesJoint ventures are joint arrangements over which the Group has joint control with other parties and has rights to the net assets of the arrangements. Joint control is the contractually agreed sharing of control of an arrangement and only exists when decisions about the relevant activities require the unanimous consent of the parties sharing control. Associates are entities over which the Group has significant influence. Significant influence is the power to participate in the financial and operating policy decisions of the entity, but is not control or joint control of those policies, and is generally achieved through holding between 20 per cent and 50 per cent of the voting share capital of the entity.
The Group utilises the venture capital exemption for investments where significant influence or joint control is present and the business unit operates as a venture capital business. These investments are designated at initial recognition at fair value through profit or loss. Otherwise, the Group’s investments in joint ventures and associates are accounted for by the equity method of accounting.
(B) GoodwillGoodwill arises on business combinations and represents the excess of the cost of an acquisition over the fair value of the Group’s share of the identifiable assets, liabilities and contingent liabilities acquired. Where the fair value of the Group’s share of the identifiable assets, liabilities and contingent liabilities of the acquired entity is greater than the cost of acquisition, the excess is recognised immediately in the income statement.
Goodwill is recognised as an asset at cost and is tested at least annually for impairment. If an impairment is identified the carrying value of the goodwill is written down immediately through the income statement and is not subsequently reversed. At the date of disposal of a subsidiary, the carrying value of attributable goodwill is included in the calculation of the profit or loss on disposal.
(C) Other intangible assetsIntangible assets which have been determined to have a finite useful life are amortised on a straight line basis over their estimated useful life as follows: up to 7 years for capitalised software; 10 to 15 years for brands and other intangible assets.
Intangible assets with finite useful lives are reviewed at each reporting date to assess whether there is any indication that they are impaired. If any such indication exists the recoverable amount of the asset is determined and in the event that the asset’s carrying amount is greater than its recoverable amount, it is written down immediately. Certain brands have been determined to have an indefinite useful life and are not amortised. Such intangible assets are reassessed annually to reconfirm that an indefinite useful life remains appropriate. In the event that an indefinite life is inappropriate a finite life is determined and an impairment review is performed on the asset.
(D) Revenue recognition(1) Net interest incomeInterest income and expense are recognised in the income statement using the effective interest method for all interest-bearing financial instruments, except for those classified at fair value through profit or loss. The effective interest method is a method of calculating the amortised cost of a financial asset or liability and of allocating the interest income or interest expense over the expected life of the financial instrument. The effective interest rate is the rate that exactly discounts the estimated future cash payments or receipts over the expected life of the financial instrument to the gross carrying amount of the financial asset (before adjusting for expected credit losses) or to the amortised cost of the financial liability, including early redemption fees, and related penalties, and premiums and discounts that are an integral part of the overall return. In the case of financial assets that are purchased or originated credit-impaired, the effective interest rate is the rate that discounts the estimated future cash flows to the amortised cost of the instrument. Direct incremental transaction costs related to the acquisition, issue or disposal of a financial instrument are also taken into account. Interest income from non-credit impaired financial assets is recognised by applying the effective interest rate to the gross carrying amount of the asset; for credit impaired financial assets, the effective interest rate is applied to the net carrying amount after deducting the allowance for expected credit losses. Impairment policies are set out in (H) below.
(2) Fee and commission income and expenseFees and commissions receivable which are not an integral part of the effective interest rate are recognised as income as the Group fulfils its performance obligations. The Group’s principal performance obligations arising from contracts with customers are in respect of value added current accounts, credit cards and debit cards. These fees are received, and the Group’s provides the service, monthly; the fees are recognised in income on this basis. The Group also receives certain fees in respect of its asset finance business where the performance obligations are typically fulfilled towards the end of the customer contract; these fees are recognised in income on this basis. Where it is unlikely that the loan commitments will be drawn, loan commitment fees are recognised in fee and commission income over the life of the facility, rather than as an adjustment to the effective interest rate for loans expected to be drawn. Incremental costs incurred to generate fee and commission income are charged to fees and commissions expense as they are incurred.
(3) OtherDividend income is recognised when the right to receive payment is established.
Revenue recognition policies specific to trading income are set out in (E)(3) below, life insurance and general insurance business are detailed below (see (M) below); those relating to leases are set out in (J)(1) below.
(E) Financial assets and liabilitiesOn initial recognition, financial assets are classified as measured at amortised cost, fair value through other comprehensive income or fair value through profit or loss, depending on the Group’s business model for managing the financial assets and whether the cash flows represent solely payments of principal and interest. The Group assesses its business models at a portfolio level based on its objectives for the relevant portfolio, how the performance of the portfolio is managed and reported, and the frequency of asset sales. Financial assets with embedded derivatives are considered in their entirety when considering their cash flow characteristics. The Group reclassifies financial assets when and only when its business model for managing those assets changes. A reclassification will only take place when the change is significant to the Group’s operations and will occur at a portfolio level and not for individual instruments; reclassifications are expected to be rare. Equity investments are measured at fair value through profit or loss unless the Group elects at initial recognition to account for the instruments at fair value through other comprehensive income. For these instruments, principally strategic investments, dividends are recognised in profit or loss but fair value gains and losses are not subsequently reclassified to profit or loss following derecognition of the investment.
The Group initially recognises loans and advances, deposits, debt securities in issue and subordinated liabilities when the Group becomes a party to the contractual provisions of the instrument. Regular way purchases and sales of securities and other financial assets and trading liabilities are recognised on trade date, being the date that the Group is committed to purchase or sell an asset.
Financial assets are derecognised when the contractual right to receive cash flows from those assets has expired or when the Group has transferred its contractual right to receive the cash flows from the assets and either: substantially all of the risks and rewards of ownership have been transferred; or the Group has neither retained nor transferred substantially all of the risks and rewards, but has transferred control.
Financial liabilities are derecognised when the obligation is discharged, cancelled or expires.
Notes to the consolidated financial statements continued
Note 2: Accounting policies continued

Strategic rep
ortFinancial results
Governance
Risk manag
ement
Other inform
ationFinancial statem
ents Lloyds Banking Group Annual Report and Accounts 2020 225
(1) Financial instruments measured at amortised costFinancial assets that are held to collect contractual cash flows where those cash flows represent solely payments of principal and interest are measured at amortised cost. A basic lending arrangement results in contractual cash flows that are solely payments of principal and interest on the principal amount outstanding. Where the contractual cash flows introduce exposure to risks or volatility unrelated to a basic lending arrangement such as changes in equity prices or commodity prices, the payments do not comprise solely principal and interest. Financial assets measured at amortised cost are predominantly loans and advances to customers and banks together with certain debt securities used by the Group to manage its liquidity. Loans and advances are initially recognised when cash is advanced to the borrower at fair value inclusive of transaction costs. Interest income is accounted for using the effective interest method (see (D) above).
Financial liabilities are measured at amortised cost, except for trading liabilities and other financial liabilities designated at fair value through profit or loss on initial recognition which are held at fair value.
(2) Financial assets measured at fair value through other comprehensive incomeFinancial assets that are held to collect contractual cash flows and for subsequent sale, where the assets’ cash flows represent solely payments of principal and interest, are recognised in the balance sheet at their fair value, inclusive of transaction costs. Interest calculated using the effective interest method and foreign exchange gains and losses on assets denominated in foreign currencies are recognised in the income statement. All other gains and losses arising from changes in fair value are recognised directly in other comprehensive income, until the financial asset is either sold or matures, at which time the cumulative gain or loss previously recognised in other comprehensive income is recognised in the income statement other than in respect of equity shares, for which the cumulative revaluation amount is transferred directly to retained profits. The Group recognises a charge for expected credit losses in the income statement (see (H) below). As the asset is measured at fair value, the charge does not adjust the carrying value of the asset, it is reflected in other comprehensive income.
(3) Financial instruments measured at fair value through profit or lossFinancial assets are classified at fair value through profit or loss where they do not meet the criteria to be measured at amortised cost or fair value through other comprehensive income or where they are designated at fair value through profit or loss to reduce an accounting mismatch. All derivatives are carried at fair value through profit or loss.
The assets backing the insurance and investment contracts issued by the Group do not meet the criteria to be measured at amortised cost or fair value through other comprehensive income as they are managed on a fair value basis and accordingly are measured at fair value through profit or loss. Similarly, trading securities, which are debt securities and equity shares acquired principally for the purpose of selling in the short-term or which are part of a portfolio which is managed for short-term gains, do not meet these criteria and are also measured at fair value through profit or loss. Financial assets measured at fair value through profit or loss are recognised in the balance sheet at their fair value. Fair value gains and losses together with interest coupons and dividend income are recognised in the income statement within net trading income.
Financial liabilities are measured at fair value through profit or loss where they are trading liabilities or where they are designated at fair value through profit or loss in order to reduce an accounting mismatch; where the liabilities are part of a group of liabilities (or assets and liabilities) which is managed, and its performance evaluated, on a fair value basis; or where the liabilities contain one or more embedded derivatives that significantly modify the cash flows arising under the contract and would otherwise need to be separately accounted for. Financial liabilities measured at fair value through profit or loss are recognised in the balance sheet at their fair value. Fair value gains and losses are recognised in the income statement within net trading income in the period in which they occur, except that gains and losses attributable to changes in own credit risk are recognised in other comprehensive income.
The fair values of assets and liabilities traded in active markets are based on current bid and offer prices respectively. If the market is not active the Group establishes a fair value by using valuation techniques. The fair values of derivative financial instruments are adjusted where appropriate to reflect credit risk (via credit valuation adjustments (CVAs), debit valuation adjustments (DVAs) and funding valuation adjustments (FVAs)), market liquidity and other risks.
(4) BorrowingsBorrowings (which include deposits from banks, customer deposits, debt securities in issue and subordinated liabilities) are recognised initially at fair value, being their issue proceeds net of transaction costs incurred. These instruments are subsequently stated at amortised cost using the effective interest method.
Preference shares and other instruments which carry a mandatory coupon or are redeemable on a specific date are classified as financial liabilities. The coupon on these instruments is recognised in the income statement as interest expense. Securities which carry a discretionary coupon and have no fixed maturity or redemption date are classified as other equity instruments. Interest payments on these securities are recognised, as distributions from equity in the period in which they are paid. An exchange of financial liabilities on substantially different terms is accounted for as an extinguishment of the original financial liability and the recognition of a new financial liability. The difference between the carrying amount of a financial liability extinguished and the new financial liability is recognised in profit or loss together with any related costs or fees incurred.
When a financial liability is exchanged for an equity instrument, the new equity instrument is recognised at fair value and any difference between the carrying value of the liability and the fair value of the new equity is recognised in profit or loss.
(5) Sale and repurchase agreements (including securities lending and borrowing)Securities sold subject to repurchase agreements (repos) continue to be recognised on the balance sheet where substantially all of the risks and rewards are retained. Funds received under these arrangements are included in deposits from banks, customer deposits, or trading liabilities. Conversely, securities purchased under agreements to resell (reverse repos), where the Group does not acquire substantially all of the risks and rewards of ownership, are recorded as loans and advances measured at amortised cost or trading securities. The difference between sale and repurchase price is treated as interest and accrued over the life of the agreements using the effective interest method.
Securities borrowing and lending transactions are typically secured; collateral takes the form of securities or cash advanced or received. Securities lent to counterparties are retained on the balance sheet. Securities borrowed are not recognised on the balance sheet, unless these are sold to third parties, in which case the obligation to return them is recorded at fair value as a trading liability. Cash collateral given or received is treated as a loan and advance measured at amortised cost or customer deposit.
(F) Derivative financial instruments and hedge accountingAs permitted by IFRS 9, the Group continues to apply the requirements of IAS 39 to its hedging relationships. All derivatives are recognised at their fair value. Derivatives are carried on the balance sheet as assets when their fair value is positive and as liabilities when their fair value is negative. Refer to note 48(3) (Financial instruments: Financial assets and liabilities carried at fair value) for details of valuation techniques and significant inputs to valuation models.
Note 2: Accounting policies continued

226 Lloyds Banking Group Annual Report and Accounts 2020
Changes in the fair value of all derivative instruments, other than those in effective cash flow and net investment hedging relationships, are recognised immediately in the income statement. As noted in (2) and (3) below, the change in fair value of a derivative in an effective cash flow or net investment hedging relationship is allocated between the income statement and other comprehensive income.
Derivatives embedded in a financial asset are not considered separately; the financial asset is considered in its entirety when determining whether its cash flows are solely payments of principal and interest. Derivatives embedded in financial liabilities and insurance contracts (unless the embedded derivative is itself an insurance contract) are treated as separate derivatives when their economic characteristics and risks are not closely related to those of the host contract and the host contract is not carried at fair value through profit or loss. These embedded derivatives are measured at fair value with changes in fair value recognised in the income statement. In accordance with IFRS 4 Insurance Contracts, a policyholder’s option to surrender an insurance contract for a fixed amount is not treated as an embedded derivative.
Hedge accounting allows one financial instrument, generally a derivative such as a swap, to be designated as a hedge of another financial instrument such as a loan or deposit or a portfolio of such instruments. At the inception of the hedge relationship, formal documentation is drawn up specifying the hedging strategy, the hedged item, the hedging instrument and the methodology that will be used to measure the effectiveness of the hedge relationship in offsetting changes in the fair value or cash flow of the hedged risk. The effectiveness of the hedging relationship is tested both at inception and throughout its life and if at any point it is concluded that it is no longer highly effective in achieving its documented objective, hedge accounting is discontinued. Note 17 provides details of the types of derivatives held by the Group and presents separately those designated in hedge relationships.
Where there is uncertainty arising from interest rate benchmark reform, the Group assumes that the interest rate benchmark on which the hedged cash flows and/or the hedged risk are based, or the interest rate benchmark on which the cash flows of the hedging instrument are based, are not altered as a result of interest rate benchmark reform. The Group does not discontinue a hedging relationship during the period of uncertainty arising from the interest rate benchmark reform solely because the actual results of the hedge are not highly effective.
(1) Fair value hedgesChanges in the fair value of derivatives that are designated and qualify as fair value hedges are recorded in the income statement, together with the changes in the fair value of the hedged asset or liability that are attributable to the hedged risk; this also applies if the hedged asset is classified as a financial asset at fair value through other comprehensive income. If the hedge no longer meets the criteria for hedge accounting, changes in the fair value of the hedged item attributable to the hedged risk are no longer recognised in the income statement. The cumulative adjustment that has been made to the carrying amount of the hedged item is amortised to the income statement using the effective interest method over the period to maturity.
(2) Cash flow hedgesThe effective portion of changes in the fair value of derivatives that are designated and qualify as cash flow hedges is recognised in other comprehensive income in the cash flow hedging reserve. The gain or loss relating to the ineffective portion is recognised immediately in the income statement. Amounts accumulated in equity are reclassified to the income statement in the periods in which the hedged item affects profit or loss. When a hedging instrument expires or is sold, or when a hedge no longer meets the criteria for hedge accounting, any cumulative gain or loss existing in equity at that time remains in equity and is recognised in the income statement when the forecast transaction is ultimately recognised in the income statement. When a forecast transaction is no longer expected to occur, the cumulative gain or loss that was reported in equity is immediately transferred to the income statement.
(3) Net investment hedgesHedges of net investments in foreign operations are accounted for similarly to cash flow hedges. Any gain or loss on the hedging instrument relating to the effective portion of the hedge is recognised in other comprehensive income, the gain or loss relating to the ineffective portion is recognised immediately in the income statement. Gains and losses accumulated in equity are included in the income statement when the foreign operation is disposed of. The hedging instrument used in net investment hedges may include non-derivative liabilities as well as derivative financial instruments.
(G) OffsetFinancial assets and liabilities are offset and the net amount reported in the balance sheet when there is a legally enforceable right of offset and there is an intention to settle on a net basis, or realise the asset and settle the liability simultaneously. Cash collateral on exchange traded derivative transactions is presented gross unless the collateral cash flows are always settled net with the derivative cash flows. In certain situations, even though master netting agreements exist, the lack of management intention to settle on a net basis results in the financial assets and liabilities being reported gross on the balance sheet.
(H) Impairment of financial assetsThe impairment charge in the income statement includes the change in expected credit losses and including those arising from fraud. Expected credit losses are recognised for loans and advances to customers and banks, other financial assets held at amortised cost, financial assets measured at fair value through other comprehensive income, and certain loan commitments and financial guarantee contracts. Expected credit losses are calculated as an unbiased and probability-weighted estimate using an appropriate probability of default, adjusted to take into account a range of possible future economic scenarios, and applying this to the estimated exposure of the Group at the point of default after taking into account the value of any collateral held, repayments, or other mitigants of loss and including the impact of discounting using the effective interest rate.
At initial recognition, allowance (or provision in the case of some loan commitments and financial guarantees) is made for expected credit losses resulting from default events that are possible within the next 12 months (12-month expected credit losses). In the event of a significant increase in credit risk since origination, allowance (or provision) is made for expected credit losses resulting from all possible default events over the expected life of the financial instrument (lifetime expected credit losses). Financial assets where 12-month expected credit losses are recognised are considered to be Stage 1; financial assets which are considered to have experienced a significant increase in credit risk since initial recognition are in Stage 2; and financial assets which have defaulted or are otherwise considered to be credit impaired are allocated to Stage 3. Some Stage 3 assets, mainly in Commercial Banking, are subject to individual rather than collective assessment. Such cases are subject to a risk-based impairment sanctioning process, and these are reviewed and updated at least quarterly, or more frequently if there is a significant change in the credit profile. The collective assessment of impairment aggregates financial instruments with similar risk characteristics such as whether the facility is revolving in nature or secured and the type of security against financial assets.
An assessment of whether credit risk has increased significantly since initial recognition considers the change in the risk of default occurring over the remaining expected life of the financial instrument. In determining whether there has been a significant increase in credit risk, the Group uses quantitative tests based on relative and absolute probability of default (PD) movements linked to internal credit ratings together with qualitative indicators such as watchlists and other indicators of historical delinquency, credit weakness or financial difficulty. The use of internal credit ratings and qualitative indicators ensure alignment between the assessment of staging and the Group’s management of credit risk which utilises these internal metrics within distinct retail and commercial portfolio risk management practices. However, unless identified at an earlier stage, the credit risk of financial assets is deemed to have increased significantly when more than 30 days past due. The use of a payment holiday in itself has not been judged to indicate a significant increase in credit risk, with the underlying long-term credit risk deemed to be driven by economic conditions and captured through the use of forward-looking models. These portfolio level models are capturing
Notes to the consolidated financial statements continued
Note 2: Accounting policies continued

Strategic rep
ortFinancial results
Governance
Risk manag
ement
Other inform
ationFinancial statem
ents Lloyds Banking Group Annual Report and Accounts 2020 227
the anticipated volume of increased defaults and therefore an appropriate assessment of staging and expected credit loss. Where the credit risk subsequently improves such that it no longer represents a significant increase in credit risk since initial recognition, the asset is transferred back to Stage 1.
Assets are transferred to Stage 3 when they have defaulted or are otherwise considered to be credit impaired. Default is considered to have occurred when there is evidence that the customer is experiencing financial difficulty which is likely to affect significantly the ability to repay the amount due. IFRS 9 contains a rebuttable presumption that default occurs no later than when a payment is 90 days past due. The Group uses this 90 day backstop for all its products except for UK mortgages. For UK mortgages, the Group uses a backstop of 180 days past due as mortgage exposures more than 90 days past due, but less than 180 days, typically show high cure rates and this aligns with the Group’s risk management practices. Key differences between Stage 3 balances and non-performing loans relate to the use of 180 days past due for Stage 3 mortgages and to the cure periods applied to forbearance exposures. The use of payment holidays is not considered to be an automatic trigger of regulatory default and therefore does not automatically trigger Stage 3. Days past due will also not accumulate on any accounts that have taken a payment holiday including those already past due.
In certain circumstances, the Group will renegotiate the original terms of a customer’s loan, either as part of an ongoing customer relationship or in response to adverse changes in the circumstances of the borrower. In the latter circumstances, the loan will remain classified as either Stage 2 or Stage 3 until the credit risk has improved such that it no longer represents a significant increase since origination (for a return to Stage 1), or the loan is no longer credit impaired (for a return to Stage 2). On renegotiation the gross carrying amount of the loan is recalculated as the present value of the renegotiated or modified contractual cash flows, which are discounted at the original effective interest rate. Renegotiation may also lead to the loan and associated allowance being derecognised and a new loan being recognised initially at fair value.
Purchased or originated credit-impaired financial assets (POCI) include financial assets that are purchased or originated at a deep discount that reflects incurred credit losses. At initial recognition, POCI assets do not carry an impairment allowance; instead, lifetime expected credit losses are incorporated into the calculation of the effective interest rate. All changes in lifetime expected credit losses subsequent to the assets’ initial recognition are recognised as an impairment charge.
A loan or advance is normally written off, either partially or in full, against the related allowance when the proceeds from realising any available security have been received or there is no realistic prospect of recovery and the amount of the loss has been determined. Subsequent recoveries of amounts previously written off decrease the amount of impairment losses recorded in the income statement. For both secured and unsecured retail balances, the write-off takes place only once an extensive set of collections processes has been completed, or the status of the account reaches a point where policy dictates that continuing attempts to recover are no longer appropriate. For commercial lending, a write-off occurs if the loan facility with the customer is restructured, the asset is under administration and the only monies that can be received are the amounts estimated by the administrator, the underlying assets are disposed and a decision is made that no further settlement monies will be received, or external evidence (for example, third party valuations) is available that there has been an irreversible decline in expected cash flows.
(I) Property, plant and equipmentProperty, plant and equipment (other than investment property) is included at cost less accumulated depreciation. The value of land (included in premises) is not depreciated. Depreciation on other assets is calculated using the straight-line method to allocate the difference between the cost and the residual value over their estimated useful lives, as follows: the shorter of 50 years and the remaining period of the lease for freehold/long and short leasehold premises; the shorter of 10 years and, if lease renewal is not likely, the remaining period of the lease for leasehold improvements; 10 to 20 years for fixtures and furnishings; and 2 to 8 years for other equipment and motor vehicles.
The assets’ residual values and useful lives are reviewed, and adjusted if appropriate, at each balance sheet date.
Assets are reviewed for impairment whenever events or changes in circumstances indicate that the carrying amount may not be recoverable. In the event that an asset’s carrying amount is determined to be greater than its recoverable amount it is written down immediately. The recoverable amount is the higher of the asset’s fair value less costs to sell and its value in use.
Investment property comprises freehold and long leasehold land and buildings that are held either to earn rental income or for capital accretion or both, primarily within the life insurance funds. In accordance with the guidance published by the Royal Institution of Chartered Surveyors, investment property is carried at fair value based on current prices for similar properties, adjusted for the specific characteristics of the property (such as location or condition). If this information is not available, the Group uses alternative valuation methods such as discounted cash flow projections or recent prices in less active markets. These valuations are reviewed at least annually by independent professionally qualified valuers. Investment property being redeveloped for continuing use as investment property, or for which the market has become less active, continues to be valued at fair value.
(J) LeasesUnder IFRS 16, a lessor is required to determine whether a lease is a finance or operating lease. A lessee is not required to make this determination.
(1) As lessorAssets leased to customers are classified as finance leases if the lease agreements transfer substantially all the risks and rewards of ownership to the lessee but not necessarily legal title. All other leases are classified as operating leases. When assets are subject to finance leases, the present value of the lease payments, together with any unguaranteed residual value, is recognised as a receivable, net of allowances for expected credit losses and residual value impairment, within loans and advances to banks and customers. The difference between the gross receivable and the present value of the receivable is recognised as unearned finance lease income. Finance lease income is recognised in interest income over the term of the lease using the net investment method (before tax) so as to give a constant rate of return on the net investment in the leases. Unguaranteed residual values are reviewed regularly to identify any impairment.
Operating lease assets are included within property, plant and equipment at cost and depreciated over their estimated useful lives, which equates to the lives of the leases, after taking into account anticipated residual values. Operating lease rental income is recognised on a straight-line basis over the life of the lease.
The Group evaluates non-lease arrangements such as outsourcing and similar contracts to determine if they contain a lease which is then accounted for separately.
(2) As lesseeLeases are recognised as a right-of-use asset and a corresponding liability at the date at which the leased asset is available for use by the Group. Assets and liabilities arising from a lease are initially measured on a present value basis. The lease payments are discounted using the interest rate implicit in the lease, if that rate can be determined, or the Group’s incremental borrowing rate appropriate for the right-of-use asset arising from the lease.
Lease payments are allocated between the liability and finance cost. The finance cost is charged to profit or loss over the lease period so as to produce a constant periodic rate of interest on the remaining balance of the liability for each period. The right-of-use asset is depreciated over the shorter of the asset's useful life and the lease term on a straight-line basis.
Payments associated with short-term leases and leases of low-value assets are recognised on a straight-line basis as an expense in profit or loss. Short-term leases are leases with a lease term of twelve months or less. Low-value assets comprise IT equipment and small items of office furniture.
Note 2: Accounting policies continued

228 Lloyds Banking Group Annual Report and Accounts 2020
(K) Employee benefitsShort-term employee benefits, such as salaries, paid absences, performance-based cash awards and social security costs are recognised over the period in which the employees provide the related services.
(1) Pension schemesThe Group operates a number of post-retirement benefit schemes for its employees including both defined benefit and defined contribution pension plans. A defined benefit scheme is a pension plan that defines an amount of pension benefit that an employee will receive on retirement, dependent on one or more factors such as age, years of service and salary. A defined contribution plan is a pension plan into which the Group pays fixed contributions; there is no legal or constructive obligation to pay further contributions.
Scheme assets are included at their fair value and scheme liabilities are measured on an actuarial basis using the projected unit credit method. The defined benefit scheme liabilities are discounted using rates equivalent to the market yields at the balance sheet date on high-quality corporate bonds that are denominated in the currency in which the benefits will be paid, and that have terms to maturity approximating to the terms of the related pension liability. The Group’s income statement charge includes the current service cost of providing pension benefits, past service costs, net interest expense (income), and plan administration costs that are not deducted from the return on plan assets. Past service costs, which represents the change in the present value of the defined benefit obligation resulting from a plan amendment or curtailment, are recognised when the plan amendment or curtailment occurs. Net interest expense (income) is calculated by applying the discount rate at the beginning of the period to the net defined benefit liability or asset.
Remeasurements, comprising actuarial gains and losses, the return on plan assets (excluding amounts included in net interest expense (income) and net of the cost of managing the plan assets), and the effect of changes to the asset ceiling (if applicable) are reflected immediately in the balance sheet with a charge or credit recognised in other comprehensive income in the period in which they occur. Remeasurements recognised in other comprehensive income are reflected immediately in retained profits and will not subsequently be reclassified to profit or loss.
The Group’s balance sheet includes the net surplus or deficit, being the difference between the fair value of scheme assets and the discounted value of scheme liabilities at the balance sheet date. Surpluses are only recognised to the extent that they are recoverable through reduced contributions in the future or through refunds from the schemes. In assessing whether a surplus is recoverable, the Group considers (i) its current right to obtain a refund or a reduction in future contributions and (ii) the rights of other parties existing at the balance sheet date. In determining the rights of third parties existing at the balance sheet date, the Group does not anticipate any future acts by other parties.
The costs of the Group’s defined contribution plans are charged to the income statement in the period in which they fall due.
(2) Share-based compensationThe Group operates a number of equity-settled, share-based compensation plans in respect of services received from certain of its employees. The value of the employee services received in exchange for equity instruments granted under these plans is recognised as an expense over the vesting period of the instruments, with a corresponding increase in equity. This expense is determined by reference to the fair value of the number of equity instruments that are expected to vest. The fair value of equity instruments granted is based on market prices, if available, at the date of grant. In the absence of market prices, the fair value of the instruments at the date of grant is estimated using an appropriate valuation technique, such as a Black-Scholes option pricing model or a Monte Carlo simulation. The determination of fair values excludes the impact of any non-market vesting conditions, which are included in the assumptions used to estimate the number of options that are expected to vest. At each balance sheet date, this estimate is reassessed and if necessary revised. Any revision of the original estimate is recognised in the income statement, together with a corresponding adjustment to equity. Cancellations by employees of contributions to the Group’s Save As You Earn plans are treated as non-vesting conditions and the Group recognises, in the year of cancellation, the amount of the expense that would have otherwise been recognised over the remainder of the vesting period. Modifications are assessed at the date of modification and any incremental charges are charged to the income statement.
(L) TaxationTax expense comprises current and deferred tax. Current and deferred tax are charged or credited in the income statement except to the extent that the tax arises from a transaction or event which is recognised, in the same or a different period, outside the income statement (either in other comprehensive income, directly in equity, or through a business combination), in which case the tax appears in the same statement as the transaction that gave rise to it. The tax consequences of the Group's dividend payments (including distributions on other equity instruments), if any, are charged or credited to the statement in which the profit distributed originally arose.
Current tax is the amount of corporate income taxes expected to be payable or recoverable based on the profit for the period as adjusted for items that are not taxable or not deductible, and is calculated using tax rates and laws that were enacted or substantively enacted at the balance sheet date.
Current tax includes amounts provided in respect of uncertain tax positions when management expects that, upon examination of the uncertainty by Her Majesty’s Revenue and Customs (HMRC) or other relevant tax authority, it is more likely than not that an economic outflow will occur. Provisions reflect management’s best estimate of the ultimate liability based on their interpretation of tax law, precedent and guidance, informed by external tax advice as necessary. Changes in facts and circumstances underlying these provisions are reassessed at each balance sheet date, and the provisions are remeasured as required to reflect current information.
For the Group’s long-term insurance businesses, the tax expense is analysed between tax that is payable in respect of policyholders’ returns and tax that is payable on the shareholders’ returns. This allocation is based on an assessment of the rates of tax which will be applied to the returns under the current UK tax rules.
Deferred tax is recognised on temporary differences arising between the tax bases of assets and liabilities and their carrying amounts in the balance sheet. Deferred tax is calculated using tax rates and laws that have been enacted or substantively enacted at the balance sheet date, and which are expected to apply when the related deferred tax asset is realised or the deferred tax liability is settled.
Deferred tax liabilities are generally recognised for all taxable temporary differences but not recognised for taxable temporary differences arising on investments in subsidiaries where the reversal of the temporary difference can be controlled and it is probable that the difference will not reverse in the foreseeable future. Deferred tax liabilities are not recognised on temporary differences that arise from goodwill which is not deductible for tax purposes.
Deferred tax assets are recognised to the extent it is probable that taxable profits will be available against which the deductible temporary differences can be utilised, and are reviewed at each balance sheet date and reduced to the extent that it is no longer probable that sufficient taxable profits will be available to allow all or part of the asset to be recovered.
Deferred tax assets and liabilities are not recognised in respect of temporary differences that arise on initial recognition of assets and liabilities acquired other than in a business combination. Deferred tax is not discounted.
Notes to the consolidated financial statements continued
Note 2: Accounting policies continued

Strategic rep
ortFinancial results
Governance
Risk manag
ement
Other inform
ationFinancial statem
ents Lloyds Banking Group Annual Report and Accounts 2020 229
(M) InsuranceThe Group undertakes both life insurance and general insurance business. Insurance and participating investment contracts are accounted for under IFRS 4 Insurance Contracts, which permits (with certain exceptions) the continuation of accounting practices for measuring insurance and participating investment contracts that applied prior to the adoption of IFRS. The Group, therefore, continues to account for these products using UK GAAP and UK established practice.
Products sold by the life insurance business are classified into three categories:
– Insurance contracts – these contracts transfer significant insurance risk and may also transfer financial risk. The Group defines significant insurance risk as the possibility of having to pay benefits on the occurrence of an insured event which are significantly more than the benefits payable if the insured event were not to occur. These contracts may or may not include discretionary participation features.
– Investment contracts containing a discretionary participation feature (participating investment contracts) – these contracts do not transfer significant insurance risk, but contain a contractual right which gives the holder the right to receive, in addition to the guaranteed benefits, further additional discretionary benefits or bonuses that are likely to be a significant proportion of the total contractual benefits and the amount and timing of which is at the discretion of the Group, within the constraints of the terms and conditions of the instrument and based upon the performance of specified assets.
– Non-participating investment contracts – these contracts do not transfer significant insurance risk or contain a discretionary participation feature.
The general insurance business issues only insurance contracts.
(1) Life insurance business(i) Accounting for insurance and participating investment contracts
Premiums and claimsPremiums received in respect of insurance and participating investment contracts are recognised as revenue when due except for unit-linked contracts on which premiums are recognised as revenue when received. Claims are recorded as an expense on the earlier of the maturity date or the date on which the claim is notified.
LiabilitiesChanges in the value of liabilities are recognised in the income statement through insurance claims.
– Insurance and participating investment contracts in the Group’s with-profit funds
Liabilities of the Group’s with-profit funds, including guarantees and options embedded within products written by these funds, are stated at their realistic values in accordance with the Prudential Regulation Authority’s realistic capital regime, except that projected transfers out of the funds into other Group funds are recorded in the unallocated surplus (see below). Further details on valuation under the realistic capital regime are included in note 30 Liabilities arising from insurance contracts and participating investment contracts.
– Insurance contracts which are not unit-linked or in the Group’s with-profit funds
A liability for contractual benefits that are expected to be incurred in the future is recorded when the premiums are recognised. The liability is calculated by estimating the future cash flows over the duration of in-force policies and discounting them back to the valuation date allowing for probabilities of occurrence. The liability will vary with movements in interest rates and with the cost of life insurance and annuity benefits where future mortality is uncertain.
Assumptions are made in respect of all material factors affecting future cash flows, including future interest rates, mortality and costs.
Further details on valuation are included in note 30 Liabilities arising from insurance contracts and participating investment contracts.
– Insurance and participating investment contracts which are unit-linked
Liabilities for unit-linked insurance contracts and participating investment contracts are stated at the bid value of units plus an additional allowance where appropriate (such as for any excess of future expenses over charges). The liability is increased or reduced by the change in the unit prices and is reduced by policy administration fees, mortality and surrender charges and any withdrawals. Benefit claims in excess of the account balances incurred in the period are also charged through insurance claims. Revenue consists of fees deducted for mortality, policy administration and surrender charges.
Unallocated surplusAny amounts in the with-profit funds not yet determined as being due to policyholders or shareholders are recognised as an unallocated surplus which is shown separately from liabilities arising from insurance contracts and participating investment contracts.
(ii) Accounting for non-participating investment contractsThe Group’s non-participating investment contracts are primarily unit-linked. These contracts are accounted for as financial liabilities whose value is contractually linked to the fair values of financial assets within the Group’s unitised investment funds. The value of the unit-linked financial liabilities is determined using current unit prices multiplied by the number of units attributed to the contract holders at the balance sheet date. Their value is never less than the amount payable on surrender, discounted for the required notice period where applicable. Investment returns (including movements in fair value and investment income) allocated to those contracts are recognised in the income statement through insurance claims.
Deposits and withdrawals are not accounted for through the income statement but are accounted for directly in the balance sheet as adjustments to the non-participating investment contract liability.
The Group receives investment management fees in the form of an initial adjustment or charge to the amount invested. These fees are in respect of services rendered in conjunction with the issue and management of investment contracts where the Group actively manages the consideration received from its customers to fund a return that is based on the investment profile that the customer selected on origination of the contract. These services comprise an indeterminate number of acts over the lives of the individual contracts and, therefore, the Group defers these fees and recognises them over the estimated lives of the contracts, in line with the provision of investment management services.
Costs which are directly attributable and incremental to securing new non-participating investment contracts are deferred. This asset is subsequently amortised over the period of the provision of investment management services and its recoverability is reviewed in circumstances where its carrying amount may not be recoverable. If the asset is greater than its recoverable amount it is written down immediately through fee and commission expense in the income statement. All other costs are recognised as expenses when incurred.
Note 2: Accounting policies continued

230 Lloyds Banking Group Annual Report and Accounts 2020
(iii) Value of in-force businessThe Group recognises as an asset the value of in-force business in respect of insurance contracts and participating investment contracts. The asset represents the present value of the shareholders’ interest in the profits expected to emerge from those contracts written at the balance sheet date. This is determined after making appropriate assumptions about future economic and operating conditions such as future mortality and persistency rates and includes allowances for both non-market risk and for the realistic value of financial options and guarantees. Each cash flow is valued using the discount rate consistent with that applied to such a cash flow in the capital markets. The asset in the consolidated balance sheet is presented gross of attributable tax and movements in the asset are reflected within other operating income in the income statement.
The Group’s contractual rights to benefits from providing investment management services in relation to non-participating investment contracts acquired in business combinations and portfolio transfers are measured at fair value at the date of acquisition. The resulting asset is amortised over the estimated lives of the contracts. At each reporting date an assessment is made to determine if there is any indication of impairment. Where impairment exists, the carrying value of the asset is reduced to its recoverable amount and the impairment loss recognised in the income statement.
(2) General insurance businessThe Group both underwrites and acts as intermediary in the sale of general insurance products. Underwriting premiums are included in insurance premium income, net of refunds, in the period in which insurance cover is provided to the customer; premiums received relating to future periods are deferred in the balance sheet within liabilities arising from insurance contracts and participating investment contracts on a basis that reflects the length of time for which contracts have been in-force and the projected incidence of risk over the term of the contract and only credited to the income statement when earned. Broking commission is recognised when the underwriter accepts the risk of providing insurance cover to the customer. Where appropriate, provision is made for the effect of future policy terminations based upon past experience.
The underwriting business makes provision for the estimated cost of claims notified but not settled and claims incurred but not reported at the balance sheet date. The provision for the cost of claims notified but not settled is based upon a best estimate of the cost of settling the outstanding claims after taking into account all known facts. In those cases where there is insufficient information to determine the required provision, statistical techniques are used which take into account the cost of claims that have recently been settled and make assumptions about the future development of the outstanding cases. Similar statistical techniques are used to determine the provision for claims incurred but not reported at the balance sheet date. Claims liabilities are not discounted.
(3) Liability adequacy testAt each balance sheet date liability adequacy tests are performed to ensure the adequacy of insurance and participating investment contract liabilities net of related deferred cost assets and value of in-force business. In performing these tests current best estimates of discounted future contractual cash flows and claims handling and policy administration expenses, as well as investment income from the assets backing such liabilities, are used. Any deficiency is immediately charged to the income statement, initially by writing off the relevant assets and subsequently by establishing a provision for losses arising from liability adequacy tests.
(4) ReinsuranceContracts entered into by the Group with reinsurers under which the Group is compensated for benefits payable on one or more contracts issued by the Group are recognised as assets arising from contracts held with reinsurers. Where the contract transfers significant insurance risk, the contract issued by the Group is classified as an insurance contract; where the contract transfers financial risk, the contract issued by the Group is recognised at fair value through profit or loss.
Assets arising from contract held with reinsurers – Insurance risk transferredAmounts recoverable from or due to reinsurers are measured consistently with the amounts associated with the reinsured contracts and in accordance with the terms of each reinsurance contract and are regularly reviewed for impairment. Premiums payable for reinsurance contracts are recognised as an expense when due within insurance premium income. Changes in the reinsurance recoverable assets are recognised in the income statement through insurance claims.
Assets arising from contract held with reinsurers – Financial risk transferredThese contracts are accounted for as financial assets whose value is contractually linked to the fair values of financial assets within the reinsurers’ investment funds. Investment returns (including movements in fair value and investment income) allocated to these contracts are recognised in insurance claims. Deposits and withdrawals are not accounted for through the income statement but are accounted for directly in the balance sheet as adjustments to the assets arising from reinsurance contracts held.
(N) Foreign currency translationItems included in the financial statements of each of the Group’s entities are measured using the currency of the primary economic environment in which the entity operates (the functional currency). Foreign currency transactions are translated into the appropriate functional currency using the exchange rates prevailing at the dates of the transactions. Foreign exchange gains and losses resulting from the settlement of such transactions and from the translation at year end exchange rates of monetary assets and liabilities denominated in foreign currencies are recognised in the income statement, except when recognised in other comprehensive income as qualifying cash flow or net investment hedges. Non-monetary assets that are measured at fair value are translated using the exchange rate at the date that the fair value was determined. Translation differences on equities and similar non-monetary items held at fair value through profit and loss are recognised in profit or loss as part of the fair value gain or loss. Translation differences on non-monetary financial assets measured at fair value through other comprehensive income, such as equity shares, are included in the fair value reserve in equity unless the asset is a hedged item in a fair value hedge.
The results and financial position of all Group entities that have a functional currency different from the presentation currency are translated into the presentation currency as follows: the assets and liabilities of foreign operations, including goodwill and fair value adjustments arising on the acquisition of a foreign entity, are translated into sterling at foreign exchange rates ruling at the balance sheet date; and the income and expenses of foreign operations are translated into sterling at average exchange rates unless these do not approximate to the foreign exchange rates ruling at the dates of the transactions in which case income and expenses are translated at the dates of the transactions.
Foreign exchange differences arising on the translation of a foreign operation are recognised in other comprehensive income and accumulated in a separate component of equity together with exchange differences arising from the translation of borrowings and other currency instruments designated as hedges of such investments (see (F)(3) above). On disposal or liquidation of a foreign operation, the cumulative amount of exchange differences relating to that foreign operation are reclassified from equity and included in determining the profit or loss arising on disposal or liquidation.
Notes to the consolidated financial statements continued
Note 2: Accounting policies continued

Strategic rep
ortFinancial results
Governance
Risk manag
ement
Other inform
ationFinancial statem
ents Lloyds Banking Group Annual Report and Accounts 2020 231
(O) Provisions and contingent liabilitiesProvisions are recognised in respect of present obligations arising from past events where it is probable that outflows of resources will be required to settle the obligations and they can be reliably estimated.
Contingent liabilities are possible obligations whose existence depends on the outcome of uncertain future events or those present obligations where the outflows of resources are uncertain or cannot be measured reliably. Contingent liabilities are not recognised in the financial statements but are disclosed unless they are remote.
Provision is made for expected credit losses in respect of irrevocable undrawn loan commitments and financial guarantee contracts (see (H) above).
(P) Share capitalIncremental costs directly attributable to the issue of new shares or options or to the acquisition of a business are shown in equity as a deduction, net of tax, from the proceeds. Dividends paid on the Group’s ordinary shares are recognised as a reduction in equity in the period in which they are paid.
Where the Company or any member of the Group purchases the Company’s share capital, the consideration paid is deducted from shareholders’ equity as treasury shares until they are cancelled; if these shares are subsequently sold or reissued, any consideration received is included in shareholders’ equity.
(Q) Cash and cash equivalentsFor the purposes of the cash flow statement, cash and cash equivalents comprise cash and non-mandatory balances with central banks and amounts due from banks with a maturity of less than three months.
Note 3: Critical accounting judgements and estimatesThe preparation of the Group’s financial statements in accordance with IFRS requires management to make judgements, estimates and assumptions in applying the accounting policies that affect the reported amounts of assets, liabilities, income and expenses. Due to the inherent uncertainty in making estimates, actual results reported in future periods may be based upon amounts which differ from those estimates. Estimates, judgements and assumptions are continually evaluated and are based on historical experience and other factors, including expectations of future events that are believed to be reasonable under the circumstances.
The significant judgements made by management in applying the Group’s accounting policies and the key sources of estimation uncertainty in these financial statements, which together are deemed critical to the Group’s results and financial position, are as follows:
Allowance for expected credit losses
Key judgements: Determining an appropriate definition of default against which a probability of default, exposure at default and loss given default parameter can be evaluated
The appropriate lifetime of an exposure to credit risk for the assessment of lifetime losses, notably on revolving products
Establishing the criteria for a significant increase in credit riskThe use of management judgement alongside impairment modelling processes to adjust inputs, parameters and outputs to reflect risks not captured by models
Key estimates: Base case and Multiple Economic Scenarios (MES) assumptions, including the rate of unemployment and the rate of change of house prices, required for creation of MES scenarios and forward-looking credit parameters
These judgements and estimates are subject to significant uncertainty.
The Group recognises an allowance for expected credit losses for loans and advances to customers and banks, other financial assets held at amortised cost, financial assets measured at fair value through other comprehensive income and certain loan commitment and financial guarantee contracts. At 31 December 2020 the Group’s expected credit loss allowance was £6,247 million (2019: £3,455 million), of which £5,788 million (2019: £3,278 million) was in respect of drawn balances.
The calculation of the Group’s expected credit loss (ECL) allowances and provisions against loan commitments and guarantees under IFRS 9 requires the Group to make a number of judgements, assumptions and estimates. The most significant are set out below.
Definition of defaultThe probability of default (PD) of an exposure, both over a 12 month period and over its lifetime, is a key input to the measurement of the ECL allowance. Default has occurred when there is evidence that the customer is experiencing significant financial difficulty which is likely to affect the ability to repay amounts due. The definition of default adopted by the Group is described in note 2(H) Impairment of financial assets. The Group has rebutted the presumption in IFRS 9 that default occurs no later than when a payment is 90 days past due for UK mortgages. As a result, at 31 December 2020, approximately £0.6 billion of UK mortgages (2019: £0.6 billion) were classified as Stage 2 rather than Stage 3; the impact on the Group’s ECL allowance was not material.
Lifetime of an exposureA range of approaches, segmented by product type, has been adopted by the Group to estimate a product’s expected life. These include using the full contractual life and taking into account behavioural factors such as early repayments and refinancing. For non-revolving retail assets, the Group has assumed the expected life for each product to be the time taken for all significant losses to be observed. For retail revolving products, the Group has considered the losses beyond the contractual term over which the Group is exposed to credit risk. For commercial overdraft facilities, the average behavioural life has been used. Changes to the assumed expected lives of the Group’s assets could impact the ECL allowance recognised by the Group. The assessment of SICR and corresponding lifetime loss, and the PD, of a financial asset deemed to be Stage 2, or Stage 3, is dependent on its expected life.
Significant increase in credit riskPerforming assets are classified as either Stage 1 or Stage 2. An ECL allowance equivalent to 12 months expected losses is established against assets in Stage 1; assets classified as Stage 2 carry an ECL allowance equivalent to lifetime expected losses. Assets are transferred from Stage 1 to Stage 2 when there has been a significant increase in credit risk (SICR) since initial recognition. Credit impaired assets are transferred to Stage 3 with a lifetime expected losses allowance. The Group uses both quantitative and qualitative indicators to determine whether there has been a SICR for an asset. For Retail, the following tables set out the Retail Master Scale (RMS) grade triggers which result in a SICR for financial assets and the PD boundaries for each RMS grade. Credit cards SICR triggers have been refined in 2020 following a review of sensitivity to changes in economic assumptions, 2019 triggers were previously aligned
Note 2: Accounting policies continued

232 Lloyds Banking Group Annual Report and Accounts 2020
to Loans and overdrafts. The impact of this has been approximately £1.4 billion of additional assets being classified as Stage 2 at 31 December 2020, with a corresponding increase in the ECL of £48 million resulting from the transfer to a lifetime expected loss.
SICR Triggers for key Retail portfoliosOrigination grade 1 2 3 4 5 6 7
Mortgages SICR grade 5 5 6 7 8 9 10
Credit cards SICR grade 4 5 6 7 8 9 10
Loans and overdrafts SICR grade 5 6 7 8 9 10 11
RMS grade 1 2 3 4 5 6 7 8 9 10 11 12 13 14
PD boundary % 0.10 0.40 0.80 1.20 2.50 4.50 7.50 10.00 14.00 20.00 30.00 45.00 99.99 100.00
For Commercial a doubling of PD with a minimum increase in PD of 1 per cent and a resulting change in the underlying grade is treated as a SICR.
The Group uses the internal credit risk classification and watchlist as qualitative indicators to identify a SICR. The Group does not use the low credit risk exemption in its staging assessments. The use of a payment holiday in and of itself has not been judged to indicate a significant increase in credit risk, nor forbearance, with the underlying long-term credit risk deemed to be driven by economic conditions and captured through the use of forward-looking models. These portfolio level models are capturing the anticipated volume of increased defaults and therefore an appropriate assessment of staging and expected credit loss. During 2020, the Group has granted payment holidays on Retail loans and advances, £6.4 billion remained in place at 31 December 2020, £4.3 billion of these balances were classified as Stage 1. If all of these assets were classified as Stage 2, the Group's ECL would have been less than £50 million higher.
All financial assets are assumed to have suffered a SICR if they are more than 30 days past due; non-mortgage Retail financial assets are also assumed to have suffered a SICR if they are in arrears on three or more separate occasions in a rolling twelve month period. Financial assets are classified as credit impaired if they are 90 days past due except for UK mortgages where a 180 days backstop is used.
A Stage 3 asset that is no longer credit-impaired is transferred back to Stage 2 as no cure period is applied to Stage 3. If an exposure that is classified as Stage 2 no longer meets the SICR criteria, which in some cases include a minimum cure period, it is moved back to Stage 1.
The setting of precise trigger points combined with risk indicators requires judgement. The use of different trigger points may have a material impact upon the size of the ECL allowance. The Group monitors the effectiveness of SICR criteria on an ongoing basis.
Generation of Multiple Economic Scenarios (MES)The measurement of expected credit losses is required to reflect an unbiased probability-weighted range of possible future outcomes. The Group considers the choice of approach used to generate the range of economic outcomes to be judgemental, given several methods can be adopted. In addition to a defined base case, as used for planning, the Group’s approach relies on model-generated scenarios, reducing scope for bias in the selection of scenarios and their weightings. The conditioning assumptions underpinning the base case scenario reflect the Group’s best view of future events. Where outcomes materially diverge from the conditioning assumptions adopted, the base case scenario is updated. The base case is therefore central to the range of outcomes created as no alternative conditioning assumptions are factored into the model-generated scenarios.
The Group models a full distribution of economic scenarios around this base case, ranking them using estimated relationships with industry-wide historical loss data. The full distribution is summarised by a practical number of scenarios to run through ECL models representing four sections: an upside, the base case, and a downside scenario weighted at 30 per cent each, with a severe downside scenario weighted at 10 per cent. With the base case already pre-defined, the other three scenarios are constructed as averages of constituent modelled scenarios around the 15th, 75th and 95th percentiles of the distribution. The scenario weights therefore represent the allocation to each summary segment of the distribution and not a subjective view on likelihood. The inclusion of a severe downside scenario with a smaller weighting but relatively large credit losses, ensures the non-linearity of losses in the tail of the distribution is captured when ECL based on the weighted result of the four scenarios is calculated.
A committee under the chairmanship of the Chief Economist meets at least quarterly to review and, if appropriate, recommend changes to the method by which economic scenarios are generated; for approval by the Chief Financial Officer and Chief Risk Officer. In 2020, a change was made to the way in which the distribution of scenarios is created. This change allows for a greater dispersal of economic outcomes in the early periods of the forecast, to recognise the increased near-term profile of risks present since the onset of the coronavirus pandemic. This change allows for a wider distribution of losses both on the upside and downside, although is most evident in the severe downside scenario, given it represents a more adverse segment of the distribution. The change is estimated to have driven an additional £200 million of ECL resulting from the inclusion of more adverse economic outcomes.
Base Case and MES Economic AssumptionsThe Group’s base case economic scenario has continued to be revised in light of the impact of the coronavirus pandemic in the UK and globally. The scenario reflects judgements of the net effect of government-mandated restrictions on economic activity, large-scale government interventions, and behavioural changes by households and businesses that may persist beyond the rollout of coronavirus vaccination programmes.
Despite large-scale vaccination efforts commencing in the UK and globally, there remains considerable uncertainty about the pace and eventual extent of the post-pandemic recovery. The Group’s current base case scenario builds in three key conditioning assumptions. First, the UK vaccine rollout successfully protects the elderly, key workers and the clinically vulnerable by mid-2021. Second, national lockdowns end by April 2021, allowing a phased return to a tiered system of restrictions that are progressively eased in the second quarter and second half of 2021, leaving only limited restrictions in place by the end of 2021. Third, government policy measures including specifically the furlough scheme continue to provide support for the duration of severe economic restrictions, through to mid-2021.
Conditioned on the above assumptions and despite the recovery in economic activity resuming from the second quarter of 2021, the Group’s base case outlook assumes a rise in the unemployment rate and weakness in residential and commercial property prices. Risks around this base case economic view lie in both directions and are partly captured by the MES generated. But uncertainties relating to the key conditioning assumptions, including epidemiological developments and the efficacy of vaccine rollouts, are not specifically captured by the MES scenarios. These specific risks have been recognised outside the modelled scenarios published below.
The Group has accommodated the latest available information at the reporting date in defining its base case scenario and generating the MES. The scenarios include forecasts for key variables in the fourth quarter of 2020, for which actuals may have since emerged prior to publication.
Notes to the consolidated financial statements continued
Note 3: Critical accounting judgements and estimates continued

Strategic rep
ortFinancial results
Governance
Risk manag
ement
Other inform
ationFinancial statem
ents Lloyds Banking Group Annual Report and Accounts 2020 233
Base case scenario by quarter1
First quarter
2020
Second quarter
2020
Third quarter
2020
Fourth quarter
2020
First quarter
2021
Second quarter
2021
Third quarter
2021
Fourth quarter
2021Base case % % % % % % % %
Gross domestic product (3.0) (18.8) 16.0 (1.9) (3.8) 5.6 3.6 1.5
UK Bank Rate 0.10 0.10 0.10 0.10 0.10 0.10 0.10 0.10
Unemployment rate 4.0 4.1 4.8 5.0 5.2 6.5 8.0 7.5
House price growth 2.8 2.6 7.2 5.9 5.5 4.7 (1.6) (3.8)
Commercial real estate price growth (5.0) (7.8) (7.8) (7.0) (6.1) (2.9) (2.2) (1.7)
1 Gross domestic product presented quarter on quarter, house price growth and commercial real estate growth presented year on year - i.e. from the equivalent quarter the previous year. Bank Rate is presented end quarter.
Scenarios by yearKey annual assumptions made by the Group are shown below. Gross domestic product is presented as an annual change, house price growth and commercial real estate price growth are presented as the growth in the respective indices within the period. UK Bank Rate and unemployment rate are averages for the period.
2020 2021 2022 2023 2024% % % % %
Upside
Gross domestic product (10.5) 3.7 5.7 1.7 1.5
UK Bank Rate 0.10 1.14 1.27 1.20 1.21
Unemployment rate 4.3 5.4 5.4 5.0 4.5
House price growth 6.3 (1.4) 5.2 6.0 5.0
Commercial real estate price growth (4.6) 9.3 3.9 2.1 0.3
Base case
Gross domestic product (10.5) 3.0 6.0 1.7 1.4
UK Bank Rate 0.10 0.10 0.10 0.21 0.25
Unemployment rate 4.5 6.8 6.8 6.1 5.5
House price growth 5.9 (3.8) 0.5 1.5 1.5
Commercial real estate price growth (7.0) (1.7) 1.6 1.1 0.6
Downside
Gross domestic product (10.6) 1.7 5.1 1.4 1.4
UK Bank Rate 0.10 0.06 0.02 0.02 0.03
Unemployment rate 4.6 7.9 8.4 7.8 7.0
House price growth 5.6 (8.4) (6.5) (4.7) (3.0)
Commercial real estate price growth (8.7) (10.6) (3.2) (0.8) (0.8)
Severe downside
Gross domestic product (10.8) 0.3 4.8 1.3 1.2
UK Bank Rate 0.10 0.00 0.00 0.01 0.01
Unemployment rate 4.8 9.9 10.7 9.8 8.7
House price growth 5.3 (11.1) (12.5) (10.7) (7.6)
Commercial real estate price growth (11.0) (21.4) (9.8) (3.9) (0.8)
Economic assumptions - five year averageThe key UK economic assumptions made by the Group averaged over a five-year period are shown below. The five-year period reflects movements within the current reporting year such that 31 December 2020 reflects five years 2020 to 2024. The prior year comparative data has been re-presented to align to the equivalent period, 2019 to 2023. The inclusion of the reporting year within the five-year period reflects the need to predict variables which remain unpublished at the reporting date, and recognises that credit models utilise both level and annual change in calculating ECL. The use of calendar years also maintains a comparability between tables disclosed.
At 31 December 2020 At 31 December 2019
Upside Base case DownsideSevere
downside Upside Base case DownsideSevere
downside% % % % % % % %
Gross domestic product 0.3 0.1 (0.4) (0.8) 1.6 1.3 1.0 0.3
UK Bank Rate 0.98 0.15 0.05 0.02 1.87 1.15 0.51 0.17
Unemployment rate 5.0 5.9 7.1 8.8 3.9 4.3 5.5 6.7
House price growth 4.2 1.1 (3.5) (7.5) 5.1 1.4 (2.5) (7.0)
Commercial real estate price growth 2.1 (1.1) (4.9) (9.7) 1.6 (0.3) (3.9) (7.3)
Note 3: Critical accounting judgements and estimates continued

234 Lloyds Banking Group Annual Report and Accounts 2020
Economic assumptions - start to peak
At 31 December 2020 At 31 December 2019
Upside Base case DownsideSevere
downside Upside Base case DownsideSevere
downside% % % % % % % %
Gross domestic product 1.4 0.8 (1.7) (3.0) 8.4 6.6 5.5 1.8
UK Bank Rate 1.44 0.25 0.10 0.10 2.56 1.75 0.75 0.75
Unemployment rate 6.5 8.0 9.3 11.5 4.4 4.6 6.9 8.3
House price growth 22.6 5.9 5.6 5.3 28.3 7.1 2.7 2.7
Commercial real estate price growth 11.0 (2.7) (2.7) (2.7) 8.8 (0.8) (0.8) (0.8)
Economic assumptions - start to trough
At 31 December 2020 At 31 December 2019
Upside Base case DownsideSevere
downside Upside Base case DownsideSevere
downside% % % % % % % %
Gross domestic product (21.2) (21.2) (21.2) (21.2) 0.3 0.3 0.3 (2.4)
UK Bank Rate 0.10 0.10 0.01 0.00 0.75 0.75 0.35 0.01
Unemployment rate 4.0 4.0 4.0 4.0 3.4 3.8 3.8 3.8
House price growth (0.5) (0.5) (16.4) (32.4) 1.5 0.0 (12.0) (30.3)
Commercial real estate price growth (6.9) (9.0) (22.2) (39.9) (1.4) (2.3) (17.9) (31.4)
ECL sensitivity to economic assumptionsThe table below shows the extent to which a higher ECL allowance has been recognised to take account of forward-looking information from the weighted multiple economic scenarios. A significant difference between these bases arises on UK mortgages as the probability-weighted ECL includes the impact of house price movements on the loss given default (LGD). Commercial Banking also reflects movements in the loss given default, whereas for Other Retail portfolios only the probability of default responds to changes in the economic outlook. ECL applied through individual assessments and post-model adjustments is reported flat against each economic scenario, reflecting the basis on which they are evaluated. Judgements applied through changes to inputs are reflected in the scenario sensitivities.
At 31 December 2020 At 31 December 2019
Base caseProbability-
weighted Difference Base caseProbability-
weighted DifferenceImpact of multiple economic scenarios £m £m £m £m £m £m
UK mortgages 804 1,027 223 464 569 105
Other Retail 2,310 2,368 58 1,492 1,521 29
Commercial Banking 2,177 2,402 225 1,258 1,315 57
Other 450 450 — 50 50 —
ECL allowance 5,741 6,247 506 3,264 3,455 191
The table below shows the Group’s ECL for the upside, base case, downside and severe downside scenarios. The stage allocation for an asset is based on the overall scenario probability-weighted PD and, hence, the Stage 2 allocation is constant across all the scenarios. ECL applied through individual assessments and post-model adjustments is reported flat against each economic scenario, reflecting the basis on which they are evaluated. Judgements applied through changes to inputs are reflected in the scenario sensitivities.
At 31 December 2020 At 31 December 2019
Probability- weighted Upside Base case Downside
Severe downside
Probability- weighted Upside Base case Downside
Severe downside
£m £m £m £m £m £m £m £m £m £m
UK mortgages 1,027 614 804 1,237 2,306 569 317 464 653 1,389
Other Retail 2,368 2,181 2,310 2,487 2,745 1,521 1,443 1,492 1,564 1,712
Commercial Banking 2,402 1,910 2,177 2,681 3,718 1,315 1,211 1,258 1,382 1,597
Other 450 448 450 450 456 50 50 50 50 50
ECL allowance 6,247 5,153 5,741 6,855 9,225 3,455 3,021 3,264 3,649 4,748
Notes to the consolidated financial statements continued
Note 3: Critical accounting judgements and estimates continued

Strategic rep
ortFinancial results
Governance
Risk manag
ement
Other inform
ationFinancial statem
ents Lloyds Banking Group Annual Report and Accounts 2020 235
The table below shows the Group’s ECL for the upside, base case, downside and severe downside scenarios, with stage allocation based on each specific scenario. ECL applied through individual assessments and post-model adjustments is reported flat against each economic scenario, reflecting the basis on which they are evaluated. Judgements applied through changes to inputs are reflected in the scenario sensitivities. A probability-weighted scenario is not shown as this does not reflect the basis on which ECL is reported.
At 31 December 2020 At 31 December 2019
Upside Base case DownsideSevere
downside Upside Base case DownsideSevere
downside£m £m £m £m £m £m £m £m
UK mortgages 602 797 1,269 2,578 311 461 670 1,667
Other Retail 2,154 2,299 2,509 2,819 1,435 1,486 1,570 1,740
Commercial Banking 1,892 2,157 2,738 4,155 1,206 1,254 1,387 1,625
Other 448 449 450 457 49 50 50 51
ECL allowance 5,096 5,702 6,966 10,009 3,001 3,251 3,677 5,083
The table below shows the percentage of assets that would be recorded in Stage 2 for the upside, base case, downside and severe downside scenarios, if stage allocation was based on each specific scenario. Given additional data has been generated to support this new disclosure the prior year comparatives are not available.
At 31 December 2020 At 31 December 2019
Upside Base case DownsideSevere
downside Upside Base case DownsideSevere
downside% % % % % % % %
UK mortgages 6.9 8.9 11.8 16.7
Other Retail 12.6 13.5 15.2 17.9
Commercial Banking 8.2 10.9 17.5 24.9
Other — — — —
Percentage of assets in Stage 2 7.0 8.7 11.8 16.4
The impact of changes in the UK unemployment rate and House Price Index (HPI) have also been assessed. Although such changes would not be observed in isolation, as economic indicators tend to be correlated in a coherent scenario, this gives insight into the sensitivity of the Group’s ECL to gradual changes in these two critical economic factors. The assessment has been made against the base case with the reported staging unchanged.
The table below shows the impact on the Group’s ECL in respect of UK mortgages resulting from a decrease/increase in loss given default for a 10 percentage point (pp) increase or decrease in the UK House Price Index (HPI). The increase/decrease is presented based on the adjustment phased evenly over the first ten quarters of the base case scenario.
At 31 December 2020 At 31 December 2019
10pp increase in HPI
10pp decrease in HPI
10pp increase in HPI
10pp decrease in HPI
ECL impact, £m (206) 284 (110) 147
The table below shows the impact on the Group’s ECL resulting from a 1 percentage point (pp) increase or decrease in the UK unemployment rate. The increase or decrease is presented based on the adjustment phased evenly over the first ten quarters of the base case scenario. An immediate increase or decrease would drive a more material ECL impact as it would be fully reflected in both 12 month and lifetime PDs.
At 31 December 2020 At 31 December 2019
1pp increase in unemployment
1pp decrease in unemployment
1pp increase in unemployment
1pp decrease in unemployment
£m £m £m £m
UK mortgages 25 (23) 33 (34)
Other Retail 54 (54) 39 (54)
Commercial Banking 125 (112) 68 (54)
Other 1 (1) 1 (1)
ECL impact 205 (190) 141 (143)
Individual assessmentsStage 3 ECL in Commercial Banking is largely assessed on an individual basis using bespoke assessment of loss for each specific client. These assessments are carried out by the Business Support Unit based on detailed reviews and expected recovery strategies. While these assessments are based on the Group’s latest economic view, the use of group-wide multiple economic scenarios and weightings is not considered appropriate for these cases due to their individual characteristics. In place of this a range of case specific outcomes are considered with any alternative better or worse outcomes that carry a 25 per cent likelihood taken into account in establishing a probability-weighted ECL. At 31 December 2020 individually assessed provisions for Commercial Banking were £1,222 million (2019: £890 million) which reflected a range of £982 million to £1,548 million (2019: £515 million to £1,183 million), based on the range of alternative outcomes considered.
Note 3: Critical accounting judgements and estimates continued

236 Lloyds Banking Group Annual Report and Accounts 2020
Application of judgement in adjustments to modelled ECLImpairment models fall within the Group’s Model Risk framework with model monitoring, periodic validation and back testing performed on model components (i.e. probability of default, exposure at default and loss given default). Limitations in the Group’s impairment models or data inputs, may be identified through the ongoing assessment and validation of the output of the models. In these circumstances, management make appropriate adjustments to the Group’s allowance for impairment losses to ensure that the overall provision adequately reflects all material risks. These adjustments are determined by considering the particular attributes of exposures which have not been adequately captured by the impairment models and range from changes to model inputs and parameters, at account level, through to more qualitative post-model overlays.
Judgements are not typically assessed under each distinct economic scenario used to generate ECL, but instead are applied on the basis of final modelled ECL which reflects the probability weighted view of all scenarios. All adjustments are reviewed quarterly and are subject to internal review and challenge, including by the Audit Committee, to ensure that amounts are appropriately calculated and that there are specific release criteria within a reasonable timeframe.
At 31 December 2020 the coronavirus pandemic and the various support measures that have been put in place have resulted in an economic environment which differs significantly from the historical economic conditions upon which the impairment models have been built. As a result there is a greater need for management judgements to be applied alongside the use of models. At 31 December 2020 management judgement resulted in additional ECL allowances totalling £1,383 million (2019: £153 million). This comprises judgements added due to COVID-19 in the year and other judgements not directly linked to COVID-19 but which have increased in size under the current outlook. The table below analyses total ECL allowance at 31 December 2020 by portfolio, separately identifying the amounts that have been modelled, those that have been individually assessed and those arising through the application of management judgement.
Modelled ECL
Individually assessed
Judgements due to
COVID-191Other
judgements Total ECL£m £m £m £m £m
At 31 December 2020
UK Mortgages 481 — 36 510 1,027
Other Retail 2,060 — 321 (13) 2,368
Commercial Banking 1,051 1,222 131 (2) 2,402
Other 50 — 400 — 450
Total 3,642 1,222 888 495 6,247
At 31 December 2019
UK Mortgages 386 — — 183 569
Other Retail 1,531 — — (10) 1,521
Commercial Banking 445 890 — (20) 1,315
Other 50 — — — 50
Total 2,412 890 — 153 3,455
1 Judgements introduced in 2020 due to the impact that COVID-19 and resulting interventions have had on the Group’s economic outlook and observed loss experience, which have required additional model limitations to be addressed.
Judgements due to COVID-19
UK mortgages: £36 millionThis reflects an adjustment made to reflect an increase in the time assumed between default and repossession as a result of the Group temporarily suspending the repossession of properties to support customers during the pandemic.
Other Retail: £321 millionThese adjustments principally comprise:
Recognition of impact of support measures: £218 million
The use of payment holidays along with subdued levels of consumer spending is judged to have temporarily reduced the flow of accounts into arrears and default and to have also improved average credit scores across portfolios. Management believes that the resulting position does not fully reflect the underlying credit risk in the portfolios. Adjustments have therefore been made to increase expected future rates of default and remove the impact of the observed improvement in average credit scores.
Incorporation of forward-looking LGDs: £86 million
Modelled LGDs in non-mortgage Retail portfolios are predominantly based on observed customer behaviour and resulting incurred losses. Management believes that this may not be representative of future experience, given the current economic outlook, and consequently an adjustment has been made to increase forward-looking LGDs to reflect a deterioration in cure and recovery rates. The impact has been estimated by using experience of losses in previous downturns and management’s view of relative comparability of anticipated economic scenarios.
Commercial Banking: £131 millionThis adjustment principally comprises:
Adjustment to economic variables used as inputs to models: £93 million
Management does not believe that the observed corporate insolvency rates used as an input to Commercial default models adequately reflect the current economic situation and outlook given the temporary government support. As a result, the observed reductions in the rate of insolvencies have been replaced with an increase proportionate to that seen in unemployment to generate a level of predicted defaults.
Notes to the consolidated financial statements continued
Note 3: Critical accounting judgements and estimates continued

Strategic rep
ortFinancial results
Governance
Risk manag
ement
Other inform
ationFinancial statem
ents Lloyds Banking Group Annual Report and Accounts 2020 237
Other: £400 millionCentral overlay in respect of economic uncertainty: £400 million
An important element of the methodology used to calculate the Group’s ECL allowance is the determination of a base case economic scenario, predicated on certain conditioning assumptions, from which alternative scenarios are derived using stochastic shocks. The rapid evolution of the pandemic and significant changes that this has brought about could continue into 2021 and may partially invalidate the conditioning assumptions that underpin the Group’s base case scenario. Management believes that the risks to the conditioning assumptions around the base case scenario are markedly to the downside, reflecting notably the potential for a material delay in the vaccination programme or reduction in its effectiveness from further virus mutation and the corresponding delayed withdrawal of restrictions on social interaction or introduction of further lockdowns. The Group's ECL allowances are required to reflect an unbiased probability-weighted view of all possible future outcomes and therefore management believes that an adjustment is required to capture these additional risks.
An adjustment of £400 million has been made to increase the Group’s ECL allowances to reflect this increased uncertainty around the conditioning assumptions. This equates to a 1 percentage point increase in unemployment allied with a 5 per cent lower HPI in 2021, reflecting a more immediate and therefore greater ECL impact than the gradual increase reflected in the stated univariate sensitivity. It is proportionate to the level of volatility seen in forecasts as the pandemic has unfolded and is also equivalent to a 10 per cent re-weighting from the upside to the severe downside scenario. The adjustment, which has not been allocated to a specific portfolio, has been allocated against Stage 1 assets given the downside risks are largely considered to relate to exposures with currently low default probabilities, the majority of which are in Stage 1. Through 2021 the scale of the uncertainty is expected to diminish and the need for this adjustment will then be reassessed.
Other judgements
UK mortgages: £510 million (2019: £183 million)These adjustments principally comprise:
Adjustment to modelled forecast parameters: £193 million (2019: £nil)
Adjustments have been required to the estimated defaults used within the ECL calculation for UK mortgages following the adoption of new default forecast models. Forecast models which predict quarterly defaults based on several economic variables have been developed using the response from the previous recession, as per usual modelling best practice. However, management believe further adjustments are necessary when the results of these models have been benchmarked to observed levels, given the atypical nature of the current economic outlook. These were derived using historical observed default rates under previous downturn conditions to ensure that the resulting forecast best reflected management’s view given the current economic outlook. The adjustment to forward-looking parameters prior to their use in ECL calculations ensures that all downstream account level calculations reflect the Group’s best view of credit losses in respect of the economic scenarios stated. As such this in-model adjustment is reflected within all scenarios, assessment of staging and in subsequent assessment of all post-model adjustments.
End-of-term interest-only: £179 million (2019: £132 million)
The current definition of default used in the UK mortgages impairment model excludes past term interest-only accounts that continue to make interest payments but have missed their capital payment upon maturity of the loan. This adjustment therefore mitigates the risk that the model understates the credit losses associated with interest-only accounts which have missed, or will potentially miss, their final capital payment. For those accounts that have reached end of term this adjustment manually overwrites PDs to 70 per cent or 100 per cent, thereby moving them into Stage 2, or Stage 3, depending on whether they are deemed performing, or non-performing respectively. For interest-only accounts with six years or less to maturity an appropriate incremental PD uplift is made to PDs based on the probability of missing a future capital payment, assessed through segmentation of behaviour score, debt-to-value and worst ever arrears status. The increase in the judgement in 2020 is primarily driven by an increase in the stock of long-term defaults following COVID-19 related litigation suspension.
Long-term defaults: £87 million (2019: £33 million)
The Group suspended mortgage litigation activity between late 2014 and mid 2018 as changes were implemented to the treatment of amounts in arrears, interrupting the natural flow of accounts to possession. An adjustment is made to ensure adequate provision coverage considering the resulting build-up of accounts in long term default. Coverage is uplifted to the equivalent levels of those accounts already in repossession on an estimated shortfall of balances expected to flow to possession. A further adjustment is made to mitigate for the risk that credit model provision understates the probability of possession for accounts which have been in default for more than 24 months, with an arrears balance increase in the last 6 months. These accounts have their probability of possession set to 95 per cent based on observed historical losses incurred on accounts that were of an equivalent status. The increase in judgement in 2020 is primarily driven by an increase in the stock of long-term defaults following COVID-19 related litigation suspension.
Other Retail: £(13) million (2019: £(10) million)These adjustments principally comprise:
Lifetime extension on revolving products: £81 million (2019: £36 million)
Unsecured revolving products use a model lifetime definition of three years based on historic data which shows that substantially all accounts resolve in this time. An adjustment is made to extend the lifetime used for Stage 2 exposures to six years by adding incremental probability of default through the extrapolation of the default trajectory observed throughout the three years and beyond. The resulting additional ECL allowance is added to Stage 2 accounts proportionate to the modelled three year PD. The increase in the judgement in 2020 is driven by growth in Stage 2 assets and their coverage, rather than any change to the lifetime assumption.
Unsecured non-scored accounts: £(72) million (2019: £nil)
Due to a shortcoming in the models, it is not possible to retrieve relevant credit data for a number of accounts and therefore no PD is available and no assessment of whether there has been a SICR can be carried out. The model defaults these accounts to Stage 2 and a proxy ECL allowance calculated based on similar accounts within the portfolio. The deterioration in the economic outlook and growth in the number of accounts subject to this proxy have resulted in this approach having a more significant effect and an exercise has been carried out to identify and adjust those accounts which should not have been allocated to Stage 2.
Credit Card LGD alignment: £(55) million (2019: £(22) million)
The MBNA impairment model was developed using historical MBNA data. Following the acquisition of the business and the subsequent migration of this portfolio to Lloyds Banking Group collections strategies an adjustment is required to reflect the recent improvement in cure rates now evident as collections strategies harmonise, which are not captured by the original MBNA model development data.
Note 3: Critical accounting judgements and estimates continued
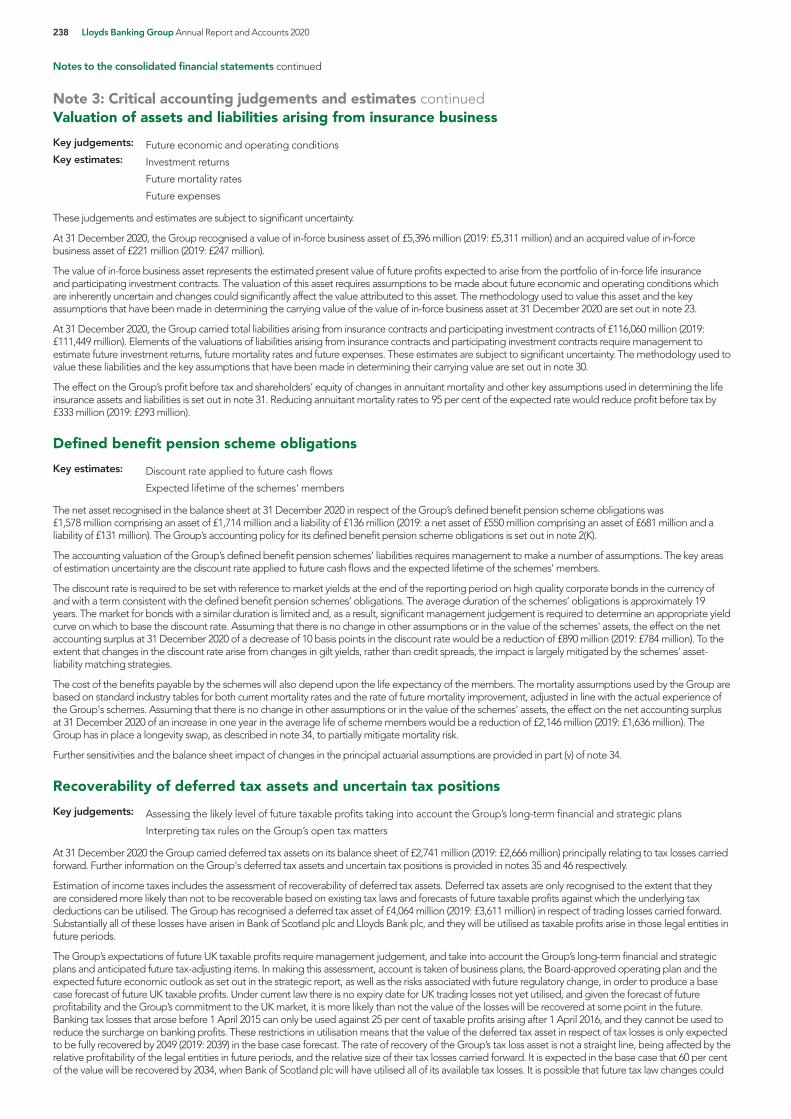
238 Lloyds Banking Group Annual Report and Accounts 2020
Valuation of assets and liabilities arising from insurance business
Key judgements: Future economic and operating conditionsKey estimates: Investment returns
Future mortality rates
Future expenses
These judgements and estimates are subject to significant uncertainty.
At 31 December 2020, the Group recognised a value of in-force business asset of £5,396 million (2019: £5,311 million) and an acquired value of in-force business asset of £221 million (2019: £247 million).
The value of in-force business asset represents the estimated present value of future profits expected to arise from the portfolio of in-force life insurance and participating investment contracts. The valuation of this asset requires assumptions to be made about future economic and operating conditions which are inherently uncertain and changes could significantly affect the value attributed to this asset. The methodology used to value this asset and the key assumptions that have been made in determining the carrying value of the value of in-force business asset at 31 December 2020 are set out in note 23.
At 31 December 2020, the Group carried total liabilities arising from insurance contracts and participating investment contracts of £116,060 million (2019: £111,449 million). Elements of the valuations of liabilities arising from insurance contracts and participating investment contracts require management to estimate future investment returns, future mortality rates and future expenses. These estimates are subject to significant uncertainty. The methodology used to value these liabilities and the key assumptions that have been made in determining their carrying value are set out in note 30.
The effect on the Group’s profit before tax and shareholders’ equity of changes in annuitant mortality and other key assumptions used in determining the life insurance assets and liabilities is set out in note 31. Reducing annuitant mortality rates to 95 per cent of the expected rate would reduce profit before tax by £333 million (2019: £293 million).
Defined benefit pension scheme obligations
Key estimates: Discount rate applied to future cash flows
Expected lifetime of the schemes' members
The net asset recognised in the balance sheet at 31 December 2020 in respect of the Group’s defined benefit pension scheme obligations was £1,578 million comprising an asset of £1,714 million and a liability of £136 million (2019: a net asset of £550 million comprising an asset of £681 million and a liability of £131 million). The Group’s accounting policy for its defined benefit pension scheme obligations is set out in note 2(K).
The accounting valuation of the Group’s defined benefit pension schemes’ liabilities requires management to make a number of assumptions. The key areas of estimation uncertainty are the discount rate applied to future cash flows and the expected lifetime of the schemes’ members.
The discount rate is required to be set with reference to market yields at the end of the reporting period on high quality corporate bonds in the currency of and with a term consistent with the defined benefit pension schemes’ obligations. The average duration of the schemes’ obligations is approximately 19 years. The market for bonds with a similar duration is limited and, as a result, significant management judgement is required to determine an appropriate yield curve on which to base the discount rate. Assuming that there is no change in other assumptions or in the value of the schemes' assets, the effect on the net accounting surplus at 31 December 2020 of a decrease of 10 basis points in the discount rate would be a reduction of £890 million (2019: £784 million). To the extent that changes in the discount rate arise from changes in gilt yields, rather than credit spreads, the impact is largely mitigated by the schemes' asset-liability matching strategies.
The cost of the benefits payable by the schemes will also depend upon the life expectancy of the members. The mortality assumptions used by the Group are based on standard industry tables for both current mortality rates and the rate of future mortality improvement, adjusted in line with the actual experience of the Group's schemes. Assuming that there is no change in other assumptions or in the value of the schemes' assets, the effect on the net accounting surplus at 31 December 2020 of an increase in one year in the average life of scheme members would be a reduction of £2,146 million (2019: £1,636 million). The Group has in place a longevity swap, as described in note 34, to partially mitigate mortality risk.
Further sensitivities and the balance sheet impact of changes in the principal actuarial assumptions are provided in part (v) of note 34.
Recoverability of deferred tax assets and uncertain tax positions
Key judgements: Assessing the likely level of future taxable profits taking into account the Group’s long-term financial and strategic plans
Interpreting tax rules on the Group’s open tax matters
At 31 December 2020 the Group carried deferred tax assets on its balance sheet of £2,741 million (2019: £2,666 million) principally relating to tax losses carried forward. Further information on the Group's deferred tax assets and uncertain tax positions is provided in notes 35 and 46 respectively.
Estimation of income taxes includes the assessment of recoverability of deferred tax assets. Deferred tax assets are only recognised to the extent that they are considered more likely than not to be recoverable based on existing tax laws and forecasts of future taxable profits against which the underlying tax deductions can be utilised. The Group has recognised a deferred tax asset of £4,064 million (2019: £3,611 million) in respect of trading losses carried forward. Substantially all of these losses have arisen in Bank of Scotland plc and Lloyds Bank plc, and they will be utilised as taxable profits arise in those legal entities in future periods.
The Group’s expectations of future UK taxable profits require management judgement, and take into account the Group’s long-term financial and strategic plans and anticipated future tax-adjusting items. In making this assessment, account is taken of business plans, the Board-approved operating plan and the expected future economic outlook as set out in the strategic report, as well as the risks associated with future regulatory change, in order to produce a base case forecast of future UK taxable profits. Under current law there is no expiry date for UK trading losses not yet utilised, and given the forecast of future profitability and the Group’s commitment to the UK market, it is more likely than not the value of the losses will be recovered at some point in the future. Banking tax losses that arose before 1 April 2015 can only be used against 25 per cent of taxable profits arising after 1 April 2016, and they cannot be used to reduce the surcharge on banking profits. These restrictions in utilisation means that the value of the deferred tax asset in respect of tax losses is only expected to be fully recovered by 2049 (2019: 2039) in the base case forecast. The rate of recovery of the Group’s tax loss asset is not a straight line, being affected by the relative profitability of the legal entities in future periods, and the relative size of their tax losses carried forward. It is expected in the base case that 60 per cent of the value will be recovered by 2034, when Bank of Scotland plc will have utilised all of its available tax losses. It is possible that future tax law changes could
Notes to the consolidated financial statements continued
Note 3: Critical accounting judgements and estimates continued

Strategic rep
ortFinancial results
Governance
Risk manag
ement
Other inform
ationFinancial statem
ents Lloyds Banking Group Annual Report and Accounts 2020 239
materially affect the timing of recovery and the value of these losses ultimately realised by the Group. The value of the deferred tax asset in respect of tax losses increased by £420 million in 2020 as a result of the change in UK tax rates (see note 35).
As disclosed in note 46, the Group has an open matter in relation to a claim for group relief of losses incurred in its former Irish banking subsidiary, where the final tax position will remain uncertain until the matter is finally determined by judicial process.
Regulatory provisions
Key judgements: Determining the scope of reviews required by regulators
The impact of legal decisions that may be relevant to claims receivedKey estimates: The number of future complaints
The proportion of complaints that will be upheld
The average cost of redress
At 31 December 2020, the Group carried provisions of £642 million (2019: £2,408 million) against the cost of making redress payments to customers and the related administration costs in connection with historical regulatory breaches.
Determining the amount of the provisions, which represent management’s best estimate of the cost of settling these issues, requires the exercise of significant judgement and estimation. It will often be necessary to form a view on matters which are inherently uncertain, such as the scope of reviews required by regulators, and to estimate the number of future complaints, the extent to which they will be upheld, the average cost of redress and the impact of decisions reached by legal and other review processes that may be relevant to claims received. Consequently the continued appropriateness of the underlying assumptions is reviewed on a regular basis against actual experience and other relevant evidence and adjustments made to the provisions where appropriate.
Fair value of financial instruments
Key estimates: Interest rate spreads, earning multiples and interest rate volatility
At 31 December 2020, the carrying value of the Group’s financial instrument assets held at fair value was £248,385 million (2019: £234,467 million), and its financial instrument liabilities held at fair value was £49,959 million (2019: £47,265 million).
The valuation techniques for level 3 financial instruments involve management judgement and estimates the extent of which depends on the complexity of the instrument and the availability of market observable information. In addition, in line with market practice, the Group applies credit, debit and funding valuation adjustments in determining the fair value of its uncollateralised derivative positions. A description of these adjustments is set out in note 48. Details about sensitivities to market risk arising from trading assets and other treasury positions can be found in the risk management section on page 159.
Recoverability of other intangible assets
Key judgements: Assessing future trading conditions that could affect the Group’s business operations
Assessing whether certain of the Group’s purchased brands have an indefinite lifeKey estimates: The value-in-use calculations require management to estimate future cash flows, appropriate discount rates for those cash flows and
long-term sustainable growth rates
Estimated useful life of internally generated capitalised software
At 31 December 2020, the carrying value of the Group’s other intangible assets was £4,140 million (2019: £3,808 million), including capitalised software enhancements of £3,309 million (2019: £2,907 million) and brands of £380 million (2019: £380 million).
In determining the estimated useful life of capitalised software enhancements, management consider the product's lifecycle and the Group's technology strategy; assets are reviewed annually to assess whether there is any indication of impairment and to confirm that the remaining estimated useful life is still appropriate. For the year ended 31 December 2020, the amortisation charge was £590 million and at 31 December 2020, the weighted-average remaining estimated useful life of the Group’s capitalised software enhancements was 4.9 years (2019: 4.7 years). If the Group reduced by one year the estimated useful life of those assets with a remaining estimated useful life of more than two years at 31 December 2020, the 2021 amortisation charge would be approximately £175 million higher.
Brands arising from the acquisition of Bank of Scotland in 2009 are recognised on the Group's balance sheet and have been determined to have an indefinite useful life. The carrying value at 31 December 2020 was £380 million (2019: £380 million). The recoverable amount has been based on a value-in-use calculation. The calculation uses post-tax projections of the income generated by the brands, a discount rate of 9.31 per cent and a future growth rate of 2.5 per cent . Management estimates that if the growth rate were decreased by 1 per cent there would have been an impairment charge of £50 million.
Note 3: Critical accounting judgements and estimates continued

240 Lloyds Banking Group Annual Report and Accounts 2020
Note 4: Segmental analysisLloyds Banking Group provides a wide range of banking and financial services in the UK and in certain locations overseas.
The Group Executive Committee (GEC) has been determined to be the chief operating decision maker for the Group. The Group’s operating segments reflect its organisational and management structures. The GEC reviews the Group’s internal reporting based around these segments in order to assess performance and allocate resources. GEC considers interest income and expense on a net basis and consequently the total interest income and expense for all reportable segments is presented net. The segments are differentiated by the type of products provided and by whether the customers are individuals or corporate entities.
The segmental results and comparatives are presented on an underlying basis, the basis reviewed by the chief operating decision maker. The effects of the following are excluded in arriving at underlying profit:
– market volatility and asset sales, including the effects of certain asset sales, the volatility relating to the Group’s own debt and hedging arrangements and that arising in the insurance businesses;
– the unwind of acquisition-related fair value adjustments and the amortisation of purchased intangible assets;
– restructuring costs, principally comprising severance costs, the costs of integrating newly acquired businesses, the costs of regulatory reform and the rationalisation of the property portfolio; and
– payment protection insurance.
For the purposes of the underlying income statement, operating lease depreciation (net of gains on disposal of operating lease assets) is shown as an adjustment to total income.
During 2020, the Group migrated certain customer relationships from the SME business within Commercial Banking to Business Banking within Retail; the Group has also revised its approach to internal funding charges, including the adoption of the Sterling Overnight Index Average (SONIA) interest rate benchmark in place of LIBOR. Comparatives have been restated accordingly.
The Group’s activities are organised into three financial reporting segments: Retail; Commercial Banking; and Insurance and Wealth.
Retail offers a broad range of financial service products, including current accounts, savings, mortgages, motor finance and unsecured consumer lending to personal and small business customers.
Commercial Banking provides a range of products and services such as lending, transactional banking, working capital management, risk management and debt capital markets services to SMEs, corporates and financial institutions.
Insurance and Wealth offers insurance, investment and wealth management products and services.
Income and expenditure not attributed to these financial reporting segments, including the costs of certain central and head office functions and the Group’s private equity business, Lloyds Development Capital, is disclosed as Other.
Inter-segment services are generally recharged at cost, although some attract a margin. In particular a profit margin is charged on the internal commission arrangements between the UK branch and other distribution networks and the insurance product manufacturing businesses within the Group. Inter-segment lending and deposits are generally entered into at market rates, except that non-interest bearing balances are priced at a rate that reflects the external yield that could be earned on such funds.
For the majority of those derivative contracts entered into by business units for risk management purposes, the business unit recognises the net interest income or expense on an accrual accounting basis and transfers the remainder of the movement in the fair value of the derivative to the central function where the resulting accounting volatility is managed where possible through the establishment of hedge accounting relationships. Any change in fair value of the hedged instrument attributable to the hedged risk is also recorded within the central function. This allocation of the fair value of the derivative and change in fair value of the hedged instrument attributable to the hedged risk avoids accounting asymmetry in segmental results and leads to accounting volatility, which is managed centrally and reported within Other.
Notes to the consolidated financial statements continued

Strategic rep
ortFinancial results
Governance
Risk manag
ement
Other inform
ationFinancial statem
ents Lloyds Banking Group Annual Report and Accounts 2020 241
RetailCommercial
BankingInsurance
and Wealth OtherUnderlying basis total
£m £m £m £m £m
Year ended 31 December 2020
Net interest income 8,384 2,357 49 (17) 10,773
Other income, net of insurance claims 1,733 1,292 1,250 240 4,515
Total underlying income, net of insurance claims 10,117 3,649 1,299 223 15,288
Operating lease depreciation1 (856) (28) — — (884)
Net income 9,261 3,621 1,299 223 14,404
Operating costs (4,761) (1,851) (902) (71) (7,585)
Remediation (125) (210) (50) 6 (379)
Total costs (4,886) (2,061) (952) (65) (7,964)
Impairment charge (2,384) (1,464) (9) (390) (4,247)
Underlying profit (loss) 1,991 96 338 (232) 2,193
External income 11,868 3,246 1,223 (1,049) 15,288
Inter-segment income (expense) (1,751) 403 76 1,272 —
Segment underlying income, net of insurance claims 10,117 3,649 1,299 223 15,288
Segment external assets 358,766 142,042 183,348 187,113 871,269
Segment customer deposits 290,206 145,596 14,072 10,194 460,068
Segment external liabilities 295,229 189,302 190,771 146,554 821,856
Analysis of segment underlying other income, net of insurance claims:
Current accounts 498 113 4 — 615
Credit and debit card fees 517 231 — — 748
Commercial banking and treasury fees — 274 — — 274
Unit trust and insurance broking — — 146 — 146
Private banking and asset management — 5 1 — 6
Factoring — 76 — — 76
Other fees and commissions 62 176 204 1 443
Fees and commissions receivable 1,077 875 355 1 2,308
Fees and commissions payable (571) (222) (329) (26) (1,148)
Net fee and commission income 506 653 26 (25) 1,160
Operating lease rental income 1,103 17 — — 1,120
Rental income from investment properties — — 191 — 191
Gains less losses on disposal of financial assets at fair value through other comprehensive income — — — 149 149
Lease termination income — 5 — — 5
Trading income 69 787 — 204 1,060
Insurance and other, net of insurance claims 147 349 1,389 (1,055) 830
Other external income, net of insurance claims 1,319 1,158 1,580 (702) 3,355
Inter-segment other income (92) (519) (356) 967 —
Segment other income, net of insurance claims 1,733 1,292 1,250 240 4,515
Other segment items reflected in income statement above:
Depreciation and amortisation 1,760 263 159 550 2,732
Movement in value of in-force business — — 76 — 76
Defined benefit scheme charges 97 30 14 106 247
Non-income statement segment items:
Additions to fixed assets 1,684 112 125 980 2,901
Investments in joint ventures and associates at end of year 4 — — 292 296
1 Net of profits on disposal of operating lease assets of £127 million.
Note 4: Segmental analysis continued

242 Lloyds Banking Group Annual Report and Accounts 2020
RetailCommercial
BankingInsurance
and Wealth OtherUnderlying basis total
£m £m £m £m £m
Year ended 31 December 20191
Net interest income 9,184 2,892 77 224 12,377
Other income, net of insurance claims 2,019 1,417 2,021 275 5,732
Total underlying income, net of insurance claims 11,203 4,309 2,098 499 18,109
Operating lease depreciation2 (946) (21) — — (967)
Net income 10,257 4,288 2,098 499 17,142
Operating costs (4,768) (2,073) (982) (52) (7,875)
Remediation (238) (155) (50) (2) (445)
Total costs (5,006) (2,228) (1,032) (54) (8,320)
Impairment (charge) credit (1,038) (306) — 53 (1,291)
Underlying profit 4,213 1,754 1,066 498 7,531
External income 13,136 3,508 1,926 (461) 18,109
Inter-segment income (expense) (1,933) 801 172 960 —
Segment underlying income, net of insurance claims 11,203 4,309 2,098 499 18,109
Segment external assets 350,850 144,795 175,869 162,379 833,893
Segment customer deposits 253,128 144,050 13,677 10,465 421,320
Segment external liabilities 261,036 182,318 182,333 160,400 786,087
Analysis of segment underlying other income, net of insurance claims:
Current accounts 518 136 5 — 659
Credit and debit card fees 652 330 — — 982
Commercial banking and treasury fees — 248 — — 248
Unit trust and insurance broking 9 — 197 — 206
Private banking and asset management — 4 65 — 69
Factoring — 103 — — 103
Other fees and commissions 59 244 156 30 489
Fees and commissions receivable 1,238 1,065 423 30 2,756
Fees and commissions payable (571) (321) (405) (53) (1,350)
Net fee and commission income 667 744 18 (23) 1,406
Operating lease rental income 1,225 25 — — 1,250
Rental income from investment properties — — 191 — 191
Gains less losses on disposal of financial assets at fair value through other comprehensive income — (5) — 201 196
Lease termination income — 12 — — 12
Trading income 47 812 — 278 1,137
Insurance and other, net of insurance claims 206 72 2,216 (954) 1,540
Other external income, net of insurance claims 1,478 916 2,407 (475) 4,326
Inter-segment other income (126) (243) (404) 773 —
Segment other income, net of insurance claims 2,019 1,417 2,021 275 5,732
Other segment items reflected in income statement above:
Depreciation and amortisation 1,712 315 181 452 2,660
Movement in value of in-force business — — 825 — 825
Defined benefit scheme charges 108 43 19 75 245
Non-income statement segment items:
Additions to fixed assets 2,208 260 174 1,007 3,649
Investments in joint ventures and associates at end of year 4 — — 300 304
1 Restated, see page 240.2 Net of profits on disposal of operating lease assets of £41 million.
Notes to the consolidated financial statements continued
Note 4: Segmental analysis continued

Strategic rep
ortFinancial results
Governance
Risk manag
ement
Other inform
ationFinancial statem
ents Lloyds Banking Group Annual Report and Accounts 2020 243
RetailCommercial
BankingInsurance
and Wealth OtherUnderlying basis total
£m £m £m £m £m
Year ended 31 December 20181
Net interest income 9,431 2,985 123 175 12,714
Other income, net of insurance claims 2,102 1,665 1,865 378 6,010
Total underlying income, net of insurance claims 11,533 4,650 1,988 553 18,724
Operating lease depreciation2 (921) (35) — — (956)
Net income 10,612 4,615 1,988 553 17,768
Operating costs (4,904) (2,184) (1,021) (56) (8,165)
Remediation (267) (203) (39) (91) (600)
Total costs (5,171) (2,387) (1,060) (147) (8,765)
Impairment charge (861) (71) (1) (4) (937)
Underlying profit 4,580 2,157 927 402 8,066
External income 13,053 3,837 1,860 (26) 18,724
Inter-segment income (expense) (1,520) 813 128 579 —
Segment underlying income, net of insurance claims 11,533 4,650 1,988 553 18,724
Segment external assets 349,787 164,655 140,487 142,669 797,598
Segment customer deposits 253,846 147,597 14,063 2,560 418,066
Segment external liabilities 260,816 190,649 147,673 148,261 747,399
Analysis of segment underlying other income, net of insurance claims:
Current accounts 503 142 5 — 650
Credit and debit card fees 660 332 1 — 993
Commercial banking and treasury fees — 305 — — 305
Unit trust and insurance broking 13 — 208 — 221
Private banking and asset management — 5 92 — 97
Factoring — 83 — — 83
Other fees and commissions 57 248 163 31 499
Fees and commissions receivable 1,233 1,115 469 31 2,848
Fees and commissions payable (601) (311) (418) (56) (1,386)
Net fee and commission income 632 804 51 (25) 1,462
Operating lease rental income 1,305 38 — — 1,343
Rental income from investment properties — — 197 — 197
Gains less losses on disposal of financial assets at fair value through other comprehensive income — — — 275 275
Lease termination income — 7 — — 7
Trading income 71 711 — 282 1,064
Insurance and other, net of insurance claims 247 356 2,146 (1,087) 1,662
Other external income, net of insurance claims 1,623 1,112 2,343 (530) 4,548
Inter-segment other income (153) (251) (529) 933 —
Segment other income, net of insurance claims 2,102 1,665 1,865 378 6,010
Other segment items reflected in income statement above:
Depreciation and amortisation 1,573 278 154 400 2,405
Movement in value of in-force business — — (55) — (55)
Defined benefit scheme charges 121 49 20 215 405
Non-income statement segment items:
Additions to fixed assets 2,092 208 223 991 3,514
Investments in joint ventures and associates at end of year 4 — — 87 91
1 Restated, see page 240.2 Net of profits on disposal of operating lease assets of £60 million.
Note 4: Segmental analysis continued

244 Lloyds Banking Group Annual Report and Accounts 2020
Reconciliation of underlying basis to statutory resultsThe underlying basis is the basis on which financial information is presented to the chief operating decision maker which excludes certain items included in the statutory results. The table below reconciles the statutory results to the underlying basis.
Lloyds Banking
Group statutory
Removal of:
Volatility and other
items1Insurance gross up2 PPI
Underlying basis
£m £m £m £m £m
Year ended 31 December 2020
Net interest income 10,749 174 (150) — 10,773
Other income, net of insurance claims 4,377 165 (27) — 4,515
Total income, net of insurance claims 15,126 339 (177) — 15,288
Operating lease depreciation3 (884) — — (884)
Net income 15,126 (545) (177) — 14,404
Operating expenses (9,745) 1,522 174 85 (7,964)
Impairment4 (4,155) (95) 3 — (4,247)
Profit before tax 1,226 882 — 85 2,193
Lloyds Banking
Group statutory
Removal of:
Volatility and other
items5Insurance gross up2 PPI
Underlying basis
£m £m £m £m £m
Year ended 31 December 2019
Net interest income 10,180 379 1,818 — 12,377
Other income, net of insurance claims 8,179 (426) (2,021) — 5,732
Total income, net of insurance claims 18,359 (47) (203) — 18,109
Operating lease depreciation3 (967) — — (967)
Net income 18,359 (1,014) (203) — 17,142
Operating expenses (12,670) 1,697 203 2,450 (8,320)
Impairment (1,296) 5 — — (1,291)
Profit before tax 4,393 688 — 2,450 7,531
Lloyds Banking
Group statutory
Removal of:
Volatility and other
items6Insurance gross up2 PPI
Underlying basis
£m £m £m £m £m
Year ended 31 December 2018
Net interest income 13,396 152 (834) — 12,714
Other income, net of insurance claims 5,230 107 673 — 6,010
Total income, net of insurance claims 18,626 259 (161) — 18,724
Operating lease depreciation3 (956) — — (956)
Net income 18,626 (697) (161) — 17,768
Operating expenses (11,729) 2,053 161 750 (8,765)
Impairment (937) — — — (937)
Profit before tax 5,960 1,356 — 750 8,066
1 In the year ended 31 December 2020 this comprises the effects of asset sales (losses of £14 million); volatility and other items (losses of £45 million); the amortisation of purchased intangibles (£69 million); restructuring (£521 million, including severance costs, property transformation, technology research and development, regulatory programmes and merger, acquisition and integration costs); and the fair value unwind (losses of £233 million).
2 The Group’s insurance businesses’ income statements include income and expenditure which are attributable to the policyholders of the Group’s long-term assurance funds. These items have no impact in total upon the profit attributable to equity shareholders and, in order to provide a clearer representation of the underlying trends within the business, these items are shown net within the underlying results.
3 Net of profits on disposal of operating lease assets of £127 million (2019: £41 million; 2018: £60 million).4 Certain derivative valuation adjustments associated with credit-impaired customers are included within the impairment charge on an underlying basis but reported within other income, net of
insurance claims on a statutory basis.5 Comprises the effects of asset sales (gains of £214 million); volatility and other items (losses of £88 million); the amortisation of purchased intangibles (£68 million); restructuring (£471 million,
comprising severance related costs, the integration of Zurich's UK workplace pensions and savings business and costs associated with establishing the Schroders Personal Wealth joint venture); and the fair value unwind and other items (losses of £275 million).
6 Comprises the effects of asset sales (loss of £145 million); volatility and other items (gains of £95 million); the amortisation of purchased intangibles (£108 million); restructuring costs (£879 million, comprising severance related costs, the rationalisation of the non-branch property portfolio, the work on implementing the ring-fencing requirements and the integration of MBNA and Zurich’s UK workplace pensions and savings business); and the fair value unwind and other items (losses of £319 million).
Geographical areasThe Group’s operations are predominantly UK-based and as a result an analysis between UK and non-UK activities is not provided.
Notes to the consolidated financial statements continued
Note 4: Segmental analysis continued

Strategic rep
ortFinancial results
Governance
Risk manag
ement
Other inform
ationFinancial statem
ents Lloyds Banking Group Annual Report and Accounts 2020 245
Note 6: Net fee and commission income
2020 2019 2018£m £m £m
Fee and commission income:
Current accounts 615 659 650
Credit and debit card fees 748 982 993
Commercial banking and treasury fees 274 248 305
Unit trust and insurance broking 146 206 221
Private banking and asset management 6 69 97
Factoring 76 103 83
Other fees and commissions 443 489 499
Total fee and commission income 2,308 2,756 2,848
Fee and commission expense (1,148) (1,350) (1,386)
Net fee and commission income 1,160 1,406 1,462
Fees and commissions which are an integral part of the effective interest rate form part of net interest income shown in note 5. Fees and commissions relating to instruments that are held at fair value through profit or loss are included within net trading income shown in note 7.
At 31 December 2020, the Group held on its balance sheet £243 million (31 December 2019: £293 million) in respect of services provided to customers and £99 million (31 December 2019: £140 million) in respect of amounts received from customers for services to be provided after the balance sheet date. Current unsatisfied performance obligations amount to £191 million (31 December 2019: £270 million); the Group expects to receive substantially all of this revenue by 2023.
Income recognised during the year included £22 million (31 December 2019: £54 million) in respect of amounts included in the contract liability balance at the start of the year and £13 million (31 December 2019: £9 million) in respect of amounts from performance obligations satisfied in previous years.
The most significant performance obligations undertaken by the Group are in respect of current accounts, the provision of other banking services for commercial customers and credit and debit card services.
Note 5: Net interest income
Weighted average effective interest rate
2020 2019 2018 2020 2019 2018% % % £m £m £m
Interest income:
Loans and advances to customers 2.72 3.17 3.17 13,704 15,790 15,078
Loans and advances to banks 0.24 0.78 0.84 203 514 565
Debt securities 1.81 2.23 1.60 97 122 66
Interest income on financial assets held at amortised cost 2.35 2.89 2.87 14,004 16,426 15,709
Financial assets at fair value through other comprehensive income 1.10 1.64 1.98 302 435 640
Total interest income1 2.30 2.83 2.82 14,306 16,861 16,349
Interest expense:
Deposits from banks, excluding liabilities under sale and repurchase transactions 0.84 0.86 1.39 (113) (96) (117)
Customer deposits, excluding liabilities under sale and repurchase transactions 0.32 0.59 0.53 (1,091) (2,015) (1,812)
Debt securities in issue2 1.37 1.24 0.27 (1,313) (1,204) (234)
Subordinated liabilities 6.29 6.79 7.63 (1,057) (1,201) (1,388)
Lease liabilities 2.39 2.49 2.46 (41) (42) (1)
Liabilities under sale and repurchase agreements 0.36 1.12 0.96 (117) (301) (245)
Interest expense on liabilities held at amortised cost 0.74 0.98 0.79 (3,732) (4,859) (3,797)
Amounts payable to unitholders in consolidated open-ended investment vehicles3 (1.58) 13.64 (6.07) 175 (1,822) 844
Total interest expense4 0.69 1.31 0.60 (3,557) (6,681) (2,953)
Net interest income 10,749 10,180 13,396
1 Includes £10 million (2019: £26 million; 2018: £31 million) of interest income on liabilities with negative interest rates and £47 million (2019: £45 million; 2018: £46 million) in respect of interest income on finance leases.
2 The impact of the Group’s hedging arrangements is included on this line; excluding this impact the weighted average effective interest rate in respect of debt securities in issue would be 2.28 per cent (2019: 2.57 per cent; 2018: 2.68 per cent).
3 Where a collective investment vehicle is consolidated the interests of parties other than the Group are reported in other liabilities and the movement in these interests in interest expense. 4 Includes £24 million (2019: £119 million; 2018: £10 million) of interest expense on assets with negative interest rates.
Included within interest income is £171 million (2019: £198 million; 2018: £227 million) in respect of credit-impaired financial assets. Net interest income also includes a credit of £496 million (2019: credit of £608 million; 2018: credit of £701 million) transferred from the cash flow hedging reserve (see note 40).

246 Lloyds Banking Group Annual Report and Accounts 2020
Note 8: Insurance premium income
2020 2019 2018£m £m £m
Life insurance
Gross premiums:
Life and pensions 6,941 6,827 6,612
Annuities 1,378 2,483 2,178
8,319 9,310 8,790
Ceded reinsurance premiums (333) (378) (271)
Net earned premiums 7,986 8,932 8,519
Non-life insurance
Net earned premiums 629 642 670
Total net earned premiums 8,615 9,574 9,189
Note 7: Net trading income
2020 2019 2018£m £m £m
Foreign exchange translation gains (losses) 12 (255) 342
Gains on foreign exchange trading transactions 527 677 580
Total foreign exchange 539 422 922
Investment property (losses) gains (note 25) (209) (108) 139
Securities and other gains (losses) (see below) 6,890 17,974 (4,937)
Net trading income 7,220 18,288 (3,876)
Securities and other gains comprise net gains (losses) arising on assets and liabilities held at fair value through profit or loss as follows:
2020 2019 2018£m £m £m
Net income arising on assets and liabilities mandatorily held at fair value through profit or loss:
Financial instruments held for trading 724 120 (8)
Other financial instruments mandatorily held at fair value through profit or loss:
Debt securities, loans and advances 3,554 3,509 (26)
Equity shares 2,729 14,559 (4,747)
7,007 18,188 (4,781)
Net expense arising on assets and liabilities designated at fair value through profit or loss (117) (214) (156)
Securities and other gains (losses) 6,890 17,974 (4,937)
In respect of current accounts, the Group receives fees for the provision of bank account and transaction services such as ATM services, fund transfers, overdraft facilities and other value-added offerings.
For commercial customers, alongside its provision of current accounts, the Group provides other corporate banking services including factoring and commitments to provide loan financing. Loan commitment fees are included in fees and commissions where the loan is not expected to be drawn down by the customer.
The Group receives interchange and merchant fees, together with fees for overseas use and cash advances, for provision of card services to cardholders and merchants.
Notes to the consolidated financial statements continued
Note 6: Net fee and commission income continued

Strategic rep
ortFinancial results
Governance
Risk manag
ement
Other inform
ationFinancial statem
ents Lloyds Banking Group Annual Report and Accounts 2020 247
Note 10: Insurance claims
2020 2019 2018Insurance claims comprise: £m £m £m
Life insurance and investment contracts
Claims and surrenders (7,670) (8,684) (8,735)
Change in insurance and participating investment contracts (note 30) (4,590) (12,633) 4,565
Change in non-participating investment contracts (1,938) (2,664) 628
(14,198) (23,981) (3,542)
Reinsurers’ share 418 290 404
(13,780) (23,691) (3,138)
Change in unallocated surplus 57 (19) 8
Total life insurance and investment contracts (13,723) (23,710) (3,130)
Non-life insurance
Total non-life insurance claims, net of reinsurance (318) (287) (335)
Total insurance claims (14,041) (23,997) (3,465)
Life insurance and participating investment contracts gross claims and surrenders can also be analysed as follows:
Deaths (694) (674) (721)
Maturities (873) (1,122) (1,198)
Surrenders (4,641) (5,523) (5,548)
Annuities (1,171) (1,104) (1,032)
Other (291) (261) (236)
Total life insurance gross claims and surrenders (7,670) (8,684) (8,735)
Note 9: Other operating income
2020 2019 2018£m £m £m
Operating lease rental income 1,120 1,250 1,343
Rental income from investment properties (note 25) 191 191 197
Gains less losses on disposal of financial assets at fair value through other comprehensive income (note 40) 149 196 275
Movement in value of in-force business (note 23) 76 825 (55)
Liability management (145) 5 —
Gain related to establishment of joint venture — 244 —
Share of results of joint ventures and associates (note 21) (13) 6 9
Other 45 191 151
Total other operating income 1,423 2,908 1,920
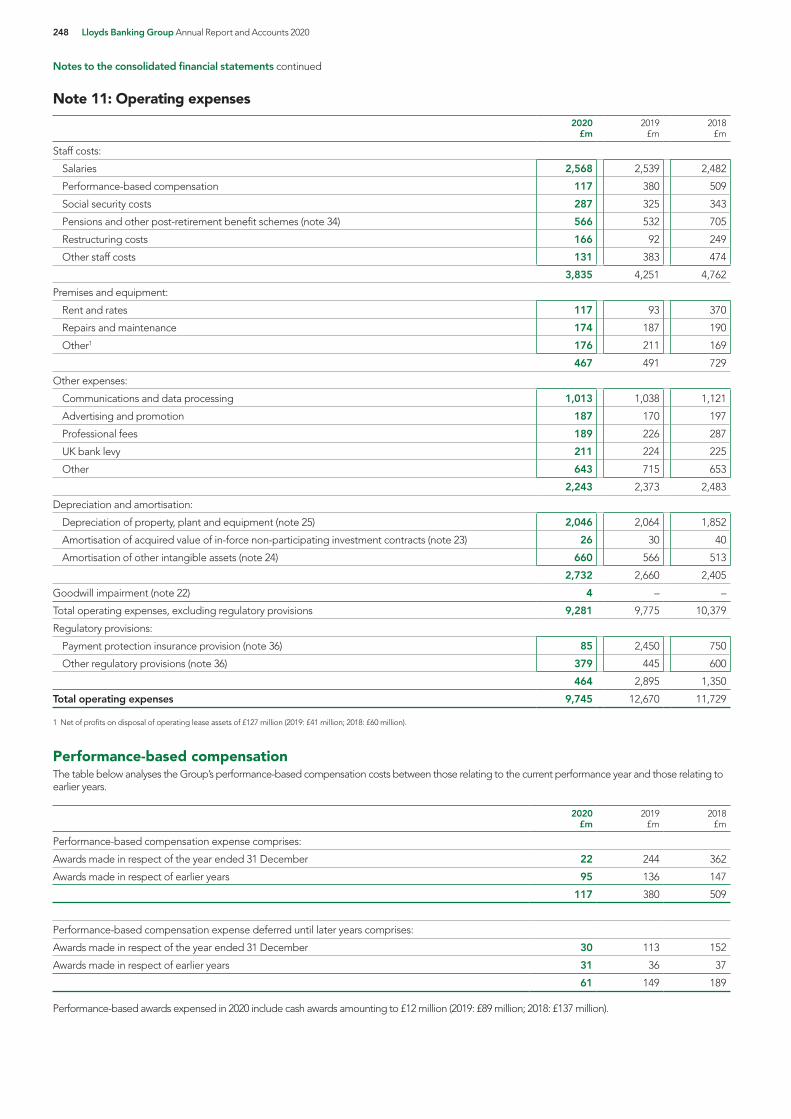
248 Lloyds Banking Group Annual Report and Accounts 2020
Note 11: Operating expenses
2020 2019 2018£m £m £m
Staff costs:
Salaries 2,568 2,539 2,482
Performance-based compensation 117 380 509
Social security costs 287 325 343
Pensions and other post-retirement benefit schemes (note 34) 566 532 705
Restructuring costs 166 92 249
Other staff costs 131 383 474
3,835 4,251 4,762
Premises and equipment:
Rent and rates 117 93 370
Repairs and maintenance 174 187 190
Other1 176 211 169
467 491 729
Other expenses:
Communications and data processing 1,013 1,038 1,121
Advertising and promotion 187 170 197
Professional fees 189 226 287
UK bank levy 211 224 225
Other 643 715 653
2,243 2,373 2,483
Depreciation and amortisation:
Depreciation of property, plant and equipment (note 25) 2,046 2,064 1,852
Amortisation of acquired value of in-force non-participating investment contracts (note 23) 26 30 40
Amortisation of other intangible assets (note 24) 660 566 513
2,732 2,660 2,405
Goodwill impairment (note 22) 4 — —
Total operating expenses, excluding regulatory provisions 9,281 9,775 10,379
Regulatory provisions:
Payment protection insurance provision (note 36) 85 2,450 750
Other regulatory provisions (note 36) 379 445 600
464 2,895 1,350
Total operating expenses 9,745 12,670 11,729
1 Net of profits on disposal of operating lease assets of £127 million (2019: £41 million; 2018: £60 million).
Performance-based compensationThe table below analyses the Group’s performance-based compensation costs between those relating to the current performance year and those relating to earlier years.
2020 2019 2018£m £m £m
Performance-based compensation expense comprises:
Awards made in respect of the year ended 31 December 22 244 362
Awards made in respect of earlier years 95 136 147
117 380 509
Performance-based compensation expense deferred until later years comprises:
Awards made in respect of the year ended 31 December 30 113 152
Awards made in respect of earlier years 31 36 37
61 149 189
Performance-based awards expensed in 2020 include cash awards amounting to £12 million (2019: £89 million; 2018: £137 million).
Notes to the consolidated financial statements continued

Strategic rep
ortFinancial results
Governance
Risk manag
ement
Other inform
ationFinancial statem
ents Lloyds Banking Group Annual Report and Accounts 2020 249
Note 12: Auditors’ remunerationFees payable to the Company’s auditors by the Group are as follows:
2020 2019 2018£m £m £m
Fees payable for the audit of the Company’s current year annual report 1.7 1.5 1.5
Fees payable for other services:
Audit of the Company’s subsidiaries pursuant to legislation 22.4 20.2 19.1
Other services supplied pursuant to legislation 3.7 3.5 2.9
Total audit fees 27.8 25.2 23.5
Other services – audit related fees 0.5 1.0 1.2
Total audit and audit related fees 28.3 26.2 24.7
Other non-audit fees:
Services relating to corporate finance transactions — — —
Other services 0.9 0.7 2.0
Total other non-audit fees 0.9 0.7 2.0
Total fees payable to the Company’s auditors by the Group 29.2 26.9 26.7
Audit fees payable in respect of the statutory audit of Group entities totalled £24.1 million (2019: £21.7 million; 2018: £20.6 million) and non-audit fees, as defined by the Financial Reporting Council’s Ethical Guidance totalled £5.1 million (2019: £5.2 million; 2018: £6.1 million).
The following types of services are included in the categories listed above:
Audit fees: This category includes fees in respect of the audit of the Group’s annual financial statements and other services in connection with regulatory filings. Other services supplied pursuant to legislation relate primarily to costs incurred in connection with client asset assurance and with the Sarbanes-Oxley Act requirements associated with the audit of the Group’s financial statements filed on its Form 20-F.
Audit related fees: This category includes fees in respect of services for assurance and related services that are reasonably related to the performance of the audit or review of the financial statements, for example acting as reporting accountants in respect of debt prospectuses required by the listing rules.
Other non-audit fees: This category includes other assurance services not related to the performance of the audit or review of the financial statements, for example, the review of controls operated by the Group on behalf of a third party. The auditors are not engaged to provide tax services.
It is the Group’s policy to use the auditors on assignments in cases where their knowledge of the Group means that it is neither efficient nor cost effective to employ another firm of accountants.
The Group has procedures that are designed to ensure auditor independence, including prohibiting certain non-audit services. All audit and non-audit assignments must be pre-approved by the audit committee on an individual engagement basis; for certain types of non-audit engagements where the fee is ‘de minimis’ the audit committee has pre-approved all assignments subject to confirmation by management. On a quarterly basis, the audit committee receives and reviews a report detailing all pre-approved services and amounts paid to the auditors for such pre-approved services.
During the year, the auditors also earned fees payable by entities outside the consolidated Lloyds Banking Group in respect of the following:
2020 2019 2018£m £m £m
Audits of Group pension schemes 0.1 0.1 0.1
Audits of the unconsolidated Open Ended Investment Companies managed by the Group 0.4 0.4 0.3
Reviews of the financial position of corporate and other borrowers 1.4 0.2 0.4
Average headcountThe average number of persons on a headcount basis employed by the Group during the year was as follows:
2020 2019 2018
UK 67,881 69,321 71,857
Overseas 784 762 769
Total 68,665 70,083 72,626
Note 11: Operating expenses continued

250 Lloyds Banking Group Annual Report and Accounts 2020
Note 13: Impairment
Stage 1 Stage 2 Stage 3 POCI Total£m £m £m £m £m
Year ended 31 December 2020
Impact of transfers between stages (169) 940 698 — 1,469
Other changes in credit quality 946 22 1,192 167 2,327
Additions (repayments) 98 177 (48) (30) 197
Methodology and model changes (44) 170 26 — 152
Other items — — 10 — 10
1,000 369 1,180 137 2,686
Total impairment 831 1,309 1,878 137 4,155
In respect of:
Loans and advances to banks 5 — — — 5
Loans and advances to customers 697 1,151 1,865 137 3,850
Debt securities 1 — — — 1
Financial assets at amortised cost 703 1,151 1,865 137 3,856
Other assets — — 5 — 5
Impairment charge on drawn balances 703 1,151 1,870 137 3,861
Loan commitments and financial guarantees 123 158 8 — 289
Financial assets at fair value through other comprehensive income 5 — — — 5
Total impairment 831 1,309 1,878 137 4,155
Stage 1 Stage 2 Stage 3 POCI Total£m £m £m £m £m
Year ended 31 December 2019
Impact of transfers between stages (17) 89 532 — 604
Other changes in credit quality 4 1 899 (106) 798
Additions (repayments) 94 (39) (84) (87) (116)
Methodology and model changes 33 (27) 8 — 14
Other items (4) — — — (4)
127 (65) 823 (193) 692
Total impairment 110 24 1,355 (193) 1,296
In respect of:
Loans and advances to banks — — — — —
Loans and advances to customers 139 10 1,351 (193) 1,307
Financial assets at amortised cost 139 10 1,351 (193) 1,307
Other assets — — 5 — 5
Impairment charge on drawn balances 139 10 1,356 (193) 1,312
Loan commitments and financial guarantees (28) 14 (1) — (15)
Financial assets at fair value through other comprehensive income (1) — — — (1)
Total impairment 110 24 1,355 (193) 1,296
Notes to the consolidated financial statements continued

Strategic rep
ortFinancial results
Governance
Risk manag
ement
Other inform
ationFinancial statem
ents Lloyds Banking Group Annual Report and Accounts 2020 251
Stage 1 Stage 2 Stage 3 POCI Total£m £m £m £m £m
Year ended 31 December 2018
Impact of transfers between stages (12) 51 446 — 485
Other changes in credit quality (20) (47) 541 69 543
Additions (repayments) 18 (82) 43 (69) (90)
Methodology and model changes (71) (21) 72 — (20)
Other items (13) — 32 — 19
(86) (150) 688 — 452
Total impairment (98) (99) 1,134 — 937
In respect of:
Loans and advances to banks 1 — — — 1
Loans and advances to customers (66) (51) 1,139 — 1,022
Financial assets at amortised cost (65) (51) 1,139 — 1,023
Other assets — — 1 — 1
Impairment charge on drawn balances (65) (51) 1,140 — 1,024
Loan commitments and financial guarantees (19) (48) (6) — (73)
Financial assets at fair value through other comprehensive income (14) — — — (14)
Total impairment (98) (99) 1,134 — 937
The impairment charge includes £41 million (2019: £134 million; 2018: £29 million) in respect of residual value impairment and voluntary terminations within the Group’s UK motor finance business.
The Group’s impairment charge comprises the following items:
Transfers between stagesThe net impact on the impairment charge of transfers between stages.
Other changes in credit qualityChanges in loss allowance as a result of movements in risk parameters that reflect changes in customer quality, but which have not resulted in a transfer to a different stage. This also contains the impact on the impairment charge as a result of write-offs and recoveries, where the related loss allowances are reassessed to reflect ultimate realisable or recoverable value.
Additions (repayments)Expected loss allowances are recognised on origination of new loans or further drawdowns of existing facilities. Repayments relate to the reduction of loss allowances as a result of repayments of outstanding balances.
Methodology and model changesIncrease or decrease in impairment charge as a result of adjustments to the models used for expected credit loss calculations; either as changes to the model inputs or to the underlying assumptions, as well as the impact of changing the models used.
Movements in the Group's impairment allowances are shown in note 18.
Note 13: Impairment continued

252 Lloyds Banking Group Annual Report and Accounts 2020
Note 14: Tax expense
(A) Analysis of tax credit (expense) for the year
2020 2019 2018£m £m £m
UK corporation tax:
Current tax on profit for the year (480) (1,389) (1,280)
Adjustments in respect of prior years 355 96 11
(125) (1,293) (1,269)
Foreign tax:
Current tax on profit for the year (27) (70) (34)
Adjustments in respect of prior years 25 2 5
(2) (68) (29)
Current tax expense (127) (1,361) (1,298)
Deferred tax:
Current year 611 (165) (127)
Adjustments in respect of prior years (323) 139 (29)
Deferred tax credit (expense) 288 (26) (156)
Tax credit (expense) 161 (1,387) (1,454)
The tax credit (expense) is made up as follows:
2020 2019 2018£m £m £m
Tax credit (expense) attributable to policyholders 4 (148) 14
Shareholder tax credit (expense) 157 (1,239) (1,468)
Tax credit (expense) 161 (1,387) (1,454)
(B) Factors affecting the tax credit (expense) for the yearThe UK corporation tax rate for the year was 19.0 per cent (2019: 19.0 per cent; 2018: 19.0 per cent). An explanation of the relationship between tax credit (expense) and accounting profit is set out below.
2020 2019 2018£m £m £m
Profit before tax 1,226 4,393 5,960
UK corporation tax thereon (233) (835) (1,132)
Impact of surcharge on banking profits (107) (364) (409)
Non-deductible costs: conduct charges (24) (370) (101)
Non-deductible costs: bank levy (38) (43) (43)
Other non-deductible costs (74) (121) (90)
Non-taxable income 59 40 87
Tax relief on coupons on other equity instruments 86 89 83
Tax-exempt gains on disposals 81 102 124
Tax losses where no deferred tax recognised (58) 18 (9)
Remeasurement of deferred tax due to rate changes 350 (6) 32
Differences in overseas tax rates 15 (14) 6
Policyholder tax (46) (67) (62)
Policyholder deferred tax asset in respect of life assurance expenses 49 (53) 73
Adjustments in respect of prior years 104 237 (13)
Tax effect of share of results of joint ventures (3) — —
Tax credit (expense) 161 (1,387) (1,454)
In 2020, the Group submitted claims to HMRC to accelerate tax deductions in respect of certain capitalised software enhancement costs incurred in 2018 and 2019. The Group has recognised a net prior year tax impact of £nil in respect of these claims, being a current tax credit of £215 million in respect of the reduced cash tax liability for those years, a deferred tax charge of £261 million in respect of the future amortisation of those costs, plus a deferred tax credit of £46 million in respect of tax losses carried forward. No other items included in the net prior year tax adjustments credit of £104 million were of individual significance.
Notes to the consolidated financial statements continued

Strategic rep
ortFinancial results
Governance
Risk manag
ement
Other inform
ationFinancial statem
ents Lloyds Banking Group Annual Report and Accounts 2020 253
Note 16: Financial assets at fair value through profit or lossThese assets are comprised as follows:
2020 2019
Trading assets
Other financial assets
mandatorily at fair value
through profit or loss Total
Trading assets
Other financial assets
mandatorily at fair value
through profit or loss Total
£m £m £m £m £m £m
Loans and advances to customers 12,765 11,244 24,009 10,422 10,654 21,076
Loans and advances to banks 229 4,238 4,467 513 1,886 2,399
Debt securities:
Government securities 7,574 13,048 20,622 6,791 12,063 18,854
Other public sector securities — 2,354 2,354 — 2,126 2,126
Bank and building society certificates of deposit — 4,841 4,841 — 984 984
Asset-backed securities:
Mortgage-backed securities 7 460 467 6 462 468
Other asset-backed securities 4 261 265 17 241 258
Corporate and other debt securities 246 17,888 18,134 233 17,983 18,216
7,831 38,852 46,683 7,047 33,859 40,906
Equity shares — 96,449 96,449 — 95,789 95,789
Treasury and other bills — 18 18 — 19 19
Total 20,825 150,801 171,626 17,982 142,207 160,189
Other financial assets at fair value through profit or loss include assets backing insurance contracts and investment contracts of £145,905 million (31 December 2019: £136,855 million). Included within these assets are investments in unconsolidated structured entities of £55,235 million (31 December 2019: £38,177 million), see note 47.
For amounts included above which are subject to repurchase and reverse repurchase agreements see note 51.
Note 15: Earnings per share
2020 2019 2018£m £m £m
Profit attributable to ordinary shareholders – basic and diluted 865 2,459 3,975
2020 2019 2018million million million
Weighted-average number of ordinary shares in issue – basic 70,606 70,603 71,638
Adjustment for share options and awards 650 682 641
Weighted-average number of ordinary shares in issue – diluted 71,256 71,285 72,279
Basic earnings per share 1.2p 3.5p 5.5p
Diluted earnings per share 1.2p 3.4p 5.5p
Basic earnings per share are calculated by dividing the net profit attributable to equity shareholders by the weighted-average number of ordinary shares in issue during the year, which has been calculated after deducting 28 million (2019: 25 million; 2018: 38 million) ordinary shares representing the Group’s holdings of own shares in respect of employee share schemes.
For the calculation of diluted earnings per share the weighted-average number of ordinary shares in issue is adjusted to assume conversion of all dilutive potential ordinary shares that arise in respect of share options and awards granted to employees. The number of shares that could have been acquired at the annual average price of the Company’s shares based on the monetary value of the subscription rights attached to outstanding share options and awards is determined. This is deducted from the number of shares issuable under such options and awards to leave a residual bonus amount of shares which are added to the weighted-average number of ordinary shares in issue, but no adjustment is made to the profit attributable to equity shareholders.
There were 647 million anti-dilutive share options and awards excluded from the calculation of diluted earnings per share (2019: 24 million; 2018: none).

254 Lloyds Banking Group Annual Report and Accounts 2020
Note 17: Derivative financial instrumentsThe fair values and notional amounts of derivative instruments are set out in the following table:
2020 2019
Contract/ notional amount
Fair value assets
Fair value liabilities
Contract/ notional amount
Fair value assets
Fair value liabilities
£m £m £m £m £m £m
Trading and other
Exchange rate contracts:
Spot, forwards and futures 49,400 882 764 44,095 681 616
Currency swaps 350,882 5,469 6,161 349,606 3,857 5,425
Options purchased 5,769 428 — 8,310 452 —
Options written 7,560 — 489 9,557 — 499
413,611 6,779 7,414 411,568 4,990 6,540
Interest rate contracts:
Interest rate swaps 5,669,551 18,577 15,799 5,245,703 17,318 15,213
Forward rate agreements 633,279 8 6 555,742 7 13
Options purchased 24,087 3,053 — 27,158 2,468 —
Options written 19,735 — 2,746 23,610 — 2,216
Futures 275,377 6 13 199,884 17 22
6,622,029 21,644 18,564 6,052,097 19,810 17,464
Credit derivatives 7,707 108 174 16,959 83 167
Equity and other contracts 10,058 266 477 11,414 250 503
Total derivative assets/liabilities – trading and other 7,053,405 28,797 26,629 6,492,038 25,133 24,674
Hedging
Derivatives designated as fair value hedges:
Currency swaps 36 11 — 34 8 —
Interest rate swaps 215,325 467 256 183,489 798 229
215,361 478 256 183,523 806 229
Derivatives designated as cash flow hedges:
Interest rate swaps 326,386 295 265 426,740 355 743
Currency swaps 5,829 43 163 9,549 75 133
332,215 338 428 436,289 430 876
Total derivative assets/liabilities – hedging 547,576 816 684 619,812 1,236 1,105
Total recognised derivative assets/liabilities 7,600,981 29,613 27,313 7,111,850 26,369 25,779
The notional amount of the contract does not represent the Group’s exposure to credit risk which is limited to the current cost of replacing contracts with a positive value to the Group should the counterparty default. To reduce credit risk the Group uses a variety of credit enhancement techniques such as netting and collateralisation, where security is provided against the exposure; a large proportion of the Group's derivatives are held through exchanges such as London Clearing House and are collateralised through those exchanges. Further details are provided in note 51 Credit risk.
The Group holds derivatives as part of the following strategies:
– Customer driven, where derivatives are held as part of the provision of risk management products to Group customers;
– To manage and hedge the Group’s interest rate and foreign exchange risk arising from normal banking business. The hedge accounting strategy adopted by the Group is to utilise a combination of fair value and cash flow hedge approaches as described in note 51; and
– Derivatives held in policyholder funds as permitted by the investment strategies of those funds.
The principal derivatives used by the Group are as follows:
– Interest rate related contracts include interest rate swaps, forward rate agreements and options. An interest rate swap is an agreement between two parties to exchange fixed and floating interest payments, based upon interest rates defined in the contract, without the exchange of the underlying principal amounts. Forward rate agreements are contracts for the payment of the difference between a specified rate of interest and a reference rate, applied to a notional principal amount at a specific date in the future. An interest rate option gives the buyer, on payment of a premium, the right, but not the obligation, to fix the rate of interest on a future loan or deposit, for a specified period and commencing on a specified future date.
– Exchange rate related contracts include forward foreign exchange contracts, currency swaps and options. A forward foreign exchange contract is an agreement to buy or sell a specified amount of foreign currency on a specified future date at an agreed rate. Currency swaps generally involve the exchange of interest payment obligations denominated in different currencies; the exchange of principal can be notional or actual. A currency option gives the buyer, on payment of a premium, the right, but not the obligation, to sell specified amounts of currency at agreed rates of exchange on or before a specified future date.
– Credit derivatives, principally credit default swaps, are used by the Group as part of its trading activity and to manage its own exposure to credit risk. A credit default swap is a swap in which one counterparty receives a premium at pre-set intervals in consideration for guaranteeing to make a specific payment should a negative credit event take place.
– Equity derivatives are also used by the Group as part of its equity-based retail product activity to eliminate the Group’s exposure to fluctuations in various international stock exchange indices. Index-linked equity options are purchased which give the Group the right, but not the obligation, to buy or sell a specified amount of equities, or basket of equities, in the form of published indices on or before a specified future date.
Notes to the consolidated financial statements continued

Strategic rep
ortFinancial results
Governance
Risk manag
ement
Other inform
ationFinancial statem
ents Lloyds Banking Group Annual Report and Accounts 2020 255
Details of the Group’s hedging instruments are set out below:
Maturity
Up to 1 month 1-3 months 3-12 months 1-5 years Over 5 years TotalAt 31 December 2020 £m £m £m £m £m £m
Fair value hedges
Interest rate
Cross currency swap
Notional — — — — 36 36
Average fixed interest rate — — — — 1.28%
Average EUR/GBP exchange rate — — — — 1.38
Interest rate swap
Notional 6,032 6,031 39,811 136,527 26,924 215,325
Average fixed interest rate 2.01% 1.69% 1.42% 1.26% 2.36%
Cash flow hedges
Foreign exchange
Currency swap
Notional 28 469 1,274 1,505 2,553 5,829
Average USD/GBP exchange rate 1.30 1.33 1.30 1.32 1.32
Interest rate
Interest rate swap
Notional 5,026 11,614 42,364 169,499 97,883 326,386
Average fixed interest rate 1.09% 1.05% 1.16% 1.55% 2.31%
Maturity
Up to 1 month 1-3 months 3-12 months 1-5 years Over 5 years TotalAt 31 December 2019 £m £m £m £m £m £m
Fair value hedges
Interest rate
Cross currency swap
Notional — — — — 34 34
Average fixed interest rate — — — — 1.28%
Average EUR/GBP exchange rate — — — — 1.38
Interest rate swap
Notional 331 9,305 37,948 106,339 29,566 183,489
Average fixed interest rate 2.58% 1.74% 1.22% 1.71% 2.81%
Cash flow hedges
Foreign exchange
Currency swap
Notional — 413 1,611 2,389 5,136 9,549
Average EUR/GBP exchange rate — — — 1.05 1.05
Average USD/GBP exchange rate — 1.29 1.30 1.31 —
Interest rate
Interest rate swap
Notional 9,675 23,589 58,447 209,108 125,921 426,740
Average fixed interest rate 1.05% 1.22% 1.29% 1.47% 2.39%
Note 17: Derivative financial instruments continued

256 Lloyds Banking Group Annual Report and Accounts 2020
The carrying amounts of the Group’s hedging instruments are as follows:
Carrying amount of the hedging instrument
Contract/ notional amount Assets Liabilities
Changes in fair value used for
calculating hedge
ineffectivenessAt 31 December 2020 £m £m £m £m
Fair value hedges
Interest rate
Currency swaps 36 11 — 1
Interest rate swaps 215,325 467 256 987
Cash flow hedges
Foreign exchange
Currency swaps 5,829 43 163 (132)
Interest rate
Interest rate swaps 326,386 295 265 603
Carrying amount of the hedging instrument
Contract/ notional amount Assets Liabilities
Changes in fair value used for
calculating hedge
ineffectivenessAt 31 December 2019 £m £m £m £m
Fair value hedges
Interest rate
Currency swaps 34 8 — 2
Interest rate swaps 183,489 798 229 1,142
Cash flow hedges
Foreign exchange
Currency swaps 9,549 75 133 (185)
Interest rate
Interest rate swaps 426,740 355 743 992
All amounts are held within Derivative financial instruments.
The Group’s hedged items are as follows:
Carrying amount of the hedged item
Accumulated amount of fair value adjustment on
the hedged item
Change in fair value of hedged
item for ineffectiveness
assessment
Cash flow hedge reserve
Assets Liabilities Assets LiabilitiesContinuing
hedgesDiscontinued
hedgesAt 31 December 2020 £m £m £m £m £m £m £m
Fair value hedges
Interest rate
Fixed rate mortgages1 125,181 — 661 — 355
Fixed rate issuance2 — 68,539 — 4,253 (1,437)
Fixed rate bonds3 24,111 — 1,178 — 641
Cash flow hedges
Foreign exchange
Foreign currency issuance2 60 (83) 130
Customer deposits4 74 13 (41)
Interest rate
Customer loans1 (510) 1,918 6
Central bank balances5 (141) 135 270
Customer deposits4 33 (203) 84
Notes to the consolidated financial statements continued
Note 17: Derivative financial instruments continued

Strategic rep
ortFinancial results
Governance
Risk manag
ement
Other inform
ationFinancial statem
ents Lloyds Banking Group Annual Report and Accounts 2020 257
Carrying amount of the hedged item
Accumulated amount of fair value adjustment on
the hedged item
Change in fair value of hedged
item for ineffectiveness
assessment
Cash flow hedge reserve
Assets Liabilities Assets LiabilitiesContinuing
hedgesDiscontinued
hedgesAt 31 December 2019 £m £m £m £m £m £m £m
Fair value hedges
Interest rate
Fixed rate mortgages1 83,818 — 154 — (73)
Fixed rate issuance2 — 70,353 — 3,058 (1,333)
Fixed rate bonds3 21,354 — 660 — 405Cash flow hedges
Foreign exchange
Foreign currency issuance2 72 (2) 179
Customer deposits4 116 18 (48)
Interest rate
Customer loans1 (680) 1,248 336
Central bank balances5 (263) 128 163
Customer deposits4 — (31) 5
1 Included within loans and advances to customers.2 Included within debt securities in issue.3 Included within financial assets at fair value through other comprehensive income.4 Included within customer deposits.5 Included within cash and balances at central banks.
The accumulated amount of fair value hedge adjustments remaining in the balance sheet for hedged items that have ceased to be adjusted for hedging gains and losses is a liability of £761 million (fixed rate issuance liability of £761 million, fixed rate bonds and mortgages £nil) (2019: liability of £692 million (fixed rate issuance liability of £721 million, fixed rate bonds asset of £29 million and fixed rate mortgages of £nil)).
Gains and losses arising from hedge accounting are summarised as follows:
Gain (loss) recognised
in other comprehensive
income£m
Hedge ineffectiveness
recognised in the income statement1
£m
Amounts reclassified from reserves to income statement as:
Hedged cash flows
will no longer occur
£m
Hedged item affected
income statement
£m
Income statement
line item that includes
reclassified amountAt 31 December 2020
Fair value hedges
Interest rate
Fixed rate mortgages 570
Fixed rate issuance (32)
Fixed rate bonds 9
Cash flow hedges
Foreign exchange
Foreign currency issuance (129) — (6) (62) Interest expense
Customer deposits 3 — — 5 Interest expense
Interest rate
Customer loans 285 (7) — (377) Interest income
Central bank balances 97 5 — (79) Interest income
Customer deposits (22) — — 23 Interest expense
Note 17: Derivative financial instruments continued

258 Lloyds Banking Group Annual Report and Accounts 2020
Gain (loss) recognised
in other comprehensive
income£m
Hedge ineffectiveness
recognised in the income statement1
£m
Amounts reclassified from reserves to income statement as:
Hedged cash flows
will no longer occur
£m
Hedged item affected
income statement
£m
Income statement
line item that includes
reclassified amountAt 31 December 2019
Fair value hedges
Interest rate
Fixed rate mortgages 186
Fixed rate issuance (32)
Fixed rate bonds (11)
Cash flow hedges
Foreign exchange
Foreign currency issuance (265) — (101) (92) Interest expense
Customer deposits (22) — — 7 Interest expense
Interest rate
Customer loans 651 98 — (362) Interest income
Central bank balances 237 36 — (66) Interest income
Customer deposits — — — 6 Interest expense
1 Hedge ineffectiveness is included in the income statement within net trading income.
There was a gain of £6 million (2019: gain of £101 million) reclassified from the cash flow hedging reserve for which hedge accounting had previously been used but for which the hedged future cash flows are no longer expected to occur.
Notes to the consolidated financial statements continued
Note 17: Derivative financial instruments continued

Strategic rep
ortFinancial results
Governance
Risk manag
ement
Other inform
ationFinancial statem
ents Lloyds Banking Group Annual Report and Accounts 2020 259
Note 18: Financial assets at amortised costYear ended 31 December 2020
Gross carrying amount Allowance for expected credit losses
Stage 1 Stage 2 Stage 3 POCI Total Stage 1 Stage 2 Stage 3 POCI Total£m £m £m £m £m £m £m £m £m £m
Loans and advances to banks
At 1 January 2020 9,777 — — — 9,777 2 — — — 2
Exchange and other adjustments 50 — — — 50 (1) — — — (1)
Additions (repayments) 925 — — — 925 — — — — —
Charge to the income statement 5 — — — 5
At 31 December 2020 10,752 — — — 10,752 6 — — — 6
Allowance for impairment losses (6) — — — (6)
Net carrying amount 10,746 — — — 10,746
Loans and advances to customers
At 1 January 2020 449,975 28,543 6,015 13,714 498,247 675 995 1,447 142 3,259
Exchange and other adjustments1 1,308 (59) (422) (8) 819 — (1) 54 21 74
Transfers to Stage 1 4,972 (4,956) (16) — 146 (143) (3) —
Transfers to Stage 2 (28,855) 29,467 (612) — (218) 268 (50) —
Transfers to Stage 3 (1,633) (2,031) 3,664 — (9) (156) 165 —
Impact of transfers between stages (25,516) 22,480 3,036 — (85) 883 569 1,367
(166) 852 681 1,367
Other changes in credit quality 857 (16) 1,196 167 2,204
Additions (repayments) 8,176 695 (802) (1,156) 6,913 50 145 (38) (30) 127
Methodology and model changes (44) 170 26 — 152
Charge to the income statement 697 1,151 1,865 137 3,850
Advances written off (1,587) (39) (1,626) (1,587) (39) (1,626)
Recoveries of advances written off in previous years 250 — 250 250 — 250
Discount unwind (47) — (47)
At 31 December 2020 433,943 51,659 6,490 12,511 504,603 1,372 2,145 1,982 261 5,760
Allowance for impairment losses (1,372) (2,145) (1,982) (261) (5,760)
Net carrying amount 432,571 49,514 4,508 12,250 498,843
Debt securities
At 1 January 2020 5,544 — 3 — 5,547 — — 3 — 3
Exchange and other adjustments (21) — — — (21) — — — — —
Additions (repayments) (117) — — — (117) — — — — —
Charge to the income statement 1 — — — 1
Financial assets that have been written off during the year (1) — (1) (1) — (1)
At 31 December 2020 5,406 — 2 — 5,408 1 — 2 — 3
Allowance for impairment losses (1) — (2) — (3)
Net carrying amount 5,405 — — — 5,405
Total financial assets at amortised cost 448,722 49,514 4,508 12,250 514,994
1 Exchange and other adjustments includes the impact of movements in exchange rates, derecognising assets as a result of modifications and adjustments in respect of purchased or originated credit-
impaired financial assets.
During the year, the economic outlook deteriorated markedly as a consequence of the COVID-19 pandemic. The Group’s economic assumptions are outlined in note 3 and these have resulted in a significant increase in the expected credit loss (ECL) allowance.
The total allowance for impairment losses includes £192 million (2019: £201 million) in respect of residual value impairment and voluntary terminations within the Group’s UK motor finance business.

260 Lloyds Banking Group Annual Report and Accounts 2020
Movements in Retail mortgage balances were as follows:
Gross carrying amount Allowance for expected credit losses
Stage 1 Stage 2 Stage 3 POCI Total Stage 1 Stage 2 Stage 3 POCI Total£m £m £m £m £m £m £m £m £m £m
Retail mortgages
At 1 January 2020 257,043 16,935 1,506 13,714 289,198 23 281 122 142 568
Exchange and other adjustments1 — — — (8) (8) — — — 21 21
Transfers to Stage 1 2,418 (2,414) (4) — 17 (17) — —
Transfers to Stage 2 (16,463) 16,882 (419) — (4) 22 (18) —
Transfers to Stage 3 (199) (974) 1,173 — — (35) 35 —
Impact of transfers between stages (14,244) 13,494 750 — (15) 198 66 249
(2) 168 83 249
Other changes in credit quality 63 (26) (23) 167 181
Additions (repayments) 8,619 (1,411) (375) (1,156) 5,677 14 (15) (13) (30) (44)
Methodology and model changes 6 60 24 — 90
Charge to the income statement 81 187 71 137 476
Advances written off (37) (39) (76) (37) (39) (76)
Recoveries of advances written off in previous years 15 — 15 15 — 15
Discount unwind 20 — 20
At 31 December 2020 251,418 29,018 1,859 12,511 294,806 104 468 191 261 1,024
Allowance for impairment losses (104) (468) (191) (261) (1,024)
Net carrying amount 251,314 28,550 1,668 12,250 293,782
1 Exchange and other adjustments includes the impact of movements in exchange rates, derecognising assets as a result of modifications and adjustments in respect of purchased or originated credit-impaired financial assets.
Movements in allowance for expected credit losses in respect of undrawn balances were as follows:
Allowance for expected credit losses
Stage 1 Stage 2 Stage 3 POCI Total£m £m £m £m £m
Undrawn balances
At 1 January 2020 95 77 5 — 177
Exchange and other adjustments (6) (1) — — (7)
Transfers to Stage 1 19 (19) — —
Transfers to Stage 2 (11) 11 — —
Transfers to Stage 3 (1) (6) 7 —
Impact of transfers between stages (10) 102 10 102
(3) 88 17 102
Other items charged to the income statement 126 70 (9) — 187
Charge to the income statement 123 158 8 — 289
At 31 December 2020 212 234 13 — 459
Notes to the consolidated financial statements continued
Note 18: Financial assets at amortised cost continued

Strategic rep
ortFinancial results
Governance
Risk manag
ement
Other inform
ationFinancial statem
ents Lloyds Banking Group Annual Report and Accounts 2020 261
The Group's total impairment allowances were as follows:
Allowance for expected credit losses
Stage 1 Stage 2 Stage 3 POCI Total£m £m £m £m £m
In respect of:
Loans and advances to banks 6 — — — 6
Loans and advances to customers:
Retail mortgages 104 468 191 261 1,024
Other 1,268 1,677 1,791 — 4,736
1,372 2,145 1,982 261 5,760
Debt securities 1 — 2 — 3
Financial assets at amortised cost 1,379 2,145 1,984 261 5,769
Other assets — — 19 — 19
Provisions in relation to loan commitments and financial guarantees 212 234 13 — 459
Total 1,591 2,379 2,016 261 6,247
Expected credit loss in respect of financial assets as fair value through other comprehensive income (memorandum item) — — — — —
Note 18: Financial assets at amortised cost continued

262 Lloyds Banking Group Annual Report and Accounts 2020
Year ended 31 December 2019
Gross carrying amount Allowance for expected credit losses
Stage 1 Stage 2 Stage 3 POCI Total Stage 1 Stage 2 Stage 3 POCI Total£m £m £m £m £m £m £m £m £m £m
Loans and advances to banks
At 1 January 2019 6,282 3 — — 6,285 2 — — — 2
Exchange and other adjustments (218) — — — (218) — — — — —
Additions (repayments) 3,713 (3) — — 3,710 — — — — —
At 31 December 2019 9,777 — — — 9,777 2 — — — 2
Allowance for impairment losses (2) — — — (2)
Net carrying amount 9,775 — — — 9,775
Loans and advances to customers
At 1 January 2019 441,531 25,345 5,741 15,391 488,008 525 994 1,553 78 3,150
Exchange and other adjustments1 (498) (34) 47 283 (202) 11 (9) 27 283 312
Acquisition of portfolios 3,694 — — — 3,694
Transfers to Stage 1 6,318 (6,286) (32) — 229 (222) (7) —
Transfers to Stage 2 (13,084) 13,516 (432) — (53) 92 (39) —
Transfers to Stage 3 (1,540) (1,440) 2,980 — (15) (140) 155 —
Impact of transfers between stages (8,306) 5,790 2,516 — (175) 353 420 598
(14) 83 529 598
Other changes in credit quality 29 — 911 (106) 834
Additions (repayments) 13,554 (2,558) (858) (1,934) 8,204 91 (46) (97) (87) (139)
Methodology and model changes 33 (27) 8 — 14
Charge to the income statement 139 10 1,351 (193) 1,307
Advances written off (1,828) (54) (1,882) (1,828) (54) (1,882)
Recoveries of advances written off in previous years 397 28 425 397 28 425
Discount unwind (53) — (53)
At 31 December 2019 449,975 28,543 6,015 13,714 498,247 675 995 1,447 142 3,259
Allowance for impairment losses (675) (995) (1,447) (142) (3,259)
Net carrying amount 449,300 27,548 4,568 13,572 494,988
Debt securities
At 1 January 2019 5,238 — 6 — 5,244 — — 6 — 6
Exchange and other adjustments (94) — (2) — (96) — — (2) — (2)
Additions (repayments) 400 — — — 400 — — — — —
Financial assets that have been written off during the year (1) — (1) (1) — (1)
At 31 December 2019 5,544 — 3 — 5,547 — — 3 — 3
Allowance for impairment losses — — (3) — (3)
Net carrying amount 5,544 — — — 5,544
Total financial assets at amortised cost 464,619 27,548 4,568 13,572 510,307
1 Exchange and other adjustments includes the impact of movements in exchange rates, derecognising assets as a result of modifications and adjustments in respect of purchased or originated credit-impaired financial assets.
Notes to the consolidated financial statements continued
Note 18: Financial assets at amortised cost continued

Strategic rep
ortFinancial results
Governance
Risk manag
ement
Other inform
ationFinancial statem
ents Lloyds Banking Group Annual Report and Accounts 2020 263
Movements in Retail mortgage balances were as follows:
Gross carrying amount Allowance for expected credit losses
Stage 1 Stage 2 Stage 3 POCI Total Stage 1 Stage 2 Stage 3 POCI Total£m £m £m £m £m £m £m £m £m £m
Retail mortgages
At 1 January 2019 257,797 13,654 1,393 15,391 288,235 37 226 118 78 459
Exchange and other adjustments1 (1) — 2 283 284 — — — 283 283
Acquisition of portfolios 3,694 — — — 3,694
Transfers to Stage 1 3,060 (3,057) (3) — 17 (17) — —
Transfers to Stage 2 (7,879) 8,242 (363) — (13) 33 (20) —
Transfers to Stage 3 (427) (472) 899 — (5) (21) 26 —
Impact of transfers between stages (5,246) 4,713 533 — (15) 104 39 128
(16) 99 45 128
Other changes in credit quality 6 10 (33) (106) (123)
Additions (repayments) 799 (1,432) (416) (1,934) (2,983) (4) (20) (16) (87) (127)
Methodology and model changes — (34) (10) — (44)
Charge to the income statement (14) 55 (14) (193) (166)
Advances written off (35) (54) (89) (35) (54) (89)
Recoveries of advances written off in previous years 29 28 57 29 28 57
Discount unwind 24 — 24
At 31 December 2019 257,043 16,935 1,506 13,714 289,198 23 281 122 142 568
Allowance for impairment losses (23) (281) (122) (142) (568)
Net carrying amount 257,020 16,654 1,384 13,572 288,630
1 Exchange and other adjustments includes the impact of movements in exchange rates, derecognising assets as a result of modifications and adjustments in respect of purchased or originated credit-impaired financial assets.
Movements in allowance for expected credit losses in respect of undrawn balances were as follows:
Allowance for expected credit losses
Stage 1 Stage 2 Stage 3 POCI Total£m £m £m £m £m
Undrawn balances
At 1 January 2019 123 64 6 — 193
Exchange and other adjustments — (1) — — (1)
Transfers to Stage 1 19 (19) — —
Transfers to Stage 2 (4) 4 — —
Transfers to Stage 3 (1) (3) 4 —
Impact of transfers between stages (17) 24 (1) 6
(3) 6 3 6
Other items charged to the income statement (25) 8 (4) — (21)
Charge to the income statement (28) 14 (1) — (15)
At 31 December 2019 95 77 5 — 177
Note 18: Financial assets at amortised cost continued
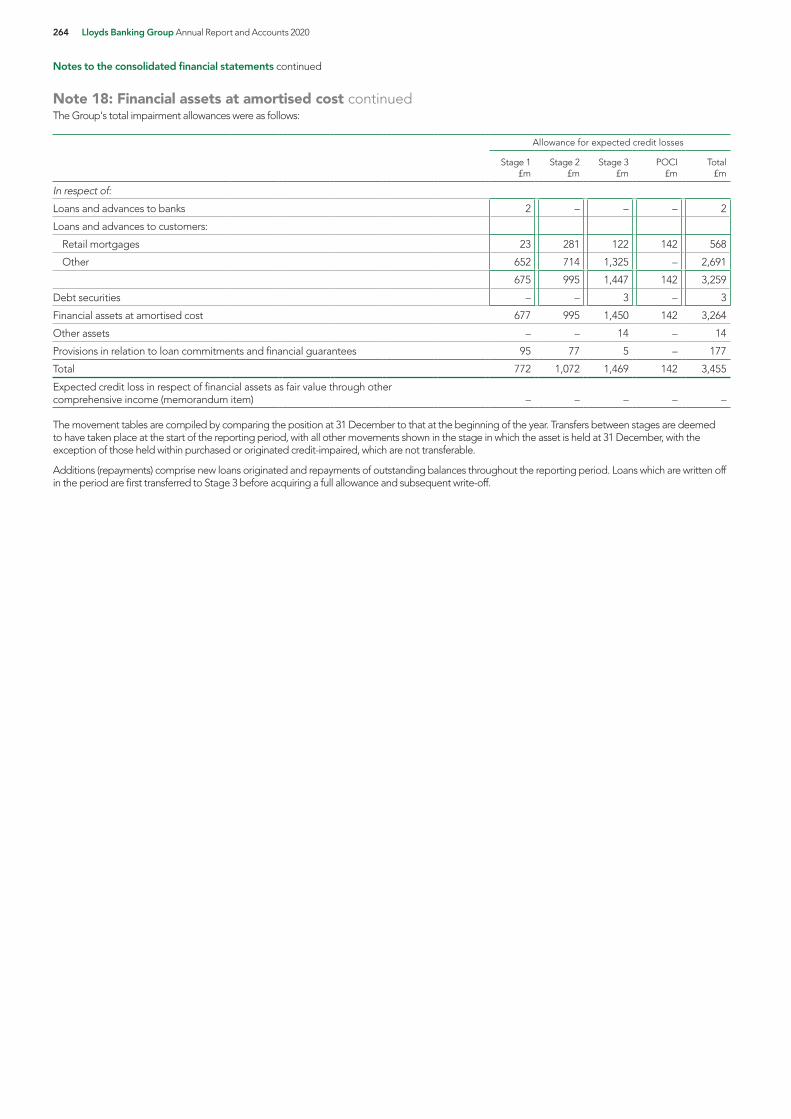
264 Lloyds Banking Group Annual Report and Accounts 2020
The Group's total impairment allowances were as follows:
Allowance for expected credit losses
Stage 1 Stage 2 Stage 3 POCI Total£m £m £m £m £m
In respect of:
Loans and advances to banks 2 — — — 2
Loans and advances to customers:
Retail mortgages 23 281 122 142 568
Other 652 714 1,325 — 2,691
675 995 1,447 142 3,259
Debt securities — — 3 — 3
Financial assets at amortised cost 677 995 1,450 142 3,264
Other assets — — 14 — 14
Provisions in relation to loan commitments and financial guarantees 95 77 5 — 177
Total 772 1,072 1,469 142 3,455
Expected credit loss in respect of financial assets as fair value through other comprehensive income (memorandum item) — — — — —
The movement tables are compiled by comparing the position at 31 December to that at the beginning of the year. Transfers between stages are deemed to have taken place at the start of the reporting period, with all other movements shown in the stage in which the asset is held at 31 December, with the exception of those held within purchased or originated credit-impaired, which are not transferable.
Additions (repayments) comprise new loans originated and repayments of outstanding balances throughout the reporting period. Loans which are written off in the period are first transferred to Stage 3 before acquiring a full allowance and subsequent write-off.
Notes to the consolidated financial statements continued
Note 18: Financial assets at amortised cost continued

Strategic rep
ortFinancial results
Governance
Risk manag
ement
Other inform
ationFinancial statem
ents Lloyds Banking Group Annual Report and Accounts 2020 265
Note 20: Financial assets at fair value through other comprehensive income
2020 2019£m £m
Debt securities:
Government securities 14,286 13,098
Asset-backed securities:
Mortgage-backed securities — 121
Other asset-backed securities 180 60
Corporate and other debt securities 12,935 11,051
27,401 24,330
Treasury and other bills 36 535
Equity shares 166 227
Total financial assets at fair value through other comprehensive income 27,603 25,092
All assets were assessed at Stage 1 at 31 December 2019 and 2020.
Note 19: Finance lease receivablesThe Group's finance lease receivables are classified as loans and advances to customers and accounted for at amortised cost. The balance is analysed as follows:
2020 2019£m £m
Gross investment in finance leases, receivable:
Not later than 1 year 314 490
Later than 1 year and not later than 2 years 187 347
Later than 2 years and not later than 3 years 150 181
Later than 3 years and not later than 4 years 199 145
Later than 4 years and not later than 5 years 118 208
Later than 5 years 758 883
1,726 2,254
Unearned future finance income on finance leases (526) (563)
Rentals received in advance (18) (20)
Net investment in finance leases 1,182 1,671
The net investment in finance leases represents amounts recoverable as follows:
2020 2019£m £m
Not later than 1 year 235 406
Later than 1 year and not later than 2 years 135 326
Later than 2 years and not later than 3 years 105 130
Later than 3 years and not later than 4 years 160 103
Later than 4 years and not later than 5 years 88 171
Later than 5 years 459 535
Net investment in finance leases 1,182 1,671
Equipment leased to customers under finance leases primarily relates to structured financing transactions to fund the purchase of aircraft, ships and other large individual value items. There was an allowance for uncollectable finance lease receivables included in the allowance for impairment losses of £22 million (2019: £12 million).

266 Lloyds Banking Group Annual Report and Accounts 2020
Notes to the consolidated financial statements continued
Note 22: Goodwill
2020 2019£m £m
At 1 January 2,324 2,310
Acquisition of businesses — 14
Impairment charged to the income statement (4) —
At 31 December 2,320 2,324
Cost1 2,664 2,664
Accumulated impairment losses (344) (340)
At 31 December 2,320 2,324
1 For acquisitions made prior to 1 January 2004, the date of transition to IFRS, cost is included net of amounts amortised up to 31 December 2003.
The goodwill held in the Group’s balance sheet is tested at least annually for impairment. For the purposes of impairment testing the goodwill is allocated to the appropriate cash generating unit; of the total balance of £2,320 million (2019: £2,324 million), £1,836 million, or 79 per cent (2019: £1,836 million, 79 per cent) has been allocated to Scottish Widows in the Group’s Insurance and Wealth division; £302 million, or 13 per cent (2019: £302 million, or 13 per cent) has been allocated to the credit card business in the Group’s Retail division; and £166 million, or 7 per cent (2019: £170 million, 7 per cent) to Motor Finance in the Group’s Retail division.
The recoverable amount of the goodwill relating to Scottish Widows has been based on a value-in-use calculation. The calculation uses pre-tax projections of future cash flows based upon budgets and plans approved by management covering a three-year period, the related run-off of existing business in-force and a discount rate of 10 per cent. The budgets and plans are based upon past experience adjusted to take into account anticipated changes in sales volumes, product mix and margins having regard to expected market conditions and competitor activity. The discount rate is determined with reference to internal
Note 21: Investments in joint ventures and associatesThe Group's share of results of, and investments in, equity accounted joint ventures and associates comprises:
Joint ventures Associates Total
2020 2019 2018 2020 2019 2018 2020 2019 2018£m £m £m £m £m £m £m £m £m
Share of income statement amounts:
Income 72 66 8 4 (1) — 76 65 8
Expenses (78) (59) 1 (11) — — (89) (59) 1
Impairment — — — — — — — — —
(Loss) profit before tax (6) 7 9 (7) (1) — (13) 6 9
Tax — — — — — — — — —
Share of post-tax results (6) 7 9 (7) (1) — (13) 6 9
Share of other comprehensive income — — 8 — — — — — 8
Share of total comprehensive income (6) 7 17 (7) (1) — (13) 6 17
Share of balance sheet amounts:
Current assets 437 347 12 5 449 352
Non-current assets 158 158 7 6 165 164
Current liabilities (148) (35) (2) — (150) (35)
Non-current liabilities (168) (177) — — (168) (177)
Share of net assets at 31 December 279 293 17 11 296 304
Movement in investments over the year:
At 1 January 293 79 11 12 304 91
Acquisitions — 1 — — — 1
Establishment of joint venture — 208 — — — 208
Additional investments 3 — 13 — 16 —
Repayment of capital (11) — — — (11) —
Share of post-tax results (6) 7 (7) (1) (13) 6
Share of other comprehensive income — — — — — —
Dividends paid — (2) — — — (2)
Share of net assets at 31 December 279 293 17 11 296 304
The Group's unrecognised share of losses of associates for the year was £nil (2019: £nil; 2018; £4 million). For entities making losses, subsequent profits earned are not recognised until previously unrecognised losses are extinguished. The Group's unrecognised share of losses net of unrecognised profits on a cumulative basis of associates is £2 million (2019: £17 million; 2018 £17 million) and of joint ventures is £5 million (2019: £3 million; 2018: £3 million).
Where entities have statutory accounts drawn up to a date other than 31 December management accounts are used when accounting for them by the Group.

Strategic rep
ortFinancial results
Governance
Risk manag
ement
Other inform
ationFinancial statem
ents Lloyds Banking Group Annual Report and Accounts 2020 267
measures and available industry information. New business cash flows beyond the three-year period have been extrapolated using a steady 2 per cent growth rate which does not exceed the long-term average growth rate for the life assurance market. Management believes that any reasonably possible change in the key assumptions above would not cause the recoverable amount of the goodwill relating to Scottish Widows to fall below its balance sheet carrying value.
The recoverable amount of the goodwill relating to Motor Finance has also been based on a value-in-use calculation using pre-tax cash flow projections based on financial budgets and plans approved by management covering a four-year period and a discount rate of 14 per cent. The cash flows beyond the four-year period are extrapolated using a growth rate of 0.5 per cent which does not exceed the long-term average growth rates for the markets in which Motor Finance participates. Management believes that any reasonably possible change in the key assumptions above would not cause the recoverable amount of the goodwill relating to Motor Finance to fall below the balance sheet carrying value. The impairment charge of £4 million related to the goodwill arising on a small, separable acquisition a number of years ago.
The recoverable amount of the goodwill relating to the Cards business has been based on a value-in-use calculation using pre-tax cash flow projections based on financial budgets and plans approved by management covering a five-year period and a discount rate of 13 per cent. The cash flows beyond the five year period assume no growth. Management believes that any reasonably possible change in the key assumptions above would not cause the recoverable amount of the goodwill relating to the Cards business to fall below the balance sheet carrying value.
Note 23: Value of in-force businessKey assumptionsThe impact of reasonably possible changes in the key assumptions made in respect of the Group's life insurance business, which include the impact on the value of in-force business, are disclosed in note 31.
The principal features of the methodology and process used for determining key assumptions used in the calculation of the value of in-force business are set out below:
Economic assumptionsEach cash flow is valued using the discount rate consistent with that applied to such a cash flow in the capital markets. In practice, to achieve the same result, where the cash flows are either independent of or move linearly with market movements, a method has been applied known as the ‘certainty equivalent’ approach whereby it is assumed that all assets earn a risk-free rate and all cash flows are discounted at a risk-free rate. The certainty equivalent approach covers all investment assets relating to insurance and participating investment contracts, other than the annuity business (where an illiquidity premium is included, see below).
A market-consistent approach has been adopted for the valuation of financial options and guarantees, using a stochastic option pricing technique calibrated to be consistent with the market price of relevant options at each valuation date. Further information on options and guarantees can be found in note 30.
The liabilities in respect of the Group’s UK annuity business are matched by a portfolio of fixed interest securities, including a large proportion of corporate bonds and illiquid loan assets. The value of the in-force business asset for UK annuity business has been calculated after taking into account an estimate of the market premium for illiquidity in respect of corporate bond holdings and relevant illiquid loan assets. In determining the market premium for illiquidity, a range of inputs are considered which reflect actual asset allocation and relevant observable market data. The illiquidity premium is estimated to be 77 basis points at 31 December 2020 (31 December 2019: 91 basis points).
The risk-free rate is derived from the relevant swap curve with a deduction for credit risk.
The table below shows the resulting range of yields and other key assumptions at 31 December:
2020 2019% %
Risk-free rate (value of in-force non-annuity business)1 (0.36) to 3.75 0.00 to 3.90
Risk-free rate (value of in-force annuity business)1 0.41 to 4.53 0.91 to 4.81
Risk-free rate (financial options and guarantees)1 (0.36) to 3.75 0.00 to 3.90
Retail price inflation 3.00 3.11
Expense inflation 3.30 3.41
1 All risk-free rates are quoted as the range of rates implied by the relevant forward swap curve.
Non-market riskAn allowance for non-market risk is made through the choice of best estimate assumptions based upon experience, which generally will give the mean expected financial outcome for shareholders and hence no further allowance for non-market risk is required. However, in the case of operational risk, reinsurer default and the with-profit funds these can be asymmetric in the range of potential outcomes for which an explicit allowance is made.
Non-economic assumptionsFuture mortality, morbidity, expenses, lapse and paid-up rate assumptions are reviewed each year and are based on an analysis of past experience and on management’s view of future experience. Further information on these assumptions is given in note 30 and the effect of changes in key assumptions is given in note 31.
Note 22: Goodwill continued

268 Lloyds Banking Group Annual Report and Accounts 2020
Notes to the consolidated financial statements continued
The gross value of in-force business asset in the consolidated balance sheet is as follows:
2020 2019£m £m
Acquired value of in-force non-participating investment contracts 221 247
Value of in-force insurance and participating investment contracts 5,396 5,311
Total value of in-force business 5,617 5,558
The movement in the acquired value of in-force non-participating investment contracts over the year is as follows:
2020 2019£m £m
At 1 January 247 271
Acquisition of business — 6
Amortisation (note 11) (26) (30)
At 31 December 221 247
The acquired value of in-force non-participating investment contracts includes £134 million (2019: £150 million) in relation to OEIC business.
Movement in value of in-force businessThe movement in the value of in-force insurance and participating investment contracts over the year is as follows:
2020 2019£m £m
At 1 January 5,311 4,491
Exchange and other adjustments 9 (5)
Movements in the year:
New business 361 696
Existing business:
Expected return (297) (274)
Experience variances (82) (43)
Assumption changes 141 102
Economic variance (47) 344
Movement in the value of in-force business (note 9) 76 825
At 31 December 5,396 5,311
This breakdown shows the movement in the value of in-force business only, and does not represent the full contribution that each item in the breakdown makes to profit before tax. This will also contain changes in the other assets and liabilities of the relevant businesses, including the effects of changes in assumptions used to value the liabilities. The presentation of economic variance includes the impact of financial market conditions being different at the end of the year from those included in assumptions used to calculate new and existing business returns.
Note 23: Value of in-force business continued

Strategic rep
ortFinancial results
Governance
Risk manag
ement
Other inform
ationFinancial statem
ents Lloyds Banking Group Annual Report and Accounts 2020 269
Note 24: Other intangible assets
BrandsCore deposit
intangible
Purchased credit card
relationships
Customer- related
intangibles
Capitalised software
enhancements Total£m £m £m £m £m £m
Cost:
At 1 January 2019 596 2,770 1,002 538 3,931 8,837
Exchange and other adjustments — — — — 4 4
Additions — — — — 1,033 1,033
Disposals — — — — (10) (10)
At 31 December 2019 596 2,770 1,002 538 4,958 9,864
Exchange and other adjustments — — — — — —
Additions — — — — 991 991
Disposals — — — — (55) (55)
At 31 December 2020 596 2,770 1,002 538 5,894 10,800
Accumulated amortisation:
At 1 January 2019 216 2,770 411 538 1,555 5,490
Exchange and other adjustments — — — — 4 4
Charge for the year (note 11) — — 70 — 496 566
Disposals — — — — (4) (4)
At 31 December 2019 216 2,770 481 538 2,051 6,056
Exchange and other adjustments — — — — (1) (1)
Charge for the year (note 11) — — 70 — 590 660
Disposals — — — — (55) (55)
At 31 December 2020 216 2,770 551 538 2,585 6,660
Balance sheet amount at 31 December 2020 380 — 451 — 3,309 4,140
Balance sheet amount at 31 December 2019 380 — 521 — 2,907 3,808
Brands arising from the acquisition of Bank of Scotland in 2009 are recognised on the Group's balance sheet and have been determined to have an indefinite useful life. The carrying value at 31 December 2020 was £380 million (2019: £380 million). The Bank of Scotland name has been in existence for over 300 years and there are no indications that the brand should not have an indefinite useful life. The recoverable amount has been based on a value-in-use calculation. The calculation uses post-tax projections of the income generated by the brands, a discount rate of 9.31 per cent and a future growth rate of 2.5 per cent. Management estimates that if the growth rate were decreased by 1 per cent there would have been an impairment charge of £50 million.

270 Lloyds Banking Group Annual Report and Accounts 2020
Notes to the consolidated financial statements continued
Note 25: Property, plant and equipment
Investment properties Premises Equipment
Operating lease assets
Right-of- use asset1 Total
£m £m £m £m £m £m
Cost or valuation:
At 1 January 2019 3,770 1,216 5,007 6,754 1,716 18,463
Exchange and other adjustments 16 3 5 (4) — 20
Additions — 121 522 1,693 196 2,532
Expenditure on investment properties (see below) 73 — — — — 73
Change in fair value of investment properties (note 7) (108) — — — — (108)
Disposals (198) (245) (238) (1,694) (27) (2,402)
At 31 December 2019 3,553 1,095 5,296 6,749 1,885 18,578
Exchange and other adjustments — 1 — (3) (2) (4)
Additions — 76 316 1,436 142 1,970
Expenditure on investment properties (see below) 82 — — — — 82
Change in fair value of investment properties (note 7) (209) — — — — (209)
Disposals (79) (189) (505) (1,917) (125) (2,815)
At 31 December 2020 3,347 983 5,107 6,265 1,900 17,602
Accumulated depreciation and impairment:
At 1 January 2019 — 216 2,298 1,933 — 4,447
Exchange and other adjustments — — (1) (36) 1 (36)
Depreciation charge for the year (note 11) — 125 715 1,008 216 2,064
Disposals — (225) (180) (595) (1) (1,001)
At 31 December 2019 — 116 2,832 2,310 216 5,474
Exchange and other adjustments — (2) 2 (3) (1) (4)
Depreciation charge for the year (note 11) — 127 680 1,011 228 2,046
Disposals — (143) (469) (1,013) (43) (1,668)
At 31 December 2020 — 98 3,045 2,305 400 5,848
Balance sheet amount at 31 December 2020 3,347 885 2,062 3,960 1,500 11,754
Balance sheet amount at 31 December 2019 3,553 979 2,464 4,439 1,669 13,104
1 Primarily premises.
Expenditure on investment properties is comprised as follows:
2020 2019£m £m
Acquisitions of new properties 61 21
Additional expenditure on existing properties 21 52
82 73
Rental income of £191 million (2019: £191 million) and direct operating expenses of £32 million (2019: £32 million) arising from properties that generate rental income have been recognised in the income statement.
Capital expenditure in respect of investment properties which had been contracted for but not recognised in the financial statements was £38 million (2019: £7 million).
The table above analyses movements in investment properties, all of which are categorised as level 3. See note 48 for details of levels in the fair value hierarchy.
At 31 December the future minimum rentals receivable under non-cancellable operating leases were as follows:
2020 2019£m £m
Receivable within 1 year 864 978
1 to 2 years 548 620
2 to 3 years 274 312
3 to 4 years 78 102
4 to 5 years 7 12
Over 5 years — 2
Total future minimum rentals receivable 1,771 2,026
Equipment leased to customers under operating leases primarily relates to vehicle contract hire arrangements.

Strategic rep
ortFinancial results
Governance
Risk manag
ement
Other inform
ationFinancial statem
ents Lloyds Banking Group Annual Report and Accounts 2020 271
Note 28: Debt securities in issue
2020 2019£m £m
Medium-term notes issued 42,621 41,291
Covered bonds (note 29) 23,980 29,821
Certificates of deposit issued 7,998 10,598
Securitisation notes (note 29) 4,406 7,288
Commercial paper 8,392 8,691
Total debt securities in issue 87,397 97,689
Note 27: Financial liabilities at fair value through profit or loss
2020 2019£m £m
Liabilities designated at fair value through profit or loss: debt securities in issue 6,828 7,531
Trading liabilities:
Liabilities in respect of securities sold under repurchase agreements 14,996 11,048
Other deposits 6 98
Short positions in securities 816 2,809
15,818 13,955
Total financial liabilities at fair value through profit or loss 22,646 21,486
Liabilities designated at fair value through profit or loss primarily represent debt securities in issue which either contain substantive embedded derivatives which would otherwise need to be recognised and measured at fair value separately from the related debt securities, or which are accounted for at fair value to significantly reduce an accounting mismatch.
The amount contractually payable on maturity of the debt securities held at fair value through profit or loss at 31 December 2020 was £11,503 million, which was £4,675 million higher than the balance sheet carrying value (2019: £14,365 million, which was £6,834 million higher than the balance sheet carrying value). At 31 December 2020 there was a cumulative £109 million increase in the fair value of these liabilities attributable to changes in credit spread risk; this is determined by reference to the quoted credit spreads of Lloyds Bank plc, the issuing entity within the Group. Of the cumulative amount, an increase of £75 million arose in 2020 and an increase of £419 million arose in 2019.
For the fair value of collateral pledged in respect of repurchase agreements see note 51.
Note 26: Other assets
2020 2019£m £m
Deferred acquisition and origination costs 74 83
Settlement balances 1,389 654
Other assets and prepayments 2,787 3,737
Total other assets 4,250 4,474

272 Lloyds Banking Group Annual Report and Accounts 2020
Notes to the consolidated financial statements continued
Note 29: Securitisations and covered bondsSecuritisation programmesLoans and advances to customers include loans securitised under the Group’s securitisation programmes, the majority of which have been sold by subsidiary companies to bankruptcy remote structured entities. As the structured entities are funded by the issue of debt on terms whereby the majority of the risks and rewards of the portfolio are retained by the subsidiary, the structured entities are consolidated fully and all of these loans are retained on the Group’s balance sheet, with the related notes in issue included within debt securities in issue.
Covered bond programmesCertain loans and advances to customers have been assigned to bankruptcy remote limited liability partnerships to provide security for issues of covered bonds by the Group. The Group retains all of the risks and rewards associated with these loans and the partnerships are consolidated fully with the loans retained on the Group’s balance sheet and the related covered bonds in issue included within debt securities in issue.
The Group’s principal securitisation and covered bond programmes, together with the balances of the advances subject to these arrangements and the carrying value of the notes in issue at 31 December, are listed below. The notes in issue are reported in note 28.
2020 2019
Loans and advances
securitisedNotes
in issue
Loans and advances
securitisedNotes
in issue£m £m £m £m
Securitisation programmes
UK residential mortgages 23,984 21,640 25,815 23,505
Commercial loans 2,884 4,004 5,116 6,037
Credit card receivables 5,890 4,340 8,164 5,767
Motor vehicle finance 1,826 1,915 3,450 3,462
34,584 31,899 42,545 38,771
Less held by the Group (27,448) (31,436)
Total securitisation programmes (notes 27 and 28)1 4,451 7,335
Covered bond programmes
Residential mortgage-backed 33,980 23,480 37,579 29,321
Social housing loan-backed 980 600 1,552 600
34,960 24,080 39,131 29,921
Less held by the Group (100) (100)
Total covered bond programmes (note 28) 23,980 29,821
Total securitisation and covered bond programmes 28,431 37,156
1 Includes £45 million (2019: £47 million) of securitisation notes held at fair value through profit or loss.
Cash deposits of £3,930 million (2019: £4,703 million) which support the debt securities issued by the structured entities, the term advances related to covered bonds and other legal obligations are held by the Group. Additionally, the Group has certain contractual arrangements to provide liquidity facilities to some of these structured entities. At 31 December 2020 these obligations had not been triggered; the maximum exposure under these facilities was £52 million (2019: £56 million).
The Group has a number of covered bond programmes, for which limited liability partnerships have been established to ring-fence asset pools and guarantee the covered bonds issued by the Group. At the reporting date the Group had over-collateralised these programmes as set out in the table above to meet the terms of the programmes, to secure the rating of the covered bonds and to provide operational flexibility. From time-to-time, the obligations of the Group to provide collateral may increase due to the formal requirements of the programmes. The Group may also voluntarily contribute collateral to support the ratings of the covered bonds.
The Group recognises the full liabilities associated with its securitisation and covered bond programmes within debt securities in issue, although the obligations of the Group in respect of its securitisation issuances are limited to the cash flows generated from the underlying assets. The Group could be required to provide additional support to a number of the securitisation programmes to support the credit ratings of the debt securities issued, in the form of increased cash reserves and the holding of subordinated notes. Further, certain programmes contain contractual obligations that require the Group to repurchase assets should they become credit impaired or as otherwise required by the transaction documents.
The Group has not provided financial or other support by voluntarily offering to repurchase assets from any of its public securitisation programmes during 2020 (2019: none).

Strategic rep
ortFinancial results
Governance
Risk manag
ement
Other inform
ationFinancial statem
ents Lloyds Banking Group Annual Report and Accounts 2020 273
Note 30: Liabilities arising from insurance contracts and participating investment contractsInsurance contract and participating investment contract liabilities are comprised as follows:
2020 2019
Gross Reinsurance1 Net Gross Reinsurance1 Net£m £m £m £m £m £m
Life insurance (see (1) below):
Insurance contracts 102,424 (820) 101,604 96,812 (715) 96,097
Participating investment contracts 13,041 — 13,041 14,063 — 14,063
115,465 (820) 114,645 110,875 (715) 110,160
Non-life insurance contracts (see (2) below):
Unearned premiums 330 (14) 316 333 (14) 319
Claims outstanding 265 — 265 241 — 241
595 (14) 581 574 (14) 560
Total 116,060 (834) 115,226 111,449 (729) 110,720
1 Reinsurance balances are reported within assets.
(1) Life insuranceThe movement in life insurance contract and participating investment contract liabilities over the year can be analysed as follows:
Insurance contracts
Participating investment
contracts Gross Reinsurance Net£m £m £m £m £m
At 1 January 2019 84,366 13,912 98,278 (716) 97,562
New business 5,684 37 5,721 (45) 5,676
Changes in existing business 6,798 114 6,912 46 6,958
Change in liabilities charged to the income statement (note 10) 12,482 151 12,633 1 12,634
Exchange and other adjustments (36) — (36) — (36)
At 31 December 2019 96,812 14,063 110,875 (715) 110,160
New business 3,780 28 3,808 (100) 3,708
Changes in existing business 1,832 (1,050) 782 (5) 777
Change in liabilities charged to the income statement (note 10) 5,612 (1,022) 4,590 (105) 4,485
Exchange and other adjustments — — — — —
At 31 December 2020 102,424 13,041 115,465 (820) 114,645
Liabilities for insurance contracts and participating investment contracts can be split into with-profit fund liabilities, accounted for using the PRA’s realistic capital regime (realistic liabilities) and non-profit fund liabilities, accounted for using a prospective actuarial discounted cash flow methodology, as follows:
2020 2019
With-profit fund
Non-profit fund Total
With-profit fund
Non-profit fund Total
£m £m £m £m £m £m
Insurance contracts 7,824 94,600 102,424 8,018 88,794 96,812
Participating investment contracts 6,475 6,566 13,041 7,222 6,841 14,063
Total 14,299 101,166 115,465 15,240 95,635 110,875
With-profit fund realistic liabilities
(i) Business descriptionScottish Widows Limited has the only with-profit funds within the Group. The primary purpose of the conventional and unitised business written in the with-profit funds is to provide a smoothed investment vehicle to policyholders, protecting them against short-term market fluctuations. Payouts may be subject to a guaranteed minimum payout if certain policy conditions are met. With-profit policyholders are entitled to at least 90 per cent of the distributed profits, with the shareholders receiving the balance. The policyholders are also usually insured against death and the policy may carry a guaranteed annuity option at retirement.
(ii) Method of calculation of liabilitiesWith-profit liabilities are stated at their realistic value, the main components of which are:
– With-profit benefit reserve, the total asset shares for with-profit policies;
– Cost of options and guarantees (including guaranteed annuity options);
– Deductions levied against asset shares;
– Planned enhancements to with-profits benefits reserve; and
– Impact of the smoothing policy.

274 Lloyds Banking Group Annual Report and Accounts 2020
Notes to the consolidated financial statements continued
(iii) AssumptionsKey assumptions used in the calculation of with-profit liabilities, which reflect the impacts of COVID-19 (in particular in relation to persistency and mortality assumptions) that has also increased the level of uncertainty, and the processes for determining these, are:
Investment returns and discount ratesWith-profit fund liabilities are valued on a market-consistent basis, achieved by the use of a valuation model which values liabilities on a basis calibrated to tradable market option contracts and other observable market data. The with-profit fund financial options and guarantees are valued using a stochastic simulation model where all assets are assumed to earn, on average, the risk-free yield and all cash flows are discounted using the risk-free yield. The risk-free yield is defined as the spot yield derived from the relevant swap curve, adjusted for credit risk. Further information on significant options and guarantees is given below.
Guaranteed annuity option take-up ratesCertain pension contracts contain guaranteed annuity options that allow the policyholder to take an annuity benefit on retirement at annuity rates that were guaranteed at the outset of the contract. For contracts that contain such options, key assumptions in determining the cost of options are economic conditions in which the option has value, mortality rates and take up rates of other options. The financial impact is dependent on the value of corresponding investments, interest rates and longevity at the time of the claim.
Investment volatilityThe calibration of the stochastic simulation model uses implied volatilities of derivatives where possible, or historical volatility where it is not possible to observe meaningful prices.
MortalityThe mortality assumptions, including allowances for improvements in longevity for annuitants, are set with regard to the Group’s actual experience where this is significant, and relevant industry data otherwise.
Lapse rates (persistency)Lapse rates refer to the rate of policy termination or the rate at which policyholders stop paying regular premiums due under the contract.
Historical persistency experience is analysed using statistical techniques. As experience can vary considerably between different product types and for contracts that have been in-force for different periods, the data is broken down into broadly homogenous groups for the purposes of this analysis.
The most recent experience is considered along with the results of previous analyses and management’s views on future experience, taking into consideration potential changes in future experience that may result from guarantees and options becoming more valuable under adverse market conditions, in order to determine a ‘best estimate’ view of what persistency will be. In determining this best estimate view a number of factors are considered, including the credibility of the results (which will be affected by the volume of data available), any exceptional events that have occurred during the period under consideration, any known or expected trends in underlying data and relevant published market data.
(iv) Options and guarantees within the With-Profit FundsThe most significant options and guarantees provided from within the With-Profit Funds are in respect of guaranteed minimum cash benefits on death, maturity, retirement or certain policy anniversaries, and guaranteed annuity options on retirement for certain pension policies.
For those policies written in Scottish Widows pre-demutualisation containing potentially valuable options and guarantees, under the terms of the Scheme a separate memorandum account was set up, within the With-Profit Fund originally held in Scottish Widows plc and subsequently transferred into Scottish Widows Limited, called the Additional Account which is available, inter alia, to meet any additional costs of providing guaranteed benefits in respect of those policies. The Additional Account had a value at 31 December 2020 of £2.5 billion (2019: £2.6 billion). The eventual cost of providing benefits on policies written both pre and post demutualisation is dependent upon a large number of variables, including future interest rates and equity values, demographic factors, such as mortality, and the proportion of policyholders who seek to exercise their options. The ultimate cost will therefore not be known for many years.
As noted above, the liabilities of the With-Profit Funds are valued using a market-consistent stochastic simulation model which places a value on the options and guarantees which captures both their intrinsic value and their time value.
The most significant economic assumptions included in the model are risk-free yield and investment volatility.
Non-profit fund liabilities
(i) Business descriptionThe Group principally writes the following types of life insurance contracts within its non-profit funds. Shareholder profits on these types of business arise from management fees and other policy charges.
Unit-linked businessThis includes unit-linked pensions and unit-linked bonds, the primary purpose of which is to provide an investment vehicle where the policyholder is also insured against death.
Life insuranceThe policyholder is insured against death or permanent disability, usually for predetermined amounts. Such business includes whole of life and term assurance and long-term creditor policies.
AnnuitiesThe policyholder is entitled to payments for the duration of their life and is therefore insured against surviving longer than expected.
(ii) Method of calculation of liabilitiesThe non-profit fund liabilities are determined on the basis of recognised actuarial methods and involve estimating future policy cash flows over the duration of the in-force book of policies, and discounting the cash flows back to the valuation date allowing for probabilities of occurrence.
Note 30: Liabilities arising from insurance contracts and participating investment contracts continued

Strategic rep
ortFinancial results
Governance
Risk manag
ement
Other inform
ationFinancial statem
ents Lloyds Banking Group Annual Report and Accounts 2020 275
(iii) AssumptionsGenerally, assumptions used to value non-profit fund liabilities are prudent in nature and therefore contain a margin for adverse deviation. This margin for adverse deviation is based on management’s judgement and reflects management’s views on the inherent level of uncertainty. In calculating the value of non-profit fund liabilities, the impacts of COVID-19 that has also increased the level of uncertainty have been considered, in particular in relation to persistency and mortality. The key assumptions used in the measurement of non-profit fund liabilities are:
Interest ratesThe rates of interest used are determined by reference to a number of factors including the redemption yields on fixed interest assets at the valuation date.
Margins for risk are allowed for in the assumed interest rates, including reductions made to the available yields to allow for default risk based upon the credit rating of the securities allocated to the insurance liability.
Mortality and morbidityThe mortality and morbidity assumptions, including allowances for improvements in longevity for annuitants, are set with regard to the Group’s actual experience where this provides a reliable basis, and relevant industry data otherwise, and include a margin for adverse deviation.
Lapse rates (persistency)Lapse rates are allowed for on some non-profit fund contracts. The process for setting these rates is as described for with-profit liabilities, however a prudent scenario is assumed by the inclusion of a margin for adverse deviation within the non-profit fund liabilities.
Maintenance expensesAllowance is made for future policy costs explicitly. Expenses are determined by reference to an internal analysis of current and expected future costs plus a margin for adverse deviation. Explicit allowance is made for future expense inflation.
Key changes in assumptionsA detailed review of the Group’s assumptions in 2020 resulted in a net loss of £151 million (2019: net gain of £336 million). The following were the key impacts on profit before tax:
– Change in persistency assumptions (£74 million decrease (2019: £67 million decrease)).
– Change in the assumption in respect of current and future mortality and morbidity rates (£52 million increase (2019: £164 million increase)).
– Change in expenses assumptions (£124 million decrease (2019: £208 million increase)).
These amounts include the impacts of movements in liabilities and value of the in-force business in respect of insurance contracts and participating investment contracts.
(iv) Options and guarantees outside the With-Profit FundsA number of typical guarantees are provided outside the With-Profit Funds such as guaranteed payments on death (for example term assurance) or guaranteed income for life (e.g. annuities). In addition, certain personal pension policyholders in Scottish Widows, for whom reinstatement to their occupational pension scheme was not an option, have been given a guarantee that their pension and other benefits will correspond in value to the benefits of the relevant occupational pension scheme. The key assumptions affecting the ultimate value of the guarantee are future salary growth, gilt yields at retirement, annuitant mortality at retirement, marital status at retirement and future investment returns. There is currently a provision, calculated on a deterministic basis, of £65 million (2019: £64 million) in respect of those guarantees.
(2) Non-life insuranceFor non-life insurance contracts, the methodology and assumptions used in relation to determining the bases of the earned premium and claims provisioning levels are derived for each individual underwritten product. Assumptions are intended to be neutral estimates of the most likely or expected outcome. There has been no significant change in the assumptions and methodologies used for setting reserves.
The movements in non-life insurance contract liabilities and reinsurance assets over the year have been as follows:
2020 2019£m £m
Provisions for unearned premiums
Gross provision at 1 January 333 342
Increase in the year 655 663
Release in the year (658) (672)
Change in provision for unearned premiums charged to income statement (3) (9)
Gross provision at 31 December 330 333
Reinsurers’ share (14) (14)
Net provision at 31 December 316 319
These provisions represent the liability for short-term insurance contracts for which the Group’s obligations are not expired at the year end.
Note 30: Liabilities arising from insurance contracts and participating investment contracts continued

276 Lloyds Banking Group Annual Report and Accounts 2020
Notes to the consolidated financial statements continued
2020 2019£m £m
Claims outstanding
Gross claims outstanding at 1 January 241 254
Cash paid for claims settled in the year (294) (300)
Increase in liabilities charged to the income statement1 318 287
24 (13)
Gross claims outstanding at 31 December 265 241
Reinsurers’ share — —
Net claims outstanding at 31 December 265 241
Notified claims 141 128
Incurred but not reported 124 113
Net claims outstanding at 31 December 265 241
1 Of which an increase of £362 million (2019: increase of £335 million) was in respect of current year claims and a decrease of £44 million (2019: decrease of £48 million) was in respect of prior year claims.
Note 31: Life insurance sensitivity analysisThe following table demonstrates the effect of reasonably possible changes in key assumptions on profit before tax and equity disclosed in these financial statements assuming that the other assumptions remain unchanged. In practice this is unlikely to occur, and changes in some assumptions may be correlated. These amounts include movements in assets, liabilities and the value of the in-force business in respect of insurance contracts and participating investment contracts. The impact is shown in one direction but can be assumed to be reasonably symmetrical.
2020 2019
Change in variable
Increase (reduction)
in profit before tax
Increase (reduction)
in equity
Increase (reduction)
in profit before tax
Increase (reduction)
in equity£m £m £m £m
Non-annuitant mortality and morbidity1 5% reduction 16 13 19 16
Annuitant mortality2 5% reduction (333) (270) (293) (243)
Lapse rates3 10% reduction 70 57 107 89
Future maintenance and investment expenses4 10% reduction 332 269 299 248
Risk-free rate5 0.25% reduction 37 30 33 28
Guaranteed annuity option take up6 5% addition (2) (1) (1) (1)
Equity investment volatility7 1% addition (2) (2) (2) (1)
Widening of credit default spreads8 0.25% addition (467) (378) (424) (352)
Increase in illiquidity premia9 0.10% addition 219 178 191 159
Assumptions have been flexed on the basis used to calculate the value of in-force business and the realistic and statutory reserving bases.
1 This sensitivity shows the impact of reducing mortality and morbidity rates on non-annuity business to 95 per cent of the expected rate.2 This sensitivity shows the impact on the annuity and deferred annuity business of reducing mortality rates to 95 per cent of the expected rate. 3 This sensitivity shows the impact of reducing lapse and surrender rates to 90 per cent of the expected rate.4 This sensitivity shows the impact of reducing maintenance expenses and investment expenses to 90 per cent of the expected rate.5 This sensitivity shows the impact on the value of in-force business, financial options and guarantee costs, statutory reserves and asset values of reducing the risk-free rate by 25 basis points.6 This sensitivity shows the impact of a flat 5 per cent addition to the expected rate. 7 This sensitivity shows the impact of a flat 1 per cent addition to the expected rate.8 This sensitivity shows the impact of a 25 basis point increase in credit default spreads on corporate bonds and the corresponding reduction in market values. Swap curves, the risk-free rate
and illiquidity premia are all assumed to be unchanged.9 This sensitivity shows the impact of a 10 basis point increase in the allowance for illiquidity premia. It assumes the overall spreads on assets are unchanged and hence market values are
unchanged. Swap curves and the non-annuity risk-free rate are both assumed to be unchanged. The increased illiquidity premium increases the annuity risk-free rate.
Note 30: Liabilities arising from insurance contracts and participating investment contracts continued

Strategic rep
ortFinancial results
Governance
Risk manag
ement
Other inform
ationFinancial statem
ents Lloyds Banking Group Annual Report and Accounts 2020 277
Note 34: Retirement benefit obligations
2020 2019 2018£m £m £m
Charge to the income statement
Defined benefit pension schemes 244 241 401
Other post-retirement benefit schemes 3 4 4
Total defined benefit schemes 247 245 405
Defined contribution pension schemes 319 287 300
Total charge to the income statement (note 11) 566 532 705
2020 2019£m £m
Amounts recognised in the balance sheet
Retirement benefit assets 1,714 681
Retirement benefit obligations (245) (257)
Total amounts recognised in the balance sheet 1,469 424
Note 33: Other liabilities
2020 2019£m £m
Settlement balances 1,191 760
Unitholders’ interest in consolidated Open Ended Investment Companies1 11,784 11,928
Unallocated surplus within insurance businesses 343 400
Lease liabilities 1,672 1,844
Other creditors and accruals 5,357 5,401
Total other liabilities 20,347 20,333
1 Where a collective investment vehicle is consolidated the interests of parties other than the Group are reported at fair value in other liabilities.
The maturity of the Group's lease liabilities was as follows:
2020 2019£m £m
Not later than 1 year 234 241
Later than 1 year and not later than 2 years 197 222
Later than 2 years and not later than 3 years 180 207
Later than 3 years and not later than 4 years 147 170
Later than 4 years and not later than 5 years 123 145
Later than 5 years 791 859
1,672 1,844
Note 32: Liabilities arising from non-participating investment contractsThe movement in liabilities arising from non-participating investment contracts may be analysed as follows:
2020 2019£m £m
At 1 January 37,459 13,853
Acquisition of business — 20,981
New business 2,113 1,810
Changes in existing business (1,120) 815
At 31 December 38,452 37,459
The balances above are shown gross of reinsurance. As at 31 December 2020, related reinsurance balances were £8 million (2019: £21 million); reinsurance balances are reported within assets. Liabilities arising from non-participating investment contracts are categorised as level 2. See note 48 for details of levels in the fair value hierarchy.

278 Lloyds Banking Group Annual Report and Accounts 2020
Notes to the consolidated financial statements continued
The total amounts recognised in the balance sheet relate to:
2020 2019£m £m
Defined benefit pension schemes 1,578 550
Other post-retirement benefit schemes (109) (126)
Total amounts recognised in the balance sheet 1,469 424
Pension schemesDefined benefit schemes
(i) Characteristics of and risks associated with the Group’s schemesThe Group has established a number of defined benefit pension schemes in the UK and overseas. All significant schemes are based in the UK, with the three most significant being the main sections of the Lloyds Bank Pension Scheme No. 1, the Lloyds Bank Pension Scheme No. 2 and the HBOS Final Salary Pension Scheme. At 31 December 2020, these schemes represented 94 per cent of the Group’s total gross defined benefit pension assets (2019: 94 per cent). These schemes provide retirement benefits calculated as a percentage of final pensionable salary depending upon the length of service; the minimum retirement age under the rules of the schemes at 31 December 2020 is generally 55 although certain categories of member are deemed to have a contractual right to retire at 50.
The Group operates both funded and unfunded pension arrangements; the majority, including the three most significant schemes, are funded schemes in the UK. All of these UK funded schemes are operated as separate legal entities under trust law, are in compliance with the Pensions Act 2004 and are managed by a Trustee Board (the Trustee) whose role is to ensure that their Scheme is administered in accordance with the Scheme rules and relevant legislation, and to safeguard the assets in the best interests of all members and beneficiaries. The Trustee is solely responsible for setting investment policy and for agreeing funding requirements with the employer through the funding valuation process. The Board of Trustees must be composed of representatives of the Company and plan participants in accordance with the Scheme’s regulations.
A valuation to determine the funding status of each scheme is carried out at least every three years, whereby scheme assets are measured at market value and liabilities (technical provisions) are measured using prudent assumptions. If a deficit is identified a recovery plan is agreed between the employer and the scheme Trustee and sent to the Pensions Regulator for review. The Group has not provided for these deficit contributions as the future economic benefits arising from these contributions are expected to be available to the Group. The Group’s overseas defined benefit pension schemes are subject to local regulatory arrangements.
Terms have now been agreed in principle with the Trustee in respect of the most recent triennial funding valuations of the Group's three main defined benefit pension schemes. The valuations showed an aggregate ongoing funding deficit of approximately £7.3 billion as at 31 December 2019 (a funding level of 85.7 per cent) compared to a £7.3 billion deficit at 31 December 2016 (a funding level of 85.9 per cent). The revised deficit now includes an allowance for the impact of RPI reform announced by the Chancellor of the Exchequer in November 2020. Under the old recovery plan deficit contributions of approximately £0.8 billion were paid in 2020 and £1.3 billion was committed from 2021 to 2024. Under the new recovery plan, £0.8 billion plus a further 30 per cent of in-year capital distributions to ordinary shareholders, up to a limit on total deficit contributions of £2.0 billion per annum, is payable from 2021 until this deficit has been removed. The deficit contributions are in addition to the regular contributions to meet benefits accruing over the year, and to cover the expenses of running the scheme. The Group expects to pay contributions of at least £1.1 billion to its defined benefit schemes in 2021.
During 2009, the Group made one-off contributions to the Lloyds Bank Pension Scheme No. 1 and Lloyds Bank Pension Scheme No. 2 in the form of interests in limited liability partnerships for each of the two schemes which hold assets to provide security for the Group’s obligations to the two schemes. At 31 December 2020, the limited liability partnerships held assets of approximately £6.7 billion. The limited liability partnerships are consolidated fully in the Group’s balance sheet.
The Group has also established three private limited companies which hold assets to provide security for the Group’s obligations to the HBOS Final Salary Pension Scheme, a section of the Lloyds Bank Pension Scheme No. 1 and the Lloyds Bank Offshore Pension Scheme. At 31 December 2020 these held assets of approximately £4.7 billion in aggregate. The private limited companies are consolidated fully in the Group’s balance sheet. The terms of these arrangements require the Group to maintain assets in these vehicles to agreed minimum values in order to secure obligations owed to the relevant Group pension schemes. The Group has satisfied this requirement during 2020.
The last funding valuations of other Group schemes were carried out on a number of different dates. In order to report the position under IAS 19 as at 31 December 2020 the most recent valuation results for all schemes have been updated by qualified independent actuaries. The funding valuations use a more prudent approach to setting the discount rate and more conservative longevity assumptions than the IAS 19 valuations.
In July 2018 a decision was sought from the High Court in respect of the requirement to equalise the Guaranteed Minimum Pension (GMP) benefits accrued between 1990 and 1997 from contracting out of the State Earnings Related Pension Scheme. In its judgment handed down on 26 October 2018 the High Court confirmed the requirement to treat men and women equally with respect to these benefits and a range of methods that the Trustee is entitled to adopt to achieve equalisation. The Group recognised a past service cost of £108 million in respect of equalisation in 2018 and, following agreement of the detailed implementation approach with the Trustee, a further £33 million was recognised in 2019. A further hearing was held during 2020 which confirmed the extent of the Trustee's obligation to revisit past transfers out of the Schemes. The amount of any additional liability as a result of this judgment is still being reviewed but is not considered likely to be material.
(ii) Amounts in the financial statements
2020 2019£m £m
Amount included in the balance sheet
Present value of funded obligations (49,549) (45,241)
Fair value of scheme assets 51,127 45,791
Net amount recognised in the balance sheet 1,578 550
Note 34: Retirement benefit obligations continued

Strategic rep
ortFinancial results
Governance
Risk manag
ement
Other inform
ationFinancial statem
ents Lloyds Banking Group Annual Report and Accounts 2020 279
2020 2019£m £m
Net amount recognised in the balance sheet
At 1 January 550 1,146
Net defined benefit pension charge (244) (241)
Actuarial losses on defined benefit obligation (5,443) (4,958)
Return on plan assets 5,565 3,531
Employer contributions 1,149 1,062
Exchange and other adjustments 1 10
At 31 December 1,578 550
2020 2019£m £m
Movements in the defined benefit obligation
At 1 January (45,241) (41,092)
Current service cost (206) (201)
Interest expense (914) (1,172)
Remeasurements:
Actuarial gains (losses) – experience 493 (29)
Actuarial (losses) gains – demographic assumptions (218) 471
Actuarial losses – financial assumptions (5,718) (5,400)
Benefits paid 2,254 2,174
Past service cost (5) (44)
Settlements 20 17
Exchange and other adjustments (14) 35
At 31 December (49,549) (45,241)
2020 2019£m £m
Analysis of the defined benefit obligation:
Active members (6,550) (6,413)
Deferred members (17,647) (16,058)
Pensioners (23,409) (21,032)
Dependants (1,943) (1,738)
(49,549) (45,241)
2020 2019£m £m
Changes in the fair value of scheme assets
At 1 January 45,791 42,238
Return on plan assets excluding amounts included in interest income 5,565 3,531
Interest income 937 1,220
Employer contributions 1,149 1,062
Benefits paid (2,254) (2,174)
Settlements (22) (18)
Administrative costs paid (54) (43)
Exchange and other adjustments 15 (25)
At 31 December 51,127 45,791
Note 34: Retirement benefit obligations continued

280 Lloyds Banking Group Annual Report and Accounts 2020
Notes to the consolidated financial statements continued
The expense recognised in the income statement for the year ended 31 December comprises:
2020 2019 2018£m £m £m
Current service cost 206 201 261
Net interest amount (23) (48) (22)
Past service credits and curtailments — — 12
Settlements 2 1 1
Past service cost – plan amendments 5 44 108
Plan administration costs incurred during the year 54 43 41
Total defined benefit pension expense 244 241 401
(iii) Composition of scheme assets
2020 2019
Quoted Unquoted Total Quoted Unquoted Total£m £m £m £m £m £m
Equity instruments 616 45 661 555 39 594
Debt instruments1:
Fixed interest government bonds 11,328 — 11,328 8,893 — 8,893
Index-linked government bonds 21,058 — 21,058 18,207 — 18,207
Corporate and other debt securities 12,736 — 12,736 10,588 — 10,588
Asset-backed securities — — — — — —
45,122 — 45,122 37,688 — 37,688
Property — 136 136 — 158 158
Pooled investment vehicles 650 13,022 13,672 4,773 10,585 15,358
Money market instruments, cash, derivatives and other assets and liabilities 812 (9,276) (8,464) 204 (8,211) (8,007)
At 31 December 47,200 3,927 51,127 43,220 2,571 45,791
1 Of the total debt instruments, £39,439 million (2019: £33,134 million) were investment grade (credit ratings equal to or better than ‘BBB’).
The assets of all the funded plans are held independently of the Group’s assets in separate trustee administered funds.
The pension schemes’ pooled investment vehicles comprise:
2020 2019£m £m
Equity funds 3,169 2,429
Hedge and mutual funds 2,181 2,886
Alternative credit funds 4,072 4,716
Property funds 1,551 1,536
Infrastructure funds 1,405 1,648
Liquidity funds 847 1,126
Bond and debt funds 396 971
Other 51 46
At 31 December 13,672 15,358
The Trustee’s approach to investment is focused on acting in the members’ best financial interests, with the integration of ESG (Environmental, Social and Governance) considerations into investment management processes and practices. This policy is reviewed annually (or more frequently as required) and has been shared with the schemes’ investment managers for implementation.
(iv) AssumptionsThe principal actuarial and financial assumptions used in valuations of the defined benefit pension schemes were as follows:
2020 2019% %
Discount rate 1.44 2.05
Rate of inflation:
Retail Price Index (RPI) 2.80 2.94
Consumer Price Index (CPI) 2.41 1.99
Rate of salary increases 0.00 0.00
Weighted-average rate of increase for pensions in payment 2.61 2.57
Note 34: Retirement benefit obligations continued

Strategic rep
ortFinancial results
Governance
Risk manag
ement
Other inform
ationFinancial statem
ents Lloyds Banking Group Annual Report and Accounts 2020 281
On 25 November 2020 the Chancellor of the Exchequer announced the outcome of a consultation into a reform of the calculation of RPI. It is now expected that from 2030 RPI will be aligned with CPIH (the Consumer Price Index including owner-occupiers' housing costs). To determine the RPI assumption a term-dependent inflation curve has been used adjusting for an assumed inflation risk premium. In the period to 2030 a gap of 100 basis points has been assumed between RPI and CPI; thereafter no gap has been assumed.
2020 2019Years Years
Life expectancy for member aged 60, on the valuation date:
Men 27.0 27.5
Women 29.0 29.2
Life expectancy for member aged 60, 15 years after the valuation date:
Men 28.1 28.5
Women 30.2 30.3
The mortality assumptions used in the UK scheme valuations are based on standard tables published by the Institute and Faculty of Actuaries which were adjusted in line with the actual experience of the relevant schemes. The table shows that a member retiring at age 60 at 31 December 2020 is assumed to live for, on average, 27.0 years for a male and 29.0 years for a female. In practice there will be much variation between individual members but these assumptions are expected to be appropriate across all members. It is assumed that younger members will live longer in retirement than those retiring now. This reflects the expectation that mortality rates will continue to fall over time as medical science and standards of living improve. To illustrate the degree of improvement assumed the table also shows the life expectancy for members aged 45 now, when they retire in 15 years’ time at age 60. The Group has considered the impact of COVID-19 and whilst a higher number of deaths have been experienced in 2020, this does not have a material impact on the defined benefit obligation.
(v) Amount, timing and uncertainty of future cash flows
Risk exposure of the defined benefit schemesWhilst the Group is not exposed to any unusual, entity specific or scheme specific risks in its defined benefit pension schemes, it is exposed to a number of significant risks, detailed below:
Inflation rate risk: the majority of the plans’ benefit obligations are linked to inflation both in deferment and once in payment. Higher inflation will lead to higher liabilities although this will be materially offset by holdings of inflation-linked gilts and, in most cases, caps on the level of inflationary increases are in place to protect against extreme inflation.
Interest rate risk: The defined benefit obligation is determined using a discount rate derived from yields on AA-rated corporate bonds. A decrease in corporate bond yields will increase plan liabilities although this will be materially offset by an increase in the value of bond holdings and through the use of derivatives.
Longevity risk: The majority of the schemes obligations are to provide benefits for the life of the members so increases in life expectancy will result in an increase in the plans’ liabilities.
Investment risk: Scheme assets are invested in a diversified portfolio of debt securities, equities and other return-seeking assets. If the assets underperform the discount rate used to calculate the defined benefit obligation, it will reduce the surplus or increase the deficit. Volatility in asset values and the discount rate will lead to volatility in the net pension asset on the Group’s balance sheet and in other comprehensive income. To a lesser extent this will also lead to volatility in the pension expense in the Group’s income statement.
The ultimate cost of the defined benefit obligations to the Group will depend upon actual future events rather than the assumptions made. The assumptions made are unlikely to be borne out in practice and as such the cost may be higher or lower than expected.
Sensitivity analysisThe effect of reasonably possible changes in key assumptions on the value of scheme liabilities and the resulting pension charge in the Group’s income statement and on the net defined benefit pension scheme asset, for the Group’s three most significant schemes, is set out below. The sensitivities provided assume that all other assumptions and the value of the schemes’ assets remain unchanged, and are not intended to represent changes that are at the extremes of possibility. The calculations are approximate in nature and full detailed calculations could lead to a different result. It is unlikely that isolated changes to individual assumptions will be experienced in practice. Due to the correlation of assumptions, aggregating the effects of these isolated changes may not be a reasonable estimate of the actual effect of simultaneous changes in multiple assumptions.
Effect of reasonably possible alternative assumptions
Increase (decrease) in the income statement charge
(Increase) decrease in the net defined benefit pension scheme
surplus
2020 2019 2020 2019£m £m £m £m
Inflation (including pension increases)1:
Increase of 0.1 per cent 11 12 531 467
Decrease of 0.1 per cent (11) (12) (522) (460)
Discount rate2:
Increase of 0.1 per cent (20) (20) (866) (763)
Decrease of 0.1 per cent 19 21 890 784
Expected life expectancy of members:
Increase of one year 39 40 2,146 1,636
Decrease of one year (37) (39) (2,052) (1,575)
1 At 31 December 2020, the assumed rate of RPI inflation is 2.80 per cent and CPI inflation 2.41 per cent (2019: RPI 2.94 per cent and CPI 1.99 per cent).2 At 31 December 2020, the assumed discount rate is 1.44 per cent (2019: 2.05 per cent).
Note 34: Retirement benefit obligations continued

282 Lloyds Banking Group Annual Report and Accounts 2020
Notes to the consolidated financial statements continued
Sensitivity analysis method and assumptionsThe sensitivity analysis above reflects the impact on the liabilities of the Group’s three most significant schemes which account for over 90 per cent of the Group’s defined benefit obligations. Whilst differences in the underlying liability profiles for the remainder of the Group’s pension arrangements mean they may exhibit slightly different sensitivities to variations in these assumptions, the sensitivities provided above are indicative of the impact across the Group as a whole.
The inflation assumption sensitivity applies to both the assumed rate of increase in the Consumer Price Index (CPI) and the Retail Price Index (RPI), and includes the impact on the rate of increases to pensions, both before and after retirement. These pension increases are linked to inflation (either CPI or RPI) subject to certain minimum and maximum limits.
The sensitivity analysis (including the inflation sensitivity) does not include the impact of any change in the rate of salary increases as pensionable salaries have been frozen since 2 April 2014.
The life expectancy assumption has been applied by allowing for an increase/decrease in life expectation from age 60 of one year, based upon the approximate weighted average age for each scheme. Whilst this is an approximate approach and will not give the same result as a one year increase in life expectancy at every age, it provides an appropriate indication of the potential impact on the schemes from changes in life expectancy.
There was no change in the methods and assumptions used in preparing the sensitivity analysis from the prior year.
Asset-liability matching strategiesThe main schemes’ assets are invested in a diversified portfolio, consisting primarily of debt securities. The investment strategy is not static and will evolve to reflect the structure of liabilities within the schemes. Specific asset-liability matching strategies for each pension plan are independently determined by the responsible governance body for each scheme and in consultation with the employer.
A significant goal of the asset-liability matching strategies adopted by Group schemes is to reduce volatility caused by changes in market expectations of interest rates and inflation. In the main schemes, this is achieved by investing scheme assets in bonds, primarily fixed interest gilts and index linked gilts, and by entering into interest rate and inflation swap arrangements. These investments are structured to take into account the profile of scheme liabilities and actively managed to reflect both changing market conditions and changes to the liability profile.
On 28 January 2020, the main schemes entered into a £10 billion longevity insurance arrangement to hedge around 20 per cent of the schemes’ exposure to unexpected increases in life expectancy. This arrangement forms part of the schemes’ investment portfolio and will provide income to the schemes in the event that pensions are paid out for longer than expected. The transaction is structured as a pass-through with Scottish Widows as the insurer, and onwards reinsurance to Pacific Life Re Limited. The valuation of the swap was nil at inception and whilst there has been a slightly higher than expected number of deaths in the population covered by the arrangement, this has not had a material impact on the value of the swap.
At 31 December 2020 the asset-liability matching strategy mitigated around 105 per cent of the liability sensitivity to interest rate movements and around 100 per cent of the liability sensitivity to inflation movements. In addition a small amount of interest rate sensitivity arises through holdings of corporate and other debt securities.
Maturity profile of defined benefit obligationThe following table provides information on the weighted average duration of the defined benefit pension obligation and the distribution and timing of benefit payments:
2020 2019Years Years
Duration of the defined benefit obligation 19 18
2020 2019£m £m
Maturity analysis of benefits expected to be paid:
Within 12 months 1,293 1,274
Between 1 and 2 years 1,350 1,373
Between 2 and 5 years 4,347 4,455
Between 5 and 10 years 8,301 8,426
Between 10 and 15 years 9,093 9,229
Between 15 and 25 years 17,485 17,400
Between 25 and 35 years 13,479 13,999
Between 35 and 45 years 7,162 8,291
In more than 45 years 2,287 3,160
Maturity analysis method and assumptionsThe projected benefit payments are based on the assumptions underlying the assessment of the obligations, including allowance for expected future inflation. They are shown in their undiscounted form and therefore appear large relative to the discounted assessment of the defined benefit obligations recognised in the Group’s balance sheet. They are in respect of benefits that have been accrued prior to the respective year-end date only and make no allowance for any benefits that may have been accrued subsequently.
Defined contribution schemesThe Group operates a number of defined contribution pension schemes in the UK and overseas, principally Your Tomorrow and the defined contribution sections of the Lloyds Bank Pension Scheme No. 1.
During the year ended 31 December 2020 the charge to the income statement in respect of defined contribution schemes was £319 million (2019: £287 million; 2018: £300 million), representing the contributions payable by the employer in accordance with each scheme’s rules.
Note 34: Retirement benefit obligations continued

Strategic rep
ortFinancial results
Governance
Risk manag
ement
Other inform
ationFinancial statem
ents Lloyds Banking Group Annual Report and Accounts 2020 283
Note 35: Deferred taxThe Group’s deferred tax assets and liabilities are as follows:
2020 2019 2020 2019Statutory position £m £m Tax disclosure £m £m
Deferred tax assets 2,741 2,666 Deferred tax assets 5,527 4,938
Deferred tax liabilities (45) (44) Deferred tax liabilities (2,831) (2,316)
Asset at 31 December 2,696 2,622 Asset at 31 December 2,696 2,622
The statutory position reflects the deferred tax assets and liabilities as disclosed in the consolidated balance sheet and takes into account the ability of the Group to net assets and liabilities where there is a legally enforceable right of offset. The tax disclosure of deferred tax assets and liabilities ties to the amounts outlined in the tables below which splits the deferred tax assets and liabilities by type, before such netting.
As a result of legislation enacted in 2016, the UK corporation tax rate had been expected to reduce from 19 per cent to 17 per cent on 1 April 2020. The Group measures its deferred tax assets and liabilities at the value expected to be recoverable or payable in future periods, and so at 31 December 2019 substantially all of its deferred tax was measured using the 17 per cent tax rate. During the December 2019 election campaign, however, the UK Government stated its intention to maintain the corporation tax rate at 19 per cent, and this tax rate was substantively enacted on 17 March 2020. The Group therefore remeasured its deferred tax assets and liabilities at 19 per cent. The deferred tax impact of this remeasurement in 2020 is a credit of £350 million in the income statement and a charge of £51 million in other comprehensive income.
On 29 October 2018, the UK Government announced its intention to restrict the use of capital tax losses to 50 per cent of any future gains arising. This restriction was substantively enacted on 2 July 2020 and as a result the Group recognised additional deferred tax liabilities of £63 million, with an impact of £47 million as a prior year charge in the income statement and £16 million in other comprehensive income, in respect of unrealised gains at that date.
Movements in deferred tax liabilities and assets (before taking into consideration the offsetting of balances within the same taxing jurisdiction) can be summarised as follows:
Other post-retirement benefit schemesThe Group operates a number of schemes which provide post-retirement healthcare benefits to certain employees, retired employees and their dependants. The principal scheme relates to former Lloyds Bank staff and under this scheme the Group has undertaken to meet the cost of post-retirement healthcare for all eligible former employees (and their dependants) who retired prior to 1 January 1996. The Group has entered into an insurance contract to provide these benefits and a provision has been made for the estimated cost of future insurance premiums payable.
For the principal post-retirement healthcare scheme, the latest actuarial valuation of the liability was carried out at 31 December 2020 by qualified independent actuaries. The principal assumptions used were as set out above, except that the rate of increase in healthcare premiums has been assumed at 6.40 per cent (2019: 6.54 per cent).
Movements in the other post-retirement benefits obligation:
2020 2019£m £m
At 1 January (126) (124)
Actuarial gains (losses) 16 (6)
Insurance premiums paid 4 7
Charge for the year (3) (4)
Exchange and other adjustments — 1
At 31 December (109) (126)
Note 34: Retirement benefit obligations continued

284 Lloyds Banking Group Annual Report and Accounts 2020
Notes to the consolidated financial statements continued
Note 36: Other provisions
Provisions for financial
commitments and guarantees
Payment protection insurance
Other regulatory provisions Other Total
£m £m £m £m £m
At 1 January 2020 177 1,880 528 738 3,323
Exchange and other adjustments (7) — 11 (9) (5)
Provisions applied — (1,703) (538) (198) (2,439)
Charge for the year 289 85 379 283 1,036
At 31 December 2020 459 262 380 814 1,915
Tax losses
Property, plant and
equipmentPension
liabilities Provisions
Share- based
payments DerivativesAsset
revaluations1
Other temporary differences Total
Deferred tax assets £m £m £m £m £m £m £m £m £m
At 1 January 2019 3,778 679 62 197 40 — — 11 4,767
(Charge) credit to the income statement (167) (16) (83) (87) 4 149 — 174 (26)
Credit to other comprehensive income — — 74 116 — — — — 190
Other credit to equity — — — — 7 — — — 7
At 31 December 2019 3,611 663 53 226 51 149 — 185 4,938
(Charge) credit to the income statement 453 5 6 6 (4) 10 29 83 588
(Charge) credit to other comprehensive income — — (3) 22 — — — — 19
Other charge to equity — — — — (18) — — — (18)
At 31 December 2020 4,064 668 56 254 29 159 29 268 5,527
Capitalised software
enhancements
Long-term assurance business
Acquisition fair value
Pension assets Derivatives
Asset revaluations1
Other temporary differences Total
Deferred tax liabilities £m £m £m £m £m £m £m £m
At 1 January 2019 (36) (637) (737) (273) (405) (99) (127) (2,314)
(Charge) credit to the income statement 15 (193) 221 59 (48) (19) (35) —
(Charge) credit to other comprehensive income — — — 64 (148) 83 — (1)
Exchange and other adjustments — — — — — — (1) (1)
At 31 December 2019 (21) (830) (516) (150) (601) (35) (163) (2,316)
(Charge) credit to the income statement (207) (13) 144 (77) (46) (25) (76) (300)
(Charge) credit to other comprehensive income — — — (165) (109) 60 — (214)
Exchange and other adjustments — — — — — — (1) (1)
At 31 December 2020 (228) (843) (372) (392) (756) — (240) (2,831)
1 Financial assets at fair value through other comprehensive income.
Deferred tax not recognisedDeferred tax assets of £85 million (2019: £24 million) have been recognised in respect of the future tax benefit of certain expenses of the life assurance business carried forward. The deferred tax asset not recognised in respect of the remaining expenses is approximately £414 million (2019: £254 million), and these expenses can be carried forward indefinitely. The unrecognised deferred tax asset has increased in 2020 because, as UK markets performed poorly, there was a significant increase in the amount of expenses to carry forward.
Deferred tax assets of approximately £114 million (2019: £48 million) have not been recognised in respect of £582 million of UK tax losses and other temporary differences which can only be used to offset future capital gains. UK capital losses can be carried forward indefinitely.
In addition, no deferred tax asset is recognised in respect of unrelieved foreign tax credits of £46 million (2019: £46 million), as there are no expected future taxable profits against which the credits can be utilised. These credits can be carried forward indefinitely.
No deferred tax has been recognised in respect of foreign trade losses where it is not more likely than not that we will be able to utilise them in future periods. Of the asset not recognised, £41 million (2019: £35 million) relates to losses that will expire if not used within 20 years, and £48 million (2019: £45 million) relates to losses with no expiry date.
As a result of parent company exemptions on dividends from subsidiaries and on capital gains on disposal there are no significant taxable temporary differences associated with investments in subsidiaries, branches, associates and joint arrangements.
Note 35: Deferred tax continued
Strategic rep
ortFinancial results
Governance
Risk manag
ement
Other inform
ationFinancial statem
ents Lloyds Banking Group Annual Report and Accounts 2020 285
Provisions for financial commitments and guaranteesProvisions are recognised for expected credit losses on undrawn loan commitments and financial guarantees. See also note 18.
Payment protection insurance (excluding MBNA)The Group has made provisions for PPI costs totalling £21,960 million; of which £85 million was recognised in the final quarter of the year ended 31 December 2020. Of the approximately six million enquiries received pre-deadline, more than 99 per cent have now been processed. The £85 million charge in the fourth quarter was driven by the impact of coronavirus delaying operational activities during 2020, the final stages of work to ensure operational completeness ahead of an orderly programme close and final validation of information requests and complaints with third parties that resulted in a limited number of additional complaints to be handled. A small part of the costs incurred during the year also reflect the costs associated with litigation activity to date.
At 31 December 2020, a provision of £201 million remained unutilised relating to complaints and associated administration costs excluding amounts relating to MBNA. Total cash payments were £1,462 million during the year ended 31 December 2020.
Payment protection insurance (MBNA)As announced in December 2016, the Group's exposure continues to remain capped at £240 million under the terms of the MBNA sale and purchase agreement. No additional charge has been made by MBNA to its PPI provision in the year ended 31 December 2020; total cash payments in the year were £241 million and the remaining provision at 31 December 2020 was £61 million (31 December 2019: £302 million).
Other provisions for legal actions and regulatory mattersIn the course of its business, the Group is engaged in discussions with the PRA, FCA and other UK and overseas regulators and other governmental authorities on a range of matters. The Group also receives complaints in connection with its past conduct and claims brought by or on behalf of current and former employees, customers, investors and other third parties and is subject to legal proceedings and other legal actions. Where significant, provisions are held against the costs expected to be incurred in relation to these matters and matters arising from related internal reviews. During the year ended 31 December 2020 the Group charged a further £379 million in respect of legal actions and other regulatory matters, and the unutilised balance at 31 December 2020 was £380 million (31 December 2019: £528 million). The most significant items are as follows.
HBOS Reading – reviewThe Group completed its compensation assessment for those within the Customer Review in 2019 with more than £109 million of compensation paid, in addition to £15 million for ex-gratia payments and £6 million for the reimbursement of legal fees. The Group is applying the recommendations from Sir Ross Cranston’s review, issued in December 2019, including a reassessment of direct and consequential losses by an independent panel, an extension of debt relief and a wider definition of de facto directors. Further details of the panel were announced on 3 April 2020 and the panel's full scope and methodology was published on 7 July 2020. The panel’s stated objective is to consider cases via a non-legalistic and fair process, and to make their decisions in a generous, fair and common-sense manner. Details of an appeal process for the further assessments of debt relief and de facto director status have also been announced. The Group continues to make progress on its assessment of claims for further debt relief and de facto director status, completing preliminary assessments for 98 per cent of claims on both debt relief and de facto directors. As part of these activities the Group has recorded charges in relation to compensation payments and associated costs (projected to the fourth quarter of 2021) in 2020 in applying the recommendations, in respect of debt relief and de facto director status. During 2021, decisions from the independent panel re-review on direct and consequential losses will start to be issued, which is likely to result in further charges but it is not possible to estimate the potential impact at this stage. The Group is committed to implementing Sir Ross' recommendations in full.
The Dame Linda Dobbs review, which is considering the Group’s handling of HBOS Reading between January 2009 and January 2017, is now expected to complete towards the end of 2021. The cost of undertaking the review is included in the revised provision.
The 2020 charge of £159 million, and lifetime cost of £435 million, includes both compensation payments and operational costs.
Arrears handling related activitiesThe Group has provided an additional £35 million in the year ended 31 December 2020 for arrears handling related activities, bringing the total provided to date to £1,016 million; the unutilised balance at 31 December 2020 was £62 million.
Customer claims in relation to insurance branch business in GermanyThe Group continues to receive claims from customers in Germany relating to policies issued by Clerical Medical Investment Group Limited (subsequently renamed Scottish Widows Limited), with smaller numbers of claims received from customers in Austria and Italy. The German industry-wide issue regarding notification of contractual 'cooling off' periods continued to lead to a similar number of claims in 2020 as 2019. The total provision made to 31 December 2020 was £674 million (31 December 2019: £656 million); utilisation of the provision was £28 million in the year ended 31 December 2020 (2019: £28 million); the remaining unutilised provision as at 31 December 2020 was £93 million (31 December 2019: £101 million). The ultimate financial effect, which could be significantly different from the current provision, will be known only once all relevant claims have been resolved.
OtherFollowing the sale of TSB Banking Group plc, the Group raised a provision of £665 million in relation to various ongoing commitments; £111 million of this provision remained unutilised at 31 December 2020.
Provisions are made for staff and other costs related to Group restructuring initiatives at the point at which the Group becomes committed to the expenditure. At 31 December 2020 provisions of £198 million (31 December 2019: £129 million) were held.
The Group carries provisions of £112 million (2019: £118 million) for indemnities and other matters relating to legacy business disposals in prior years.
Note 36: Other provisions continued

286 Lloyds Banking Group Annual Report and Accounts 2020
Notes to the consolidated financial statements continued
Note 37: Subordinated liabilitiesThe movement in subordinated liabilities during the year was as follows:
Preference shares
Preferred securities
Undated subordinated
liabilities
Dated subordinated
liabilities Total£m £m £m £m £m
At 1 January 2019 803 3,205 588 13,060 17,656
Repurchases and redemptions during the year1 (3) (49) (53) (713) (818)
Foreign exchange movements (12) (83) (36) (402) (533)
Other movements (all non-cash) 114 152 18 541 825
At 31 December 2019 902 3,225 517 12,486 17,130
Issued during the year — — — 1,010 1,010
Repurchases and redemptions during the year1 — (1,609) — (3,125) (4,734)
Foreign exchange movements (22) (59) 15 84 18
Other movements (all non-cash) 82 186 (23) 592 837
At 31 December 2020 962 1,743 509 11,047 14,261
1 The repurchases and redemptions resulted in cash outflows of £3,874 million (2019: £818 million).
Issued during 2020
Dated subordinated liabilities £m
4.50% Fixed Rate Step-up Subordinated Notes due 2030 (€309 million) 275
2.707% Fixed Rate Dated Subordinated Reset Notes due 2035 (£1,309 million) 735
1,010
Repurchases and redemptions during 2020
Preferred securities £m
12% Fixed to Floating Rate Perpetual Tier 1 Capital Securities callable 2024 (US$2,000 million) 119
13% Sterling Step-up Perpetual Capital Securities callable 2029 (£700 million) 515
7.281% Perpetual Regulatory Tier One Securities (Series B) (£150 million) 111
6.85% Non-cumulative Perpetual Preferred Securities (US$1,000 million) 580
7.881% Guaranteed Non-voting Non-cumulative Preferred Securities (£245 million) 284
1,609
Dated subordinated liabilities £m
6.5% Dated Subordinated Notes 2020 (€1,500 million) 1,464
4.50% Fixed Rate Step-up Subordinated Notes due 2030 (€309 million) 284
5.75% Subordinated Fixed to Floating Rate Notes 2025 callable 2020 (£350 million) 370
6.50% Subordinated Fixed Rate Notes 2020 (US$2,000 million) 674
Subordinated Floating Rate Notes 2020 (€100 million) 90
9.625% Subordinated Bonds 2023 (£300 million) 239
7.375% Dated Subordinated Notes 2020 4
3,125
Certain of the above securities were issued or redeemed under exchange offers, which did not result in an extinguishment of the original financial liability for accounting purposes.
Repurchases and redemptions during 2019
Preference shares £m
6.3673% Non-cumulative Fixed to Floating Rate Preference Shares callable 2019 3
Preferred securities £m
13% Step-up Perpetual Capital Securities callable 2019 49
Undated subordinated liabilities £m
6.5% Undated Subordinated Step-up Notes callable 2019 1
7.375% Undated Subordinated Guaranteed Bonds 52
53
Dated subordinated liabilities £m
10.375% Subordinated Fixed to Fixed Rate Notes 2024 callable 2019 135
9.375% Subordinated Bonds 2021 328
6.375% Subordinated Instruments 2019 250
713

Strategic rep
ortFinancial results
Governance
Risk manag
ement
Other inform
ationFinancial statem
ents Lloyds Banking Group Annual Report and Accounts 2020 287
Note 39: Share premium account
2020 2019 2018£m £m £m
At 1 January 17,751 17,719 17,634
Issued under employee share schemes 112 29 85
Redemption of preference shares1 — 3 —
At 31 December 17,863 17,751 17,719
1 During the year ended 31 December 2019, the Company redeemed all of its outstanding 6.3673% Non-cumulative Fixed to Floating Rate Preference Shares at their combined sterling par value of £3 million. These preference shares had been accounted for as subordinated liabilities. On redemption an amount of £3 million was transferred from the distributable merger reserve to the share premium account.
Note 38: Share capital(1) Authorised share capitalAs permitted by the Companies Act 2006, the Company removed references to authorised share capital from its articles of association at the annual general meeting on 5 June 2009. This change took effect from 1 October 2009.
(2) Issued and fully paid share capital
2020 2019 2018 2020 2019 2018Number of shares Number of shares Number of shares £m £m £m
Ordinary shares of 10p (formerly 25p) each
At 1 January 70,052,557,838 71,163,592,264 71,972,949,589 7,005 7,116 7,197
Issued under employee share schemes 786,648,222 775,882,951 768,551,098 79 78 77
Share buyback programme — (1,886,917,377) (1,577,908,423) — (189) (158)
At 31 December 70,839,206,060 70,052,557,838 71,163,592,264 7,084 7,005 7,116
Share issuancesIn 2020, 787 million shares (2019: 776 million shares; 2018: 769 million shares) were issued in respect of employee share schemes.
(3) Share capital and controlThere are no restrictions on the transfer of shares in the Company other than as set out in the articles of association and:
– certain restrictions which may from time to time be imposed by law and regulations (for example, insider trading laws);
– where directors and certain employees of the Company require the approval of the Company to deal in the Company’s shares; and
– pursuant to the rules of some of the Company’s employee share plans where certain restrictions may apply while the shares are subject to the plans.
Where, under an employee share plan operated by the Company, participants are the beneficial owners of shares but not the registered owners, the voting rights are normally exercised by the registered owner at the direction of the participant. Outstanding awards and options would normally vest and become exercisable on a change of control, subject to the satisfaction of any performance conditions at that time.
In addition, the Company is not aware of any agreements between shareholders that may result in restrictions on the transfer of securities and/or voting rights. Information regarding significant direct or indirect holdings of shares in the Company can be found on page 112.
The directors have authority to allot and issue ordinary and preference shares and to make market purchases of ordinary and preference shares as granted at the annual general meeting on 21 May 2020. The authority to issue shares and the authority to make market purchases of shares will expire at the next annual general meeting. Shareholders will be asked, at the annual general meeting, to give similar authorities.
Subject to any rights or restrictions attached to any shares, on a show of hands at a general meeting of the Company every holder of shares present in person or by proxy and entitled to vote has one vote and on a poll every member present and entitled to vote has one vote for every share held.
Further details regarding voting at the annual general meeting can be found in the notes to the notice of the annual general meeting.
Ordinary sharesThe holders of ordinary shares, who held 100 per cent of the total ordinary share capital at 31 December 2020, are entitled to receive the Company’s report and accounts, attend, speak and vote at general meetings and appoint proxies to exercise voting rights. Holders of ordinary shares may also receive a dividend (subject to the provisions of the Company’s articles of association) and on a winding up may share in the assets of the Company.
Preference sharesThe Company has in issue various classes of preference shares which are all classified as liabilities under accounting standards and which are included in note 37.
These securities will, in the event of the winding-up of the issuer, be subordinated to the claims of depositors and all other creditors of the issuer, other than creditors whose claims rank equally with, or are junior to, the claims of the holders of the subordinated liabilities. The subordination of specific subordinated liabilities is determined in respect of the issuer and any guarantors of that liability. The claims of holders of preference shares and preferred securities are generally junior to those of the holders of undated subordinated liabilities, which in turn are junior to the claims of holders of the dated subordinated liabilities. The Group has not had any defaults of principal, interest or other breaches with respect to its subordinated liabilities during 2020 (2019: none).
Note 37: Subordinated liabilities continued

288 Lloyds Banking Group Annual Report and Accounts 2020
Notes to the consolidated financial statements continued
Note 40: Other reserves
2020 2019 2018£m £m £m
Other reserves comprise:
Merger reserve 7,763 7,763 7,766
Capital redemption reserve 4,462 4,462 4,273
Revaluation reserve in respect of debt securities held at fair value through other comprehensive income 99 123 279
Revaluation reserve in respect of equity shares held at fair value through other comprehensive income (47) 19 5
Cash flow hedging reserve 1,629 1,504 1,051
Foreign currency translation reserve (159) (176) (164)
At 31 December 13,747 13,695 13,210
The merger reserve primarily comprises the premium on shares issued in January 2009 as part of the recapitalisation of the Group and the acquisition of HBOS plc.
The capital redemption reserve represents transfers from distributable reserves in accordance with companies’ legislation upon the redemption of ordinary and preference share capital.
The revaluation reserves in respect of debt securities and equity shares held at fair value through other comprehensive income represent the cumulative after tax unrealised change in the fair value of financial assets so classified since initial recognition; or in the case of financial assets obtained on acquisitions of businesses, since the date of acquisition.
The cash flow hedging reserve represents the cumulative after-tax gains and losses on effective cash flow hedging instruments that will be reclassified to the income statement in the periods in which the hedged item affects profit or loss.
The foreign currency translation reserve represents the cumulative after-tax gains and losses on the translation of foreign operations and exchange differences arising on financial instruments designated as hedges of the Group’s net investment in foreign operations.
Movements in other reserves were as follows:
2020 2019 2018£m £m £m
Merger reserve
At 1 January 7,763 7,766 7,766
Redemption of preference shares (note 39) — (3) —
At 31 December 7,763 7,763 7,766
2020 2019 2018£m £m £m
Capital redemption reserve
At 1 January 4,462 4,273 4,115
Shares cancelled under share buyback programmes — 189 158
At 31 December 4,462 4,462 4,273
2020 2019 2018£m £m £m
Revaluation reserve in respect of debt securities held at fair value through other comprehensive income
At 1 January 123 279 472
Change in fair value 46 (30) (37)
Deferred tax 29 10 35
Current tax (2) — —
73 (20) (2)
Income statement transfers in respect of disposals (note 9) (149) (196) (275)
Deferred tax 47 61 84
(102) (135) (191)
Impairment recognised in the income statement 5 (1) —
At 31 December 99 123 279

Strategic rep
ortFinancial results
Governance
Risk manag
ement
Other inform
ationFinancial statem
ents Lloyds Banking Group Annual Report and Accounts 2020 289
2020 2019 2018£m £m £m
Revaluation reserve in respect of equity shares held at fair value through other comprehensive income
At 1 January 19 5 (49)
Change in fair value (50) — (97)
Deferred tax (16) 12 22
(66) 12 (75)
Realised gains and losses transferred to retained profits (16) 14 151
Deferred tax 16 (12) (22)
— 2 129
At 31 December (47) 19 5
2020 2019 2018£m £m £m
Cash flow hedging reserve
At 1 January 1,504 1,051 1,405
Change in fair value of hedging derivatives 730 1,209 234
Deferred tax (244) (303) (69)
486 906 165
Income statement transfers (496) (608) (701)
Deferred tax 135 155 182
(361) (453) (519)
At 31 December 1,629 1,504 1,051
2020 2019 2018£m £m £m
Foreign currency translation reserve
At 1 January (176) (164) (156)
Currency translation differences arising in the year 4 (12) (8)
Income statement transfers 13 — —
At 31 December (159) (176) (164)
Note 40: Other reserves continued

290 Lloyds Banking Group Annual Report and Accounts 2020
Notes to the consolidated financial statements continued
Note 42: Other equity instruments
2020 2019 2018£m £m £m
At 1 January 5,906 6,491 5,355
Issued in the year:
US dollar notes ($1,500 million nominal) — — 1,136
US dollar notes ($500 million nominal) — 396 —
Sterling notes (£500 million nominal) — 500 —
Redemption — (1,481) —
Profit for the year attributable to other equity holders 453 466 433
Distributions on other equity instruments (453) (466) (433)
At 31 December 5,906 5,906 6,491
The AT1 securities are Fixed Rate Resetting Perpetual Subordinated Contingent Convertible Securities with no fixed maturity or redemption date. The principal terms of the AT1 securities are described below:
– The securities rank behind the claims against Lloyds Banking Group plc of (a) unsubordinated creditors, (b) claims which are, or are expressed to be, subordinated to the claims of unsubordinated creditors of Lloyds Banking Group plc but not further or otherwise or (c) whose claims are, or are expressed to be, junior to the claims of other creditors of Lloyds Banking Group, whether subordinated or unsubordinated, other than those whose claims rank, or are expressed to rank, pari passu with, or junior to, the claims of the holders of the AT1 Securities in a winding-up occurring prior to a conversion event being triggered.
– The securities bear a fixed rate of interest until the first call date. After the initial call date, in the event that they are not redeemed, the AT1 securities will bear interest at rates fixed periodically in advance for five year periods based on market rates.
– Interest on the securities will be due and payable only at the sole discretion of Lloyds Banking Group plc, and Lloyds Banking Group plc may at any time elect to cancel any Interest Payment (or any part thereof) which would otherwise be payable on any Interest Payment Date. There are also certain restrictions on the payment of interest as specified in the terms.
– The securities are undated and are repayable, at the option of Lloyds Banking Group plc, in whole at the first call date or period, or on any fifth anniversary after the first call date or period. In addition, the AT1 securities are repayable, at the option of Lloyds Banking Group plc, in whole for certain regulatory or tax reasons. Any repayments require the prior consent of the PRA.
– The securities convert into ordinary shares of Lloyds Banking Group plc, at a pre-determined price, should the fully loaded Common Equity Tier 1 ratio of the Group fall below 7.0 per cent.
Note 41: Retained profits
2020 2019 2018£m £m £m
At 1 January 3,246 5,389 3,976
Profit for the year 865 2,459 3,975
Dividends paid — (2,312) (2,240)
Issue costs of other equity instruments (net of tax) (note 42) — (3) (5)
Share buyback programmes (note 40) — (1,095) (1,005)
Realised gains and losses on equity shares held at fair value through other comprehensive income — (2) (129)
Post-retirement defined benefit scheme remeasurements 113 (1,117) 120
Share of other comprehensive income of associates and joint ventures — — 8
Gains and losses attributable to own credit risk (net of tax)1 (55) (306) 389
Movement in treasury shares 293 (3) 40
Value of employee services:
Share option schemes 48 71 53
Other employee award schemes 74 165 207
At 31 December 4,584 3,246 5,389
1 During 2020 the Group derecognised, on redemption, financial liabilities on which cumulative fair value movements relating to own credit of £1 million net of tax (2019: £nil; 2018: £nil), had been recognised directly in retained profits.
Retained profits are stated after deducting £230 million (2019: £575 million; 2018: £499 million) representing 592 million (2019: 902 million; 2018: 909 million) treasury shares held.
The payment of dividends by subsidiaries and the ability of members of the Group to lend money to other members of the Group may be subject to regulatory or legal restrictions, the availability of reserves and the financial and operating performance of the entity. Details of such restrictions and the methods adopted by the Group to manage the capital of its subsidiaries are provided under Capital Risk on page 189.

Strategic rep
ortFinancial results
Governance
Risk manag
ement
Other inform
ationFinancial statem
ents Lloyds Banking Group Annual Report and Accounts 2020 291
Note 43: Dividends on ordinary sharesThe directors have recommended a final dividend, which is subject to approval by the shareholders at the Annual General Meeting, of 0.57 pence per share representing a total dividend of £404 million, the maximum allowable under PRA guidelines, which will be paid on 25 May 2021.
At the time of approving the Group’s results for the year ended 31 December 2019, the directors recommended a final dividend of 2.25 pence per share (2018: 2.14 pence per share) representing a total dividend of £1,586 million (2018: £1,523 million), which was to be paid on 27 May 2020. However, on 31 March 2020 the Group announced the cancellation of its final 2019 ordinary dividend. This decision was taken by the Board at the specific request of the regulator, the PRA, in line with all other major UK listed banks, as a result of the developing coronavirus crisis.
The financial statements do not reflect recommended dividends.
Dividends paid during the year were as follows:
2020 2019 2018 2020 2019 2018pence
per sharepence
per sharepence
per share £m £m £m
Final dividend recommended by directors at previous year end — 2.14 2.05 — 1,523 1,475
Interim dividend paid in the year — 1.12 1.07 — 789 765
— 3.26 3.12 — 2,312 2,240
The trustees of the following holdings of Lloyds Banking Group plc shares in relation to employee share schemes retain the right to receive dividends but have chosen to waive their entitlement to the dividends on those shares as indicated: the Lloyds Banking Group Share Incentive Plan (holding at 31 December 2020: 3,990,862 shares, 31 December 2019: 6,508,529 shares, waived rights to all dividends), the HBOS Share Incentive Plan Trust (holding at 31 December 2020: nil, 31 December 2019: 445,625 shares, waived rights to all dividends), the Lloyds Banking Group Employee Share Ownership Trust (holding at 31 December 2020: 20,540,083 shares, 31 December 2019: 11,656,155 shares, waived rights to all dividends).
Note 44: Share-based paymentsCharge to the income statementThe charge to the income statement is set out below:
2020 2019 2018£m £m £m
Deferred bonus plan 81 261 325
Executive and SAYE plans:
Options granted in the year 13 16 14
Options granted in prior years 62 59 71
75 75 85
Share plans:
Shares granted in the year 16 17 16
Shares granted in prior years 24 20 17
40 37 33
Total charge to the income statement 196 373 443
During the year ended 31 December 2020 the Group operated the following share-based payment schemes, all of which are equity settled.
Group Performance Share planThe Group operates a Group Performance Share plan that is equity settled. No award has been made in respect of 2020; the charge in the year relates to prior year awards for which the deferral period has completed.
Save-As-You-Earn schemesEligible employees may enter into contracts through the Save-As-You-Earn (SAYE) schemes to save up to £500 per month and, at the expiry of a fixed term of three years, have the option to use these savings within six months of the expiry of the fixed term to acquire shares in the Group at a discounted price of no less than 80 per cent (90 per cent for the 2020 plan) of the market price at the start of the invitation.
Movements in the number of share options outstanding under the SAYE schemes are set out below:
2020 2019
Number of options
Weighted average
exercise price (pence)
Number of options
Weighted average
exercise price (pence)
Outstanding at 1 January 1,068,094,073 44.55 802,994,918 49.30
Granted 779,229,797 24.25 487,654,212 39.87
Exercised (255,706,663) 47.51 (27,303,963) 51.23
Forfeited (6,938,102) 43.30 (15,830,204) 48.69
Cancelled (389,767,675) 42.24 (130,068,149) 49.03
Expired (74,772,515) 47.26 (49,352,741) 58.74
Outstanding at 31 December 1,120,138,915 30.39 1,068,094,073 44.55
Exercisable at 31 December 792,741 47.49 227,139 60.70

292 Lloyds Banking Group Annual Report and Accounts 2020
Notes to the consolidated financial statements continued
The weighted average share price at the time that the options were exercised during 2020 was £0.61 (2019: £0.59). The weighted average remaining contractual life of options outstanding at the end of the year was 2.98 years (2019: 2.22 years).
The weighted average fair value of SAYE options granted during 2020 was £0.05 (2019: £0.10). The fair values of the SAYE options have been determined using a standard Black-Scholes model.
Other share option plansLloyds Banking Group Executive Share Plan 2003The Plan was adopted in December 2003 and under the Plan share options may be granted to senior employees. Options under this plan have been granted specifically to facilitate recruitment (to compensate new recruits for any lost share awards), and also to make grants to key individuals for retention purposes. In some instances, grants may be made subject to individual performance conditions.
Participants are not entitled to any dividends paid during the vesting period.
2020 2019
Number of options
Weighted average
exercise price (pence)
Number of options
Weighted average
exercise price (pence)
Outstanding at 1 January 7,634,638 Nil 10,263,028 Nil
Granted 1,990,449 Nil 2,336,171 Nil
Exercised (2,122,302) Nil (4,455,481) Nil
Vested (47,337) Nil (69,005) Nil
Forfeited (111,100) Nil (39,250) Nil
Lapsed (677,976) Nil (400,825) Nil
Outstanding at 31 December 6,666,372 Nil 7,634,638 Nil
Exercisable at 31 December 3,150,407 Nil 2,683,267 Nil
The weighted average fair value of options granted in the year was £0.33 (2019: £0.59). The fair values of options granted have been determined using a standard Black-Scholes model. The weighted average share price at the time that the options were exercised during 2020 was £0.36 (2019: £0.60). The weighted average remaining contractual life of options outstanding at the end of the year was 4.1 years (2019: 3.8 years).
Other share plansLloyds Banking Group Executive Group Ownership Share PlanThe plan, introduced in 2006, is aimed at delivering shareholder value by linking the receipt of shares to an improvement in the performance of the Group over a three year period. Awards are made within limits set by the rules of the plan, with the limits determining the maximum number of shares that can be awarded equating to three times annual salary. In exceptional circumstances this may increase to four times annual salary.
At the end of the performance period for the 2017 grant, the targets had not been fully met and therefore these awards vested in 2020 at a rate of 49.7 per cent.
2020 2019Number
of sharesNumber of shares
Outstanding at 1 January 459,904,745 417,385,636
Granted 211,214,605 174,490,843
Vested (47,775,806) (88,318,950)
Forfeited (96,015,542) (55,029,439)
Dividend award 6,659,525 11,376,655
Outstanding at 31 December 533,987,527 459,904,745
Awards in respect of the 2018 grant vested in 2021 at a rate of 33.75 per cent. In previous years participants were entitled to any dividends paid in the vesting period. However, following a regulatory change prohibiting the payment of dividend equivalents on awards, the number of shares subject to award was determined by applying an adjustment factor to the share price on grant. Details of the performance conditions for the plan are provided in the Directors’ remuneration report.
The weighted average fair value of awards granted in the year was £0.28 (2019: £0.45).
Note 44: Share-based payments continued

Strategic rep
ortFinancial results
Governance
Risk manag
ement
Other inform
ationFinancial statem
ents Lloyds Banking Group Annual Report and Accounts 2020 293
Chief Financial Officer BuyoutWilliam Chalmers joined the Group on 3 June 2019 and was appointed as Chief Financial Officer on 1 August 2019 on the retirement of George Culmer. He was granted deferred share awards over 4,086,632 shares, to replace unvested awards from his former employer, Morgan Stanley, that were forfeited as a result of him joining the Group.
2020 2019Number
of sharesNumber of shares
Outstanding at 1 January 3,268,460 —
Granted — 4,086,632
Exercised (1,457,748) (818,172)
Outstanding at 31 December 1,810,712 3,268,460
The weighted average fair value of awards granted in 2019 was £0.55.
The fair value calculations at 31 December 2020 for grants made in the year, using Black-Scholes models and Monte Carlo simulation, are based on the following assumptions:
SAYE
Executive Share Plan
2003
Executive Group
Ownership Share Plan
Weighted average risk-free interest rate (0.03%) (0.01%) 0.18%
Weighted average expected life 3.2 years 1.2 years 3.6 years
Weighted average expected volatility 32% 42% 23%
Weighted average expected dividend yield 5.3% 5.3% 5.3%
Weighted average share price £0.28 £0.35 £0.47
Weighted average exercise price £0.24 Nil Nil
Expected volatility is a measure of the amount by which the Group’s shares are expected to fluctuate during the life of an option. The expected volatility is estimated based on the historical volatility of the closing daily share price over the most recent period that is commensurate with the expected life of the option. The historical volatility is compared to the implied volatility generated from market traded options in the Group’s shares to assess the reasonableness of the historical volatility and adjustments made where appropriate.
Share Incentive PlanFree SharesAn award of shares may be made annually to employees up to a maximum of £3,600. The shares awarded are held in trust for a mandatory period of three years on the employee’s behalf, during which period the employee is entitled to any dividends paid on such shares. The award is subject to a non-market based condition. If an employee leaves the Group within this three year period for other than a ‘good’ reason, all of the shares awarded will be forfeited.
On 20 May 2020, the Group made an award of £200 (2019: £200) of shares to all eligible employees. The number of shares awarded was 45,612,424 (2019: 22,422,337), with an average fair value of £0.30 (2019: £0.62) based on the market price at the date of award.
Matching sharesThe Group undertakes to match shares purchased by employees up to the value of £45 per month; these matching shares are held in trust for a mandatory period of three years on the employee’s behalf, during which period the employee is entitled to any dividends paid on such shares. The award is subject to a non-market based condition: if an employee leaves within this three year period for other than a ‘good’ reason, all of the matching shares are forfeited. Similarly if the employees sell their purchased shares within three years, their matching shares are forfeited.
The number of shares awarded relating to matching shares in 2020 was 62,262,140 (2019: 37,346,812), with an average fair value of £0.34 (2019: £0.56), based on market prices at the date of award.
Fixed share awardsFixed share awards were introduced in 2014 in order to ensure that total fixed remuneration is commensurate with role and to provide a competitive reward package for certain Lloyds Banking Group employees, with an appropriate balance of fixed and variable remuneration, in line with regulatory requirements. The fixed share awards are delivered in Lloyds Banking Group shares, released over five years with 20 per cent being released each year following the year of award. From June 2020, the fixed share awards are released over three years with one third being released each year following the year of award. The number of shares purchased in 2020 was 13,975,993 (2019: 8,239,332).
The fixed share award is not subject to any performance conditions, performance adjustment or clawback. On an employee leaving the Group, there is no change to the timeline for which shares will become unrestricted.
Note 44: Share-based payments continued

294 Lloyds Banking Group Annual Report and Accounts 2020
Notes to the consolidated financial statements continued
Note 45: Related party transactionsKey management personnelKey management personnel are those persons having authority and responsibility for planning, directing and controlling the activities of an entity; the Group’s key management personnel are the members of the Lloyds Banking Group plc Group Executive Committee together with its Non-Executive Directors.
The table below details, on an aggregated basis, key management personnel compensation:
2020 2019 2018£m £m £m
Compensation
Salaries and other short-term benefits 13 15 14
Post-employment benefits — — —
Share-based payments 13 15 18
Total compensation 26 30 32
Aggregate contributions in respect of key management personnel to defined contribution pension schemes were £nil (2019: £nil; 2018: £nil).
2020 2019 2018million million million
Share option plans
At 1 January — — 1
Granted, including certain adjustments (includes entitlements of appointed key management personnel) — — —
Exercised/lapsed (includes entitlements of former key management personnel) — — (1)
At 31 December — — —
2020 2019 2018million million million
Share plans
At 1 January 101 84 82
Granted, including certain adjustments (includes entitlements of appointed key management personnel) 46 46 39
Exercised/lapsed (includes entitlements of former key management personnel) (30) (29) (37)
At 31 December 117 101 84
The tables below detail, on an aggregated basis, balances outstanding at the year end and related income and expense, together with information relating to other transactions between the Group and its key management personnel:
2020 2019 2018£m £m £m
Loans
At 1 January 2 2 2
Advanced (includes loans of appointed key management personnel) — 1 1
Repayments (includes loans of former key management personnel) — (1) (1)
At 31 December 2 2 2
The loans are on both a secured and unsecured basis and are expected to be settled in cash. The loans attracted interest rates of between 0.39 per cent and 24.20 per cent in 2020 (2019: 6.45 per cent and 24.20 per cent; 2018: 6.70 per cent and 24.20 per cent).
No provisions have been recognised in respect of loans given to key management personnel (2019 and 2018: £nil).
2020 2019 2018£m £m £m
Deposits
At 1 January 23 20 20
Placed (includes deposits of appointed key management personnel) 25 44 33
Withdrawn (includes deposits of former key management personnel) (38) (41) (33)
At 31 December 10 23 20
Deposits placed by key management personnel attracted interest rates of up to 2.0 per cent (2019: 3.0 per cent; 2018: 3.5 per cent).
At 31 December 2020, the Group did not provide any guarantees in respect of key management personnel (2019 and 2018: none).
At 31 December 2020, transactions, arrangements and agreements entered into by the Group’s banking subsidiaries with directors and connected persons included amounts outstanding in respect of loans and credit card transactions of £0.6 million with four directors and two connected persons (2019: £0.6 million with four directors and two connected persons; 2018: £0.5 million with three directors and three connected persons).

Strategic rep
ortFinancial results
Governance
Risk manag
ement
Other inform
ationFinancial statem
ents Lloyds Banking Group Annual Report and Accounts 2020 295
SubsidiariesDetails of the Group’s subsidiaries and related undertakings are given on pages 349 to 354. In accordance with IFRS 10 Consolidated Financial Statements, transactions and balances with subsidiaries have been eliminated on consolidation.
Pension fundsThe Group provides banking and some investment management services to certain of its pension funds. At 31 December 2020, customer deposits of £151 million (2019: £169 million) and investment and insurance contract liabilities of £152 million (2019: £127 million) related to the Group’s pension funds. As disclosed in note 34, the Group’s main pension funds have entered into a longevity insurance arrangement that was structured as a pass-through involving Scottish Widows.
Collective investment vehiclesThe Group manages 137 (2019: 141) collective investment vehicles, such as Open Ended Investment Companies (OEICs) and of these 76 (2019: 75) are consolidated. The Group invested £659 million (2019: £804 million) and redeemed £1,159 million (2019: £1,771 million) in the unconsolidated collective investment vehicles during the year and had investments, at fair value, of £2,234 million (2019: £3,417 million) at 31 December. The Group earned fees of £93 million from the unconsolidated collective investment vehicles during 2020 (2019: £127 million).
Joint ventures and associatesAt 31 December 2020 there were loans and advances to customers of £28 million (2019: £75 million) outstanding and balances within customer deposits of £73 million (2019: £5 million) relating to joint ventures and associates.
During the year the Group paid fees of £7 million (2019: £2 million) to its Schroders Personal Wealth joint venture and also made a payment of £20 million under the terms of an Operating Margin Guarantee put in place as part of the agreements for the establishment of the joint venture.
In addition to the above balances, the Group has a number of other associates held by its venture capital business that it accounts for at fair value through profit or loss. At 31 December 2020, these companies had total assets of approximately £4,387 million (2019: £4,761 million), total liabilities of approximately £4,928 million (2019: £5,322 million) and for the year ended 31 December 2020 had turnover of approximately £3,857 million (2019: £4,286 million) and made a net loss of approximately £435 million (2019: net loss of £190 million). In addition, the Group has provided £1,295 million (2019: £1,266 million) of financing to these companies on which it received £91 million (2019: £86 million) of interest income in the year.
Note 46: Contingent liabilities, commitments and guaranteesInterchange feesWith respect to multi-lateral interchange fees (MIFs), the Group is not involved in the ongoing litigation which involves card schemes such as Visa and Mastercard (as described below). However, the Group is a member/licensee of Visa and Mastercard and other card schemes. The litigation in question is as follows:
– litigation brought by retailers against both Visa and Mastercard continues in the English Courts (and includes a judgment of the Supreme Court in June 2020 upholding the Court of Appeal's finding in 2018 that historic interchange arrangements of Mastercard and Visa infringed competition law); and
– litigation brought on behalf of UK consumers in the English Courts against Mastercard, which the Supreme Court has now confirmed can proceed.
Any impact on the Group of the litigation against Visa and Mastercard remains uncertain at this time, such that it is not practicable for the Group to provide an estimate of any potential financial effect. Insofar as Visa is required to pay damages to retailers for interchange fees set prior to June 2016, contractual arrangements to allocate liability have been agreed between various UK banks (including the Group) and Visa Inc, as part of Visa Inc’s acquisition of Visa Europe in 2016. These arrangements cap the maximum amount of liability to which the Group may be subject and this cap is set at the cash consideration received by the Group for the sale of its stake in Visa Europe to Visa Inc in 2016. In 2016, the Group received Visa preference stock as part of the consideration for the sale of its shares in Visa Europe. In 2020, some of these Visa preference shares were converted into Visa Inc Class A common stock (in accordance with the provisions of the Visa Europe sale documentation) and they were subsequently sold by the Group. The sale had no impact on this contingent liability.
LIBOR and other trading ratesCertain Group companies, together with other panel banks, have been named as defendants in private lawsuits, including purported class action suits, in the US in connection with their roles as panel banks contributing to the setting of US Dollar, Japanese Yen and Sterling London Interbank Offered Rate and the Australian BBSW reference rate. Certain of the plaintiffs' claims have been dismissed by the US Federal Court for the Southern District of New York (subject to appeals).
Certain Group companies are also named as defendants in (i) UK based claims; and (ii) two Dutch class actions, raising LIBOR manipulation allegations. A number of the claims against the Group in relation to the alleged mis-sale of interest rate hedging products also include allegations of LIBOR manipulation.
Furthermore, the Swiss Competition Commission concluded its investigation against Lloyds Bank plc in June 2019. However, the Group continues to respond to litigation arising out of the investigations into submissions made by panel members to the bodies that set LIBOR and various other interbank offered rates.
It is currently not possible to predict the scope and ultimate outcome on the Group of the various outstanding regulatory investigations not encompassed by the settlements, any private lawsuits or any related challenges to the interpretation or validity of any of the Group's contractual arrangements, including their timing and scale. As such, it is not practicable to provide an estimate of any potential financial effect.
Tax authoritiesThe Group has an open matter in relation to a claim for group relief of losses incurred in its former Irish banking subsidiary, which ceased trading on 31 December 2010. In 2013, HMRC informed the Group that its interpretation of the UK rules means that the group relief is not available. In 2020, HMRC concluded their enquiry into the matter and issued a closure notice. The Group's interpretation of the UK rules has not changed and hence it has appealed to the First Tier Tax Tribunal, with a hearing expected in early 2022. If the final determination of the matter by the judicial process is that HMRC’s position is correct, management estimate that this would result in an increase in current tax liabilities of approximately £810 million (including interest) and a reduction in the Group’s deferred tax asset of approximately £270 million. The Group, having taken appropriate advice, does not consider that this is a case where additional tax will ultimately fall due.
Note 45: Related party transactions continued

296 Lloyds Banking Group Annual Report and Accounts 2020
Notes to the consolidated financial statements continued
There are a number of other open matters on which the Group is in discussions with HMRC (including the tax treatment of certain costs arising from the divestment of TSB Banking Group plc), none of which is expected to have a material impact on the financial position of the Group.
Other legal actions and regulatory mattersIn addition, during the ordinary course of business the Group is subject to other complaints and threatened or actual legal proceedings (including class or group action claims) brought by or on behalf of current or former employees, customers, investors or other third parties, as well as legal and regulatory reviews, challenges, investigations and enforcement actions, both in the UK and overseas. All material such matters are periodically reassessed, with the assistance of external professional advisers where appropriate, to determine the likelihood of the Group incurring a liability. In those instances where it is concluded that it is more likely than not that a payment will be made, a provision is established to management's best estimate of the amount required at the relevant balance sheet date. In some cases it will not be possible to form a view, for example because the facts are unclear or because further time is needed properly to assess the merits of the case, and no provisions are held in relation to such matters. In these circumstances, specific disclosure in relation to a contingent liability will be made where material. However the Group does not currently expect the final outcome of any such case to have a material adverse effect on its financial position, operations or cash flows.
Contingent liabilities, commitments and guarantees arising from the banking business
2020 2019£m £m
Contingent liabilities
Acceptances and endorsements 131 74
Other:
Other items serving as direct credit substitutes 317 366
Performance bonds, including letters of credit, and other transaction-related contingencies 2,105 2,454
2,422 2,820
Total contingent liabilities 2,553 2,894
The contingent liabilities of the Group arise in the normal course of its banking business and it is not practicable to quantify their future financial effect.
2020 2019£m £m
Commitments and guarantees
Documentary credits and other short-term trade-related transactions 1 —
Forward asset purchases and forward deposits placed 127 189
Undrawn formal standby facilities, credit lines and other commitments to lend:
Less than 1 year original maturity:
Mortgage offers made 20,179 12,684
Other commitments and guarantees 89,269 85,735
109,448 98,419
1 year or over original maturity 38,299 34,945
Total commitments and guarantees 147,875 133,553
Of the amounts shown above in respect of undrawn formal standby facilities, credit lines and other commitments to lend, £73,962 million (2019: £63,504 million) was irrevocable.
Capital commitmentsExcluding commitments in respect of investment property (note 25), capital expenditure contracted but not provided for at 31 December 2020 amounted to £501 million (2019: £405 million). Of this amount, £501 million (2019: £400 million) related to assets to be leased to customers under operating leases. The Group’s management is confident that future net revenues and funding will be sufficient to cover these commitments.
Note 46: Contingent liabilities, commitments and guarantees continued

Strategic rep
ortFinancial results
Governance
Risk manag
ement
Other inform
ationFinancial statem
ents Lloyds Banking Group Annual Report and Accounts 2020 297
Note 47: Structured entitiesThe Group’s interests in structured entities are both consolidated and unconsolidated. Details of the Group’s interests in consolidated structured entities are set out in note 29 for securitisations and covered bond vehicles, note 34 for structured entities associated with the Group’s pension schemes, and below in part (A) and (B). Details of the Group’s interests in unconsolidated structured entities are included below in part (C).
(A) Asset-backed conduitsIn addition to the structured entities discussed in note 29, which are used for securitisation and covered bond programmes, the Group sponsors an active asset-backed conduit, Cancara, which invests in client receivables and debt securities. The total consolidated exposure of Cancara at 31 December 2020 was £2,490 million (2019: £3,735 million), comprising £1,695 million of loans and advances (2019: £3,670 million) and £795 million of debt securities (2019: £65 million).
All lending assets and debt securities held by the Group in Cancara are restricted in use, as they are held by the collateral agent for the benefit of the commercial paper investors and the liquidity providers only. The Group provides liquidity facilities to Cancara under terms that are usual and customary for standard lending activities in the normal course of the Group’s banking activities. During 2020 there have continued to be planned drawdowns on certain liquidity facilities for balance sheet management purposes, supporting the programme to provide funding alongside the proceeds of the asset-backed commercial paper issuance. The Group could be asked to provide support under the contractual terms of these arrangements including, for example, if Cancara experienced a shortfall in external funding, which may occur in the event of market disruption.
The external assets in Cancara are consolidated in the Group’s financial statements.
(B) Consolidated collective investment vehicles and limited partnershipsThe assets of the Insurance business held in consolidated collective investment vehicles, such as Open-Ended Investment Companies and limited partnerships, are not directly available for use by the Group. However, the Group’s investment in the majority of these collective investment vehicles is readily realisable. As at 31 December 2020, the total carrying value of these consolidated collective investment vehicle assets and liabilities held by the Group was £57,430 million (2019: £68,724 million).
The Group has no contractual arrangements (such as liquidity facilities) that would require it to provide financial or other support to the consolidated collective investment vehicles; the Group has not previously provided such support and has no current intentions to provide such support.
(C) Unconsolidated collective investment vehicles and limited partnershipsThe Group’s direct interests in unconsolidated structured entities comprise investments in collective investment vehicles, such as Open-Ended Investment Companies, and limited partnerships with a total carrying value of £55,235 million at 31 December 2020 (2019: £38,177 million), included within financial assets designated at fair value through profit and loss (see note 16). These investments include both those entities managed by third parties and those managed by the Group. At 31 December 2020, the total asset value of these unconsolidated structured entities, including the portion in which the Group has no interest, was £2,473 billion (2019: £2,363 billion).
Given the nature of these investments, the Group’s maximum exposure to loss is equal to the carrying value of the investment. However, the Group’s investments in these entities are primarily held to match policyholder liabilities in the Insurance division and the majority of the risk from a change in the value of the Group’s investment is matched by a change in policyholder liabilities. The collective investment vehicles are primarily financed by investments from investors in the vehicles.
During the year the Group has not provided any non-contractual financial or other support to these entities and has no current intention of providing any financial or other support. There were no transfers from/to these unconsolidated collective investment vehicles and limited partnerships.
The Group considers itself the sponsor of a structured entity where it is primarily involved in the design and establishment of the structured entity and further where the Group transfers assets to the structured entity, markets products associated with the structured entity in its own name and/or provides guarantees regarding the structured entity’s performance.
The Group sponsors a range of diverse investment funds and limited partnerships where it acts as the fund manager or equivalent decision maker and markets the funds under one of the Group’s brands.
The Group earns fees from managing the investments of these funds. The investment management fees that the Group earned from these entities, including those in which the Group held no ownership interest at 31 December 2020, are reported in note 6.

298 Lloyds Banking Group Annual Report and Accounts 2020
Notes to the consolidated financial statements continued
Note 48: Financial instruments
(1) Measurement basis of financial assets and liabilitiesThe accounting policies in note 2 describe how different classes of financial instruments are measured, and how income and expenses, including fair value gains and losses, are recognised. The following table analyses the carrying amounts of the financial assets and liabilities by category and by balance sheet heading.
Derivatives designated as hedging
instruments
Mandatorily held at fair value through
profit or lossDesignated at fair value
through profit or loss
At fair value through other
comprehensive income
Held at amortised
cost
Insurance related
contractsHeld for trading Other Total
£m £m £m £m £m £m £m £m
At 31 December 2020
Financial assets
Cash and balances at central banks — — — — — 73,257 — 73,257
Items in the course of collection from banks — — — — — 299 — 299
Financial assets at fair value through profit or loss — 20,825 150,801 — — — — 171,626
Derivative financial instruments 816 28,797 — — — — — 29,613
Loans and advances to banks — — — — — 10,746 — 10,746
Loans and advances to customers — — — — — 498,843 — 498,843
Debt securities — — — — — 5,405 — 5,405
Financial assets at amortised cost — — — — — 514,994 — 514,994
Financial assets at fair value through other comprehensive income — — — — 27,603 — — 27,603
Assets arising from contracts held with reinsurers — — 19,543 — — — 842 20,385
Total financial assets 816 49,622 170,344 — 27,603 588,550 842 837,777
Financial liabilities
Deposits from banks — — — — — 31,465 — 31,465
Customer deposits — — — — — 460,068 — 460,068
Items in course of transmission to banks — — — — — 306 — 306
Financial liabilities at fair value through profit or loss — 15,818 — 6,828 — — — 22,646
Derivative financial instruments 684 26,629 — — — — — 27,313
Notes in circulation — — — — — 1,305 — 1,305
Debt securities in issue — — — — — 87,397 — 87,397
Liabilities arising from insurance contracts and participating investment contracts — — — — — — 116,060 116,060
Liabilities arising from non-participating investment contracts — — — — — — 38,452 38,452
Other — — — — — 1,672 343 2,015
Subordinated liabilities — — — — — 14,261 — 14,261
Total financial liabilities 684 42,447 — 6,828 — 596,474 154,855 801,288

Strategic rep
ortFinancial results
Governance
Risk manag
ement
Other inform
ationFinancial statem
ents Lloyds Banking Group Annual Report and Accounts 2020 299
Derivatives designated as hedging instruments
Mandatorily held at fair value through
profit or lossDesignated at fair value
through profit or loss
At fair value through other
comprehensive income
Held at amortised
cost
Insurance related
contractsHeld for trading Other Total
£m £m £m £m £m £m £m £m
At 31 December 2019
Financial assets
Cash and balances at central banks — — — — — 55,130 — 55,130
Items in the course of collection from banks — — — — — 313 — 313
Financial assets at fair value through profit or loss — 17,982 142,207 — — — — 160,189
Derivative financial instruments 1,236 25,133 — — — — — 26,369
Loans and advances to banks — — — — — 9,775 — 9,775
Loans and advances to customers — — — — — 494,988 — 494,988
Debt securities — — — — — 5,544 — 5,544
Financial assets at amortised cost — — — — — 510,307 — 510,307
Financial assets at fair value through other comprehensive income — — — — 25,092 — — 25,092
Assets arising from contracts held with reinsurers — — 22,817 — — — 750 23,567
Total financial assets 1,236 43,115 165,024 — 25,092 565,750 750 800,967
Financial liabilities
Deposits from banks — — — — — 28,179 — 28,179
Customer deposits — — — — — 421,320 — 421,320
Items in course of transmission to banks — — — — — 373 — 373
Financial liabilities at fair value through profit or loss — 13,955 — 7,531 — — — 21,486
Derivative financial instruments 1,105 24,674 — — — — — 25,779
Notes in circulation — — — — — 1,079 — 1,079
Debt securities in issue — — — — — 97,689 — 97,689
Liabilities arising from insurance contracts and participating investment contracts — — — — — — 111,449 111,449
Liabilities arising from non-participating investment contracts — — — — — — 37,459 37,459
Other — — — — — 1,844 400 2,244
Subordinated liabilities — — — — — 17,130 — 17,130
Total financial liabilities 1,105 38,629 — 7,531 — 567,614 149,308 764,187
Note 48: Financial instruments continued

300 Lloyds Banking Group Annual Report and Accounts 2020
Notes to the consolidated financial statements continued
(2) Fair value measurementFair value is the price that would be received to sell an asset or paid to transfer a liability in an orderly transaction between market participants at the measurement date. It is a measure as at a specific date and may be significantly different from the amount which will actually be paid or received on maturity or settlement date.
Wherever possible, fair values have been calculated using unadjusted quoted market prices in active markets for identical instruments held by the Group. Where quoted market prices are not available, or are unreliable because of poor liquidity, fair values have been determined using valuation techniques which, to the extent possible, use market observable inputs, but in some cases use non-market observable inputs. Valuation techniques used include discounted cash flow analysis and pricing models and, where appropriate, comparison to instruments with characteristics similar to those of the instruments held by the Group. The Group measures valuation adjustments for its derivative exposures on the same basis as the derivatives are managed.
The carrying amount of the following financial instruments is a reasonable approximation of fair value: cash and balances at central banks, items in the course of collection from banks, items in course of transmission to banks, notes in circulation and liabilities arising from non-participating investment contracts. Fair values have not been disclosed for discretionary participating investment contracts. There is currently no agreed definition of fair valuation for discretionary participation features applied under IFRS and therefore the range of possible fair values of these contracts cannot be measured reliably.
Because a variety of estimation techniques are employed and significant estimates made, comparisons of fair values between financial institutions may not be meaningful. Readers of these financial statements are thus advised to use caution when using this data to evaluate the Group’s financial position.
Fair value information is not provided for items that are not financial instruments or for other assets and liabilities which are not carried at fair value in the Group’s consolidated balance sheet. These items include intangible assets, such as brands and acquired credit card relationships; premises and equipment; and shareholders’ equity. These items are material and accordingly the Group believes that any fair value information presented would not represent the underlying value of the Group.
Valuation control frameworkThe key elements of the control framework for the valuation of financial instruments include model validation, product implementation review and independent price verification. These functions are carried out by appropriately skilled risk and finance teams, independent of the business area responsible for the products.
Model validation covers both qualitative and quantitative elements relating to new models. In respect of new products, a product implementation review is conducted pre- and post-trading. Pre-trade testing ensures that the new model is integrated into the Group’s systems and that the profit and loss and risk reporting are consistent throughout the trade life cycle. Post-trade testing examines the explanatory power of the implemented model, actively monitoring model parameters and comparing in-house pricing to external sources. Independent price verification procedures cover financial instruments carried at fair value. The frequency of the review is matched to the availability of independent data, monthly being the minimum. Valuation differences in breach of established thresholds are escalated to senior management. The results from independent pricing and valuation reserves are reviewed monthly by senior management.
Formal committees, consisting of senior risk, finance and business management, meet at least quarterly to discuss and approve valuations in more judgemental areas, in particular for unquoted equities, structured credit, over-the-counter options and the Credit Valuation Adjustment (CVA) reserve.
Valuation of financial assets and liabilitiesAssets and liabilities carried at fair value or for which fair values are disclosed have been classified into three levels according to the quality and reliability of information used to determine the fair values.
Level 1Level 1 fair value measurements are those derived from unadjusted quoted prices in active markets for identical assets or liabilities. Products classified as level 1 predominantly comprise equity shares, treasury bills and other government securities.
Level 2Level 2 valuations are those where quoted market prices are not available, for example where the instrument is traded in a market that is not considered to be active or valuation techniques are used to determine fair value and where these techniques use inputs that are based significantly on observable market data. Examples of such financial instruments include most over-the-counter derivatives, financial institution issued securities, certificates of deposit and certain asset-backed securities.
Level 3Level 3 portfolios are those where at least one input which could have a significant effect on the instrument’s valuation is not based on observable market data. Such instruments would include the Group’s venture capital and unlisted equity investments which are valued using various valuation techniques that require significant management judgement in determining appropriate assumptions, including earnings multiples and estimated future cash flows. Certain of the Group’s asset-backed securities and derivatives, principally where there is no trading activity in such securities, are also classified as level 3.
Transfers out of the level 3 portfolio arise when inputs that could have a significant impact on the instrument’s valuation become market observable after previously having been non-market observable. In the case of asset-backed securities this can arise if more than one consistent independent source of data becomes available. Conversely transfers into the portfolio arise when consistent sources of data cease to be available.
Note 48: Financial instruments continued

Strategic rep
ortFinancial results
Governance
Risk manag
ement
Other inform
ationFinancial statem
ents Lloyds Banking Group Annual Report and Accounts 2020 301
(3) Financial assets and liabilities carried at fair value(A) Financial assets, excluding derivativesValuation hierarchyAt 31 December 2020, the Group’s financial assets carried at fair value, excluding derivatives, totalled £218,772 million (2019: £208,098 million). The table below analyses these financial assets by balance sheet classification, asset type and valuation methodology (level 1, 2 or 3, as described on page 300). The fair value measurement approach is recurring in nature. There were no significant transfers between level 1 and 2 during the year.
Valuation hierarchy
Level 1 Level 2 Level 3 Total£m £m £m £m
At 31 December 2020
Financial assets at fair value through profit or loss
Loans and advances to customers — 12,508 11,501 24,009
Loans and advances to banks — 4,467 — 4,467
Debt securities:
Government securities 20,332 290 — 20,622
Other public sector securities — 2,289 65 2,354
Bank and building society certificates of deposit 44 4,797 — 4,841
Asset-backed securities:
Mortgage-backed securities — 467 — 467
Other asset-backed securities — 265 — 265
Corporate and other debt securities — 16,245 1,889 18,134
20,376 24,353 1,954 46,683
Treasury and other bills 18 — — 18
Equity shares 94,687 171 1,591 96,449
Financial assets at fair value through profit or loss 115,081 41,499 15,046 171,626
Assets arising from contracts held with reinsurers — 19,543 — 19,543
Total financial assets at fair value through profit or loss 115,081 61,042 15,046 191,169
Financial assets at fair value through other comprehensive income
Debt securities:
Government securities 14,286 — — 14,286
Asset-backed securities:
Mortgage-backed securities — — — —
Other asset-backed securities — — 180 180
Corporate and other debt securities 498 12,437 — 12,935
14,784 12,437 180 27,401
Treasury and other bills 36 — — 36
Equity shares — — 166 166
Total financial assets at fair value through other comprehensive income 14,820 12,437 346 27,603
Total financial assets carried at fair value, excluding derivatives 129,901 73,479 15,392 218,772
Note 48: Financial instruments continued

302 Lloyds Banking Group Annual Report and Accounts 2020
Notes to the consolidated financial statements continued
Level 1 Level 2 Level 3 Total£m £m £m £m
At 31 December 2019
Financial assets at fair value through profit or loss
Loans and advances to customers — 10,164 10,912 21,076
Loans and advances to banks 18 2,381 — 2,399
Debt securities:
Government securities 18,618 236 — 18,854
Other public sector securities — 2,071 55 2,126
Bank and building society certificates of deposit 52 932 — 984
Asset-backed securities:
Mortgage-backed securities — 468 — 468
Other asset-backed securities — 158 100 258
Corporate and other debt securities — 16,381 1,835 18,216
18,670 20,246 1,990 40,906
Treasury and other bills 19 — — 19
Equity shares 93,766 17 2,006 95,789
Financial assets at fair value through profit or loss 112,473 32,808 14,908 160,189
Assets arising from contracts held with reinsurers — 22,817 — 22,817
Total financial assets at fair value through profit or loss 112,473 55,625 14,908 183,006
Financial assets at fair value through other comprehensive income
Debt securities:
Government securities 12,860 238 — 13,098
Asset-backed securities:
Mortgage-backed securities — — 121 121
Other asset-backed securities — — 60 60
Corporate and other debt securities 16 11,035 — 11,051
12,876 11,273 181 24,330
Treasury and other bills 535 — — 535
Equity shares — — 227 227
Total financial assets at fair value through other comprehensive income 13,411 11,273 408 25,092
Total financial assets carried at fair value, excluding derivatives 125,884 66,898 15,316 208,098
Note 48: Financial instruments continued

Strategic rep
ortFinancial results
Governance
Risk manag
ement
Other inform
ationFinancial statem
ents Lloyds Banking Group Annual Report and Accounts 2020 303
Movements in Level 3 portfolioThe table below analyses movements in level 3 financial assets, excluding derivatives, carried at fair value (recurring measurement).
2020 2019
Financial assets at fair
value through profit or loss
Financial assets at fair value
through other comprehensive
income
Total level 3 assets carried at fair value,
excluding derivatives
(recurring basis)
Financial assets at fair
value through profit or loss
Financial assets at fair value
through other comprehensive
income
Total level 3 assets carried
at fair value, excluding
derivatives (recurring basis)
£m £m £m £m £m £m
At 1 January 14,908 408 15,316 13,917 267 14,184
Exchange and other adjustments 94 9 103 (85) (10) (95)
Gains recognised in the income statement within other income 836 — 836 794 — 794
(Losses) gains recognised in other comprehensive income within the revaluation reserve in respect of financial assets at fair value through other comprehensive income — (48) (48) — 12 12
Purchases/increases to customer loans 1,756 8 1,764 2,579 207 2,786
Sales/repayments of customer loans (2,316) (31) (2,347) (2,807) (87) (2,894)
Transfers into the level 3 portfolio 167 — 167 644 19 663
Transfers out of the level 3 portfolio (399) — (399) (134) — (134)
At 31 December 15,046 346 15,392 14,908 408 15,316
Gains (losses) recognised in the income statement, within other income, relating to the change in fair value of those assets held at 31 December 109 — 109 269 — 269
Valuation methodology for financial assets, excluding derivatives
Loans and advances to customers and banksThe fair value of these assets is determined using discounted cash flow techniques. The discount rates are derived from market observable interest rates, a risk margin that reflects loan credit ratings and an incremental illiquidity premium based on historical spreads at origination on similar loans.
Debt securitiesDebt securities measured at fair value and classified as level 2 are valued by discounting expected cash flows using an observable credit spread applicable to the particular instrument.
Where there is limited trading activity in debt securities, the Group uses valuation models, consensus pricing information from third party pricing services and broker or lead manager quotes to determine an appropriate valuation. Debt securities are classified as level 3 if there is a significant valuation input that cannot be corroborated through market sources or where there are materially inconsistent values for an input. Asset classes classified as level 3 mainly comprise certain collateralised loan obligations and collateralised debt obligations.
Equity investmentsUnlisted equity and fund investments are valued using different techniques in accordance with the Group’s valuation policy and International Private Equity and Venture Capital Guidelines.
Depending on the business sector and the circumstances of the investment, unlisted equity valuations are based on earnings multiples, net asset values or discounted cash flows.
– A number of earnings multiples are used in valuing the portfolio including price earnings, earnings before interest and tax and earnings before interest, tax, depreciation and amortisation. The particular multiple selected is appropriate for the type of business being valued and is derived by reference to the current market-based multiple. Consideration is given to the risk attributes, growth prospects and financial gearing of comparable businesses when selecting the appropriate multiple.
– Discounted cash flow valuations use estimated future cash flows, usually based on management forecasts, with the application of appropriate exit yields or terminal multiples and discounted using rates appropriate to the specific investment, business sector or recent economic rates of return. Recent transactions involving the sale of similar businesses may sometimes be used as a frame of reference in deriving an appropriate multiple.
– For fund investments the most recent capital account value calculated by the fund manager is used as the basis for the valuation and adjusted, if necessary, to align valuation techniques with the Group’s valuation policy.
Unlisted equity investments and investments in property partnerships held in the life assurance funds are valued using third party valuations. Management take account of any pertinent information, such as recent transactions and information received on particular investments, to adjust the third party valuations where necessary.
Note 48: Financial instruments continued

304 Lloyds Banking Group Annual Report and Accounts 2020
Notes to the consolidated financial statements continued
(B) Financial liabilities, excluding derivativesValuation hierarchyAt 31 December 2020, the Group’s financial liabilities carried at fair value, excluding derivatives, comprised its financial liabilities at fair value through profit or loss and totalled £22,646 million (2019: £21,486 million). The table below analyses these financial liabilities by balance sheet classification and valuation methodology (level 1, 2 or 3, as described on page 300). The fair value measurement approach is recurring in nature. There were no significant transfers between level 1 and 2 during the year.
Level 1 Level 2 Level 3 Total£m £m £m £m
At 31 December 2020
Financial liabilities at fair value through profit or loss
Liabilities designated at fair value through profit or loss — 6,783 45 6,828
Trading liabilities:
Liabilities in respect of securities sold under repurchase agreements — 14,996 — 14,996
Other deposits — 6 — 6
Short positions in securities 778 38 — 816
778 15,040 — 15,818
Total financial liabilities carried at fair value, excluding derivatives 778 21,823 45 22,646
At 31 December 2019
Financial liabilities at fair value through profit or loss
Liabilities designated at fair value through profit or loss — 7,483 48 7,531
Trading liabilities:
Liabilities in respect of securities sold under repurchase agreements — 11,048 — 11,048
Other deposits — 98 — 98
Short positions in securities 2,781 28 — 2,809
2,781 11,174 — 13,955
Total financial liabilities carried at fair value, excluding derivatives 2,781 18,657 48 21,486
The table below analyses movements in the level 3 financial liabilities portfolio, excluding derivatives.
2020 2019£m £m
At 1 January 48 11
Losses (gains) recognised in the income statement within other income 1 —
Redemptions (4) (5)
Transfers into the level 3 portfolio — 52
Transfers out of the level 3 portfolio — (10)
At 31 December 45 48
Gains recognised in the income statement, within other income, relating to the change in fair value of those liabilities held at 31 December — —
Valuation methodology for financial liabilities, excluding derivatives
Liabilities held at fair value through profit or lossThese principally comprise debt securities in issue which are classified as level 2 and their fair value is determined using techniques whose inputs are based on observable market data. The carrying amount of the securities is adjusted to reflect the effect of changes in own credit spreads and the resulting gain or loss is recognised in other comprehensive income.
At 31 December 2020, the own credit adjustment arising from the fair valuation of £6,828 million (2019: £7,531 million) of the Group’s debt securities in issue designated at fair value through profit or loss resulted in a loss of £75 million (2019: loss of £419 million), before tax, recognised in other comprehensive income.
Trading liabilities in respect of securities sold under repurchase agreementsThe fair value of these liabilities is determined using discounted cash flow techniques. The discount rates are derived from observable repo curves specific to the type of security sold under the repurchase agreement.
Note 48: Financial instruments continued

Strategic rep
ortFinancial results
Governance
Risk manag
ement
Other inform
ationFinancial statem
ents Lloyds Banking Group Annual Report and Accounts 2020 305
(C) DerivativesAll of the Group’s derivative assets and liabilities are carried at fair value. At 31 December 2020, such assets totalled £29,613 million (2019: £26,369 million) and liabilities totalled £27,313 million (2019: £25,779 million). The table below analyses these derivative balances by valuation methodology (level 1, 2 or 3, as described on page 300). The fair value measurement approach is recurring in nature. There were no significant transfers between level 1 and level 2 during the year.
2020 2019
Level 1 Level 2 Level 3 Total Level 1 Level 2 Level 3 Total£m £m £m £m £m £m £m £m
Derivative assets 60 28,572 981 29,613 50 25,456 863 26,369
Derivative liabilities (56) (25,883) (1,374) (27,313) (54) (24,358) (1,367) (25,779)
Where the Group’s derivative assets and liabilities are not traded on an exchange, they are valued using valuation techniques, including discounted cash flow and options pricing models, as appropriate. The types of derivatives classified as level 2 and the valuation techniques used include:
– Interest rate swaps which are valued using discounted cash flow models; the most significant inputs into those models are interest rate yield curves which are developed from publicly quoted rates.
– Foreign exchange derivatives that do not contain options which are priced using rates available from publicly quoted sources.
– Credit derivatives which are valued using standard models with observable inputs, except for the items classified as level 3, which are valued using publicly available yield and credit default swap (CDS) curves.
– Less complex interest rate and foreign exchange option products which are valued using volatility surfaces developed from publicly available interest rate cap, interest rate swaption and other option volatilities; option volatility skew information is derived from a market standard consensus pricing service. For more complex option products, the Group calibrates its models using observable at-the-money data; where necessary, the Group adjusts for out-of-the- money positions using a market standard consensus pricing service.
Complex interest rate and foreign exchange products where inputs to the valuation are significant are material and unobservable are classified as level 3.
Where credit protection, usually in the form of credit default swaps, has been purchased or written on asset-backed securities, the security is referred to as a negative basis asset-backed security and the resulting derivative assets or liabilities have been classified as either level 2 or level 3 according to the classification of the underlying asset-backed security.
Certain unobservable inputs used to calculate CVA, FVA, and own credit adjustments, are not significant in determining the classification of the derivative and debt instruments. Consequently, these inputs do not form part of the level 3 sensitivities presented.
The table below analyses movements in level 3 derivative assets and liabilities carried at fair value.
2020 2019
Derivative assets
Derivative liabilities
Derivative assets
Derivative liabilities
£m £m £m £m
At 1 January 863 (1,367) 927 (716)
Exchange and other adjustments 16 (17) (27) 4
Losses (gains) recognised in the income statement within other income 84 (112) 81 (75)
Purchases (additions) 61 (6) 4 (4)
(Sales) redemptions (85) 19 (19) 47
Transfers into the level 3 portfolio 41 (51) 415 (959)
Transfers out of the level 3 portfolio 1 160 (518) 336
At 31 December 981 (1,374) 863 (1,367)
Gains (losses) recognised in the income statement, within other income, relating to the change in fair value of those assets or liabilities held at 31 December 99 (131) (14) 18
Derivative valuation adjustmentsDerivative financial instruments which are carried in the balance sheet at fair value are adjusted where appropriate to reflect credit risk, market liquidity and other risks.
(i) Uncollateralised derivative valuation adjustmentsThe following table summarises the movement on this valuation adjustment account during 2019 and 2020:
2020 2019£m £m
At 1 January 423 562
Income statement charge (credit) 70 (134)
Transfers (19) (5)
At 31 December 474 423
Note 48: Financial instruments continued

306 Lloyds Banking Group Annual Report and Accounts 2020
Notes to the consolidated financial statements continued
Represented by:
2020 2019£m £m
Credit Valuation Adjustment 358 278
Debit Valuation Adjustment (35) (27)
Funding Valuation Adjustment 151 172
474 423
Credit and Debit Valuation Adjustments (CVA and DVA) are applied to the Group’s over-the-counter derivative exposures with counterparties that are not subject to strong interbank collateral arrangements. These exposures largely relate to the provision of risk management solutions for corporate customers within the Commercial Banking division.
A CVA is taken where the Group has a positive future uncollateralised exposure (asset). A DVA is taken where the Group has a negative future uncollateralised exposure (liability). These adjustments reflect interest rates and expectations of counterparty creditworthiness and the Group’s own credit spread respectively.
The CVA is sensitive to:
– the current size of the mark-to-market position on the uncollateralised asset;
– expectations of future market volatility of the underlying asset; and
– expectations of counterparty creditworthiness.
Market Credit Default Swap (CDS) spreads are used to develop the probability of default for quoted counterparties. For unquoted counterparties, internal credit ratings and market sector CDS curves and recovery rates are used. The Loss Given Default (LGD) is based on market recovery rates and internal credit assessments.
The combination of a one notch deterioration in the credit rating of derivative counterparties and a ten per cent increase in LGD increases the CVA by £83 million. Current market value is used to estimate the projected exposure for products not supported by the model, which are principally complex interest rate options that are traded in very low volumes. For these, the CVA is calculated on an add-on basis (although no such adjustment was required at 31 December 2020).
The DVA is sensitive to:
– the current size of the mark-to-market position on the uncollateralised liability;
– expectations of future market volatility of the underlying liability; and
– the Group’s own CDS spread.
A one per cent rise in the CDS spread would lead to an increase in the DVA of £101 million.
The risk exposures that are used for the CVA and DVA calculations are strongly influenced by interest rates. Due to the nature of the Group’s business the CVA/DVA exposures tend to be on average the same way around such that the valuation adjustments fall when interest rates rise. A one per cent rise in interest rates would lead to a £83 million fall in the overall valuation adjustment to £240 million. The CVA model used by the Group does not assume any correlation between the level of interest rates and default rates.
The Group has also recognised a Funding Valuation Adjustment to adjust for the net cost of funding uncollateralised derivative positions. This adjustment is calculated on the expected future exposure discounted at a suitable cost of funds. A ten basis points increase in the cost of funds will increase the funding valuation adjustment by approximately £26 million.
(ii) Market liquidityThe Group includes mid to bid-offer valuation adjustments against the expected cost of closing out the net market risk in the Group’s trading positions within a timeframe that is consistent with historical trading activity and spreads that the trading desks have accessed historically during the ordinary course of business in normal market conditions.
At 31 December 2020, the Group’s derivative trading business held mid to bid-offer valuation adjustments of £83 million (2019: £80 million).
Note 48: Financial instruments continued

Strategic rep
ortFinancial results
Governance
Risk manag
ement
Other inform
ationFinancial statem
ents Lloyds Banking Group Annual Report and Accounts 2020 307
(D) Sensitivity of level 3 valuations
At 31 December 2020 At 31 December 2019
Effect of reasonably possible alternative assumptions2
Effect of reasonably possible alternative assumptions2
Valuation techniques
Significant unobservable inputs1
Carrying value
Favourable changes
Unfavourable changes
Carrying value
Favourable changes
Unfavourable changes
£m £m £m £m £m £m
Financial assets at fair value through profit or loss
Loans and advances to customers
Discounted cash flows
Interest rate spreads (-50bps/+215bps)4
11,501 528 (651) 10,912 401 (384)
Debt securities Discounted cash flows
Credit spreads (+/- 5%)5 226 10 (10) 61 1 (1)
Equity and venture capital investments
Market approach Earnings multiple (1.0/15.2)6
1,905 72 (72) 1,948 89 (89)
Underlying asset/net asset value (incl. property prices)3
n/a
634 91 (121) 935 89 (113)
Unlisted equities, debt securities and property partnerships in the life funds
Underlying asset/net asset value (incl. property prices), broker quotes or discounted cash flows3
n/a
780 6 (34) 1,052 19 (41)
15,046 14,908
Financial assets at fair value through other comprehensive income
Asset-backed securities
Lead manager or broker quote/consensus pricing
n/a
180 6 (6) 181 6 (6)
Equity and venture capital investments
Underlying asset/net asset value (incl. property prices)3
n/a
166 6 (6) 227 7 (6)
346 408
Derivative financial assets
Interest rate derivatives
Option pricing model
Interest rate volatility (13%/128%)7 981 8 (6) 863 5 (6)
981 863
Level 3 financial assets carried at fair value 16,373 16,179
Financial liabilities at fair value through profit or loss
Discounted cash flows
Interest rate spreads (+/– 50bps)8
45 1 (1) 48 1 (1)
Derivative financial liabilities
Interest rate derivatives
Option pricing model
Interest rate volatility (13%/128%)7 1,374 — — 1,367 — —
1,374 1,367
Level 3 financial liabilities carried at fair value 1,419 1,415
1 Ranges are shown where appropriate and represent the highest and lowest inputs used in the level 3 valuations.
2 Where the exposure to an unobservable input is managed on a net basis, only the net impact is shown in the table.
3 Underlying asset/net asset values represent fair value.
4 2019: 47bps/108bps
5 2019: 1bp/2bps
6 2019: 1.5/15.4
7 2019: 14%/115%
8 2019: +/-50bps
Note 48: Financial instruments continued

308 Lloyds Banking Group Annual Report and Accounts 2020
Notes to the consolidated financial statements continued
Unobservable inputsSignificant unobservable inputs affecting the valuation of debt securities, unlisted equity investments and derivatives are as follows:
– Interest rates and inflation rates are referenced in some derivatives where the payoff that the holder of the derivative receives depends on the behaviour of those underlying references through time.
– Credit spreads represent the premium above the benchmark reference instrument required to compensate for lower credit quality; higher spreads lead to a lower fair value.
– Volatility parameters represent key attributes of option behaviour; higher volatilities typically denote a wider range of possible outcomes.
– Earnings multiples are used to value certain unlisted equity investments; a higher earnings multiple will result in a higher fair value.
Reasonably possible alternative assumptionsValuation techniques applied to many of the Group’s level 3 instruments often involve the use of two or more inputs whose relationship is interdependent. The calculation of the effect of reasonably possible alternative assumptions included in the table above reflects such relationships.
Debt securitiesReasonably possible alternative assumptions have been determined in respect of the Group’s structured credit investment by flexing credit spreads.
DerivativesReasonably possible alternative assumptions have been determined in respect of swaptions in the Group’s derivative portfolios which are priced using industry standard option pricing models. Such models require interest rate volatilities which may be unobservable at longer maturities. To derive reasonably possible alternative valuations these volatilities have been flexed within a range of 13 per cent to 128 per cent (2019: 10 per cent to 128 per cent).
Unlisted equity, venture capital investments and investments in property partnershipsThe valuation techniques used for unlisted equity and venture capital investments vary depending on the nature of the investment. Reasonably possible alternative valuations for these investments have been calculated by reference to the approach taken, as appropriate to the business sector and investment circumstances and as such the following inputs have been considered:
– for valuations derived from earnings multiples, consideration is given to the risk attributes, growth prospects and financial gearing of comparable businesses when selecting an appropriate multiple;
– the discount rates used in discounted cash flow valuations; and
– in line with International Private Equity and Venture Capital Guidelines, the values of underlying investments in fund investment portfolios.
Note 48: Financial instruments continued

Strategic rep
ortFinancial results
Governance
Risk manag
ement
Other inform
ationFinancial statem
ents Lloyds Banking Group Annual Report and Accounts 2020 309
(4) Financial assets and liabilities carried at amortised cost(A) Financial assetsValuation hierarchyThe table below analyses the fair values of the financial assets of the Group which are carried at amortised cost by valuation methodology (level 1, 2 or 3, as described on page 300). Financial assets carried at amortised cost are mainly classified as level 3 due to significant unobservable inputs used in the valuation models. Where inputs are observable, debt securities are classified as level 1 or 2.
Valuation hierarchy
Carrying value Fair value Level 1 Level 2 Level 3£m £m £m £m £m
At 31 December 2020
Financial assets at amortised cost:
Loans and advances to customers: Stage 1 432,571 431,395 — 58,643 372,752
Loans and advances to customers: Stage 2 49,514 50,198 — — 50,198
Loans and advances to customers: Stage 3 4,508 4,412 — — 4,412
Loans and advances to customers: POCI 12,250 12,250 — — 12,250
Loans and advances to customers 498,843 498,255 — 58,643 439,612
Loans and advances to banks 10,746 10,745 — 2,686 8,059
Debt securities 5,405 5,398 — 5,387 11
Reverse repos included in above amounts:
Loans and advances to customers 58,643 58,643 — 58,643 —
Loans and advances to banks 2,686 2,686 — 2,686 —
At 31 December 2019
Financial assets at amortised cost:
Loans and advances to customers: Stage 11 449,300 449,477 — 54,600 394,877
Loans and advances to customers: Stage 2 27,548 28,259 — — 28,259
Loans and advances to customers: Stage 31 4,568 4,496 — — 4,496
Loans and advances to customers: POCI 13,572 13,572 — — 13,572
Loans and advances to customers 494,988 495,804 — 54,600 441,204
Loans and advances to banks 9,775 9,773 — 1,555 8,218
Debt securities 5,544 5,537 — 5,526 11
Reverse repos included in above amounts:
Loans and advances to customers 54,600 54,600 — 54,600 —
Loans and advances to banks 1,555 1,555 — 1,555 —
1 Revised presentation of fair values.
Valuation methodology
Loans and advances to customersThe Group provides loans and advances to commercial, corporate and personal customers at both fixed and variable rates. Due to their short-term nature, the carrying value of the variable rate loans and those relating to lease financing is assumed to be their fair value.
To determine the fair value of loans and advances to customers, loans are segregated into portfolios of similar characteristics. A number of techniques are used to estimate the fair value of fixed rate lending; these take account of expected credit losses based on historic trends, prevailing market interest rates and expected future cash flows. For retail exposures, fair value is usually estimated by discounting anticipated cash flows (including interest at contractual rates) at market rates for similar loans offered by the Group and other financial institutions. Certain loans secured on residential properties are made at a fixed rate for a limited period, typically two to five years, after which the loans revert to the relevant variable rate. The fair value of such loans is estimated by reference to the market rates for similar loans of maturity equal to the remaining fixed interest rate period. The fair value of commercial loans is estimated by discounting anticipated cash flows at a rate which reflects the effects of interest rate changes, adjusted for changes in credit risk.
Loans and advances to banksThe carrying value of short-dated loans and advances to banks is assumed to be their fair value. The fair value of loans and advances to banks is estimated by discounting the anticipated cash flows at a market discount rate adjusted for the credit spread of the obligor or, where not observable, the credit spread of borrowers of similar credit quality.
Debt securitiesThe fair values of debt securities are determined predominantly from lead manager quotes and, where these are not available, by alternative techniques including reference to credit spreads on similar assets with the same obligor, market standard consensus pricing services, broker quotes and other research data.
Reverse repurchase agreementsThe carrying amount is deemed a reasonable approximation of fair value given the short-term nature of these instruments.
Note 48: Financial instruments continued

310 Lloyds Banking Group Annual Report and Accounts 2020
Notes to the consolidated financial statements continued
(B) Financial liabilitiesValuation hierarchyThe table below analyses the fair values of the financial liabilities of the Group which are carried at amortised cost by valuation methodology (level 1, 2 or 3, as described on page 300).
Valuation hierarchy
Carrying value Fair value Level 1 Level 2 Level 3£m £m £m £m £m
At 31 December 2020
Deposits from banks 31,465 31,468 — 31,468 —
Customer deposits 460,068 460,338 — 453,261 7,077
Debt securities in issue 87,397 93,152 — 93,152 —
Subordinated liabilities 14,261 16,410 — 16,410 —
Repos included in above amounts:
Deposits from banks 18,767 18,767 — 18,767 —
Customer deposits 9,417 9,417 — 9,417 —
At 31 December 2019
Deposits from banks 28,179 28,079 — 28,079 —
Customer deposits 421,320 421,728 — 416,493 5,235
Debt securities in issue 97,689 100,443 — 100,443 —
Subordinated liabilities 17,130 19,783 — 19,783 —
Repos included in above amounts:
Deposits from banks 18,105 18,105 — 18,105 —
Customer deposits 9,530 9,530 — 9,530 —
Valuation methodology
Deposits from banks and customer depositsThe fair value of bank and customer deposits repayable on demand is assumed to be equal to their carrying value.
The fair value for all other deposits is estimated using discounted cash flows applying either market rates, where applicable, or current rates for deposits of similar remaining maturities.
Debt securities in issueThe fair value of short-term debt securities in issue is approximately equal to their carrying value. Fair value for other debt securities is calculated based on quoted market prices where available. Where quoted market prices are not available, fair value is estimated using discounted cash flow techniques at a rate which reflects market rates of interest and the Group’s own credit spread.
Subordinated liabilitiesThe fair value of subordinated liabilities is determined by reference to quoted market prices where available or by reference to quoted market prices of similar instruments. Subordinated liabilities are classified as level 2, since the inputs used to determine their fair value are largely observable.
Repurchase agreementsThe carrying amount is deemed a reasonable approximation of fair value given the short-term nature of these instruments.
(5) Reclassifications of financial assetsThere have been no reclassifications of financial assets in 2019 or 2020.
Note 48: Financial instruments continued

Strategic rep
ortFinancial results
Governance
Risk manag
ement
Other inform
ationFinancial statem
ents Lloyds Banking Group Annual Report and Accounts 2020 311
Note 49: Transfers of financial assetsThere were no significant transferred financial assets which were derecognised in their entirety, but with ongoing exposure. Details of transferred financial assets that continue to be recognised in full are as follows.
The Group enters into repurchase and securities lending transactions in the normal course of business that do not result in derecognition of the financial assets as substantially all of the risks and rewards, including credit, interest rate, prepayment and other price risks are retained by the Group. In all cases, the transferee has the right to sell or repledge the assets concerned.
As set out in note 29, included within financial assets measured at amortised cost are loans transferred under the Group’s securitisation and covered bond programmes. As the Group retains all or a majority of the risks and rewards associated with these loans, including credit, interest rate, prepayment and liquidity risk, they remain on the Group’s balance sheet. Assets transferred into the Group’s securitisation and covered bond programmes are not available to be used by the Group whilst the assets are within the programmes. However, the Group retains the right to remove loans from the covered bond programmes where they are in excess of the programme’s requirements. In addition, where the Group has retained some of the notes issued by securitisation and covered bond programmes, the Group has the ability to sell or pledge these retained notes.
The table below sets out the carrying values of the transferred assets and the associated liabilities. For repurchase and securities lending transactions, the associated liabilities represent the Group’s obligation to repurchase the transferred assets. For securitisation programmes, the associated liabilities represent the external notes in issue (note 29). Except as otherwise noted below, none of the liabilities shown in the table below have recourse only to the transferred assets.
2020 2019
Carrying value of
transferred assets
Carrying value of
associated liabilities
Carrying value of
transferred assets
Carrying value of
associated liabilities
£m £m £m £m
Repurchase and securities lending transactions
Financial assets at fair value through profit or loss 5,791 2,512 9,186 3,364
Financial assets at fair value through other comprehensive income 6,025 5,105 7,897 5,875
Securitisation programmes
Financial assets at amortised cost:
Loans and advances to customers1 34,584 4,451 42,545 7,335
1 The carrying value of associated liabilities excludes securitisation notes held by the Group of £27,448 million (31 December 2019: £31,436 million).

312 Lloyds Banking Group Annual Report and Accounts 2020
Notes to the consolidated financial statements continued
Note 50: Offsetting of financial assets and liabilitiesThe following information relates to financial assets and liabilities which have been offset in the balance sheet and those which have not been offset but for which the Group has enforceable master netting agreements or collateral arrangements in place with counterparties.
Related amounts where set off in the balance sheet not permitted3 Potential
net amounts if offset
of related amounts
permitted
Gross amounts of assets and
liabilities1
Amount offset in the balance
sheet2
Net amounts presented in the balance
sheet
Cash collateral received/ pledged
Non-cash collateral received/ pledged
At 31 December 2020 £m £m £m £m £m £m
Financial assets
Financial assets at fair value through profit or loss:
Excluding reverse repos 158,633 — 158,633 — (2,567) 156,066
Reverse repos 27,904 (14,911) 12,993 (24) (12,969) —
186,537 (14,911) 171,626 (24) (15,536) 156,066
Derivative financial instruments 88,700 (59,087) 29,613 (8,715) (16,747) 4,151
Loans and advances to banks:
Excluding reverse repos 8,060 — 8,060 (3,105) — 4,955
Reverse repos 2,694 (8) 2,686 — (2,686) —
10,754 (8) 10,746 (3,105) (2,686) 4,955
Loans and advances to customers:
Excluding reverse repos 440,200 — 440,200 (2,094) (2,762) 435,344
Reverse repos 64,052 (5,409) 58,643 — (58,643) —
504,252 (5,409) 498,843 (2,094) (61,405) 435,344
Debt securities 5,405 — 5,405 — — 5,405
Financial assets at fair value through other comprehensive income 27,603 — 27,603 — (5,132) 22,471
Financial liabilities
Deposits from banks:
Excluding repos 12,698 — 12,698 (8,739) — 3,959
Repos 18,775 (8) 18,767 — (18,767) —
31,473 (8) 31,465 (8,739) (18,767) 3,959
Customer deposits:
Excluding repos 450,651 — 450,651 (1,862) (2,762) 446,027
Repos 14,826 (5,409) 9,417 — (9,417) —
465,477 (5,409) 460,068 (1,862) (12,179) 446,027
Financial liabilities at fair value through profit or loss:
Excluding repos 7,650 — 7,650 — — 7,650
Repos 29,907 (14,911) 14,996 — (14,996) —
37,557 (14,911) 22,646 — (14,996) 7,650
Derivative financial instruments 85,088 (57,775) 27,313 (5,199) (20,156) 1,958

Strategic rep
ortFinancial results
Governance
Risk manag
ement
Other inform
ationFinancial statem
ents Lloyds Banking Group Annual Report and Accounts 2020 313
Related amounts where set off in the balance sheet not permitted3 Potential
net amounts if offset
of related amounts
permitted
Gross amounts of assets and
liabilities1
Amount offset in the balance
sheet2
Net amounts presented in the balance
sheet
Cash collateral received/ pledged
Non-cash collateral received/ pledged
At 31 December 2019 £m £m £m £m £m £m
Financial assets
Financial assets at fair value through profit or loss:
Excluding reverse repos 148,920 — 148,920 — (2,825) 146,095
Reverse repos 24,165 (12,896) 11,269 (366) (10,903) —
173,085 (12,896) 160,189 (366) (13,728) 146,095
Derivative financial instruments 79,735 (53,366) 26,369 (7,650) (13,892) 4,827
Loans and advances to banks:
Excluding reverse repos 8,220 — 8,220 (3,377) — 4,843
Reverse repos 1,555 — 1,555 — (1,555) —
9,775 — 9,775 (3,377) (1,555) 4,843
Loans and advances to customers:
Excluding reverse repos 440,388 — 440,388 (2,392) (2,123) 435,873
Reverse repos 58,959 (4,359) 54,600 — (54,600) —
499,347 (4,359) 494,988 (2,392) (56,723) 435,873
Debt securities 5,544 — 5,544 — (211) 5,333
Financial assets at fair value through other comprehensive income 25,092 — 25,092 — (5,859) 19,233
Financial liabilities
Deposits from banks:
Excluding repos 10,074 — 10,074 (8,016) — 2,058
Repos 18,105 — 18,105 — (18,105) —
28,179 — 28,179 (8,016) (18,105) 2,058
Customer deposits:
Excluding repos 413,659 (1,869) 411,790 (1,850) (2,123) 407,817
Repos 9,530 — 9,530 — (9,530) —
423,189 (1,869) 421,320 (1,850) (11,653) 407,817
Financial liabilities at fair value through profit or loss:
Excluding repos 10,438 — 10,438 — — 10,438
Repos 28,303 (17,255) 11,048 — (11,048) —
38,741 (17,255) 21,486 — (11,048) 10,438
Derivative financial instruments 77,276 (51,497) 25,779 (5,770) (16,364) 3,645
1 After impairment allowance.
2 The amounts offset in the balance sheet as shown above represent derivatives and repurchase agreements with central clearing houses which meet the criteria for offsetting under IAS 32.
3 The Group enters into derivatives and repurchase and reverse repurchase agreements with various counterparties which are governed by industry standard master netting agreements. The Group holds and provides cash and securities collateral in respective of derivative transactions covered by these agreements. The right to set off balances under these master netting agreements or to set off cash and securities collateral only arises in the event of non-payment or default and, as a result, these arrangements do not qualify for offsetting under IAS 32.
The effects of over collateralisation have not been taken into account in the above table.
Note 50: Offsetting of financial assets and liabilities continued

314 Lloyds Banking Group Annual Report and Accounts 2020
Notes to the consolidated financial statements continued
Note 51: Financial risk managementAs a bancassurer, financial instruments are fundamental to the Group’s activities and, as a consequence, the risks associated with financial instruments represent a significant component of the risks faced by the Group.
The primary risks affecting the Group through its use of financial instruments are: credit risk; market risk, which includes interest rate risk and foreign exchange risk; liquidity risk; capital risk; and insurance risk. Information about the Group’s exposure to each of the above risks and its capital can be found on pages 144 to 204. The following additional disclosures, which provide its quantitative information about the risks within financial instruments held or issued by the Group, should be read in conjunction with that earlier information.
Market risk(A) Interest rate riskInterest rate risk arises from the different repricing characteristics of the assets and liabilities. Liabilities are either insensitive to interest rate movements, for example interest free or very low interest customer deposits, or are sensitive to interest rate changes but bear rates which may be varied at the Group’s discretion and that for competitive reasons generally reflect changes in the UK Bank Rate, set by the Bank of England. The rates on the remaining deposits are contractually fixed for their term to maturity.
Many banking assets are sensitive to interest rate movements; there is a large volume of managed rate assets such as variable rate mortgages which may be considered as a natural offset to the interest rate risk arising from the managed rate liabilities. However, a significant proportion of the Group’s lending assets, for example many personal loans and mortgages, bear interest rates which are contractually fixed.
The Group’s risk management policy is to optimise reward whilst managing its market risk exposures within the risk appetite defined by the Board. The largest residual risk exposure arises from balances that are deemed to be insensitive to changes in market rates (including current accounts, a portion of variable rate deposits and investable equity), and is managed through the Group’s structural hedge. The structural hedge consists of longer-term fixed rate assets or interest rate swaps and the amount and duration of the hedging activity is reviewed regularly by the Group Asset and Liability Committee. Further details on the Group market risk policy can be found on page 155.
The Group establishes hedge accounting relationships for interest rate risk using cash flow hedges and fair value hedges. The Group is exposed to cash flow interest rate risk on its variable rate loans and deposits together with its floating rate subordinated debt. The derivatives used to manage the structural hedge may be designated into cash flow hedges to manage income statement volatility. The economic items related to the structural hedge, for example current accounts, are not eligible hedged items under IAS 39 for inclusion into accounting hedge relationships. The Group is exposed to fair value interest rate risk on its fixed rate customer loans, its fixed rate customer deposits and the majority of its subordinated debt, and to cash flow interest rate risk on its variable rate loans and deposits together with its floating rate subordinated debt. The Group applies netting between similar risks before applying hedge accounting.
Hedge ineffectiveness arises during the management of interest rate risk due to residual unhedged risk. Sources of ineffectiveness, which the Group may decide to not fully mitigate, can include basis differences, timing differences and notional amount differences. The effectiveness of accounting hedge relationships is assessed between the hedging derivatives and the documented hedged item, which can differ to the underlying economically hedged item.
At 31 December 2020 the aggregate notional principal of interest rate swaps designated as fair value hedges was £215,325 million (2019: £183,489 million) with a net fair value asset of £211 million (2019: asset of £569 million) (note 17). The gains on the hedging instruments were £988 million (2019: gains of £1,144 million). The losses on the hedged items attributable to the hedged risk were £441 million (2019: losses of £1,001 million). The gains and losses relating to the fair value hedges are recorded in net trading income.
In addition the Group has cash flow hedges which are primarily used to hedge the variability in the cost of funding within the commercial business. The notional principal of the interest rate swaps designated as cash flow hedges at 31 December 2020 was £326,386 million (2019: £426,740 million) with a net fair value asset of £30 million (2019: liability of £388 million) (note 17). In 2020, ineffectiveness recognised in the income statement that arises from cash flow hedges was a loss of £2 million (2019: gain of £134 million).
Interest Rate Benchmark ReformFor the purposes of determining whether:
– a forecast transaction is highly probable;
– hedged future cash flows are expected to occur;
– a hedge is expected to be highly effective in achieving offsetting changes in fair value or cash flows attributable to the hedged risk; and
– an accounting hedging relationship should be discontinued because of a failure of the retrospective effectiveness test
the Group assumes that the interest rate benchmark on which the hedged risk or the cash flows of the hedged item or hedging instrument are based is not altered by uncertainties resulting from interest rate benchmark reform. In addition, for a fair value hedge of a non-contractually specified benchmark portion of interest rate risk, the Group assesses only at inception of the hedge relationship and not on an ongoing basis that the risk is separately identifiable and hedge effectiveness can be measured. The Group’s most significant hedge accounting relationships are exposed to the following interest rate benchmarks: Sterling LIBOR, US Dollar LIBOR and EURIBOR.
At 31 December 2020, the Group expects that EURIBOR will continue to exist as a benchmark rate for the foreseeable future and, as a result does not anticipate changing the hedged risk to a different benchmark. Accordingly, the Group does not consider its fair value or cash flow hedges of the EURIBOR benchmark interest rate to be directly affected by interest rate benchmark reform.
The notional of the hedged items that the Group has designated into cash flow hedge relationships that is directly affected by the interest rate benchmark reform is £20,243 million (2019: £29,202 million), of which £16,523 million (2019: £25,438 million) relates to Sterling LIBOR and £3,720 million (2019: £1,350 million) relates to US Dollar LIBOR. These are principally loans and advances to customers in Commercial Banking.
The interest rate benchmark reforms also affect assets designated in fair value hedges with a notional of £107,340 million (2019: £102,969 million), of which £103,438 million (2019: £98,278 million) is in respect of Sterling LIBOR, and liabilities designated in fair value hedges with a notional of £35,360 million (2019: £62,295 million), of which £10,518 million (2019: £9,186 million) is in respect of Sterling LIBOR. These fair value hedges principally relate to mortgages in Retail and debt securities in issue.
At 31 December 2020, the notional amount of the hedging instruments in hedging relationships to which these amendments apply was £464,744 million (2019: £604,602 million), of which £116,498 million (2019: £117,076 million) relates to Sterling LIBOR fair value hedges and £302,707 million (2019: £400,439 million) relates to Sterling LIBOR cash flow hedges.

Strategic rep
ortFinancial results
Governance
Risk manag
ement
Other inform
ationFinancial statem
ents Lloyds Banking Group Annual Report and Accounts 2020 315
The Group is managing the process to transition to alternative benchmark rates under its Group-wide IBOR Transition Programme. This programme has developed an implementation plan for new products and a transition plan for legacy products. The programme also encompasses the associated impacts on systems, processes, accounting and reporting and includes dealing with the impact on hedge accounting relationships of the transition to alternative reference rates.
(B) Foreign exchange riskThe corporate and retail businesses incur foreign exchange risk in the course of providing services to their customers. All non-structural foreign exchange exposures in the non-trading book are transferred to the trading area where they are monitored and controlled. These risks reside in the authorised trading centres who are allocated exposure limits. The limits are monitored daily by the local centres and reported to the market and liquidity risk function in London. Associated VaR and the closing, average, maximum and minimum are disclosed on page 159. The Group also manages foreign currency risk via cash flow hedge accounting, utilising currency swaps.
Risk arises from the Group’s investments in its overseas operations. The Group’s structural foreign currency exposure is represented by the net asset value of the foreign currency equity and subordinated debt investments in its subsidiaries and branches. Gains or losses on structural foreign currency exposures are taken to reserves.
The Group ceased all hedging of the currency translation risk of the net investment in foreign operations on 1 January 2018.
The Group’s main overseas operations are in the Americas and Europe. Details of the Group’s structural foreign currency exposures are as follows:
(C) Functional currency of Group operations
2020 2019
Euro US DollarOther
non-sterling Euro US DollarOther
non-sterling£m £m £m £m £m £m
Exposure 113 95 12 63 93 48
Credit riskThe Group’s credit risk exposure arises in respect of the instruments below and predominantly in the United Kingdom. Information about the Group’s exposure to credit risk, credit risk management, measurement and mitigation can be found on pages 160 to 182.
(A) Maximum credit exposureThe maximum credit risk exposure of the Group in the event of other parties failing to perform their obligations is detailed below. No account is taken of any collateral held and the maximum exposure to loss, which includes amounts held to cover unit-linked and With Profits funds liabilities, is considered to be the balance sheet carrying amount or, for non-derivative off-balance sheet transactions and financial guarantees, their contractual nominal amounts.
2020 2019
Maximum exposure Offset1
Net exposure
Maximum exposure Offset1
Net exposure
£m £m £m £m £m £m
Loans and advances to banks, net2 10,746 — 10,746 9,775 — 9,775
Loans and advances to customers, net2 498,843 (2,762) 496,081 494,988 (2,792) 492,196
Debt securities, net2 5,405 — 5,405 5,544 — 5,544
Financial assets at amortised cost 514,994 (2,762) 512,232 510,307 (2,792) 507,515
Financial assets at fair value through other comprehensive income3 27,437 — 27,437 24,865 — 24,865
Financial assets at fair value through profit or loss3,4
Loans and advances 28,476 — 28,476 23,475 — 23,475
Debt securities, treasury and other bills 46,701 — 46,701 40,925 — 40,925
75,177 — 75,177 64,400 — 64,400
Derivative assets 29,613 (15,866) 13,747 26,369 (14,696) 11,673
Assets arising from contracts held with reinsurers 20,385 — 20,385 23,567 — 23,567
Off-balance sheet items:
Acceptances and endorsements 131 — 131 74 — 74
Other items serving as direct credit substitutes 317 — 317 366 — 366
Performance bonds, including letters of credit, and other transaction-related contingencies 2,105 — 2,105 2,454 — 2,454
Irrevocable commitments and guarantees 73,962 — 73,962 63,504 — 63,504
76,515 — 76,515 66,398 — 66,398
744,121 (18,628) 725,493 715,906 (17,488) 698,418
1 Offset items comprise deposit amounts available for offset, and amounts available for offset under master netting arrangements, that do not meet the criteria under IAS 32 to enable loans and advances and derivative assets respectively to be presented net of these balances in the financial statements.
2 Amounts shown net of related impairment allowances.
3 Excluding equity shares.
4 Includes assets within the Group’s unit-linked funds for which credit risk is borne by the policyholders and assets within the Group’s With-Profits funds for which credit risk is largely borne by the policyholders. Consequently, the Group has no significant exposure to credit risk for such assets which back related contract liabilities.
Note 51: Financial risk management continued

316 Lloyds Banking Group Annual Report and Accounts 2020
Notes to the consolidated financial statements continued
(B) Concentrations of exposureThe Group’s management of concentration risk includes single name, industry sector and country limits as well as controls over the Group’s overall exposure to certain products. Further information on the Group’s management of this risk is included within Credit risk mitigation, Risk management on page 160.
At 31 December 2020 the most significant concentrations of exposure were in mortgages (comprising 62 per cent of total loans and advances to customers) and to financial, business and other services (comprising 19 per cent of the total).
2020 2019£m £m
Agriculture, forestry and fishing 7,836 7,558
Energy and water supply 1,313 1,432
Manufacturing 4,956 6,093
Construction 5,096 4,285
Transport, distribution and hotels 14,341 13,016
Postal and telecommunications 2,665 1,923
Property companies 26,061 27,596
Financial, business and other services 92,555 89,763
Personal:
Mortgages1 307,087 299,141
Other 25,363 29,272
Lease financing 1,182 1,671
Hire purchase 16,148 16,497
Total loans and advances to customers before allowance for impairment losses 504,603 498,247
Allowance for impairment losses (note 18) (5,760) (3,259)
Total loans and advances to customers 498,843 494,988
1 Includes both UK and overseas mortgage balances.
The Group’s operations are predominantly UK-based and as a result an analysis of credit risk exposures by geographical region is not provided.
(C) Credit quality of assetsLoans and advancesThe analysis of lending has been prepared based on the division in which the asset is held; with the business segment in which the exposure is recorded reflected in the ratings system applied. The internal credit ratings systems used by the Group differ between Retail and Commercial, reflecting the characteristics of these exposures and the way that they are managed internally; these credit ratings are set out below. All probabilities of default (PDs) include forward-looking information and are based on 12 month values, with the exception of credit impaired.
Retail Commercial
Quality classification IFRS 9 PD range Quality classification IFRS 9 PD range
RMS 1-6 0.00-4.50% CMS 1-10 0.00-0.50%
RMS 7-9 4.51-14.00% CMS 11-14 0.51-3.00%
RMS 10 14.01-20.00% CMS 15-18 3.01-20.00%
RMS 11-13 20.01-99.99% CMS 19 20.01-99.99%
RMS 14 100% CMS 20-23 100%
Stage 3 assets include balances of £179 million (2019: £205 million) (with outstanding amounts due of £732 million (2019: £1,700 million)) which have been subject to a partial write-off and where the Group continues to enforce recovery action.
Stage 2 and Stage 3 assets with a carrying amount of £22,200 million (2019: £219 million) were modified during the year. No material gain or loss was recognised by the Group.
As at 31 December 2020 and 2019, assets that had been previously modified whilst classified as Stage 2 or Stage 3 and were classified as Stage 1 were not material.
Note 51: Financial risk management continued

Strategic rep
ortFinancial results
Governance
Risk manag
ement
Other inform
ationFinancial statem
ents Lloyds Banking Group Annual Report and Accounts 2020 317
Drawn exposures Expected credit loss allowance
Gross drawn exposures and expected credit loss allowances
Stage 1 Stage 2 Stage 3 POCI Total Stage 1 Stage 2 Stage 3 POCI Total£m £m £m £m £m £m £m £m £m £m
At 31 December 2020
Loans and advances to banks:
CMS 1-10 10,670 — — — 10,670 6 — — — 6
CMS 11-14 82 — — — 82 — — — — —
CMS 15-18 — — — — — — — — — —
CMS 19 — — — — — — — — — —
CMS 20-23 — — — — — — — — — —
10,752 — — — 10,752 6 — — — 6
Loans and advances to customers:
Retail - mortgages
RMS 1-6 251,372 21,010 — — 272,382 103 247 — — 350
RMS 7-9 46 4,030 — — 4,076 1 66 — — 67
RMS 10 — 907 — — 907 — 25 — — 25
RMS 11-13 — 3,071 — — 3,071 — 130 — — 130
RMS 14 — — 1,859 12,511 14,370 — — 191 261 452
251,418 29,018 1,859 12,511 294,806 104 468 191 261 1,024
Retail - credit cards
RMS 1-6 9,619 1,284 — — 10,903 75 57 — — 132
RMS 7-9 1,603 1,137 — — 2,740 66 138 — — 204
RMS 10 274 343 — — 617 14 70 — — 84
RMS 11-13 — 509 — — 509 — 193 — — 193
RMS 14 — — 340 — 340 — — 153 — 153
11,496 3,273 340 — 15,109 155 458 153 — 766
Retail - loans and overdrafts
RMS 1-6 5,559 291 — — 5,850 80 15 — — 95
RMS 7-9 1,990 580 — — 2,570 99 66 — — 165
RMS 10 116 181 — — 297 13 36 — — 49
RMS 11-13 45 467 — — 512 9 178 — — 187
RMS 14 — — 307 — 307 — — 147 — 147
7,710 1,519 307 — 9,536 201 295 147 — 643
Retail - UK Motor Finance
RMS 1-6 12,035 1,396 — — 13,431 187 46 — — 233
RMS 7-9 738 456 — — 1,194 7 33 — — 40
RMS 10 — 171 — — 171 — 30 — — 30
RMS 11-13 13 193 — — 206 — 62 — — 62
RMS 14 — — 199 — 199 — — 133 — 133
12,786 2,216 199 — 15,201 194 171 133 — 498
Retail - other
RMS 1-6 14,952 482 — — 15,434 19 19 — — 38
RMS 7-9 2,418 334 — — 2,752 11 39 — — 50
RMS 10 — 21 — — 21 — 1 — — 1
RMS 11-13 509 467 — — 976 — 40 — — 40
RMS 14 — — 184 — 184 — — 59 — 59
17,879 1,304 184 — 19,367 30 99 59 — 188
Total Retail 301,289 37,330 2,889 12,511 354,019 684 1,491 683 261 3,119
Note 51: Financial risk management continued
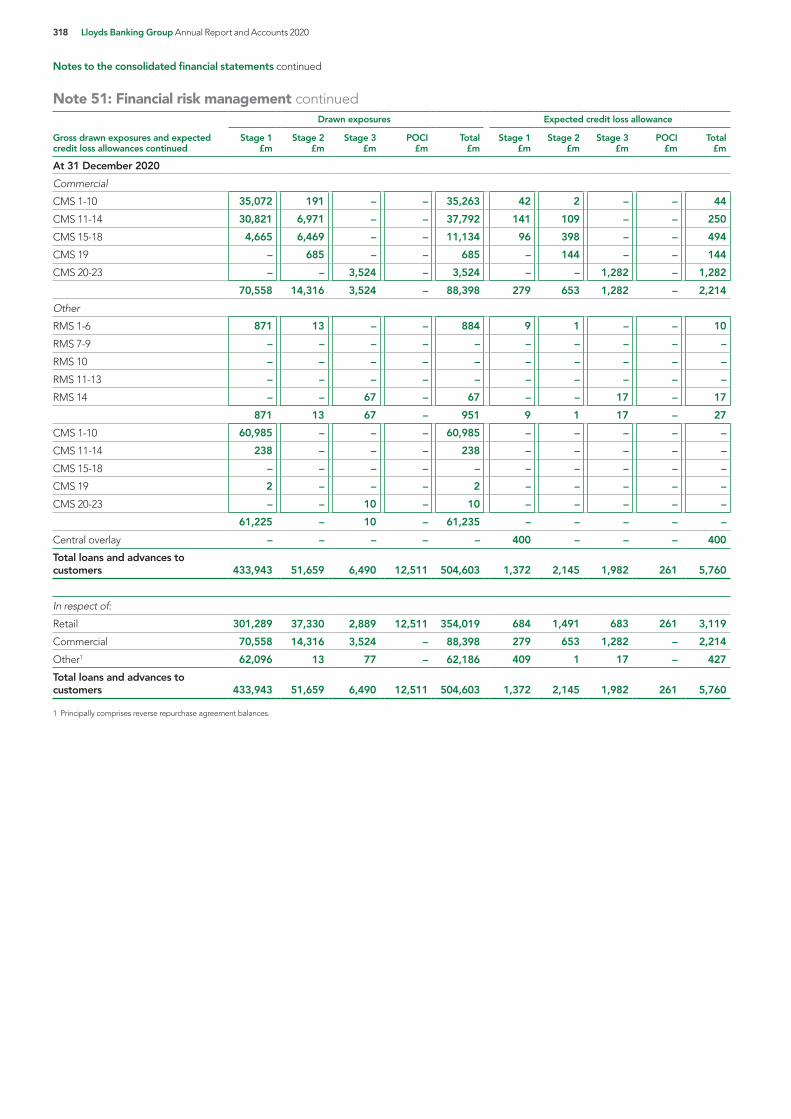
318 Lloyds Banking Group Annual Report and Accounts 2020
Notes to the consolidated financial statements continued
Drawn exposures Expected credit loss allowance
Gross drawn exposures and expected credit loss allowances continued
Stage 1 Stage 2 Stage 3 POCI Total Stage 1 Stage 2 Stage 3 POCI Total£m £m £m £m £m £m £m £m £m £m
At 31 December 2020
Commercial
CMS 1-10 35,072 191 — — 35,263 42 2 — — 44
CMS 11-14 30,821 6,971 — — 37,792 141 109 — — 250
CMS 15-18 4,665 6,469 — — 11,134 96 398 — — 494
CMS 19 — 685 — — 685 — 144 — — 144
CMS 20-23 — — 3,524 — 3,524 — — 1,282 — 1,282
70,558 14,316 3,524 — 88,398 279 653 1,282 — 2,214
Other
RMS 1-6 871 13 — — 884 9 1 — — 10
RMS 7-9 — — — — — — — — — —
RMS 10 — — — — — — — — — —
RMS 11-13 — — — — — — — — — —
RMS 14 — — 67 — 67 — — 17 — 17
871 13 67 — 951 9 1 17 — 27
CMS 1-10 60,985 — — — 60,985 — — — — —
CMS 11-14 238 — — — 238 — — — — —
CMS 15-18 — — — — — — — — — —
CMS 19 2 — — — 2 — — — — —
CMS 20-23 — — 10 — 10 — — — — —
61,225 — 10 — 61,235 — — — — —
Central overlay — — — — — 400 — — — 400
Total loans and advances to customers 433,943 51,659 6,490 12,511 504,603 1,372 2,145 1,982 261 5,760
In respect of:
Retail 301,289 37,330 2,889 12,511 354,019 684 1,491 683 261 3,119
Commercial 70,558 14,316 3,524 — 88,398 279 653 1,282 — 2,214
Other1 62,096 13 77 — 62,186 409 1 17 — 427
Total loans and advances to customers 433,943 51,659 6,490 12,511 504,603 1,372 2,145 1,982 261 5,760
1 Principally comprises reverse repurchase agreement balances.
Note 51: Financial risk management continued

Strategic rep
ortFinancial results
Governance
Risk manag
ement
Other inform
ationFinancial statem
ents Lloyds Banking Group Annual Report and Accounts 2020 319
Undrawn exposures Expected credit loss allowance
Gross undrawn exposures and expected credit loss allowances
Stage 1 Stage 2 Stage 3 POCI Total Stage 1 Stage 2 Stage 3 POCI Total£m £m £m £m £m £m £m £m £m £m
At 31 December 2020
Loans and advances to customers:
Retail - mortgages
RMS 1-6 19,347 109 — — 19,456 3 — — — 3
RMS 7-9 1 6 — — 7 — — — — —
RMS 10 — 2 — — 2 — — — — —
RMS 11-13 — 1 — — 1 — — — — —
RMS 14 — — 10 74 84 — — — — —
19,348 118 10 74 19,550 3 — — — 3
Retail - credit cards
RMS 1-6 54,694 3,044 — — 57,738 67 46 — — 113
RMS 7-9 772 463 — — 1,235 11 8 — — 19
RMS 10 602 282 — — 884 7 11 — — 18
RMS 11-13 — 85 — — 85 — 7 — — 7
RMS 14 — — 56 — 56 — — — — —
56,068 3,874 56 — 59,998 85 72 — — 157
Retail - loans and overdrafts
RMS 1-6 6,070 315 — — 6,385 14 7 — — 21
RMS 7-9 269 139 — — 408 8 14 — — 22
RMS 10 13 35 — — 48 1 7 — — 8
RMS 11-13 3 69 — — 72 — 21 — — 21
RMS 14 — — 18 — 18 — — — — —
6,355 558 18 — 6,931 23 49 — — 72
Retail - UK Motor Finance
RMS 1-6 1,275 — — — 1,275 2 — — — 2
RMS 7-9 381 3 — — 384 1 — — — 1
RMS 10 — — — — — — — — — —
RMS 11-13 1 — — — 1 — — — — —
RMS 14 — — — — — — — — — —
1,657 3 — — 1,660 3 — — — 3
Retail - other
RMS 1-6 1,672 23 — — 1,695 7 5 — — 12
RMS 7-9 140 36 — — 176 9 13 — — 22
RMS 10 — — — — — — — — — —
RMS 11-13 — 10 — — 10 — 7 — — 7
RMS 14 — — 1 — 1 — — — — —
1,812 69 1 — 1,882 16 25 — — 41
Total Retail 85,240 4,622 85 74 90,021 130 146 — — 276
Note 51: Financial risk management continued

320 Lloyds Banking Group Annual Report and Accounts 2020
Notes to the consolidated financial statements continued
Gross undrawn exposures and expected credit loss allowances continued
Undrawn exposures Expected credit loss allowance
Stage 1 Stage 2 Stage 3 POCI Total Stage 1 Stage 2 Stage 3 POCI Total£m £m £m £m £m £m £m £m £m £m
At 31 December 2020
Commercial
CMS 1-10 42,071 — — — 42,071 32 — — — 32
CMS 11-14 10,122 2,412 — — 12,534 32 27 — — 59
CMS 15-18 934 1,315 — — 2,249 16 49 — — 65
CMS 19 — 92 — — 92 — 12 — — 12
CMS 20-23 — — 195 — 195 — — 13 — 13
53,127 3,819 195 — 57,141 80 88 13 — 181
Other
RMS 1-6 299 — — — 299 2 — — — 2
RMS 7-9 — — — — — — — — — —
RMS 10 — — — — — — — — — —
RMS 11-13 — — — — — — — — — —
RMS 14 — — — — — — — — — —
299 — — — 299 2 — — — 2
CMS 1-10 239 — — — 239 — — — — —
CMS 11-14 170 — — — 170 — — — — —
CMS 15-18 — — — — — — — — — —
CMS 19 — — — — — — — — — —
CMS 20-23 — — 5 — 5 — — — — —
409 — 5 — 414 — — — — —
Total loans and advances to customers 139,075 8,441 285 74 147,875 212 234 13 — 459
In respect of:
Retail 85,240 4,622 85 74 90,021 130 146 — — 276
Commercial 53,127 3,819 195 — 57,141 80 88 13 — 181
Other 708 — 5 — 713 2 — — — 2
Total loans and advances to customers 139,075 8,441 285 74 147,875 212 234 13 — 459
Note 51: Financial risk management continued

Strategic rep
ortFinancial results
Governance
Risk manag
ement
Other inform
ationFinancial statem
ents Lloyds Banking Group Annual Report and Accounts 2020 321
Drawn exposures Expected credit loss allowance
Gross drawn exposures and expected credit loss allowances
Stage 1 Stage 2 Stage 3 POCI Total Stage 1 Stage 2 Stage 3 POCI Total£m £m £m £m £m £m £m £m £m £m
At 31 December 2019
Loans and advances to banks:
CMS 1-10 9,777 — — — 9,777 2 — — — 2
CMS 11-14 — — — — — — — — — —
CMS 15-18 — — — — — — — — — —
CMS 19 — — — — — — — — — —
CMS 20-23 — — — — — — — — — —
9,777 — — — 9,777 2 — — — 2
Loans and advances to customers:
Retail - mortgages
RMS 1-6 257,028 13,494 — — 270,522 23 183 — — 206
RMS 7-9 15 2,052 — — 2,067 — 39 — — 39
RMS 10 — 414 — — 414 — 13 — — 13
RMS 11-13 — 975 — — 975 — 46 — — 46
RMS 14 — — 1,506 13,714 15,220 — — 122 142 264
257,043 16,935 1,506 13,714 289,198 23 281 122 142 568
Retail - credit cards
RMS 1-6 14,744 729 — — 15,473 103 25 — — 128
RMS 7-9 1,355 556 — — 1,911 49 54 — — 103
RMS 10 32 105 — — 137 3 19 — — 22
RMS 11-13 1 291 — — 292 — 91 — — 91
RMS 14 — — 385 — 385 — — 125 — 125
16,132 1,681 385 — 18,198 155 189 125 — 469
Retail - loans and overdrafts
RMS 1-6 7,406 368 — — 7,774 84 17 — — 101
RMS 7-9 1,321 363 — — 1,684 55 38 — — 93
RMS 10 44 85 — — 129 4 15 — — 19
RMS 11-13 17 315 — — 332 3 102 — — 105
RMS 14 — — 293 — 293 — — 108 — 108
8,788 1,131 293 — 10,212 146 172 108 — 426
Retail - UK Motor Finance
RMS 1-6 13,568 1,297 — — 14,865 203 30 — — 233
RMS 7-9 314 368 — — 682 10 15 — — 25
RMS 10 — 99 — — 99 — 10 — — 10
RMS 11-13 2 178 — — 180 1 32 — — 33
RMS 14 — — 150 — 150 — — 84 — 84
13,884 1,942 150 — 15,976 214 87 84 — 385
Retail - other
RMS 1-6 9,762 395 — — 10,157 25 10 — — 35
RMS 7-9 8 420 — — 428 — 26 — — 26
RMS 10 — 7 — — 7 — — — — —
RMS 11-13 134 23 — — 157 — 1 — — 1
RMS 14 — — 150 — 150 — — 51 — 51
9,904 845 150 — 10,899 25 37 51 — 113
Total Retail 305,751 22,534 2,484 13,714 344,483 563 766 490 142 1,961
Note 51: Financial risk management continued

322 Lloyds Banking Group Annual Report and Accounts 2020
Notes to the consolidated financial statements continued
Drawn exposures Expected credit loss allowance
Gross drawn exposures and expected credit loss allowances continued
Stage 1 Stage 2 Stage 3 POCI Total Stage 1 Stage 2 Stage 3 POCI Total£m £m £m £m £m £m £m £m £m £m
At 31 December 2019
Commercial
CMS 1-10 59,708 379 — — 60,087 33 1 — — 34
CMS 11-14 25,569 2,318 — — 27,887 50 37 — — 87
CMS 15-18 1,797 3,111 — — 4,908 13 174 — — 187
CMS 19 — 169 — — 169 — 16 — — 16
CMS 20-23 — — 3,447 — 3,447 — — 941 — 941
87,074 5,977 3,447 — 96,498 96 228 941 — 1,265
Other
RMS 1-6 754 32 — — 786 6 1 — — 7
RMS 7-9 40 — — — 40 — — — — —
RMS 10 — — — — — — — — — —
RMS 11-13 — — — — — — — — — —
RMS 14 — — 84 — 84 — — 16 — 16
794 32 84 — 910 6 1 16 — 23
CMS 1-10 56,356 — — — 56,356 10 — — — 10
CMS 11-14 — — — — — — — — — —
CMS 15-18 — — — — — — — — — —
CMS 19 — — — — — — — — — —
CMS 20-23 — — — — — — — — — —
56,356 — — — 56,356 10 — — — 10
Total loans and advances to customers 449,975 28,543 6,015 13,714 498,247 675 995 1,447 142 3,259
In respect of:
Retail 305,751 22,534 2,484 13,714 344,483 563 766 490 142 1,961
Commercial 87,074 5,977 3,447 — 96,498 96 228 941 — 1,265
Other1 57,150 32 84 — 57,266 16 1 16 — 33
Total loans and advances to customers 449,975 28,543 6,015 13,714 498,247 675 995 1,447 142 3,259
1 Principally comprises reverse repurchase agreement balances.
Note 51: Financial risk management continued

Strategic rep
ortFinancial results
Governance
Risk manag
ement
Other inform
ationFinancial statem
ents Lloyds Banking Group Annual Report and Accounts 2020 323
Gross undrawn exposures and expected credit loss allowances
Undrawn exposures Expected credit loss allowance
Stage 1 Stage 2 Stage 3 POCI Total Stage 1 Stage 2 Stage 3 POCI Total£m £m £m £m £m £m £m £m £m £m
At 31 December 2019
Loans and advances to customers:
Retail - mortgages
RMS 1-6 12,242 62 — — 12,304 1 — — — 1
RMS 7-9 1 1 — — 2 — — — — —
RMS 10 — — — — — — — — — —
RMS 11-13 — — — — — — — — — —
RMS 14 — — 8 79 87 — — — — —
12,243 63 8 79 12,393 1 — — — 1
Retail - credit cards
RMS 1-6 54,216 1,762 — — 55,978 44 21 — — 65
RMS 7-9 293 162 — — 455 4 3 — — 7
RMS 10 3 28 — — 31 — 1 — — 1
RMS 11-13 1 44 — — 45 — 4 — — 4
RMS 14 — — 75 — 75 — — — — —
54,513 1,996 75 — 56,584 48 29 — — 77
Retail - loans and overdrafts
RMS 1-6 6,437 224 — — 6,661 12 3 — — 15
RMS 7-9 96 56 — — 152 2 5 — — 7
RMS 10 2 11 — — 13 — 2 — — 2
RMS 11-13 — 29 — — 29 — 11 — — 11
RMS 14 — — 8 — 8 — — — — —
6,535 320 8 — 6,863 14 21 — — 35
Retail - UK Motor Finance
RMS 1-6 1,181 — — — 1,181 2 — — — 2
RMS 7-9 193 4 — — 197 — — — — —
RMS 10 — — — — — — — — — —
RMS 11-13 — — — — — — — — — —
RMS 14 — — — — — — — — — —
1,374 4 — — 1,378 2 — — — 2
Retail - other
RMS 1-6 1,240 — — — 1,240 11 — — — 11
RMS 7-9 — 62 — — 62 — 3 — — 3
RMS 10 — — — — — — — — — —
RMS 11-13 — — — — — — — — — —
RMS 14 — — 3 — 3 — — — — —
1,240 62 3 — 1,305 11 3 — — 14
Total Retail 75,905 2,445 94 79 78,523 76 53 — — 129
Note 51: Financial risk management continued
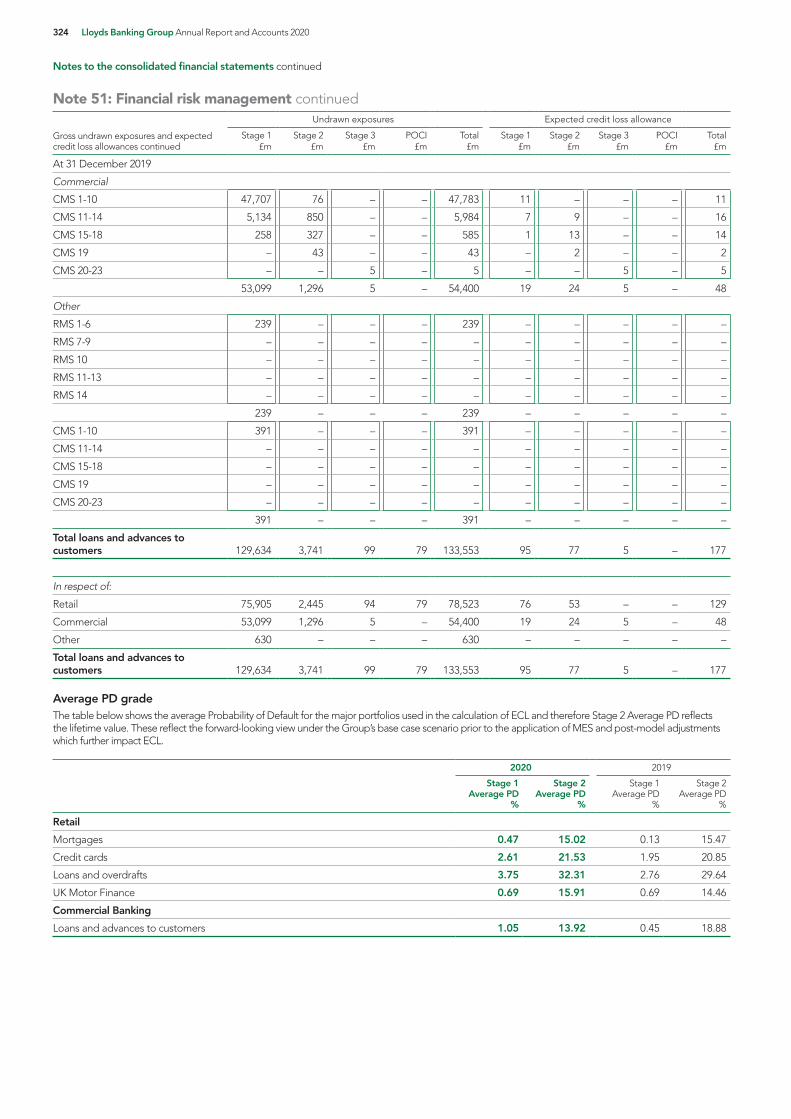
324 Lloyds Banking Group Annual Report and Accounts 2020
Notes to the consolidated financial statements continued
Gross undrawn exposures and expected credit loss allowances continued
Undrawn exposures Expected credit loss allowance
Stage 1 Stage 2 Stage 3 POCI Total Stage 1 Stage 2 Stage 3 POCI Total£m £m £m £m £m £m £m £m £m £m
At 31 December 2019
Commercial
CMS 1-10 47,707 76 — — 47,783 11 — — — 11
CMS 11-14 5,134 850 — — 5,984 7 9 — — 16
CMS 15-18 258 327 — — 585 1 13 — — 14
CMS 19 — 43 — — 43 — 2 — — 2
CMS 20-23 — — 5 — 5 — — 5 — 5
53,099 1,296 5 — 54,400 19 24 5 — 48
Other
RMS 1-6 239 — — — 239 — — — — —
RMS 7-9 — — — — — — — — — —
RMS 10 — — — — — — — — — —
RMS 11-13 — — — — — — — — — —
RMS 14 — — — — — — — — — —
239 — — — 239 — — — — —
CMS 1-10 391 — — — 391 — — — — —
CMS 11-14 — — — — — — — — — —
CMS 15-18 — — — — — — — — — —
CMS 19 — — — — — — — — — —
CMS 20-23 — — — — — — — — — —
391 — — — 391 — — — — —
Total loans and advances to customers 129,634 3,741 99 79 133,553 95 77 5 — 177
In respect of:
Retail 75,905 2,445 94 79 78,523 76 53 — — 129
Commercial 53,099 1,296 5 — 54,400 19 24 5 — 48
Other 630 — — — 630 — — — — —
Total loans and advances to customers 129,634 3,741 99 79 133,553 95 77 5 — 177
Average PD gradeThe table below shows the average Probability of Default for the major portfolios used in the calculation of ECL and therefore Stage 2 Average PD reflects the lifetime value. These reflect the forward-looking view under the Group’s base case scenario prior to the application of MES and post-model adjustments which further impact ECL.
2020 2019
Stage 1 Average PD
Stage 2 Average PD
Stage 1 Average PD
Stage 2 Average PD
% % % %
Retail
Mortgages 0.47 15.02 0.13 15.47
Credit cards 2.61 21.53 1.95 20.85
Loans and overdrafts 3.75 32.31 2.76 29.64
UK Motor Finance 0.69 15.91 0.69 14.46
Commercial Banking
Loans and advances to customers 1.05 13.92 0.45 18.88
Note 51: Financial risk management continued

Strategic rep
ortFinancial results
Governance
Risk manag
ement
Other inform
ationFinancial statem
ents Lloyds Banking Group Annual Report and Accounts 2020 325
Debt securities held at amortised costAn analysis by credit rating of the Group’s debt securities held at amortised cost is provided below:
2020 2019
Investment grade1 Other2 Total
Investment grade1 Other2 Total
£m £m £m £m £m £m
Asset-backed securities:
Mortgage-backed securities 2,046 — 2,046 3,007 — 3,007
Other asset-backed securities 1,593 20 1,613 876 — 876
3,639 20 3,659 3,883 — 3,883
Corporate and other debt securities 1,721 28 1,749 1,650 14 1,664
Gross exposure 5,360 48 5,408 5,533 14 5,547
Allowance for impairment losses (3) (3)
Total debt securities held at amortised cost 5,405 5,544
1 Credit ratings equal to or better than ‘BBB’.
2 Other comprises sub-investment grade (2020: £8 million; 2019: £nil) and not rated (2020: £40 million; 2019: £14 million).
Financial assets at fair value through other comprehensive income (excluding equity shares)An analysis of the Group’s financial assets at fair value through other comprehensive income is included in note 20. The credit quality of the Group’s financial assets at fair value through other comprehensive income (excluding equity shares) is set out below:
2020 2019
Investment grade1 Other2 Total
Investment grade1 Other2 Total
£m £m £m £m £m £m
Debt securities:
Government securities 14,267 19 14,286 13,084 14 13,098
Asset-backed securities:
Mortgage-backed securities — — — 121 — 121
Other asset-backed securities 115 65 180 — 60 60
115 65 180 121 60 181
Corporate and other debt securities 12,786 149 12,935 11,036 15 11,051
Total debt securities 27,168 233 27,401 24,241 89 24,330
Treasury and other bills 36 — 36 535 — 535
Total financial assets at fair value through other comprehensive income 27,204 233 27,437 24,776 89 24,865
1 Credit ratings equal to or better than ‘BBB’.
2 Other comprises sub-investment grade (2020: £92 million; 2019: £89 million) and not rated (2020: £141 million; 2019: £nil).
Note 51: Financial risk management continued

326 Lloyds Banking Group Annual Report and Accounts 2020
Notes to the consolidated financial statements continued
Debt securities, treasury and other bills held at fair value through profit or lossAn analysis of the Group’s financial assets at fair value through profit or loss is included in note 16. Substantially all of the loans and advances to customers and banks recognised at fair value through profit or loss have a good quality rating. The credit quality of the Group’s debt securities, treasury and other bills held at fair value through profit or loss is set out below:
2020 2019
Investment grade1 Other2 Total
Investmentgrade1 Other2 Total
£m £m £m £m £m £m
Debt securities, treasury and other bills held at fair value through profit or loss
Trading assets:
Government securities 7,574 — 7,574 6,791 — 6,791
Asset-backed securities:
Mortgage-backed securities 4 3 7 1 5 6
Other asset-backed securities — 4 4 14 3 17
4 7 11 15 8 23
Corporate and other debt securities 225 21 246 232 1 233
Total held as trading assets 7,803 28 7,831 7,038 9 7,047
Other assets held at fair value through profit or loss:
Government securities 13,048 — 13,048 12,044 19 12,063
Other public sector securities 2,347 7 2,354 2,118 8 2,126
Bank and building society certificates of deposit 4,841 — 4,841 984 — 984
Asset-backed securities:
Mortgage-backed securities 457 3 460 452 10 462
Other asset-backed securities 261 — 261 241 — 241
718 3 721 693 10 703
Corporate and other debt securities 15,743 2,145 17,888 15,932 2,051 17,983
Total debt securities held at fair value through profit or loss 36,697 2,155 38,852 31,771 2,088 33,859
Treasury bills and other bills 18 — 18 19 — 19
Total other assets held at fair value through profit or loss 36,715 2,155 38,870 31,790 2,088 33,878
Total held at fair value through profit or loss 44,518 2,183 46,701 38,828 2,097 40,925
1 Credit ratings equal to or better than ‘BBB’.
2 Other comprises sub-investment grade (2020: £344 million; 2019: £251 million) and not rated (2020: £1,839 million; 2019: £1,846 million).
Credit risk in respect of trading and other financial assets at fair value through profit or loss held within the Group’s unit-linked funds is borne by the policyholders and credit risk in respect of with-profits funds is largely borne by the policyholders. Consequently, the Group has no significant exposure to credit risk for such assets which back those contract liabilities.
Derivative assetsAn analysis of derivative assets is given in note 17. The Group reduces exposure to credit risk by using master netting agreements and by obtaining collateral in the form of cash or highly liquid securities. In respect of the Group’s net credit risk relating to derivative assets of £13,747 million (2019: £11,673 million), cash collateral of £8,715 million (2019: £7,650 million) was held and a further £454 million was due from OECD banks (2019: £274 million).
2020 2019
Investment grade1 Other2 Total
Investment grade1 Other2 Total
£m £m £m £m £m £m
Trading and other 26,782 2,015 28,797 22,991 2,142 25,133
Hedging 810 6 816 1,178 58 1,236
Total derivative financial instruments 27,592 2,021 29,613 24,169 2,200 26,369
1 Credit ratings equal to or better than ‘BBB’.
2 Other comprises sub-investment grade (2020: £1,499 million; 2019: £1,555 million) and not rated (2020: £522 million; 2019: £645 million).
Financial guarantees and irrevocable loan commitmentsFinancial guarantees represent undertakings that the Group will meet a customer’s obligation to third parties if the customer fails to do so. Commitments to extend credit represent unused portions of authorisations to extend credit in the form of loans, guarantees or letters of credit. The Group is theoretically exposed to loss in an amount equal to the total guarantees or unused commitments, however, the likely amount of loss is expected to be significantly less; most commitments to extend credit are contingent upon customers maintaining specific credit standards.
Note 51: Financial risk management continued

Strategic rep
ortFinancial results
Governance
Risk manag
ement
Other inform
ationFinancial statem
ents Lloyds Banking Group Annual Report and Accounts 2020 327
(D) Collateral held as security for financial assetsA general description of collateral held as security in respect of financial instruments is provided on page 161. The Group holds collateral against loans and advances and irrevocable loan commitments; qualitative and, where appropriate, quantitative information is provided in respect of this collateral below. Collateral held as security for financial assets at fair value through profit or loss and for derivative assets is also shown below.
The Group holds collateral in respect of loans and advances to banks and customers as set out below. The Group does not hold collateral against debt securities, comprising asset-backed securities and corporate and other debt securities, which are classified as financial assets held at amortised cost.
Loans and advances to banksThere were reverse repurchase agreements which are accounted for as collateralised loans within loans and advances to banks with a carrying value of £2,686 million (2019: £1,555 million), against which the Group held collateral with a fair value of £2,682 million (2019: £1,516 million).
These transactions were generally conducted under terms that are usual and customary for standard secured lending activities.
Loans and advances to customers
Retail lending
MortgagesAn analysis by loan-to-value ratio of the Group's residential mortgage lending is provided below. The value of collateral used in determining the loan-to-value ratios has been estimated based upon the last actual valuation, adjusted to take into account subsequent movements in house prices, after making allowances for indexation error and dilapidations.
In some circumstances, where the discounted value of the estimated net proceeds from the liquidation of collateral (i.e. net of costs, expected haircuts and anticipated changes in the value of the collateral to the point of sale) is greater than the estimated exposure at default, no credit losses are expected and no ECL allowance is recognised.
Drawn balances Expected credit losses
Stage 1 Stage 2 Stage 3 POCITotal gross Stage 1 Stage 2 Stage 3 POCI
Total gross
£m £m £m £m £m £m £m £m £m £m
At 31 December 2020
Less than 70 per cent 185,548 24,330 1,547 10,051 221,476 42 202 77 88 409
70 per cent to 80 per cent 43,656 3,364 187 1,303 48,510 29 136 46 58 269
80 per cent to 90 per cent 21,508 1,009 74 470 23,061 28 79 31 34 172
90 per cent to 100 per cent 555 126 21 190 892 3 16 11 19 49
Greater than 100 per cent 151 189 30 497 867 2 35 26 62 125
Total 251,418 29,018 1,859 12,511 294,806 104 468 191 261 1,024
Drawn balances Expected credit losses
Stage 1 Stage 2 Stage 3 POCITotal gross Stage 1 Stage 2 Stage 3 POCI
Total gross
£m £m £m £m £m £m £m £m £m £m
At 31 December 2019
Less than 70 per cent 179,566 13,147 1,174 10,728 204,615 6 104 41 44 195
70 per cent to 80 per cent 44,384 2,343 181 1,751 48,659 7 75 29 38 149
80 per cent to 90 per cent 27,056 1,057 86 677 28,876 7 58 25 23 113
90 per cent to 100 per cent 5,663 199 34 207 6,103 2 17 12 10 41
Greater than 100 per cent 374 189 31 351 945 1 27 15 27 70
Total 257,043 16,935 1,506 13,714 289,198 23 281 122 142 568
OtherThe majority of non-mortgage retail lending is unsecured. At 31 December 2020, Stage 3 non-mortgage lending amounted to £538 million, net of an impairment allowance of £492 million (2019: £610 million, net of an impairment allowance of £368 million).
Stage 1 and Stage 2 non-mortgage retail lending amounted to £58,183 million (2019: £54,307 million). Lending decisions are predominantly based on an obligor’s ability to repay from normal business operations rather than reliance on the disposal of any security provided. Collateral values are rigorously assessed at the time of loan origination and are thereafter monitored in accordance with business unit credit policy.
The Group's credit risk disclosures for unimpaired non-mortgage retail lending report assets gross of collateral and therefore disclose the maximum loss exposure. The Group believes that this approach is appropriate.
Commercial lending
Reverse repurchase transactionsAt 31 December 2020 there were reverse repurchase agreements which were accounted for as collateralised loans with a carrying value of £58,643 million (2019: £54,600 million), against which the Group held collateral with a fair value of £59,157 million (2019: £52,982 million), all of which the Group was able to repledge. There were no collateral balances in the form of cash provided in respect of reverse repurchase agreements included in these amounts (2019: £nil). These transactions were generally conducted under terms that are usual and customary for standard secured lending activities.
Note 51: Financial risk management continued

328 Lloyds Banking Group Annual Report and Accounts 2020
Notes to the consolidated financial statements continued
Stage 3 secured lendingThe value of collateral is re-evaluated and its legal soundness re-assessed if there is observable evidence of distress of the borrower; this evaluation is used to determine potential loss allowances and management’s strategy to try to either repair the business or recover the debt.
At 31 December 2020, Stage 3 secured commercial lending amounted to £739 million, net of an impairment allowance of £294 million (2019: £966 million, net of an impairment allowance of £243 million). The fair value of the collateral held in respect of impaired secured commercial lending was £753 million (2019: £744 million). In determining the fair value of collateral, no specific amounts have been attributed to the costs of realisation. For the purposes of determining the total collateral held by the Group in respect of impaired secured commercial lending, the value of collateral for each loan has been limited to the principal amount of the outstanding advance in order to eliminate the effects of any over-collateralisation and to provide a clearer representation of the Group’s exposure.
Stage 3 secured commercial lending and associated collateral relates to lending to property companies and to customers in the financial, business and other services; transport, distribution and hotels; and construction industries.
Stage 1 and Stage 2 secured lendingFor Stage 1 and Stage 2 secured commercial lending, the Group reports assets gross of collateral and therefore discloses the maximum loss exposure. The Group believes that this approach is appropriate as collateral values at origination and during a period of good performance may not be representative of the value of collateral if the obligor enters a distressed state.
Stage 1 and Stage 2 secured commercial lending is predominantly managed on a cash flow basis. On occasion, it may include an assessment of underlying collateral, although, for Stage 3 lending, this will not always involve assessing it on a fair value basis. No aggregated collateral information for the entire unimpaired secured commercial lending portfolio is provided to key management personnel.
Financial assets at fair value through profit or loss (excluding equity shares)Included in financial assets at fair value through profit or loss are reverse repurchase agreements treated as collateralised loans with a carrying value of £12,993 million (2019: £11,269 million). Collateral is held with a fair value of £13,169 million (2019: £11,081 million), all of which the Group is able to repledge. At 31 December 2020, £10,049 million had been repledged (2019: £9,605 million).
In addition, securities held as collateral in the form of stock borrowed amounted to £54,232 million (2019: £32,888 million). Of this amount, £52,887 million (2019: £30,594 million) had been resold or repledged as collateral for the Group’s own transactions.
These transactions were generally conducted under terms that are usual and customary for standard secured lending activities.
Derivative assets, after offsetting of amounts under master netting arrangementsThe Group reduces exposure to credit risk by using master netting agreements and by obtaining collateral in the form of cash or highly liquid securities. In respect of the net derivative assets after offsetting of amounts under master netting arrangements of £13,747 million (2019: £11,673 million), cash collateral of £8,715 million (2019: £7,650 million) was held.
Irrevocable loan commitments and other credit-related contingenciesAt 31 December 2020, the Group held irrevocable loan commitments and other credit-related contingencies of £76,515 million (2019: £66,398 million). Collateral is held as security, in the event that lending is drawn down, on £19,548 million (2019: £12,391 million) of these balances.
Collateral repossessedDuring the year, £125 million of collateral was repossessed (2019: £413 million), consisting primarily of residential property.
In respect of retail portfolios, the Group does not take physical possession of properties or other assets held as collateral and uses external agents to realise the value as soon as practicable, generally at auction, to settle indebtedness. Any surplus funds are returned to the borrower or are otherwise dealt with in accordance with appropriate insolvency regulations. In certain circumstances the Group takes physical possession of assets held as collateral against commercial lending. In such cases, the assets are carried on the Group’s balance sheet and are classified according to the Group’s accounting policies.
Note 51: Financial risk management continued

Strategic rep
ortFinancial results
Governance
Risk manag
ement
Other inform
ationFinancial statem
ents Lloyds Banking Group Annual Report and Accounts 2020 329
(E) Collateral pledged as securityThe Group pledges assets primarily for repurchase agreements and securities lending transactions which are generally conducted under terms that are usual and customary for standard securitised borrowing contracts.
Repurchase transactions
Deposits from banksIncluded in deposits from banks are balances arising from repurchase transactions of £18,767 million (2019: £18,105 million); the fair value of the collateral provided under these agreements at 31 December 2020 was £18,874 million (2019: £17,545 million).
Customer depositsIncluded in customer deposits are balances arising from repurchase transactions of £9,417 million (2019: £9,530 million); the fair value of the collateral provided under these agreements at 31 December 2020 was £8,087 million (2019: £9,221 million).
Financial liabilities at fair value through profit or lossThe fair value of collateral pledged in respect of repurchase transactions, accounted for as secured borrowing, where the secured party is permitted by contract or custom to repledge was £12,608 million (2019: £8,324 million).
Securities lending transactionsThe following on balance sheet financial assets have been lent to counterparties under securities lending transactions:
2020 2019£m £m
Financial assets at fair value through profit or loss 3,224 5,857
Financial assets at fair value through other comprehensive income 894 2,020
4,118 7,877
Securitisations and covered bondsIn addition to the assets detailed above, the Group also holds assets that are encumbered through the Group’s asset-backed conduits and its securitisation and covered bond programmes. Further details of these assets are provided in note 29.
Note 51: Financial risk management continued

330 Lloyds Banking Group Annual Report and Accounts 2020
Notes to the consolidated financial statements continued
Liquidity riskLiquidity risk is defined as the risk that the Group has insufficient financial resources to meet its commitments as they fall due, or can only secure them at excessive cost. Liquidity risk is managed through a series of measures, tests and reports that are primarily based on contractual maturity. The Group carries out monthly stress testing of its liquidity position against a range of scenarios, including those prescribed by the PRA. The Group’s liquidity risk appetite is also calibrated against a number of stressed liquidity metrics.The table below analyses assets and liabilities of the Group into relevant maturity groupings based on the remaining contractual period at the balance sheet date; balances with no fixed maturity are included in the over 5 years category. Certain balances, included in the table below on the basis of their residual maturity, are repayable on demand upon payment of a penalty.
(A) Maturities of assets and liabilities
Up to 1 month
1-3 months
3-6 months
6-9 months
9-12 months
1-2 years
2-5 years
Over 5 years Total
£m £m £m £m £m £m £m £m £m
At 31 December 2020
Assets
Cash and balances at central banks 73,256 1 — — — — — — 73,257
Financial assets at fair value through profit or loss 8,085 8,168 7,446 1,428 1,132 2,420 5,193 137,754 171,626
Derivative financial instruments 1,332 1,028 1,092 504 374 1,068 3,021 21,194 29,613
Loans and advances to banks 5,372 1,391 1,170 217 50 — 2,544 2 10,746
Loans and advances to customers 27,200 23,432 27,322 16,092 12,088 30,342 73,562 288,805 498,843
Debt securities held at amortised cost 118 18 — — — 1,651 1,089 2,529 5,405
Financial assets at fair value through other comprehensive income 51 272 569 349 255 3,423 11,289 11,395 27,603
Other assets 1,810 901 433 153 418 653 1,010 48,798 54,176
Total assets 117,224 35,211 38,032 18,743 14,317 39,557 97,708 510,477 871,269
Liabilities
Deposits from banks 8,590 2,500 384 104 — 278 19,362 247 31,465
Customer deposits 431,235 13,354 3,368 2,328 1,825 3,909 3,341 708 460,068
Derivative financial instruments and financial liabilities at fair value through profit or loss 5,099 8,182 4,666 1,529 324 1,728 4,541 23,890 49,959
Debt securities in issue 6,565 6,489 6,881 4,655 3,435 12,001 29,867 17,504 87,397
Liabilities arising from insurance and investment contracts 1,321 1,763 2,573 2,542 3,159 9,488 27,132 106,534 154,512
Other liabilities 5,644 1,821 453 439 728 648 845 13,616 24,194
Subordinated liabilities — — 587 — — 1,528 4,929 7,217 14,261
Total liabilities 458,454 34,109 18,912 11,597 9,471 29,580 90,017 169,716 821,856
At 31 December 2019
Assets
Cash and balances at central banks 55,128 2 — — — — — — 55,130
Financial assets at fair value through profit or loss 7,195 3,689 3,016 1,710 451 2,801 5,385 135,942 160,189
Derivative financial instruments 583 739 627 404 336 1,294 2,763 19,623 26,369
Loans and advances to banks 4,953 1,017 265 124 91 26 — 3,299 9,775
Loans and advances to customers 35,973 26,036 23,283 12,626 11,425 29,917 74,416 281,312 494,988
Debt securities held as at amortised cost 131 19 — — — 74 3,085 2,235 5,544
Financial assets at fair value through other comprehensive income 111 179 729 102 234 2,929 12,809 7,999 25,092
Other assets 2,224 1,155 533 160 520 568 1,218 50,428 56,806
Total assets 106,298 32,836 28,453 15,126 13,057 37,609 99,676 500,838 833,893
Liabilities
Deposits from banks 4,530 2,715 267 85 55 15,686 433 4,408 28,179
Customer deposits 382,885 12,945 6,716 4,377 3,207 6,742 1,752 2,696 421,320
Derivative financial instruments and financial liabilities at fair value through profit or loss 5,182 6,101 2,579 784 528 1,644 5,238 25,209 47,265
Debt securities in issue 4,070 9,159 7,135 7,418 1,963 13,618 30,897 23,429 97,689
Liabilities arising from insurance and investment contracts 1,213 1,658 2,370 2,348 2,882 9,028 24,870 104,539 148,908
Other liabilities 4,541 1,914 772 893 1,682 898 906 13,990 25,596
Subordinated liabilities — 1,339 96 1,137 108 575 4,105 9,770 17,130
Total liabilities 402,421 35,831 19,935 17,042 10,425 48,191 68,201 184,041 786,087
Note 51: Financial risk management continued

Strategic rep
ortFinancial results
Governance
Risk manag
ement
Other inform
ationFinancial statem
ents Lloyds Banking Group Annual Report and Accounts 2020 331
The above tables are provided on a contractual basis. The Group’s assets and liabilities may be repaid or otherwise mature earlier or later than implied by their contractual terms and readers are, therefore, advised to use caution when using this data to evaluate the Group’s liquidity position. In particular, amounts in respect of customer deposits are usually contractually payable on demand or at short notice. However, in practice, these deposits are not usually withdrawn on their contractual maturity.
The table below analyses financial instrument liabilities of the Group, excluding those arising from insurance and participating investment contracts, on an undiscounted future cash flow basis according to contractual maturity, into relevant maturity groupings based on the remaining period at the balance sheet date; balances with no fixed maturity are included in the over 5 years category.
Up to 1 month
1-3 months
3-12 months
1-5 years
Over 5 years Total
£m £m £m £m £m £m
At 31 December 2020
Deposits from banks 8,584 2,429 550 23,451 495 35,509
Customer deposits 428,634 13,659 8,387 8,049 1,528 460,257
Financial liabilities at fair value through profit or loss 3,904 7,117 5,096 2,139 10,513 28,769
Debt securities in issue 6,339 6,599 16,612 45,666 19,583 94,799
Liabilities arising from non-participating investment contracts 38,450 — — — — 38,450
Other liabilities (Lease liabilities) 10 53 182 663 857 1,765
Subordinated liabilities 105 66 1,165 8,303 11,829 21,468
Total non-derivative financial liabilities 486,026 29,923 31,992 88,271 44,805 681,017
Derivative financial liabilities:
Gross settled derivatives – outflows 45,151 36,737 32,437 50,646 20,556 185,527
Gross settled derivatives – inflows (42,851) (34,519) (31,248) (49,866) (21,393) (179,877)
Gross settled derivatives – net flows 2,300 2,218 1,189 780 (837) 5,650
Net settled derivative liabilities 16,132 98 243 933 2,428 19,834
Total derivative financial liabilities 18,432 2,316 1,432 1,713 1,591 25,484
At 31 December 2019
Deposits from banks 5,009 2,564 762 20,066 317 28,718
Customer deposits 385,864 14,433 14,327 10,661 1,393 426,678
Financial liabilities at fair value through profit or loss 4,370 5,543 2,255 2,690 14,653 29,511
Debt securities in issue 5,335 9,858 19,205 54,638 36,321 125,357
Liabilities arising from non-participating investment contracts 37,459 — — — — 37,459
Other liabilities (Lease liabilities) 2 61 190 803 946 2,002
Subordinated liabilities 942 1,462 1,918 7,837 14,857 27,016
Total non-derivative financial liabilities 438,981 33,921 38,657 96,695 68,487 676,741
Derivative financial liabilities:
Gross settled derivatives – outflows 43,118 44,379 34,012 36,012 18,238 175,759
Gross settled derivatives – inflows (40,829) (42,954) (32,966) (34,758) (17,753) (169,260)
Gross settled derivatives – net flows 2,289 1,425 1,046 1,254 485 6,499
Net settled derivative liabilities 23,648 48 122 700 2,201 26,719
Total derivative financial liabilities 25,937 1,473 1,168 1,954 2,686 33,218
The majority of the Group’s non-participating investment contract liabilities are unit-linked. These unit-linked products are invested in accordance with unit fund mandates. Clauses are included in policyholder contracts to permit the deferral of sales, where necessary, so that linked assets can be realised without being a forced seller.
The principal amount for undated subordinated liabilities with no redemption option is included within the over five years column; interest of approximately £24 million (2019: £29 million) per annum which is payable in respect of those instruments for as long as they remain in issue is not included beyond five years.
Further information on the Group’s liquidity exposures is provided on pages 183 to 187.
Liabilities arising from insurance and participating investment contracts are analysed on a behavioural basis, as permitted by IFRS 4, as follows:
Up to 1 month
1-3 months
3-12 months
1-5 years
Over 5 years Total
£m £m £m £m £m £m
At 31 December 2020 1,476 1,323 5,879 27,468 79,914 116,060
At 31 December 2019 1,340 1,240 5,378 25,349 78,142 111,449
For insurance and participating investment contracts which are neither unit-linked nor in the Group’s with-profit funds, in particular annuity liabilities, the aim is to invest in assets such that the cash flows on investments match those on the projected future liabilities.
Note 51: Financial risk management continued

332 Lloyds Banking Group Annual Report and Accounts 2020
Notes to the consolidated financial statements continued
Note 52: Consolidated cash flow statement
(A) Change in operating assets
2020 2019 2018£m £m £m
Change in financial assets held at amortised cost (7,634) (12,423) (27,038)
Change in derivative financial instruments and financial assets at fair value through profit or loss (14,315) 3,887 22,046
Change in other operating assets 3,299 (2,513) 520
Change in operating assets (18,650) (11,049) (4,472)
(B) Change in operating liabilities
2020 2019 2018£m £m £m
Change in deposits from banks 3,287 (2,140) 515
Change in customer deposits 38,805 3,248 (322)
Change in debt securities in issue (10,142) 6,631 18,579
Change in derivative financial instruments and financial liabilities at fair value through profit or loss 2,619 (5,078) (24,606)
Change in investment contract liabilities 993 2,625 (1,594)
Change in other operating liabilities1 175 (1,644) (1,245)
Change in operating liabilities 35,737 3,642 (8,673)
1 Includes a decrease of £172 million (2019: increase of £82 million; 2018: increase of £27 million) in respect of lease liabilities.
The following tables set out the amounts and residual maturities of the Group’s off balance sheet contingent liabilities, commitments and guarantees.
Up to 1 month
1-3 months
3-6 months
6-9 months
9-12 months
1-3 years
3-5 years
Over 5 years Total
£m £m £m £m £m £m £m £m £m
At 31 December 2020
Acceptances and endorsements 80 10 41 — — — — — 131
Other contingent liabilities 327 551 164 175 212 340 70 583 2,422
Total contingent liabilities 407 561 205 175 212 340 70 583 2,553
Lending commitments and guarantees 72,916 4,890 22,288 3,981 5,374 23,048 11,411 3,839 147,747
Other commitments — — — — 4 44 16 64 128
Total commitments and guarantees 72,916 4,890 22,288 3,981 5,378 23,092 11,427 3,903 147,875
Total contingents, commitments and guarantees 73,323 5,451 22,493 4,156 5,590 23,432 11,497 4,486 150,428
At 31 December 2019
Acceptances and endorsements 25 24 4 — 21 — — — 74
Other contingent liabilities 381 409 387 177 207 475 101 683 2,820
Total contingent liabilities 406 433 391 177 228 475 101 683 2,894
Lending commitments and guarantees 68,638 2,682 15,297 4,637 7,367 17,365 14,114 3,264 133,364
Other commitments — 1 16 5 — 72 43 52 189
Total commitments and guarantees 68,638 2,683 15,313 4,642 7,367 17,437 14,157 3,316 133,553
Total contingents, commitments and guarantees 69,044 3,116 15,704 4,819 7,595 17,912 14,258 3,999 136,447
Note 51: Financial risk management continued

Strategic rep
ortFinancial results
Governance
Risk manag
ement
Other inform
ationFinancial statem
ents Lloyds Banking Group Annual Report and Accounts 2020 333
(C) Non-cash and other items
2020 2019 2018£m £m £m
Depreciation and amortisation 2,732 2,660 2,405
Revaluation of investment properties 209 108 (139)
Allowance for loan losses 3,856 1,312 1,024
Write-off of allowance for loan losses, net of recoveries (1,377) (1,458) (1,025)
Impairment charge relating to undrawn balances 289 (15) (73)
Impairment of financial assets at fair value through other comprehensive income 5 (1) (14)
Change in insurance contract liabilities 4,554 12,593 (4,547)
Payment protection insurance provision 85 2,450 750
Other regulatory provisions 379 445 600
Other provision movements 85 (165) (518)
Net charge in respect of defined benefit schemes 247 245 405
Unwind of discount on impairment allowances (47) (53) (44)
Foreign exchange impact on balance sheet1 865 533 191
Interest expense on subordinated liabilities 1,080 1,228 1,388
Net gain on sale of financial assets at fair value through other comprehensive income (149) (196) (275)
Hedging valuation adjustments on subordinated debt 280 440 (429)
Value of employee services 122 236 260
Transactions in own shares 293 (3) 40
Accretion of discounts and amortisation of premiums and issue costs (82) 445 1,947
Share of post-tax results of associates and joint ventures 13 (6) (9)
Gain on establishment of joint venture — (244) —
Transfers to income statement from reserves (496) (608) (701)
Profit on disposal of tangible fixed assets (81) (32) (104)
Other non-cash items 9 (35) (34)
Total non-cash items 12,871 19,879 1,098
Contributions to defined benefit schemes (1,153) (1,069) (868)
Payments in respect of payment protection insurance provision (1,703) (2,461) (2,104)
Payments in respect of other regulatory provisions (538) (778) (1,032)
Other 117 2 14
Total other items (3,277) (4,306) (3,990)
Non-cash and other items 9,594 15,573 (2,892)
1 When considering the movement on each line of the balance sheet, the impact of foreign exchange rate movements is removed in order to show the underlying cash impact.
(D) Analysis of cash and cash equivalents as shown in the balance sheet
2020 2019 2018£m £m £m
Cash and balances at central banks 73,257 55,130 54,663
Less: mandatory reserve deposits1 (4,553) (3,289) (2,553)
68,704 51,841 52,110
Loans and advances to banks 10,746 9,775 6,283
Less: amounts with a maturity of three months or more (3,983) (3,805) (3,169)
6,763 5,970 3,114
Total cash and cash equivalents 75,467 57,811 55,224
1 Mandatory reserve deposits are held with local central banks in accordance with statutory requirements; these deposits are not available to finance the Group's day-to-day operations.
Included within cash and cash equivalents at 31 December 2020 is £84 million (2019: £49 million; 2018: £40 million) held within the Group's long-term insurance and investments businesses, which is not immediately available for use in the business.
Note 52: Consolidated cash flow statement continued

334 Lloyds Banking Group Annual Report and Accounts 2020
Notes to the consolidated financial statements continued
Note 53: Future accounting developmentsThe following pronouncements are not applicable for the year ending 31 December 2020 and have not been applied in preparing these financial statements. Save as disclosed below, the impact of these accounting changes is still being assessed by the Group and reliable estimates cannot be made at this stage.
With the exception of IFRS 17 Insurance Contracts and certain other minor amendments, as at 23 February 2021 these pronouncements have been endorsed for use in the United Kingdom.
IFRS 17 Insurance ContractsIFRS 17 replaces IFRS 4 Insurance Contracts and is effective for annual periods beginning on or after 1 January 2023.
IFRS 17 requires insurance contracts and participating investment contracts to be measured on the balance sheet as the total of the fulfilment cash flows and the contractual service margin. Changes to estimates of future cash flows from one reporting date to another are recognised either as an amount in profit or loss or as an adjustment to the expected profit for providing insurance coverage, depending on the type of change and the reason for it. The effects of some changes in discount rates can either be recognised in profit or loss or in other comprehensive income as an accounting policy choice. The risk adjustment is released to profit and loss as an insurer’s risk reduces. Profits which are currently recognised through a value in-force asset, will no longer be recognised at inception of an insurance contract. Instead, the expected profit for providing insurance coverage is recognised in profit or loss over time as the insurance coverage is provided. The standard will have a significant impact on the accounting for the insurance and participating investment contracts issued by the Group.
The Group's IFRS 17 project is progressing to plan. Work has focused on interpreting the requirements of the standard, developing methodologies and accounting policies, and assessing the changes required to reporting and other systems. The development of the Group's data warehousing and actuarial liability calculation processes required for IFRS 17 reporting is progressing.
Interest Rate Benchmark ReformThe IASB’s Phase 2 amendments in response to issues arising from the replacement of interest rate benchmarks in a number of jurisdictions are effective for annual periods beginning on or after 1 January 2021.
Under these amendments, an immediate gain or loss is not recognised in the income statement where the contractual cash flows of a financial asset or financial liability are amended as a direct consequence of the rate reform and the revised contractual terms are economically equivalent to the previous terms. In addition, hedge accounting is continued for relationships that are directly affected by the reform.
These amendments are not expected to have a significant impact on the Group.
Minor amendments to other accounting standardsThe IASB has issued a number of minor amendments to IFRSs effective 1 January 2021 and in later years (including IFRS 9 Financial Instruments and IAS 37 Provisions, Contingent Liabilities and Contingent Assets). These amendments are not expected to have a significant impact on the Group.
(E) Acquisition of group undertakings and businesses
2020 2019 2018£m £m £m
Net assets acquired:
Financial assets at fair value through profit or loss — 7,350 —
Assets arising from contracts held with reinsurers — 13,616 —
Intangible assets — — 21
Other assets — 29 6
Liabilities arising from non-participating investment contracts — (20,981) —
Other liabilities — (8) (1)
Goodwill arising on acquisition — 14 —
Cash consideration — 20 26
Less: cash and cash equivalents acquired — — —
Net cash outflow arising from acquisition of subsidiaries and businesses — 20 26
Acquisition of and additional investment in joint ventures (3) 1 23
Net cash (inflow) outflow from acquisitions in the year (3) 21 49
Note 52: Consolidated cash flow statement continued

Strategic rep
ortFinancial results
Governance
Risk manag
ement
Other inform
ationFinancial statem
ents Lloyds Banking Group Annual Report and Accounts 2020 335
Parent company balance sheetat 31 December
2020 2019Note £ million £ million
Assets
Non-current assets:
Investment in subsidiaries 10 49,903 48,597
Loans to subsidiaries 10 20,107 14,660
Deferred tax asset 10 —
70,020 63,257
Current assets:
Derivative financial instruments 1,832 760
Financial assets at fair value through profit or loss 2 14,362 12,516
Other assets 982 983
Amounts due from subsidiaries 3 27 27
Cash and cash equivalents 7 29
Current tax recoverable 16 1
17,226 14,316
Total assets 87,246 77,573
Equity and liabilities
Capital and reserves:
Share capital 4 7,084 7,005
Share premium account 4 17,863 17,751
Merger reserve 5 7,420 7,420
Capital redemption reserve 5 4,462 4,462
Retained profits1 6 4,869 3,950
Shareholders’ equity 41,698 40,588
Other equity instruments 4 5,906 5,906
Total equity 47,604 46,494
Non-current liabilities:
Debt securities in issue 7 20,545 20,018
Subordinated liabilities 8 7,760 5,961
Deferred tax liabilities — 2
28,305 25,981
Current liabilities:
Derivative financial instruments 803 438
Financial liabilities at fair value through profit or loss 9 8,635 3,464
Other liabilities 1,899 1,196
11,337 5,098
Total liabilities 39,642 31,079
Total equity and liabilities 87,246 77,573
1 The parent company recorded a profit after tax for the year of £1,302 million (2019: £5,415 million).
The accompanying notes are an integral part of the parent company financial statements.
The directors approved the parent company financial statements on 23 February 2021.
Robin Budenberg António Horta-Osório William ChalmersChair Group Chief Executive Chief Financial Officer

336 Lloyds Banking Group Annual Report and Accounts 2020
Parent company statement of changes in equityfor the year ended 31 December
Attributable to ordinary shareholders
Share capital and
premiumMerger reserve
Capital redemption
reserveRetained
profits Total
Other equity
instrumentsTotal
equity
£ million £ million £ million £ million £ million £ million £ million
At 1 January 2018 24,831 7,423 4,115 1,498 37,867 5,355 43,222
Total comprehensive income1 — — — 3,671 3,671 433 4,104
Dividends — — — (2,240) (2,240) — (2,240)
Distributions on other equity instruments — — — — — (433) (433)
Issue of ordinary shares 162 — — — 162 — 162
Share buyback (158) — 158 (1,005) (1,005) — (1,005)
Issue of other equity instruments — — — (7) (7) 1,136 1,129
Movement in treasury shares — — — (74) (74) — (74)
Value of employee services:
Share option schemes — — — 53 53 — 53
Other employee award schemes — — — 207 207 — 207
At 31 December 2018 24,835 7,423 4,273 2,103 38,634 6,491 45,125
Total comprehensive income1 — — — 4,949 4,949 466 5,415
Dividends — — — (2,312) (2,312) — (2,312)
Distributions on other equity instruments — — — — — (466) (466)
Issue of ordinary shares 107 — — — 107 — 107
Share buyback (189) — 189 (1,095) (1,095) — (1,095)
Redemption of preference shares 3 (3) — — — — —
Issue of other equity instruments — — — (5) (5) 896 891
Redemption of other equity instruments — — — — — (1,481) (1,481)
Movement in treasury shares — — — 74 74 — 74
Value of employee services:
Share option schemes — — — 71 71 — 71
Other employee award schemes — — — 165 165 — 165
At 31 December 2019 24,756 7,420 4,462 3,950 40,588 5,906 46,494
Total comprehensive income1 — — — 849 849 453 1,302
Distributions on other equity instruments — — — — — (453) (453)
Issue of ordinary shares 191 — — — 191 — 191
Movement in treasury shares — — — (52) (52) — (52)
Value of employee services:
Share option schemes — — — 48 48 — 48
Other employee award schemes — — — 74 74 — 74
At 31 December 2020 24,947 7,420 4,462 4,869 41,698 5,906 47,604
1 No statement of comprehensive income has been shown for the parent company, as permitted by section 408 of the Companies Act 2006. Total comprehensive income comprises only the profit for the year.
The accompanying notes are an integral part of the parent company financial statements.

Strategic rep
ortFinancial results
Governance
Risk manag
ement
Other inform
ationFinancial statem
ents Lloyds Banking Group Annual Report and Accounts 2020 337
Parent company cash flow statementfor the year ended 31 December
2020 2019 2018£ million £ million £ million
Profit before tax 1,257 5,439 4,102
Fair value and exchange adjustments and other non-cash items (512) (166) (715)
Change in other assets (1,815) (11,975) (572)
Change in other liabilities and other items 6,401 3,151 7,538
Dividends received (1,135) (5,150) (4,000)
Distributions on other equity instruments received (492) (366) (324)
Tax received — 70 660
Net cash provided by (used in) operating activities 3,704 (8,997) 6,689
Cash flows from investing activities
Return of capital contribution 4 5 9
Dividends received 1,135 5,150 4,000
Distributions on other equity instruments received 492 366 324
Acquisitions of and capital injections to subsidiaries (1,170) (1,648) (12,753)
Return of capital by subsidiaries — — 11,114
Amounts advanced to subsidiaries (5,827) (1,812) (21,577)
Repayment of loans to subsidiaries 2,004 11,257 12,602
Interest received on loans to subsidiaries 261 395 370
Net cash (used in) provided by investing activities (3,101) 13,713 (5,911)
Cash flows from financing activities
Dividends paid to ordinary shareholders — (2,312) (2,240)
Distributions on other equity instruments (453) (466) (433)
Interest paid on subordinated liabilities (316) (314) (275)
Proceeds from issue of subordinated liabilities — — 1,729
Proceeds from issue of other equity instruments — 891 1,129
Proceeds from issue of ordinary shares 144 36 102
Share buyback — (1,095) (1,005)
Repayment of subordinated liabilities — (3) —
Redemptions of other equity instruments — (1,481) —
Net cash used in financing activities (625) (4,744) (993)
Change in cash and cash equivalents (22) (28) (215)
Cash and cash equivalents at beginning of year 29 57 272
Cash and cash equivalents at end of year 7 29 57
The accompanying notes are an integral part of the parent company financial statements.

338 Lloyds Banking Group Annual Report and Accounts 2020
Note 5: Other reservesThe merger reserve comprises the premium on shares issued on 13 January 2009 under the placing and open offer and shares issued on 16 January 2009 on the acquisition of HBOS plc, offset by adjustments on the redemption of preference shares. Substantially all of the Company’s merger reserve is available for distribution.
Movements in the merger reserve were as follows:
2020 2019 2018£m £m £m
At 1 January 7,420 7,423 7,423
Redemption of preference shares1 — (3) —
At 31 December 7,420 7,420 7,423
1 During the year ended 31 December 2019, the Company redeemed all of its outstanding 6.3673% Non-cumulative Fixed to Floating Rate Preference Shares at their combined sterling par value of £3 million. These preference shares had been accounted for as subordinated liabilities. On redemption an amount of £3 million was transferred from the distributable merger reserve to the share premium account.
The capital redemption reserve represents transfers from the merger reserve in accordance with companies’ legislation and amounts transferred from share capital following the cancellation of shares.
Movements in the capital redemption reserve were as follows:
2020 2019 2018£m £m £m
At 1 January 4,462 4,273 4,115
Shares cancelled under share buyback programmes — 189 158
At 31 December 4,462 4,462 4,273
Note 4: Share capital, share premium account and other equity instrumentsDetails of the Company’s share capital, share premium account and other equity instruments are as set out in notes 38, 39 and 42 to the consolidated financial statements.
Note 3: Amounts due from subsidiariesThese comprise short-term lending to subsidiaries, repayable on demand. As required by IFRS 9, the Company has established an allowance for impairment losses for amounts due from its subsidiaries (31 December 2020: £3 million; 31 December 2019: £1 million) based on the probability of its subsidiaries defaulting on the amounts payable in the next 12 months. The carrying value of the amounts owed by subsidiaries is a reasonable approximation to fair value.
Note 2: Financial assets at fair value through profit or loss
2020 2019£m £m
Debt securities 14,362 12,516
The assets held at fair value through profit or loss represent holdings of debt securities issued by subsidiary companies. The contractual terms of such instruments contain certain write-down and conversion features, and so are not deemed to satisfy the solely payments of principal and interest test.
Note 1: Basis of preparation and accounting policiesThe financial statements of Lloyds Banking Group plc comply with international accounting standards in conformity with the requirements of the Companies Act 2006. The financial statements have been prepared in accordance with International Financial Reporting Standards (IFRS). IFRS comprises accounting standards prefixed IFRS issued by the International Accounting Standards Board (IASB) and those prefixed IAS issued by the IASB’s predecessor body as well as interpretations issued by the IFRS Interpretations Committee and its predecessor body. On adoption of IFRS 9 in 2018, the Group elected to continue applying hedge accounting under IAS 39.
The financial information has been prepared under the historical cost convention, as modified by the revaluation of certain financial assets and liabilities at fair value through profit or loss and all derivative contracts.
The accounting policies of the Company are the same as those of the Group which are set out in note 2 to the consolidated financial statements. Investments in subsidiaries are carried at historical cost, less any provisions for impairment.
Fees payable to the Company’s auditors by the Group are set out in note 12 to the consolidated financial statements.
Notes to the parent company financial statementsfor the year ended 31 December

Strategic rep
ortFinancial results
Governance
Risk manag
ement
Other inform
ationFinancial statem
ents Lloyds Banking Group Annual Report and Accounts 2020 339
Note 9: Financial liabilities at fair value through profit or lossFinancial liabilities designated at fair value through profit or loss represent debt securities in issue which are accounted for at fair value to significantly reduce an accounting mismatch. The changes in the credit risk of these liabilities are linked to the changes in credit risk on corresponding assets that the Company holds at fair value through profit or loss, representing debt securities issued by subsidiaries. Given the economic relationship between these assets and liabilities, the Company presents changes in the credit risk of its liabilities in profit or loss in order to avoid creating or enlarging an accounting mismatch.
The amount contractually payable on maturity of the debt securities held at fair value through profit or loss at 31 December 2020 was £8,060 million, which was £575 million lower than the balance sheet carrying value (2019: £3,393 million which was £71 million lower than the balance sheet carrying value). At 31 December 2020 there was a cumulative £541 million increase in the fair value of these liabilities attributable to changes in credit risk (2019: increase of £101 million), of which £440 million arose in 2020 and £101 million arose in 2019; this is determined by reference to the quoted credit spreads of the Company.
Note 8: Subordinated liabilitiesThese liabilities will, in the event of the winding-up of the issuer, be subordinated to the claims of depositors and all other creditors of the issuer. Any repayments of subordinated liabilities require the consent of the Prudential Regulation Authority.
Preference shares
Undated subordinated
liabilities
Dated subordinated
liabilities Total£m £m £m £m
At 1 January 2019 554 10 5,479 6,043
Redemption:
6.3673% Non-cumulative Fixed to Floating Rate Preference Shares callable 2019 (3) — — (3)
Foreign exchange and other movements 91 — (170) (79)
At 31 December 2019 642 10 5,309 5,961
Issued in the year:
4.50% Fixed Rate Step-up Subordinated Notes due 2030 (€309 million) — — 280 280
2.707% Fixed Rate Dated Subordinated Reset Notes due 2035 (£1,309 million) — — 1,309 1,309
Foreign exchange and other movements 81 — 129 210
At 31 December 2020 723 10 7,027 7,760
1 The redemption in 2019 resulted in cash outflows of £3 million.
Note 7: Debt securities in issueThese comprise notes issued by the Company in a number of currencies, although predominantly Euros and US dollars, with maturity dates ranging up to 2038.
Note 6: Retained profits
2020 2019 2018£m £m £m
At 1 January 3,950 2,103 1,498
Profit for the year 849 4,949 3,671
Dividends paid1 — (2,312) (2,240)
Issue costs of other equity instruments (net of tax) — (5) (7)
Share buyback programmes — (1,095) (1,005)
Movement in treasury shares (52) 74 (74)
Value of employee services:
Share option schemes 48 71 53
Other employee award schemes 74 165 207
At 31 December 4,869 3,950 2,103
1 Details of the Company’s dividends are as set out in note 43 to the consolidated financial statements.

340 Lloyds Banking Group Annual Report and Accounts 2020
Notes to the parent company financial statements continued
Note 10: Related party transactionsKey management personnelThe key management personnel of the Group and the Company are the same. The relevant disclosures are given in note 45 to the consolidated financial statements.
The Company has no employees (2019: nil).
As discussed in note 2 to the consolidated financial statements, the Group provides share-based compensation to employees through a number of schemes; these are all in relation to shares in the Company and the costs of providing those benefits are treated as capital contributions to the employing companies in the Group.
Investment in subsidiaries
Ordinary share capital Other capital instruments Total
2020 2019 2020 2019 2020 2019£m £m £m £m £m £m
At 1 January 41,940 41,716 6,657 5,009 48,597 46,725
Additions and capital injections — — 1,170 1,648 1,170 1,648
Capital contributions 140 229 — — 140 229
Return of capital contributions (4) (5) — — (4) (5)
At 31 December 42,076 41,940 7,827 6,657 49,903 48,597
Details of the subsidiaries and related undertakings are given on pages 349 to 354 and are incorporated by reference.
Certain subsidiary companies currently have insufficient distributable reserves to make dividend payments, however, there were no further significant restrictions on any of the Company’s subsidiaries in paying dividends or repaying loans and advances. All regulated banking and insurance subsidiaries are required to maintain capital at levels agreed with the regulators; this may impact those subsidiaries’ ability to make distributions.
Loans to subsidiaries
2020 2019£m £m
At 1 January 14,660 24,211
Exchange and other adjustments 35 (106)
New advances 7,416 1,812
Repayments (2,004) (11,257)
At 31 December 20,107 14,660
In addition the Company carries out banking activities through its subsidiary, Lloyds Bank plc. At 31 December 2020, the Company held deposits of £7 million with Lloyds Bank plc (2019: £29 million). Given the volume of transactions flowing through the account, it is not meaningful to provide gross inflow and outflow information. Included within other liabilities is £805 million (2019: £105 million) due to subsidiary undertakings. In addition, at 31 December 2020 the Company had interest rate and currency swaps with Lloyds Bank plc and Lloyds Bank Corporate Markets plc with an aggregate notional principal amount of £49,388 million and a net positive fair value of £1,029 million (2019: notional principal amount of £37,555 million and a net positive fair value of £338 million). Of this amount an aggregate notional principal amount of £19,909 million and a net positive fair value of £1,418 million (2019: notional principal amount of £21,164 million and a net positive fair value of £707 million) were designated as fair value hedges to manage the Company’s issuance of subordinated liabilities.
GuaranteesThe Company guarantees certain of its subsidiaries’ liabilities to the Bank of England.
Other related party transactionsRelated party information in respect of other related party transactions is given in note 45 to the consolidated financial statements.

Strategic rep
ortFinancial results
Governance
Risk manag
ement
Other inform
ationFinancial statem
ents Lloyds Banking Group Annual Report and Accounts 2020 341
Note 11: Financial instrumentsMeasurement basis of financial assets and liabilitiesThe accounting policies in note 2 to the consolidated financial statements describe how different classes of financial instruments are measured, and how income and expenses, including fair value gains and losses, are recognised. The following table analyses the carrying amounts of the Company’s financial assets and liabilities by category and by balance sheet heading.
Derivatives designated as hedging
instruments
Mandatorily held at fair value through profit or loss
Designated at fair value
through profit or loss
Held at amortised
costHeld for trading Other Total
£m £m £m £m £m £m
At 31 December 2020
Financial assets
Cash and cash equivalents — — — — 7 7
Derivative financial instruments 1,449 383 — — — 1,832
Financial assets at fair value through profit or loss — — 14,362 — — 14,362
Loans to subsidiaries — — — — 20,107 20,107
Amounts due from subsidiaries — — — — 27 27
Total financial assets 1,449 383 14,362 — 20,141 36,335
Financial liabilities
Financial liabilities at fair value through profit or loss — — — 8,635 — 8,635
Derivative financial instruments 31 772 — — — 803
Debt securities in issue — — — — 20,545 20,545
Subordinated liabilities — — — — 7,760 7,760
Total financial liabilities 31 772 — 8,635 28,305 37,743
At 31 December 2019
Financial assets
Cash and cash equivalents — — — — 29 29
Derivative financial instruments 706 54 — — — 760
Financial assets at fair value through profit or loss — — 12,516 — — 12,516
Loans to subsidiaries — — — — 14,660 14,660
Amounts due from subsidiaries — — — — 27 27
Total financial assets 706 54 12,516 — 14,716 27,992
Financial liabilities
Financial liabilities at fair value through profit or loss — — — 3,464 — 3,464
Derivative financial instruments 43 395 — — — 438
Debt securities in issue — — — — 20,018 20,018
Subordinated liabilities — — — — 5,961 5,961
Total financial liabilities 43 395 — 3,464 25,979 29,881
Note 48 to the consolidated financial statements outlines the valuation hierarchy into which financial instruments measured at fair value are categorised.
Interest rate risk and currency riskThe Company is exposed to interest rate risk and currency risk on its debt securities in issue and its subordinated debt.
As discussed in note 10, the Company has entered into interest rate and currency swaps with its subsidiaries, Lloyds Bank plc and Lloyds Bank Corporate Markets plc, to manage these risks.
Credit riskThe majority of the Company’s credit risk arises from amounts due from its wholly owned subsidiaries, Lloyds Bank plc, and subsidiaries of that company.
Liquidity riskThe table below analyses financial instrument liabilities of the Company, on an undiscounted future cash flow basis according to contractual maturity, into relevant maturity groupings based on the remaining period at the balance sheet date; balances with no fixed maturity are included in the over 5 years category.

342 Lloyds Banking Group Annual Report and Accounts 2020
Notes to the parent company financial statements continued
Note 12: Other informationLloyds Banking Group plc was incorporated as a public limited company and registered in Scotland under the UK Companies Act 1985 on 21 October 1985 with the registered number 95000. Lloyds Banking Group plc’s registered office is The Mound, Edinburgh EH1 1YZ, Scotland, and its principal executive offices in the UK are located at 25 Gresham Street, London EC2V 7HN.
Up to 1 month
1-3 months
3-12 months
1-5 years
Over 5 years Total
£m £m £m £m £m £m
At 31 December 2020
Financial liabilities at fair value through profit or loss 35 39 127 8,614 — 8,815
Debt securities in issue 55 91 2,333 13,051 7,299 22,829
Subordinated liabilities 24 40 282 4,055 8,423 12,824
Total financial instrument liabilities 114 170 2,742 25,720 15,722 44,468
At 31 December 2019
Financial liabilities at fair value through profit or loss 30 31 41 3,554 — 3,656
Debt securities in issue 55 126 415 16,679 9,008 26,283
Subordinated liabilities 25 28 252 2,660 8,112 11,077
Total financial instrument liabilities 110 185 708 22,893 17,120 41,016
The principal amount for undated subordinated liabilities with no redemption option is included within the over 5 years column; interest of approximately £1 million (2019: £1 million) per annum which is payable in respect of those instruments for as long as they remain in issue is not included beyond 5 years.
Fair values of financial assets and liabilitiesThe valuation techniques for the Company’s financial instruments are as discussed in note 48 to the consolidated financial statements.
Valuation hierarchyThe table below analyses the assets and liabilities of the Company. With the exception of derivatives all assets and liabilities are held at amortised cost. They are categorised into levels 1 to 3 based on the degree to which their fair value is observable. No assets or liabilities were categorised as level 1 (2019: none).
Fair value of financial assets and liabilities
2020 2019
Carrying value
Fair value
Valuation hierarchy Carrying value
Fair value
Valuation hierarchy
Level 2 Level 3 Level 2 Level 3£m £m £m £m £m £m £m £m
Derivative financial instruments 1,832 1,832 1,832 — 760 760 760 —
Financial assets at fair value through profit or loss 14,362 14,362 14,362 — 12,516 12,516 12,516 —
Loans to subsidiaries 20,107 20,107 20,107 — 14,660 14,660 14,660 —
Amounts due from subsidiaries 27 27 27 — 27 27 27 —
Total financial assets 36,328 36,328 36,328 — 27,963 27,963 27,963 —
Financial liabilities at fair value through profit or loss 8,635 8,635 8,635 — 3,464 3,464 3,464 —
Derivative financial instruments 803 803 803 — 438 438 438 —
Debt securities in issue 20,545 21,887 21,887 — 20,018 20,621 20,621 —
Subordinated liabilities 7,760 8,966 8,966 — 5,961 7,204 7,204 —
Total financial liabilities 37,743 40,291 40,291 — 29,881 31,727 31,727 —
The carrying amount of cash and cash equivalents (2020: £7 million; 2019: £29 million) is a reasonable approximation of fair value.
Note 11: Financial instruments continued

Strategic rep
ortFinancial results
Governance
Risk manag
ement
Financial statements
Other inform
ation Lloyds Banking Group Annual Report and Accounts 2020 343
2020 CAPTURED BY LLOYDS BANKING GROUP COLLEAGUES
Other informationShareholder information 344Five year financial summary 346Forward-looking statements 347Abbreviations 348Alternative performance measures 348Subsidiaries and related undertakings 349
Jonathan Rookes Steven Cachia Laura Millington
Siobhan Devlin Karl Wilson Connie Garrad Joanna Spackman
Paul Coombes Matthew Perrins Sarah Gill Helen Nelson

344 Lloyds Banking Group Annual Report and Accounts 2020
Annual general meeting (AGM)The health and wellbeing of the Group's shareholders, customers and employees are of paramount importance and the Board is constantly reviewing the impacts of the COVID-19 pandemic. The Board is considering the format of this year’s AGM to ensure that shareholders have the opportunity to suitably engage with the Board. Details will be made available in the Notice of AGM, which will be published towards the end of March and will be available on our website at www.lloydsbankinggroup.com
Reports and communicationsThe Group issues regulatory announcements through the Regulatory News Service (RNS); shareholders can subscribe for free via the Investors section of our website at www.lloydsbankinggroup.com, where our statutory reports and shareholder communications are available. A summary of the scheduled reports and communications to be issued in 2021 is set out below:
Available format
Report/Communication Month Online Email RNS Paper
Preliminary results and publication of Annual Report and Accounts Feb
Pillar 3 report Mar/Aug
Group Chief Executive update to shareholders Mar
Mailing of Annual Report and Accounts, Annual Review or Performance Summary Mar
Notice of AGM and voting materials Mar
Q1 interim management statement Apr
Country analysis1 Jul
Interim results Jul
Q3 interim management statement Oct
1 To be published on the Group’s website by 29 July 2021 in accordance with the Capital Requirements (Country-by-Country Reporting) Regulations 2013.
Share dealing facilitiesWe offer a choice of four share dealing services for our UK shareholders and customers. To see the full range of services available for each, please use the contact details below:
Service Provider Telephone Dealing Internet Dealing
Bank of Scotland Share Dealing 0345 606 1188 www.bankofscotland.co.uk/sharedealing
Halifax Share Dealing 03457 22 55 25 www.halifax.co.uk/sharedealing
Lloyds Bank Direct Investments 0345 60 60 560 www.lloydsbank.com/share-dealing.asp
IWeb Share Dealing 03450 707 129 www.iweb-sharedealing.co.uk/share-dealing-home.asp
Note:
All internet services are available 24/7. Telephone dealing services are available between 8.00 am and 9.00 pm, Monday to Friday. To open a share dealing account with any of these services, you must be 18 years of age or over and be resident in the UK, Jersey, Guernsey or the Isle of Man.
Share dealing for the Lloyds Banking Group Shareholder Account Share dealing services for the Lloyds Banking Group Shareholder Account are provided by Equiniti Shareview Dealing, operated by Equiniti Financial Services Limited. Details of the services provided can be found either on the Shareholder information page of our website at www.lloydsbankinggroup.com or by contacting Equiniti using the contact details provided on the next page.
Share price informationShareholders can access both the latest and historical share prices via our website at www.lloydsbankinggroup.com as well as listings in most national newspapers. For a real time buying or selling price, you will need to contact a stockbroker, or you can contact the share dealing providers detailed above.
Individual Savings Accounts (ISAs)There are a number of options for investing in Lloyds Banking Group shares through an ISA. For details of services and products provided by the Group please contact Bank of Scotland Share Dealing, Halifax Share Dealing or Lloyds Bank Direct Investments using the contact details above.
Shareholder information

Strategic rep
ortFinancial results
Governance
Risk manag
ement
Financial statements
Other inform
ation Lloyds Banking Group Annual Report and Accounts 2020 345
American Depositary Receipts (ADRs)Our shares are traded in the USA through a New York Stock Exchange-listed sponsored ADR facility with The Bank of New York Mellon as the depositary. The ADRs are traded on the New York Stock Exchange under the symbol LYG. The CUSIP number is 539439109 and the ratio of ADRs to ordinary shares is 1:4.
For details contact: BNY Mellon Shareowner Services, 462 South 4th Street, Suite 1600, Louisville KY 40202. Telephone: 1-866-259-0336 (US toll free), international callers: +1 201-680-6825. Alternatively visit www.adrbnymellon.com or email [email protected]
Analysis of shareholders
Balance Ranges
Total Number
of HoldingsPercentage of Holders
Total Number
of SharesPercentage
Issued capital
1-999 1,899,324 81.17% 561,620,817 0.79%
1,000-9,999 376,675 16.10% 1,000,548,882 1.40%
10,000-99,999 60,365 2.58% 1,539,535,930 2.16%
100,000-999,999 2,818 0.12% 648,639,025 0.91%
1,000,000-4,999,999 494 0.02% 1,156,565,765 1.62%
5,000,000-9,999,999 168 0.01% 1,204,302,388 1.69%
10,000,000-49,999,999 264 0.00% 6,165,686,982 8.65%
50,000,000-99,999,999 66 0.00% 4,519,794,943 6.34%
100,000,000-499,999,999 87 0.00% 17,869,577,046 25.07%
500,000,000-999,999,999 16 0.00% 11,275,125,755 15.83%
1,000,000,000+ 11 0.00% 25,326,602,153 35.54%
Totals 2,340,288 100.00% 71,267,999,686 100.00%
Security – share fraud and scamsShareholders should exercise caution when unsolicited callers offer the chance to buy or sell shares with promises of huge returns. If it sounds too good to be true, it usually is and we would ask that shareholders take steps to protect themselves. We strongly recommend seeking advice from an independent financial adviser authorised by the Financial Conduct Authority (FCA). Shareholders can verify whether a firm is authorised via the Financial Services Register which is available at www.fca.org.uk
If a shareholder is concerned that they may have been targeted by such a scheme, please contact the FCA Consumer Helpline on 0800 111 6768 or use the online ‘Share Fraud Reporting Form’ available from their website (see above). We would also recommend contacting the Police through Action Fraud on 0300 123 2040 or visiting www.actionfraud.org.uk for further information.
Important shareholder and registrar information
Company websitewww.lloydsbankinggroup.com
Shareholder informationhelp.shareview.co.uk (from here you will be able to email your query securely)
RegistrarEquiniti Limited Aspect House, Spencer Road, Lancing West Sussex BN99 6DA
Shareholder helpline0371 384 2990* from within the UK +44 121 415 7066 from outside the UK* Lines are open from 8.30 am to 5.30 pm Monday to Friday, excluding English and Welsh public holidays.
The company registrar is Equiniti Limited. They provide a shareholder service, including a telephone helpline and shareview which is a free secure portfolio service.
Register today to manage your shareholding online
Get online in just three easy steps:
step 1Register at www.shareview.co.uk/info/register
step 2Receive your activation code in post
step 3Log on

346 Lloyds Banking Group Annual Report and Accounts 2020
Five year financial summary for the Group
2020 2019 20181,2 20171,2,3 20161,2,3
Income statement data for the year ended 31 December (£m)
Total income, net of insurance claims 15,126 18,359 18,626 18,659 17,267
Operating expenses (9,745) (12,670) (11,729) (12,696) (12,277)
Impairment (4,155) (1,296) (937) (688) (752)
Profit before tax 1,226 4,393 5,960 5,275 4,238
Profit after tax for the year 1,387 3,006 4,506 3,649 2,605
Profit for the year attributable to ordinary shareholders 865 2,459 3,975 3,144 2,092
31 December 2020
31 December 2019
31 December 2018
31 December 2017
31 December 2016
Balance sheet data (£m)
Share capital 7,084 7,005 7,116 7,197 7,146
Shareholders’ equity 43,278 41,697 43,434 43,551 43,020
Other equity instruments 5,906 5,906 6,491 5,355 5,355
Customer deposits 460,068 421,320 418,066 418,124 415,460
Subordinated liabilities 14,261 17,130 17,656 17,922 19,831
Loans and advances to customers 498,843 494,988 484,858 472,498 457,958
Total assets 871,269 833,893 797,598 812,109 817,793
2020 2019 2018 2017 2016
Share information
Basic earnings per ordinary share 1.2p 3.5p 5.5p 4.4p 2.9p
Diluted earnings per ordinary share 1.2p 3.4p 5.5p 4.3p 2.9p
Net asset value per ordinary share 61.1p 59.5p 61.0p 60.5p 60.2p
Dividends per ordinary share4, 5, 6 0.57p 1.12p 3.21p 3.05p 3.05p
Market price (year end) 36.4p 62.5p 51.9p 68.1p 62.5p
Number of shareholders (thousands) 2,340 2,361 2,404 2,450 2,510
Number of ordinary shares in issue (millions) 7 70,839 70,053 71,164 71,973 71,374
2020 2019 2018 2017 2016
Financial ratios (%) 8
Dividend payout ratio5,9 46.7 32.1 57.6 69.8 104.0
Post-tax return on average shareholders’ equity 2.0 5.7 9.3 7.2 4.9
Post-tax return on average assets2 0.16 0.36 0.55 0.45 0.31
Cost:income ratio10 64.4 69.0 63.0 68.0 71.1
31 December 2020
31 December 2019
31 December 2018
31 December 2017
31 December 2016
Capital ratios (%)
Total capital 23.3 21.3 22.9 21.2 21.4
Tier 1 capital 19.1 16.7 18.2 17.2 17.0
Common equity tier 1 capital 16.2 13.6 14.6 14.1 13.6
1 The Group adopted IFRS 16 Leases with effect from 1 January 2019, in accordance with the transition requirements of the standard, comparative information was not restated.
2 The Group implemented the amendments to IAS 12 Income Taxes with effect from 1 January 2019 and as a result tax relief on distributions on other equity instruments, previously taken directly to retained profits, is now reported within tax expense in the income statement. Comparatives were restated.
3 The Group adopted IFRS 9 and IFRS 15 with effect from 1 January 2018; in accordance with the transition requirements of the two standards, comparative information for preceding years was not restated.
4 Annual dividends comprise both interim and estimated final dividend payments. The total dividend for the year represents the interim dividend paid during the year and the final dividend which is paid and accounted for in the following year.
5 At the time of approving the Group’s results for the year ended 31 December 2019, the directors recommended a final dividend of 2.25 pence per share representing a total dividend of £1,586 million, which was to be paid on 27 May 2020. However, on 31 March 2020 the Group announced the cancellation of its final 2019 ordinary dividend. This decision was taken by the Board at the specific request of the regulator, the PRA, in line with all other major UK listed banks, as a result of the developing coronavirus crisis.
6 Dividends per ordinary share in 2016 included a recommended special dividend of 0.5 pence.
7 For 2016, this figure excluded the limited voting ordinary shares owned by the Lloyds Bank Foundations. The limited voting ordinary shares were redesignated as ordinary shares on 1 July 2017.
8 Averages are calculated on a monthly basis from the consolidated financial data of Lloyds Banking Group.
9 Total dividend for the year divided by earnings attributable to ordinary shareholders adjusted for tax relief on distributions to other equity holders.
10 The cost:income ratio is calculated as total operating expenses as a percentage of total income (net of insurance claims).

Strategic rep
ortFinancial results
Governance
Risk manag
ement
Financial statements
Other inform
ation Lloyds Banking Group Annual Report and Accounts 2020 347
Forward-looking statements
This document contains certain forward-looking statements within the meaning of Section 21E of the US Securities Exchange Act of 1934, as amended, and section 27A of the US Securities Act of 1933, as amended, with respect to the business, strategy, plans and/or results of Lloyds Banking Group plc together with its subsidiaries (the Group) and its current goals and expectations relating to its future financial condition and performance. Statements that are not historical facts, including statements about the Group's or its directors' and/or management's beliefs and expectations, are forward-looking statements.
Words such as ‘believes’, ‘achieves’, ‘anticipates’, ‘estimates’, ‘expects’, ‘targets’, ‘should’, ‘intends’, ‘aims’, ‘projects’, ‘plans’, ‘potential’, ‘will’, ‘would’, ‘could’, ‘considered’, ‘likely’, ‘may’, ‘seek’, ‘estimate’ and variations of these words and similar future or conditional expressions are intended to identify forward-looking statements but are not the exclusive means of identifying such statements.
Examples of such forward-looking statements include, but are not limited to, statements or guidance relating to: projections or expectations of the Group’s future financial position including profit attributable to shareholders, provisions, economic profit, dividends, capital structure, portfolios, net interest margin, capital ratios, liquidity, risk-weighted assets (RWAs), expenditures or any other financial items or ratios; litigation, regulatory and governmental investigations; the Group’s future financial performance; the level and extent of future impairments and write-downs; statements of plans, objectives or goals of the Group or its management including in respect of statements about the future business and economic environments in the UK and elsewhere including, but not limited to, future trends in interest rates, foreign exchange rates, credit and equity market levels and demographic developments; statements about competition, regulation, disposals and consolidation or technological developments in the financial services industry; and statements of assumptions underlying such statements.
By their nature, forward-looking statements involve risk and uncertainty because they relate to events and depend upon circumstances that will or may occur in the future.
Factors that could cause actual business, strategy, plans and/or results (including but not limited to the payment of dividends) to differ materially from forward-looking statements made by the Group or on its behalf include, but are not limited to: general economic and business conditions in the UK and internationally; market related trends and developments; fluctuations in interest rates, inflation, exchange rates, stock markets and currencies; any impact of the transition from IBORs to alternative reference rates; the ability to access sufficient sources of capital, liquidity and funding when required; changes to the Group’s credit ratings; the ability to derive cost savings and other benefits including, but without limitation as a result of any acquisitions, disposals and other strategic transactions; the ability to achieve strategic objectives; the Group’s ESG targets and/or commitments; changing customer behaviour including consumer spending, saving and borrowing habits; changes to borrower or counterparty credit quality impacting the recoverability and value of balance sheet assets; concentration of financial exposure; management and monitoring of conduct risk; exposure to counterparty risk (including but not limited to third parties conducting illegal activities without the Group’s knowledge); instability in the global financial markets, including Eurozone instability, instability as a result of uncertainty surrounding the exit by the UK from the European Union (EU), the EU-UK Trade and Cooperation Agreement, and as a result of such exit and the potential for other countries to exit the EU
or the Eurozone and the impact of any sovereign credit rating downgrade or other sovereign financial issues; political instability including as a result of any UK general election and any further possible referendum on Scottish independence; technological changes and risks to the security of IT and operational infrastructure, systems, data and information resulting from increased threat of cyber and other attacks; natural, pandemic (including but not limited to the COVID-19 pandemic) and other disasters, adverse weather and similar contingencies outside the Group’s control; inadequate or failed internal or external processes or systems; acts of war, other acts of hostility, terrorist acts and responses to those acts, or other such events; geopolitical unpredictability; risks relating to climate change; changes in laws, regulations, practices and accounting standards or taxation, including as a result of the UK’s exit from the EU; changes to regulatory capital or liquidity requirements (including regulatory measures to restrict distributions to address potential capital and liquidity stress) and similar contingencies outside the Group’s control; the policies, decisions and actions of governmental or regulatory authorities or courts in the UK, the EU, the US or elsewhere including the implementation and interpretation of key laws, legislation and regulation together with any resulting impact on the future structure of the Group; the ability to attract and retain senior management and other employees and meet its diversity objectives; actions or omissions by the Group's directors, management or employees including industrial action; changes to the Group's post-retirement defined benefit scheme obligations; the extent of any future impairment charges or write-downs caused by, but not limited to, depressed asset valuations, market disruptions and illiquid markets; the value and effectiveness of any credit protection purchased by the Group; the inability to hedge certain risks economically; the adequacy of loss reserves; the actions of competitors, including non-bank financial services, lending companies and digital innovators and disruptive technologies; and exposure to regulatory or competition scrutiny, legal, regulatory or competition proceedings, investigations or complaints. Please refer to the latest Annual Report on Form 20-F filed by Lloyds Banking Group plc with the US Securities and Exchange Commission for a discussion of certain factors and risks.
Lloyds Banking Group may also make or disclose written and/or oral forward-looking statements in reports filed with or furnished to the US Securities and Exchange Commission, Lloyds Banking Group annual reviews, half-year announcements, proxy statements, offering circulars, prospectuses, press releases and other written materials and in oral statements made by the directors, officers or employees of Lloyds Banking Group to third parties, including financial analysts.
Except as required by any applicable law or regulation, the forward-looking statements contained in this document are made as of today's date, and the Group expressly disclaims any obligation or undertaking to release publicly any updates or revisions to any forward-looking statements contained in this document to reflect any change in the Group’s expectations with regard thereto or any change in events, conditions or circumstances on which any such statement is based. The information, statements and opinions contained in this document do not constitute a public offer under any applicable law or an offer to sell any securities or financial instruments or any advice or recommendation with respect to such securities or financial instruments.

348 Lloyds Banking Group Annual Report and Accounts 2020
Abbreviations
Alternative performance measuresAs described on page 72, the Group analyses its performance on an underlying basis. The Group also calculates a number of metrics that are used throughout the banking and insurance industries on an underlying basis as these provide management with a relevant and consistent view of these measures from period to period. A description of the Group’s alternative performance measures and their calculation is set out below.
Asset quality ratio The underlying impairment charge for the period (on an annualised basis) in respect of loans and advances to customers after releases and write-backs, expressed as a percentage of average gross loans and advances to customers for the period.
Banking net interest margin Banking net interest income on customer and product balances in the banking businesses as a percentage of average banking gross interest-earning assets for the period.
Business as usual costs Operating costs, less investment expensed and depreciation.
Cost:income ratio Total costs as a percentage of net income calculated on an underlying basis.
Gross asset quality ratio The underlying impairment charge for the period (on an annualised basis) in respect of loans and advances to customers before releases and write-backs, expressed as a percentage of average gross loans and advances to customers for the period.
Loan to deposit ratio Loans and advances to customers net of allowance for impairment losses and excluding reverse repurchase agreements divided by customer deposits excluding repurchase agreements on an underlying basis.
Present value of new business premium The total single premium sales received in the period (on an annualised basis) plus the discounted value of premiums expected to be received over the term of the new regular premium contracts.
Return on risk-weighted assets Underlying profit before tax divided by average risk-weighted assets.
Return on tangible equity - existing basis Statutory profit after tax adjusted to add back amortisation of intangible assets, and to deduct profit attributable to non-controlling interests and other equity holders, divided by average tangible net assets.
Return on tangible equity - new basis Statutory profit after tax adjusted to deduct profit attributable to non-controlling interests and other equity holders, divided by average tangible net assets
Tangible net assets per share Net assets excluding intangible assets such as goodwill and acquisition-related intangibles divided by the weighted average number of ordinary shares in issue.
Trading Surplus Underlying profit before impairment charge
Underlying, or above the line, profit Statutory profit adjusted for certain items as detailed on page 72.
ADRs American Depositary Receipts
BSU Business Support Unit
CDS Credit Default Swap
CET1 Common Equity Tier 1
CRD IV Capital Requirements Directive IV
CVA Credit Valuation Adjustment
DVA Debit Valuation Adjustment
EBA European Banking Authority
ECN Enhanced Capital Note
EP Economic Profit
EPS Earnings Per Share
FCA Financial Conduct Authority
FLS Funding for Lending Scheme
FRC Financial Reporting Council
GSR3 Group Strategic Review 3
HMRC Her Majesty’s Revenue & Customs
IAS International Accounting Standard
IASB International Accounting Standards Board
ICG Individual Capital Guidance
IFRS International Financial Reporting Standard
LCR Liquidity Coverage Ratio
LIBOR London Inter-Bank Offered Rate
LTIP Long-Term Incentive Plan
OEIC Open Ended Investment Company
PFI Private Finance Initiative
PPI Payment Protection Insurance
PPP Public Private Partnership
PRA Prudential Regulation Authority
PVNBP Present Value of New Business Premiums
SEC Securities and Exchange Commission
TSR Total Shareholder Return
VaR Value-at-Risk

Strategic rep
ortFinancial results
Governance
Risk manag
ement
Financial statements
Other inform
ation Lloyds Banking Group Annual Report and Accounts 2020 349
Subsidiaries and related undertakings
Name of undertaking Notes
A G Finance Ltd 50 iii #A.C.L. Ltd 1 iACL Autolease Holdings Ltd 1 iADF No.1 Pty Ltd 8 iAlex Lawrie Factors Ltd 9 iAlex. Lawrie Receivables Financing Ltd 9 iAmberdate Ltd 1 i vAnglo Scottish Utilities Partnership 1 + * Aquilus Ltd (in liquidation) 13 iAutomobile Association Personal Finance Ltd 4 iBank of Scotland (B G S) Nominees Ltd 5 *Bank of Scotland (Stanlife) London Nominees Ltd – applied for strike off
5 *
Bank of Scotland Branch Nominees Ltd 5 iBank of Scotland Central Nominees Ltd 5 * Bank of Scotland Edinburgh Nominees Ltd 5 *Bank of Scotland Equipment Finance Ltd (in liquidation)
13 i
Bank of Scotland London Nominees Ltd – applied for strike off
5 *
Bank of Scotland Nominees (Unit Trusts) Ltd – applied for strike off
5 *
Bank of Scotland P.E.P. Nominees Ltd – applied for strike off
5 *
Bank of Scotland plc 5 i vBank of Scotland Structured Asset Finance Ltd 1 iBank of Scotland Transport Finance 1 Ltd (in liquidation)
13 i
Bank of Wales Ltd 47 i Barents Leasing Ltd 1 iBarnwood Mortgages Ltd (in liquidation) 13 i Birchcrown Finance Ltd 1 v xxviiiBirmingham Midshires Financial Services Ltd 4 iBirmingham Midshires Land Development Ltd (in liquidation)
13 i
Birmingham Midshires Mortgage Services Ltd (in liquidation)
13 i
Black Horse (TRF) Ltd 1 iBlack Horse Finance Holdings Ltd 1 ii xxixBlack Horse Finance Management Ltd 1 iBlack Horse Group Ltd 1 i vBlack Horse Ltd 1 iBlack Horse Offshore Ltd 60 iBlack Horse Property Services Ltd 1 iBoltro Nominees Ltd 1 iBOS (Ireland) Property Services 2 Ltd 16 iBOS (Ireland) Property Services Ltd 16 iBOS (Shared Appreciation Mortgages (Scotland) No. 2) Ltd
4 i
BOS (Shared Appreciation Mortgages (Scotland) No. 3) Ltd
4 i
BOS (Shared Appreciation Mortgages (Scotland)) Ltd
4 i
BOS (Shared Appreciation Mortgages) No. 1 plc 4 # iBOS (Shared Appreciation Mortgages) No. 2 plc 4 # iBOS (Shared Appreciation Mortgages) No. 3 plc 4 # iBOS (Shared Appreciation Mortgages) No. 4 plc 4 # iBOS (Shared Appreciation Mortgages) No. 5 plc 4 i BOS (Shared Appreciation Mortgages) No. 6 plc 4 iBOS (USA) Fund Investments Inc. 11 xivBOS (USA) Inc. 11 iBOS Mistral Ltd 1 iBOSSAF Rail Ltd 1 iBOS Personal Lending Ltd 4 i ii iiiBritish Linen Leasing (London) Ltd 5 iBritish Linen Leasing Ltd 5 iBritish Linen Shipping Ltd 5 iCapital 1945 Ltd 47 iCapital Bank Leasing 3 Ltd (in liquidation) 13 i Capital Bank Leasing 5 Ltd 47 iCapital Bank Leasing 12 Ltd 5 iCapital Bank Property Investments (3) Ltd 47 i Capital Personal Finance Ltd 4 i
Cardnet Merchant Services Ltd 1 # iii xxxCF1 Ltd (in liquidation) 13 viii ix #Cashfriday Ltd 9 iCashpoint Ltd 1 iCaveminster Ltd 1 iCBRail S.A.R.L. 53 iCedar Holdings Ltd (in liquidation) 13 iCentral Mortgage Finance Ltd (in liquidation) 13 iCF Asset Finance Ltd (in liquidation) 13 iCheltenham & Gloucester plc 12 iClerical Medical Finance plc 20 iClerical Medical Financial Services Ltd 20 iClerical Medical International Holdings B.V. 21 iClerical Medical Investment Fund Managers Ltd 4 iClerical Medical Non Sterling Property Company S.A.R.L.
22 i
Cloak Lane Funding S.A.R.L. 56 iCloak Lane Investments S.A.R.L. 56 iCM Venture Investments Ltd 23 i vConquest Securities Ltd 1 v xxviiiCorbiere Asset Investments Ltd 1 ii iiiCreate Services Ltd (in liquidation) 13 i Dalkeith Corporation 24 iDunstan Investments (UK) Ltd 1 iEurolead Services Holdings Ltd 9 iFirst Retail Finance (Chester) Ltd 4 iForthright Finance Ltd 47 iFrance Industrial Premises Holding Company 28 iGeneral Leasing (No. 12) Ltd 1 iGeneral Reversionary and Investment Company 20 i Gresham Nominee 1 Ltd 1 iGresham Nominee 2 Ltd 1 iHalifax Credit Card Ltd (in liquidation) 13 ii iii viiiHalifax Financial Brokers Ltd 4 iHalifax Financial Services (Holdings) Ltd 4 iHalifax Financial Services Ltd 4 iHalifax General Insurance Services Ltd 4 iHalifax Group Ltd 4 iHalifax Investment Services Ltd (in liquidation) 13 iHalifax Leasing (March No.2) Ltd 1 iHalifax Leasing (September) Ltd 1 iHalifax Life Ltd 4 iHalifax Ltd 4 iHalifax Loans Ltd 4 iHalifax Mortgage Services Ltd 4 iHalifax Nominees Ltd – applied for strike off 4 iHalifax Pension Nominees Ltd 29 iHalifax Share Dealing Ltd 4 iHalifax Vehicle Leasing (1998) Ltd 4 iHBOS Covered Bonds LLP 4 *HBOS Final Salary Trust Ltd 5 iHBOS Financial Services Ltd 20 iHBOS Insurance & Investment Group Ltd 20 iHBOS International Financial Services Holdings Ltd 20 iHBOS Investment Fund Managers Ltd 4 iiHBOS plc 5 i xxx xxxiiHBOS Social Housing Covered Bonds LLP 47 *HBOS UK Ltd 5 iHeidi Finance Holdings (UK) Ltd 1 iHill Samuel Bank Ltd 1 iHill Samuel Finance Ltd 1 v xxxiHill Samuel Leasing Co. Ltd 1 iHome Shopping Personal Finance Ltd 4 iHorizon Capital 2000 Ltd 5 iHousing Growth Partnership GP LLP 1 *Housing Growth Partnership LP 1 * #Housing Growth Partnership Ltd 1 ii iiiHousing Growth Partnership Manager Ltd 1 iHSDL Nominees Ltd 4 iHVF Ltd 2 iHyundai Car Finance Ltd 50 ii iiiIBOS Finance Ltd 47 iInchcape Financial Services Ltd (in liquidation) 13 ii #Intelligent Finance Financial Services Ltd 4 iIntelligent Finance Software Ltd 4 iInternational Motors Finance Ltd 2 ii #Kanaalstraat Funding C.V. 35 *Katrine Leasing Ltd (in liquidation) 39 iLB Healthcare Trustee Ltd 1 iLB Share Schemes Trustees Ltd 1 iLBCF Ltd 9 iLBG Brasil Administração LTDA 38 i LBG Capital Holdings Ltd 1 i LBG Equity Investments Ltd 1 i LBI Leasing Ltd 1 iLDC (General Partner) Ltd 40 iLDC (Managers) Ltd 40 iLDC (Nominees) Ltd 40 iLDC GP LLP 41 *LDC I LP 41 *LDC II LP 41 *LDC III LP 41 *LDC IV LP 41 *LDC Parallel (Nominees) Ltd 40 iLDC IX LP 40 *LDC V LP 41 *LDC VI LP 41 *LDC VII LP 41 *LDC VIII LP 40 *Legacy Renewal Company Ltd 5 i
Lex Autolease (CH) Ltd 1 iLex Autolease (VC) Ltd 1 iLex Autolease Carselect Ltd 1 iLex Autolease Ltd 1 iLex Vehicle Leasing (Holdings) Ltd (in liquidation) 13 ii iii xiLex Vehicle Leasing Ltd (in liquidation) 13 iLime Street (Funding) Ltd (in liquidation) 13 iLloyds (Gresham) Ltd 1 i xiLloyds (Gresham) No. 1 Ltd 1 iLloyds (Nimrod) Specialist Finance Ltd 1 iLloyds America Securities Corporation 11 iLloyds Asset Leasing Ltd 1 iLloyds Bank (Branches) Nominees Ltd (in liquidation)
13 i
Lloyds Bank (Colonial & Foreign) Nominees Ltd 1 iLloyds Bank (Fountainbridge 1) Ltd (in liquidation) 65 iLloyds Bank (Fountainbridge 2) Ltd (in liquidation) 65 iLloyds Bank (I.D.) Nominees Ltd 1 iLloyds Bank (International Services) Ltd 58 i Lloyds Bank (Stock Exchange Branch) Nominees Ltd (in liquidation)
13 i
Lloyds Bank Asset Finance Ltd 1 iLloyds Bank Commercial Finance Ltd 9 iLloyds Bank Commercial Finance Scotland Ltd 43 iLloyds Bank Corporate Asset Finance (HP) Ltd 1 iLloyds Bank Corporate Asset Finance (No.1) Ltd 1 iLloyds Bank Corporate Asset Finance (No.2) Ltd 1 iLloyds Bank Corporate Asset Finance (No.3) Ltd 1 iLloyds Bank Corporate Asset Finance (No.4) Ltd 1 iLloyds Bank Corporate Markets plc 1 i Lloyds Bank Corporate Markets Wertpapierhandelsbank GmbH
17 i
Lloyds Bank Covered Bonds LLP 26 *Lloyds Bank Equipment Leasing (No. 1) Ltd 1 iLloyds Bank Equipment Leasing (No. 7) Ltd 1 iLloyds Bank Equipment Leasing (No. 9) Ltd 1 iLloyds Bank Financial Services (Holdings) Ltd 1 i vLloyds Bank General Insurance Holdings Ltd 45 iLloyds Bank General Insurance Ltd 1 iLloyds Bank General Leasing (No. 3) Ltd 1 iLloyds Bank General Leasing (No. 5) Ltd (in liquidation)
13 i
Lloyds Bank General Leasing (No. 11) Ltd 1 iLloyds Bank General Leasing (No. 17) Ltd (in liquidation)
13 i
Lloyds Bank GmbH 59 iLloyds Bank Hill Samuel Holding Company Ltd (in liquidation)
13 i
Lloyds Bank Insurance Services Ltd 1 iLloyds Bank International Ltd 58 iLloyds Bank Leasing (No. 6) Ltd 1 iLloyds Bank Leasing (No. 8) Ltd (in liquidation) 13 iLloyds Bank Leasing Ltd 1 iLloyds Bank Maritime Leasing (No. 10) Ltd 1 iLloyds Bank Maritime Leasing (No.16) Ltd (in liquidation)
13 i
Lloyds Bank Maritime Leasing (No. 17) Ltd (in liquidation)
13 i
Lloyds Bank MTCH Ltd 1 iLloyds Bank Nominees Ltd 1 iLloyds Bank Offshore Pension Trust Ltd 33 i Lloyds Bank Pension ABCS (No. 1) LLP 1 *Lloyds Bank Pension ABCS (No. 2) LLP 1 *Lloyds Bank Pension Trust (No. 1) Ltd 1 iLloyds Bank Pension Trust (No. 2) Ltd 1 iLloyds Bank Pensions Property (Guernsey) Ltd 34 ii iiiLloyds Bank plc 1 i viiLloyds Bank Property Company Ltd 1 iLloyds Bank S.F. Nominees Ltd 1 iLloyds Bank Subsidiaries Ltd 1 iLloyds Bank Trustee Services Ltd 1 iLloyds Banking Group Pensions Trustees Ltd 1 iLloyds Capital GP Ltd 10 i Lloyds Commercial Leasing Ltd (in liquidation) 13 iLloyds Corporate Services (Jersey) Ltd 58 iLloyds Development Capital (Holdings) Ltd 40 iLloyds Engine Capital (No.1) U.S LLC 11 *Lloyds Far East S.A.R.L. 56 iLloyds General Leasing Ltd 1 iLloyds Holdings (Jersey) Ltd 58 iLloyds Hypotheken B.V. 37 iLloyds Industrial Leasing Ltd 1 iLloyds International Pty Ltd 8 iLloyds Investment Bonds Ltd (in liquidation) 13 iLloyds Investment Securities No.5 Ltd 1 iLloyds Leasing (North Sea Transport) Ltd 1 iLloyds Leasing Developments Ltd 1 iLloyds Offshore Global Services Private Ltd 48 iLloyds Plant Leasing Ltd 1 iLloyds Portfolio Leasing Ltd 1 iLloyds Project Leasing Ltd 1 iLloyds Property Investment Company No. 3 Ltd (in liquidation)
13 i
Lloyds Property Investment Company No. 4 Ltd 1 iLloyds Property Investment Company No.5 Ltd (in liquidation)
13 i
Lloyds Secretaries Ltd 1 iLloyds Securities Inc. 11 iLloyds TSB Pacific Ltd 51 i
In compliance with Section 409 of the Companies Act 2006, the following comprises a list of all related undertakings of the Group, as at 31 December 2020. The list includes each undertaking’s registered office and the percentage of the class(es) of shares held by the Group. All shares held are ordinary shares unless indicated otherwise in the notes.
Subsidiary undertakings The Group directly or indirectly holds 100 % of the share class or a majority of voting rights (including where the undertaking does not have share capital as indicated) in the following undertakings. All material subsidiary undertakings are consolidated by Lloyds Banking Group.

350 Lloyds Banking Group Annual Report and Accounts 2020
Subsidiaries and related undertakings continued
Name of undertaking Notes
Addison Social Housing Holdings Ltd 61Cancara Asset Securitisation Ltd 63Cardiff Auto Receivables Securitisation 2018-1 Plc 26Cardiff Auto Receivables Securitisation 2019-1 Plc 26Cardiff Auto Receivables Securitisation Holdings Ltd
26
Celsius European Lux 2 S.A.R.L. 30Cheltenham Securities 2017 Ltd 61Fontwell II Securities 2020 DAC 42Chepstow Blue Holdings Ltd 26Chepstow Blue plc 26Chester Asset Options No.2 Ltd (in liquidation) 19Chester Asset Option No.3 Ltd (applied for strike off)
66
Chester Asset Receivables Dealings Issuer Ltd (in liquidation)
19
Chester Asset Securitisation Holdings Ltd (in liquidation)
19
Chester Asset Securitisation Holdings No.2 Ltd (in liquidation)
19
Clerical Medical Non Sterling Guadalix Hold Co BV
7
Clerical Medical Non Sterling Guadalix Spanish Prop Co SL
64
Clerical Medical Non Sterling Megapark Hold Co BV
7
Clerical Medical Non Sterling Megapark Prop Co SA
64
Credit Card Securitisation Europe Ltd 63Deva Financing Holdings Ltd 26Deva Financing plc 26Deva One Ltd 63Deva Three Ltd 63Deva Two Ltd 63Edgbaston RMBS 2010-1 plc 26Edgbaston RMBS Holdings Ltd 26Elland RMBS 2018 plc 26Elland RMBS Holdings Ltd 26Fontwell Securities 2016 Ltd 61Gresham Receivables (No. 1) Ltd 63Gresham Receivables (No. 3) Ltd 63Gresham Receivables (No. 10) Ltd 63Gresham Receivables (No.11) UK Ltd 54Gresham Receivables (No. 12) Ltd 63Gresham Receivables (No. 13) UK Ltd 54Gresham Receivables (No. 14) UK Ltd 54Gresham Receivables (No. 15) UK Ltd 54Gresham Receivables (No. 16) UK Ltd 54Gresham Receivables (No. 19) UK Ltd 54Gresham Receivables (No. 20) Ltd 63Gresham Receivables (No. 21) Ltd 63Gresham Receivables (No. 22) Ltd 63Gresham Receivables (No. 23) Ltd 63Gresham Receivables (No. 24) Ltd 63Gresham Receivables (No. 25) UK Ltd 54Gresham Receivables (No. 26) UK Ltd 54Gresham Receivables (No.27) UK Ltd 54Gresham Receivables (No.28) Ltd 63Gresham Receivables (No.29) Ltd 63Gresham Receivables (No. 30) UK Ltd 54Gresham Receivables (No. 31) UK Ltd 54Gresham Receivables (No. 32) UK Ltd 54Gresham Receivables (No. 33) UK Ltd 54Gresham Receivables (No. 34) UK Ltd 54Gresham Receivables (No.35) Ltd 63Gresham Receivables (No.36) UK Ltd 54Gresham Receivables (No.37) UK Ltd 54Gresham Receivables (No.38) UK Ltd 54Gresham Receivables (No.39) UK Ltd 54Gresham Receivables (No.40) UK Ltd 54Gresham Receivables (No.41) UK Ltd 54Gresham Receivables (No.44) UK Ltd 54Gresham Receivables (No.45) UK Ltd 54Gresham Receivables (No.46) UK Ltd 54Gresham Receivables (No.47) UK Ltd 54
Gresham Receivables (No.48) UK Ltd 54Guildhall Asset Purchasing Company (No 3) Ltd 63Guildhall Asset Purchasing Company (No.11) UK Ltd
54
Housing Association Risk Transfer 2019 DAC 42Leicester Securities 2014 Ltd 26Lingfield 2014 I Holdings Ltd 26Lingfield 2014 I plc 26Lloyds Bank Covered Bonds (Holdings) Ltd 26Lloyds Bank Covered Bonds (LM) Ltd 26Molineux RMBS 2016-1 plc 26Molineux RMBS Holdings Ltd 26Penarth Asset Securitisation Holdings Ltd 26Penarth Funding 1 Ltd 26Penarth Funding 2 Ltd 26Penarth Master Issuer plc 26Penarth Receivables Trustee Ltd 26Permanent Funding (No. 1) Ltd 26Permanent Funding (No. 2) Ltd 26Permanent Holdings Ltd 26Permanent Master Issuer plc 26Permanent Mortgages Trustee Ltd 26Permanent PECOH Holdings Ltd 26Permanent PECOH Ltd 26Salisbury Securities 2015 Ltd 36Salisbury II Securities 2016 Ltd 61Salisbury II-A Securities 2017 Ltd 61Salisbury III Securities 2019 DAC 42Sandown 2012-2 Holdings Ltd (applied for strike off)
26
Sandown 2012-2 plc (in liquidation) 6Sandown Gold 2012-1 Holdings Ltd (applied for strike off)
44
Sandown Gold 2012-1 plc (in liquidation) 6SARL Coliseum 62SARL Hiram 62SAS Compagnie Fonciere De France 62SCI Astoria Invest 62SCI De L’Horloge 62SCI Equinoxe 62SCI Rambuteau CFF 62Swan Funding 2 Ltd 61Syon Securities 2019 DAC 42Syon Securities 2020 DAC 42Syon Securities 2020-2 DAC 42Thistle Investments (AMC) Ltd 26Thistle Investments (ERM) Ltd 26Wetherby II Securities 2018 DAC 55Wetherby III Securities 2019 DAC 42Wetherby Securities 2017 Ltd 61Lloyds Bank Foundation for England & Wales • 52The Halifax Foundation for Northern Ireland • 15 Lloyds Bank Foundation for the Channel Islands • 52Bank of Scotland Foundation • 5MBNA General Foundation • 47
• A charitable foundation funded but not owned by Lloyds Banking Group
Lloyds UDT Asset Rentals Ltd (in liquidation) 13 iLloyds UDT Leasing Ltd 1 iLloyds UDT Ltd (in liquidation) 13 iLloyds Your Tomorrow Trustee Ltd 1 iLoans.co.uk Ltd 47 iLondon Taxi Finance Ltd 1 ii iiiLondon Uberior (L.A.S. Group) Nominees Ltd – applied for strike off
5 *
Lotus Finance Ltd 50 ii #LTGP Limited Partnership Incorporated 34 *Mainsearch Company Ltd (in liquidation) 13 iMaritime Leasing (No. 19) Ltd 1 iMBNA Direct Ltd (in liquidation) 13 iMBNA Europe Finance Ltd 46 iMBNA Europe Holdings Ltd 47 iMBNA Global Services Ltd (in liquidation) 13 iMBNA Ltd 47 iMBNA R & L S.A.R.L. 53 iMBNA Receivables Ltd 63 iMembership Services Finance Ltd 4 iMitre Street Funding S.A.R.L. 56 iNFU Mutual Finance Ltd 47 ii viii #Nominees (Jersey) Ltd 58 iNordic Leasing Ltd (in liquidation) 13 iNWS Trust Ltd 5 iPacific Leasing Ltd 1 iPensions Management (S.W.F.) Ltd 25 *Peony Eastern Leasing Ltd (in liquidation) 13 iPeony Leasing Ltd (in liquidation) 13 iPeony Western Leasing Ltd (in liquidation) 13 iPerry Nominees Ltd 1 iPIPS Asset Investments Ltd 1 ii iiiPrestonfield Investments Ltd 5 iProton Finance Ltd 50 iii #R.F. Spencer and Company Ltd 9 iRanelagh Nominees Ltd 1 iRetail Revival (Burgess Hill) Investments Ltd 1 iSaint Michel Holding Company No1 28 iSaint Michel Investment Property 28 iSaint Witz 2 Holding Company No1 28 iSaint Witz 2 Investment Property 28 iSavban Leasing Ltd 1 iScotland International Finance B.V. 21 iScottish Widows Administration Services (Nominees) Ltd
25 i
Scottish Widows Administration Services Ltd 1 iScottish Widows Auto Enrolment Services Ltd 1 iScottish Widows Europe 27 iScottish Widows Financial Services Holdings 3 iScottish Widows’ Fund and Life Assurance Society
25 *
Scottish Widows Group Ltd 3 ii iii xiScottish Widows Industrial Properties Europe B.V. 18 iScottish Widows Ltd 1 iScottish Widows Pension Trustees Ltd 3 iScottish Widows Property Management Ltd 25 iScottish Widows Schroder Personal Wealth (ACD) Ltd
1 i
Scottish Widows Schroder Personal Wealth Ltd 1 iScottish Widows Schroder Wealth Holdings Ltd 1 ii #Scottish Widows Services Ltd 3 iScottish Widows Trustees Ltd 25 iScottish Widows Unit Funds Ltd 3 iScottish Widows Unit Trust Managers Ltd 45 iSeabreeze Leasing Ltd 1 iSeaspirit Leasing Ltd 1 iShare Dealing Nominees Ltd 4 iShogun Finance Ltd 50 iii #Silentdale Ltd (in liquidation) 13 v vii xxviiiSt Andrew’s Group Ltd 20 iSt Andrew’s Insurance plc 20 iSt Andrew’s Life Assurance plc 20 iSt. Mary’s Court Investments 1 iStandard Property Investment (1987) Ltd 5 ii iiiStandard Property Investment Ltd 57 i #Sussex County Homes Ltd 4 iSuzuki Financial Services Ltd 50 ii # SW Funding plc 3 i # SW No.1 Ltd 3 iSWAMF (GP) Ltd (in liquidation) 13 iSWAMF Nominee (1) Ltd (in liquidation) 13 iThe Agricultural Mortgage Corporation plc 45 iThe British Linen Company Ltd 5 iThe Mortgage Business plc 4 iThistle Leasing + * Tower Hill Property Investments (7) Ltd 47 i #Tower Hill Property Investments (10) Ltd 47 i #Tranquility Leasing Ltd 1 iUberior (Moorfield) Ltd 5 iUberior Co-Investments Ltd 5 iUberior ENA Ltd 5 iUberior Equity Ltd 5 iUberior Europe Ltd 5 iUberior Fund Investments Ltd 5 iUberior Infrastructure Investments Ltd 5 iUberior Infrastructure Investments (No.2) Ltd 1 i Uberior Investments Ltd 5 iUberior Nominees Ltd – applied for strike off 5 *Uberior Trading Ltd 5 iUberior Trustees Ltd – applied for strike off 5 *Uberior Ventures Australia Pty Ltd 8 iUberior Ventures Ltd 5 iUDT Budget Leasing Ltd (in liquidation) 13 iUnited Dominions Leasing Ltd 1 i
Subsidiary undertakings continuedThe Group has determined that it has the power to exercise control over the following entities without having the majority of the voting rights of the undertakings. Unless otherwise stated, the undertakings do not have share capital or the Group does not hold any shares.
United Dominions Trust Ltd 1 iUniverse, The CMI Global Network Fund 49 *Upsaala Ltd 16 iWard Nominees (Abingdon) Ltd 1 iWard Nominees (Birmingham) Ltd 1 iWard Nominees (Bristol) Ltd 1 iWaverley – Fund II Investor LLC 24 iWaverley – Fund III Investor LLC 24 iWaymark Asset Investments Ltd 1 ii iiiWest Craigs Ltd 5 iWood Street Leasing Ltd 1 i

Strategic rep
ortFinancial results
Governance
Risk manag
ement
Financial statements
Other inform
ation Lloyds Banking Group Annual Report and Accounts 2020 351
Associated undertakings The Group has a participating interest in the following undertakings.
Name of undertaking
% of share class held by immediate parent company (or by the Group where this varies) Registered office address (UK unless stated otherwise) Notes
Addo Food Group (Holdings) Ltd 76.85% Queens Drive, Nottingham, NG2 1LU ii &Addison Social Housing Ltd 20% 1 Bartholomew Lane, London, EC2N 2AX iArcher Topco Ltd 99% c/o Crestbridge Limited, 47 Esplanade, St. Helier, Jersey JE1 0BD xvii &Aghoco 1472 Ltd 89.25% 58 Evans Road, Liverpool, L24 9PB ii &Airline Services And Components Group Ltd 94.45% Squire Patton Boggs (UK) LLP (Ref: Csu), Rutland House, 148 Edmund Street, Birmingham,
B3 2JRii &
Allan Water Homes (Chryston) Ltd 50% 24B Kenilworth Road, Bridge Of Allan, Stirling, Scotland, FK9 4DU iiAllan Water Homes (Heartlands) Ltd 50% 24B Kenilworth Road, Bridge Of Allan, Stirling, Scotland, FK9 4DU iiAngus International Safety Group Ltd 88.93%
88.93%Station Road, High Bentham, Near Lancaster, LA2 7NA xviii
xvii &Applied Composites Group Ltd (in liquidation) 85.76% 1 Bridgewater Place, Water Lane, Leeds, West Yorkshire LS11 5QR xviii &Aqualisa Holdings (International) Ltd 76.12%
89.25%Westerham Trade Centre, The Flyers Way, Westerham, TN16 1DE xvii
xviii &Ashtons Group Holdings Ltd 99% Unit 4 74 Dyke Road Mews, Brighton, BN1 3JD ii &Asset Solutions Group Ltd 89.25% Osprey House, Crayfields Business Park, New Mills Road, Orpington, Kent, BR5 3QJ,
United Kingdomxviii &
Bacchus Newco Ltd 89.25% Park Lane Industrial Estates, Park Lane Off Wigan Road, Ashton in Makerfield, Wigan, WN4 0BZ,United Kingdom
ii &
Backhouse (Westbury) JV Ltd 50% DAC Beachcroft LLP, Portwall Place, Portwall Lane, Bristol, BS1 9HS, United Kingdom iiBackhouse (Castle Cary) JV Ltd 50% DAC Beachcroft LLP, Portwall Place, Portwall Lane, Bristol, BS1 9HS, United Kingdom iiBeckstones (Rheda Park) Ltd 50% 4 Cowper Road, Gilwilly Industrial Estate, Penrith, Cumbria, United Kingdom, CA11 9BN iiBergamot Ventures Ltd 50% 6th Floor, 25 Farringdon Street, London, EC4A 4AB iiiBlue Bay Travel Group Ltd 99.17% A4 Bellringer Road, Trentham Business Quarter, Stoke-On-Trent, ST4 8GB xviii &BoS Mezzanine Partners Fund LP n/a 7 Melville Crescent, Edinburgh, EH3 7JA *Bowbridge Homes (Raunds) Ltd 50% Unit 4 Shieling Court, Corby, England, NN18 9QD iiBriar Homes (Darnley) Ltd 50% Radleigh House 1 Golf Road, Clarkston, Glasgow, G76 7HU iiBrington North Holdco Ltd 50% 25 Gresham Street, London, EC2V 7HN ~Burnham SPV Ltd 50% Weir House, Hurst Road, East Molesey, Surrey, KT8 9AY iiCaedmon Homes (St Johns Mews) Ltd 50% Baldwins Wynyard Park House, Wynyard Avenue, Wynyard, TS22 5TB, United Kingdom iiCaedmon Homes Ltd 50% Baldwins Wynyard Park House, Wynyard Avenue, Wynyard, TS22 5TB, United Kingdom iiCaedmon Homes Kirby Hill Ltd 50% C/O Azets Holdings Ltd Wynyard Park House, Wynyard Avenue, Wynyard, United Kingdom, TS22 5TB iiCardel Group Ltd 89.25% 5 The Marquis Business Centre, Royston Road, Baldock, SG7 6XL xviii &Chianti Holdings Limited 99% c/o Freeths Llp, Floor 3, 100 Wellington Street, Leeds, United Kingdom, LS1 4LT ii &City & General Securities Ltd 100% 10 Upper Berkeley Street, London, W1H 7PE iii &City Living (Midlands) Ltd 50% Old Banks Chambers, 582-586 Kingsbury Road, Erdington, Birmingham, B24 9ND iiCitysprint (UK) Holdings Ltd 82.03%
91.22%Ground Floor, Redcentral, 60 High Street, Redhill, RH1 1SH xvii
xviii &Cleanslate Ashford Ltd 50% Chobham Farm, Sandpit Hall Road, Chobham, Surrey, GU24 8HA iiColumbus UK Holdings Ltd 99% 1 Fore Street Avenue, Moorgate, London UK, EC2Y 6DT ii &Connect Health Group Ltd 99% The Light Box Quorum Business Park, Benton Lane, Newcastle Upon Tyne, United Kingdom, NE12 8EU iiConnery Ltd 20% 44 Esplanade, St. Helier, Jersey, JE4 9WG &Couple Holdco Ltd 26.70% 353 Buckingham Avenue, Slough, England, SL1 4PF ii &Croud Holdings Ltd 99% First Floor, 39 Tabernacle Street, London EC2A 4AA ii &Cruden Homes (Aberlady) Ltd 50% 16 Walker Street, Edinburgh EH3 7LP iiCruden Homes (Longniddry) Ltd 50% 16 Walker Street, Edinburgh EH3 7LP iiD.U.K.E Real Estate Ltd 50% Cromwell Property Group Spaces, Lochrin Square, 1 Lochrin Square, 92-98
Fountainbridge, Edinburgh, United Kingdom, EH3 9QAiii ~
Delancey Arnold UK Ltd (in liquidation) 50% 4th Floor, 4 Victoria Street, St Albans, Hertfordshire, AL1 3TF iiiDelancey Rolls UK Ltd (in liquidation) 50% 4th Floor, 4 Victoria Street, St Albans, Hertfordshire, AL1 3TF iiiDevonshire Homes (Cullompton) Ltd 50% Devonshire House, Lowman Green, Tiverton, Devon, EX16 4LA iiDevonshire Homes (Landkey) Ltd 50% Devonshire House, Lowman Green, Tiverton, Devon, EX16 4LA, United Kingdom iiDevonshire Homes (St Austell) Ltd 50% Devonshire House, Lowman Green, Tiverton, Devon, EX16 4LA, United Kingdom iiDino Newco Ltd 89.25%
85.32%Unit 2, Orchard Place, Nottingham Business Park, Nottingham, NG8 6PX ii &
xxDuchy Homes (Bowgreave) Ltd 50% Middleton House, Westland Road, Leeds, West Yorkshire, LS11 5UH iiDuchy Homes (North Cave) Ltd 50% Middleton House, Westland Road, Leeds, West Yorkshire, LS11 5UH iiDuchy Homes (Penistone) Ltd 50% Middleton House, Westland Road, Leeds, West Yorkshire, LS11 5UH iiDuchy Homes (Scawthorpe) Ltd 50% Middleton House, Westland Road, Leeds, West Yorkshire, LS11 5UH iiDuchy Homes (Winterley) Ltd 50% Middleton House, Westland Road, Leeds, West Yorkshire, LS11 5UH iiDuncan and Todd Holdings Ltd 89.25% 6 Queens Road, Aberdeen, AB15 4ZT ii &Ediston Homes Sauchie Ltd 50% 39/1 George Street, Edinburgh, EH2 2HN iiiEley Group Ltd 85.86% Selco Way, Off First Avenue, Minworth Industrial Estate, Minworth, Sutton Coldfield, B76 1BA ii &Ensco 997 Ltd 30.76%
32.74%The Yard, Dodd Lane, Westhoughton, Bolton, BL5 3NU x
xv &Ensco 1314 Ltd 99%
99%90 Tottenham Court Road, London W1T 4TJ ii
xxii &Ensco 1322 Ltd 99% Newbury House, 20 Kings Road West, Newbury, Berkshire, RG14 5XR ii &Ensco 1327 Ltd 99% First Floor, 65 Gresham Street, London, England, EC2V 7NQ ii &Ensco 1337 Ltd 99% Cotton Tree Lane, Colne, BB8 7BH ii &Ensco 1366 Ltd 99% 25a Market Street, Bicester, Oxfordshire, OX26 6AD ii &Ensco 1375 Ltd 99% 25 Southampton Buildings, London, England, WC2A 1AL ii &Ensek Holdings Ltd 99.17% The Watercourt, 116-118 Canal Street, Nottingham, NG1 7HF xviii &Erris Homes (Almondbury) Ltd 50% Unit 11 Acorn Business Park, Killingbeck Drive, Leeds, LS14 6UF, United Kingdom iiEscapade Bidco Ltd 99%
99%2nd Floor Waverley House, 7-12 Noel Street, London W1F 8GQ xviii
xvii &Europa Property Company (Northern) Ltd 100% Europa House, 20 Esplanade, Scarborough, North Yorkshire, YO11 2AQ viii &Evolution Funding Group Ltd 99% Thompson Close, Whittington Moor, Chesterfield, S41 9AZ ii &Express Engineering (Group) Ltd 99%
99%99%99.35%
Kingsway North, Team Valley Trading Estate, Gateshead, NE11 0EG iixviiixviixxi &
FDL Salterns Ltd 50% 2 Poole Road, Bournemouth, BH2 5QY iiFHR European Ventures LLP n/a CMS Cameron Mckenna LLP, 78 Cannon Street, London, EC4N 6AF *Ginger Acquisition Company Ltd 89.25% Tudno Mill, Smith Street, Ashton-Under-Lyne, OL7 0DB, United Kingdom ii &Global Autocare Holding Ltd 99% The Hub, Gelderd Lane, Leeds, England, LS12 6AL ii &Great Wigmore Property Ltd 50% 33 Cavendish Square, London, W1G 0PW &Hamsard 3468 Ltd 89.25%
89.25%Sterling House, Grimbald Crag Close, Knaresborough, England, HG5 8PJ xviii
xvi &Hedge End Place (Durkan) LLP n/a 4 Elstree Gate, Elstree Way, Borehamwood, Hertfordshire, WD6 1JD *Hedge End Place Hold Co Ltd 50% 25 Gresham Street, London, EC2V 7HN ~Highlands Bidco Ltd 99% Commsworld House, Peffer Place, Edinburgh EH16 4BB ii &Hillcrest Homes (Hurst Green) Ltd 50% Mynshulls House, 14 Cateaton Street, Manchester, M3 1SQ iiHollins Homes (Aston) Ltd 50% Suite 4 No. 1 King Street, Manchester, M2 6AW, United Kingdom iiHollins Homes (Newton) Ltd 50% Suite 4 No. 1 King Street, Manchester, M2 6AW, United Kingdom iiHollins Homes (Wingates) Ltd 50% Suite 4 1 King Street, Manchester, M2 6AW, United Kingdom iiHomes By Carlton (MSTG1) Ltd 50% Carlton House, 15 Parsons Court, Welbury Way, Newton Aycliffe, County Durham, DL5 6ZE iiIglufastnet Ltd 89.25%
55.49%2nd Floor, 165 The Broadway, Wimbledon, London, SW19 1NE ii &
xxiiiJames Taylor Homes (Kingston) Ltd 50% James Taylor House, St. Albans Road East, Hatfield, AL10 0HE, United Kingdom iiJames Taylor Homes (Newton Longville) Ltd 50% James Taylor House, St. Albans Road East, Hatfield, AL10 0HE, United Kingdom iiJupiter Bidco Ltd 78.29% The Light House, Brooks Lane, Middlewich, England, CW10 0JG ii &Kenmore Capital 2 Ltd (in liquidation) 50% Grant Thornton UK LLP, 110 Queen Street, Glasgow, G1 3BX iii ~Kenmore Capital 3 Ltd (in receivership) 50% Grant Thornton UK LLP, 110 Queen Street, Glasgow, G1 3BX iii ~Kenmore Capital Ltd (in liquidation) 50% Grant Thornton UK LLP, 110 Queen Street, Glasgow, G1 3BX iii ~

352 Lloyds Banking Group Annual Report and Accounts 2020
Subsidiaries and related undertakings continued
KERV Group Ltd 99% 1st Floor 16 St. Clare Street, London, England, EC3N 1LQ ii &KHL 2017 Ltd 84.4%
84.4%One Eleven, Edmund Street, Birmingham, England, B3 2HJ ii
iii &Kruger Bidco Ltd 99% Rhino House, Deans Road, Ellesmere Port, United Kingdom, CH65 4DR ii &LF (Holdco) Ltd 99% Price House, 37 Stoney Street, Nottingham NG1 1LS ii &London Topco Ltd 62.82% Uk Head Office, Gloucester Road, Cheltenham, Gloucestershire, GL51 8NR, United Kingdom ii &Mableford Ltd 50% Lindum Business Park, Station Road, North Hykeham, Lincoln, LN6 3QX, United Kingdom iiMagicard Holdings Ltd 89.25%
89.25%Waverley House, Hampshire Road, Granby Industrial Estate, Weymouth, DT4 9XD xviii &
xviiMandata Group Ltd 89.25% 3rd Floor Q5 Quorum Business Park, Benton Lane, Longbenton, Newcastle Upon Tyne,
Tyne And Wear, United Kingdom, NE12 8BSxviii &
Mansion House Group (Sandbach) Ltd 50% 8-10 Old Market Place, Altrincham, Cheshire, United Kingdom, WA14 4DF iiMeasured Identity Hub Ltd 97.92% 3 Long Acres, Willow Farm, Castle Donington, Derbyshire DE74 2UG ii &MFS Groupco Ltd 99% York House, Wetherby Road, Long Marston YO26 7NH ii &Motability Operations Group plc 40%
40%City Gate House, 22 Southwark Bridge Road, London, SE1 9HB i
vNeilson Active Holidays Group Ltd 89.25% Locksview, Brighton Marina, Brighton, BN2 5HA ii &Northern Edge Ltd 39.4% The Beacon, 176 St. Vincent Street, Glasgow, G2 5SG iii &Odyssey Bidco Limited 99% Hjp Audley House, Northbridge Road, Berkhamsted, Hertfordshire, United Kingdom, HP4 1EH ii &Omnium Leasing Company 39% N/A +Onapp (Topco) II Ltd 82.5%
100%3MC Middlemarch Business Park, Siskin Drive, Coventry, United Kingdom, CV3 4FJ ii &
vOnapp (Topco) Ltd 82.5%
82.5%3MC Middlemarch Business Park, Siskin Drive, Coventry, United Kingdom, CV3 4FJ ii
iii &Osprey Aviation Services (UK) Ltd 89.25%
89.25%Blackwood House, Union Grove Lane, Aberdeen, AB10 6XU xviii &
xviiPaladone Holdings Ltd 89.25% Apex House, Dolphin Way, Shoreham-by-Sea, West Sussex, BN43 6NZ, United Kingdom ii &Panther Partners Ltd 89%
89%16 Kirby Street, London, EC1N 8TS xviii &
xviiPPCE Holdings Ltd 89.25% 40 St. Pauls Square, Birmingham, United Kingdom, B3 1FQ xviii &Park Bidco Ltd 99% Liliput Road, Brackmills Industrial Estate, Northampton, United Kingdom NN4 7DT ii &Pertemps Network Group Ltd 93.83% Meriden Hall, Main Road, Meriden, Coventry CV7 7PT iii &Personal Touch Holdings Ltd (in liquidation) 100%
100%100%100%100%
Two Snowhill, Snow Hill Queensway, Birmingham, West Midlands, B4 6GA ii &xxivxxvxxvixxvii
PIHL Equity Administration Ltd 35% Cavendish House, 18 Cavendish Square, London, W1G 0PJ iiiPIMCO (Holdings) Ltd (in liquidation) 82.5%
42.8%30.6%
Four Brindleyplace, Birmingham, B1 2HZ, United Kingdom ii iii viii &
Prestbury 1 Limited Partnership n/a Cavendish House, 18 Cavendish Square, London, W1G 0PJ * &Project Belize Ltd 89.25% Sawley Marina, Long Eaton, Nottinghamshire, NG10 3AE ii &Project Bolt Newco 1 Ltd 89.25% Ground Floor Redcentral, 60 High Street, Redhill, Surrey, United Kingdom, RH1 1SH xviii &Project Bronze Ltd 99% Fifth Floor, 55 King Street, Manchester M4 4LQ ii &Project TC Ltd 99% Browne Jacobson Llp (Cs) Mowbray House, Castle Meadow Road, Nottingham NG2 1BJ ii &Project Chicago Newco Ltd 89.25% Church Lane, Church Lane, Norton, Worcester, WR5 2PR ii &Project Polka Topco Ltd 89.25% Roundhouse Road, Faverdale Industrial Estate, Darlington, County Durham, DL3 0UR,
United Kingdomiii &
Project Sketch Ltd 88.30% 11 Vantage Way, Erdington, Birmingham, B24 9GZ ii &Quantum (Flimwell) Ltd 50% Kings Parade, Lower Coombe Street, Croydon, CR0 1AA iiQuentin Park (Cumwhinton) Ltd 50% 4 Cowper Road, Gilwilly Industrial Estate, Penrith CA11 9BN iiRamco Acquisition Ltd 88.74%
88.74%0.17%
6 Queens Road, Aberdeen, Scotland, AB15 4ZT xvi xiixix &
Right Choice Holdings Ltd 89.25% St James House, 27-43 Eastern Road, Romford, Essex, United Kingdom, RM1 3NH ii &Rocket Science Holdings Ltd 99.17% Unit 2, Origin Business Park, Rainsford Road, Park Royal, London NW10 7FW xviii &Rolls Development UK Ltd (in liquidation) 50% 4th Floor , 4 Victoria Square, St Albans, Hertfordhsire, AL1 3TF, United Kingdom iiiSanders Brow (Armathwaite) Ltd 50% 4 Cowper Road, Gilwilly Industrial Estate, Penrith CA11 9BN iiScenic Topco Ltd 89.25% Unit 1B, Pentwyn Business Centre, Wharfedale Road, Cardiff, Wales, CF23 7HB ii &Seahawk Bidco Ltd 89.25% Unit 2 Springfield Court, Summerfield Road, Bolton, BL3 2NT, United Kingdom xviii &SGI Holdings Ltd 99% Alton House, Alton Business Park, Alton Road, Ross-on-Wye, HR9 5BP ii &SHOO 802AA Ltd 89.25% Burleighfield House, London Road, Loudwater, Bucks. HP10 9RF xviii &Sigmat Group Ltd 89.25%
89.25%89.25%
Unit 2 Acorn Business Park Airedale Business Centre, Keighley Road, Skipton, NorthYorkshire, England, BD23 2UE
i &xviiixvii
Solid Solutions Group Ltd 99% Building 500 Abbey Park, Stareton, Kenilworth, Warwickshire, CV8 2LY ii &SOLO Topco Ltd 99% Onecom House, 4400 Parkway, Whiteley, Fareham, Hampshire, PO15 7FJ ii &Specialist People Services Group Ltd 82.5%
82.5%82.5%
7 Bradford Business Park, Kingsgate, Bradford, BD1 4SJ xviiixviiv &
SSP Topco Ltd 89.25% Fourth Floor D Mill, Dean Clough, Halifax, United Kingdom, HX3 5AX ii &Stewart Milne (Glasgow) Ltd 100% The Mound, Edinburgh, EH1 1YZ, United Kingdom ii ~Stewart Milne (West) Ltd 100% The Mound, Edinburgh, EH1 1YZ, United Kingdom ii ~Stratus (Holdings) Ltd 82.5%
82.5%3MC Middlemarch Business Park, Siskin Drive, Coventry, West Midlands, England, CV3 4FJ xvii
xviii &Stroma Group Ltd 98.89 % Unit 4, Pioneer Way, Castleford, West Yorkshire, WF10 5QU xviii &Stonewood Partnerships (Brook Farm) Ltd 50% The Stonewood Office West Yatton Lane, Castle Combe, Chippenham, Wiltshire, SN14 7EY iiTemple Topco Ltd 89.25% Market Place, Henley-On-Thames, Oxfordshire, RG9 2AD ii &The Exceed Partnership LP n/a Cavendish House, 39-41 Waterloo Street, Birmingham, B2 5PP *The Great Wigmore Partnership (G.P.) Ltd 50%
50%33 Cavendish Square, London, W1G 0PW ii
iiiThe Orchards (Burgh by Sands) Ltd 50% 4 Cowper Road, Gilwilly Industrial Estate, Penrith CA11 9BN iiThe Power Industrial Group Ltd (in liquidation) 82.5%
82.5%Deloitte LLP, 1 City Square, Leeds, LS1 2AL ii &
xviiiThistlerow Ltd 50% Radleigh House 1 Golf Road, Clarkston, Glasgow, G76 7HU iiTimec 1667 Ltd 99% Unit 7 & 8 Diamond Court, Newcastle Upon Tyne, NE3 2EN ii &United House Group Holdings Ltd 82.5% 26 Kings Hill Avenue, Kings Hill, West Malling, Kent, ME19 4AE ii &Whittington Facilities Ltd (in administration) 100% c/o Deloitte LLP, Four Brindley Place, Birmingham B1 2HZ viWilliams Topco Ltd 89.25% The Old Post Office, St. Nicholas Street, Newcastle Upon Tyne, United Kingdom, NE1 1RH ii &ZWPV Ltd 89.25% Zip World Base Camp, Denbigh Street, Llanrwst, LL26 0LL ii &

Strategic rep
ortFinancial results
Governance
Risk manag
ement
Financial statements
Other inform
ation Lloyds Banking Group Annual Report and Accounts 2020 353
Collective Investment VehiclesThe following comprises a list of the Group’s and other external collective investment vehicles (CIV), where the shareholding is greater than or equal to 20% of the nominal value of any class of shares, or a book value greater than 20% of the CIV’s assets.
Name of undertaking
% of fund held by immediate parent (or by the Group where this varies Notes
ABERDEEN LIQUIDITY FUND (LUX) 7Aberdeen Liquidity Fund (Lux) - Ultra Short Duration
Sterling Fund 70.67% ABERDEEN STANDARD OEIC I 8
Aberdeen European Property Share Fund 32.06%Aberdeen Sterling Bond Fund 78.65%
ABERDEEN STANDARD OEIC IV 8Aberdeen Global Corporate Bond Tracker Fund 98.30%ASI UK Equity Index Managed Fund 82.67%
ABERDEEN STANDARD OEIC VI 8Aberdeen Global Emerging Markets Quantitative
Equity Fund 62.10%
ACS POOLED PROPERTY 2Scottish Widows Pooled Property ACS Fund 100%Scottish Widows Pooled Property ACS Fund 2 100%
AGFE UK REAL ESTATE SENIOR DEBT FUND LP 26AgFe UK Real Estate Senior Debt Fund LP 78%
ARTEMIS INSTITUTIONAL FUNDSArtemis Institutional Global Capital Fund 43.67% 3
BAILLIE GIFFORD INVESTMENT FUNDS ICVC 13Baillie Gifford Multi Asset Growth Fund 23.10%
BLACKROCK AUTHORISED CONTRACTUAL SCHEME 1 11ACS Climate Transition World Equity Fund 68.79%ACS World Multifactor Equity Tracker Fund 45.12%BlackRock ACS Japan Equity Tracker Fund 76.85%BlackRock ACS UK Equity Tracker Fund 91.87%BlackRock ACS US Equity Tracker Fund 77.18%
BLACKROCK COLLECTIVE INVESTMENT FUNDS 9iShares Global Property Securities Equity Index Fund 39.47%
BLACKROCK FIXED INCOME DUBLIN FUNDS 5iShares Emerging Markets Government Bond Index
Fund (IE) 44.04%iShares Emerging Markets Local Government Bond
Index Fund (IE) 70.52%
BNY MELLON INVESTMENTS FUNDS 10BNY Mellon Global Balanced Fund 20.64%BNY Mellon Global Equity Fund 25.41%BNY Mellon US Opportunities Fund 38.85%Insight Global Absolute Return Fund 77.48%Insight Global Multi-Strategy Fund 42.37%Newton Multi-Asset Growth Fund 25.43%Newton UK Income Fund 27.65%Newton UK Opportunities Fund 52.95%
BNY MELLON MANAGED FUNDS II 10Insight Absolute Fund of Funds 84.02%
FIDELITY ACTIVE STRATEGY 20FAST-UK Fund 29.52%
HBOS ACTIVELY MANAGED PORTFOLIO FUNDS ICVC 1Absolute Return Fund 94.59%Diversified Return Fund 94.22%Dynamic Return Fund 96.62%
HBOS INTERNATIONAL INVESTMENT FUNDS ICVC 1European Fund 93.42%Far Eastern Fund 80.45% International Growth Fund 52.44%Japanese Fund 94.72%North American Fund 95.26%
HBOS PROPERTY INVESTMENT FUNDS ICVC 1UK Property Fund 50.07%
HBOS SPECIALISED INVESTMENT FUNDS ICVC 1Cautious Managed Fund 51.68%Ethical Fund 81.73%Fund of Investment Trusts 40.08%Smaller Companies Fund 65.10%Special Situations Fund 50.41%
HBOS UK INVESTMENT FUNDS ICVC 1UK Equity Income Fund 61.53% UK FTSE All-Share Index Tracking Fund 56.88%UK Growth Fund 62.92%
HLE ACTIVE MANAGED PORTFOLIO AUSGEWOGEN 48.09% 18
HLE ACTIVE MANAGED PORTFOLIO DYNAMISCH 37.37% 18
HLE ACTIVE MANAGED PORTFOLIO KONSERVATIV 36.25% 18
INVESCO PERPETUAL FAR EASTERN INVESTMENT SERIES
12
Invesco Perpetual Asian Equity Income Fund 26.50%
INVESTMENT PORTFOLIO ICVC 22IPS Growth Portfolio 28.33%IPS Income Portfolio 24.99%
LAZARD INVESTMENT FUNDS 16Lazard Developing Markets Fund 90.17%
MGI FUNDS PLC 14Mercer Diversified Retirement Fund 69.42%Mercer Multi Asset Defensive Fund 58.01%Mercer Multi Asset Growth Fund 64.05%Mercer Multi Asset High Growth Fund 80.19%Mercer Multi Asset Moderate Growth Fund 82.02%
MULTI MANAGER ICVC 22Multi Manager UK Equity Growth Fund 83.73%Multi Manager UK Equity Income Fund 39.42%
PAN EUROPEAN URBAN RETAIL FUND 24Pan European Urban Retail Fund 22%
PEMBERTON DEBT FUND SCS 25Pemberton European Mid-Market Debt Fund II 100%
RETAIL AUTHORISED UNIT TRUSTS 9BlackRock Balanced Growth Portfolio Fund 36.73%
RUSSELL INVESTMENT COMPANY PLC 15Russell Asia Pacific Fund 33.08%Russell Euro Fixed Income Fund 32.46%Russell Investments US Bond Fund 51.67%Russell Sterling Bond Fund 44.26%
SCHRODER FUNDS ICAV 23Schroder Sterling Liquidity Fund 85.92%Schroder Sterling Short Duration Bond Fund 91.37%
SCHRODER INTERNATIONAL SELECTION FUND 19 Emerging Market Bond Fund 65.36% Multi Asset Total Return 20.71%
SCHRODER MATCHING PLUS 19Schroder Matching Plus Bespoke Investment Fund 10 100%
SCOTTISH WIDOWS INCOME AND GROWTH FUNDS ICVC 2
Adventurous Growth Fund 44.62% Balanced Growth Fund 30.95%Corporate Bond 1 Fund 96.10%Corporate Bond PPF Fund 100%Progressive Growth Fund 46.94%Scottish Widows GTAA 1 83.54% SW Corporate Bond Tracker 100%UK Index Linked Gilt Fund 100%
SCOTTISH WIDOWS INVESTMENT SOLUTIONS FUNDS ICVC 2
Asia Pacific (ex Japan) Equity Fund 98.63%European (ex UK) Equity Fund 95.99%Fundamental Index Emerging Markets Equity Fund 95.11%Fundamental Index Global Equity Fund 95.61%Fundamental Index UK Equity Fund 86.44%Japan Equities Fund 88.67%Scottish Widows Corporate Bond Fund 67.34%Scottish Widows Gilt Fund 96.14%Scottish Widows High Income Bond Fund 28.92%Scottish Widows International Bond Fund 69.82%Scottish Widows Strategic Income Fund 64.53%Fundamental Low Volatility Index Emerging Markets Equity Fund 95.24%Fundamental Low Volatility Index UK Equity Fund 91.30%Fundamental Low Volatility Index Global Equity Fund 98.13%US Equities Fund 100%
SCOTTISH WIDOWS MANAGED INVESTMENT FUNDS ICVC 2
Balanced Portfolio Fund 82.72%Cash Fund 98.94%Cautious Portfolio Fund 61.79%International Equity Tracker Fund 80.95%Opportunities Portfolio Fund 91.60%Progressive Portfolio Fund 72.11%
SCOTTISH WIDOWS OVERSEAS GROWTH INVESTMENT FUNDS ICVC 2
American Growth Fund 83.51%European Growth Fund 89%Global Growth Fund 55.13%Japan Growth Fund 93.23%Pacific Growth Fund 75.29%
SCOTTISH WIDOWS TRACKER AND SPECIALIST INVESTMENT FUNDS ICVC 2
Emerging Markets Fund 87.89%UK All Share Tracker Fund 91.06%UK Fixed Interest Tracker Fund 96.49%UK Index-Linked Tracker Fund 39.08%UK Smaller Companies Fund 20.27%UK Tracker Fund 45.74%
SCOTTISH WIDOWS UK AND INCOME INVESTMENT FUNDS ICVC 2
Environmental Investor Fund 73.54% Ethical Fund 80.07% UK Growth Fund 62.36%
SSGA ASIA PACIFIC TRACKER FUND 93.66% 4
SSGA EUROPE (EX UK) 95.98% 4
THE TM LEVITAS FUNDS 21TM Levitas A Fund 52.60%TM Levitas B Fund 47.11%
UBS INVESTMENT FUNDS ICVC 17UBS Global Optimal Fund 30.94%

354 Lloyds Banking Group Annual Report and Accounts 2020
Subsidiaries and related undertakings continued
UNIVERSE, THE CMI GLOBAL NETWORK 6CMIG Access 80% 100%CMIG Focus Euro Bond 99.93%CMIG GA 70 Flexible 100%CMIG GA 80 Flexible 100%
UNIVERSE, THE CMI GLOBAL NETWORK (Continued)CMIG GA 90 Flexible 100%Continental Euro Equity 97.39%Euro Bond 59.66%Euro Cautious 89.14%Euro Currency Reserve 98.63%European Enhanced Equity 100%Japan Enhanced Equity 93.17%Pacific Enhanced Basin 79.33%UK Equity 77.55%US Bond 94.14%US Currency Reserve 75.98%US Enhanced Equity 86.92%US Tracker 28.92%
Principal place of business for collective investment vehicles(1) Trinity Road, Halifax, West Yorkshire, HX1 2RG(2) 15 Dalkeith Road, Edinburgh, EH16 5WL(3) Cassini House, 57 St James’s Street, London SW1A 1LD(4) 20 Churchill Place, Canary Wharf, London E14 5HJ(5) 200 Capital Dock, 79 Sir John Rogerson's Quay, Dublin 2, Ireland(6) Lemanik Asset Management S.A, 106 route d’Arlon, L-8210, Mamer, Luxembourg(7) 35a Avenue John F. Kennedy, L-1855, Luxembourg(8) Aberdeen Asset Managers Ltd, 1 Bread Street, Bow Bells House, London, EC4M 9HH(9) BlackRock Fund Managers Ltd, 12 Throgmorton Avenue, London EC2N 2DL(10) BNY Mellon Investment Funds, BNY Mellon Centre, 160 Queen Victoria Street, London,
EC4V 4LA(11) Aztec Group House, 11-15 Seaton Place, St Helier, Jersey, Channel Islands, JE4 0QH(12) Perpetual Park, Perpetual Park Drive, Henley-on-Thames, Oxfordshire, RG9 1HH(13) Calton Square, 1 Greenside Row, Edinburgh EH1 3AN(14) 70 Sir John Rogerson’s Quay, Dublin 2, Ireland(15) 78 Sir John Rogerson’s Quay, Dublin 2, Ireland(16) 50 Stratton Street, London, W1J 8LL(17) UBS Investment Funds ICVC, 21 Lombard Street, London, EC3V 9AH(18) Oppenheim Asset Management Services S.à r.l. , 2, Boulevard Konrad Adenauer, L-1115
Luxembourg(19) 5, Rue Hohenhof, L-1736, Senningerberg, Luxembourg(20) 2a, Rue Albert Borschette, BP 2174, L-1021, Luxembourg(21) Thesis Unit Trust Management Ltd , Exchange Building, St. John’s Street, Chichester, West
Sussex PO19 1UP(22) 25 Gresham Street, London EC2V 7HN(23) Schroder Investment Management (Ireland) Limited, Georges Court, 54-62 Townsend
Street, Dubin 2, DO2 R156(24) Jackson House, 18 Saville Row, London, W1S 3PW(25) 2 - 4, Rue Eugène Ruppert, L-2453, Luxembourg(26) 3rd Floor South, 55 Baker Street, London, W1U 8EW
* The undertaking does not have share capital+ The undertaking does not have a registered office# In relation to Subsidiary Undertakings, an undertaking external to the Group holds shares
Shares held directly by Lloyds Banking Group plc& The Group holds voting rights of between 20% and 49.9%~ The Group holds voting rights of 50%(i) Ordinary Shares (ii) A Ordinary Shares(iii) B Ordinary Shares(iv) Deferred Shares (v) Preference Shares(vi) Preferred Ordinary Shares(vii) Redeemable Non-voting Shares(viii) C Ordinary Shares(ix) N Ordinary Shares(x) Preferred A Ordinary Shares (xi) Redeemable Preference Shares(xii) A4 Ordinary Shares (xiii) Redeemable Ordinary Shares(xiv) Common Stock(xv) Preferred B Ordinary Shares (xvi) A3 Ordinary Shares(xvii) A2 Ordinary Shares(xviii) A1 Ordinary Shares (xix) Z Ordinary Shares (xx) B1 Ordinary Shares(xxi) LN Deferred Shares(xxii) D Ordinary Shares(xxiii) E Ordinary Shares(xxiv) W Ordinary Shares(xxv) X Ordinary Shares(xxvi) Y Ordinary Shares(xxvii) Z1 Ordinary Shares(xxviii) Ordinary Non-Voting Shares(xxix) B Ordinary Non-Voting Shares(xxx) Non-Voting Deferred Shares(xxxi) Ordinary Limited Voting Shares(xxxii) Non-Voting Preference
Registered office addresses(1) 25 Gresham Street, London, EC2V 7HN(2) Charterhall House, Charterhall Drive, Chester, CH88 3AN(3) 69 Morrison Street, Edinburgh, EH3 8YF(4) Trinity Road, Halifax, West Yorkshire HX1 2RG(5) The Mound, Edinburgh, EH1 1YZ(6) 40a Station Road, Upminster, Essex, RM14 2TR(7) Naritaweg 165, 1043 BW, Amsterdam, Netherlands(8) Minter Ellison, Governor Macquarie Tower, Level 40, 1 Farrer Place, Sydney, NSW 2000,
Australia(9) 1 Brookhill Way, Banbury, Oxon, OX16 3EL(10) 6th Floor, 125 London Wall, London EC2Y 5AS(11) The Corporation Trust Company, Corporation Trust Center, 1209 Orange Street,
Wilmington, Delaware 19801(12) Barnett Way, Gloucester, GL4 3RL(13) 1 More London Place, London, SE1 2AF(14) 1095 Avenue of the America’s, 34th Floor, New York, NY 10036, United States(15) 2 North Queen Street, Belfast, Northern Ireland, BT15 1ES(16) Suite 6, Rineanna House, Shannon Free Zone, Co. Clare, Ireland(17) 60313 Frankfurt AM Main, Thurn-Und, Taxis-Platz 6, Germany(18) Hoogoorddreef, 151101BA, Amsterdam, Netherlands(19) The Shard, 32 London Bridge Street, London SE1 9SG(20) 33 Old Broad Street, London, EC2N 1HZ(21) Prins Bernhardplein 200, 1097 JB, Amsterdam, Netherlands(22) Citco REIF Services, 20 Rue de Poste, L-2346, Luxembourg(23) International House, Cooil Road, Douglas, Isle of Man, IM2 2SP(24) Corporation Service Company, 251 Little Falls Drive, Wilmington, DE 19808, USA(25) 69 Morrison Street, Edinburgh, United Kingdom, EH3 8BW(26) 1 Bartholomew Lane, London EC2N 2AX, United Kingdom(27) 1, Avenue du Bois, Luxembourg, L – 1251, Luxembourg(28) SAB Formalities, 23 Rue de Roule, Paris, 75001, France(29) c/o PATRIZIA, 166 Sloane Street, London, SW1X 9QF(30) 20 Rue de la Poste, L-2346 Luxembourg(31) 2nd Floor, 21 Palmer Street, London, SW1H 0AD(32) McStay Luby, Dargan House, 21-23 Fenian Street, Dublin 2, Ireland(33) 3rd Floor, Standard Bank House, 47-49 La Motte Street, St. Helier, JE2 4SZ, Jersey(34) P O Box 186, Royal Chambers, St Julian’s Avenue, St. Peter Port, GY1 4HP, Guernsey(35) De Entrée 254, 1101 EE, Amsterdam, Netherlands(36) 47 Esplanade, St. Helier, Jersey, JE1 0BD(37) Fascinatio Boulevard 1302, 2909VA Capelle aan den IJssel, Netherlands(38) Avenida Dr. Chucri Zaidan, n° 296, cj 231 e 51, Bairro Vila Cordeiro, Cidade de São Paulo,
Estado de São Paulo, Cep 04583-110 Brazil(39) 2nd Floor, Liberation House, Castle Street, St. Helier, JE1 1EY, Jersey(40) 1 Vine Street, London, W1J 0AH(41) 39 Queens Road, Aberdeen, AB15 4ZN(42) 5th Floor, The Exchange, George’s Dock, IFSC, Dublin 1, Ireland(43) 110 St. Vincent Street, Glasgow, G2 4QR(44) 35 Great St. Helen’s, London, EC3A 6AP(45) Charlton Place, Charlton Road, Andover, SP10 1RE(46) Glategny Court, Glategny Esplanade, St. Peter Port, GY1 1WR, Guernsey(47) Cawley House, Chester Business Park, Chester, CH4 9FB, United Kingdom(48) 6/12, Primrose Road, Bangalore, 560025, India(49) 106 Route d'Arlon, Mamer, L-8210, Luxembourg(50) St William House, Tresillian Terrace, Cardiff, CF10 5BH(51) 18th Floor, United Centre, 95 Queensway, Hong Kong(52) Pentagon House, 52-54 Southwark Street, London, SE1 1UN(53) 1A Heienhaff, Senningerberg, L-1736, Luxembourg(54) Wilmington Trust SP Services (London) Limited, Third Floor, 1 King’s Arms Yard, London,
EC2R 7AF(55) 1-2 Victoria Buildings, Haddington Road, Dublin 4, Ireland(56) 48 Boulevard Grande-Duchesse Charlotte, 1330, Luxembourg(57) Caledonian Exchange, 19A Canning Street, Edinburgh, EH3 8HE(58) 11-12 Esplanade, St. Helier, Jersey, JE2 3QA(59) Karl-Liebknecht-STR. 5, D-10178 Berlin, Germany(60) 11-12 Esplanade, St. Helier, Jesey JE4 8ZU(61) 44 Esplanade, St. Helier, Jersey, JE4 9WG(62) 8 Avenue Hoche, 75008, Paris, France(63) 26 New Street, St. Helier, Jersey, JE2 3RA(64) Calle Pinar 7, 50 Izquierda, 28006, Madrid, Spain(65) Atria One, 144 Morrison Street, Edinburgh, EH3 8EX(66) Fifth Floor, 100 Wood Street, London, EC2V 7EX, United Kingdom

Strategic rep
ortFinancial results
Governance
Risk manag
ement
Financial statements
Other inform
ation Lloyds Banking Group Annual Report and Accounts 2020 355
INTENTIONAL BLANK PAGE

356 Lloyds Banking Group Annual Report and Accounts 2020
INTENTIONAL BLANK PAGE

Designed and produced by Friend www.friendstudio.com Printed in the UK by CPI Colour, a certified CarbonNeutral® printing company, using vegetable based inks and water based sealants; the printer and paper manufacturing mill are both certified with ISO 140001 Environmental Management systems standards and both are Forest Stewardship Council certified. When you have finished with this report, please dispose of it in your recycled waste stream.

Head office25 Gresham Street London EC2V 7HN
+44 (0)20 7626 1500
www.lloydsbankinggroup.com
Registered officeThe Mound Edinburgh EH1 1YZ Registered in Scotland no. SC95000


