DALLAS COUNTY UTILITY AND -\' );J::[. ! - RECLAMATION DISTRICT ........... " ..... {r/ "'It"'" DALLAS iljFORT WORTH INTERNATIONAL AIRPORT Report to the Texas Water Development Board DallaslFort Worth International Airport Raw Water Supply Study TWDB Contract No. 95-483-084 Final Report January 1996
Transcript
.,.,~'l;"I""'~"
DALLAS COUNTY UTILITY AND t~~'~/::;;!;~\ -\' );J::[. ! ~ -
RECLAMATION DISTRICT \.~ ........... " ..... {r/ "":~ .l.'l~.".
List of Tables ••• List of Figures List of Abbreviations
Chapter I. Introduction Study Objective •• Project Participants Study Area ••.• Previous Studies
TABLE OF CONTENTS
Chapter II. Regulatory Considerations
Chapter III. Development of Raw Water Demands Spine Road Irrigation •••••• Golf Course Irrigation •••••• Administration Building Irrigation Irrigation of Outlying Areas Cooling Water Make-Up .••• Total Raw Water Demands •••
Chapter IV. Sources of Raw Water Tri gg Lake •••.•••••••••••.•.• Dallas County Utility Reclamation District (DCURD) Estimated Demands for DCURD Raw Water •• Ability of DCURD to Meet the Anticipated Demands
Chapter V. Proposed Improvements Phase I Improvements
Line Segment A • Option Al .• Option A2 ••
Line Segment B • Line Segment C .•.. Lake Remle Pump Station
Option LRI Option LR2 ••.•••
Line Segment D •.••• Opti on Dl • • • . • • Option D2 •.••.•
Trigg Lake Pump Station Phase II Improvements .,.
Li ne Segment A • • • • . • • Line Segments E. F. G. and H Southeast Pump Station Southeast Reservoir .• Trigg Lake Pump Station Lake Remle Pump Station
Chapter VI. Opinion of Probable Costs New Capital Costs •••••.••• Existing Debt Service Requirements C OIIIllOd i ty Charges •••••••••
Chapter VII. Feasibility Assessment ••••••••• Cost of Potable Water Without a Raw Water System •• Cost of Potable Water with Raw Water System in Place Cos t of Raw Water • • • • • • • • • • • • Cost Benefit Analysis .•••••••• . Value-Added Benefits •••••••••••
Spine Road Irrigation Zone Demands •••••• Spine Road Monthly Irrigation Demands •••••• DFW Golf Course Irrigation Demands •.••••• Administration Building Monthly Irrigation Demands Outlying Area Monthly Irrigation Demands • Central Utilities Plant Monthly Water Demand Total Nonpotable Water Demands ••.•• Phase I Water Budget - Average Conditions Phase I Water Budget - Drought Conditions Phase II Water Budget - Average Conditions Phase II Water Budget - Drought Conditions Opinion of Probable Construction Costs • Opinion of Total Probable Project Costs •• Annual TRA Debt Service Requirements Historical Dallas Water Utility Rates •• Historical Fort Worth Water Utility Rates Potable Water Rate Increase Scenarios ••••• Projected Potable Water Costs Without a Raw Water System • • • • • • • • • • • • • • • • • • • • • •
Projected Potable Water Costs With a Raw Water System Raw Water Supply Alternatives •.•••••••••••. Comparison of Projected Water Costs With/Without Raw Water A 1 ternat i ve 1 • . • . • . . . . . • • . • . • • • . • . • .
Comparison of Projected Water Costs With/Without Raw Water Al ternati ve 2 ••••••••••••••••••••••••
Comparison of Projected Water Costs With/Without Raw Water A 1 ternat i ve 3 • • • • • • • • • • • • • • • • . • • . . • •
Comparison of Projected Water Costs With/Without Raw Water Alternative 4 ••••••.•••••.••••••••••
Comparison of Projected Water Costs With/Without Raw Water Alternative 5 •••.•••••.•.••.••..••••
Comparison of Projected Water Costs With/Without Raw Water Alternative 6 •••••.••.••.
Net Present Worth Analysis ••••••.••• Percent Return on Investment Analysis ••.••
Phase I Hydraulic Gradient from Lake Remle to Trigg Lake Line Segment D Layout 0 0 0 0 0 0 0 0 0 0 0 0 0 0 0
Phase I Hydraulic Gradient Along the Spine Road Line Segment E. F. G. & H Layout 0 0 0 0 0 0 0
iv
Page
1-3 111-2 111-3 111-4 111-5 111-9
II 1-10 II 1-11
IV-4 V-4 V-7 V-8
V-ll V-13 V-16 V-18
CRWS CUP DCURD DFWIA fps gpm hp MGD msl psi RWSP RWSS SDWA Spine Road TDS TNRCC TRA TWBD
LIST OF ABBREVIATIONS
Central Regional Wastewater System Central Utilities Plant Dallas County Utility and Reclamation District Dallas/Fort Worth International Airport feet per second gallons per minute horsepower million gallons per day mean sea level per square inch Raw Water Supply Project raw water supply system Safe Water Drinking Act International Parkway Total Dissolved Solids Texas Natural Resource Conservation Commission Trinity River Authority of Texas Texas Water Development Board
v
STUDY OBJECTIVE
CHAPTER I
INTRODUCTION
The objective of this study is to determine the feasibility of implementing a raw water supply system (RWSS) for the Dallas/Fort Worth International Airport (DFWIA). With anticipated increases in the cost of potable water. the use of raw water for irrigation and industrial purposes is becoming increasingly attractive. Additionally. during periods of water shortage. potable water supplies for irrigation may not be as dependable as a raw water supply because domestic use of avail ab 1 e supplies receives a higher priority than irrigation and other nondomestic uses. Another benefit of a raw water supply system is that the use of raw water as planned for this project can .1 essen demands on the Ci ty of Da 11 as and the Ci ty of Fort Worth water systems. which supply potable water to DFWIA. and possibly defer costs of improving parts of these water systems.
In view of the above. the objective of this study is to develop a plan to provide raw water to DFWIA. As will be shown in more detail. this study envisions obtaining raw water from the Dallas County Utility and Reclamation District (DCURD) in Irving. Texas for use by DFWIA. DCURD owns and operates one of this state's largest raw water systems. the Raw Water Supply Project (RWSP). obtaining up to 16.4 million gallons per day (MGD) of reclaimed water from the Trinity River Authority of Texas' (TRA) Central Regional Wastewater System for use in making up evaporation losses in 51 lakes and associated scenic waterways and for irrigation of four golf courses. certain roadway medians. two corporate headquarters and various other landscaped open spaces.
The RWSS envisioned in this report would involve two phases. Phase I would include construction of a pipeline from Lake Remle. the RWSP receiving/detention lake on DCURD property. to the southeast edge of the DFWIA property. At this point. a meter station would be constructed which would connect to a proposed line from the eastern boundary of the airport property to Trigg Lake. the DFWIA receiving impoundment. on the western side of the airport. Phase I also includes the construction of a new pipeline within the median of International Parkway (Spine Road). This pipeline would be connected to the existing irrigation system within the Spine Road median. Phase II
1-2
of the RWSS would involve completion of a looped raw water pipel ine around the perimeter of the DFWIA property.
PROJECT PARTICIPANTS
The participants for this project include DFWIA. DCURD. and the Texas Water Development Board (TWDB). DFWIA is participating in the study in an effort to plan the continued provision of water service to all water users on airport property. The use of raw water for irrigation activities is considered a viable alternative source of irrigation water for the airport. worthy of study. DCURD is a potential provider of raw water to DFWIA. In order to complete this study. DCURD and DFWIA applied to the TWDB and received a regional planning grant to study· the feasibility of implementing a raw water supply system for DFWIA.
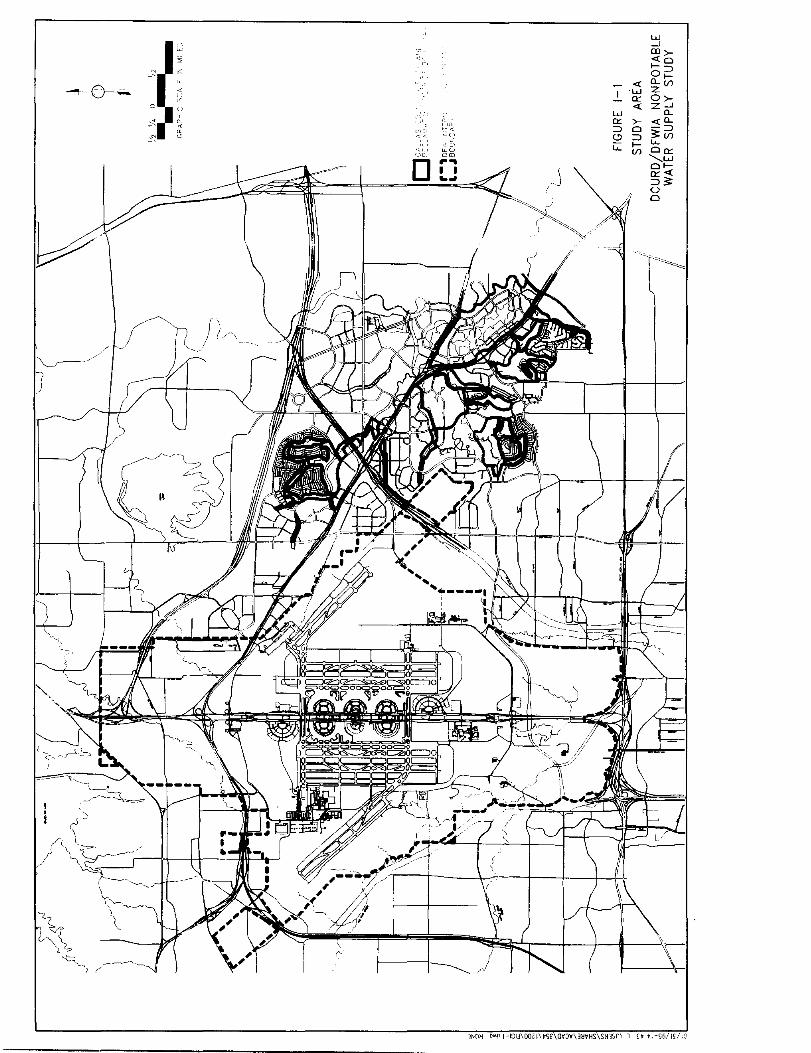
STUDY AREA
The overall study area for this project is shown in Figure I-I. In addition to the entities mentioned in the above paragraph. the study area includes portions of Dallas and Tarrant counties and portions of the cities of Irving. Grapevine. and Euless.
PREVIOUS STUDIES
The DCURD and DFWIA have each performed studies and planning projects during the last five years addressing the supply of raw water to meet the needs of DFWIA. The previous studies have been independent studies that need to be consolidated into a single "Plan." Also. the technical information developed by these previous studies needs to be revised to reflect current conditions. Accordingly. this report will update water demands; determine availability of reclaimed water to meet water demands; determine the physical facilities needed (e.g •• pipe sizes. pipeline routing. requirements to isolate raw water piping from existing potable water piping. etc.); develop opinions of probable costs; establish sequencing for constructing the DFWIA raw water supply system; and review regulatory requirements.
During 1991. the DFWIA commissioned a feasibility study for a raw water supply which could be used for irrigation and other appropriate uses. This 1991 study performed by Huitt-Zollars. Inc. evaluated the feasibility of developing a raw water system for
W -' CD>-
<,< <{O ~ ,,, >-::> 0>-
"' « <{ ILV) o-~ <W Z --""'11;-- <
a:o 0>-C' ,r <{ Z-'
" ~, ' W IL T
" a:o >- <{IL ~ IdCL
::> 0 -::> ~ V):·
,< 4
3: V) ~ 4 ' ...:'=-.' C) ::> D
-~ ~) >- '-'-'~L, I ,,0 '-'- V) 00:: '_,0 om
'-..W
0 .... 0>-I I a:o<{ .... ::>3: 0 0
lNO~ 1 n \>l
1-4
irrigation of the airport grounds and golf courses, as well as cooling tower makeup at the Central Utilities Plant. This study included an evaluation of sources of supply for raw water. One such supply identified was the Raw Water Supply project which is operated by DCURD.
Other studies being reviewed as part of this project include:
1. Dallas County Utility and Reclamation District Feasibility Study for Expansion
of Ra~ Water Supply System, Camp Dresser McKee & Inc., 1989;
2. Dallas County Utility and Reclamation District Engineer's Report Expansion of
Ra~ Water Supply System, Camp Dresser & McKee, Inc., 1991;
3. Dallas County Utility and Reclamation District Report on the Expansion of the
Ra~ Water Supply System to Serve Dallas/Fort Worth International Airport, Camp Dresser & McKee Inc., 1991; and
4. Economic Analysis of a Non-Potable Water System for Dallas/Fort Worth
International Airport, Rusty T. Hodapp, P.E., Airport Maintenance/Mechanical Systems, November 1993.
CHAPTER II
REGULATORY CONSIDERATIONS
The collection, treatment, disposal, and reuse of wastewater is regulated by the Texas Natural Resource Conservation Commission (TNRCC) in the State of Texas. Since the ultimate source of the raw water suppl i ed to Dall as County Util ity Recl amation District (DCURD) and proposed to be suppl ied to Dallas/Fort Worth International Airport (DFWIA) is a wastewater treatment plant, the use of this water must comply with TNRCC regulations. The regulations provide two alternative mechanisms for authorizing the use of treated wastewater effluent.
The first alternative is to obtain authorization to discharge effluent to a water body. Effluent that is discharged in compliance with a discharge permit is considered to be of a sufficiently high quality that further regulation of its use is not warranted. The wastewater discharge permit regulations are set forth in Chapter 305 of the TNRCC Permanent Rules.
The second alternative is to obtain authorization to reuse the reclaimed water produced through the treatment of wastewater. The regulations authorizing the use of reclaimed water are set forth in Chapter 310 of the TNRCC Permanent Rules. This section of the rules establishes reclaimed water quality limits and management practices for different types of uses. The limits and practices are deemed appropriate measures to safeguard the public based on the likelihood that individuals might come in contact with the reclaimed water.
DCURD's use of reclaimed water is specifically identified and authorized in the wastewater di scharge permit for TRA' s Central Regi onal Wastewater System (CRWS). Thi s authorization includes a limit on the amount of reclaimed water that TRA can currently deliver to DCURD at Lake Remle. The additional demand associated with the DFWIA project will not cause this limitation to be exceeded. As a result, it is anticipated that the extension of service to DFWIA will not effect the regulatory authority of DCURD'S operations.
CHAPTER III
DEVELOPMENT OF RAN WATER DEMANDS
Dallas/Fort Worth International Airport (DFWIA) owns, operates, and maintains its own potabl e water di stri bution system withi n the ai rport property. DFWIA purchases treated water from the cities of Fort Worth and Dallas. The water purchased by DFWIA
is stored on-site and then redistributed to meet water demands for the airport operations, as well as tenants at the airport. Many of the water demands that are bei ng supp 1 i ed through thi s potable water di stri but i on system do not requi re the superior quality associated with potable water suppl ies. Demands that could be supplied with an alternative water supply are primarily related to irrigation activities at the airport. In addition, make-up water for the cool ing tower operations at the Central Utilities Plant has been identified as a demand that could be satisfied with a lower quality water. Specific demands within these two categories are discussed in the following sections.
SPINE ROAD IRRIGATION
The Spine Road (International Parkway) from the southern boundary of the airport to the northern boundary of the airport is irrigated extensively. Currently, this
i rri gat i on water is provi ded through the potable water system' i n the area. The potable water system consists of parallel 18- and 21-inch lines for most of this area.
Separate i rrigati on pipes are connected to the potabl e trunkl i nes at numerous locations along the spine road corridor. The potable water system and the irrigation
connections are illustrated in Figures 111-1 through 111-3.
The connections between the irrigation system and the potable water lines generally consist of 4-inch flanged fittings installed when the potable water lines were
ori gi nally constructed. These connections i ncl ude i sol at i on val ves and backflow preventers. The irrigation pipes connected to the potable water system are generally
4-inch pipes. The 4-inch irrigation pipes are used to distribute water to each of
the irrigation zones. In most cases, the 4-inch pipes form grids between several
irrigation zones and several connections to the potable water system to provide adequate pressures and system redundancy. Figure 111-4 represents a typical section
of the irrigation system.
~--~J_ ---J~]
===lIlF --~ ~_J
--~ ~
GRAPHIC SCALE IN FEET
® EXISnNG IRRICA nON CONNECTION TO THE POTABLE SYSTEM
I I//~------·-~ \ 10 ) ( DCURD/DFWIA NON POTABLE I ( / \ \ 1 // ..------r----------.-.---\ _____ WATER SUPPLY STUDY
, i'?/ ~lf 4' \
111-6
Each of the irrigation zones is isolated with control valves so that individual zones can be operated independently. The control valves are all connected to master controll ers whi ch are programmed to operate each zone sequenti ally. The master controllers can be programmed to determine the timing, sequencing, and duration of the irrigation for each zone.
Historically, the Spine Road irrigation system has been operated six nights per week, with each zone being irrigated three times per week. This operation was revised slightly during 1993, when the irrigation of some areas was changed from three times per week to one time per week as a cost-saving measure.
Currently, the controllers are programmed to operate each zone for 40 minutes during the period of June through September. During this period, the irrigation system is operated between the hours of 9 p.m. and 6 a.m. Each zone is irrigated for 20 minutes during the months of April, May, October, and November. During this period, irrigation operations are generally conducted between the hours of 9 p.m. and 3 a.m. During the winter months, December through March, irrigation is conducted on an as needed basis only.
These frequencies and durations of irrigation are the standard operating procedures for the irrigation systems. However, changes to these procedures are implemented in response to climatic conditions. The DFWIA Irrigation Department has access to the rainfall records from the National Weather Service Station at the airport. In response to significant rainfall events, the Irrigation Department staff will temporarily suspend irrigation activities. In addition, irrigation activities may be curtailed during high summertime use periods because the extensive operation of the irrigation system can deplete the amount of water stored in the potable water tanks located on the airport. Since the potable water needs represent a higher priority, irrigation use is curtailed until the volume of water in the storage tanks is replenished. Curtailment of irrigation is also impacted by the Dallas Water Utilities' rate of flow control and capacity limitations in the Fort Worth supply main.
The standard irrigation frequency and duration for the period of June through September is considered to be the maximum amount of irrigation that can be achieved, since additional irrigation would require the operation of the system during daylight
111-7
hours when the airport is most heavily used. As a result, the peak day demand and the peak instantaneous demand for the Spine Road irrigation will be determined based on these operating conditions.
The demands for the Spine Road irrigation system were determined from information provided by the DFWIA maintenance staff. Table 111-1 contains demand information for each of the irrigation zones. The irrigation zones are generally depicted in Figures 111-5 through 111-7.
Table 111-2 contains the total monthly demands based on the current, reduced irrigation practices. Once an alternative source of irrigation water is available, reducing the frequency of irrigation within the median areas may no longer be desirable. If the frequency of irrigation for these areas were increased to three times per week to match the irrigation rates of the other areas, the total irrigation demands would be increased. Table 111-2 also includes the irrigation demands generated under this alternative mode of operation.
Depending upon the irrigation practices employed, the demands identified in Table 111-2 are considered to be the maximum demands through the life of the project. Since additional irrigation acreage is not anticipated in this area, increases in demand over the existing demands are not projected for the future.
GOLF COURSE IRRIGATION
The Bear Creek Golf Center operates two IS-hole golf courses in the southwest quadrant of the airport. Access to the Bear Creek Golf Courses is provided from South Airfield Drive. In addition to the existing golf courses, the operators of the complex have an option to develop two additional golf courses adjacent to the existing golf courses.
In addition, the Bear Creek Complex includes a soccer field, softball field, driving range, and a picnic area. The golf courses and other areas are irrigated with water provided from Trigg Lake. DFWIA holds a water use permit which limits diversions from Trigg Lake to 610 acre-feet per year.
Irrigation Zone
North
2-North
2-South
3-North
3-South
4-North
4-South
South
TABLE ill-I
SPINE ROAD IRRIGATION ZONE DEMANDS DCURDIDFWIA RAW WATER SUPPLY STUDY
Frequency (days/week)
1 3
1 3
1 3
1 3
3
1 3
1 3
1 3
Maximum Demand Generated During Irrigation Cycle
(gpm)
520 1850
306 700
199 600
100 400
200
110 500
249 600
695 3292
Total Demand of All Sprinkler
Heads in Zone (gpm)
5,567 25,750
2,845 3,800
1,825 5,000
2,264 3,300
2,700
2,017 2,600
1,410 4,900
8,299 37,357
Note: Information provided by DFWIA Irrigation Staff.
Approximate Area of Irrigation
(acres)
17 79
9 12
6 15
7 10
8
6 8
4 15
25 114
§
~
500 250 500 lono .. GRAPHIC SCALE IN FEET
liI:i:t:::::J ~U~~~N~~ ':~~A TED
CuRRENTLY IRRIGATED J m~ES PER WEEK
" ( oqjj ;;'le3J
!, II
D~: ""
-----o--rc
~~"'~--' ,-Ie .... =,
OC~_ - - .- ._----/ -----_. __ ._---
-'C~o __ ::,_c,. ----'c=---'-'.c~-='ij
FIGURE 111-5
EXISTING SPINE ROAD IRRIGATION ZONES
DCURD/DFWIA NONPOTABLE WATER SUPPLY STUDY
'I I,
?~
_____ ._.~.-. [~~ l;;==.=cc~_=~_~=.~ =-=-. =] c = l--~J 0)
SPINE ROAD MONTHLY IRRIGATION DEMANDS DCURDIDFWIA RAW WATER SUPPLY STUDY
Month
January
February
March
April
May
June
July
August
September
October
November
December
Annual Total
Existing Conditions! (Million Gallons)
0.0
0.0
0.0
24.8
24.8
49.7
49.7
49.7
49.7
24.8
24.8
.J1Q
298.0
Previous Conditions2
(Million Gallons)
0.0
0.0
0.0
29.1
29.1
58.3
58.3
58.3
58.3
29.1
29.1
.J1Q
349.6
Existing conditions includes irrigating some areas one time per week.
2 Previous conditions includes irrigating all areas three times per week.
111-13
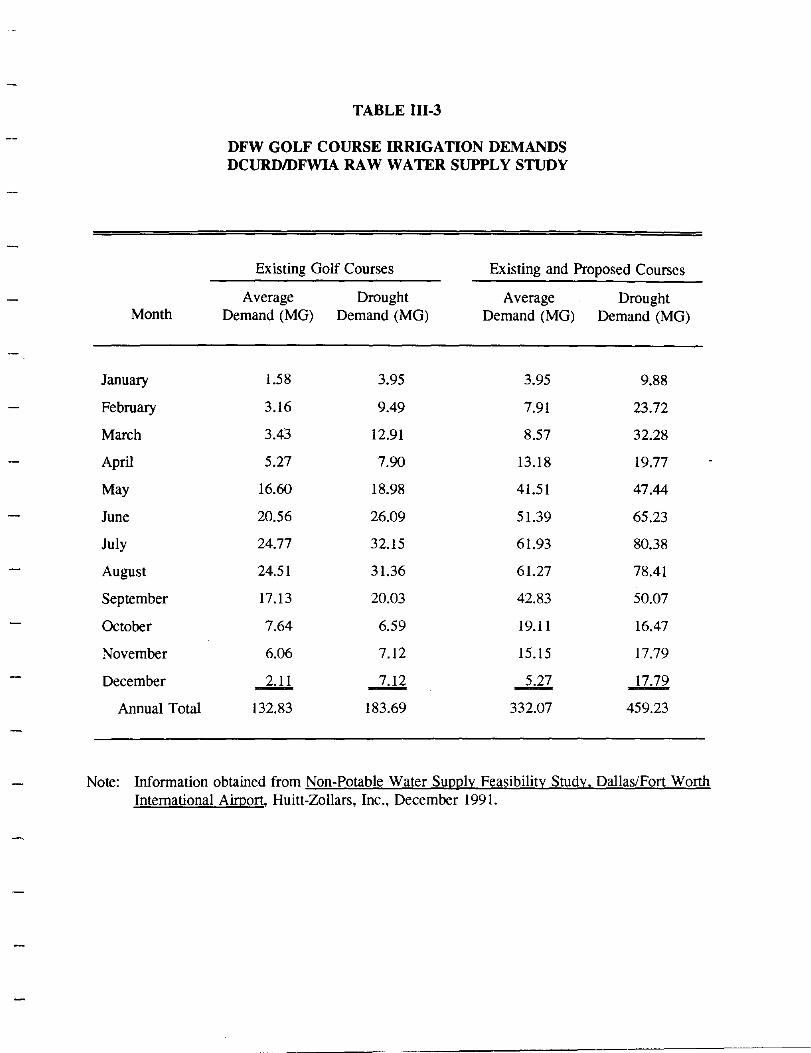
A previous study has indicated that the annual yield from Trigg Lake is sufficient to meet the existing. normal demands. Under drought conditions. the demand from the existing golf courses would exceed the available yield during the summer months. The remaining demand can be met from water stored in the lake. if lake levels are sufficient; however. water levels in Trigg Lake typically decline during the summer months. It is anticipated that Trigg Lake will not be able to provide enough water for irrigation during extreme. summertime droughts. The additional demand generated by the two additional golf courses would exceed both the annual use permit and the available summertime yields (Huitt-Zollars. Inc. 1991). The existing and future monthly irrigation demands for the Bear Creek Golf Course Complex are contained in Table III-3.
ADMINISTRATION BUILDING IRRIGATION
The main administration building complex for DFWIA is located southeast of the intersection of South Airfield Drive and Carbon Road. The buildings and grounds in this area form a "campus" type setting. Maintaining this type of setting requires significant irrigation of landscaped areas.
Currently. DFWIA is irrigating this area with potable water. Irrigation pipes are connected to potable water lines in the area. The connections contain both isolation valves and backflow preventers. Irrigation in the area is contr.olled by automatic valves and a master controller.
The current irrigation practice is to irrigate the area three nights per week. The area is i rri gated for 40 mi nutes each time duri ng the peri od of June through September. The area is irrigated for 20 minutes during the months of April. May. October. and November. Irrigation during the winter months. December through March is conducted only as needed.
Information concerning the peak and total demands for the administration building area was provided by the DFWIA Irrigation Department staff. The peak demand generated within this zone is 450 gallons per minute (gpm). The total demand generated by all sprinkler heads in the zone is 7.561 gpm. The total estimated area under irrigation is 23 acres. The total monthly demands are shown in Table 111-4. It is anticipated that these demands will remain constant in the future.
--~---~-----------------------
Month
January
February
March
April
May
June
July
August
September
October
November
December
Annual Total
TABLE ill-3
DFW GOLF COURSE IRRIGATION DEMANDS DCURDIDFWIA RAW WATER SUPPLY STUDY
Existing Golf Courses Existing and Proposed Courses
Average Demand (MG)
1.58
3.16
3.43
5.27
16.60
20.56
24.77
24.51
17.13
7.64
6.06
...w. 132.83
Drought Demand (MG)
3.95
9.49
12.91
7.90
18.98
26.09
32.15
31.36
20.03
6.59
7.12
..ill 183.69
Average Demand (MG)
3.95
7.91
8.57
13.18
41.51
51.39
61.93
61.27
42.83
19.11
15.15
.2:1l 332.07
Drought Demand (MG)
9.88
23.72
32.28
19.77
47.44
65.23
80.38
78.41
50.07
16.47
17.79
17.79
459.23
Note: Information obtained from Non-Potable Water Supply Feasibility Study, Dallas/Fort Worth International Airport, Huitt-Zollars, Inc., December 1991.
TABLE III-4
ADMINISTRATION BUILDING MONTHLY mRIGATION DEMANDS DCURDIDFWIA RAW WATER SUPPLY STUDY
Month
January
February
March
April
May
June
July
August
September
October
November
December
Annual Total
Demand (MG)
0.00
0.00
0.00
1.98
1.98
3.95
3.95
3.95
3.95
1.98
1.98
J1QQ 23.72
Note: Information provided by DFWIA Irrigation Staff.
111-16
IRRIGATION OF OUTLYING AREAS
The DFWIA encompasses a total of 17,707 acres. The majority of this land is set aside for airfield, terminal, and roadway facilities. However, a significant portion of the remaining land is available for other uses. DFWIA completed a Land Use Plan in December 1994. This plan indicates that a total of 6,600 acres of airport property may be made available for either commercial or light industrial development. These areas are generally located around the perimeter of the airport with access available from Airfield Drive or thoroughfares surrounding the airport. The North Foreign Trade Zone is incorporated into this plan.
The development of the Land Use Plan by DFWIA was a strategic step to enhance the existing development at the airport by promoting additional development. The Land Use Plan establishes the highest and best use for airport property while maintaining and protecting its primary mission as an air carrier airport.
The existing development at the airport and any future development will generate additional raw water demands for irrigation purposes. Currently, these demands are being met with potable water supplied by DFWIA. The amount of potable water delivered to airport tenants is metered, either as a part of the total potable water demand, or in some cases, through a separate irrigation meter. In either case, the airport tenant is charged for the irrigation water at the potable water rates.
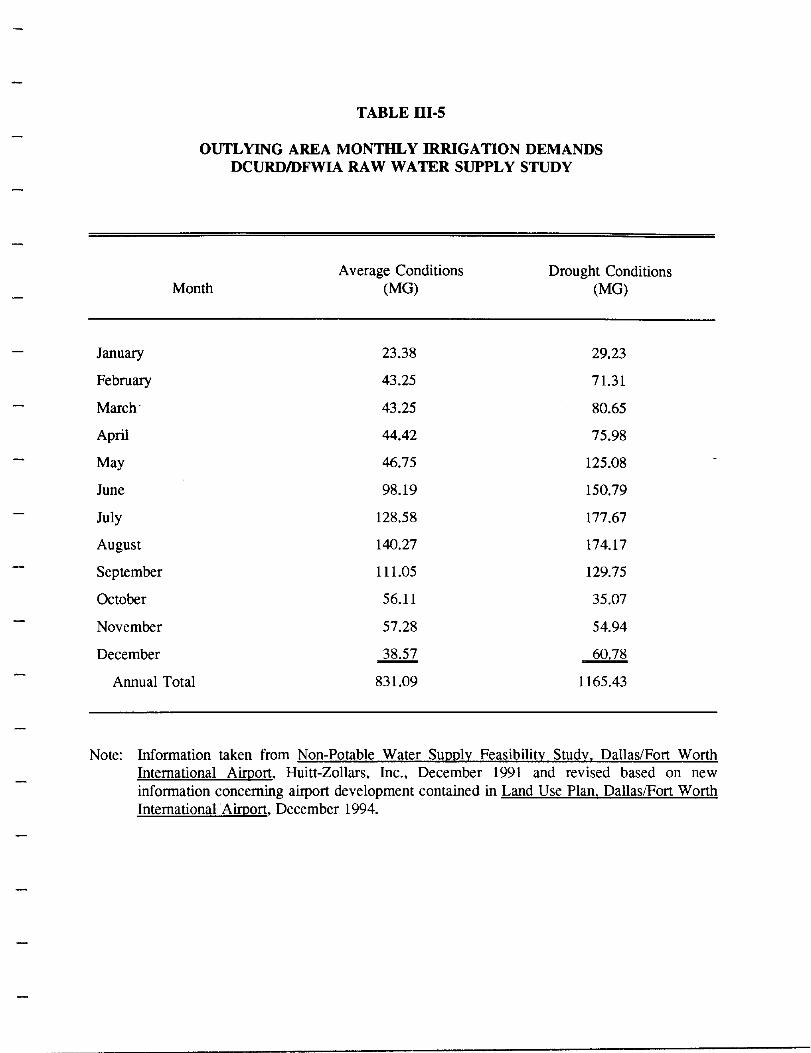
As additional development occurs, it is anticipated that the raw water system could be expanded to provi de water to meet these demands. Estimates of the amount of deve 1 opment that wi 11 occur, and the amount of i rri gat i on associ ated with those developments were included in the 1991 Nonpotable Water Supply Feasibility Study conducted by Huitt-Zoll ars, Inc. These estimates were based on a total amount of 1 and available for development of 5,600 acres and an average of 15 percent of this area being under irrigation. The Land Use Plan just released indicates that 6,600 acres will probably be made available. As a result, the demands estimated by Huitt-Zollars, Inc. will be adjusted by a factor of 1.18 (6,600/5,600). The monthly demands associated with irrigation of the outlying areas are presented in Table 111-5.
TABLE III-5
OUTLYING AREA MONTHLY IRRIGATION DEMANDS DCURDIDFWIA RAW WATER SUPPLY STUDY
Month Average Conditions
(MG) Drought Conditions
(MG)
January 23.38 29.23
February 43.25 71.31
March· 43.25 80.65
April 44.42 75.98
May 46.75 125.08
June 98.19 150.79
July 128.58 177.67
August 140.27 174.17
September 111.05 129.75
October 56.11 35.07
November 57.28 54.94
December 38.57 60.78
Annual Total 831.09 1165.43
Note: Information taken from Non-Potable Water Supply Feasibility Study. Dallas/Fort Worth International Airport, Huitt-Zollars, Inc., December 1991 and revised based on new information concerning airport development contained in Land Use Plan, Dallas/Fort Worth International Airport, December 1994.
III-18
The demands estimated for irrigation in outlying areas will also include smaller irrigation activities operated by DFWIA. These additional irrigation activities would include the tree nursery located on the west side of the airport, fire stations, and other airport facilities. It is estimated that these uses will represent 5 percent of the total demand in the outlying areas.
COOLING WATER MAKE-UP
DFWIA operates and maintains a Central Utilities Plant near the center of the airport to generate chilled and hot water. The chilled and hot water are distributed to the individual terminal buildings for heating and cooling purposes. These activities require a significant amount of make-up water. This make-up water could be provided using raw water, as long as the water is of acceptable quality.
The water quality concerns are generally associated with increased levels of dissolved solids. Potable water typically has lower levels of total dissolved solids (roS) than either raw water or reclaimed water. The increased levels of solids can cause problems with operations and maintenance. The anticipated quality of the raw water should be evaluated carefully before it is used for cooling water make-up.
For the purposes of this study, it is assumed that the raw water will be of sufficient quality to use as cooling water make-up. Since the demands gener~ted by the existing plant and a proposed expansion are small relative to the irrigation demands, it is not anticipated that the deletion of these demands would have a significant impact on the sizing of the proposed improvements. The monthly demand projections for cooling water make-up are included as Table 111-6.
TOTAL RAW WATER DEMANDS
The total, existing, raw water demands for all of the uses identified have been combined. The demand has been identified for a year with a normal precipitation pattern, as well as a drought condition. The future demands projected for the year 2010 have also been combined based on a year with normal precipitation and a drought condition. These demands are included as Table 111-7.
TABLE 111-6
CENTRAL UTILITIES PLANT MONTHLY WATER DEMAND DCURDIDFWIA RAW WATER SUPPLY STUDY
Existing Demand Month (MG)
January 1.0
February 1.0
March 2.0
April 2.4
May 2.6
June 2.9
July 4
August 4.5
September 3.0
October 1.9
November 1.1
December .l.:Q
Annual Total 27.4
Note: Information obtained from Non-Potable Water Supply Feasibility Study. Dallas/Fort Worth International Airport, Huitt-Zollars, Inc., December 1991.
Month
January
February
March
April
May
June
July
August
September
October
November
December
Annual Total
TABLE III-7
TOTAL NONPOTABLE WATER DEMANDS DCURDIDFWIA RAW WATER SUPPLY STUDY
Phase I Demands Phase II Demands
Average Demand (MG)
7.94
12.81
16.70
119.24
154.72
263.71
280.07
280.79
253.48
125.00
117.66
9.56
1641.69
Drought Demand (MG)
15.23
32.28
45.88
127.32
162.03
280.74
302.77
301.88
262.40
121.75
120.92
24.98
1798.18
Average Demand (MG)
87.16
160.48
165.59
274.14
369.11
648.55
777.89
813.34
662.09
326.83
315.78
137.98
4738.94
Drought Demand (MG)
123.41
295.47
353.64
391.54
628.37
852.99
985.70
970.39
741.92
253.97
316.71
244.84
6158.94
CHAPTER IV
SOURCES OF RAW WATER
A previous study conducted to identify potential alternatives for a raw water supply for Dallas/Fort Worth Internati onal Ai rport (DFWIA) i dent i fi ed surface runoff to Tri gg Lake and reclaimed water from the Trinity River Authority of Texas' (TRA) Central Regional Wastewater Treatment (CRWS) pl ant as potenti ally vi abl e sources (HuittZollars, Inc. 1991). The information developed as part of that study was used as an initial starting point for the current study. The current study updated the information and refined the engineering solutions. This information is discussed in the following sections.
TRIGG LAKE
Trigg Lake is a surface impoundment formed by a dam located on a tributary of Bear Creek. The dam and lake are located on DFWIA property southwest of the intersection of International Parkway and South Airfield Drive. The lake has a surface area of approximately 40 acres at its normal pool elevation of 511.5 feet. The volume of the lake at normal pool elevation is approximately 333 acre-feet. Assuming that the minimum desirable lake level is 507 feet, the lake has an active storage volume of 173 acre-feet (Huitt-Zollars 1991).
DFWIA is currently utilizing water impounded in Trigg Lake to supply the irrigation demands for the Bear Creek Complex. The Bear Creek Complex contains two, 18-hole golf courses, a soccer field, a softball field, a driving range, and a picnic area. The complex is operated under a long-term lease agreement.
The annual yield to Trigg Lake has been estimated to be 1860 acre-feet under 1990 development conditions (Huitt-Zollars 1991). However, DFWIA only has the right to divert 610 acre-feet of water from Trigg Lake on an annual basis. In addition to this restriction, the monthly variation in the available yield can create problems during the summer months when the yield is at its lowest and the demand for irrigation water is at its highest. Water withdrawn from the active storage area can be used to meet these peak summertime demands, assuming that the levels in the lake are sufficiently high at the beginning of the summer. If lake levels are below normal at the beginning
IV-2
of the summer, water shortages can occur during unusually hot and dry summers (HuittZollars 1991).
A revi ew of recent pumpi ng records for wi thdrawa 1 s from Tri gg Lake i ndi cate that normal diversions from the lake have ranged from 280 acre-feet to 380 acre-feet (Huitt-Zollars 1991). The lower than allowable diversions have resulted from a combination of the limited supply available during the summer periods, and the relatively low demands placed on the system by the existing golf courses during the remainder of the year. However, if Trigg Lake is used as a terminal storage facility for a raw water supply system serving DFWIA, it is anticipated that the maximum, active storage volume and allowable diversions will be utilized. This will be accomplished as a result of the increased demands on the system and the ability to maintain high lake levels at the beginning of the peak summertime usage due to a reliable source of water.
In order to utilize Trigg Lake as a terminal storage facility, it will be necessary to meter all water that is di scharged to the 1 ake from the raw water system for storage. Water withdrawn from the lake will also need to be metered so that the difference between the water withdrawn from the lake and the water discharged to the lake can be calculated. In order to comply with the existing water use permit, the difference between these values can not exceed 610 acre-feet in anyone year.
DALLAS COUNTY UTILITY AND RECLAMATION DISTRICT {DCURD}
DCURD operates a raw water supply system within the Las Co1inas development. The source for the DCURD raw water supply system is treated effluent from the TRA CRWS. The treated effluent is pumped from the CRWS plant to Lake Rem1e via a pipeline along the Elm Fork of the Trinity River. The water is temporarily stored in Lake Rem1e and then distributed throughout Las Co1inas by DCURD via a system of pump stations and pipelines. The raw water is sold by DCURD for irrigation purposes and to make up evaporation losses to maintain water levels in over 50 lakes. In addition, DCURD sells the raw water to its customers for irrigation of four (4) golf courses, public open spaces, roadway medians, and for specific corporate landscape areas.
In order to provide raw water to DFWIA, a pipeline would need to be constructed from DCURD's existing system to DFWIA. The original concept for the raw water distribution
IV-3
system on airport property assumed that raw water would ultimately be received by DFWIA at a storage facility located along the northern boundary of the airport. Locating the delivery point to the north would require the construction of a line by DCURD from Lake Reml e to the southeast quadrant of the ai rport property and then continuing along the northeastern boundary of the airport to the storage facility. The portion of this line along the northeastern boundary of the airport would parallel an internal distribution pipeline to be constructed by DFWIA.
Upon further evaluation of this conceptual layout, it was determined that moving the terminal storage facility from the northern boundary of the airport to the southeastern corner of the airport could result in significant cost savings. The cost savings would result from the deletion of the parallel line along the northeastern boundary of the airport.
It is anticipated that the proposed improvements will be constructed in phases to meet growing demands for raw water. It is further anticipated that the first phase of the improvements wi 11 be constructed to meet the exi sti ng demands generated by the irrigation activities located along the spine road, the administration buildings, and the existing golf courses. In addition, providing raw water for cooling water makeup would be included in the first phase. The irrigation demands in the outlying areas would be addressed in later phases designed to keep pace with the growing demands. The revised conceptual layout is included as Figure IV-I.
ESTIMATED DEMANDS FOR DCURD RAW WATER
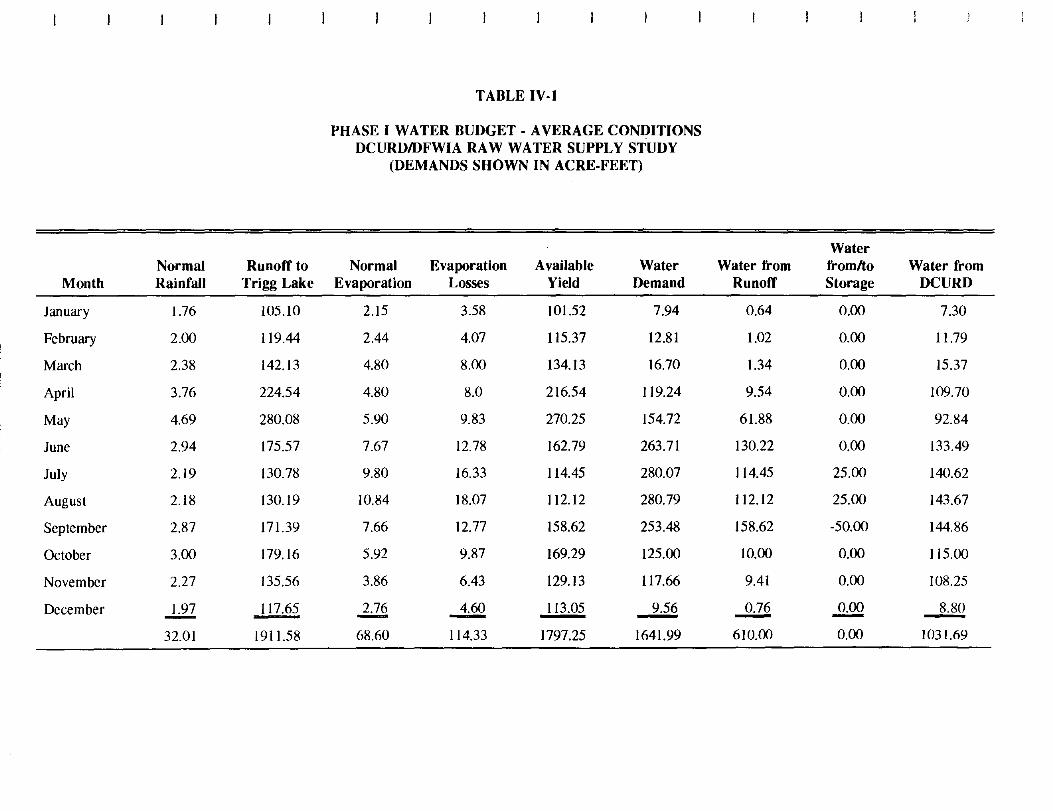
Under the revi sed conceptual 1 ayout, the raw water demands at DFWIA will be met through a combination of runoff water diverted from Trigg Lake and raw water supplied by DCURD. The annual water demands for raw water from DCURD will be the total demands minus the 610 acre-feet diverted from Trigg Lake. However, the operation of the raw water system will have an effect on the peak monthly demand for raw water from DCURD, which in turn will have an effect on the sizing of the improvements required to convey water from Lake Remle to DFWIA.
With a reliable source of water available from DCURD, DFWIA can operate Trigg Lake in a manner that maximizes the use of runoff yields to Trigg Lake and the lake's storage capacity during the peak summertime periods. By maximizing the use of water
t 1/2
GRAPHIC SCALE IN MILES
LEGEND
- ~ • - DCURD SUPPLY LINE PHASE I
m .. IIIU .. ""I",,,, DCURD SUPPLY LINE PHASE II
DFIMA DISTRIBUTION UNE PHASE I
- - - - DFW\A POTABLE WATER LINE CONVERTED TO RAW WATER LINE PHASE I
••••••••••••• DFWlA DISTRIBUTION LINE PHASE II
FIGURE IV-1
REVISED CONCEPTUAL LAYOUT
DCURD/DFWIA RAW WATER SUPPLY STUDY
IV-5
withdrawn from Tri gg Lake storage duri ng the summer months, the peak demands on DCURD's system will be minimized during the summer months. This will be true for summers with normal precipitation patterns, as well as drought conditions.
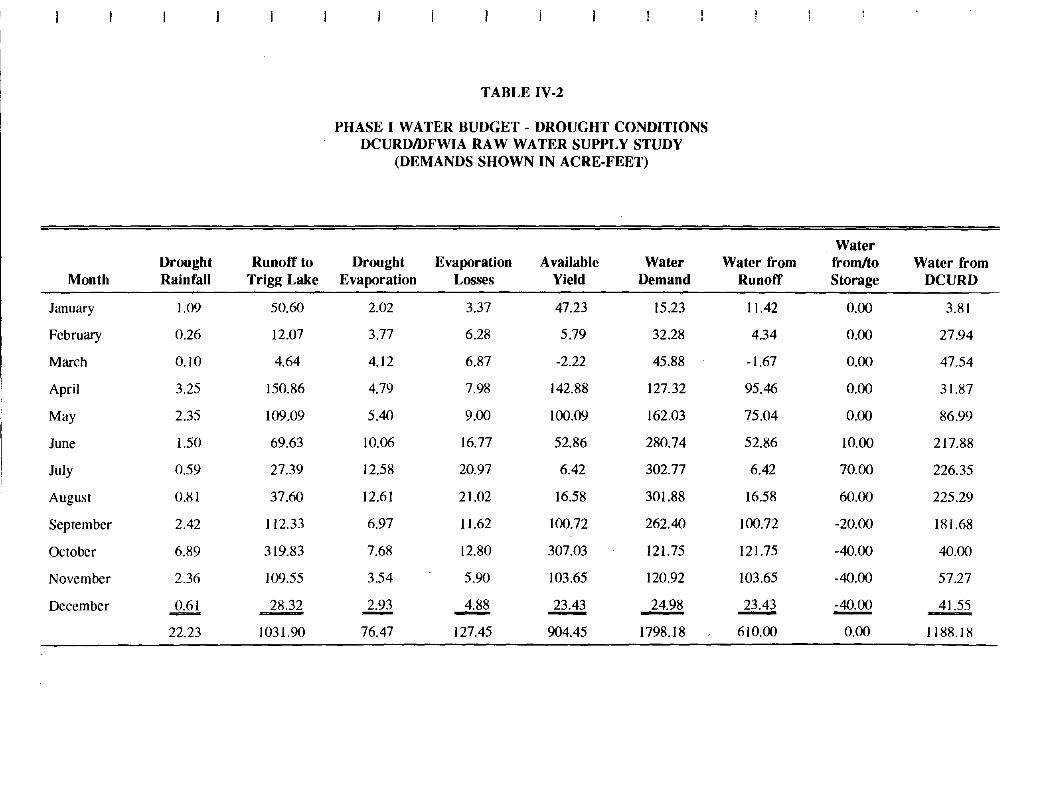
In order to determine the monthly demands for raw water from DCURD, annual water budgets have been developed for several conditions. The monthly demands identified in Table 111-7 were compared to the available yields from Trigg Lake under normal and drought conditions. Withdrawals from Trigg Lake storage were identified during the summer months in an attempt to mi nimi ze the peak demands. The amount of the withdrawal for any month was limited to 60 acre-feet. The water budget indicates that lake levels will be restored during the fall months using a combination of runoff and DCURD raw water. Tables IV-l through IV-4 present the water budgets for the existing demands under normal and drought conditions and future demands (2010) under normal and drought conditions.
All·of the water budgets have been prepared assuming that the DFWIA will continue to be able to divert 610 acre-feet per year from Trigg Lake. However, the existing water-right permit, authorizing diversions from Trigg Lake, is due to expire at the end of the year 2000. It is not known whether the DFWIA will be able to renew this right for another period of time. If the airport is not able to renew this right, additional water will need to be provided from DCURD. However, it is anticipated that the peak rate of delivery from DCURD will not be affected greatly since the monthly yields from Trigg Lake are relatively small during the peak irrigation months.
ABILITY OF DCURD TO MEET THE ANTICIPATED DEMANDS
DCURD's ability to provide raw water to DFWIA is impacted by the following three constraints.
1. The capacity of the TRA pi pe 1 i ne and pump stati on to convey raw water from the CRWS to Lake Remle.
2. The quantity limits contained in the contract between DCURD and TRA.
3. The infrastructure necessary to convey water from Lake Remle to DFWIA.
Normal Runoff to Month Rainfall Trigg Lake
January 1.76 105.10
February 2.00 119.44
March 2.38 142.13
April 3.76 224.54
May 4.69 280.08
June 2.94 175.57
July 2.19 130.78
August 2.18 130.19
September 2.87 171.39
October 3.00 179.16
November 2.27 135.56
December 1.97 117.65 -32.01 1911.58
TABLE IV-!
PHASE I WATER BUDGET - AVERAGE CONDITIONS DCURDIDFWIA RA W WATER SUPPLY STUDY
(DEMANDS SHOWN IN ACRE-FEET)
Normal Evaporation Available Water Evaporation Losses Yield Demand
The third constraint identified is the main topic of this report. The infrastructure improvements required to allow the conveyance of raw water from Lake Remle to DFWIA will be identified and evaluated in the following sections of this report.
In order to determine the impact of the first two constraints on the feasibility of the DFWIA raw water supply project, the capacity and quantity limits must be compared to the eXisting and projected demands within DCURD to determine the excess capacity that is available for use by DFWIA. DCURD personnel have indicated that the District has excess capacity avail ab 1 e for de 1 i very to DFWIA. The excess capacity has been determined to be approximately 1,550 acre-feet per year with a peak rate of 3.64 MGD. These values represent the difference between the quantity limits identified in the TRA contract and DCURD commitments to customers or DCURD's internal needs.
This unused capacity is more than enough to meet all of DFWIA's Phase I demands and a portion of Phase II demands. However, the ultimate demands projected for Phase II would significantly exceed the available capacity under the existing TRA contract. In addition, the Phase II demands would exceed the capacity of the TRA pipeline and pump station.
As a result, the development of Phase II with water provided by DCURD would not be feasible unless additional capacity is obtained by DCURD. The deficit between the total demands and the available capacity could be made up by implementing one or more of the following measures.
1. The total peak demands could be decreased through conservation measures enforced during drought conditions.
2. The total peak demands could be decreased by providing additional onsite storage capacity.
3. Additional pumping capacity could be provided at the CRWS or an intermediate pump station. This would allow increased flows at increased velocities in the existing pipeline.
4. A parallel line could be constructed.
In order to meet all of the Phase II demands, the contract between DCURD and TRA would have to be re-negotiated. However, before the contract could be re-negotiated, TRA would have to amend its wastewater discharge permit to allow the transfer of more water to DCURD. In addition, DCURD would have to amend its water-use permit to
IV-ll
increase the limits it contains. If DCURD and TRA can obtain the necessary approvals, TRA would have the water available from its facility to meet all of the Phase II demands.
--
CHAPTER V
PROPOSED IMPROVEMENTS
As previously discussed, it is anticipated that the improvements required to implement a raw water supply for Dallas/Fort Worth International Airport (DFWIA) will be completed in phases. Phase I of the proposed improvements would provide a source of raw water for the existing, heavy irrigation demands along the Spine Road, the existing golf courses, and the administration building. In addition, water will be made available for use as cooling water make-up at the Central Utilities Plant (CUP). Phase II of the project will extend the raw water system to the periphery of the airport to supply airport irrigation operations in these areas, as well as serving the irrigation needs of airport tenants located outside of the airfield. These improvements are discussed in more detail in the following sections.
PHASE I IMPROVEMENTS
Due to the need to obtain additional supplies to meet the projected Phase II demands, the timing of Phase II implementation is uncertain. As a result, the proposed improvements identified for Phase I have been evaluated for two scenarios. The first scenari 0 woul d i ncl ude excess capacity in the Phase I improvements such that the demands projected for Phase II could be accommodated. The second scenario assumes that the Phase I improvements will be developed to serve only Phase I demands.
The proposed Phase I improvements include a pump station at Lake Remle, a pipeline from Lake Remle to Trigg Lake, a pump station at Trigg Lake, and distribution pipeline from Trigg Lake through the Spine Road corridor. For discussion purposes, the pipeline will be divided into four separate segments. Line A will extend from Lake Remle to Hackberry Creek Lake Segment III. Line B will extend from Hackberry Creek Lake Segment III to the ai rport property. Li ne C wi 11 extend from the ai rport property to Trigg Lake. Line D will extend north from Trigg Lake through the Spine Road corri dor.
As originally conceived in the 1991 feasibility study, Line D would have been constructed as a cut-and-cover line located between northbound International Parkway and the east service road. DFWIA staff have expressed concern over the
V-2
constructability of a line in this location. A review of airport records and the proposed ali gnment i ndi cates that the constructi on of thi s 1 i ne woul d be very difficult between the north and south cross-taxiways. The difficulty arises from numerous utility conflicts and physical constraints due to the roadways. airfield. and rapidly changing elevations.
As a result of the concerns. two options to the construction of a cut-and-cover line between the two cross-taxiways were investigated. The first option would be to delete this portion of the irrigation system from the service area of the raw water supply system. This would alleviate the need to construct any 1 ines in this heavily congested area by leaving the irrigation system in this area connected to the potable water supply.
The second option investigated is to construct the main raw water supply line in a utility tunnel that extends from the southern end of Terminal 4E to the northern end of Terminals 2E and 2W. This tunnel is located approximately in the center of the Spine Road corridor. The tunnel currently contains pipes carrying hot and cold water between each of the terminal buildings and the CUP. In addition. the tunnel contains steam pipes and telecommunication cables. An inspection of the tunnel indicates that it would be possible to construct a raw water line in the tunnel. The irrigation system located between the two cross-taxiways would be supplied with raw water through a series of connections to the pipe in the tunnel. These connections would penetrate the tunnel -at existing vaults located adjacent to the ends of the terminal buildings. The preliminary design of this line is discussed in more detail in a later section.
The inclusion or exclusion of the irrigation system between the two cross-taxiways could have an impact on the preliminary sizing of the remainder of the improvements. As a result. the remainder of the improvements will be considered under both conditions.
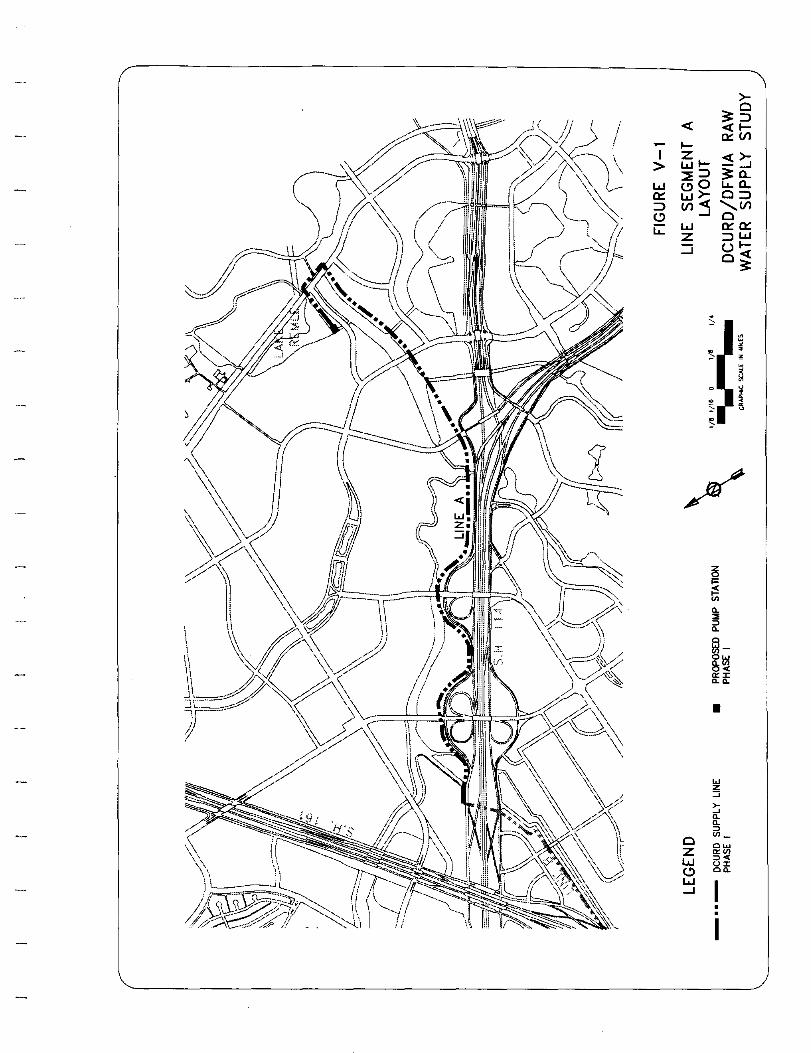
Line Segment A
While the actual irrigation demands at DFWIA will occur during a 9- to 12-hour period. the design of Line A will be based on the average daily demands during the peak monthly usage. The average daily demand can be used instead of the peak instantaneous
V-3
demand since Trigg Lake will provide the operational storage necessary to meet the peak demand. Line A will be designed with the capacity to replenish this storage when irrigation is not occurring. Figure V-I illustrates the extent of Line Segment A.
DCURD currently operates a 14-inch diameter pipeline extending from Lake Remle along Hackberry Creek to Hackberry Creek Segment III. This pipeline provides water to both Lake Carolyn and Hackberry Creek Segment III. The peak demand for water to these locations. as well as the proposed demand generated by DFWIA and the South Fork Hackberry Creek IV lakes is estimated to be 10.21 MGD. with DFWIA accounting for 2.37 million gallons per day (MGD) of this total.
The eXisting 14-inch pipe does not have sufficient capacity to provide the existing demands for Lake Carolyn. Hackberry Creek Segment III. South Fork Hackberry Creek Segment IV. and DFWIA. Two options have been investigated to provide the additional capacity required.
Option Al
The first option would include the construction of a separate line. paralleling the existing line between the Lake Remle Pump Station and Hackberry Creek Segment III. This new line would be constructed to serve DFWIA and South Fork Hackberry Creek IV. Lake Carolyn and Hackberry Creek Segment III would continue to be served via the existing 14-inch line. The demands generated by Hackberry Creek Segment IV and DFWIA in Phase I would be 2.61 MGD. At a design velocity of 5 feet per second (fps). a 14-inch pi pe would be requ ired. However. if Phase II is developed. Li ne A wi 11 ultimately need to provide a capacity of 9.67 MGD. In order to avoid requiring a third parallel pipe along this route in the near future. a 24-inch pipe could be constructed during Phase I.
Option A2
Option A2 includes the construction of a line from the Lake Remle pump station to a point along the existing 14-inch line just west of the connection to Lake Carolyn. Providing this pipeline would increase the capacity available for delivery to Hackberry Creek Segment I II and DFWIA by removi ng the demands generated by Lake Carolyn. As a result, it would be possible to serve Hackberry Creek Segment III,
I >
«
w Z
Cl Z W (,!) W ...J
•
'" Z ::J
~ ...J Il. Il. ::>
>Cl
~:::l «Ic:::Vl
Vl_
0 ... <>:Vl ::>< O:I: Oil.
I · · I
V-5
South Fork Hackberry Creek Segment IV and the Phase I demands from DFWIA with the existing 14-inch 1 ine. The total peak demand during drought conditions for this option would be 4.39 MGD. However, the velocity in the 14-inch line will be approximately 6.4 fps during this peak demand condition. The anticipated velocity in the pipeline during normal summertime peak demands of 2.96 MGD would be 4.3 fps. Velocities during the remainder of the year would be significantly less. While 5 fps is the typical value used for design velocities, velocities exceeding this value will not necessarily adversely affect the pipe, particularly if the higher velocities are limited in the duration and frequency of occurrence. However, the increased friction losses resulting from the increased velocities will result in additional pumping costs.
It is anticipated that the use of the existing 14-inch line, as proposed in Option A2 would be temporary. If Phase II of the project is developed, additional demands will be generated by DFWIA that would require the construction of a parallel 1 ine. However, significant cost savings are achievable by deferring the construction of this line to Phase II.
The size of the pipeline constructed between the Lake Rem1e pump station and the 14-inch line leading to Lake Carolyn is dependent upon the ultimate demands to be served. If capacity for Phase II demands is to be provided, this line would need to be 24 inches in diameter. If only Phase I demands are considered, the pipeline could be a 14-inch line.
The exclusion of the irrigation area between the cross-taxiways would not affect the size of the pipeline in Alternative Al if Phase II demands are considered. However, if only Phase I demands are considered, the pipeline would only need to be a IO-inch line. Alternative A2 would be affected in that the velocities in the existing 14-inch line would be limited to 4.6 fps during peak drought conditions. In addition, the pipeline from the Lake Rem1e pump station to Lake Carolyn would only need to be a lO-inch pipe.
Li ne Segment B
Since Line B is part of the raw water delivery system instead of the distribution system, this line will be sized based on the average daily demand during the peak
V-6
month. line B will provide raw water to both DFWIA and Hackberry Creek Segment IV. The peak demand for this line during Phase I is anticipated to be 2.61 MGD. During Phase II, the peak demand would be 9.67 MGD. Figure V-2 illustrates the extent of line Segment B.
Based on the existing demands, a l4-inch pipeline would be sufficient. The design velocity for a l4-inch pipeline would be 3.8 fps. However, if Phase II of the DFWIA project is developed, a 24-i nch pipel ine woul d be requi red to meet the ultimate demands. It would be possible to construct a l4-inch pipeline under Phas~ I and construct a parallel 20-inch pipeline as part of Phase II.
The exclusion of the irrigation area between the cross-taxiways would reduce the size of the pipe required to meet the Phase I demands to a lO-inch pipe. The size of pipe needed to meet the Phase II demands would not be effected.
line SegIN!nt C
While the Phase I improvements are in operation, line C will be part of the raw water supply system to Trigg lake. As such, the design criteria for Phase I is the average dai 1 y demand duri ng the peak month. However, if the Phase II improvements are constructed, line C will become a part of the DFWIA raw water distribution system. This line is expected to experience relatively low peak irrigation demands during Phase II operation due to its location between the two proposed pump stations and the relatively low demands. Figure V-3 illustrates the extent of line Segment C.
In addition to the instantaneous demands, it is anticipated that the operation of the system under Phase II improvements will require the use of line C, as well as other Phase II improvements to move water from the proposed southeast storage reservoir to Trigg lake. Assuming that one-half of the peak instantaneous demands will be met by each of the two pump stations in operation under Phase II, the amount of water that must be transferred from the southeast reservoi r to Tri gg lake for operati onal storage is approxi mate 1 y one-half of the average day demand duri ng the peak month. Thi s transfer of water must be accompl i shed duri ng the 12 hours that the i rri gati on systems are not in operation. A simplified KYPIPE computer model analysis of the proposed Phase II pipe network indicates that an l8-inch pipeline would be sufficient.
III
'" z :::; >-...J 0. 0.
0 iii -
z ii11X w =><
U::J: <.!) 00.
W
I ...J
• •
I
~u ~O DO
Ole I .... )
;z
LEGEND
~ •• --- DCURD SUPPLY UNE PHASE I
• PROPOSED PUIAP STA liON PHASE I
__ ._._ DF'MA POTABLE WATER UNE CONVERTED TO RAW WATER UNE PHASE I
~\uWIIWUIUIUdl DCURD SUPPLY UNE PHASE II
DFWlA DISTRIBUllON LINE PHASE I
~»fl!fcfffllfffU"f DFWA DISTRIBUTION LINE PHASE II
• PROPOSED PUIAP STAllON PHASE II
+ 1/6 1/12 0 1/8 1/3 ----GIMPHIC SCALE IN MILES
-----,-
FIGURE V-3
LINE SEGMENT C LAYOUT
DCURD/DFWIA RAW WATER SUPPLY STUDY
V-I0
For the purposes of evaluating the pumping improvements at Lake Remle. the following assumptions were made.
1. Phase I improvements will be designed to accommodate Phase I demands only.
2. Option A2 (use of the existing 14-inch pipeline) will be implemented.
3. The area between the cross-taxiways will be included.
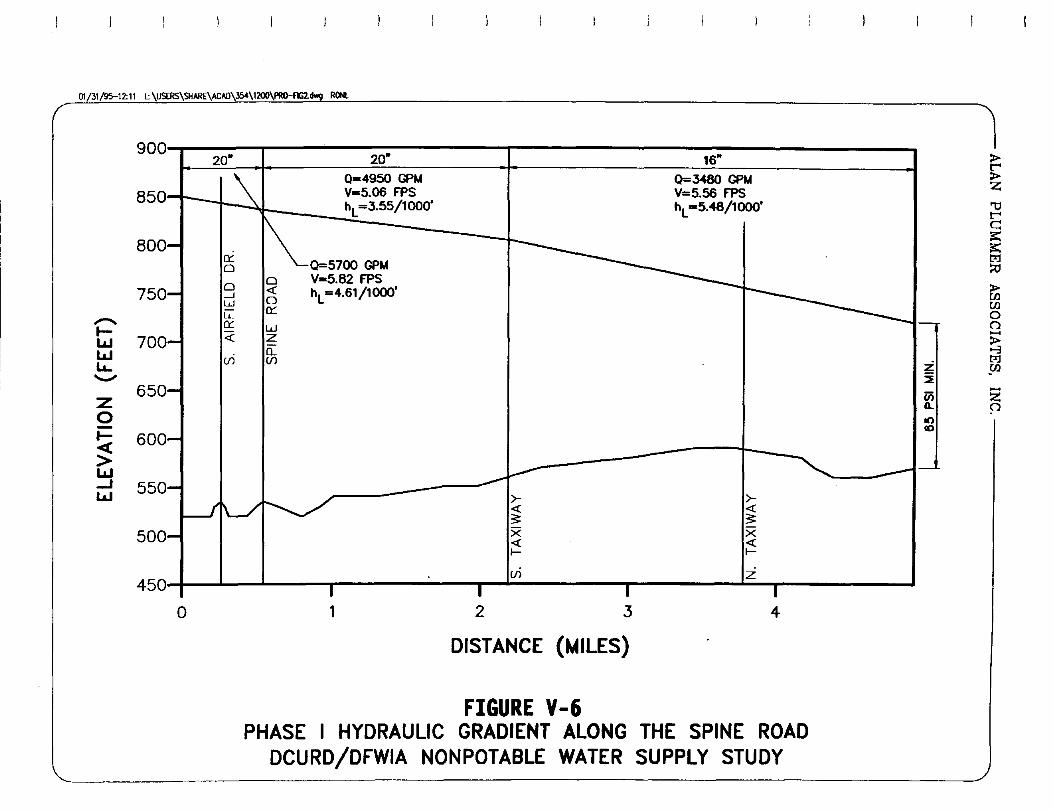
This set of assumptions will result in the most conservative design conditions for the Phase I pumping improvements at Lake Remle. The hydraulic gradient resulting from this set of assumptions is included in Figure V-4. The design flow for the pump station is 3.050 gpm at a TOH of approximately 390 feet. The design of the pump station for Options LRI and LR2 is discussed in the following sections.
Option LRI
If a new pump station is constructed at Lake Remle. it is anticipated that vertical turbine pumps will be used. The type of pump recommended would be a "canned" vertical turbine pump. This type of pump is recommended due to the relatively low construction costs associated with its prefabricated wetwell. The pump cans would extend below the surface to an elevation of apprOXimately 410 feet above mean sea level (msl). The pump motors would be located above the cans in an underground vault structure. Water would be supplied to the pump station by a connection to the eXisting 24-inch water intake for the Lake Remle pump station. Water would be discharged to the new pipe constructed as part of Line A.
The new pump station will require two pumps. The pumps will have four stages to provide the necessary lift. The horsepower (hp) required for each pump would be 240 hp. The operating point for the two pumps during peak demand conditions would be 1.525 gpm at a TOH of 395 feet. One pump would be able to meet the average demand conditions of 2.050 gpm at a TOH of 330 feet.
If the area between the cross-taxiways is excluded from the raw water system service area. the horsepower required for each pump would be decreased due to the decreased demand. The TOH would be about 320 feet. Four stage pumps would still be required to achieve this lift. but the horsepower required would be 160 hp.
PHASE I HYDRAULIC GRADIENT FROM LAKE REMLE TO TRIGG LAKE DCURD/DFWIA NONPOTABLE WATER SUPPLY STUDY
8
in Q.
o .....
> t"' > Z 'U t"' c:: =::: ~ t%J ~
> rn rn o ()
:; 0-3 t%J rn
z o
V-12
Option lR2
The existing lake Remle pump station is designed to acconrnodate four submersible pumps. In order to achieve the capacity required, it will be necessary to remove the existing pump that serves Hackberry Creek Segment In and install three, new submersible vertical turbine pumps. Submersible vertical turbine pumps are recommended since they can be installed in the existing structure without requiring major structural modifications. If regular vertical turbine pumps were installed in this pump station, a structural platform would need to be constructed to support the pump motors above the vertical turbine shafts.
The three new pumps would share the wetwell with the remaining, existing pump, which will still serve lake Carolyn. The existing raw water intake pipe will supply all four pumps. The discharge header will be modified so that the three new pumps discharge to a pipe that leaves the pump station through an existing, unused wall penetration. The existing submersible pump will discharge to the existing discharge header pipe.
The new pumps will be two-stage pumps. The pump motors will be 140 hp. At the peak discharge demand of 3,050 gpm, each pump will be operating at a flow rate of 1,017 gpm and a TOH of 395 feet. Ouring normal operating conditions, two pumps will provide the demand of 2,050 gpm. Each pump will operate at a flow rate of 1,025 gpm and a TOH of 360 feet .. If the area between the cross-taxiways is excluded from the service area, only two of these pumps will be required to meet the peak demand of 2,220 gpm.
li ne Segllent D
As previously discussed, two options for the construction of line 0 have been investigated. The difference between the two options is the inclusion/exclusion of the area between the cross taxiways. The two options are discussed further in the following section. Figure V-5 illustrates the extent of line Segment O.
Option 01
line 0 will form the Phase I raw water distribution system. The irrigation system located along the spine road will be connected to line 0 at several locations. line 0
,
LEGEND
- • ........ DCURD SUPPLY LINE PHASE I
iIfI PROPOSED PUMP STATION PHASE I
_ ... _ ... DF'MA POTABLIE WATER LINE CON~TED TO RAW WATER UNE PHASE I
FIGURE V-6 PHASE I HYDRAULIC GRADIENT ALONG THE SPINE ROAD
DCURD/DFWIA NONPOTABLE WATER SUPPLY STUDY
> t"" > Z
'tl t"" c: s::: s::: tr:I ~
> Ul Ul 0
] () ..... > ~ tr:I Ul
:iE
~I ..... z 0
00 co
V-I7
It is likely that the raw water system could be extended with minimal construction to meet new demands in close proximity to the Phase I pipelines. However, the excess capacity available in the Phase I improvements will not accommodate a substantial increase in demand. Additional pumping and pipeline capacity will be required to meet substantial growth.
For the purposes of thi s study, it is assumed that suffi ci ent growth wi 11 have occurred around the periphery of the airport to justify the construction of the Phase II improvements in one phase. These improvements wi 11 speci fi ca 11 y include additional pumping capacity at Lake Remle, construction of Line A (if Option A2 is selected in Phase I), construction of a storage reservoir in the southeast quadrant of the airport, construction of a pump station at the southeast reservoir, additional pumping capacity at Trigg Lake, and construction of a looped distribution main surrounding the airport.
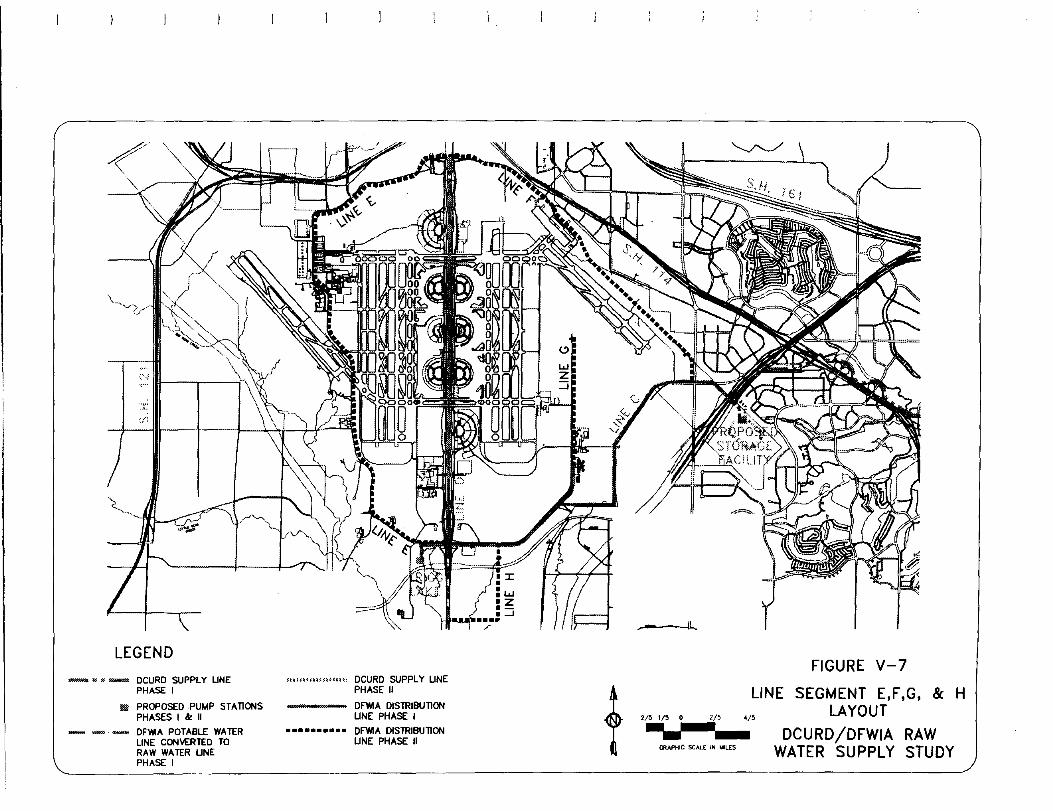
Each of these improvements is discussed in the following sections. For discussion purposes, the looped distribution system has been divided into four segments. Line E will extend from Line C in the southeast quadrant to International Parkway and North Airfield Drive. Line F will extend along Airfield Drive West from the north intersection of International Parkway to the south intersection. Line G will extend north along East Airfield Drive past the DFWIA maintenance facilities. Line H will form a loop on the east side of International Parkway, south of South Airfield Drive.
Li ne Seglllent A
If Opti on A2 is selected as the Phase I improvements for thi s segment, then the parallel 24-inch line discussed in Option Al will need to be constructed as part of the Phase II improvements. If Option Al is implemented as part of Phase I, then no additional improvements will be needed for this segment.
Line Seglllents E, F, G, and H
Lines E, F, G, and H, together with Lines C and D from Phase I, will form a looped raw water distribution system. In order to adequately analyze the benefits of looping the system, a simplified computer model of the system was developed. Figure V-7 illustrates the extent of Line Segments E, F, G, and H.
'--j III f\
~T~
u;
LEGEND
........ ~ DCURD SUPPLY LINE PHASE I
!IIi PROPOSED PUMP STATIONS PHASES I '" II
DI"'MA POTABLE WATER LINE CON\'ERTED TO RAW WATER LINE PHASE I
H~mHnUHIIU' DCURD SUPPLY UNE PHASE II
Df\\lA DISTRIBUTION LINE PHASE I
• ••••••••• OFWIA DISTRIBUllON LINE PHASE II t
~
,- II-
FIGURE V-7
LINE SEGMENT E,F,G, & H LAYOUT 2/5 1,/5 0 2/5 4/5 ----GRAPHIC SCALE IN MILES
DCURD/DFWIA RAW WATER SUPPLY STUDY
V-19
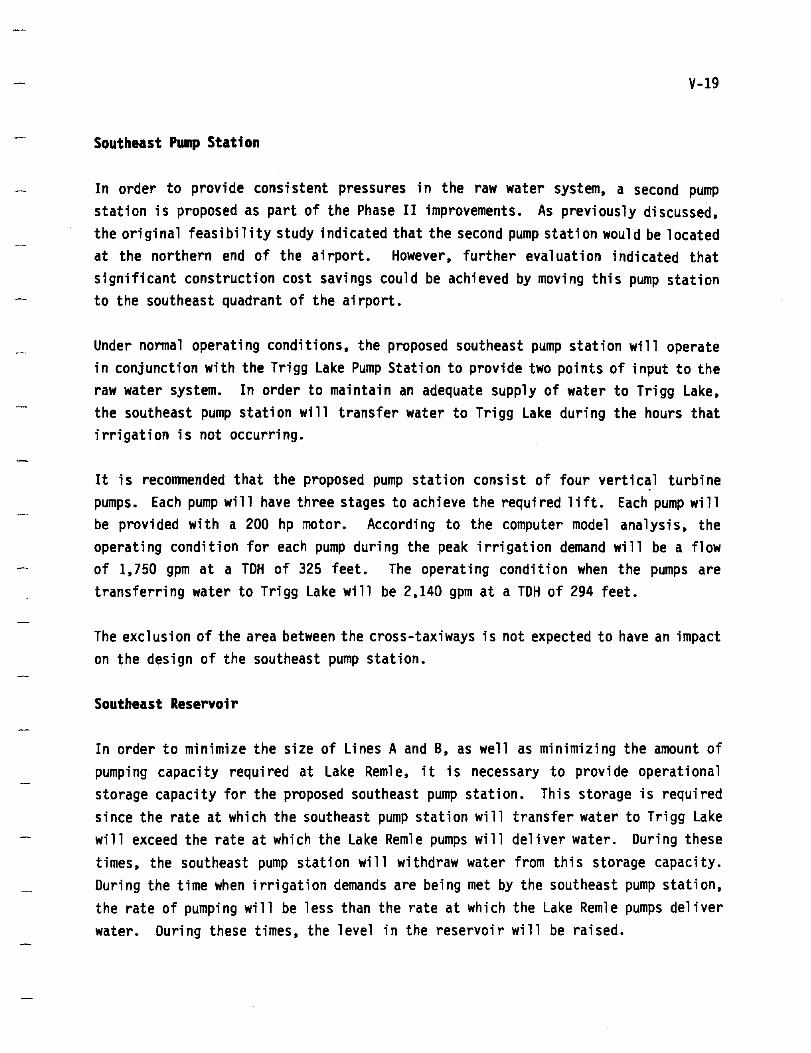
Southeast Pump Station
In order to provide consistent pressures in the raw water system, a second pump station is proposed as part of the Phase II improvements. As previously discussed, the original feasibility study indicated that the second pump station would be located at the northern end of the airport. However, further evaluation indicated that significant construction cost savings could be achieved by moving this pump station to the southeast quadrant of the airport.
Under normal operating conditions, the proposed southeast pump station will operate in conjunction with the Trigg Lake Pump Station to provide two points of input to the raw water system. In order to maintain an adequate supply of water to Trigg Lake, the southeast pump station will transfer water to Trigg Lake during the hours that irrigation is not occurring.
It "is recommended that the proposed pump station consist of four vertical turbine pumps. Each pump will have three stages to achieve the required lift. Each pump will be provided with a 200 hp motor. According to the computer model analysis, the operating condition for each pump during the peak irrigation demand will be a flow of 1,750 gpm at a TOH of 325 feet. The operating condition when the pumps are transferring water to Trigg Lake will be 2,140 gpm at a TDH of 294 feet.
The exclusion of the area between the cross-taxiways is not expected to have an impact on the design of the southeast pump station.
Southeast Reservoir
In order to minimize the size of Lines A and B, as well as minimizing the amount of pumping capacity required at Lake Remle, it is necessary to provide operational storage capacity for the proposed southeast pump station. This storage is required since the rate at which the southeast pump station will transfer water to Trigg Lake will exceed the rate at which the Lake Remle pumps will deliver water. During these times, the southeast pump station will withdraw water from this storage capacity. During the time when irrigation demands are being met by the southeast pump station, the rate of pumping will be less than the rate at which the Lake Remle pumps deliver water. During these times, the level in the reservoir will be raised.
V-20
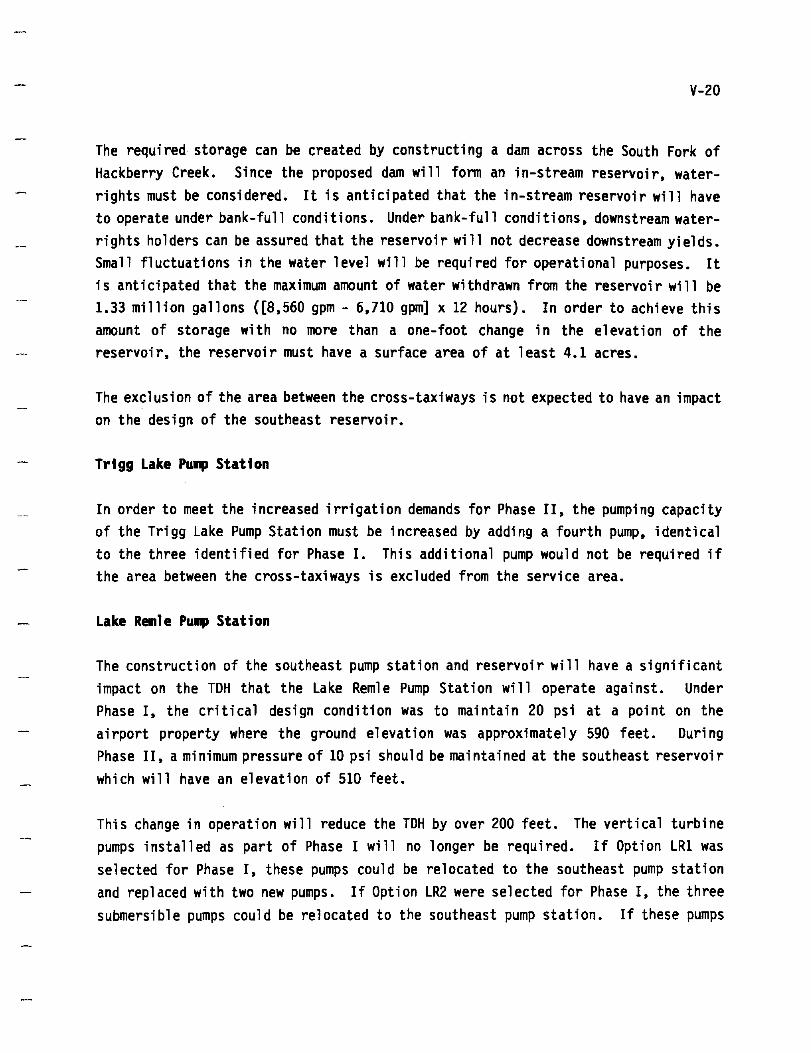
The required storage can be created by constructing a dam across the South Fork of Hackberry Creek. Since the proposed dam will form an in-stream reservoir, waterrights must be considered. It is anticipated that the in-stream reservoir will have to operate under bank-full conditions. Under bank-full conditions, downstream waterrights holders can be assured that the reservoir will not decrease downstream yields. Small fluctuations in the water level will be required for operational purposes. It is anticipated that the maximum amount of water withdrawn from the reservoir will be 1.33 million gallons ([8,560 gpm - 6,710 gpm] x 12 hours). In order to achieve this amount of storage with no more than a one-foot change in the elevation of the reservoir, the reservoir must have a surface area of at least 4.1 acres.
The exclusion of the area between the cross-taxiways is not expected to have an impact on the design of the southeast reservoir.
Trigg Lake Pump Station
In order to meet the increased irrigation demands for Phase II, the pumping capacity of the Trigg Lake Pump Station must be increased by adding a fourth pump, identical to the three identified for Phase I. This additional pump would not be required if the area between the cross-taxiways is excluded from the service area.
Lake Renle Pump Station
The construction of the southeast pump station and reservoir will have a significant impact on the TDH that the Lake Reml e Pump Station wi 11 operate agai nst. Under Phase I, the critical design condition was to maintain 20 psi at a point on the airport property where the ground elevation was approximately 590 feet. During Phase II, a minimum pressure of 10 psi should be maintained at the southeast reservoir which will have an elevation of 510 feet.
This change in operation will reduce the TDH by over 200 feet. The vertical turbine pumps installed as part of Phase I will no longer be required. If Option LRI was selected for Phase I, these pumps could be relocated to the southeast pump station and replaced with two new pumps. If Option LR2 were selected for Phase I, the three submersible pumps could be relocated to the southeast pump station. If these pumps
V-21
are relocated. only two of the four vertical turbine pumps identified for the southeast pump station would need to be supplied.
CHAPTER VI
OPINION OF PROBABLE COSTS
The total costs for the development of a raw water system for Dallas/Fort Worth International Airport (DFWIA) will include the capital costs for new facilities and debt retirement costs for the use of existing facilities. In addition to the capital costs. DFWIA will be charged a commodity charge by Dallas County Utility Reclamation District (DCURD). This commodity charge is intended to recover DCURD's cost of operating a raw water system supplying raw water to DFWIA. Each of these individual components are discussed in this chapter.
NEW CAPITAL COSTS
Chapter V contai ned desi gn i nformati on for proposed Phase I improvements under several different scenarios. The two major design scenarios that affected the design of all Phase I improvements was the issue of whether or not these improvements should be designed to meet the ultimate demands projected for Phase II or should the improvements be designed to meet the Phase I conditions. Information concerning the probable cost of each option presented in Chapter V was developed for both scenarios. This information is presented in Table VI-I.
The information contained in Table VI-I indicates that Option A2. the use of the existing 14-inch line. has the lower opinion of probable costs of the two options considered for Line A. As a result. it is recommended that the Phase I improvements incorporate Option A2. Similarly. Option LR2. the addition of pumps to the existing pump station. has a lower opinion of probable cost of the two options considered for the Lake Reml e Pump Stati on. It is recommended that the Phase I improvements incorporate Option LR2.
The only other options investigated for Phase I improvements involved the inclusion (Option DI) or exclusion (Option D2) of the irrigated area between the two crosstaxiways in the service area. In order to serve this area. a raw water main would need to be constructed in an existing utility tunnel extending from the south end of Terminal 4E to the north end of Terminals 2E and 2W. Option 01. The initial evaluation of the construction of this line would indicate that it is feasible and
TABLE VI-l
OPINION OF PROBABLE CONSTRUCTION COSTS DCURDIDFWIA RAW WATER SUPPLY STUDY
Improvement
Phase I
Line A Option Al Option A2
Line B
Line C
Line D Option DI Option D2
Lake Remle Pump Station Option LRI Option LR2
Trigg Lake Pump Station
Phase II
Line E
Line F
Line G
Line H
Trigg Lake Pump
Southeast Pump Station
Southeast Reservoir
Lake Remle Pump Sta. Imp.
Opinion of Probable Construction Cost for
Phase I Only
$ 725,000 225,000
675,000
2,050,000
3,200,000 1,100,000
400,000 225,000
500,000
N/A
N/A
N/A
N/A
N/A
N/A
N/A
N/A
Opinion of Probable Construction Cost Including Phase II
$ 875,000 275,000
925,000
2,350,000
3,200,000 1,100,000
400,000 225,000
500,000
2,225,000
2,175,000
400,000
425,000
210,000
800,000
200,000
300.000
VI-3
would probably not cost any more than a cut-and-cover line through this area. As a result, it is recommended that the Phase I improvements incorporate Option Dl and provide service to the entire Spine Road corridor.
The combined opinion of probable costs for the combination of options recommended has been included in Table VI-2. This table includes an opinion of the total probable project cost for Phase I improvements wi thout provi ding capacity for Phase II of $9.5 million. The opinion of the total probable project costs for Phase I improvements, assumi ng that Phase II demands wi 11 be served, is $10.3 mi 11 ion. Finally, the opinion of total probable project costs for Phase II improvements is $10.15 mi 11 ion.
EXISTING DEBT SERVICE REQUIREMENTS
In addition to the cost of the new facilities, the operation of a raw water supply system for DFWIA will require the use of existing DCURD facilities. In particular, the Trinity River Authority of Texas (TRA) pump station and transfer line will be used during both Phase I and Phase II. As compensation for the use of these facilities, DCURD would charge DFWIA a pro rata share of the annual debt retirement for these facilities which is consistent with DCURD's policy to charge other raw water customers. The pro rata share will be based on the relative demands placed on the TRA line under Phase I. It is anticipated that this ratio could be applied to the remainder of the term of the bonds since Phase II improvements are not expected to be implemented for several years. When Phase II improvements become imminent, the pro rata share of the existing debt-service requirements may need to be revised. As a result, DFWIA's share of this cost would be based on a ratio of the peak Phase I demand to the peak capacity of the existing TRA pipeline. The calculated ratio would be 14.6 percent (2.4 million gallons per day (MGD}/16.4 MGD).
DCURD's annual debt-service requirement varies from one year to the next. The variation of the annual debt-service requirement is a result of a recent refinancing of this debt by TRA. Information concerning DCURD's requirement was obtained from DCURD personnel. This information, together with the proposed DFWIA pro rata share of the debt-service requirement is presented in Table VI-3.
TABLE VI-2
OPINION OF TOTAL PROBABLE PROJECT COSTS DCURDIDFWIA RAW WATER SUPPLY STUDY
Opinion of Probable Opinion of Probable Construction Cost for Construction Cost
ANNUAL TRA DEBT SERVICE REQUIREMENTS DCURDIDFWIA RAW WATER SUPPLY STUDY
Fiscal Year
1996
1997
1998
1999
2000
2001
2002
2003
2004
2005
2006
2007
2008
2009
2010
20 II
2012
2013
2014
2015
2016
Total TRA Debt Service Requiremene
$ 455,956
455,354
453,456
443,706
270,548
331,654
320,887
321,850
322,522
323,544
323,777
324,306
326,584
328,757
331,965
192,054
192,952
193,865
194,868
195,936
197,127
DFWIA Pro rata Share of TRA Debt Service2
$ 66,725
66,643
66,359
64,932
39,932
48,535
46,959
47,100
47,198
47,348
47,382
47,459
47,793
48, III
48,580
28,105
28,237
28,370
28,517
28,674
28,848
1 Infonnation provided by DCURD personnel.
2 Pro rata share based on ration of 2.4 MGDIl6.4 MGD.
VI-6
COMMODITY CHARGES
In addition to the opinion of probable construction costs, the operation and maintenance of the raw water system will require annual expenditures. The major annual expense will be electrical charges associated with operating the various pump stations and the cost of purchasing raw water from TRA. Information concerning probable commodity charges was provided by DCURD personnel. Based on the information available, the financial analysis for this study is based upon DFWIA being charged an initial commodity charge of $0.55 per 1000 gallons by DCURD.
CHAPTER VII
FEASIBILITY ASSESSMENT
The assessment of the feasibility of implementing a raw water system for Dallas/Fort Worth International Airport (DFWIA) should examine a comparison of the probable cost of all water purchased, potable and raw water, with and without the proposed raw water supply system. Consideration should also be given to the value-added benefits available to DFWIA as a result of the proposed raw water supply system. These issues will all be addressed in this chapter.
COST OF POTABLE WATER WITHOUT A RAW WATER SYSTEM
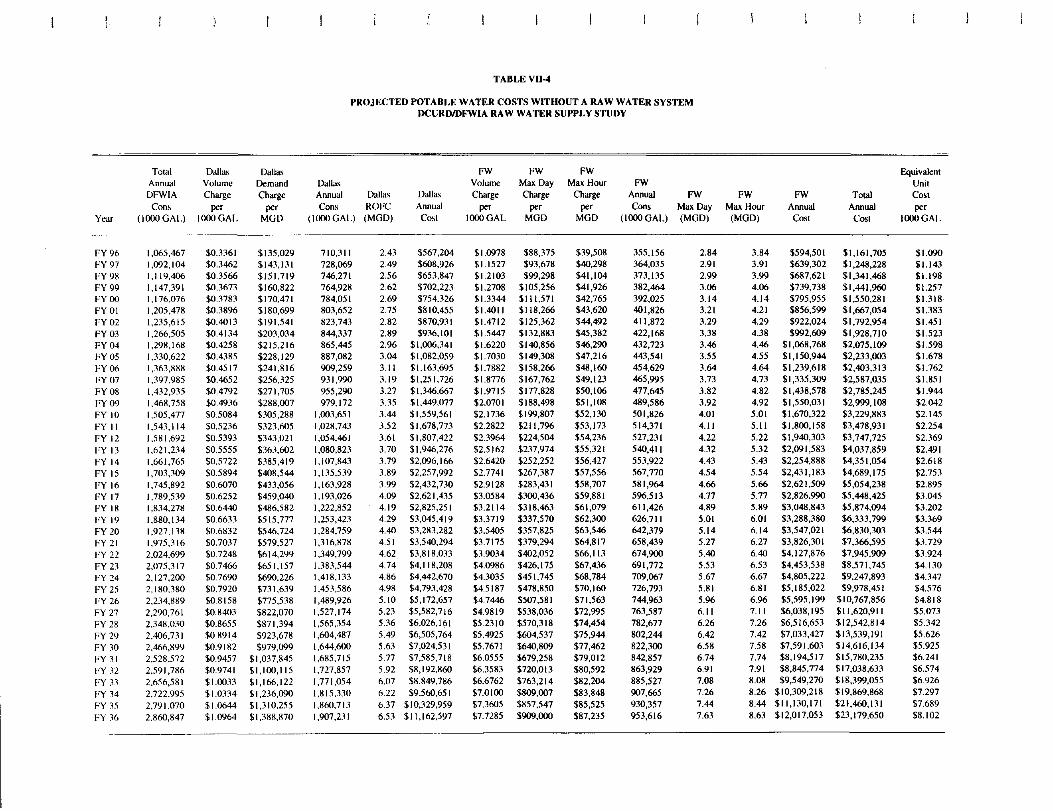
It is anticipated that DFWIA will continue to irrigate landscaped areas at the airport in the future. If an alternate source of water is not available, DFWIA will continue to use potable water for irrigation. DFWIA is contractually obligated to obtain twothirds of its potable water supply from the City of Dallas and one-third of the supply from the City of Fort Worth. Since both the City of Dallas and Fort Worth include charges for the total volume of water used and the rate at which water is used, it is necessary to analyze the water use from each city separately in order to determine the total cost of potable water.
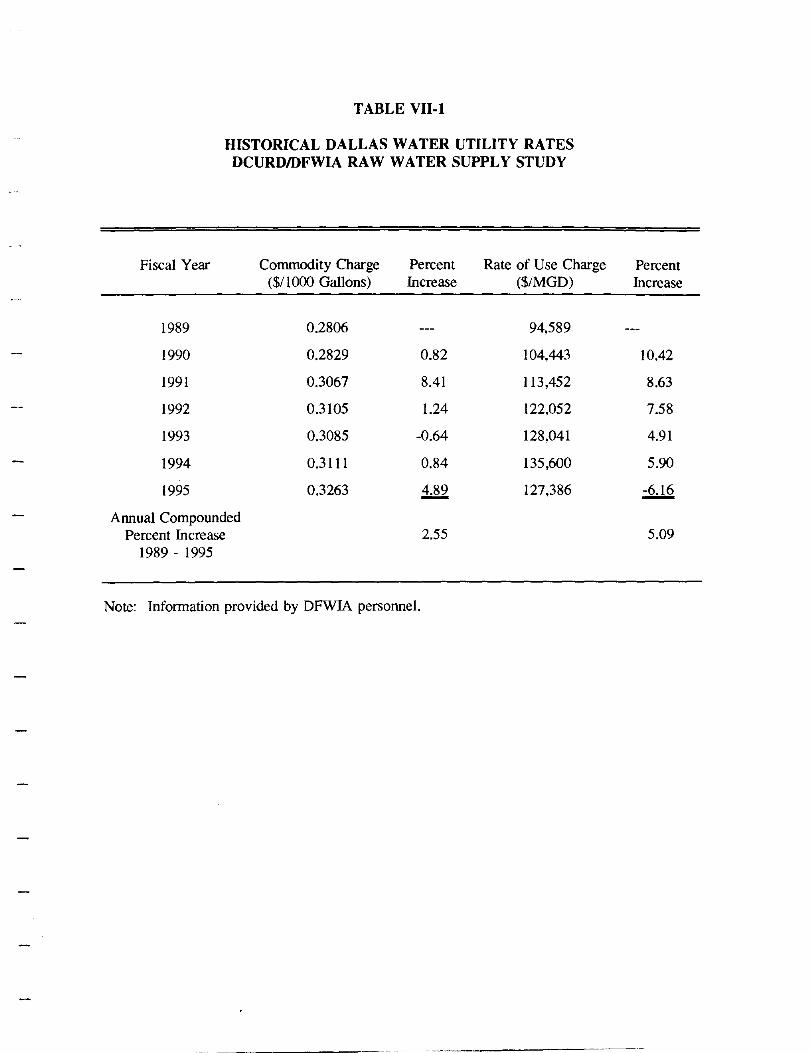
The current practice by the City of Dallas is to charge its wholesale customers a commodity charge of $0.33 per 1000 gallons and a rate of use charge of $127,386 per million gallons per day (MGD). The commodity charge is applied to the total volume of water delivered by the City of Dallas, while the rate of use charge is applied against the peak day demand for the previous year.
The current practice by the City of Fort Worth is to charge its wholesale customers a commodity charge of $1.05 per 1000 gallons, a peak day charge of $83,373 per MGD, and a peak hour charge of $38,733 per MGD. The commodity charge is applied to the total volume of water delivered by the City of Fort Worth. The peak day charge is applied against the peak day demand for the previous year and the peak hour charge is applied to the peak hourly flow recorded in the previous year.
VII-2
As a result of the different rates charged by the two cities, DFWIA can impact its overall cost of water by managing the manner in which water is received from the two cities. Currently, DFWIA tries to use the City of Dallas water system to meet the average demands experienced throughout the year. When water consumption rises in the sunmer, DFWIA uses the City of Fort Worth system to meet the additional demands. This type of operation allows DFWIA to use the City of Dallas as its primary source of water and meet the two-thirds requirement. It also minimizes the peak charges that DFWIA incurs from the City of Dallas. It is anti cipated that the airport will continue to operate in this manner.
While the airport can adjust its water use patterns to affect the overall cost of potable water used, DFWIA has little or no control over the rates charged by the two cities for the delivery of potable water. It is anticipated that potable water rates charged to DFWIA will increase significantly in the future. This increase is due to two primary factors. First, water use in the Dallas/Fort Worth area is increasing to "the poi nt where potable water provi ders wi 11 need to bri ng more water into the region from distant reservoirs. The need to pump this water over greater distances will increase the overall cost of the water. The second factor affecting the cost of potable water is the anticipated promulgation of regulations associated with the Safe Drinking Water Act (SDWA). It is anticipated that these regulations will require additional treatment of potable water at increased costs.
In order to estimate the cost of potable water in the future, it is necessary to estimate future potable water rates. The amount of increases expected over the coming years can not be determined with any certainty. However, it is probable that the increases will exceed recent historical increases in water rates. For the purposes of conducting this cost/benefit analysis, three separate scenarios for potable water rate increases were defi ned. The three scenari os were based on a revi ew of hi stori ca 1 water rate increases. Table VII-l presents historical potable rates charged by the City of Dallas over the past six years and the percent increase each year. Table VII-2 presents the historical potable rates charged by the City of Fort Worth over the past six years and the percent increase each year.
The first scenario is considered to be a low-end estimate of potable water rate increases. It is based on increases that approximate the trend in historical increases. The second scenario is considered to be the most likely potable water rate
TABLE VII-!
HISTORICAL DALLAS WATER UTILITY RATES DCURDIDFWIA RAW WATER SUPPLY STUDY
Fiscal Year Commodity Charge Percent Rate of Use Charge ($/1000 Gallons) Increase ($/MGD)
1989 0.2806 94,589
1990 0.2829 0.82 104,443
1991 0.3067 8.41 113,452
1992 0.3105 1.24 122,052
1993 0.3085 -0.64 128,041
1994 0.3111 0.84 135,600
1995 0.3263 i§2 127,386
Annual Compounded Percent Increase 2.55
1989 - 1995
Note: Information provided by DFWIA personnel.
Percent Increase
10.42
8.63
7.58
4.91
5.90
-6.16 -5.09
Fiscal Year
1989
1990
1991
1992
1993
1994
1995
Annual Compounded Percent Increase
1989 - 1995
TABLE VII-2
HISTORICAL FORT WORTH WATER UTILITY RATES DCURDmFWIA RAW WATER SUPPLY STUDY
Commodity Charge Percent Maximum Day Percent ($/1000 Gallons) Increase Charge ($/MGD) Increase
0.9374 62,974
0.9980 6.47 57,872 -8.10
1.0847 8.69 79,212 36.87
1.1512 6.13 84,403 6.55
1.1217 -3.56 72,900 -13.63
1.2165 8.45 93,919 28.83
1.0455 -14.06 83,373 -11.23 - -1.84 4.79
Note: Information provided by DFWIA personnel.
Maximum Hour Percent Charge ($/MGD) Increase
29,450
30,935 5.04
28,080 -9.23
27,388 -2.46
27,001 -1.41
27,303 1.12
38,733 41.86 -4.67
VII-5
increases. It is based on increases slightly above historical increases. The third scenario is considered to be a high-end estimate of potable water rate increases. It is based on increases moderately higher than historical increases. Table VII-3 presents the potable water rate increases assumed for each of these scenarios.
The projected cost of potable water in future years was calculated based on an average annual increase in total water consumption of 2.5 percent. The total cost of water to be purchased from the City of Dallas was calculated by taking two-thirds of the total water consumption multiplied by the commodity charge for the year, plus the projected peak day rate multiplied by the projected rate of use charge for the year. The projected peak day rate was calculated by multiplying the average daily consumption by 1.20. This factor was based on an evaluation of historical data. The total cost of water purchased from the City of Fort Worth was calculated by taking one-third of the total water consumption multipl ied by the projected Fort Worth commodity charge for the year, plus the peak day charge multiplied by the peak rate and the peak hour charge multiplied by the peak hour. The peak day for Fort Worth was calculated by multiplying the average daily consumption by a factor of 2.92. The peak hour rate was calculated by adding 1.0 MGD to the peak day rate. These factors were based on a review of historical data. The total peak day demand for DFWIA can be calculated by adding the Dallas peak day demand to the Fort Worth peak day demand.
All of these relationships and factors were incorporated into a computer spreadsheet to calculate the'total projected annual cost of potable water consumption over a 40-year period. The results of this spreadsheet analysis for the most-likely potable water rate increase scenario, Scenario 2, is presented as Table VII-4.
COST OF POTABLE WATER WITH RAW WATER SYSTEM IN PLACE
Since both the City of Dallas and the City of Fort Worth base a significant portion of their water rates on the peak rate at which water is delivered, the cost of potable water purchased after a raw water system is implemented is expected to be less. The decrease in the cost of water is rel ated to the removal of high summertime peak demands related to irrigation. Since the irrigation demands will be met by the raw water system, the remaining potable water peak is expected to be reduced.
TABLE VII-3
POTABLE WATER RATE INCREASE SCENARIOS DCURDIDFWIA RAW WATER SUPPLY STUDY
The spreadsheet that was developed to project the future annual cost of potable water without a raw water system was modified to project the future annual cost of potable water with a raw water system. The modification involved a change in the method used to calculate the peak day and peak hour demands on the City of Forth Worth water system. The total volume of water consumed by DFWIA was reduced by the amount of water supplied through the raw water system. The revised total consumption was then divided between the City of Dallas and the City of Fort Worth based on a twothi rds/one-thi rd spl it. The revi sed. total peak day demand for DFWIA was then calculated by taking the total DFWIA peak day demand previously calculated. assuming that a raw water system is not implemented. and subtracting the peak day raw water demand to be supplied from DCURD. The revised peak day demand for the City of Dallas was calculated based on the same 1.20 factor since it is anticipated that DFWIA will continue to meet its average demands from the City of Dallas. The peak day demand from the City of Fort Worth was cal cul ated by subtracti ng the revi sed peak day demand for Dallas from the revised. total peak day demand for DFWIA. The peak hour for Fort Worth was calculated by adding 0.9 MGD to the peak day demand. The results of this spreadsheet for the most likely potable water rate increase scenario. Scenario 2. is presented in Table VII-5.
COST OF RAW WATER
The annual cost of raw water is dependent upon the capital cost of new facilities. the cost of existing debt service requirements. the cost of providing the raw water. and the cost of financing. The first three issues were addressed in Chapter VI. The remaining issue is addressed in the following section.
It is anticipated that the cost of the proposed improvements will need to be financed through the sale of bonds. Two alternatives for the sale of bonds were investigated. Under the first alternative. Dallas County Utility Reclamation District (DCURD) would provide the financing for all of the construction. Under the second alternative. DFWIA would provide the financing for all of the construction on the airport property and DCURD would provide the financing for the remainder of the construction. which would include the construction of Line A. Line B. and the Lake Remle Pump Station upgrade.
Under both of these alternatives. DCURD will provide financing for some portion of the project. Since the costs associated with the proposed improvements would be incurred solely to provide service to DFWIA. DCURD would likely need to recoup the annual debt-service requirement for these bonds from the sale of water to DFWIA. This could be accomplished by adding a debt-service component to the rate charged DFWIA. It is anticipated that the bonds secured to finance this construction would be repaid over a 20-year period. Once these bonds were repaid. the debt service component of the water rate would be eliminated. unless additional debt were incurred.
At this time. it is anticipated that DCURD could obtain financing through the sale of bonds to the Texas Water Development Board (TWDB). The TWDB provides assistance to local utilities by providing discounted bond rates for water and wastewater projects. Information provided by the bonding agents for DCURD indicates that bond rates available through the public bond market are in the 6 to 8 percent range. The rates available through the TWDB have historically been lower.
If DFWIA provides financing for the portion of construction on airport property; Line C, Line D, and the Trigg Lake Pump Station; it is anticipated that funds for this project woul d be provi ded by the ai rport. For the purposes of conducting a cost/benefit analysis. it is assumed that the cost of the system components on the ai rport represents an i niti a 1 cost to the project. Thi s cost wi 11 need to be recovered through savi ngs resulti ng from the purchase of raw water at lower rates than potable water over a period of years.
COST BENEFIT ANALYSIS
The projected annual cost of raw water was calculated for six alternatives which included different financing arrangements and different design conditions. The six alternatives evaluated are summarized in Table VII-6. These costs were compared to the projected annual decreases in the cost of potable water. If the total cost of the raw water was less than the decrease in the cost of potable water, then DFWIA would experience a net annual savings for that year. If the projected cost of raw water exceeded the projected decrease in the cost of potable water, then DFWIA would experience a net annual deficit for that year. The net annual deficits and savings were evaluated over a 40-year period to determine the net present worth of the
TABLE VII-6
RA W WATER SUPPLY ALTERNATIVES DCURDIDFWIA RAW WATER SUPPLY STUDY
Design Alternative Condition
1 Phase I pipes designed to accommodate Phase II demands
2 Phase I pipes designed to accommodate Phase II demands
3 Phase I pipes designed to accommodate only Phase I demands
4 Phase I pipes designed to accommodate only Phase I demands
5 Phase I pipes designed to accommodate Phase II demands
6 Phase I pipes designed to accommodate Phase II demands
Financing Arrangement
DCURD finances 100% of construction
DFWIA finances construction on airport property
DCURD finances 100% of construction
DFWIA finances construction on airport property
DCURD finances 100% of construction
DFWIA finances construction on airport property
1 DFWIA water rights to 610 ac-ft from Trigg Lake expire 12/31100.
Demand Condition
Phase I demands only
Phase I demands only
Phase I demands only
Phase I demands only
Additional demands occur in 200 1 due to loss of Trigg Lake Water Rights l
Additional demands occur in 2001 due to loss of Trigg Lake Water Rights 1
VII-12
project. The net present worth of the project indicates the total savings, or cost of the project expressed in current dollars.
This net present worth analysis was conducted for several scenarios. Factors that were allowed to vary in the analysis included the interest rate and the rate of potable water increases.
The results of these analyses are presented in Table VII-J through VII-12. Table VII-13 contains a sunmary of the results for all scenarios. The results indicate that all six alternatives have positive net present worths for the most likely scenario which assumes an interest rate of 5.5 percent and that potable water rates increase at a slightly higher rate than historical increases. The net present worth ranges from a low of $3.00 million, assuming that DCURD finances 100 percent of improvements designed to acconmodate Phase II demands, to a high of $9.44 million, assuming that DFWIA finances the portion of construction on airport property and additional demands occur beginning in the year 2001.
In addition to presenting the net present worth of the anticipated cost savings, a return on investment has been calculated for each alternative. The return on investment was calculated by dividing the net present worth of an alternative by the combined capital investment by DCURD and DFWIA, expressed as a percent. Table VII-14 contains the results of this analysis. This return on investment is considered to be the actual return on investment for DFWIA based on DFWIA's level of investment.
VALUE-ADDED BENEFITS
In addition to the probable cost benefits associated with the reduction in the price of water for irrigation purposes over the years, the construction of a raw water supply system for the DFWIA would have a number of additional, value-added benefits that can not be calculated directly at this time. A few of these value-added benefits have been identified below.
1. Current irrigation operations at the airport tend to stress the potable water system during the peak summertime uses. DFWIA irrigation staff have indicated that irrigation activities have been halted due to low water levels in the storage tanks. Continued reliance on potable water for irrigation would 1 ikely require the construction of additional storage tanks and pumping capacity in the near future. If the raw water system is constructed,
(3) Potable Water Rate Scenario 1: Dallas volume charge escalates 2% per year; demand charge escalates 5.25% per year. Fort Worth volume charge escalates 4.5% per year; peak day charge escalates 5.25%; peak hour charge escalates 1 % per year.
(4) Potable Water Rate Scenario 2: Dallas volume charge escalates 3% per year; demand charge escalates 6% per year. Fort Worth volume charge escalates 5% per year; peak day charge escalates 6%; peak hour charge escalates 2% per year.
(5) Potable Water Rate Scenario 3: Dallas volume charge escalates 4% per year; demand charge escalates 7% per year. Fort Worth volume charge escalates 6% per year; peak day charge escalates 7%; peak hour charge escalates 2.5% per year.
VII-21
additional potable water storage tanks and pumping capacity would probably not be required for several years.
2. Continued reliance on potable water for irrigation at the airport. coupled with the anticipated growth of the airport and its tenants will at some pOint result in water demands that exceed the capacity of the Dallas and Fort Worth water systems in the area. In order to provide additional capacity. the cities will need to construct substantial infrastructure improvements. While the need for these improvements may not be imminent. the conversion to raw water for irrigation activities would probably greatly extend the time before these improvements are needed. Due to the likely cost of these significant improvements. the deferral of the improvements could have a significant net present worth.
3. The conversion to a raw water supply for irrigation purposes would provide the airport with a relatively drought resistant source of water for irrigation purposes. If the Dallas/Fort Worth area were faced with significant water shortages requiring water rationing. irrigation activities at the airport would probably be largely unaffected. However. if the airport continues to rely on potable water for irrigation. the airport would likely be subject to any water rationing requirements enforced. If the drought were significant. the airport could be faced with the loss of valuable landscaped areas. The cost of replacing this landscaping could represent significant costs in the future that could be avoided with the raw water system.
4. The development of a raw water supply from DCURD would eliminate the airport's dependence on water from Trigg Lake. There is a probability that DFWIA will not be able to obtain the right to divert water from Trigg Lake in the future. The current water-right expires at the end of the year 2000. If this water right is lost. DFWIA would have to provide potable water to the golf courses at an annual cost of over $200.000.
5. In the recent past. the airport has had to provide potable water to the two golf courses when water was not available from Trigg Lake due to low lake levels or pump failures. At a rate of 1 MGD. the cost of this water is approximately $1.100 per day. Due to the contractual agreement between the golf courses and the airport. the airport is unable to recover this cost. The construction of a raw water system would eliminate the need to provide potable water to the golf courses. The level in Trigg Lake will be maintained due to a reliable source of water. In addition. if pump failures are experienced at the existing Trigg Lake Pump Station. water could be supplied to the golf courses from the new Trigg Lake Pump Station or from the DCURD supply line.
6. The nutrient levels in the raw water would most likely be higher than the potable water supply. Use of the raw water supply could result in a decreased need for other fertilizers. thus resulting in a decrease in costs.
7. The use of raw water would protect DFWIA from future unanticipated increases in the cost of potable water due to new regulatory requirements that will probably greatly increase the potable water treatment requirements. Future regulations will probably also impact the cost of treating reclaimed water. however. it is anticipated that the impact on reclaimed water treatment will be significantly lower than the impact on potable water treatment. Additionally. the use of reclaimed water would avoid the probable impact of
VII-22
the cities being required to obtain their water supply from reservoirs located at great distances from the metroplex.
8. The use of raw water by the airport would benefit the cities of Dallas and Fort Worth because their existing water supplies would be extended for some period. The 2.4 MGD of potable water that the airport would no longer be usi ng woul d be avail abl e to meet growi ng demands in other parts of the citi es' systems. This additional capacity may delay the cities' need to expand treatment capacity for relatively small periods of time. However. even a oneyear deferral in the construction of major treatment plant expansions can represent significant cost savings. In addition. the additional capacity may defer or reduce the need to begi n pumpi ng water from di stant reservoi rs. Again. the time-frame for these deferrals are probably relatively short but could still represent a significant cost savings for the utilities and their customers.
9. In addition to benefitting the airport. the availability of raw water would also provide a benefit to DFWIA tenants with irrigation demands by providing a low cost alternative.
10. The use of raw water is generally recognized as a positive environmental benefit due to the decreased impacts on surface waters due to decreased
·treatment plant discharges and the conservation of water resources. A water reclamation project the size of the proposed raw water system for DFWIA would be a show-case example for other airports and communities to follow.
CHAPTER VII I
CONCLUSIONS AND RECOMMENDATIONS
A study to evaluate the feasibility of implementing a raw water supply system for the Dallas/Fort Worth International Airport (DFWIA) was completed. The primary source for the raw water is the Dallas County Utility and Reclamation District (DCURD). An additional source for demands during the near-term is Trigg Lake. The results of the study include the following conclusions and recommendations.
1. A si gni fi cant demand for raw water is generated on DFWIA property. Thi s demand is a combination of DFWIA irrigation of landscaped areas, irrigation of two, 18-hole golf courses located at DFWIA, and cooling water make-up at the Central Utilities Plant. These demands are expected to increase in the future due to anticipated commercial and light industrial development around the airport.
2. DCURD has an excess supply of raw water, sufficient to meet the existing raw water demands at DFWIA. Additional supplies of raw water would need to be secured to accommodate the ultimate demands associated with the anticipated development at DFWIA.
3. A raw water supply system can be constructed to convey raw water from DCURD to the i rri gat ion operations at DFWIA. The improvements would inc 1 ude addit i ona 1 pumpi ng capacity and pi pe 1 i nes. The opi ni on of probable tot a 1 project cost for a system designed to supply the eXisting demands is $9.5 mi 11 ion. Additi ona 1 capacity to accommodate future demands coul d be provided by constructing slightly larger diameter pipelines. The opinion of total probable project costs for this design would be $10.3 million.
4. During the early years of the operation of the raw water system, the unit costs of the raw water may be greater than the unit cost of potable water, depending upon the financing arrangements. However, in future years, the cost of raw water would be significantly less than the cost of potable water.
5. Significant cost savings in the purchase of water can be achieved by DFWIA through the implementation of a raw water system. The net present worth of the projected cost savings over a 40-year period ranges from a low of $3.00 million to a high of $9.44 million for the most likely scenario. This range in net present worths represents a return on the DFWIA investment of between 41 and 293 percent.
6. In addition to the probable cost savings associated with the purchase of potable water, other value-added benefits can be derived from the implementation of a raw water system. These value-added benefits include the deferral of future potable water system improvements by DFWIA and the cities of Dallas and Fort Worth; the conservati on of water resources in the Dallas/Fort Worth area; the implementation of a drought-resistent source of water for irrigation purposes; an alternative source of water should DFWIA
VIII-2
lose the right to divert water from Trigg Lake. and a source of cheaper water for DFWIA tenants with irrigation demands.
7. Pending the completion of the legal review. the next steps for DCURD and DFWIA to implement a raw water system would be to authorize the design of the system and begin negotiating the terms of the water sale contract.