Page 1
This report is in response to a requirement of Act 1 of Special Session 1 (2007-2008), known as the Alternative Energy Investment Act. It describes the status of the Homeowner Energy Efficiency Loan Program (HEELP) as well as its successes and challenges.
The Legislature defined most of the parameters of the HEELP program in the Act. The legislatively mandated program characteristics of HEELP include loan usage (weatherization and energy efficient-type repairs and improvements), loan terms (10 years and a below market rate), an income limit of 150 percent of the greater of the area or statewide median income, and certain underwriting criteria (specifics within PHFA’s discretion to determine). The Act also requires PHFA to develop a network of approved contractors to do HEELP work and specifies the standards that contractors must meet to be approved.
PHFA uses a total debt to income ratio of 45 percent (with exceptions possible, typically not exceeding 52 percent) and a Combined Loan to Value Ratio not to exceed 120 percent of home value); and an interest rate of 1 percent. A minimum credit score is not required in the HEELP program, although a credit report is obtained to review the applicant’s credit history. The underwriting criteria are flexible compared to typical lending practices in order to benefit as many Pennsylvanians as possible. A common sense approach is utilized and full documentation of the borrower’s income, assets and credit history is obtained in order to demonstrate an ability to repay the loan.
PHFA’s main strategy in its first five years of operation was to use HEELP as a complement to the federal Weatherization Assistance Program because: (1) Weatherization funds often cannot cover all necessary repairs, most notably roofs, and (2) stimulus dollars were being directed to the Weatherization Program, so this was a prime opportunity to leverage that additional funding. The HEELP program continues to be in a position that allows for expansion of the state’s array of state-and-federally supported Energy Efficiency programs to Pennsylvanians of all income levels now that stimulus dollars are no longer available. These programs include:
• Weatherization grants- The Weatherization Assistance Program is funded by the Department of Energy and passed through to the Department of Community and Economic Development and ultimately funds are moved to the Weatherization providers at the local level. Funding is limited to $6,500 per home, so HEELP is able to bridge the gap for repairs that require more funding, such as roof replacement.https://dced.pa.gov/programs/weatherization-assistance-program-wx/
• Federal Tax Credits- The Residential Renewable Energy Tax Credit is funded throughFederal funds. Eligible uses include solar water heat, photovoltaics, wind, fuel cells,geothermal heat pumps, and other solar technologies.http://www.energystar.gov/taxcredits
1
Homeowners Energy Efficiency Loan Program Report
Page 2
This array provides Pennsylvanians with grants, loans, and tax credits to help pay for or reimburse them for general energy efficiency work (such as air sealing, insulation, heating system repair and/or replacement, minor repairs that allow Weatherization to occur, homeowner education), whole house (heating, cooling, insulation, and air sealing projects that are accompanied by a whole house energy audit), solar and geothermal heating.
HEELP loans strengthen offerings at the lower end of the income scale compared to typical financing options and tax credit incentives. The Agency has used these funds to support full Weatherization Assistance Program expenditures and to ensure that all Pennsylvanians have some type of option for home energy efficiency assistance.
PHFA encourages Community Action Provider (CAP) and Weatherization Agency Providers (WAP) involvement because they can provide homeowner education, suggest energy efficiency solutions, recognize reasonable costs, and help with contractor selection, and contractor oversight. CAP/WAP participation is voluntary, however, and there has been modest interest in participation in HEELP. Our participating agencies are to date:
• ACTION-Housing, Inc.• Fayette County Redevelopment Authority• Habitat for Humanity of Greater Pittsburgh• Housing Development Corp. of Northeast PA• Philadelphia Neighborhood Housing Services• Scranton- Lackawanna Human Development Agency
PHFA continues to make outreach through CAP/WAP professional associations and directly to potential local program administrators.
Program Statistics
As of November 1, 2015, 511 loans have been approved out of a total of 1,562 applications received, for an approval rate of 30 percent. While this may seem low, this approval rate is due to the majority of applicants not being able to afford any additional debt, even a payment of $88 a month for a $10,000, 1% interest rate loan.
Appendix A is a list of all HEELP loans closed on or before November 1, 2015. The total number of closed loans as of November 1, 2015 is 394. The number of loan closings is less than approvals due to borrowers’ need to select an approved contractor’s estimate in a timely manner so that the loan can be closed in an amount sufficient to cover the needed work. Contractors often must become approved to perform this work.
2
Page 3
Energy Savings
In an effort to keep origination/operation costs to a minimum, PHFA has attempted to use existing energy savings reports wherever possible. For this reason, the Agency intended to use energy efficiency information already gathered by CAPs/WAPs, thus saving the $250 to $400 projected cost of energy audits for each household. As borrowers were approved for loans, however, it became apparent that very little energy savings data for these households would be available. Many borrowers had had weatherization work done to their home prior to recent federal testing requirements and were using HEELP loans to finish installing energy efficiency items that had been recommended to them and to repair or replace roofs. Also, approximately fifty-six percent of the borrowers were working independently of an assistance agency.
Roofs are an interesting aspect of the HEELP program. Two hundred and forty of the 394, or 61 percent, of the HEELP loans closed as of November 1 have had roof replacement or repair as the largest single expenditure of the loan. Roof repair is a common barrier to weatherization grant work being performed and maintaining homeowner’s insurance as well.
Now at the end of HEELP’s fifth year, PHFA continues to confront the “post-install” data issue as it impacts the Agency’s ability to report energy savings from HEELP work. Of the 163 loans included in our review period, loans closed prior to November 1, 2015, 75 have met their reporting requirements at their respective reporting phase, 30 have not responded to Agency requests for all or a portion of energy information, and 58 are either not six months out from their installation date and do not yet owe the Agency usage information or have not completed construction as of the reporting date.
Actual responses to the energy usage submission requirements indicate that many borrowers are not bothering to meet their obligation to provide usage information despite repeated Agency efforts via telephone and mail (and email if available) to procure the data.
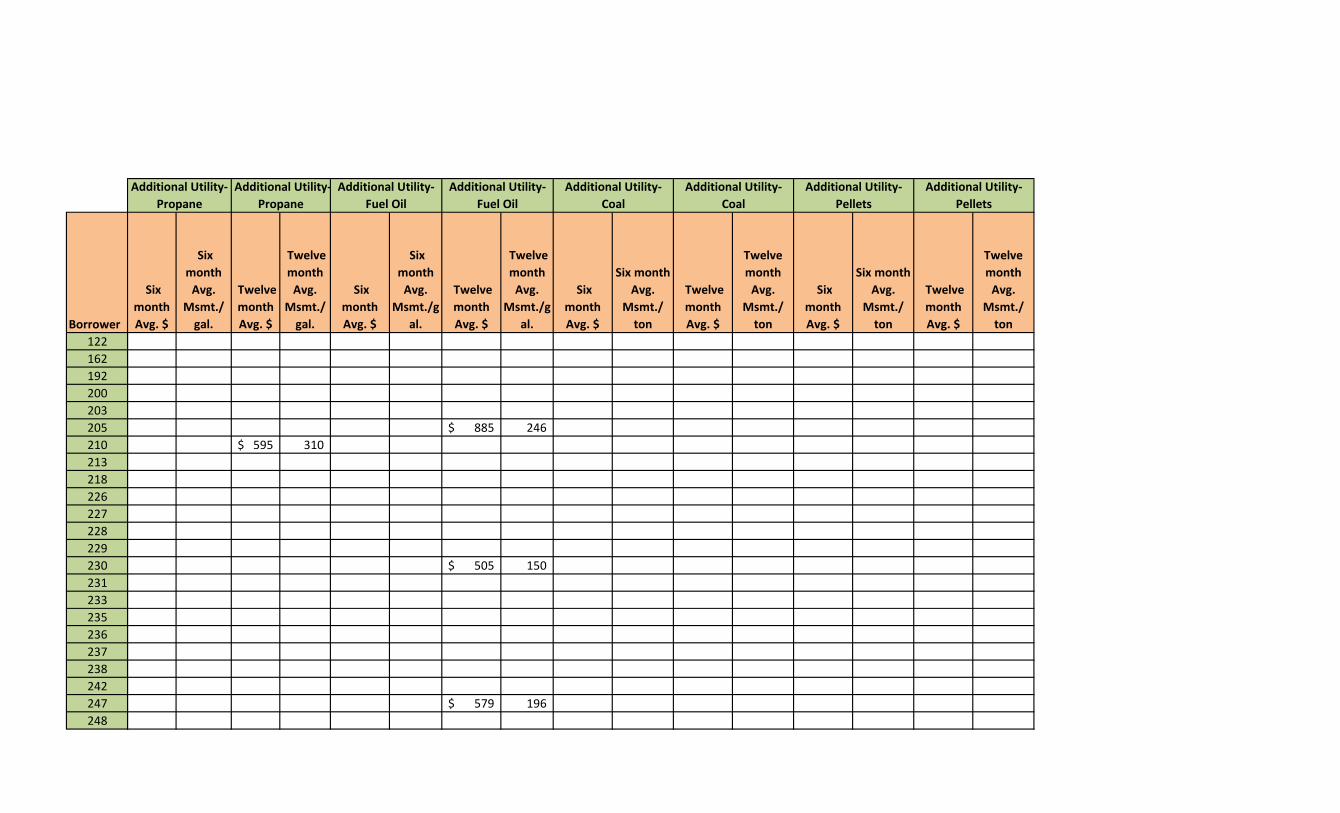
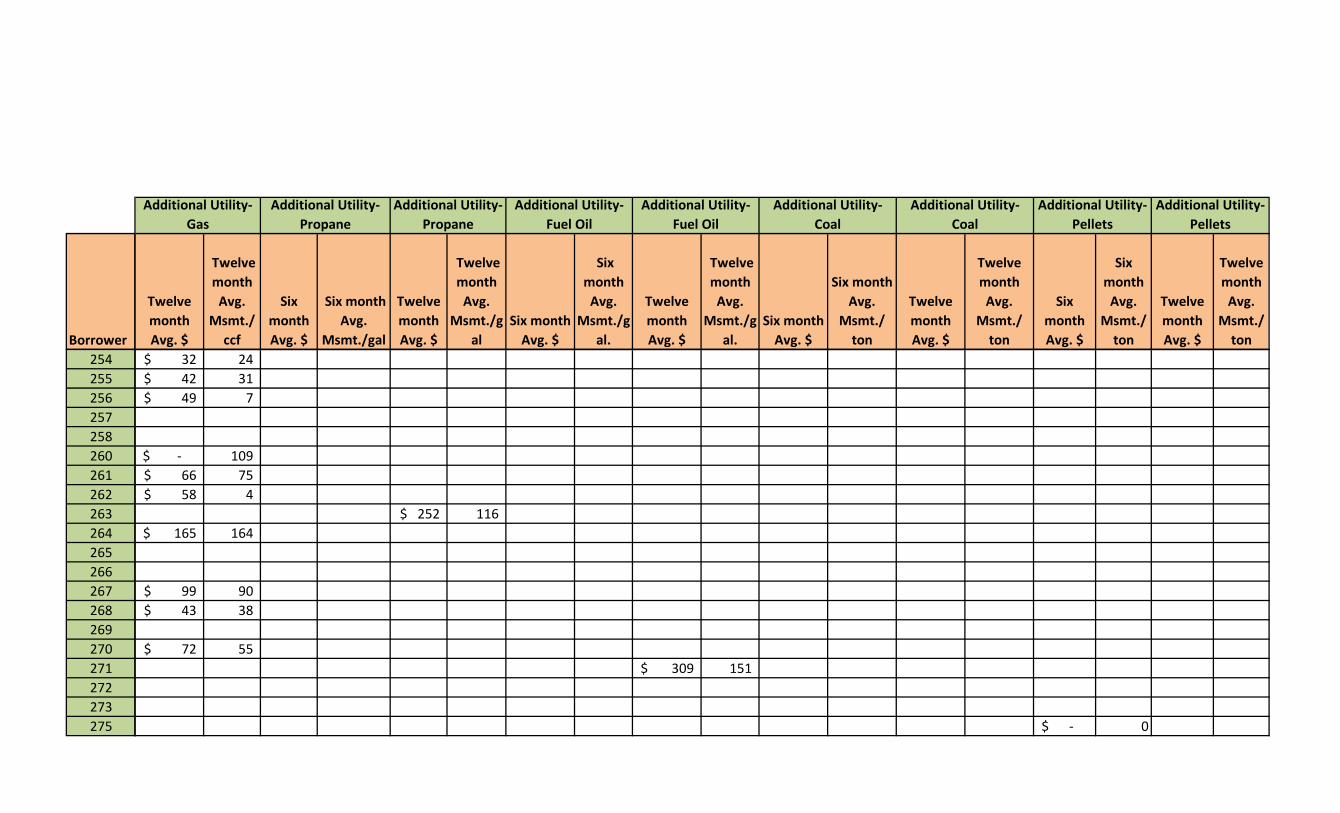
Appendix B- Table 1 (Change in Reported Energy Usage- Borrowers with Pre and Post Data Only) summarizes for each borrower their average Electric, Gas, and Fuel Oil consumption for the months prior to installation and post-installation, if available. For example, Borrower 146’s data is for the twelve months prior to their date of application for pre-install data and twelve months after their work was completed for post-install. The responses received often show energy use increases rather than reductions, which typically indicates a more severe winter and other behavioral changes by borrowers. Again, it also reflects that the majority of work paid for with HEELP loans: i.e. roofs typically have little impact on reducing energy usage but are vital home maintenance repairs. Appendix B- Table 2 summarizes energy usage information received from all borrowers with closed loans- even those not reporting post-install data.
3
Page 4
The success of the HEELP loan is best measured in three ways: its ability to help Commonwealth citizens’ help themselves to meet their housing needs; its availability to support Weatherization programs; and its role, supporting lower-income Pennsylvanians, in the array of energy efficiency programs within the state.
4
Page 5
Appendix A- Summary of Applications and Approved Loans
Number of Applications
Status as of Nov. 1, 2015
Closed Approved Denied Cancelled Pending 1562 394 511 973 154 41
Approved and Closed Loans- As of November 1, 2015*
County Closing Date Original Principal Loan Balance
Loan Use
ADAMS 8/22/2011 $10,000 2, 4 ADAMS 2/7/2013 $10,000 2, 4 ADAMS 5/1/2013 $10,000 2 ADAMS 9/27/2013 $9,000 1 ADAMS 3/2/2015 $10,000 1, 2, 3, 4 ALLEGHENY 3/8/2011 $9,997 1, 2, 4 ALLEGHENY 3/8/2011 $10,000 2, 4 ALLEGHENY 3/29/2011 $5,000 2, 4 ALLEGHENY 4/21/2011 $9,524 2, 4 ALLEGHENY 4/25/2011 $10,000 4 ALLEGHENY 10/3/2011 $10,000 1, 2, 3, 4 ALLEGHENY 11/17/2011 $10,000 4 ALLEGHENY 12/15/2011 $9,000 2, 3 ALLEGHENY 12/15/2011 $10,000 4 ALLEGHENY 1/27/2012 $2,045 1, 2, 4 ALLEGHENY 3/28/2012 $7,345 4 ALLEGHENY 4/5/2012 $10,000 1, 2 ALLEGHENY 10/4/2012 $10,000 2 ALLEGHENY 2/14/2013 $5,000 4 ALLEGHENY 2/26/2013 $10,000 3 ALLEGHENY 9/3/2013 $9,730 1, 2 ALLEGHENY 9/3/2013 $10,000 4 ALLEGHENY 9/4/2013 $4,500 4 ALLEGHENY 11/22/2013 $5,750 3 ALLEGHENY 4/1/2014 $8,200 4 ALLEGHENY 4/21/2014 $9,974 3 ALLEGHENY 6/18/2014 $9,720 1, 3 ALLEGHENY 8/1/2014 $4,726 2 ALLEGHENY 8/19/2014 $10,000 4 ALLEGHENY 12/12/2014 $9,982 2, 3, 4 ALLEGHENY 12/12/2014 $10,000 1, 2, 3, 4 ALLEGHENY 1/15/2015 $8,000 4 ALLEGHENY 1/15/2015 $10,000 2, 4 ALLEGHENY 3/9/2015 $10,000 2 ALLEGHENY 3/17/2015 $10,000 4
Page 6
Appendix A- Summary of Applications and Approved Loans
Approved and Closed Loans- As of November 1, 2015*
County Closing Date Original Principal Loan Balance
Loan Use
ALLEGHENY 4/9/2015 $10,000 1, 2 ALLEGHENY 4/9/2015 $10,000 4 ALLEGHENY 5/12/2015 $10,000 4 ALLEGHENY 6/8/2015 $10,000 1, 2, 4 ALLEGHENY 7/24/2015 $1,570 2 ALLEGHENY 9/18/2015 $6,000 4 ALLEGHENY 9/23/2015 $10,000 2, 4 ALLEGHENY 10/28/2015 $5,000 4 ARMSTRONG 11/3/2011 $10,000 4 ARMSTRONG 2/9/2012 $10,000 3, 4 BEAVER 10/3/2011 $10,000 2, 4 BEAVER 1/23/2012 $10,000 1, 2 BEAVER 8/24/2015 $5,876 2, 3 BEDFORD 5/6/2011 $4,995 1 BERKS 11/15/2010 $9,644 2, 3 BERKS 3/18/2011 $5,765 4 BERKS 7/25/2011 $8,000 4 BERKS 12/7/2011 $8,500 3 BERKS 8/13/2012 $10,000 1, 2, 4 BERKS 3/21/2013 $7,000 4 BERKS 9/18/2013 $8,700 3 BERKS 10/7/2013 $9,400 1, 3, 4 BERKS 10/23/2014 $10,000 3, 4 BERKS 9/30/2015 $10,000 2, 3 BLAIR 12/8/2011 $10,000 1, 3 BLAIR 12/22/2014 $5,725 3 BUCKS 3/27/2012 $7,000 4 BUCKS 6/18/2015 $6,000 3 BUCKS 7/14/2015 $10,000 3, 4 BUTLER 10/8/2013 $9,400 3, 4 BUTLER 10/29/2014 $10,000 4 CAMBRIA 8/12/2010 $6,845 4 CAMBRIA 11/24/2010 $10,000 3, 4, 5 CAMBRIA 8/24/2011 $10,000 2, 4 CAMBRIA 9/8/2011 $6,000 2, 4 CAMBRIA 12/6/2011 $10,000 3, 4 CAMBRIA 10/12/2012 $5,400 2, 4 CAMBRIA 10/18/2012 $10,000 5 CAMBRIA 2/4/2013 $5,000 3
Page 7
Appendix A- Summary of Applications and Approved Loans
Approved and Closed Loans- As of November 1, 2015*
County Closing Date Original Principal Loan Balance
Loan Use
CAMBRIA 6/18/2013 $7,850 2, 4 CAMBRIA 7/13/2015 $10,000 1, 4 CAMBRIA 9/1/2015 $10,000 2, 4 CARBON 7/25/2011 $8,180 2, 4 CARBON 12/6/2011 $8,775 4 CARBON 11/21/2012 $7,000 4 CARBON 12/15/2014 $9,400 2, 3, 4 CHESTER 12/18/2013 $7,357 1, 3 CLEARFIELD 7/29/2010 $5,370 2 CLEARFIELD 11/18/2011 $10,000 4 CLEARFIELD 2/23/2012 $10,000 1, 4 CLEARFIELD 11/26/2013 $10,000 1, 2 CLEARFIELD 2/12/2014 $3,100 3 CLEARFIELD 10/23/2014 $3,236 3 CLEARFIELD 12/9/2014 $7,000 4 CLEARFIELD 1/23/2015 $10,000 1, 2, 3 CLEARFIELD 9/21/2015 $10,000 4 CLEARFIELD 10/5/2015 $8,000 2, 4 CLEARFIELD 10/28/2015 $7,200 4 COLUMBIA 4/28/2014 $10,000 4 CRAWFORD 11/10/2010 $7,375 4 CRAWFORD 5/23/2012 $8,500 2, 4 CRAWFORD 10/22/2014 $10,000 1, 2, 4 CRAWFORD 11/13/2014 $10,000 1, 2, 3, 4 CRAWFORD 7/14/2015 $8,000 4 CUMBERLAND 8/5/2011 $6,490 2, 4 CUMBERLAND 4/30/2012 $10,000 2, 4 CUMBERLAND 7/30/2013 $9,200 2, 4 CUMBERLAND 8/15/2014 $5,600 3 CUMBERLAND 12/9/2014 $10,000 1, 2, 3 CUMBERLAND 12/16/2014 $10,000 3 CUMBERLAND 3/18/2015 $7,500 3 DAUPHIN 9/24/2010 $4,698 4 DAUPHIN 1/17/2012 $9,500 2, 3 DAUPHIN 1/27/2012 $9,800 1, 3 DAUPHIN 7/18/2012 $4,695 3 DAUPHIN 10/10/2012 $5,000 4 DAUPHIN 11/15/2012 $9,290 3 DAUPHIN 12/12/2012 $8,800 4 DAUPHIN 1/8/2013 $10,000 2, 3 DAUPHIN 2/12/2013 $5,000 3 DAUPHIN 3/11/2013 $5,307 3
Page 8
Appendix A- Summary of Applications and Approved Loans
Approved and Closed Loans- As of November 1, 2015*
County Closing Date Original Principal Loan Balance
Loan Use
DAUPHIN 4/3/2013 $7,100 1, 3 DAUPHIN 4/11/2013 $9,647 1, 2, 3, 4 DAUPHIN 7/1/2013 $5,398 3 DAUPHIN 8/6/2013 $4,750 3 DAUPHIN 8/20/2013 $3,200 3 DAUPHIN 9/21/2013 $8,000 3 DAUPHIN 10/15/2013 $2,662 3 DAUPHIN 3/11/2014 $5,000 3 DAUPHIN 4/6/2015 $5,000 2 DAUPHIN 7/7/2015 $10,000 3 DELAWARE 4/22/2010 $5,300 4 DELAWARE 5/27/2010 $6,840 4 DELAWARE 6/1/2010 $9,190 5 DELAWARE 6/25/2010 $9,940 2 DELAWARE 6/28/2010 $4,080 5 DELAWARE 7/7/2010 $9,250 4 DELAWARE 10/27/2010 $9,170 2, 3, 4 DELAWARE 2/23/2011 $7,760 3 DELAWARE 3/17/2011 $4,530 4 DELAWARE 4/4/2011 $9,950 5 DELAWARE 5/11/2011 $9,890 4 DELAWARE 6/17/2011 $4,420 2 DELAWARE 8/15/2011 $4,810 2, 4 DELAWARE 8/31/2011 $9,925 4 DELAWARE 10/24/2011 $4,820 3, 4 DELAWARE 10/27/2011 $9,580 2, 4 DELAWARE 12/6/2011 $10,000 4 DELAWARE 1/18/2012 $7,755 2 DELAWARE 3/28/2012 $5,000 4 DELAWARE 5/31/2012 $6,400 4 DELAWARE 7/2/2012 $9,030 2 DELAWARE 7/12/2012 $8,750 2, 4 DELAWARE 9/14/2012 $4,810 3 DELAWARE 7/8/2013 $10,000 2, 4, 6 DELAWARE 8/26/2013 $9,975 1, 2, 3, 4 DELAWARE 9/5/2013 $7,630 3 DELAWARE 9/9/2013 $10,000 1, 2, 3 DELAWARE 10/1/2013 $10,000 2, 3, 4 DELAWARE 10/1/2013 $10,000 4 DELAWARE 10/11/2013 $9,980 2, 3 DELAWARE 11/8/2013 $10,000 2, 3, 4
Page 9
Appendix A- Summary of Applications and Approved Loans
Approved and Closed Loans- As of November 1, 2015*
County Closing Date Original Principal Loan Balance
Loan Use
DELAWARE 11/25/2013 $10,000 1, 2, 3, 4 DELAWARE 12/5/2013 $10,000 1, 3 DELAWARE 1/13/2014 $10,000 2, 4 DELAWARE 1/28/2014 $10,000 2, 3 DELAWARE 3/6/2014 $9,700 1, 2, 3 DELAWARE 3/11/2014 $10,000 3 DELAWARE 5/1/2014 $9,980 2, 4 DELAWARE 8/4/2014 $4,875 2, 4 DELAWARE 7/14/2015 $5,000 4 DELAWARE 9/4/2015 $6,500 3, 4 DELAWARE 10/16/2015 $7,000 4 ELK 11/12/2014 $6,900 4 ERIE 12/23/2010 $6,787 1, 2 ERIE 12/22/2011 $10,000 2, 4 ERIE 5/14/2012 $10,000 1, 2, 3, 4 ERIE 4/16/2013 $10,000 2, 4 ERIE 4/19/2013 $10,000 2, 3, 4 ERIE 7/8/2013 $7,280 4 ERIE 5/9/2014 $9,995 1, 2 ERIE 7/2/2014 $10,000 2, 4 ERIE 9/12/2014 $10,000 2, 4 ERIE 3/6/2015 $7,200 3 ERIE 8/17/2015 $10,000 2, 3 FAYETTE 8/10/2010 $9,850 4 FAYETTE 3/30/2011 $9,971 2, 3 FAYETTE 7/12/2011 $8,000 2, 4 FAYETTE 7/12/2011 $10,000 4 FAYETTE 8/31/2011 $10,000 2, 4 FAYETTE 11/22/2011 $10,000 3, 4 FAYETTE 1/23/2012 $10,000 3, 4 FAYETTE 2/23/2012 $10,000 4 FAYETTE 3/27/2012 $9,300 4 FAYETTE 4/17/2012 $3,195 3 FAYETTE 5/1/2012 $10,000 2, 4 FAYETTE 9/18/2012 $2,485 3 FAYETTE 10/9/2012 $8,300 2, 4 FAYETTE 11/8/2012 $8,000 3 FAYETTE 6/17/2013 $10,000 4 FAYETTE 9/3/2013 $8,600 4 FAYETTE 1/13/2014 $10,000 4 FAYETTE 2/2/2015 $10,000 2, 4
Page 10
Appendix A- Summary of Applications and Approved Loans Approved and Closed Loans- As of November 1, 2015*
County Closing Date Original Principal
Loan Balance Loan Use
FAYETTE 4/13/2015 $7,000 2 FAYETTE 6/22/2015 $5,500 4 FAYETTE 9/28/2015 $10,000 4 FAYETTE 10/5/2015 $6,500 4 GREENE 9/17/2012 $10,000 4 INDIANA 11/12/2012 $5,000 4 INDIANA 4/23/2014 $10,000 4 JEFFERSON 10/25/2010 $5,000 3 JEFFERSON 3/15/2013 $8,000 4 LACKAWANNA 11/20/2012 $10,000 1, 3 LACKAWANNA 5/29/2013 $10,000 3, 4 LACKAWANNA 8/20/2013 $10,000 1, 2, 3 LACKAWANNA 1/8/2014 $9,310 1, 2, 3 LACKAWANNA 1/10/2014 $8,390 1, 2 LACKAWANNA 2/12/2014 $5,000 3 LACKAWANNA 6/10/2014 $4,643 3 LACKAWANNA 7/8/2014 $6,100 3 LACKAWANNA 9/4/2014 $10,000 3, 4 LACKAWANNA 9/17/2014 $1,333 3 LACKAWANNA 10/9/2014 $3,900 4 LACKAWANNA 11/26/2014 $8,400 4 LACKAWANNA 12/22/2014 $7,400 3, 4 LACKAWANNA 1/14/2015 $7,700 4 LACKAWANNA 2/2/2015 $5,000 3 LACKAWANNA 3/30/2015 $9,050 1, 2, 3, 4 LACKAWANNA 7/7/2015 $1,400 5 LACKAWANNA 10/30/2015 $4,700 3 LANCASTER 12/23/2010 $10,000 3 LANCASTER 10/7/2011 $5,000 4 LANCASTER 12/22/2011 $8,713 3 LANCASTER 1/3/2012 $10,000 2, 3 LANCASTER 1/10/2012 $9,500 4 LANCASTER 7/16/2012 $10,000 2 LANCASTER 11/5/2012 $10,000 2 LANCASTER 11/16/2012 $9,100 3 LANCASTER 4/19/2013 $10,000 1, 2, 4 LANCASTER 10/2/2013 $9,415 2 LANCASTER 1/8/2014 $5,390 3 LANCASTER 11/12/2014 $5,395 3 LANCASTER 3/11/2015 $10,000 2, 4 LANCASTER 3/12/2015 $10,000 1, 2, 3, 4
Page 11
Appendix A- Summary of Applications and Approved Loans Approved and Closed Loans- As of November 1, 2015*
County Closing Date Original Principal
Loan Balance Loan Use
LANCASTER 5/15/2015 $6,300 1, 4 LANCASTER 7/7/2015 $6,030 3 LANCASTER 7/14/2015 $4,476 4 LANCASTER 8/20/2015 $10,000 2, 3 LAWRENCE 4/5/2011 $9,860 4 LEBANON 9/22/2011 $10,000 1, 2, 3 LEHIGH 10/25/2011 $4,763 3 LEHIGH 11/14/2013 $10,000 5 LEHIGH 5/28/2015 $9,615 2 LUZERNE 11/22/2010 $9,950 2, 3, 4, 5 LUZERNE 4/6/2011 $9,922 2, 4 LUZERNE 6/14/2011 $5,600 4 LUZERNE 8/22/2011 $10,000 1, 2, 4, 5 LUZERNE 8/22/2011 $10,000 5 LUZERNE 10/6/2011 $5,000 4 LUZERNE 11/8/2011 $5,100 4 LUZERNE 12/19/2011 $3,000 4 LUZERNE 4/26/2012 $9,278 1, 4 LUZERNE 5/16/2012 $10,000 4 LUZERNE 6/28/2012 $10,000 2, 4 LUZERNE 6/29/2012 $5,685 4 LUZERNE 8/23/2012 $7,200 4 LUZERNE 8/31/2012 $7,580 2 LUZERNE 10/8/2012 $5,900 4 LUZERNE 11/20/2012 $10,000 4 LUZERNE 1/10/2013 $10,000 4 LUZERNE 1/14/2013 $10,000 2 LUZERNE 3/12/2013 $10,000 4 LUZERNE 6/28/2013 $10,000 2, 4 LUZERNE 7/15/2013 $1,850 4 LUZERNE 11/25/2013 $10,000 2, 4 LUZERNE 1/6/2014 $1,860 1, 2, 4 LUZERNE 3/4/2014 $3,800 2 LUZERNE 4/11/2014 $10,000 1, 2, 3 LUZERNE 10/14/2014 $7,130 4 LUZERNE 10/20/2014 $5,825 4 LUZERNE 3/11/2015 $8,500 4 LUZERNE 6/26/2015 $10,000 4 LUZERNE 7/20/2015 $10,000 4 LUZERNE 8/19/2015 $10,000 4 LUZERNE 8/31/2015 $10,000 4
Page 12
Appendix A- Summary of Applications and Approved Loans Approved and Closed Loans- As of November 1, 2015*
County Closing Date Original Principal
Loan Balance Loan Use
LUZERNE 10/1/2015 $5,295 4 LUZERNE 10/19/2015 $7,790 4 LYCOMING 10/28/2010 $9,969 1, 3 LYCOMING 6/29/2011 $10,000 1, 3 LYCOMING 11/21/2011 $8,686 2 LYCOMING 5/20/2013 $9,200 4 LYCOMING 10/15/2013 $4,850 1, 3, 4 MCKEAN 6/14/2013 $5,000 4 MERCER 3/18/2011 $10,000 1, 2 MERCER 8/15/2011 $10,000 4 MERCER 8/2/2012 $7,574 4 MERCER 10/12/2012 $10,000 3, 4 MERCER 8/6/2013 $9,725 2, 3 MIFFLIN 8/17/2011 $8,900 4 MIFFLIN 4/18/2012 $10,000 1, 2, 4 MIFFLIN 10/15/2014 $4,900 3 MONROE 4/26/2013 $10,000 4 MONROE 7/14/2014 $7,950 3 MONTGOMERY 11/27/2012 $8,100 3 MONTGOMERY 8/21/2013 $4,600 4 MONTGOMERY 5/2/2014 $10,000 4 MONTGOMERY 2/2/2015 $10,000 2, 3, 4 NORTHAMPTON 2/2/2015 $10,000 2, 4 NORTHAMPTON 8/4/2015 $8,000 2 NORTHAMPTON 10/27/2015 $8,500 4 NORTHUMBERLAND 12/10/2010 $2,786 2 NORTHUMBERLAND 10/22/2012 $10,000 4 NORTHUMBERLAND 10/7/2013 $10,000 1, 2, 3, 4 PERRY 1/14/2015 $6,179 3 PHILADELPHIA 5/11/2011 $4,875 4 PHILADELPHIA 5/23/2011 $9,933 1, 2, 3, 4 PHILADELPHIA 11/7/2011 $10,000 4 PHILADELPHIA 12/14/2011 $6,343 4, 6 PHILADELPHIA 2/23/2012 $10,000 2, 4 PHILADELPHIA 3/26/2012 $10,000 2, 4 PHILADELPHIA 7/16/2012 $9,762 1, 2, 3 PHILADELPHIA 10/3/2012 $8,000 2, 4 PHILADELPHIA 11/14/2012 $10,000 2, 4 PHILADELPHIA 4/12/2013 $10,000 1, 2, 3, 4 PHILADELPHIA 4/15/2013 $5,000 4 PHILADELPHIA 4/16/2013 $10,000 1, 2, 3, 4
Page 13
Appendix A- Summary of Applications and Approved Loans Approved and Closed Loans- As of November 1, 2015*
County Closing Date Original Principal
Loan Balance Loan Use
PHILADELPHIA 5/14/2013 $10,000 3 PHILADELPHIA 12/4/2013 $10,000 2 PHILADELPHIA 2/11/2014 $10,000 1, 2 PHILADELPHIA 4/8/2014 $5,000 4 PHILADELPHIA 6/20/2014 $10,000 1, 3 PHILADELPHIA 6/23/2014 $3,300 3 PHILADELPHIA 10/13/2014 $7,000 4 PHILADELPHIA 10/24/2014 $9,216 3, 4 PHILADELPHIA 11/4/2014 $10,000 4 PHILADELPHIA 11/13/2014 $10,000 3 PHILADELPHIA 11/19/2014 $10,000 2, 3 PHILADELPHIA 11/24/2014 $7,000 3, 4 PHILADELPHIA 11/25/2014 $2,600 4 PHILADELPHIA 2/5/2015 $4,100 3, 4 PHILADELPHIA 5/1/2015 $10,000 2, 4 PHILADELPHIA 6/10/2015 $6,400 2 PHILADELPHIA 8/24/2015 $6,500 4 PHILADELPHIA 9/4/2015 $7,000 3 SCHUYLKILL 4/11/2013 $2,227 3 SCHUYLKILL 4/28/2015 $10,000 2, 4 SNYDER 4/30/2013 $10,000 1, 2, 3 SOMERSET 10/31/2011 $10,000 2, 4 SOMERSET 2/20/2013 $3,850 2 SUSQUEHANNA 9/27/2013 $10,000 4 WASHINGTON 11/15/2010 $10,000 4 WASHINGTON 11/12/2012 $10,000 4 WASHINGTON 10/31/2013 $7,500 1, 4 WASHINGTON 1/9/2014 $10,000 4 WASHINGTON 10/29/2014 $8,500 4 WASHINGTON 6/29/2015 $5,000 2 WAYNE 7/12/2011 $10,000 4 WAYNE 1/13/2015 $8,800 4 WESTMORELAND 10/21/2010 $10,000 2, 4 WESTMORELAND 4/21/2011 $8,200 1, 4 WESTMORELAND 6/9/2011 $6,975 2, 4 WESTMORELAND 7/28/2011 $10,000 4 WESTMORELAND 11/29/2011 $10,000 2, 4 WESTMORELAND 4/5/2012 $10,000 4 WESTMORELAND 6/28/2012 $10,000 4 WESTMORELAND 7/18/2012 $10,000 4 WESTMORELAND 9/10/2012 $3,900 4
Page 14
Appendix A- Summary of Applications and Approved Loans
Approved and Closed Loans- As of November 1, 2015*
County Closing Date Original Principal Loan Balance
Loan Use
WESTMORELAND 5/9/2013 $7,956 3, 4 WESTMORELAND 6/24/2013 $5,500 1, 3 WESTMORELAND 8/21/2013 $10,000 4 WESTMORELAND 3/18/2014 $4,570 2, 4 WESTMORELAND 8/25/2014 $10,000 2, 3, 4 WESTMORELAND 9/17/2014 $10,000 1, 2, 3, 4 WESTMORELAND 11/21/2014 $10,000 2, 4 WESTMORELAND 3/12/2015 $10,000 1, 2, 3, 4 WESTMORELAND 6/3/2015 $6,590 3 WESTMORELAND 9/4/2015 $6,400 4 WESTMORELAND 11/2/2015 $9,000 2, 4 YORK 11/30/2010 $4,030 4 YORK 10/6/2011 $4,000 1 YORK 2/29/2012 $10,000 2 YORK 3/25/2013 $10,000 3, 4 YORK 6/2/2014 $5,113 2, 3 YORK 6/23/2014 $5,171 1, 3 YORK 7/7/2014 $2,015 4 TOTALS $3,076,389 Loan Use
1- Air sealing/insulation/ducts 2- Energy efficient windows/doors 3- Energy efficient heating/cooling 4- Roofing repairs and/or replacement 5- Miscellaneous
*This table represents closed loans only.
Page 15
Appendix A- Summary of Applications and Approved Loans
Approved Not Yet Closed- As of November 1, 2015**
County Approval Date Original Principal Loan
Balance
Loan Use
ALLEGHENY 12/10/2014 $10,000 1, 2, 4 ALLEGHENY 7/23/2015 $10,000 4 ALLEGHENY 8/5/2015 $10,000 2, 3 ALLEGHENY 10/14/2015 $6,500 1, 2, 3, 4 BEAVER 8/5/2015 $10,000 4 BEAVER 10/1/2015 $10,000 2, 3, 4 BUCKS 10/13/2015 $10,000 2 CAMBRIA 9/11/2015 $10,000 2, 4 DAUPHIN 8/5/2015 $5,500 2, 4 DELAWARE 10/14/2015 $10,000 3, 4 ELK 10/8/2015 $10,000 4 ERIE 10/1/2015 $10,000 1, 2, 3, 4 FAYETTE 8/24/2015 $10,000 1, 2, 3, 4 FAYETTE 10/8/2015 $10,000 4 FAYETTE 10/14/2015 $10,000 3 INDIANA 10/14/2015 $10,000 2 LACKAWANNA 8/17/2015 $10,000 1, 2, 3 LACKAWANNA 9/11/2015 $10,000 1, 2, 4 LACKAWANNA 10/28/2015 $10,000 3, 4 LUZERNE 7/22/2015 $10,000 3 PHILADELPHIA 3/24/2015 $10,000 3 PHILADELPHIA 8/6/2015 $7,000 2, 3, 4 PHILADELPHIA 10/1/2015 $10,000 2, 3, 4 PHILADELPHIA 10/1/2015 $10,000 2, 4 PHILADELPHIA 10/1/2015 $10,000 3 SOMERSET 8/17/2015 $9,000 1, 2, 3, 4 WESTMORELAND 8/17/2015 $10,000 1, 3 TOTALS $258,000 Loan Use
1- Air sealing/insulation/ducts 2- Energy efficient windows/doors 3- Energy efficient heating/cooling 4- Roofing repairs and/or replacement 5- Miscellaneous
**This table represents applications that were received on or before November 1, 2015 that have been approved and are not yet closed.
Page 16
Appendix A- Summary of Applications and Approved Loans
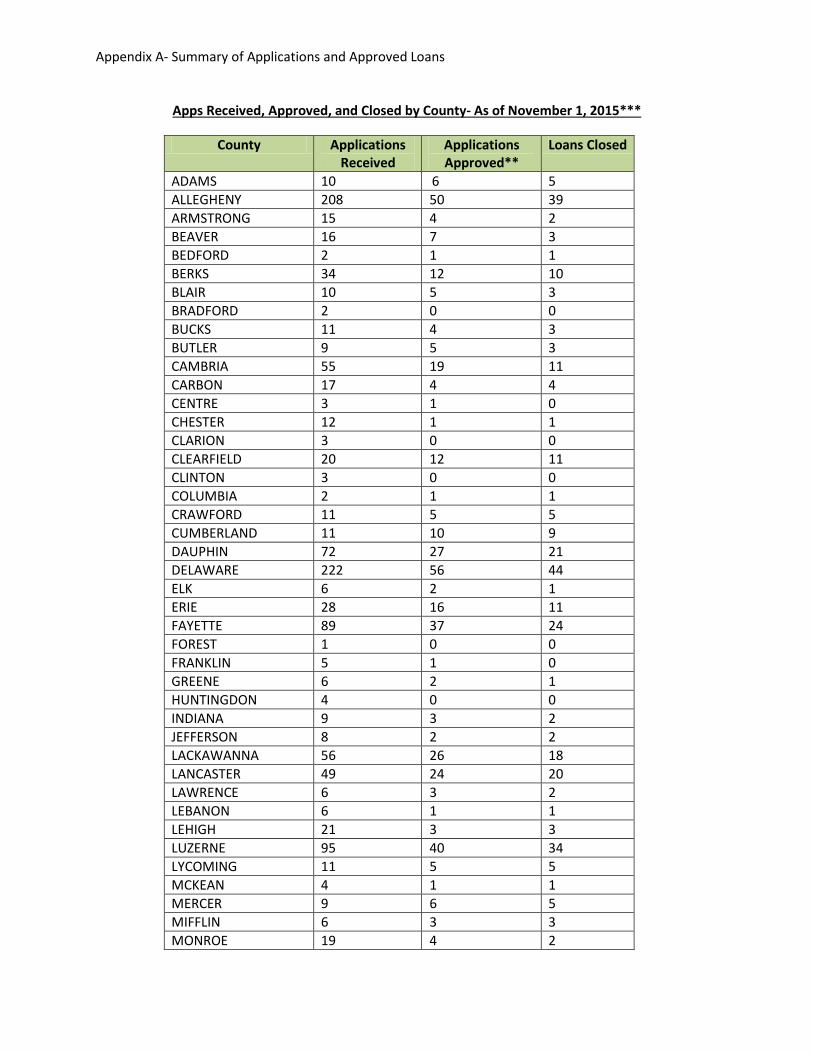
Apps Received, Approved, and Closed by County- As of November 1, 2015***
County Applications Received
Applications Approved**
Loans Closed
ADAMS 10 6 5 ALLEGHENY 208 50 39 ARMSTRONG 15 4 2 BEAVER 16 7 3 BEDFORD 2 1 1 BERKS 34 12 10 BLAIR 10 5 3 BRADFORD 2 0 0 BUCKS 11 4 3 BUTLER 9 5 3 CAMBRIA 55 19 11 CARBON 17 4 4 CENTRE 3 1 0 CHESTER 12 1 1 CLARION 3 0 0 CLEARFIELD 20 12 11 CLINTON 3 0 0 COLUMBIA 2 1 1 CRAWFORD 11 5 5 CUMBERLAND 11 10 9 DAUPHIN 72 27 21 DELAWARE 222 56 44 ELK 6 2 1 ERIE 28 16 11 FAYETTE 89 37 24 FOREST 1 0 0 FRANKLIN 5 1 0 GREENE 6 2 1 HUNTINGDON 4 0 0 INDIANA 9 3 2 JEFFERSON 8 2 2 LACKAWANNA 56 26 18 LANCASTER 49 24 20 LAWRENCE 6 3 2 LEBANON 6 1 1 LEHIGH 21 3 3 LUZERNE 95 40 34 LYCOMING 11 5 5 MCKEAN 4 1 1 MERCER 9 6 5 MIFFLIN 6 3 3 MONROE 19 4 2
Page 17
Appendix A- Summary of Applications and Approved Loans
Apps Received, Approved, and Closed by County- As of November 1, 2015***
County Applications Received
Applications Approved**
Loans Closed
MONTGOMERY 29 4 4 NORTHAMPTON 12 4 3 NORTHUMBERLAND 15 3 3 PERRY 1 1 1 PHILADELPHIA 180 38 30 PIKE 8 0 0 SCHUYLKILL 13 3 2 SNYDER 1 1 1 SOMERSET 7 3 2 SUSQUEHANNA 3 1 1 TIOGA 1 1 0 UNION 2 0 0 WARREN 5 1 0 WASHINGTON 25 8 6 WAYNE 7 3 2 WESTMORELAND 48 24 21 WYOMING 2 0 0 YORK 17 7 7 1562 511 394 ***This table represents applications that were received on or before November 1, 2015. **An approved loan may fail to close as borrower decides to rescind loan approval.
Page 18
Borrower Avg. $
Avg. Msmt./
kwh Avg. $
Avg. Msmt./c
cf Avg. $
Avg. Msmt./
gal. Avg. $
Avg. Msmt./
gal. Avg. $
Avg. Msmt./
ton Avg. $
Avg. Msmt./
ton
Six month Avg. $
Six month
Avg. Msmt./k
wh
Twelve month Avg. $
Twelve month
Avg. Msmt./k
wh
Six month Avg. $
Six month
Avg. Msmt./c
cf
Twelve month Avg. $
Twelve month
Avg. Msmt./
ccf 122 69$ 445 242$ 64 $ 59 571 $ 112 67 162 87$ 711 375$ 100 $ 271 656 $ 82 50 192 71$ 505 88$ 9 $ 74 600 $ 86 10 200 109$ 693 85$ 6 87$ 616 79$ 8 203 199$ 1,819 255$ 1,708 205 44$ 439 700$ 201 39$ 386 210 191$ 1,427 259$ 1 91$ 715 213 66$ 476 78$ 76 66$ 463 83$ 80 218 29$ 278 348$ 100 17$ 316 36$ 30 226 78$ 526 636$ 183 59$ 374 106$ 98 227 56$ 342 97$ 9 56$ 377 93$ 8 228 133$ 1,153 100$ 97 128$ 1,001 126$ 122 229 186$ 1,179 75$ 59 175$ 1,121 76$ 65 230 86$ 666 497$ 133 106$ 763 231 28$ 130 72$ 52 153$ 618 103$ 62 233 486$ 1,889 244$ 1,563 235 52$ 382 218$ 1,782 236 54$ 351 104$ 101 84$ 403 99$ 94 237 56$ 399 47$ 40 80$ 437 48$ 42 238 70$ 802 92$ 91 88$ 944 114$ 98 242 77$ 581 94$ 72 79$ 609 75$ 57 247 112$ 1,384 413$ 120 133$ 1,056 248 67$ 328 99$ 95 49$ 212 89$ 81
Appendix B- TABLE 1: Change In Reported Energy Usage- Borrowers with
Pre and Post Install Data Only
Pre-Install Post-Install
ElectricAdditional Utility-
GasAdditional Utility-
PropaneAdditional Utility-
Fuel OilAdditional Utility-
CoalAdditional Utility-
Pellets Electric ElectricAdditional Utility-
GasAdditional Utility-
Gas
Page 19
Borrower Avg. $
Avg. Msmt./
kwh Avg. $
Avg. Msmt./c
cf Avg. $
Avg. Msmt./
gal. Avg. $
Avg. Msmt./
gal. Avg. $
Avg. Msmt./
ton Avg. $
Avg. Msmt./
ton
Six month Avg. $
Six month
Avg. Msmt./k
wh
Twelve month Avg. $
Twelve month
Avg. Msmt./k
wh
Six month Avg. $
Six month
Avg. Msmt./c
cf
Twelve month Avg. $
Twelve month
Avg. Msmt./
ccf
Appendix B- TABLE 1: Change In Reported Energy Usage- Borrowers with
Pre and Post Install Data Only
Pre-Install Post-Install
ElectricAdditional Utility-
GasAdditional Utility-
PropaneAdditional Utility-
Fuel OilAdditional Utility-
CoalAdditional Utility-
Pellets Electric ElectricAdditional Utility-
GasAdditional Utility-
Gas
249 140$ 1,182 373$ 100 160$ 1,204 250 92$ 662 488$ 133 107$ 745 95$ 96 251 8$ 29 129$ 24 10$ 46 162$ 9 253 158$ 1,376 102$ 9 138$ 1,029 120$ 11 254 130$ 526 98$ 470 32$ 24 255 103$ 876 28$ 17 77$ 569 42$ 31 256 30$ 448 115$ 6 46$ 256 49$ 7 257 111$ 814 210$ 1,464 260 171$ 513 -$ 7 178$ 400 -$ 109 261 47$ 319 79$ 81 46$ 312 66$ 75 262 85$ 893 53$ 3 68$ 677 58$ 4 263 89$ 819 476$ 107 29$ 290 264 111$ 742 66$ 59 111$ 631 165$ 164 267 42$ 257 612$ 169 64$ 417 99$ 90 268 107$ 840 45$ 35 103$ 779 43$ 38 270 69$ 496 71$ 59 75$ 543 72$ 55 271 316$ 2,552 216$ 84 232$ 2,333 272 -$ 721 150$ 13 108$ 603 51$ 4 273 134$ 990 169$ 14 91$ 583 199$ 20 275 117$ 1,414 229 2 122$ 1,289 276 217$ 1,759 521$ 2,912 277 111$ 838 354$ 100 142$ 991 173$ 173 278 95$ 1,473 115$ 123 319$ 1,338 90$ 116
Page 20
Borrower Avg. $
Avg. Msmt./
kwh Avg. $
Avg. Msmt./c
cf Avg. $
Avg. Msmt./
gal. Avg. $
Avg. Msmt./
gal. Avg. $
Avg. Msmt./
ton Avg. $
Avg. Msmt./
ton
Six month Avg. $
Six month
Avg. Msmt./k
wh
Twelve month Avg. $
Twelve month
Avg. Msmt./k
wh
Six month Avg. $
Six month
Avg. Msmt./c
cf
Twelve month Avg. $
Twelve month
Avg. Msmt./
ccf
Appendix B- TABLE 1: Change In Reported Energy Usage- Borrowers with
Pre and Post Install Data Only
Pre-Install Post-Install
ElectricAdditional Utility-
GasAdditional Utility-
PropaneAdditional Utility-
Fuel OilAdditional Utility-
CoalAdditional Utility-
Pellets Electric ElectricAdditional Utility-
GasAdditional Utility-
Gas
279 125$ 955 0 - 153$ 501 -$ - 280 205$ 2,122 195$ 2,345 281 42$ 245 156$ 129 50$ 250 243$ 282 51$ 223 112$ 109 60$ 288 161$ 159 283 70$ 515 65$ 56 69$ 527 75$ 67 285 54$ 332 227$ 99 71$ 432 286 83$ 636 85$ 84 96$ 730 96$ 117 287 84$ 637 729$ 200 114$ 635 290 73$ 432 229$ 140 68$ 415 233$ 161 291 358$ 983 166$ 1,261 292 70$ 415 22$ 15 101$ - 178$ 108
Page 21
Borrower Avg. $
Avg. Msmt./
kwh Avg. $
Avg. Msmt./c
cf Avg. $
Avg. Msmt./
gal. Avg. $
Avg. Msmt./
gal. Avg. $
Avg. Msmt./
ton Avg. $
Avg. Msmt./
ton
Six month Avg. $
Six month
Avg. Msmt./k
wh
Twelve month Avg. $
Twelve month
Avg. Msmt./k
wh
Six month Avg. $
Six month
Avg. Msmt./c
cf
Twelve month Avg. $
Twelve month
Avg. Msmt./
ccf
Appendix B- TABLE 1: Change In Reported Energy Usage- Borrowers with
Pre and Post Install Data Only
Pre-Install Post-Install
ElectricAdditional Utility-
GasAdditional Utility-
PropaneAdditional Utility-
Fuel OilAdditional Utility-
CoalAdditional Utility-
Pellets Electric ElectricAdditional Utility-
GasAdditional Utility-
Gas
294 96$ 494 582$ 5 67$ 500 299 54$ 585 77$ 6 45$ 479 102$ 9 301 47$ 511 75$ 7 70$ 627 35$ 3 302 70$ 529 167$ 63 75$ - 195$ 69 303 51$ 560 126$ 138 57$ 572 151$ 206 305 130$ 927 394$ 100 92$ 55 16$ 9 307 46$ 261 442$ 121 51$ 283 308 51$ 279 397$ 110 67$ 368 309 140$ 759 91$ 9 135$ 694 107$ 11 310 87$ 514 136$ 137 64$ 371 108$ 104 312 73$ 1,230 132$ 8 76$ 430 21$ 1 313 33$ 153 285$ 100 33$ 137 316 176$ 410 -$ 90 63$ 380 73$ 68 317 56$ 265 86$ 79 73$ 347 74$ 65 318 73$ 286 76$ 73 55$ 368 59$ 58 320 666$ 1,721 132$ 137 185$ 1,415 50$ 138 355 50$ 260 37$ 27 51$ 295 47$ - 357 77$ 542 61$ 139 33$ 531 66$
Monthly Average $ 104 801 $ 89 53 $ 256 100 $ 441 123 $ 291 3 $ 244 1 $ 111 678 $ 106 714 $ 108 76 $ 82 56
Page 22
Borrower122162192200203205210213218226227228229230231233235236237238242247248
Six month Avg. $
Six month
Avg. Msmt./
gal.
Twelve month Avg. $
Twelve month
Avg. Msmt./
gal.
Six month Avg. $
Six month
Avg. Msmt./g
al.
Twelve month Avg. $
Twelve month
Avg. Msmt./g
al.
Six month Avg. $
Six month Avg.
Msmt./ ton
Twelve month Avg. $
Twelve month
Avg. Msmt./
ton
Six month Avg. $
Six month Avg.
Msmt./ ton
Twelve month Avg. $
Twelve month
Avg. Msmt./
ton
885$ 246 595$ 310
505$ 150
579$ 196
Additional Utility- Propane
Additional Utility- Propane
Additional Utility- Fuel Oil
Additional Utility- Fuel Oil
Additional Utility- Coal
Additional Utility- Coal
Additional Utility- Pellets
Additional Utility- Pellets
Page 23
Borrower249250251253254255256257260261262263264267268270271272273275276277278
Six month Avg. $
Six month
Avg. Msmt./
gal.
Twelve month Avg. $
Twelve month
Avg. Msmt./
gal.
Six month Avg. $
Six month
Avg. Msmt./g
al.
Twelve month Avg. $
Twelve month
Avg. Msmt./g
al.
Six month Avg. $
Six month Avg.
Msmt./ ton
Twelve month Avg. $
Twelve month
Avg. Msmt./
ton
Six month Avg. $
Six month Avg.
Msmt./ ton
Twelve month Avg. $
Twelve month
Avg. Msmt./
ton
Additional Utility- Propane
Additional Utility- Propane
Additional Utility- Fuel Oil
Additional Utility- Fuel Oil
Additional Utility- Coal
Additional Utility- Coal
Additional Utility- Pellets
Additional Utility- Pellets
461$ 2
252$ 116
309$ 151
-$ -
Page 24
Borrower279280281282283285286287290291292
Six month Avg. $
Six month
Avg. Msmt./
gal.
Twelve month Avg. $
Twelve month
Avg. Msmt./
gal.
Six month Avg. $
Six month
Avg. Msmt./g
al.
Twelve month Avg. $
Twelve month
Avg. Msmt./g
al.
Six month Avg. $
Six month Avg.
Msmt./ ton
Twelve month Avg. $
Twelve month
Avg. Msmt./
ton
Six month Avg. $
Six month Avg.
Msmt./ ton
Twelve month Avg. $
Twelve month
Avg. Msmt./
ton
Additional Utility- Propane
Additional Utility- Propane
Additional Utility- Fuel Oil
Additional Utility- Fuel Oil
Additional Utility- Coal
Additional Utility- Coal
Additional Utility- Pellets
Additional Utility- Pellets
228$ 58
503$ 200
Page 25
Borrower294299301302303305307308309310312313316317318320355357
Monthly Average
Six month Avg. $
Six month
Avg. Msmt./
gal.
Twelve month Avg. $
Twelve month
Avg. Msmt./
gal.
Six month Avg. $
Six month
Avg. Msmt./g
al.
Twelve month Avg. $
Twelve month
Avg. Msmt./g
al.
Six month Avg. $
Six month Avg.
Msmt./ ton
Twelve month Avg. $
Twelve month
Avg. Msmt./
ton
Six month Avg. $
Six month Avg.
Msmt./ ton
Twelve month Avg. $
Twelve month
Avg. Msmt./
ton
Additional Utility- Propane
Additional Utility- Propane
Additional Utility- Fuel Oil
Additional Utility- Fuel Oil
Additional Utility- Coal
Additional Utility- Coal
Additional Utility- Pellets
Additional Utility- Pellets
170$ 2
442$ 175 243$ 100
199$ 100
$ 199 100 $ 358 161 $ 396 158 $ 569 186 170$ 2 461$ 2 -$ - -$ -
Page 26
Borrower Avg. $
Avg. Msmt./k
wh Avg. $
Avg. Msmt./
ccf Avg. $
Avg. Msmt./
gal. Avg. $
Avg. Msmt./
gal. Avg. $
Avg. Msmt./
ton Avg. $
Avg. Msmt./
tonSix month
Avg. $
Six month
Avg. Msmt./
kwh
Twelve month Avg. $
Twelve month
Avg. Msmt./k
wh Six month
Avg. $
Six month
Avg. Msmt./c
cf 121 -$ 524 -$ 74122 69$ 445 242$ 64 59$ 571 162 87$ 711 375$ 100 271$ 656 170 130$ 796 133$ 87 184$ 1,295 192 71$ 505 88$ 9 74$ 600 200 109$ 693 85$ 6 87$ 616 201 53$ 599 74$ 7 65$ 765 203 199$ 1,819 255$ 1,708 205 44$ 439 700$ 201 39$ 386 210 191$ 1,427 259$ 1 91$ 715 213 66$ 476 78$ 76 66$ 463 217 31$ 158 218 29$ 278 348$ 100 17$ 316 219 98$ 1,189 -$ 256 97$ 1,164 220 128$ 639 106$ 98223 54$ 612 74$ 5 65$ 712 92$ 8 225 53$ 4,447 -$ 165226 78$ 526 636$ 183 59$ 374 227 56$ 342 97$ 9 56$ 377 228 133$ 1,153 100$ 97 128$ 1,001
Additional Utility- Pellets
TABLE 2: Change In Reported Energy Usage- All Borrowers (includes non-
compliant borrowers)
Additional Utility- Gas
Pre-Install Post-Install
ElectricAdditional Utility-
GasAdditional Utility-
Fuel Oil Electric ElectricAdditional Utility-
CoalAdditional Utility-
Propane
Page 27
Borrower Avg. $
Avg. Msmt./k
wh Avg. $
Avg. Msmt./
ccf Avg. $
Avg. Msmt./
gal. Avg. $
Avg. Msmt./
gal. Avg. $
Avg. Msmt./
ton Avg. $
Avg. Msmt./
tonSix month
Avg. $
Six month
Avg. Msmt./
kwh
Twelve month Avg. $
Twelve month
Avg. Msmt./k
wh Six month
Avg. $
Six month
Avg. Msmt./c
cf
Additional Utility- Pellets
TABLE 2: Change In Reported Energy Usage- All Borrowers (includes non-
compliant borrowers)
Additional Utility- Gas
Pre-Install Post-Install
ElectricAdditional Utility-
GasAdditional Utility-
Fuel Oil Electric ElectricAdditional Utility-
CoalAdditional Utility-
Propane
229 186$ 1,179 75$ 59 175$ 1,121 230 86$ 666 497$ 133 106$ 763 231 28$ 130 72$ 52 153$ 618 233 486$ 1,889 244$ 1,563 234 142$ 995 133$ 936 235 52$ 382 218$ 1,782 236 54$ 351 104$ 101 84$ 403 237 56$ 399 47$ 40 80$ 437 238 70$ 802 92$ 91 88$ 944 240 147$ 1,335 533$ 150 109$ 788 241 115$ 945 467$ 125242 77$ 581 94$ 72 79$ 609 243 40$ 397 116$ 114245 183$ 1,161 377$ 100247 112$ 1,384 413$ 120 133$ 1,056 248 67$ 328 99$ 95 49$ 212 249 140$ 1,182 373$ 100 160$ 1,204 250 92$ 662 488$ 133 107$ 745 251 8$ 29 129$ 24 10$ 46 253 158$ 1,376 102$ 9 138$ 1,029
Page 28
Borrower Avg. $
Avg. Msmt./k
wh Avg. $
Avg. Msmt./
ccf Avg. $
Avg. Msmt./
gal. Avg. $
Avg. Msmt./
gal. Avg. $
Avg. Msmt./
ton Avg. $
Avg. Msmt./
tonSix month
Avg. $
Six month
Avg. Msmt./
kwh
Twelve month Avg. $
Twelve month
Avg. Msmt./k
wh Six month
Avg. $
Six month
Avg. Msmt./c
cf
Additional Utility- Pellets
TABLE 2: Change In Reported Energy Usage- All Borrowers (includes non-
compliant borrowers)
Additional Utility- Gas
Pre-Install Post-Install
ElectricAdditional Utility-
GasAdditional Utility-
Fuel Oil Electric ElectricAdditional Utility-
CoalAdditional Utility-
Propane
254 130$ 526 98$ 470 255 103$ 876 28$ 17 77$ 569 256 30$ 448 115$ 6 46$ 256 257 111$ 814 210$ 1,464 258 101$ 820 84$ 78260 171$ 513 -$ 7 178$ 400 261 47$ 319 79$ 81 46$ 312 262 85$ 893 53$ 3 68$ 677 263 89$ 819 476$ 107 29$ 290 264 111$ 742 66$ 59 111$ 631 265 91$ 346 101$ 110266 89$ 661 38$ 31 90$ 694 40$ 33 267 42$ 257 612$ 169 64$ 417 268 107$ 840 45$ 35 103$ 779 269 172$ 1,250 60$ 41 100$ 764 125$ 84 270 69$ 496 71$ 59 75$ 543 271 316$ 2,552 216$ 84 232$ 2,333 272 -$ 721 150$ 13 108$ 603 51$ 4 273 134$ 990 169$ 14 91$ 583 199$ 20 275 117$ 1,414 229$ 2 122$ 1,289
Page 29
Borrower Avg. $
Avg. Msmt./k
wh Avg. $
Avg. Msmt./
ccf Avg. $
Avg. Msmt./
gal. Avg. $
Avg. Msmt./
gal. Avg. $
Avg. Msmt./
ton Avg. $
Avg. Msmt./
tonSix month
Avg. $
Six month
Avg. Msmt./
kwh
Twelve month Avg. $
Twelve month
Avg. Msmt./k
wh Six month
Avg. $
Six month
Avg. Msmt./c
cf
Additional Utility- Pellets
TABLE 2: Change In Reported Energy Usage- All Borrowers (includes non-
compliant borrowers)
Additional Utility- Gas
Pre-Install Post-Install
ElectricAdditional Utility-
GasAdditional Utility-
Fuel Oil Electric ElectricAdditional Utility-
CoalAdditional Utility-
Propane
276 217$ 1,759 521$ 2,912 277 111$ 838 354$ 100 142$ 991 173$ 173 278 95$ 1,473 115$ 123 319$ 1,338 90$ 116 279 125$ 955 153$ 501 -$ - 280 205$ 2,122 195$ 2,345 281 42$ 245 156$ 129 50$ 250 243$ - 282 51$ 223 112$ 109 60$ 288 161$ 159 283 70$ 515 65$ 56 69$ 527 284 117$ 911 285 54$ 332 227$ 99 71$ 432 286 83$ 636 85$ 84 96$ 730 96$ 117 287 84$ 637 729$ 200 114$ 635 288 184$ 540 525$ 133289 83$ 479 74$ 41290 73$ 432 229$ 140 68$ 415 233$ 161 291 358$ 983 166$ 1,261 292 70$ 415 22$ 15 101$ - 178$ 108 293 194$ 683 -$ 245294 96$ 494 582$ 5 67$ 500 295 68$ 498 183$ 17
Page 30
Borrower Avg. $
Avg. Msmt./k
wh Avg. $
Avg. Msmt./
ccf Avg. $
Avg. Msmt./
gal. Avg. $
Avg. Msmt./
gal. Avg. $
Avg. Msmt./
ton Avg. $
Avg. Msmt./
tonSix month
Avg. $
Six month
Avg. Msmt./
kwh
Twelve month Avg. $
Twelve month
Avg. Msmt./k
wh Six month
Avg. $
Six month
Avg. Msmt./c
cf
Additional Utility- Pellets
TABLE 2: Change In Reported Energy Usage- All Borrowers (includes non-
compliant borrowers)
Additional Utility- Gas
Pre-Install Post-Install
ElectricAdditional Utility-
GasAdditional Utility-
Fuel Oil Electric ElectricAdditional Utility-
CoalAdditional Utility-
Propane
296 13$ 101 -$ 0297 109$ 778 298 94$ 1,122 112$ 13299 54$ 585 77$ 6 45$ 479 102$ 9 300 42$ 233 38$ 12301 47$ 511 75$ 7 70$ 627 35$ 3 302 70$ 529 167$ 63 75$ - 195$ 69 303 51$ 560 126$ 138 57$ 572 151$ 206 304 47$ 492 65$ 6305 130$ 927 394$ 100 92$ 55 16$ 9 306 157$ 1,663 307 46$ 261 442$ 121 51$ 283 308 51$ 279 397$ 110 67$ 368 309 140$ 759 91$ 9 135$ 694 107$ 11 310 87$ 514 136$ 137 64$ 371 108$ 104 311 61$ 575 33$ 8312 73$ 1,230 132$ 8 76$ 430 21$ 1 313 33$ 153 285$ 100 33$ 137 314 130$ 1,018 83$ 61315 209$ 2,344 1,013$ 281
Page 31
Borrower Avg. $
Avg. Msmt./k
wh Avg. $
Avg. Msmt./
ccf Avg. $
Avg. Msmt./
gal. Avg. $
Avg. Msmt./
gal. Avg. $
Avg. Msmt./
ton Avg. $
Avg. Msmt./
tonSix month
Avg. $
Six month
Avg. Msmt./
kwh
Twelve month Avg. $
Twelve month
Avg. Msmt./k
wh Six month
Avg. $
Six month
Avg. Msmt./c
cf
Additional Utility- Pellets
TABLE 2: Change In Reported Energy Usage- All Borrowers (includes non-
compliant borrowers)
Additional Utility- Gas
Pre-Install Post-Install
ElectricAdditional Utility-
GasAdditional Utility-
Fuel Oil Electric ElectricAdditional Utility-
CoalAdditional Utility-
Propane
316 176$ 410 -$ 90 63$ 380 73$ 68 317 56$ 265 86$ 79 73$ 347 74$ 65 318 73$ 286 76$ 73 55$ 368 59$ 58 319 84$ 619 131$ 121320 666$ 1,721 132$ 137 185$ 1,415 50$ 138 321 117$ 908 161$ 123322 248$ 1,437 374$ 100323 162$ 1,225 324 120$ 929 101$ 100325 284$ 982 90$ 9326 58$ 420 175$ 327 134$ 1,043 328 26$ 339 230$ 245329 109$ 760 235$ 23330 242$ 1,946 331 84$ 904 87$ 72332 80$ 302 105$ 104333 53$ 331 93$ 93334 59$ 721 -$ 73335 90$ 608 191$ 20
Page 32
Borrower Avg. $
Avg. Msmt./k
wh Avg. $
Avg. Msmt./
ccf Avg. $
Avg. Msmt./
gal. Avg. $
Avg. Msmt./
gal. Avg. $
Avg. Msmt./
ton Avg. $
Avg. Msmt./
tonSix month
Avg. $
Six month
Avg. Msmt./
kwh
Twelve month Avg. $
Twelve month
Avg. Msmt./k
wh Six month
Avg. $
Six month
Avg. Msmt./c
cf
Additional Utility- Pellets
TABLE 2: Change In Reported Energy Usage- All Borrowers (includes non-
compliant borrowers)
Additional Utility- Gas
Pre-Install Post-Install
ElectricAdditional Utility-
GasAdditional Utility-
Fuel Oil Electric ElectricAdditional Utility-
CoalAdditional Utility-
Propane
336 98$ 608 170$ 84337 80$ 848 357$ 97338 139$ 826 110$ 104339 51$ 432 121$ 92340 164$ 1,186 478$ 149341 320$ 2,710 342343 98$ 804 344 183$ 808 345 182$ 1,487 103$ 121346 212$ 1,542 437$ 169347 121$ 836 348 204$ 1,655 309$ 100349 240$ 1,081 124$ 129350 1,431$ 2,825 351 66$ 1,022 122$ 108352 143$ 780 93$ 86353 61$ 362 53$ 49354 145$ 626 355 50$ 260 37$ 27 51$ 295
Page 33
Borrower Avg. $
Avg. Msmt./k
wh Avg. $
Avg. Msmt./
ccf Avg. $
Avg. Msmt./
gal. Avg. $
Avg. Msmt./
gal. Avg. $
Avg. Msmt./
ton Avg. $
Avg. Msmt./
tonSix month
Avg. $
Six month
Avg. Msmt./
kwh
Twelve month Avg. $
Twelve month
Avg. Msmt./k
wh Six month
Avg. $
Six month
Avg. Msmt./c
cf
Additional Utility- Pellets
TABLE 2: Change In Reported Energy Usage- All Borrowers (includes non-
compliant borrowers)
Additional Utility- Gas
Pre-Install Post-Install
ElectricAdditional Utility-
GasAdditional Utility-
Fuel Oil Electric ElectricAdditional Utility-
CoalAdditional Utility-
Propane
356 122$ 420 136$ 93357 77$ 542 61$ 139 33$ 531 66$ - 358 45$ 365 157$ 107359 71$ 448 79$ 7360 144$ 1,165 361 82$ 607 98$ 10362 42$ 257 41$ 5363 95$ 596 127$ 85364 68$ 720 79$ 8365 204$ 1,134 515$ 151366 61$ 479 367 176$ 1,488 368 112$ 987 40$ 6369 34$ 306 218$ 223370 69$ 559 1,336$ 424371 253$ 2,180 582$ 233372 118$ 812 373 106$ 840 639$ 266374 60$ 639 83$ 55375 -$ 508 309$ 114
Page 34
Borrower Avg. $
Avg. Msmt./k
wh Avg. $
Avg. Msmt./
ccf Avg. $
Avg. Msmt./
gal. Avg. $
Avg. Msmt./
gal. Avg. $
Avg. Msmt./
ton Avg. $
Avg. Msmt./
tonSix month
Avg. $
Six month
Avg. Msmt./
kwh
Twelve month Avg. $
Twelve month
Avg. Msmt./k
wh Six month
Avg. $
Six month
Avg. Msmt./c
cf
Additional Utility- Pellets
TABLE 2: Change In Reported Energy Usage- All Borrowers (includes non-
compliant borrowers)
Additional Utility- Gas
Pre-Install Post-Install
ElectricAdditional Utility-
GasAdditional Utility-
Fuel Oil Electric ElectricAdditional Utility-
CoalAdditional Utility-
Propane
376 152$ 151 49$ 354377 -$ - 110$ 88378 138$ 976 379 83$ 561 963$ 338380 60$ 340 161$ 131
Average* $ 119 821 $ 107 74 $ 290 99 $ 491 153 $582 5 $ 244 1 $ 107 678 $ 107 738 $ 105 66
* Again, average includes borrowers who reported or are not yet due to report energy use information.
Page 35
Borrower121122162170192200201203205210213217218219220223225226227228
Twelve month Avg. $
Twelve month
Avg. Msmt./
ccf
Six month Avg. $
Six month Avg.
Msmt./gal
Twelve month Avg. $
Twelve month
Avg. Msmt./g
al Six month
Avg. $
Six month
Avg. Msmt./g
al.
Twelve month Avg. $
Twelve month
Avg. Msmt./g
al. Six month
Avg. $
Six month Avg.
Msmt./ ton
Twelve month Avg. $
Twelve month
Avg. Msmt./
ton
Six month Avg. $
Six month
Avg. Msmt./
ton
Twelve month Avg. $
Twelvemonth
Avg. Msmt./
ton
112$ 67 82$ 50
277$ 161 86$ 10 79$ 8
100$ 8
885$ 246 595$ 310
83$ 80
36$ 30
106$ 98 93$ 8
126$ 122
Additional Utility- Coal
Additional Utility- Coal
Additional Utility- Pellets
Additional Utility- Pellets
Additional Utility- Gas
Additional Utility- Fuel Oil
Additional Utility- Fuel Oil
Additional Utility- Propane
Additional Utility- Propane
Page 36
Borrower229230231233234235236237238240241242243245247248249250251253
Twelve month Avg. $
Twelve month
Avg. Msmt./
ccf
Six month Avg. $
Six month Avg.
Msmt./gal
Twelve month Avg. $
Twelve month
Avg. Msmt./g
al Six month
Avg. $
Six month
Avg. Msmt./g
al.
Twelve month Avg. $
Twelve month
Avg. Msmt./g
al. Six month
Avg. $
Six month Avg.
Msmt./ ton
Twelve month Avg. $
Twelve month
Avg. Msmt./
ton
Six month Avg. $
Six month
Avg. Msmt./
ton
Twelve month Avg. $
Twelvemonth
Avg. Msmt./
ton
Additional Utility- Coal
Additional Utility- Coal
Additional Utility- Pellets
Additional Utility- Pellets
Additional Utility- Gas
Additional Utility- Fuel Oil
Additional Utility- Fuel Oil
Additional Utility- Propane
Additional Utility- Propane
76$ 65 505$ 150
103$ 62
99$ 94 48$ 42
114$ 98
75$ 57
579$ 196 89$ 81
461$ 295$ 96
162$ 9 120$ 11
Page 37
Borrower254255256257258260261262263264265266267268269270271272273275
Twelve month Avg. $
Twelve month
Avg. Msmt./
ccf
Six month Avg. $
Six month Avg.
Msmt./gal
Twelve month Avg. $
Twelve month
Avg. Msmt./g
al Six month
Avg. $
Six month
Avg. Msmt./g
al.
Twelve month Avg. $
Twelve month
Avg. Msmt./g
al. Six month
Avg. $
Six month Avg.
Msmt./ ton
Twelve month Avg. $
Twelve month
Avg. Msmt./
ton
Six month Avg. $
Six month
Avg. Msmt./
ton
Twelve month Avg. $
Twelvemonth
Avg. Msmt./
ton
Additional Utility- Coal
Additional Utility- Coal
Additional Utility- Pellets
Additional Utility- Pellets
Additional Utility- Gas
Additional Utility- Fuel Oil
Additional Utility- Fuel Oil
Additional Utility- Propane
Additional Utility- Propane
32$ 24 42$ 31 49$ 7
-$ 109 66$ 75 58$ 4
252$ 116 165$ 164
99$ 90 43$ 38
72$ 55 309$ 151
-$ 0
Page 38
Borrower276277278279280281282283284285286287288289290291292293294295
Twelve month Avg. $
Twelve month
Avg. Msmt./
ccf
Six month Avg. $
Six month Avg.
Msmt./gal
Twelve month Avg. $
Twelve month
Avg. Msmt./g
al Six month
Avg. $
Six month
Avg. Msmt./g
al.
Twelve month Avg. $
Twelve month
Avg. Msmt./g
al. Six month
Avg. $
Six month Avg.
Msmt./ ton
Twelve month Avg. $
Twelve month
Avg. Msmt./
ton
Six month Avg. $
Six month
Avg. Msmt./
ton
Twelve month Avg. $
Twelvemonth
Avg. Msmt./
ton
Additional Utility- Coal
Additional Utility- Coal
Additional Utility- Pellets
Additional Utility- Pellets
Additional Utility- Gas
Additional Utility- Fuel Oil
Additional Utility- Fuel Oil
Additional Utility- Propane
Additional Utility- Propane
75$ 67
228$ 58
503$ 200
170$ 2
Page 39
Borrower296297298299300301302303304305306307308309310311312313314315
Twelve month Avg. $
Twelve month
Avg. Msmt./
ccf
Six month Avg. $
Six month Avg.
Msmt./gal
Twelve month Avg. $
Twelve month
Avg. Msmt./g
al Six month
Avg. $
Six month
Avg. Msmt./g
al.
Twelve month Avg. $
Twelve month
Avg. Msmt./g
al. Six month
Avg. $
Six month Avg.
Msmt./ ton
Twelve month Avg. $
Twelve month
Avg. Msmt./
ton
Six month Avg. $
Six month
Avg. Msmt./
ton
Twelve month Avg. $
Twelvemonth
Avg. Msmt./
ton
Additional Utility- Coal
Additional Utility- Coal
Additional Utility- Pellets
Additional Utility- Pellets
Additional Utility- Gas
Additional Utility- Fuel Oil
Additional Utility- Fuel Oil
Additional Utility- Propane
Additional Utility- Propane
442$ 175 243$ 100
199$ 100
Page 40
Borrower316317318319320321322323324325326327328329330331332333334335
Twelve month Avg. $
Twelve month
Avg. Msmt./
ccf
Six month Avg. $
Six month Avg.
Msmt./gal
Twelve month Avg. $
Twelve month
Avg. Msmt./g
al Six month
Avg. $
Six month
Avg. Msmt./g
al.
Twelve month Avg. $
Twelve month
Avg. Msmt./g
al. Six month
Avg. $
Six month Avg.
Msmt./ ton
Twelve month Avg. $
Twelve month
Avg. Msmt./
ton
Six month Avg. $
Six month
Avg. Msmt./
ton
Twelve month Avg. $
Twelvemonth
Avg. Msmt./
ton
Additional Utility- Coal
Additional Utility- Coal
Additional Utility- Pellets
Additional Utility- Pellets
Additional Utility- Gas
Additional Utility- Fuel Oil
Additional Utility- Fuel Oil
Additional Utility- Propane
Additional Utility- Propane
Page 41
Borrower336337338339340341342343344345346347348349350351352353354355
Twelve month Avg. $
Twelve month
Avg. Msmt./
ccf
Six month Avg. $
Six month Avg.
Msmt./gal
Twelve month Avg. $
Twelve month
Avg. Msmt./g
al Six month
Avg. $
Six month
Avg. Msmt./g
al.
Twelve month Avg. $
Twelve month
Avg. Msmt./g
al. Six month
Avg. $
Six month Avg.
Msmt./ ton
Twelve month Avg. $
Twelve month
Avg. Msmt./
ton
Six month Avg. $
Six month
Avg. Msmt./
ton
Twelve month Avg. $
Twelvemonth
Avg. Msmt./
ton
Additional Utility- Coal
Additional Utility- Coal
Additional Utility- Pellets
Additional Utility- Pellets
Additional Utility- Gas
Additional Utility- Fuel Oil
Additional Utility- Fuel Oil
Additional Utility- Propane
Additional Utility- Propane
47$ -
Page 42
Borrower356357358359360361362363364365366367368369370371372373374375
Twelve month Avg. $
Twelve month
Avg. Msmt./
ccf
Six month Avg. $
Six month Avg.
Msmt./gal
Twelve month Avg. $
Twelve month
Avg. Msmt./g
al Six month
Avg. $
Six month
Avg. Msmt./g
al.
Twelve month Avg. $
Twelve month
Avg. Msmt./g
al. Six month
Avg. $
Six month Avg.
Msmt./ ton
Twelve month Avg. $
Twelve month
Avg. Msmt./
ton
Six month Avg. $
Six month
Avg. Msmt./
ton
Twelve month Avg. $
Twelvemonth
Avg. Msmt./
ton
Additional Utility- Coal
Additional Utility- Coal
Additional Utility- Pellets
Additional Utility- Pellets
Additional Utility- Gas
Additional Utility- Fuel Oil
Additional Utility- Fuel Oil
Additional Utility- Propane
Additional Utility- Propane
Page 43
Borrower376377378379380
Average*
*
Twelve month Avg. $
Twelve month
Avg. Msmt./
ccf
Six month Avg. $
Six month Avg.
Msmt./gal
Twelve month Avg. $
Twelve month
Avg. Msmt./g
al Six month
Avg. $
Six month
Avg. Msmt./g
al.
Twelve month Avg. $
Twelve month
Avg. Msmt./g
al. Six month
Avg. $
Six month Avg.
Msmt./ ton
Twelve month Avg. $
Twelve month
Avg. Msmt./
ton
Six month Avg. $
Six month
Avg. Msmt./
ton
Twelve month Avg. $
Twelvemonth
Avg. Msmt./
ton
Additional Utility- Coal
Additional Utility- Coal
Additional Utility- Pellets
Additional Utility- Pellets
Additional Utility- Gas
Additional Utility- Fuel Oil
Additional Utility- Fuel Oil
Additional Utility- Propane
Additional Utility- Propane
$ 88 58 $ 199 100 $ 358 161 $ 396 158 $ 569 186 170$ 2 461$ 2 $ - - $ - -
Again, average includes borrowers who reported or are not yet due to report energy use information.