WORKING PAPER SERIES No. 5/2011 Homework assignment and student achievement in OECD countries_ Torberg Falch Department of Economics, Norwegian University of Science and Technology (NTNU), and CESifo and Marte Rønning Statistics Norway, Research Department, Postboks 8131 Dep., N-0033 Oslo Department of Economics N-7491 Trondheim, Norway www.svt.ntnu.no/iso/wp/wp.htm ISSN 1503-299X
Transcript
WORKING PAPER SERIES
No. 5/2011
Homework assignment and student achievement in OECD countries_
Torberg Falch Department of Economics, Norwegian University of Science
and Technology (NTNU), and CESifo
and
Marte Rønning Statistics Norway, Research Department, Postboks 8131 Dep., N-0033 Oslo
By using data from 16 OECD countries who participated in TIMSS 2007, this
paper analyzes the e�ect of assigning homework on student achievement. The identi-
�cation rests on within-student variation in homework across subjects in a sample of
students who have the same teacher in both mathematics and science. Unobserved
teacher and student characteristics are conditioned out of the model by applying
a di�erence-in-di�erence approach. We �nd a modest, but statistically signi�cant
e�ect of homework.
∗We thank seminar participants in Oslo and Trondheim for generous comments.†Department of Economics. Norwegian University of Science and Technology, N-7491 Trondheim,
Homework is the main intersection between home and school. It is a widespread belief
among school leaders, teachers and parents that homework is a valuable educational
tool. Assigning homework can be seen as an instrument to rise student e�ort. The UK
government white paper �Excellence in schools� from 1997 advocates the use of homework,
and national standards were developed afterwards. O�cial papers in relation to the US
�No child left behind� reform support the recommendations from the National Parent
Teacher Association that the amount of homework increases yearly by 10 minutes per
night in K-12 education.
The literature on education production functions focuses on inputs such as �nancial
resources and teacher quality. As Betts (1996) points out, this approach has the drawback
of treating students simply as intermediate inputs to whom value is `added'. However,
homework can also be used in order to compensate for low progress, either for the whole
class or for a subsample of the students.
Cooper et al. (2006) summarize the US education literature on homework in primary
and secondary education, and conclude that homework is positively related to academic
achievement, with larger e�ects at the secondary level than at the primary level. They also
conclude that none of the studies reviewed had a well-designed approach. The empirical
evidence on the causal e�ect of homework on student achievement is mainly concentrated
to students enrolled in universities in the US (Grove and Wasserman, 2006; Emerson and
Mencken, 2010; Grodner and Rupp, 2011).
Assigning homework is a teacher policy. Any study of teacher policies that does not
rely on policy interventions might have endogeneity biases. The main challenge is that
observed teacher policy is likely to be correlated with unobserved characteristics and the
behavior of teachers and students. The present paper attempts to reduce this problem
by using an estimation strategy that condition on all teacher and student characteristics
that have the same e�ect on two related subjects; mathematics and science. Moreover,
this is also one of the �rst papers that addresses the causal e�ect of homework on the
2
achievement of primary school children.1
We use data from the Trends in International Mathematics and Science Study (TIMSS)
in 2007 for 9 years old students from 16 OECD countries. We exploit that students have
the same teacher in mathematics and science, but are assigned di�erent amount of home-
work in these two subjects. The estimating strategy relies on random relative homework
assignment in mathematics and science at the teacher level, given teacher and student
characteristics. We investigate the robustness of this assumption in several ways.
It is commonly recognized that homework can have negative e�ects (Cooper et al.,
2006). For example, it can have a negative in�uence on attitudes toward school. We
will estimate average e�ects, masking negative and positive elements. We also investigate
whether the e�ect of homework is heterogeneous. It is well documented in the literature
that better educated parents spend more time helping their children with homework than
less educated parents (Guryan et al., 2008; Rønning, 2011). If homework is a substitute
for in-school learning, it is particularly likely that the home environment in�uences the
return to homework. To the extent that the home environment is important for whether
the homework is completed and perceived or not, children of better educated parents may
bene�t more from homework than children of less educated parents.
The next section reviews the literature. Section 3 describes the data, Section 4 dis-
cusses the empirical approach, while the results are presented in Section 5. Section 6
concludes.
2 Existing literature
Cooper (1989) reviews nearly 120 US educational studies of the e�ect of homework on
student achievement. Studies comparing the achievement of students given homework
with the achievement of students without homework tend to �nd no association in primary
education and a positive association in high school. In a follow-up paper, Cooper et al.
1Only McMullen and Busscher (2009) look at children in primary school. However, our study di�erfrom their study in the sense that they only condition on student �xed e�ects and ignore that assigninghomework is a teacher policy.
3
(2006) review US studies from the period 1987-2003. Some studies have investigated the
e�ect of exogenous introduction of homework, but Cooper et al. argue that all these
studies su�er from non-random assignments. Most of the cross-sectional analyses rely
on student reported time on homework, which is vulnerably to a spurious relationship
with achievement. The reported time may be related to unobserved variation in student
ability and motivation. In addition, the cross-sectional analyses may be biased due to
unobserved characteristics of students and teachers.
The review of the literature by Trautwein and Köller (2003) argues that there is an
important distinction between homework assignment by teachers and student e�ort/time
used on homework. One of few papers using non-US data is Trautwein (2007), who �nd
for Germany that homework frequency is more important than the time students use
on mathematics homework in a cross-section framework. Using data from TIMSS 2003,
Baker et al. (2005) �nd that teachers in countries with low average student achievement
assign more homework than teachers in countries with high achievement, see also Dettmers
et al. (2009). Baker et al. (2005) are especially concerned that teachers in the US to
a larger degree than teachers in other countries seem to correct the homework and give
feedback. Dettmers et al. (2009) use another international comparable achievement test,
and �nd in most countries a positive association between achievement in mathematics
and average homework time at the class level as reported by the students.
The small literature in economics which addresses the causal e�ect of homework is
mainly concentrated to students at the university level. Grodner and Rupp (2010) present
evidence from a �eld experiment in which a treatment group of students was required to do
homework. They �nd that the treatment group got signi�cantly better learning outcomes.
The novelty of Grodner and Rupp's paper is that they are able to separate between the
e�ect of being assigned homework and the e�ect of completing homework. By exploiting
natural experiments which randomly divided students into di�erent study groups, both
Grove and Wasserman (2006) and Emerson and Mencken (2010) �nd that students in
groups with graded homework increased their achievement.
4
At lower levels, problems related to endogeneity have been addressed by either es-
timating value-added models or models with student �xed e�ects. In an unpublished
paper, Betts (1996) extends the traditional value-added education production function
with hours of homework as reported by teachers using representative US data for students
in seventh to eleventh grade. He �nds a sizable positive e�ect of homework. Some studies
use data from the US survey National Educational Longitudinal Study of 1988 (NELS)
which included 8 graders in the base year, with follow-ups in 1990 and 1992. Eren and
Henderson (2008) use data for the tenth grade level in a value-added model. They �nd
that homework assigned by teachers is most e�ective for high and low achievers.
As Todd and Wolpin (2003) point out, there is a severe potential endogeneity problem
in value-added models. Alternative approaches include models with student �xed e�ects
or credible instruments for homework. Aksoy and Link (2000) use a student �xed e�ects
approach on the NELS data, and �nd strong e�ects of the time the students report doing
homework. McMullen (2010) employ IV estimations using NELS data within a model
with student �xed e�ects. As instruments for student reported homework time he uses
the amount of homework assigned by the student's teacher and the student's �locus of
control�. The latter variable is a composite of answers on statements like �good luck
is more important than hard work for success in life�. One may wonder whether such
opinions also in�uence how hard the student work in-school. McMullen �nds that the IV
estimate is almost 20 times larger than the �xed e�ects estimate.
McMullen and Busscher (2009) study younger students, and is thus more comparable
to our study. They use data for students in �rst to �fth grade from the US survey
Early Childhood Longitudinal Study and �nd no relationship between homework and
achievement in pooled regressions. However, in models with student �xed e�ects, both
the time teachers expect their students to spend on homework and the number of times
per week the parents report their children worked on homework have positive e�ects on
mathematics and reading achievement.
In a recent paper, Eren and Henderson (2011) exploit that eight grade students in
5
NELS are tested in two di�erent subjects. They argue that it is possible to include both
student �xed e�ects and teacher �xed e�ects in the model. It turns out that the e�ect of
assigned homework, given student �xed e�ects, is extremely sensitive to the inclusion of
teacher �xed e�ects. The results are driven by a large homework e�ect in mathematics.
There are some attempts to estimate heterogeneous e�ects of homework in the litera-
ture. Both Rønning (2011) and Eren and Henderson (2011) �nd that only students from
higher educated parents bene�t from homework. Rønning (2011) also shows that higher
educated parents help more with homework than lower educated parents, and suggests
that assigning homework can amplify existing inequalities through complementarities with
home inputs.
Assigning homework can be interpreted as an attempt to increase student e�ort. The
few explicit analyses of student e�ort that exist is therefore relevant for the interpretation
of the �ndings in the homework literature, see for example Krohn and O'Connor (2005).
However, the results in this literature for K-12 education is mixed, and su�er from the
same methodological problems as the homework literature. The few studies that exists
with an experimental framework with random assignment seems to be on college students.
Stinebrickner and Stinebrickner (2008) exploit that assignment of roommates at Berea
College is random, and use whether the roommate has a videogame as an instrument for
study e�ort. They �nd that the return to e�ort is large.
Since assigning homework is a teacher policy, this paper is also related to the literature
on e�ective teaching practices. Using NELS, Goldhaber and Brewer (1997) �nd several
variables describing teacher behavior in the classroom to in�uence student achievement.
Machin and McNally (2008) study a highly structured literacy hour that was introduced
in English primary schools in the 1990s, and �nd that the change in teaching method
signi�cantly increased literacy skills. Schwerdt and Wuppermann (2009) exploit between-
subject variation in lecturing style at eighth grade. They �nd that traditional lecture type
teaching yields higher student achievement than in-class teaching time used for problem
solving.
6
We are not aware of any other paper that use the same identi�cation strategy as in the
present paper. Several papers include student �xed e�ects, but the endogenous respond
in teacher behavior is addressed to a smaller extend. When we rely on data where the
student has the same teacher in two subjects, we can di�erence out of the model not only
unobserved factors of students and teachers that has a common e�ect in the two subjects,
but also every interaction between the student, the teachers, and the peer group.
3 Data
This paper uses data from the TIMSS (Trends in International Mathematics and Science
Study) 2007 database. TIMSS is an international survey conducted by the International
Association for the Evaluation of Educational Achievement (IEA). TIMSS samples stu-
dents enrolled in the two adjacent grades that contain the largest proportion of 9 year
olds (3rd/4th graders in most countries) and students enrolled in the two adjacent grades
that contain the largest proportion of 13 year olds (7th/8th graders in most countries).
The database contains information on student achievement in mathematics and science,
as well as background information on the students, teachers, and schools. The student's
parents did not participate in the TIMSS survey.
Due to lack of variation in homework for 7th/8th graders we focus on 3rd/4th graders.
We also restrict the sample to OECD countries. These are Australia, Austria, Czech Re-
public, Denmark, England, Germany, Hungary, Italy, Japan, Netherlands, New Zealand,
Norway, Scotland, Slovak, Sweden, and USA (in total 16 countries).
In the empirical analysis we drop students with missing information on homework
(approximately 30 percent of the sample). As we exploit that a majority of the students
in the sample have the same teacher in both mathematics and science, we also drop
students who have di�erent teachers in these two subjects and students who are being
taught by more than one teacher per subject (additional four percent of the students).2
2The number of students excluded from the analysis by this procedure varies somewhat across coun-tries. The highest number of students dropped are for the Unites States (55 percent), while no studentsare dropped in Italy.
7
Homework
All teachers who participated in TIMSS were asked how often they give homework. By
merging the teacher data to the student data, we can identify the students who are
assigned homework. Summary statistics are provided in Table 1.
In all countries, almost all students get at least some homework in mathematics. The
only exception is the Netherlands where a majority of the students (63.6 percent) never
get homework, and those who get homework only get it in some lessons. At the other
extreme, in Germany and Hungary more than 90 percent of the students get homework
in math in every or almost every lesson. In Australia, New Zealand, Sweden, England
and Scotland, assigning homework in some lessons seem to be most common.
There is less cross country-variation in homework in science. Apart from Hungary
and Italy, a majority of the students either get homework in some lessons or no lessons.
Student achievement
TIMSS 2007 summarizes student achievement by using Item Response Theory (IRT). The
IRT scaling approach makes use of �plausible value� or multiple imputation methodology
to obtain pro�ciency scores in mathematics and science for all the students who partic-
ipated in the survey. According to the TIMSS 2007 user guide, plausible values are the
best available measures of student achievement, and should be used to measure outcomes
in studies of student achievement. The plausible values are predictions based on limited
information, and are contaminated by some errors. In order to incorporate these errors,
the TIMSS database provides �ve separate plausible values. The correlation between the
plausible values range between 0.85 and 0.88. In this paper we use the average of all the
plausible values as our measure of student achievement. Regressing homework on each of
the �ve plausible values separately, and then calculating the average of these coe�cients
(with bootstrapped standard errors) give similar results.
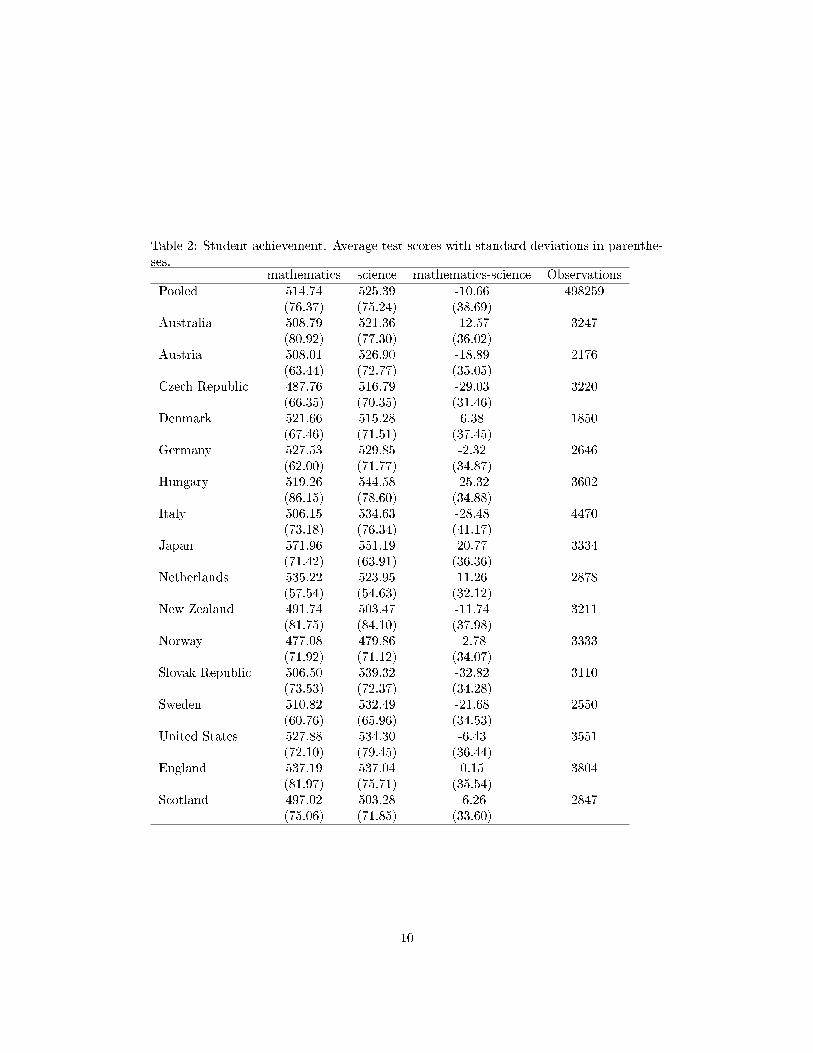
A descriptive overview of the test scores, separately for country and subject, is given
in Table 2. The test scores in TIMSS have an international mean of 500 and a stan-
8
Table 1: Fraction of students who get homework in mathematics and science.
Country Every or almost About half Some lessons Homework notevery lesson the lessons given
Note: In addition to reported variables, all model speci�cations include subject times countryspeci�c e�ects and dummy variables for missing information on control variables. Standarderrors are heteroskedasticity robust and clustered at the teacher level . */**/*** denotesstatistically signi�cance at the 10/5/1 percent level.
17
e�ects is the indicator for test-language spoken only sometimes or never at home. Being
a language minority is more detrimental for achievement in science than in mathematics.
As already discussed, the decision to assign homework may be correlated with unob-
served variables which also a�ect student achievement. In order to come closer to the
causal e�ect of homework more elaborated identi�cation strategies must be applied.
5.2 Di�erence-in-di�erence approach
In this paper the identi�cation strategy is to eliminate the unobserved student and teacher
characteristics by applying the di�erence-in-di�erence method as described in Equation
(2). To the extent that these characteristics have the same e�ects on mathematics and
science, they are di�erenced out of the model.
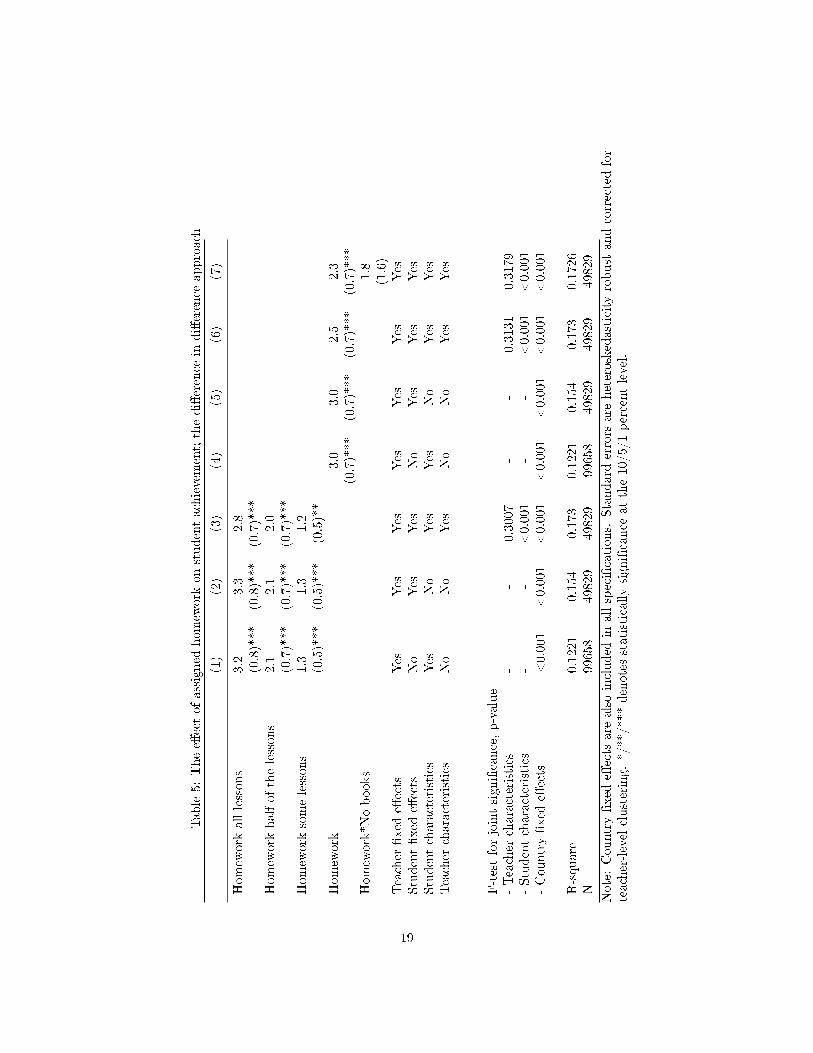
Table 5 starts out by only including teacher �xed e�ects (column (1)). In addition
to dummy variables for homework and country speci�c e�ects, this model also includes
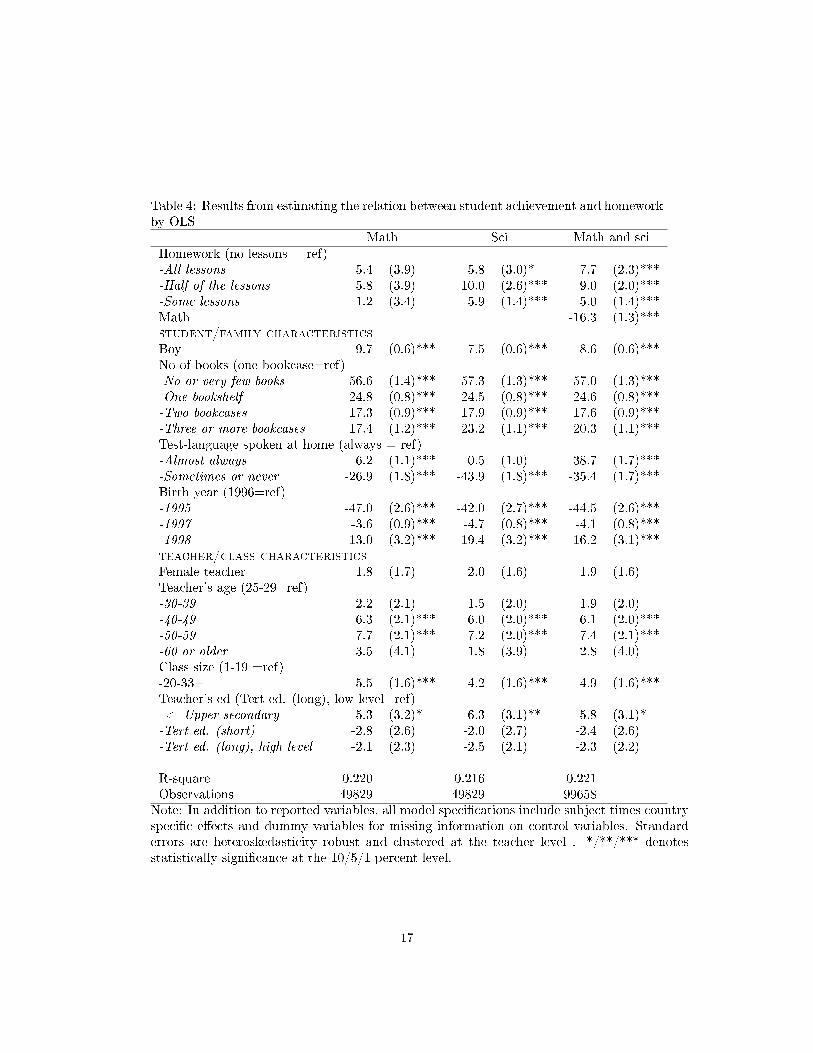
student characteristics. The results show that assigning more homework in mathematics
than in science increases the achievement in mathematics relative to science. Homework
in all lessons increases student test scores by 3.2, that is 4.4 percent of a standard de-
viations. This e�ect is larger in relative terms since the standard deviation in student
achievement in mathematics relative to science is only about 39. Thus, assigning home-
work in all lessons in mathematics and no lessons in science increases the relative score
in mathematics by 8.2 percent of a standard deviation of the di�erence in test score.
The e�ect of assigning homework in half of the lessons and in some lessons are smaller
as expected, but statistically signi�cant at 1 percent level. If the e�ect of homework is
linear, we would expect to �nd that the e�ect of homework in half of the lessons was 50
percent of the e�ect of homework in all lessons. Our results indicate that the di�erence is
65 percent, but not signi�cantly larger than 50 percent. Thus, the relative e�ects of the
dummy variables for homework seem reasonable, in contrast to the OLS results in Table
4. The e�ects estimated are smaller than the OLS results, which indicates than the OLS
results are biased upwards by omitted characteristics of the teachers.
The model in column (2) also includes student �xed e�ects. This is the model in
Equation (2) above. The results are almost identical to the model with only teacher
�xed e�ects in column (1), which indicate that biased estimates are mainly related to
unobserved teacher behavior.4
If the approach di�erences out all relevant factors at the student and teacher level,
the estimated e�ect of homework should not be sensitive to the inclusion of such variables
in the �rst-di�erence model. In column (3) we allow student and teacher characteristics
to have di�erent e�ects on achievement in mathematics and science. With this change in
model formulation, the estimated e�ects of homework do not change much. The e�ect of
homework in all lessons compared to never homework declines from 3.3 to 2.8, that is 60
percent of the standard error in column (1). The decline is solely due to the inclusion of
student characteristics. A model only including teacher characteristics does not change
the e�ect of homework at all.
The lower part of Table 5 presents results for F-tests of joint signi�cance of the control
variables. The null hypothesis of no joint e�ect of teacher characteristics (including class
size) can clearly not be rejected. The full model results for the model speci�cation in
column (3) are presented in Appendix Table A3. In fact, all teacher characteristics are
insigni�cant at 10 percent level. However, the F-statistics for student characteristics is
signi�cant. This indicates that the assumption in Equation (2) that all student charac-
teristics have the same e�ect on achievement in mathematics and science does not hold
in reality. As shown in Appendix Table A3, boys and students from language minorities
perform better in mathematics than in science
The �nal part of Table 5 presents results using our cardinal measure of homework,
4homeworkjc. We estimate the following equation:
4yijc = βhw4homeworkjc + αCCc + eijc (3)
4Notice that with the data structure on our sample, it is not possible to include student �xed e�ectswithout at the same time implicitly including teacher �xed e�ects. Since all students have the sameteacher in both subjects, di�erencing across subjects at the student level implies that all teacher e�ectswhich are similar in the two subjects also are di�erenced out of the model.
20
Equation (3) is clearly a testable simpli�cation of Equation (2). The e�ect of home-
work for this model speci�cation are presented in columns (4)-(6) in Table 5. In all cases
the simpli�cation is not rejected at 10 percent level.5 By this approach, the e�ect of
homework is 3.0 in the model without control variables and 2.5 in the model with control
variables. The correlations between the control variables and student achievement (mea-
sured as the di�erence between the scores in math and science) resemble the results from
speci�cation (3) in Table 5 and Appendix Table A3, and are therefore not reported.
5.3 Heterogeneous e�ects
Column (7) in Table 5 includes interaction terms between homework and the indicator
for whether the family has no or very few books at home. This is the group of students
with lowest achievement as is clear from Table 4. The interaction term is positive, indi-
cating that students with the most disadvantage family background gains the most from
homework, but the e�ect is clearly insigni�cant.
In Table 6 we present results from country-speci�c estimations. The table only uses
the cardinal measure of homework in order to simplify the comparison across countries.
The �rst column presents results for the di�erence-in-di�erence model without control
variables, the same model speci�cation as in column (5) in Table 5. The e�ect of home-
work is positive in 12 of the 16 countries, and the e�ect is signi�cant at 1 percent level in
Australia, Austria, and the US. In the latter countries, the e�ect of homework is about
11-15 test score points, that is 14-21 percent of a standard deviation in these countries.
For most other countries, the estimated e�ect is in line with the average e�ect in Table 5.
Sweden turns up as an outlier with a negative e�ect that is signi�cant at 5 percent level.
The model in column (2) in Table 6 includes student and teacher characteristics. This
change in speci�cation leaves the estimated e�ect of homework almost unaltered in all
countries. Although the multivariate correlation with homework varies across countries
as shown in Table 3, the change in the point estimate is small in every country. The
5The p-value on whether the model in column (5) is an allowable simpli�cation of the model in column(2) is 0.42, and the p-value on whether the model in column (6) is an allowable simpli�cation of the modelin column (3) is 0.34.
21
Table 6: Homework and student achievement. Country speci�c estimates.With interaction terms
Homework Homework Homework*No books(1) (2) (3)
Australia 11.3 9.6 9.2 5.4(3.4)*** (2.8)*** (3.0)*** (7.4)
Austria 12.9 13.2 12.6 4.4(4.9)*** (4.1)*** (4.2)*** (11.4)
New Zealand 2.2 1.7 0.6 10.5(2.7) (2.5) (2.7) (7.0)
Norway 1.8 2.1 2.7 -9.0(1.9) (1.9) (2.0) (7.2)
Slovak -0.4 -0.9 -1.1 3.0(2.4) (2.6) (2.6) (5.5)
Sweden -10.4 -8.7 -9.2 11.5(4.4)** (4.2)** (4.3)** (24.7)
United States 15.2 11.8 11.6 1.3(2.7)*** (2.4)*** (2.3)*** (5.7)
England 2.8 2.6 3.6 -8.8(4.0) (3.5) (3.7) (7.1)
Scotland 5.1 4.8 4.3 5.1(3.5) (3.4) (3.7) (10.3)
Controlling for-student/fam char No Yes Yes Yes-Teacher/class char No Yes Yes Yes
Note: Results from country speci�c regressions. The models in column (1), (2) and(3) have the same speci�cation as the models in column (5), (6) and (7) in Table 5,respectively. Standard errors are heteroskedasticity robust and corrected for teacher-levelclustering. */**/*** denotes statistically signi�cance at the 10/5/1 percent level.
22
largest change is for the US, for the which the estimate of homework in all versus none
lessons is reduced from 15.2 to 11.8 score points.
The last columns in Table 6 (model (3)) present country speci�c results for the model
which allows the e�ect of homework to di�er between students with no or very few books
at home and other students. The interaction e�ect is positive in nine countries and
negative in seven countries. Students in Germany, Norway and England, whose parents
have few books, seem to be those who are most hurt by getting homework, whereas
students from the same background in Sweden and New Zealand seem to bene�t the
most from homework. However, in all 16 countries the interaction term is insigni�cant at
10 percent level.
The existing literature on homework is mainly form the US. To make a more through-
out comparison with that literature, Table 7 presents results from di�erent model speci-
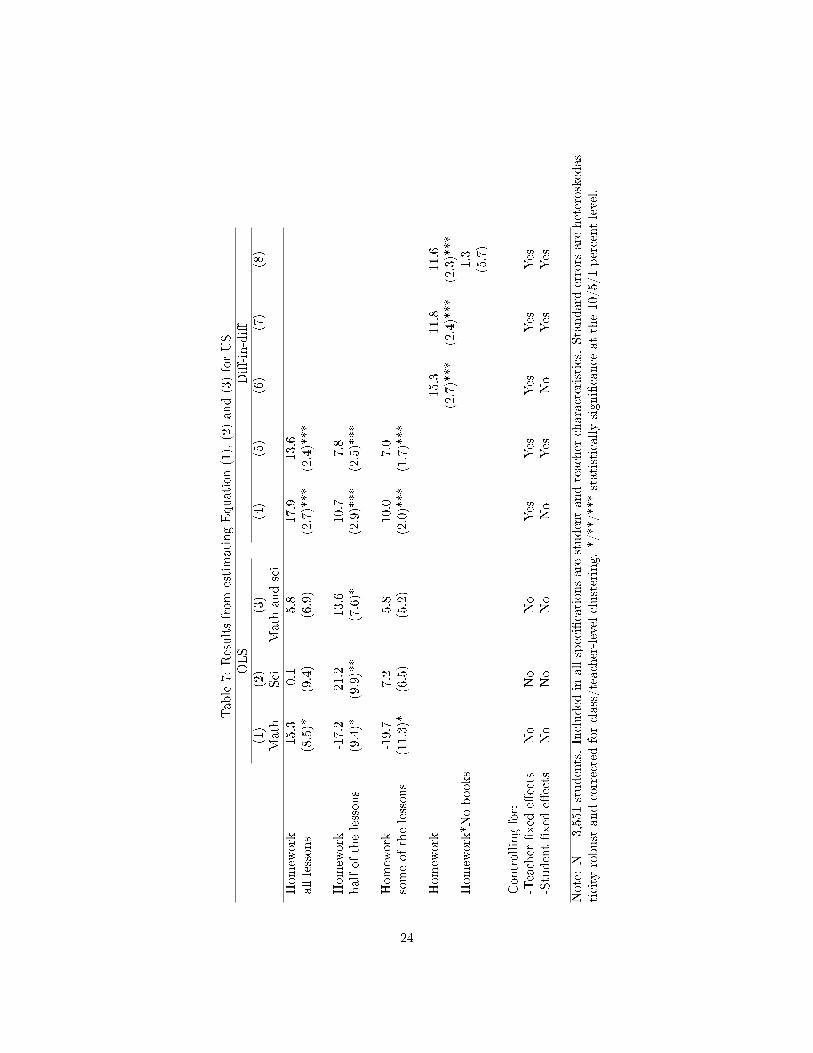
�cations on the sample of students in the US.
The OLS results are very di�erent for mathematics and science. Whereas homework
seems to be negatively related to achievement in mathematics (column (1)), the pattern
is less clear for science (column (2)). Only the relation between achievement in science
and assigning homework in half of the lessons is statistically signi�cant (and positive). In
column (3) which presents average e�ects across the two subjects, homework is positively
correlated with achievement. Also in this case the point estimate of homework in half
of the lessons is higher than the point estimate of homework in all lessons (cf. Table 4).
These results resemble the previous �ndings for the US that homework is not signi�cantly
related to higher achievement in primary education.
When conditioning on teacher �xed e�ects, the point estimate of assigning homework
becomes larger and statistically signi�cant at one percent level (column (4) and (6)),
which is more in line with the existing �ndings for the secondary level (seventh to eleventh
grade) for the US. This suggests a negative correlation between the amount of homework
assigned and teacher quality. This result di�ers from other countries where we found that
OLS overestimates the e�ect of homework. In contrast to other countries, it seems like
weak teachers assign more homework in order to compensate for poor teaching skills in
the US. On the other hand, in line with the results for all countries, the relative e�ects
of the three dummy variables of homework are meaningful in the di�erence-in-di�erence
speci�cation in contrast to the OLS speci�cation. The e�ect of the amount of homework
seems reasonable linear.
Finally, columns (5) and (7) in Table 7 include student �xed e�ects. Including student
�xed e�ects reduces the e�ect of homework somewhat (about 1.5 standard errors), but
the e�ect of homework is still highly signi�cant and larger than the international average
e�ect. Finally, there seems to be no evidence that pupils with few books at home perform
better or worse when homework is assigned in the US.
6 Discussion and concluding remarks
By using data on 3rd/4th graders from 16 OECD countries which participated in TIMSS
2007, this paper analyzes the e�ect of homework on student achievement. The identi�ca-
tion rests on within-student variation in homework in a sample of students who have the
same teacher in both mathematics and science. Unobserved teacher and student charac-
teristics are conditioned out of the model by applying a di�erence-in-di�erence approach.
Our �ndings indicate that models which do not take unobserved teacher characteristics
into account tend to overestimate the e�ect of homework. When conditioning on unob-
served characteristics of the teachers which are constant across mathematics and science,
we �nd that assigning homework in all lessons compared to never assigning homework
increases student test scores by 3.2 points, which is 4.4 percent of a standard deviation.
This estimate is not sensitive to the inclusion of student �xed e�ects. The e�ect of assign-
ing homework is largest in the US, Austria and Australia where it amounts to about 14-21
percent of a standard deviation. For most other countries we �nd an e�ect of homework
of about the same magnitude as the average e�ect. It may be the case that the e�ect
of homework depends on educational institutions. Why the e�ect of homework seems to
vary across countries will be an interesting research avenue.
25
With survey data, it is not possible to distinguish between the importance of homework
and classwork. To the extent that homework is correlated with unobserved classwork, it
will be a part of the e�ect of homework estimated. Teachers assigning relatively more
homework in mathematics than in science may also have di�erent degrees of classwork in
the two subjects. We cannot rule out that teachers who assign relatively much homework
in mathematics also are able to pursue e�cient in-class learning, although it seems most
likely that the correlation between homework and classwork is negative. In that case
we underestimate the pure e�ect of homework. One obvious fruitful avenue of further
research is �eld experiments with random assignment of homework. However, also in
that case it will be a challenge to keep classwork constant in a credible way.
26
References
[1] Ammermueller, A. and Pischke, J-S. (2009). Peer e�ects in European primary
schools: Evidence from PIRLS. Journal of Labour Economics, 27, 315-348.
[2] Askoy, T. and Links, C. R. (2000): A panel analysis of student mathematics achieve-
ment in the US in the 1990s: does increasing the amount of time in learning activities
a�ect math achivement? Economics of Education Review, 19, 261-277.
[3] Baker, D. P., LeTendre, G. K. and Akiba, M. (2005). Schoolwork at home? Low-
quality schooling and homework. In D.P. Baker and G.K. LeTendre (Eds), National
di�erences, global similarities: World culture and the future of schooling (pp. 117-
133). Stanford, CA: Stanford University Press.
[4] Betts, J. (1996): The role of homework in improving school quality. Discussion Paper
96-16, University of California, San Diego.
[5] Cooper, H. (1989). Homework. White Plains, NY: Longman
[6] Cooper, H., Robinson, J. C. and Patall, E. A. (2006). Does homework improve
academic achievement? A synthesis of research, 1987-2003. Review of Educational
Research, 76, 1-62.
[7] Dettmers S., Trautwein D. and Lütke O. (2009). The relationship between home-
work time and achievement is not universal: evidence from multilevel analyses in 40
countries. School E�ectiveness and School Improvement, 20(4), 375-405.
[8] Emerson, T. N. and Mencken, K. D. (2011). Homework: To Require or Not? On-
line Graded Homework and Student Achievement. Forthcoming in Perspectives on
Economic Education Research
[9] Eren O. and Henderson D. J. (2008). The impact of homework on student achieve-
ment. Econometrics Journal, 11, 326-348.
27
[10] Eren O. and Henderson D. J. (2011). Are we wasting our childrens time by giving
them more homework? Forthcoming in Economics of Education Review.
[11] Goldhaber, D. and Brewer, D. (1997). Why Don't Schools and Teachers Seem to Mat-
ter? Assessing the Impact of Unobservables on Educational Productivity. Journal of
Human Resources, 32(3), 505-523.
[12] Grodner A. and Rupp N. G. (2011). The Role of Homework on Student Learning
Outcomes: Evidence from a Field Experiment. Working Paper, East Carolina Uni-
versity
[13] Grove, W. A. andWasserman, T. (2006). Incentives and Student Learning: A Natural
Experiment with Economics Problem Sets. American Economic Review, 96 (2), 447-
452
[14] Guryan J., Hurst E. and Kearney M. S. (2008). Parental education and parental time
with children. Journal of Economic Perspectives, 22(3), 23-46.
[15] Krohn G. A. and O'Connor C. M. (2005). Student E�ort and Performance over the
Semester. Journal of Economic Education, 36(1), 3-28.
[16] Machin S. and S. McNally (2008). The Literacy Hour. Journal of Public Economics,
92, 1141-1462.
[17] McMullen S. (2010). The Impact of Homework Time on Academic Achievement.
Working Paper, Calvin College.
[18] McMullen S. and Busscher D. (2009). Homework and Academic Achievement in
Elementary School. Working Paper, Calvin College.
[19] Rønning, M. (2011). Who bene�ts from homework assignments? Economics of Ed-
ucation Review, 30, 55-64.
28
[20] Schwerdt G. and Wuppermann A. C. (2009). Is Traditional Teaching really all that
Bad? A Within-Student Between-Subject Approach. CESifo Working Paper No.
2634, Munich.
[21] Stinebrickner R. and Stinebrickner T. (2003). Working during school and academic
performance. Journal of Labor Economics, 21(2), 473- 491
[22] TIMSS 2007 user guide for the International Database. Lynch School of Education,
Boston College.
[23] Todd P. and Wolpin K. I. (2003). On the Speci�cation and Estimation of the Pro-
duction Function for Cognitive Achievement. Economic Journal, 113, F3-F33.
[24] Trautwein, U. and Köller, O. (2003). The relationship between homework and
achievement: still much of a mystery. Educational Psychology Review, 15, 115-145.
[25] Trautwein, U. (2007). The homework-achievement relation reconsidered: Di�eren-
tiating homework time, homework frequency, and homework e�ort. Learning and
Instructions, 17, 372-388.
Appendix
29
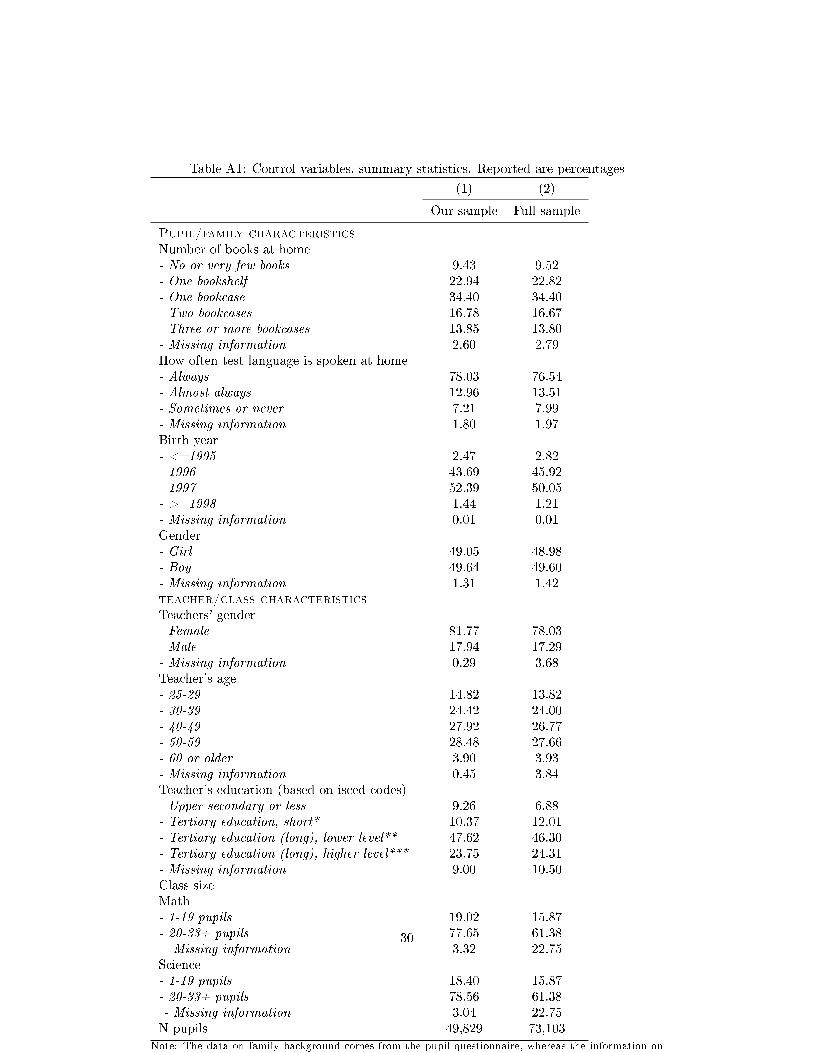
Table A1: Control variables, summary statistics. Reported are percentages
(1) (2)
Our sample Full sample
Pupil/family characteristicsNumber of books at home- No or very few books 9.43 9.52- One bookshelf 22.94 22.82- One bookcase 34.40 34.40- Two bookcases 16.78 16.67- Three or more bookcases 13.85 13.80- Missing information 2.60 2.79How often test language is spoken at home- Always 78.03 76.54- Almost always 12.96 13.51- Sometimes or never 7.21 7.99- Missing information 1.80 1.97Birth year- <=1995 2.47 2.82- 1996 43.69 45.92- 1997 52.39 50.05- >=1998 1.44 1.21- Missing information 0.01 0.01Gender- Girl 49.05 48.98- Boy 49.64 49.60- Missing information 1.31 1.42teacher/class characteristicsTeachers' gender- Female 81.77 78.03- Male 17.94 17.29- Missing information 0.29 3.68Teacher's age- 25-29 14.82 13.82- 30-39 24.42 24.00- 40-49 27.92 26.77- 50-59 28.48 27.66- 60 or older 3.90 3.93- Missing information 0.45 3.84Teacher's education (based on isced codes)- Upper secondary or less 9.26 6.88- Tertiary education, short* 10.37 12.01- Tertiary education (long), lower level** 47.62 46.30- Tertiary education (long), higher level*** 23.75 24.31- Missing information 9.00 10.50Class sizeMath- 1-19 pupils 19.02 15.87- 20-33+ pupils 77.65 61.38- Missing information 3.32 22.75Science- 1-19 pupils 18.40 15.87- 20-33+ pupils 78.56 61.38- Missing information 3.04 22.75N pupils 49,829 73,103
Note: The data on family background comes from the pupil questionnaire, whereas the information on
teacher and class characteristics come from the teacher questionnaire.
30
Table A2: The relation between di�erences in homework assignment across subjects andstudent and teacher characteristics.4hwajc 4homeworkjcDependent variable 4hwajc 4homeworkjc
Coe� St.error Coe� St.error(1) (2)
Teacher/class characteristicsFemale teacher -0.003 (0.022) -0.005 (0.017)Teacher's age (25-29=ref)-30-39 0.007 (0.026) -0.012 (0.020)-40-49 -0.026 (0.027) -0.024 (0.020)-50-59 -0.036 (0.027) -0.040 (0.021)*-60 or older 0.074 (0.047) 0.036 (0.037)Class size (1-19 =ref)-20-33+ 0.024 (0.020) 0.017 (0.015)Teacher's ed (Tert ed (long), low level=ref)-Upper sec or less 0.042 (0.054) 0.031 (0.040)-Tert ed (short) -0.059 (0.030)** -0.048 (0.024)**-Tert ed (long), high level -0.015 (0.023) -0.008 (0.019)Pupil/family characteristicsBoy -0.003 (0.004) -0.005 (0.003)*No of books (one bookcase=ref)-No or very few books 0.000 (0.009) 0.008 (0.007)-One bookshelf 0.003 (0.006) 0.002 (0.005)-Two bookcases -0.009 (0.006) -0.014 (0.005)***-Three or more bookcases -0.009 (0.008) -0.005 (0.006)Test-language spoken at home (always = ref)-Almost always -0.018 (0.012) -0.017 (0.009)*-Sometimes or never 0.032 (0.013)** 0.025 (0.010)**Birth year (1996=ref)-1995 -0.018 (0.017) -0.019 (0.011)*-1997 0.012 (0.006)* 0.013 (0.005)***-1998 0.080 (0.035)** 0.050 (0.027)*
R-square 0.2980 0.3039Note: N = 49,829. A constant term, country �xed e�ects and dummy variables for missinginformation on control variables are included in all speci�cations. Standard errors areheteroscedasticity robust and corrected for teacher-level clustering. */**/*** statisticallysigni�cance at the 10/5/1 percent level.
31
Table A3: Table 5 con't. The relation between observed student and teacher character-istics.
(3)
student/family characteristicsBoy 2.2 (0.3)***No of books (one bookcase=ref)-No or very few books 0.8 (0.7)-One bookshelf -0.2 (0.4)-Two bookcases -0.7 (0.5)-Three or more bookcases -5.8 (0.5)***Test-language spoken at home (always = ref)-Almost always -11.3 (0.8)***-Sometimes or never 17.0 (0.8)***Birth year (1996=ref)-1995 -5.2 (1.1)***-1997 1.2 (0.4)***-1998 6.7 (1.5)***teacher/class characteristicsFemale teacher -0.2 (0.6)Teacher's age (25-29=ref)-30-39 0.5 (0.7)-40-49 0.3 (0.7)-50-59 0.5 (0.7)-60 or older 1.8 (1.1)Class size (1-19 =ref)-20-33+ 0.8 (0.5)Teacher's ed (Tert ed. (long), low level=ref)-<=Upper secondary 1.0 (1.0)-Tert ed. (short) -1.0 (0.8)-Tert ed. (long), high level 0.5 (0.7)