Subscriber access provided by University of Texas Libraries Journal of the American Chemical Society is published by the American Chemical Society. 1155 Sixteenth Street N.W., Washington, DC 20036 Homogeneous electron-transfer reactions of several aromatic anion and cation radicals Bruce A. Kowert, Lynn Marcoux, and Allen J. Bard J. Am. Chem. Soc., 1972, 94 (16), 5538-5550• DOI: 10.1021/ja00771a003 • Publication Date (Web): 01 May 2002 Downloaded from http://pubs.acs.org on February 19, 2009 More About This Article The permalink http://dx.doi.org/10.1021/ja00771a003 provides access to: • Links to articles and content related to this article • Copyright permission to reproduce figures and/or text from this article
Transcript
Subscriber access provided by University of Texas Libraries
Journal of the American Chemical Society is published by the American ChemicalSociety. 1155 Sixteenth Street N.W., Washington, DC 20036
Homogeneous electron-transfer reactions ofseveral aromatic anion and cation radicals
Bruce A. Kowert, Lynn Marcoux, and Allen J. BardJ. Am. Chem. Soc., 1972, 94 (16), 5538-5550• DOI: 10.1021/ja00771a003 • Publication Date (Web): 01 May 2002
Downloaded from http://pubs.acs.org on February 19, 2009
More About This Article
The permalink http://dx.doi.org/10.1021/ja00771a003 provides access to:
• Links to articles and content related to this article• Copyright permission to reproduce figures and/or text from this article
detailed examination of this question will require data as a function of temperature so that comparisons similar to those made here can be made. Other work involving LFE relationships has been done22 as a function of
(22) E x . , (a) E. Lieber, C. N. Rao, and T. S. Chao, J . Amer. Chem. Soc., 79, 5962 (1957); (b) M. E. Langmuir, L. Dodlietti, E. D. Black,
temperature, but the investigators apparently did not address themselves to this question, nor do their data readily lend themselves to analysis in this manner.
Acknowledgment. This work was supported by The Institutes Of in the form Of a re-
and G. Wettermark, ibid., 91, 2204 (1969). search grant to J. E. s. (GM-I 3 1 16).
Homogeneous Electron-Transfer Reactions of Several Aromatic Anion and Cation Radicals
Bruce A. Kowert, Lynn Marcoux, and Allen J. Bard*
Contribution from the Department of Chemistry, University of Texas at Austin, Austin, Texas 78712. Received December 27, 1971
Abstract: The homogeneous electron-transfer reaction between aromatic molecules and their anion or cation radi- cals represents one of the simplest possible cases of electron transfer. Although this reaction results in no net chemi- cal change, the rate may be measured by magnetic resonance techniques. This study reports the development of a technique which utilizes in situ radical ion generation by electrochemical methods in order to produce radical ion- parent mixtures which may be studied by electron spin resonance techniques in the fast exchange limit. This tech- nique permitted the first large-scale study of the homogeneous exchange rates of radical cations, and reports rate constants for the exchange reactions of phenothiazine, 10-methylphenothiazine, phenoxazine, phenoxathiin, N, N- dimethyl-p-phenylenediamine, and N,N,N’,N‘-tetramethyl-p-phenylenediamine. The effects of substituents upon the exchange rates of several aromatic nitriles were studied; and the effect of solvent variation upon the exchange rate of benzonitrile was determined.
xchange reactions of all types have long held a E fascination for kineticists, and of these electron- exchange reactions have been of especial interest since these processes represent the simplest sort of electron transfer. The publication by Ward and Weissman2s3 of an electron spin resonance (esr) study of the rate of electron exchange for the naphthalene-sodium naph- thalenide system was significant because it presented a measurement technique which did not rely on radio- active tracers and which was applicable to a large number of organic molecules.
The electron-transfer reactions of aromatic anion radicals have been the most extensively studied group since the early work of Ward and Weissman. They have been shown to be influenced by a variety of factors including solvent, 4--6 identity of c o ~ n t e r i o n , ~ ~ ~ and the degree of ion pairing between the anion radical and the counterion.5!6
Neutral radicals occur far less frequently but rate constants for the electron-transfer reactions of two systems have been obtained. Lown7& studied the triphenylmethyl, triphenylmethyl cation electron trans- fer while Jones and W e i s ~ m a n ~ ~ examined the effect of counterion and solvent on the reaction of the tris-p-
(1) Exch. React. ,Proc. Symp., l(1965). (2) R . L. Ward and S . 1. Weissman, J . Amer. Chem. SOC., 76, 3612
(3) R. L. Ward and S. I. Weissman, ibid., 79,2086(1957). (4) P. A. Malachesky, T. A. Miller, T. Layloff, and R. N. Adams,
(5) P. J. Zandstra and S. I. Weissman, J . Amer. Chem. Soc., 84, 4408
(6) N. Hirota, R. Carraway, and W . Schook, ibid., 90,3611 (1968). (7) (a) J. W. Lown, Proc. Chem. SOC. London, 283 (1963); (b) M. T.
Jones and S. I. Weissman, J. Amer. Chem. Soc., 84, 4269 (1962).
(1954).
Exch. React., Proc. Symp., 151 (1965).
(1962).
nitrophenylmethyl radical with the tris-p-nitrophenyl methide anion.
In spite of the large number of cation radicals that have been observed with esr, it is surprising that so few electron-transfer reactions involving this important class of radicals have been reported. Cross reactions between various aromatic hydrocarbons and their cation radicals have been observed by pulse radiolysis.8 For the well-known stable cation of tetramethyl-p- phenylenediamine (Wurster’s Blue cation) three sep- arate investigation^^-^^ revealed that the electron transfer occurs primarily between the radical and free amine, even if protonated species are also present. Romans, et al., l 2 observed the electron-transfer reaction of the tetramethylhydrazine cation radical complexed with the singly charged anion of molecular iodine with parent tetramethylhydrazine.
The reason for the small number of investigations of cation radicals becomes evident if the requirements for the determination of electron-transfer rate constants using esr are examined. Knowledge of both the parent and radical concentration is a necessity, since the rate constant is determined from the change in line shape of the esr spectrum as the parent-to-radical con- centration ratio is varied. The radical concentration must also be kept small enough to prevent spin ex- change from becoming an appreciable source of spin
(8) N. E. Shank and L. M. Dorfman, J . Chem. Phys., 52,4441 (1970). (9) C. R. Bruce, R. E. Norberg, and S. I. Weissman, ibid., 24, 473
(1956). \ - - - - I
(10) C. S . Johnson, Jr., ibid.,39,2111 (1963). (11) A. D. Britt, ibid., 41,3069 (1964). (12) D. Romans, W. H. Bruning, and C. J. Michejda, J . Amer. Chem.
SOC., 91,3859 (1969).
Journal of the American C!temical Society 1 94:16 1 August 9, 1972
relaxation. Success in determining an electron-transfer rate constant thus generally requires both the repro- ducible preparation of small amounts of radical and the reproducible variation of the parent concentration. While many methods for the chemical preparation of cation radicals are known, l 3 the mechanisms are not completely understood and the amount of parent and radical present in a given solution is hard to control. This is the main reason for the small number of in- vestigations of the electron-transfer reactions of cation radicals.
Controlled potential electrolysis, however, can be used for the quantitative preparation of dilute solutions of anion or cation radicals provided that the radical is stable. This has been one of the principal methods used to prepare anion radicals for the investigation of their high-resolution esr spectra. 14, l5 Adams and coworkers have used electrochemical generation in their studies of the electron-transfer rates of the anions of several hydrocarbons, nitro compounds, and nitriles4, 16, as well as in their work on spin exchange. 18,19
We have used controlled potential electrolysis in conjunction with the esr fast exchange limit to obtain the electron-transfer rate constants for the cation radicals of the three tricyclic heterocycles phenothiazine, 10-methylphenothiazine, and phenoxazine and the Wurster's Blue cation in acetonitrile. The fast ex- change limit was chosen because of the complex high- resolution esr spectra these compounds exhibit.
Using controlled potential electrolysis, samples were prepared by addition of parent to a radical-only solution outside of the esr cavity. This was extremely time consuming and it was obvious that radicals less stable than these cations would be difficult if not impossible to study in this manner.
The search for a technique which would make the study of less long-lived species possible as well as reduce the amount of time needed to study stable radicals revealed that the in situ e l e c t r o l y ~ i s ~ ~ ~ ~ ~ of concen- trated parent solutions was both convenient and accurate. The resulting esr spectra were either in or very near the fast exchange limit and when compared with the results from the controlled potential experi- ments the agreement was found to be good.
The in situ method was successfully employed for studies of the phenoxathiin and dimethyl-p-phenylene- diamine cation radicals in acetonitrile and the anions of eight substituted benzonitriles, dibenzofuran, di- benzothiophene, and stilbene in dimethylformamide. Additionally the benzonitrile anion was examined in the solvents dimethylformamide, acetonitrile, propyl- ene carbonate, dimethyl sulfoxide, and dioxane.
The series of substituted benzonitriles affords the opportunity to look for a different type of correlation
(13) G. Vincow, "Radical Ions," E. T. Kaiser and L. Kevan, Ed.1
(14) D. H. Geske and A. H. Maki, J . Amer. Chem. SOC., 82, 2671
(IS) R.N.Adams,J.Electroannl. Chem., 8 , 151 (1964). (16) P. Ludwig and R. N. Adams, J . Chem. Phys., 37,828 (1962). (17) T. Layloff, T. A. Miller, R. N. Adams, H. Fah, A. Horsfield,
(18) T. A. Miller, R. N. Adams, and P. N. Richards, J . Chem. Phys.,
(19) T. A. Miller and R. N. Adams, J . Amer. Chem. SOC., 88, 5713
(20) L. H. Piette, P. Ludwig, and R. N. Adams, Anal. Chem., 34,
Interscience, New York, N. Y., 1968, p 202.
( 1960).
and W. Proctor, Nature (London), 205,382 (1965).
44,4022 (1966).
(1966).
916 (1962).
5539
for electron-transfer rate constants. Rate-constant correlations applied until the present have involved varying some property of the solution such as solvent or counterion. 4--6 For the benzonitriles, however, all experiments were performed using the same solvent and supporting electrolyte so differences in rate constant should be due to the molecular properties of the par- ticular species involved. Similar remarks apply to the four heterocyclic cations.
Accordingly, two types of correlation have been examined. One involves the correlation of rate con- stant with molecular properties such as oxidation potential, reduction potential, or molecular geometry. The other postulates models in which electron transfer takes place between individual groups of atoms in the radical and parent.
The solvent data are compared with two models for electron transfer. One is the model used in the corre- lation for the rate constants of the substituted benzo- nitriles. The other is the well-known theory of Marcus.
Experimental Section Chemicals. Tetrabutylammonium perchlorate was obtained from
Southwestern Analytical Chemicals, dried under vacuum, and stored over calcium chloride. Tetraethylammonium perchlorate was prepared by mixing 500 g of tetraethylammonium bromide in 1500 ml of hot water with 350 g of NaCIOI.H1O in 400 ml of hot water and heated further until the tetraethylammonium perchlorate dissolved. It was recrystallized six times from water and stored over calcium chloride.
Dimethylformamide (Eastman Organic Chemicals) was vacuum distilled from anhydrous copper sulfate at 55". Acetonitrile (Math- eson Coleman and Bell) was stored over calcium hydride for 12 hr and distilled from phosphorus pentoxide a t 80" and atmospheric pressure. Acetonitrile was used as a solvent for both anion and cation radicals. All other solvents were used only for anions. Propylene carbonate (Jefferson Chemical Co.) was vacuum distilled at 110". Dimethyl sulfoxide (Eastman Organic Chemicals) was dried over calcium hydride for 48 hr and vacuum distilled with a nitrogen leak at 68". Dioxane (J. T. Baker Chemical Co.) was dis- tilled from sodium at 99" and atmospheric pressure.
Phenothiazine, 10-methylphenothiazine, and phenoxathiin (East- man Organic Chemicals) were chromatographed on an alumina column using benzene and recrystallized from benzene. Phenox- azine was prepared according to Gilman and Moorez2 and twice sublimed in aacuo. N,N,N',N'-Tetramethyl-p-phenylenediamine hydrochloride (Eastman Organic Chemicals) was neutralized with sodium hydroxide, extracted with benzene, chromatographed on an alumina column, and sublimed in vucuo. N,N-Dimethyl-p-phenyl- enediamine (Eastman Organic Chemicals) was distilled at atmo- spheric pressure at 259". The distillate was dark red.
Benzonitrile (Matheson Coleman and Bell) was used as received. Phthalonitrile and terephthalonitrile (Eastman Organic Chemicals) were chromatographed using benzene on an alumina column and recrystallized from benzene.
Pyromellitonitrile was prepared using the method of Lawton and Ritchie. z 3 4-Cyanopyridine (Aldrich Chemical Co.) was chroma- tographed using benzene and recrystallized from benzene.
o-Tolunitrile (Aldrich Chemical Co.) was distilled at atmospheric pressure and 200". m-Tolunitrile (Aldrich Chemical Co.) was dis- tilled a t atmospheric pressure and 210". p-Tolunitrile was distilled at atmospheric pressure and 210".
Dibenzothiophene and dibenzofuran (Eastman Organic Chemi- cals) were chromatographed on alumina using benzene and re- crystallized from benzene.
Radical Ion Generation The cation radicals of phenothiazine, 10-methylphe-
nothiazine, phenoxazine, and N,N,N',N'-tetramethyl-p- (21) R. A. Marcus, Annu. Rev. Phys. Chem., 15,155 (1964). (22) H. Gilman and L. 0. Moore, J. Amer. Chcm. SOC., 79, 3485
(23) E. A. Lawton and D. D. Ritchie, J . Org. Chem., 24,26 (1959). (1957).
Kowert, Marcoux, Bard 1 Reactions of Aromatic Anion and Cation Radicals
5540
phenylenediamine (Wurster’s Blue) were studied by external generation. They were chosen because previous esr and electrochemical studies indicated suitable stability. 2 4 Acetonitrile was employed as the solvent. The supporting electrolyte was tetraethyl- ammonium perchlorate (TEAP), used at a concen- tration of 0.1 A4 for all samples.
The cell used most often was similar to one originally designed by Sadler.25 Another cell with only one sidearm was also used. The solvent and supporting electrolyte were degassed at least once before a helium atmosphere was introduced in the cell. This atmo- sphere was maintained for the duration of the period in which samples were taken.
The sample was introduced and the controlled potential electrolysis was performed using a potentio- stat designed by Bard.26 The concentration of the electroactive species ranged from 5 x to 10-3 M . The potentials us. the saturated calomel electrode (we) were 0.80 V for phenothiazine and 10-methylpheno- thiazine, 0.65 V for phenoxazine, and 0.40 V for Wurster’s Blue. The total number of coulombs passed was measured using a voltage-to-frequency converter-digital counter described by Bard and Solon. 27
An sce was used as the standard electrode while the working electrode was a platinum gauze with a plati- num wire as the auxillary electrode.
For each system at least one radical-only sample was taken after the conclusion of electrolysis and its spectrum was compared with those in the literature. The radical-parent solutions were prepared using a mixing chamber which was evacuated for approxi- mately 15-30 min after introduction of a known amount of the solid parent. An aliquot of the radical solution was drawn into the calibrated barrel. After complete dissolution the solution was admitted to the sample tube, which had also been previously evacuated. The sample tube was then immersed in liquid nitrogen and removed with a torch.
The external method provided a reliable means of measuring electron-transfer rates but suffered from several disadvantages. The process was somewhat unwieldy and time consuming. An average of 1 hr was necessary to obtain a sample, with at least half of this time required to dissolve the solid parent due to the high concentrations involved. The number of oper- ations increased the probability of admission of oxygen to the sample, leading to line broadening. Destruction of the radical was also possible.
Additionally, if the lifetime was short the number of samples obtainable from a given electrolysis decreased, necessitating the repetition of the lengthy preelectrolysis and electrolysis procedures in order to secure a sufficient amount of data.
The in situ electrolysis of organic molecules has been utilized extensively in studying the high-resolution esr spectra of the resulting radical ion^.'^!^^ Ludwig and Adams also used it to study the electron-transfer reaction of the benzonitrile anion radical in the slow
(24) (a) J.-P. Billon, Ann. Chim. (Paris), 7, 183 (1962); (b) J.-P. Billon, G . Cauquis, and J . Combrisson, J . Chim. PhJs., 374 (1964;; (c) S . Odiot and F. Tonnard, ibid., 382 (1964); (d) J.-M. Lhoste and F. Tonnard, ibid., 678 (1966); (e) B. M. Latta and R. W. Taft, J . Amer. Chem. SOC., 89,5172 (1967).
(25) J . L. Sadler, Ph.D. Dissertation, University of Texas, 1967. (26) A. J. Bard, Anal. Chem., 35,1125 (1963). (27) A. J. Bard and E. Solon, ibid., 34,1181 (1962).
exchange limit.I6 They observed but did not analyze singlets for two samples of fairly high benzonitrile concentration. This indicated the possibility of using in situ electrolysis with the fast exchange method. This approach was used for the entire group of anions and the phenoxathiin and N,N-dimethyl-p-phenylene- diamine cations as well as a few preliminary experiments on the phenoxazine cation radical.
The electrolysis cell was the Varian flat cell Model 4556. A Heathkit voltage regulated power supply was used with a platinum gauze anode and a platinum wire cathode for oxidations while a mercury pool cathode and a silver wire anode were used for re- ductions. Current was monitored using a Simpson Model 260 VOM. Solutions were prepared in 5-ml volumetric flasks and were gently stirred with solvent- saturated nitrogen during dissolution of the parent and supporting electrolyte. The supporting electrolyte was tetrabutylammonium perchlorate and its concen- tration was 0.1 M for all samples.
The current level in all experiments was held between 200 and 400 PA. At this level a 30-min electrolysis consumed approximately 3 X mol of parent. Since 5 ml of about 1 M solution was normally used, depletion due to electrolysis was less than 1 %.
Stirring with nitrogen was used in the electrolysis cell to avoid high localized concentrations of radical. The nitrogen was passed over hot copper filings and bubbled through a reservoir of solvent before entering the cell through a capillary placed at the top of the flat portion. At the conclusion of electrolysis, if stable enough, the radical’s color would be uniformly distributed through- out the cell, showing the effectiveness of the stirring.
This arrangement did not allow the monitoring of the cell potential. To be sure the desired radical was indeed being formed, dilute solutions of the parent compound were electrolyzed under the same conditions used for the electron-transfer experiments. The re- sulting highly resolved esr spectra were found to agree with those in the literature. Additionally, the current for these generations was intentionally kept low (200- 400 PA) to avoid excessively negative potentials. The reduction potentials for the parent compounds used were all between - 1 and -3 V. The high concen- trations of electroactive species provided an effective buffer for potential so excessively positive or negative potentials and their concomitant complications were avoided.
As further proof that the desired radical and not some other species was being generated, it should be noted that with the parent concentration as the only variable, the esr line width systematically narrowed. A final check of the validity of the method was provided by examining several phenoxazine samples using the in situ technique, Their line widths were consistent with those obtained by external generation.
Radical concentrations in the flat portion of the cell were shown to be insufficient for spin exchange. Elec- trolysis was terminated for particularly intense singlets and the line width was observed while the signal ampli- tude dropped. The data given in Table I for samples of the phenoxazine cation and the stilbene anion show no change within experimental error after stopping electrolysis, change in line width for a tenfold increase in gain and a
The st lbene sample shows less than 1
Journal of the American Chemical Society 1 94:16 1 August 9 , 1972
5541
The theoretical basis for the determination of ex- change rates from line widths has been discussed in the past; 3 2 however, certain comments pertinent to this type of measurement should be made at this time. The original measurements of Ward and W e i s ~ m a n ~ , ~ were made at the slow exchange limit where one measures the broadening of an individual hyperfine line. This is severely complicated by overlap in the case of complex spectra. This problem has been treated33 and rate con- stants have been determined utilizing computer simu- lation.12 Chang and however, have shown that measurement in the fast exchange limit is a less complicated approach for these molecules since the spectrum has narrowed to a singlet. In this limit the probability of electron transfer per unit time is much greater than the frequency separation of the resonance lines, i.e.
W I - a, << 1/T?i + l / T (1) where T is the mean radical lifetime between electron transfers, l/Tzi is the line width of the ith resonance in the absence of electron transfer, and w j is the resonance frequency of the j th line. The general equation for electron exchange may then be expressed as
Table I. Line Width as a Function of Time for the Stilbene Anion and Phenoxazine Cation
sixfold increase in modulation amplitude over a period of about 40 min. The increase in modulation ampli- tude easily accounts for the slight broadening observed.
Esr Measurements. All esr measurements were made at 23 =k 2” using a Varian Associates V-4502 spectrometer employing 1 00-Kc modulation.
Line widths were measured between points of extreme slope in a first derivative presentation. A minimum of four spectra was averaged for each sample. The standard deviation in line width for a given sample was usually about 2-3% with only a few as large as 5x. The field scan rate ranged between 2.5 G/min and 0.5 G/min with the majority of runs (about 80%) being made at 1 G/min. A change in scan rate did not produce appreciable differences in line width.
Where necessary, corrections were made for the contribution of the modulation amplitude to the experimental line width. The effect of modulation amplitude on line width and intensity has been discussed by several a ~ t h o r s . ~ 8 , ~ ~ The true line width is related to the experimentally observed line width for the spec- trometer used in these studies by
AH = AH,,, - 0.002(MS)
where MS is the modulation amplitude machine setting. This relation was obtained from a calibration made employing the perylene anion radical.30 For most experiments the correction was 0.02 G or less.
For samples in the fast exchange limit the lines were Lorentzian in shape within experimental error using the derivative curve-slope method and the normalized plot method.
(28) G. K. Fraenkel in “Physical Methods of Organic Chemistry,” Vol. 1, Part IV, 3rd ed, A. Weissberger, Ed., Interscience, New York, N. Y., 1960, Chapter XLII.
(29) J . E. Wertz and J . R. Bolton, “Electron Spin Resonance,” American Chemical Society Short Course 107, Appendix 6.
(30) I. B. Goldberg, private communication. (3 1) R. S. Alger, “Electron Paramagnetic Resonance: Techniques
and Applications,”Interscience, N e w York, N. Y . , 1968, pp 42-44.
where
(a) = CP@t (4)
(4 = C P , W L Z (5)
a
and
I
and where y is the electronic gyromagnetic ratio, HI is the magnitude of the oscillating microwave field, M o is the equilibrium magnetic moment, p J is the fractional population of thejth state, and w is the frequency of HI.
The quantities ( w ) and (a?) are obtained from the spectrum in the absence of electron transfer. Since first-order spectra are symmetrical, ( w ) measured in gauss is simply the value of the magnetic field at the spectrum’s center and is independent of the hyperfine coupling constants. The quantity V = (a’) -
is the second moment of the spectrum and de- pends only on the hyperfine coupling constants. Ex- pressed in (gauss)2 the second moment is
v = C P I H Z 2 z
where Hi is the magnetic field at which the ith resonance takes place.
Using the valid approximation T20 >> ‘T, the line width in gauss of the Lorentzian singlet is
(7)
where AHo is the common line width assumed for all lines in the absence of electron transfer. As before,
A H = AH0 + 2.05 X 10⁷V/k[R]
(32) C. S. Johnson, Jr., Adoan. Mugn. Resonance, 1, 33 (1965). (33) J . R. Norris, Jr., Chem. Phj,s.Leti., 1, 333 (1967). (34) R. Chang and C. S. Johnson, Jr., J . Amer. Chem. SOC., 88, 2335
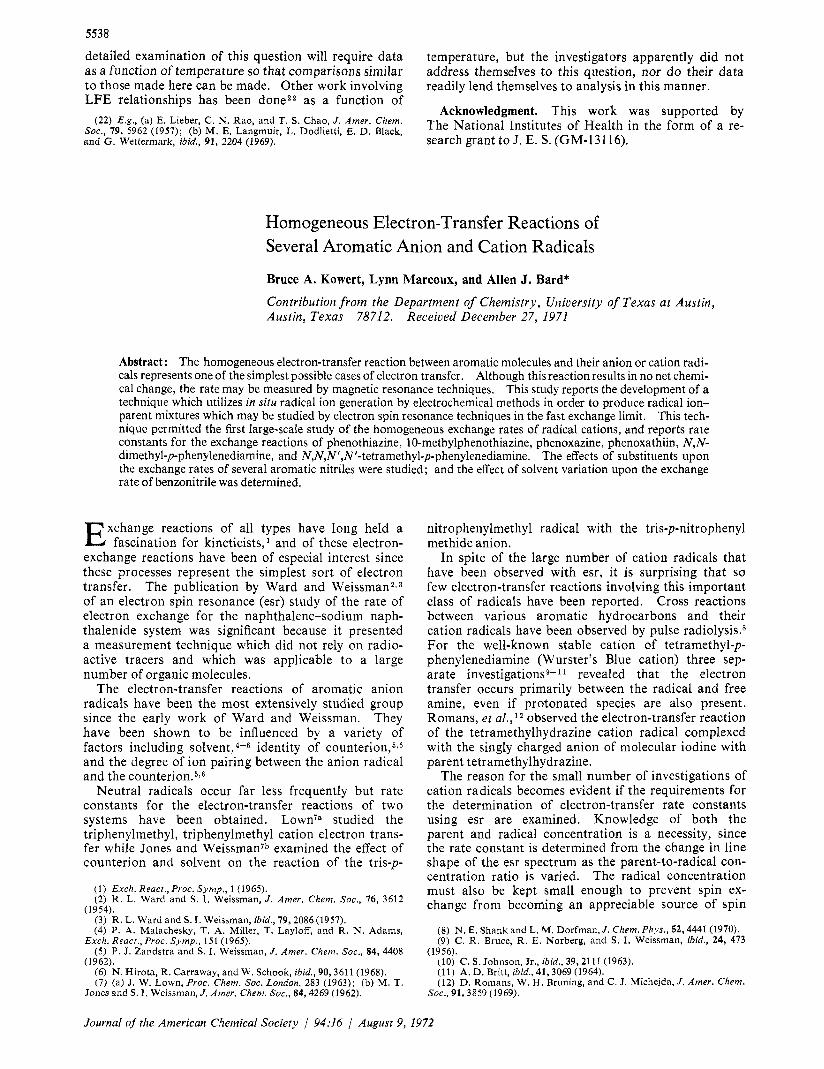
Figure 1. Line widths for external and internal generation of phenoxazine cation.
line width is measured between points of extreme slope in a first derivative presentation.
A few additional comments on the second moment are in order. The quantity V which arises when the general expression is expanded in the fast exchange limit is the stick spectrum approximation to the true second moment. Chang and suggested that the second moment could be obtained by overmodu- lating an uncollapsed spectrum. They measured such a quantity for the stilbene anion radical and obtained good agreement with the stick spectrum result. This would be the true second moment since it takes the finite width of the individual lines into account.
The line shape usually assumed for organic radicals in solution is the Lorentzian line shape. 36 This presents an interesting complication, since the second moment of a Lorentzian line is infinite and any spectrum com- posed of Lorentzian lines would have an infinite second moment. The precise confirmation of a given line shape becomes difficult after one goes a few line widths into the wings3? and if one assumes the line shape follows Lorentzian behavior when it can be measured and is zero elsewhere, a finite second moment can be calculated for the “truncated” Lorentzian lines. 38
The results of the calculations indicate that the differ- ence between the stick spectrum second moment and the second moment for Lorentzian lines truncated five line widths from the center is small. This means the experimental determination of a second moment is probably possible but extreme care must be taken.
The appearance of a singlet does not guarantee that the fast exchange limit has been achieved, a situation which may often occur due to the limited solubility of some organic compounds. Johnson and H01.z~~ have studied the limits for which eq 7 is applicable and have added a correction that allows rates to be determined outside of the rigorous fast exchange limit. The cor- rected equation is
AH,, = 3.16 X 10L4VX] (8)
(35) R. Chang and C. S. Johnson, J. Chem. Phys., 46,2314 (1967). (36) A. Hudson and G. R. Luckhurst, Chem. Reo., 69,191 (1969). (37) J. Gendell, J. H. Freed, and G. K. Fraenkel, J . Chem. Phys., 41,
949 (1964). ~I
(38) C . P. h o l e , Jr., “Electron Spin Resonance,” Interscience, New
(39) C. S. Johnson, Jr., and J. B. Hclz, J . Chem. Phys., 50, 4420 York, N. Y., 1967, pp 807-811.
(1969).
where
x = 2 - @lV (9) The quantity in ( g a ~ s s ) ~ and is
is the fourth moment of the esr spectrum
= CPdK4 (10) i
The parameter that determines whether a series of measurements is within the fast exchange limit is
If Z I 0.2, the fast exchange equation can be used with a maximum error of 5 % , while if Z I 0.4, the same maximum occurs if the corrected equation is employed. The largest tolerable line width for either approximation is easily calculated once the second moment is known.
A small value of X will cause the extended equation’s correction to be small, allowing the fast exchange formula to be used for Z as large as 0.3 or 0.4 with no large introduction of error.
The following procedure was used to obtain a rate constant from a series of line width measurements. Assuming Z = 0.2, the maximum value of AH,, for the fast exchange limit was calculated using eq 11. If a reasonable number of line widths were equal to or smaller than this value, a least-squares analysis was performed to determine a slope and intercept. If line width is plotted us. inverse parent concentration, the rate constant can then be determined using eq 7 in the form
k = 2.05 X 1O7V/slope (12)
Standard deviations for rate constants were calculated by subtracting the intercept from each line width and calculating the rate constant for each point using eq 7 directly.
If a large percentage of the line widths were larger than the maximum fast exchange line width, the ex- tended equation was used. Even though the fast exchange limit was not being obeyed, the slope of a least-squares analysis yielded an initial estimate of the rate constant. If X < 1, this would be too high while of X > 1, it would be too low. The final value was ob- tained by comparison of experimental line width us. inverse concentration curves with those calculated for different values of the rate constant. No standard deviations were calculated for these systems but they are assumed to be no greater than those in the fast exchange limit. Additionally, a linear correlation co- efficient has been calculated for systems in the fast ex- change limit.
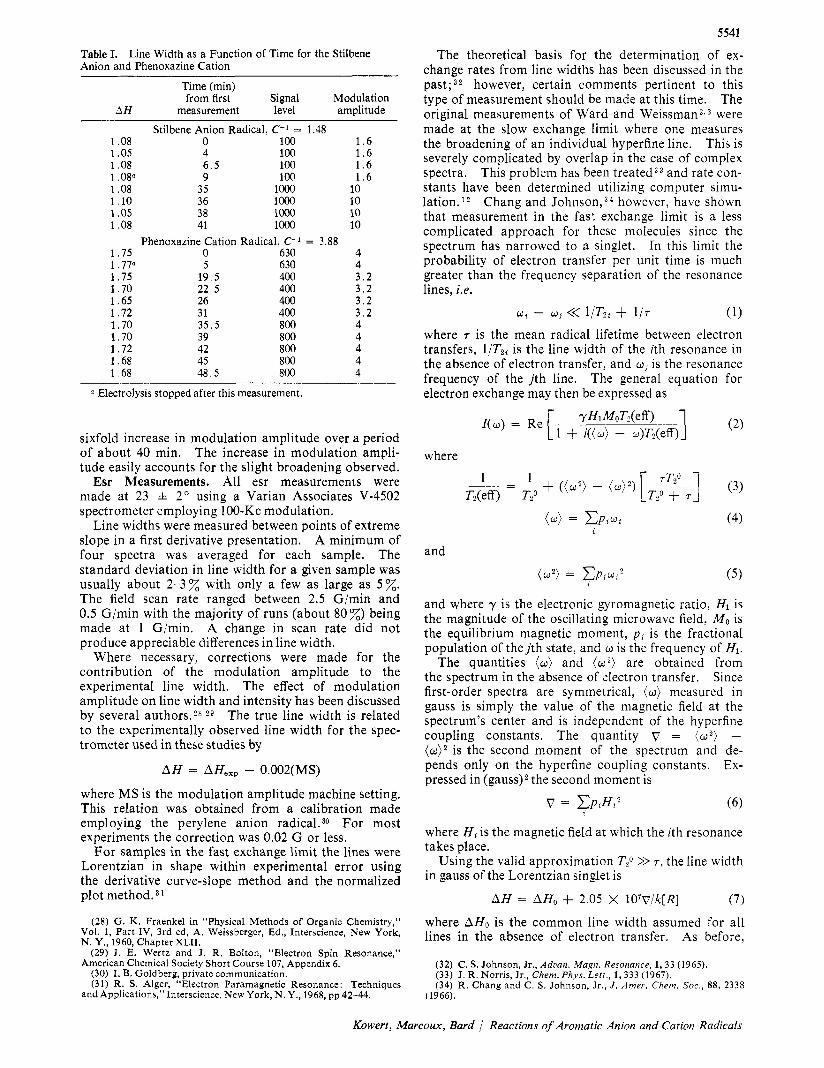
Results Plots of experimental data are given in Figures 1 and
2. Figure 1 shows the data for the phenoxazine system which is representative of those for which it is possible to use the fast exchange equation without correction. In this case 2 was no larger than 0.21 for any line. Figure 2 shows the data for the benzonitrile system in dimethylformamide. The factor X is small (-0.09) for this anion. This causes the correction to the fast exchange expression to be only 1 % for 2 = 0.32, corresponding to the lowest parent concentration
Journal of the American Chemical Society 94:16 August 9,1972
5543 Table 11. Rate Constants, Second Moments, and Correlation Coefficients for Cations
Supporting Seconda Correlation Molecule Solvent electrolyte moment Ref coefficient kb
Phenothiazine ACN' TEAPd 47.97 40 0.99 6 .7 i 0 .4 X lo9 10-Methylphenothiazine ACN TEAP 75.16 24c 2 . 2 i 0 . 3 X lo9 Phenoxazine ACN TEAP 67.80 24d 0.99 4 .5 i 0.3 x 10⁹
Phenoxathiin ACN TBAP 2.97 41 0.99 3 .6 f 0 . 2 x 10⁸ N,N,N',N'-Tetramethyl- ACN TBAP 206.12 24e 1 . 0 i 0 . 2 x 10⁹
TBAPO
. . . p-phenylenediamine-
N.N-Dimethv1-D- ACN TEAP 161.60 24e 7 . 5 i 0.8 X 10⁸ . . phenylenediamine
a The second moment's units are (gauss)2. The rate constant's units are liter/(mole second). Acetonitrile. Tetraethylammonium perchlorate. e Tetrabutylammonium perchlorate.
Table 111. Rate Constants, Second Moments, and Correlation Coefficients for Anions
Molecule Supporting Secondo Correlation
Solvent electrolvte moment Ref coefficient kb
Benzonitrile DMFc TBAPf 27 43 42 0 .99 5 .6 i 0 . 3 X 10⁸ Benzonitrile ACNd TBAP 27.43 42 0.92 6 . 6 i 0 . 6 x lo8 Benzonitrile DMSO' TBAP 27.43 42 0.98 3 .9 i 0 . 4 x 10⁸ Benzonitrile Propylene TBAP 27.43 42 0.99 2 . 6 f 0 . 2 X 10⁸
Benzonitrile Dioxane TBAP 27.43 42 0.92 1 . 7 i 0 . 3 X lo8
Terephthalonitrile D M F TBAP 6.90 42 0.99 1 . 4 i 0.04 X log Pyromellitonitrile D M F TBAP 4.14 42 0.96 9 . 1 i 1 . 0 X 108 4-Cyanopyridine DMF TBAP 29.46 42 0.95 6 .8 i 0 . 6 X 10⁸ p-Tolunitrile DMF TBAP 75.20 42 0.99 7 . 8 i 0 . 5 X 10⁸ m-Tolunitrile DMF TBAP 25.64 43 0.99 5 . 6 f 0 . 6 X 10⁸ o-Tolunitrile DMF TBAP 34.71 43 0.99 8 . 6 i 1 . 0 x 108 Di benzothiophene D M F TBAP 24.78 44 0.94 1 . 2 i 0 .1 x 109 Dibenzofuran DMF TBAP 26.12 44 0.98 1 . 6 i 0 . 2 x 10⁹ trans-Stilbene DMF TBAP 23.70 45 1 . 0 i 0.1 x 10⁹
carbonate
Phthalonitrile D M F TBAP 12.70 42 0.98 1 . 2 i 0 . 1 x 10⁹
a The second moment's units are (gauss)z. b The rate constant's units are liters/(mole second). Dimethylformamide. Acetonitrile. e Dimethyl sulfoxide. f Tetrabutylammonium perchlorate.
used. Johnson and H ~ l z ~ ~ found that the true line width was approximated within 1 % by the fast exchange expression for the radicals with X - 0 up to Z = 0.30, showing that the correction to the fast exchange ex- pression is indeed valid for larger 2 values when X is small and that no additional corrections need be intro- duced. The same second moment was used when analyzing the data in other solvents. This was done since there was essentially no difference between the high resolution spectra obtained in dimethylformamide and dioxane.
Table I1 summarizes the data for the cation radicals studied and Table I11 presents the anion radical data. Those systems for which no correlation coefficient is shown were treated by the extended equation. The reference column gives the source of the hyperfine splitting constants used to calculate various mo- ments. 40-45
Exchange rates determined in identical solvents have previously been reported for two of these molecules, stilbene and N,N,N',N'-tetramethyl-p-phenylenedi-
(40) Interpretation of high-resolution spectrum obtained during Results differed slightly from other workers, Le., course of this work.
ref 24c,d, 41. (41) P. D. Sullivan, J . Amer. Chem. Soc., 90,3618 (1968). (42) P. H . Rieger, I . Bernal, W. H. Reinmuth, and G. K. Fraenkel,
(43) A. Lomax, private communication. (44) R. Gerdil and E. A. C. Lucken, J . Amer. Chem. Soc., 87, 213
ibid., 85,683 (1963).
(1965). ~ (45j A. E. J. Forno, M. E. Peover, and R. Wilson, Trans. Faraday Soc., 66,1322 (1970).
0 1.0 2.0 l M - l l
Figure 2. Fast exchange plot for benzonitrile anion
amine, and those results should be compared. Correct analysis of the stilbene data definitely required the extended equation, changing the rate constant from 1.3 X lo9 for the fast exchange approximation to 1.0 X lo9 for the extended equation, the difference being larger than the experimental error. This value is in good agreement with the value of 1.04 X lo9 obtained by Peover, et a1.,45 using the fast exchange limit in the same solvent at the same concentration of supporting electro- lyte. The only minor difference was their use of tetrabutylammonium iodide. This result, in fact, verifies their rate constant which was obtained using a straight line drawn through two points, only one of
Kowert, Marcoux, Bard Reactions of Aromatic Anion and Cation Radicals
5544
which was rigorously in the fast exchange limit. They also reported a slow exchange rate constant of 1.02 X
The Wurster’s Blue cation also required use of the extended equation, giving a rate constant of (1.0 + 0.2) X lo9. This differs by more than experimental error from the value (2.0 + 1.0) X los determined by Johnson lo using nuclear magnetic resonance. How- ever, he notes that the error in his calculations is large because Wurster’s Blue is a fairly poor example to use for the approximations he employed to obtain his rate constant from experimental data.
Discussion One of the main
objectives of this research was to study systematically a group of related compounds under similar conditions and interpret the change in electron-transfer rate con- stant from molecule to molecule in terms of the elec- tronic structure of the species involved. Two groups of compounds have been examined that provide suffi- cient data for interpretation and speculation.
The first group contains the cation radicals of phenothiazine, 10-methylphenothiazine, phenoxazine, and phenoxathin. The second, larger group comprises the anions of benzonitrile, phthalonitrile, terephthalo- nitrile, pyromellitonitrile, 4-cyanopyridine, o-tolunitrile, m-tolunitrile, and p-tolunitrile. The anions of dibenzo- furan and dibenzothiophene have also been studied and where possible will be compared with the nitrile anions.
Other workers have correlated electron-transfer rate constants with some property of the solvent. Adams and coworkers4 studied the nitrobenzene anion in the mixed solvent DMF--H20, as well as a series of sub- stituted nitrobenzenes in dry DMF. The general trend observed was that as the nitrogen coupling constant decreased, the electron-transfer rate constant increased. They tentatively suggested “that the more highly localized the unpaired electron perhaps the less effective are collisions in terms of orbital overlap leading to electron t r a n ~ f e r . ” ~ Hirota, Carraway, and Schook6 studied the electron- and atom-transfer re- actions of the naphthalene anion radical prepared by reduction with a variety of alkali metals in ethereal sol- vents. They showed that the rate constants for both the tight and loose ion pairs increase with increasing temperature but when rapid interconversion between the two takes place, the apparent rate constant may increase with decreasing temperature.
While Hirota’s studies6 coupled with the earlier work of Zandstra and Weissman5 and Ward and Weissman3 have shown ion pairing to have marked effects on electron-transfer rate constants, it will not be invoked here to explain differences in rate between the related compounds in the two groups. This is because our measurements for the two groups of compounds, including the solvent studies for benzonitrile with the exception of dioxane, have been made in solvents of high dielectric constant with the same concentration of tetraalkylammonium perchlorates. Conflicting re- p o r t ~ ~ ~ ’ ~ ’ exist concerning the existence of a tetraalkyl- ammonium ion effect upon hyperfine coupling con-
109.
Correlation of Rate and Structure.
(46) T. Kitagawa, T. Layloff, and R. N. Adams, Anal. Chem., 36,
(47) J. Oakes and M. C. R. Symons, Chem. Commun., 244 (1968). 925 (1964).
stants. However, it is clear that this effect is not conventional ion pairing. 47 The butyl derivative was used for all anion radicals while the ethyl derivative was used for all cations except Wurster’s Blue. For the phenoxazine cation radical both were used, with the esr line widths being mutually consistent.
In the following discussion two general types of correlation will be used. One deals with a property of an entire molecule such as electrochemical reduction potential or the energy of a particular molecular orbital while the other is concerned with the role of specific atoms or groups of atoms within the radical.
The electron involved in the electron-transfer re- actions of the anion radicals considered here resides in the lowest lying antibonding orbital while that for the cations is in the highest occupied bonding orbital. The ability of a neutral parent to accept an electron should be a measure of the rate constant for the anion radicals while the ease by which an electron can be removed from a neutral parent should be indicative of the relative electron-transfer rates for cation radicals.
This immediately suggests several quantities which can be measured or calculated which can be correlated with the electron-transfer rate constants. The ability of a molecule to accept an electron is related to its electron affinity which in simple molecular orbital theories is set equal to the negative energy of the lowest lying unoccupied orbital of the parent molecule. Since the same theory predicts a correlation between half-wave potentials for electrochemical reduction and the energy of the pertinent molecular orbital,48 the rate constant for anion radicals should be correlated with this energy as well as the half-wave potential. Similar arguments should apply to cation systems and oxidation potentials. 48
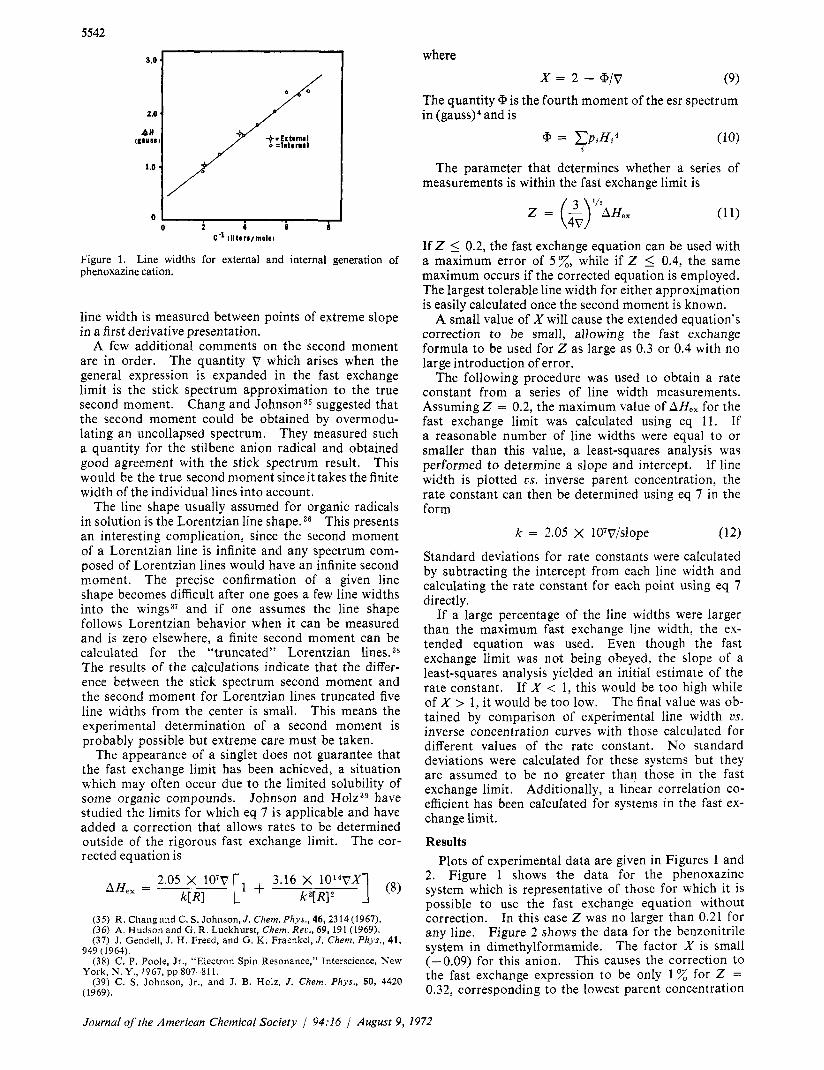
The phenothiazine and related cations will be con- sidered first. Table IV gives the HMO energy of the
highest occupied orbital in units of and the electro- chemical half-wave potential. In Figure 3 the electron- transfer rate constants are plotted us. these quantities. The HMO energies were calculated using the parameters employed by Bolton and Sullivan.49 The electrode potentials for phenothiazine and lo-methylphenothi- azine are given by Billon,24a that of phenoxathiin by Cauquis, et al.,jQ and the phenoxazine value was ob- tained in the course of this study.
The correlations are actually quite good and indicate that the energy required to remove the electron from the
Chemists,” Wiley, New York, N. Y., 1961.
( 1969).
(48) A. Streitweisser, Jr., “Molecular Orbital Theory for Organic
(49) P. D. Sullivan and J. R. Bolton, J . Magn. Resonance, 1, 356
’ (50) C. Barry, G. Cauquis, and M. Maurey, Bull. Soc. Chim. Fr., 2510 (1966).
Journal of the American Chemical Society 1 94:16 1 August 9, 1972
10.01
0
log k 0
9.01
9.2 ,::j 8.8 O
0
0
0
5545
00
8
E HMO
log k ‘4: 9.0
8.5 0.5 0.7 0.9 1.1 1.3
E + V vs.SCE
Figure 3. Molecular correlations for cations.
parent may play a key role in determining the electron- transfer rate constant for cation radicals. This is especially encouraging since this is the first systematic study of a series of cation radicals.
Correlation is also possible with ionization potentials and the agreement is again good also with the exception of Wurster’s Blue. Bloor, et a1.,j1 give the experi- mental ionization potential of Wurster’s Blue cation to be 6.50 eV, which with its rate constant of 1.0 X lo9 does not correlate with the phenothiazine compounds. No data were available for the Wurster’s Red cation. Since there is a major structural difference between the Wurster’s salts and the phenothiazines, the use of a simple one-parameter correlation may not be adequate.
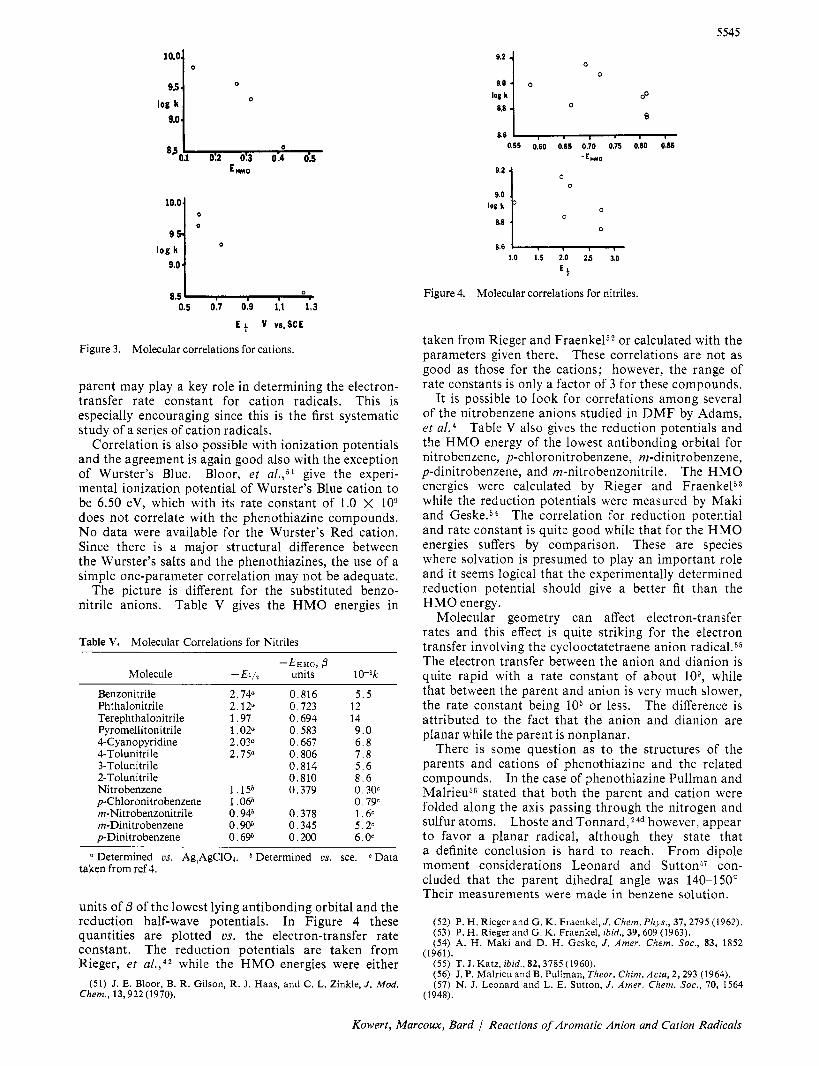
The picture is different for the substituted benzo- nitrile anions. Table V gives the HMO energies in
a Determined cs. Ag!AgC1O4. * Determined us. sce. Data taken from ref 4.
units of /3 of the lowest lying antibonding orbital and the reduction half-wave potentials. In Figure 4 these quantities are plotted us. the electron-transfer rate constant. The reduction potentials are taken from Rieger, et al . ,42 while the HMO energies were either
Chem., 13,922(1970). (51) J. E. Bloor, B. R. Gilson, R. 1 . Haas, and C. L. Zinkle, J . Mod.
, I S . . . _ _ 0.55 0.60 0.65 0.70 0.75 0.80 0.85
E HMO
0
8.6 I-
E f
1.0 1.5 2.0 2.5 3.0
Figure 4. Molecular correlations for nitriles.
taken from Rieger and Fraenke152 or calculated with the parameters given there. These correlations are not as good as those for the cations; however, the range of rate constants is only a factor of 3 for these compounds.
It is possible to look for correlations among several of the nitrobenzene anions studied in DMF by Adams, et al.4 Table V also gives the reduction potentials and the HMO energy of the lowest antibonding orbital for nitrobenzene, p-chloronitrobenzene, m-dinitrobenzene, p-dinitrobenzene, and m-nitrobenzonitrile. The HMO energies were calculated by Rieger and Fraenkelj while the reduction potentials were measured by Maki and Geske.j4 The correlation for reduction potential and rate constant is quite good while that for the HMO energies suffers by comparison. These are species where solvation is presumed to play an important role and it seems logical that the experimentally determined reduction potential should give a better fit than the HMO energy.
Molecular geometry can affect electron-transfer rates and this effect is quite striking for the electron transfer involving the cyclooctatetraene anion radical.55 The electron transfer between the anion and dianion is quite rapid with a rate constant of about lo9, while that between the parent and anion is very much slower, the rate constant being 10j or less. The difference is attributed to the fact that the anion and dianion are planar while the parent is nonplanar.
There is some question as to the structures of the parents and cations of phenothiazine and the related compounds. In the case of phenothiazine Pullman and M a l r i e ~ ~ ~ stated that both the parent and cation were folded along the axis passing through the nitrogen and sulfur atoms. Lhoste and Tonnard, 24d however, appear to favor a planar radical, although they state that a definite conclusion is hard to reach. From dipole moment considerations Leonard and Suttonj’ con- cluded that the parent dihedral angle was 140-150” Their measurements were made in benzene solution.
(52) P. H. Rieger and G. K. Fraenkel, J . Chem. Phys., 37,2795 (1962). (53) P. H. Rieger and G. K. Fraenkel, ibid., 39,609 (1963). (54) A. H. Maki and D. H. Geske, J . Amer. Chem. SOC., 83, 1852
(55) T. J. Katz, ibid., 82,3785 (1960). (56) J. P. Malrieu and B. Pullman, Theor. Chim. Acta, 2,293 (1964). (57) N. J. Leonard and L. E. Sutton, J . Amer. Chem. Soc., 70, 1564
(1961).
(1948).
Kowert, Marcoux, Bard 1 Reactions of Aromatic Anion and Cation Radicals
5546
Two studies of phenothiazine in charge-transfer com- plexes also have bearing on its geometry. An X-ray analysis by Fritchie5* of the complex with 1,3,5-trinitro- benzene revealed it to be nonplanar with a dihedral angle of 165-172”. Bloor, et U Z . , ~ ’ found good agree- ment between ionization potentials obtained from the charge-transfer complexes mentioned earlier and that calculated assuming a planar geometry using the Pariser-Pople-Parr method. Since phenothiazine is the electron donor in both complexes, its structure in the complex may be different from that of the parent and closer to that of the cation. The reason for Bloor’s good agreements’ could be that in the complex a planar or near-planar sturcture exists but this same structure might not be the case for the free molecule in solution,
The electron-transfer rate constant for phenothia- zine is quite large, 6.7 X lo9, which would seem to in- dicate that any difference between its structures, geom- etrically or energetically, is small. While 10-methyl- phenothiazine and phenoxazine have not been the sub- ject of as much study, similar arguments would seem to apply since they too have fairly large rate constants. It should be noted that crystalline phenoxazine is planar.59 This would not necessarily be so in the liquid phase but it would seem less distorted than the molecules con- taining sulfur atoms.59 In fact, Bloor, et uI.,~’ have shown that the dipole moment of phenoxazine can be explained in terms of a planar structure.
Phenoxathiin has a rate constant of only 3 X 10⁸. The dihedral angle of 138” for the parent was measured by Le FevreGo and coworkers in benzene and carbon tetrachloride solutions. This is considerably more folded than phenothiazine and phenoxazine and the difference may result from a greater geometric differ- ential between the parent and the radical.
The majority of radicals and parents studied here are polar ; the electron-transfer reaction can then be characterized as taking place between dipolar species. It is also a reaction between an ion and a dipole. These two types of reaction have been discussed by several authors61162 and so only a brief summary is given now.
In a solution with macroscopic dielectric constant D , the potential energy between an ion and a dipole is given by
u = zep cos eIDr2 where p is the permanent dipole moment, ze is the ionic charge, and the orientation of the ion and dipole is specified by
(13)
0.2 /
The direction of the dipole moment vector is from the partial positive to the partial negative charge. For an anion z is negative and the potential energy has its maximum attractive value when 6 = 0.
The potential energy for two dipoles in a solvent with macroscopic dielectric constant D is an attractive max-
(58) C. J. Fritchie, Jr.,J. Chem. SOC. A , 1328(1969). (59) S . Hosoya, Acta Crysrallogr., 16,310(1963). (60) M. J. Aroney, G. M. Hoskins, and R. J. W. Le Fevre, J . Chem.
(61) E. A. Moelwyn-Hughes, “The Kinetics of Reactions in Solu-
(62) S. W. Benson, “The Foundations of Chemical Kinetics,” Mc-
SOC. B, 960(1969).
tions,” Oxford Press, Clarendon, 1947.
Graw-Hill, New York, N. Y., 1960.
imum when the two dipoles are aligned head to tail and is given by
u= -2p1p2/Dr3 (14) Regardless of whether a cation-dipole/parent-dipole or anion-dipole/parent-dipole pair is involved, the orientation for maximum attractive potential will be head-tail and is the sum of eq 13 and 14.
E = - p de + 2p2/r)lDr2 (15) For p1 = p2 = 4 0 , r = 4 A, and D = 35, the total interaction energy for the two terms gives an energy of about 1 .O kcal/mol, with the ion-dipole term account- ing for about two-thirds of the total.
As a consequence of these interactions, the head-tail configuration for dipolar radicals and parents is assumed to give a preferred orientation for electron transfer. The dipole moment of benzonitrile, 3.9D,‘j3 is directed toward the nitrogen. This is also true of the tolu- nitriles because the dipole moment of toluene, 0.37- D,63 is much smaller than that of benzonitrile. For 4-cyanopyridine the total dipole moment likewise points out along the nitrile group. The dipole moment for phthalonitrile points out between the two nitrile groups.
The electron transfer then takes place between the nitrile group of the ion and the ring position of the parent to which it is directed by the dipole-dipole in- teraction. The logarithm of the rate constant is then assumed to be proportional to the sum of the spin densities on the nitrile group and the ring position.
The pertinent ring position for most of the parents is the position para with respect to the nitrile group, i .e.
@ C E N D C G N
The spin density at this position is usually the largest of the ring atoms except for the one to which the nitrile group is attached. The lineup for phthalonitrile, how- ever, would be
(gN \ N @fN \ N
with two nitrile groups assumed interacting with two ring positions.
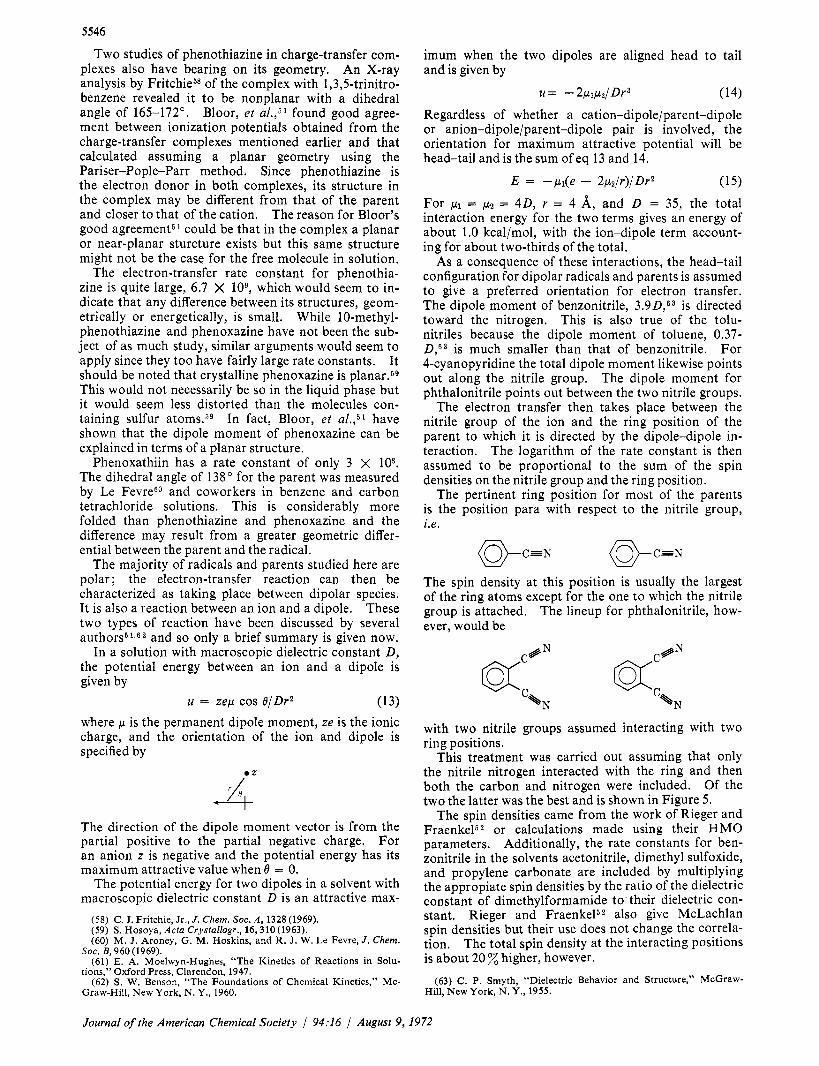
This treatment was carried out assuming that only the nitrile nitrogen interacted with the ring and then both the carbon and nitrogen were included. Of the two the latter was the best and is shown in Figure 5.
The spin densities came from the work of Rieger and FraenkelS2 or calculations made using their HMO parameters. Additionally, the rate constants for ben- zonitrile in the solvents acetonitrile, dimethyl sulfoxide, and propylene carbonate are included by multiplying the appropiate spin densities by the ratio of the dielectric constant of dimethylformamide to their dielectric con- stant. Rieger and Fraenkelj2 also give McLachlan spin densities but their use does not change the correla- tion. The total spin density at the interacting positions is about 2 0 z higher, however.
(63) C. P. Smyth, “Dielectric Behavior and Structure,” McGraw- Hill, New York, N. Y., 1955.
Journal of the American Chemical Society / 94:16 / August 9, 1972
5547
8.6 -
O I
A 0 0: Nitrile Group plus
Ring Carbon
0.30 0.40 0.50 0860 Spin k n t l t y Sum
Figure 5. Dipolar correlation for nitriles using nitrile nitrogen and carbon.
The same type of correlation should apply to diben- zofuran, dibenzothiophene, and the 1 ,Cnaphthoquinone anion studied by ad am^.^ These molecules were in- cluded in the correlation shown. The anions of ter- ephthalonitrile and pyromellitonitrile were not included since their molecular dipole moments are zero. None- theless, it is interesting that a simple physical model gives an adequate correlation between electron-transfer rate constants and spin densities of atoms dictated by the model in systems where it is applicable.
The same dipolar model can also be used for the phenothiazine-like cation radicals. The lineup would be
H
a:m but exactly which atoms are involved will depend on the geometry of the radical and parent. If geometric differences are small, all the atoms joined by arrows would be considered while if the geometric differences were large, only the heteroatoms would be important. The former gives better agreement, giving the correct order of rate constants and a straight line, except for 10-methylphenothiazine which is predicted to be as fast as phenothiazine. The latter predicts the order 10- methylphenothiazine > phenoxazine > phenothiazine > phenoxathiin.
For phenoxathiin approximately 90% of the spin density of interaction between the two molecules is contained on the sulfur and oxygen atoms5* and if the difference in structure between parent and cation were the largest of the cations, the value for its large geo- metrical difference would still correlate well with that for the other molecules with small geometrical differ- ences.
The approach used here suggests that the rate-con- trolling factor in electron transfer might not be “delocal- ization” as orignally proposed by ad am^.^ In our case the pertinent spin densities are those of the parent and radical atoms nearest each other in the preferred orientation. These can be large without an “even” electron distribution which “delocalization” implies.
log k 119 9*1L 8.7
1.0 1.5 2.0 25 c lgrusr,
Figure 6. Nitrogen coupling constant correlation.
9.2 4 A 0
0
logst 1 A k A A 8 0
8.8 A:Nitrile Group
However, the electron density at a given position has a better chance of being larger if the electron distribu- tion is uniform. Additionally, using “localization” and/or “delocalization” as standards for the rates of electron-transfer reactions can be misleading. For example, in the solvated nitro anions the spin density on the nitro group is quite high and if the spin density there increases, a decrease in rate constant usually occurs. One cannot say that the slower electron-transfer rate takes place through the more tightly solvated nitro group since it is also possible that the electron transfer occurs from the ring, where the spin density has de- creased.
The above, however, should not be taken to mean that spin-density type correlations are not possible, and in fact in the following it will be seen that one may, with care, correlate these rates quite satisfactorily with spin densities.
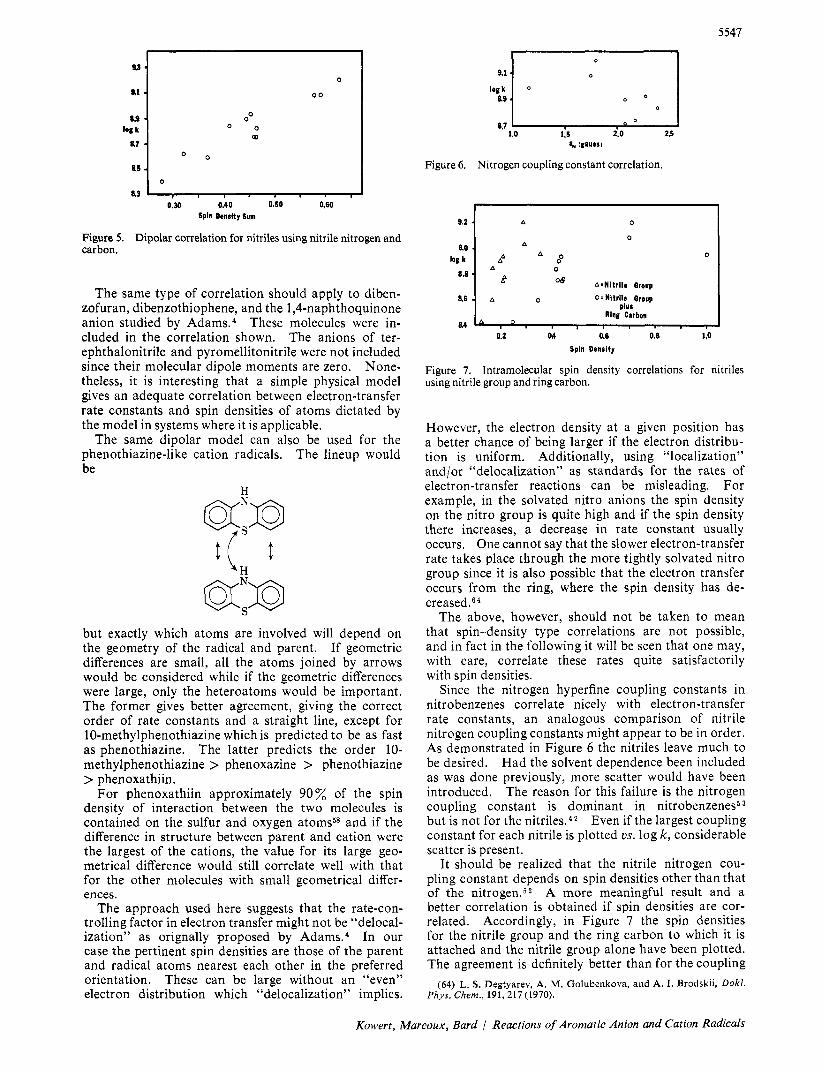
Since the nitrogen hyperfine coupling constants in nitrobenzenes correlate nicely with electron-transfer rate constants, an analogous comparison of nitrile nitrogen coupling constants might appear to be in order. As demonstrated in Figure 6 the nitriles leave much to be desired. Had the solvent dependence been included as was done previously, more scatter would have been introduced. The reason for this failure is the nitrogen coupling constant is dominant in nitrobenzenes5 but is not for the nitriles.42 Even if the largest coupling constant for each nitrile is plotted vs. log k, considerable scatter is present.
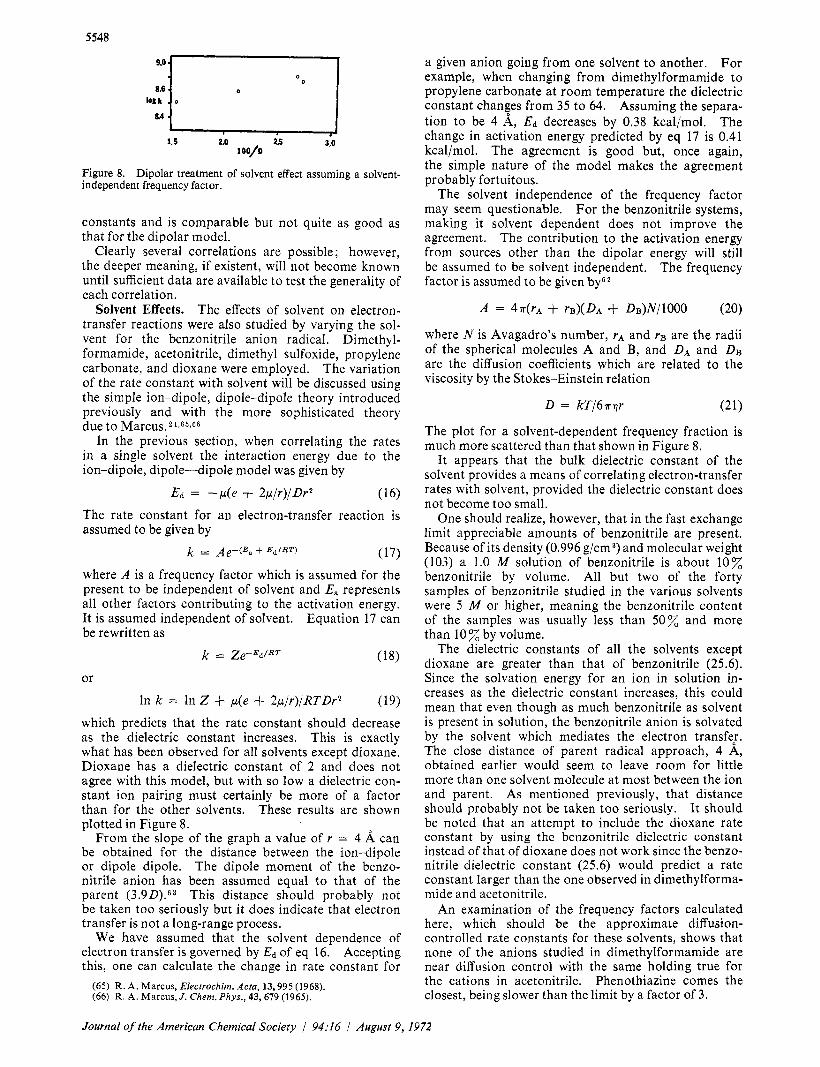
It should be realized that the nitrile nitrogen cou- pling constant depends on spin densities other than that of the nitrogen.52 A more meaningful result and a better correlation is obtained if spin densities are cor- related. Accordingly, in Figure 7 the spin densities for the nitrile group and the ring carbon to which it is attached and the nitrile group alone have been plotted. The agreement is definitely better than for the coupling
(64) L. S. Degtyarev, A. M. Golubenkova, and A. I. Brodskii, Dokl. Phys. Chem., 191,217 (1970).
Kowert, Marcoux, Bard Reactions of Aromatic Anion and Cation Radicals
5548
9.0
I 1.5 2.0 2.5 3,O
1 OO/D
Figure 8. Dipolar treatment of solvent effect assuming a solvent- independent frequency factor.
constants and is comparable but not quite as good as that for the dipolar model.
Clearly several correlations are possible ; however, the deeper meaning, if existent, will not become known until sufficient data are available to test the generality of each correlation.
Solvent Effects. The effects of solvent on electron- transfer reactions were also studied by varying the sol- vent for the benzonitrile anion radical. Dimethyl- formamide, acetonitrile, dimethyl sulfoxide, propylene carbonate, and dioxane were employed. The variation of the rate constant with solvent will be discussed using the simple ion-dipole, dipole-dipole theory introduced previously and with the more sophisticated theory due to Marcus.21,65Jj6
In the previous section, when correlating the rates in a single solvent the interaction energy due to the ion-dipole, dipole-dipole model was given by
Ed = - p ( e + 2p./r)/Dr2 (16) The rate constant for an electron-transfer reaction is assumed to be given by
(17) k = A e - ( E s + E d / R T )
where A is a frequency factor which is assumed for the present to be independent of solvent and E, represents all other factors contributing to the activation energy. It is assumed independent of solvent. Equation 17 can be rewritten as
k = Z e - E d / R T (18)
(19)
or
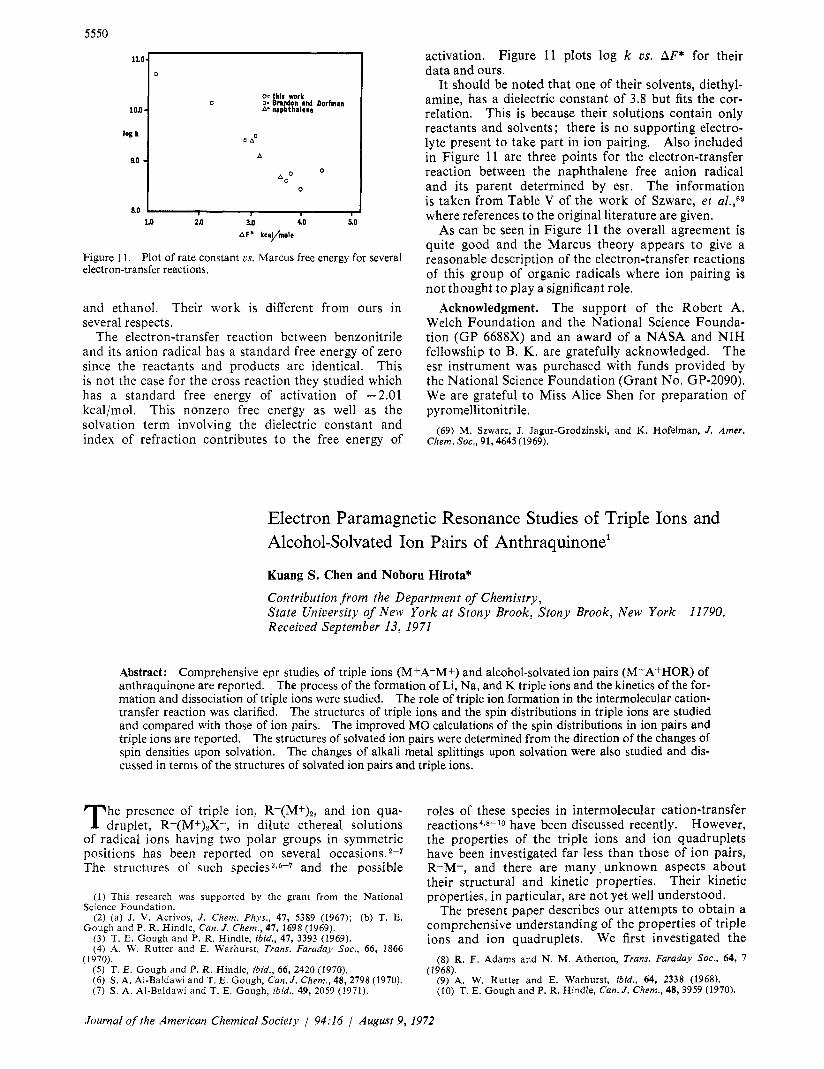
In k = In Z + p(e + 2p./r)/RTDr2
which predicts that the rate constant should decrease as the dielectric constant increases. This is exactly what has been observed for all solvents except dioxane. Dioxane has a dielectric constant of 2 and does not agree with this model, but with so low a dielectric con- stant ion pairing must certainly be more of a factor than for the other solvents. These results are shown plotted in Figure 8.
From the slope of the graph a value of r = 4 A can be obtained for the distance between the ion-dipole or dipole-dipole. The dipole moment of the benzo- nitrile anion has been assumed equal to that of the parent (3.9D).63 This distance should probably not be taken too seriously but it does indicate that electron transfer is not a long-range process.
We have assumed that the solvent dependence of electron transfer is governed by Ed of eq 16. Accepting this, one can calculate the change in rate constant for
(65) R. A. Marcus, Electrochim. Acta, 13,995 (1968). (66) R, A. Marcus, J . Chem. Phys., 43,679 (1965).
a given anion going from one solvent to another. For example, when changing from dimethylformamide to propylene carbonate at room temperature the dielectric constant changes from 35 to 64. Assuming the separa- tion to be 4 A, E d decreases by 0.38 kcal/mol. The change in activation energy predicted by eq 17 is 0.41 kcal/mol. The agreement is good but, once again, the simple nature of the model makes the agreement probably fortuitous.
The solvent independence of the frequency factor may seem questionable. For the benzonitrile systems, making it solvent dependent does not improve the agreement. The contribution to the activation energy from sources other than the dipolar energy will still be assumed to be solvent independent. The frequency factor is assumed to be given by62
A = 4?T(rp, + rB)(DA + D~)N/1000 (20)
where N is Avagadro’s number, rA and rB are the radii of the spherical molecules A and B, and DA and DB are the diffusion coefficients which are related to the viscosity by the Stokes-Einstein relation
D = kT16aqr (21)
The plot for a solvent-dependent frequency fraction is much more scattered than that shown in Figure 8.
It appears that the bulk dielectric constant of the solvent provides a means of correlating electron-transfer rates with solvent, provided the dielectric constant does not become too small.
One should realize, however, that in the fast exchange limit appreciable amounts of benzonitrile are present. Because of its density (0.996 g/cm3) and molecular weight (103) a 1.0 M solution of benzonitrile is about 10% benzonitrile by volume. All but two of the forty samples of benzonitrile studied in the various solvents were 5 M or higher, meaning the benzonitrile content of the samples was usually less than 50x and more than 10 ’% by volume.
The dielectric constants of all the solvents except dioxane are greater than that of benzonitrile (25.6). Since the solvation energy for an ion in solution in- creases as the dielectric constant increases, this could mean that even though as much benzonitrile as solvent is present in solution, the benzonitrile anion is solvated by the solvent which mediates the electron transfe:. The close distance of parent radical approach, 4 A, obtained earlier would seem to leave room for little more than one solvent molecule at most between the ion and parent. As mentioned previously, that distance should probably not be taken too seriously. It should be noted that an attempt to include the dioxane rate constant by using the benzonitrile dielectric constant instead of that of dioxane does not work since the benzo- nitrile dielectric constant (25.6) would predict a rate constant larger than the one observed in dimethylforma- mide and acetonitrile.
An examination of the frequency factors calculated here, which should be the approximate diffusion- controlled rate constants for these solvents, shows that none of the anions studied in dimethylformamide are near diffusion control with the same holding true for the cations in acetonitrile. Phenothiazine comes the closest, being slower than the limit by a factor of 3.
Journal of the American Chemical Society / 94.16 / August 9, 1972
5549
8.8 1 hn o o 0 0
0 0 I
-150
leg h aA
ao liL ao 02 Q - 4'1 0.4 0.6
Figure 9. Plot of rate constants L'S. Marcus dielectric parameter.
The variation of rate constant with solvent can also be used to test the theory of In this theory the rate constant for an activation-controlled electron-transfer reaction is
(22) where AF* is the free energy of activation and Z is a collision number of about 10" l./(mol sec). The free energy of activation is given by
- Z ~ - A F * / R T kaot. -
ur + up X AF' AF* = ~ +-+2+ 2 4
(23) (AF' + up -
4X
where AFo is the standard free energy of reaction, wr and wp are the work necessary to bring together the reactants and products in the activated complex, and X is the solvent reorganization parameter, which is given by
The effective radii of the reactants are al and a2, r is a1 + az, Ae is the difference in charge between the re- actants, Do, is the optical dielectric constant of the solvent, which is the square of its refractive index, and D. is the static dielectric constant.
For the type of electron-transfer reactions we have studied, the standard free energy of reaction is zero and the work terms are small, since one of the reactants is the neutral parent. Even if some model such as the ion-dipole or dipole-dipole interactions were used this would still be small compared to the term involving X. A plot of k VS. X should then yield a straight line.
If the rate constant is near the diffusion-controlled limit, the experimentally observed rate constant is related to that for activation controlled and diffusion controlled by67
k-lobsd = k-ldiff + k- 'act .
and the diffusion-controlled term must be taken into account before a comparison of theory and experiment
(25)
(67) R. A. Marcus, Discuss. Faraday Soc., 29,129 (1960).
ao a2 Od 0.6
Gi- 0;'
Figure 10. assuming the frequency factor is solvent dependent.
Plot of rate constant us. Marcus dielectric parameter
for the activation-controlled term can be made. In Table VI the dielectric parameter D-lOp - D-lS and
the various rate constants are given. In Figure 9 both kobsd and kaCt. are plotted US. the dielectric param- eter.
In fact the trend is the reverse of what might be expected. As E l o p - D-lS decreases, the rate constant is predicted to increase but our data show a decrease as the parameter decreases.
The agreement can be improved by making the fre- quency factor 2 solvent dependent. This is contrary to the Marcus theory but is included since the correla- tion is considerably better than the other two. In Figure 10 log kobsd - log kdirf is plotted us. D-lOp - D-lS and the improved agreement can be readily seen. If a straight line is drawn through the four points ex- cluding dioxane, the slope can be used to determine the radius of the reactant, assuming a1 = a2 = a. At room temperatye the slope is about -7 and a distance of r = a of 4.4 A is obtained. This means the separa- tion of the Ladical and parent in the activated complex is about 9 A, which is larger than the separation ob- tained for the dipolar model.
It would appear that Marcus theory as originally postulated does not give adequate agreement with ex- periment and that additional parameters need to be introduced to obtain agreement considering only our data. However, if it is considered with the results of other determinations of electron-transfer rate constants, the introduction of a solvent-dependent frequency factor is unnecessary.
Brandon and Dorfman68 studied the electron-transfer reaction between the pyrene anion radical and 9,lO- dimethylanthracene using pulse radiolysis techniques in the solvents diethylamine, ethylenediamine, 2-propanol,
The agreement is not good.
(68) L. M. Dorfman and J. R. Brandon, J . Chem. Phys., 53, 3849 (1970).
Kowert, Marcoux, Bard / Reactions of Aromatic Anion and Cation Radicals
5550
D l a= this w r k 0 s Brandon and Dorfman A. naphthalene
0 O A
A
0
ao I I
1.0 2.0 36 4.0 5.0
AF' kcavmolc
Figure 11. electron-transfer reactions.
Plot of rate constant us. Marcus free energy for several
and ethanol. Their work is different from ours in several respects.
The electron-transfer reaction between benzoniirile and its anion radical has a standard free energy of zero since the reactants and products are identical. This is not the case for the cross reaction they studied which has a standard free energy of activation of -2.01 kcal/mol. This nonzero free energy as well as the solvation term involving the dielectric constant and index of refraction contributes to the free energy of
activation. Figure 11 plots log k us. AF* for their data and ours.
It should be noted that one of their solvents, diethyl- amine, has a dielectric constant of 3.8 but fits the cor- relation. This is because their solutions contain only reactants and solvents ; there is no supporting electro- lyte present to take part in ion pairing. Also included in Figure 11 are three points for the electron-transfer reaction between the naphthalene free anion radical and its parent determined by esr. The information is taken from Table V of the work of Szwarc, et a1.,69 where references to the original literature are given.
As can be seen in Figure 11 the overall agreement is quite good and the Marcus theory appears to give a reasonable description of the electron-transfer reactions of this group of organic radicals where ion pairing is not thought to play a significant role.
Acknowledgment. The support of the Robert A. Welch Foundation and the National Science Founda- tion (GP 6688X) and an award of a NASA and NIH fellowship to B. K. are gratefully acknowledged. The esr instrument was purchased with funds provided by the National Science Foundation (Grant No. GP-2090). We are grateful to Miss Alice Shen for preparation of pyromellitonitrile.
(69) M. Szwarc, J . Jagur-Grodzinski, and K. Hofelman, J . Amer. Chem. SOC., 91,4645 (1969).
Electron Paramagnetic Resonance Studies of Triple Ions and Alcohol-Solvated Ion Pairs of Anthraquinone'
Kuang S. Chen and Noboru Hirota*
Contribution from the Department of Chemistry, State University of New York at Stony Brook, Stony Brook, New York 11790. Received September 13, 1971
Abstract: Comprehensive epr studies of triple ions (M+A-M+) and alcohol-solvated ion pairs (M+A+HOR) of anthraquinone are reported. The process of the formation of Li, Na, and K triple ions and the kinetics of the for- mation and dissociation of triple ions were studied. The role of triple ion formation in the intermolecular cation- transfer reaction was clarified. The structures of triple ions and the spin distributions in triple ions are studied and compared with those of ion pairs. The improved MO calculations of the spin distributions in ion pairs and triple ions are reported. The structures of solvated ion pairs were determined from the direction of the changes of spin densities upon solvation. The changes of alkali metal splittings upon solvation were also studied and dis- cussed in terms of the structures of solvated ion pairs and triple ions.
he presence of triple ion, R-(M+),, and ion qua- T druplet, R-(M+)2X-, in dilute ethereal solutions of radical ions having two polar groups in symmetric positions has been reported on several occasions. 2-7
The structures of such s p e c i e ~ ~ , ~ - ~ and the possible
(1) This research was supported by the grant from the National Science Foundation.
(2) (a) J. V. Acrivos, J . Chem. Phys., 47, 5389 (1967); (b) T. E. Gough and P. R. Hindle, Can. J . Chem., 47, 1698 (1969).
(3) T. E. Gough and P. R. Hindle, ibid., 47, 3393 (1969). (4) A. W. Rutter and E. Warhurst, Trans. Faraday SOC., 66, 1866
( 5 ) T. E. Gough and P. R. Hindle, ibid., 66, 2420 (1970). (6) S. A. AI-Baldawi and T. E. Gough, Can. J . Chem., 48,2798 (1970). (7) S. A. AI-Baldawi and T. E. Gough, ibid., 49, 2059 (1971).
(1970).
roles of these species in intermolecular cation-transfer r eac t ion~~ ,+~o have been discussed recently. However, the properties of the triple ions and ion quadruplets have been investigated far less than those of ion pairs, R-M+, and there are many.unknown aspects about their structural and kinetic properties. Their kinetic properties, in particular, are not yet well understood.
The present paper describes our attempts to obtain a comprehensive understanding of the properties of triple ions and ion quadruplets. We first investigated the
(8) R. F. Adams and N. M. Atherton, Trans. Faraday SOC., 64, 7
(9) A. W. Rutter and E. Warhurst, ibid., 64, 2338 (1968). (10) T. E. Gough and P. R. Hindle, Can. J . Chem., 48, 3959 (1970).
(1968).
Journal of the American Chemical Society / 94:16 / August 9, 1972