1 Finance Division Kaitlyn O’Hagan, Senior Financial Analyst Dohini Sompura, Unit Head Latonia McKinney, Director Nathan Toth, Deputy Director Regina Poreda Ryan, Deputy Director Paul Scimone, Deputy Director Report of the Finance Division on the Fiscal 2020 Preliminary Plan and the Fiscal 2019 Preliminary Mayor’s Management Report for the Department of Education March 20, 2019 THE COUNCIL OF THE CITY OF NEW YORK Hon. Corey Johnson Speaker of the Council Hon. Mark Treyger Chair, Committee on Education
Transcript
1
Finance Division
Kaitlyn O’Hagan, Senior Financial Analyst Dohini Sompura, Unit Head
Latonia McKinney, Director Nathan Toth, Deputy Director Regina Poreda Ryan, Deputy Director Paul Scimone, Deputy Director
Report of the Finance Division on the Fiscal 2020 Preliminary Plan and the
Fiscal 2019 Preliminary Mayor’s Management Report for the
Department of Education
March 20, 2019
THE COUNCIL OF THE CITY OF NEW YORK
Hon. Corey Johnson Speaker of the Council
Hon. Mark Treyger
Chair, Committee on Education
Finance Division Briefing Paper Department of Education
Table of Contents
Department of Education Overview .................................................................................................................. 1
Fiscal 2020 State Executive Budget Highlights .................................................................................................. 9
Council Initiatives ............................................................................................................................................. 11
DOE Budget Risks ............................................................................................................................................. 11
Financial Plan Summary ................................................................................................................................... 14
School Budgets ................................................................................................................................................. 16
Class Size ...................................................................................................................................................... 20
General Education Instruction & School Leadership ....................................................................................... 21
Special Education Instruction & School Leadership......................................................................................... 22
Citywide Special Education & Special Education Instructional Support .......................................................... 25
Related Services........................................................................................................................................... 27
Charter Schools ................................................................................................................................................ 28
Early Childhood Programs................................................................................................................................ 32
School Support Organizations.......................................................................................................................... 33
Special Education Pre-Kindergarten ................................................................................................................ 34
Contract Schools, Carter Cases and Foster Care .............................................................................................. 35
School Food Services ....................................................................................................................................... 40
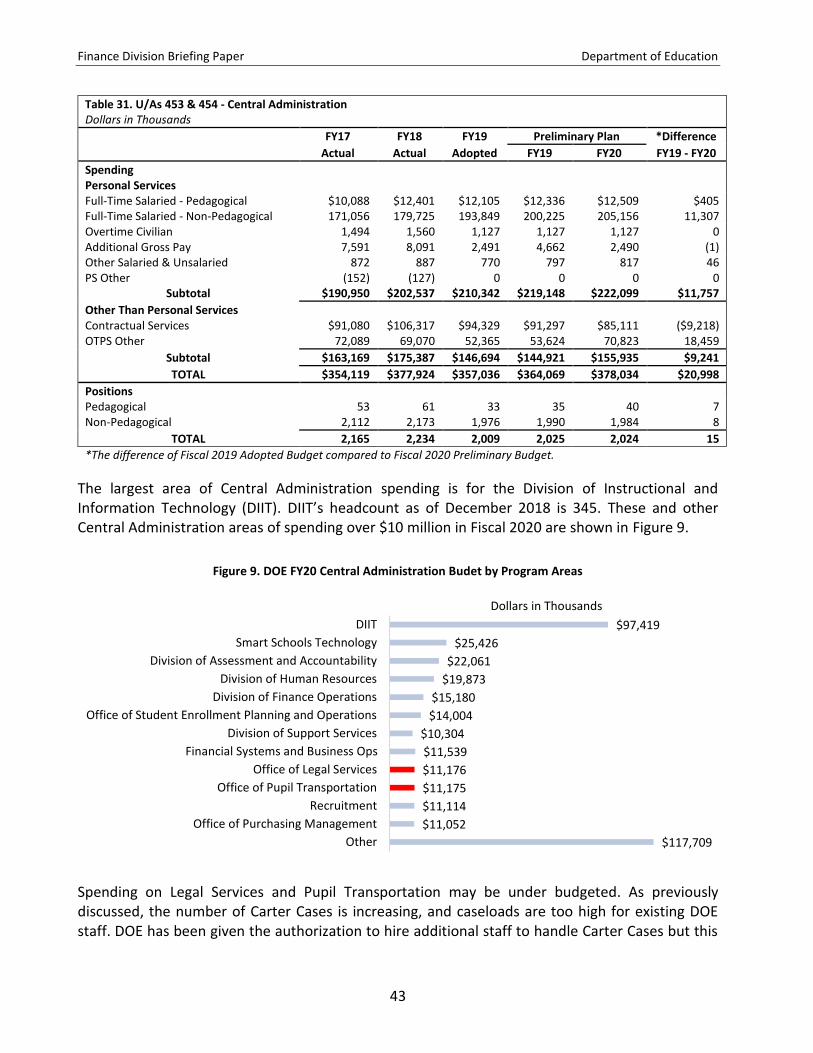
Central Administration..................................................................................................................................... 42
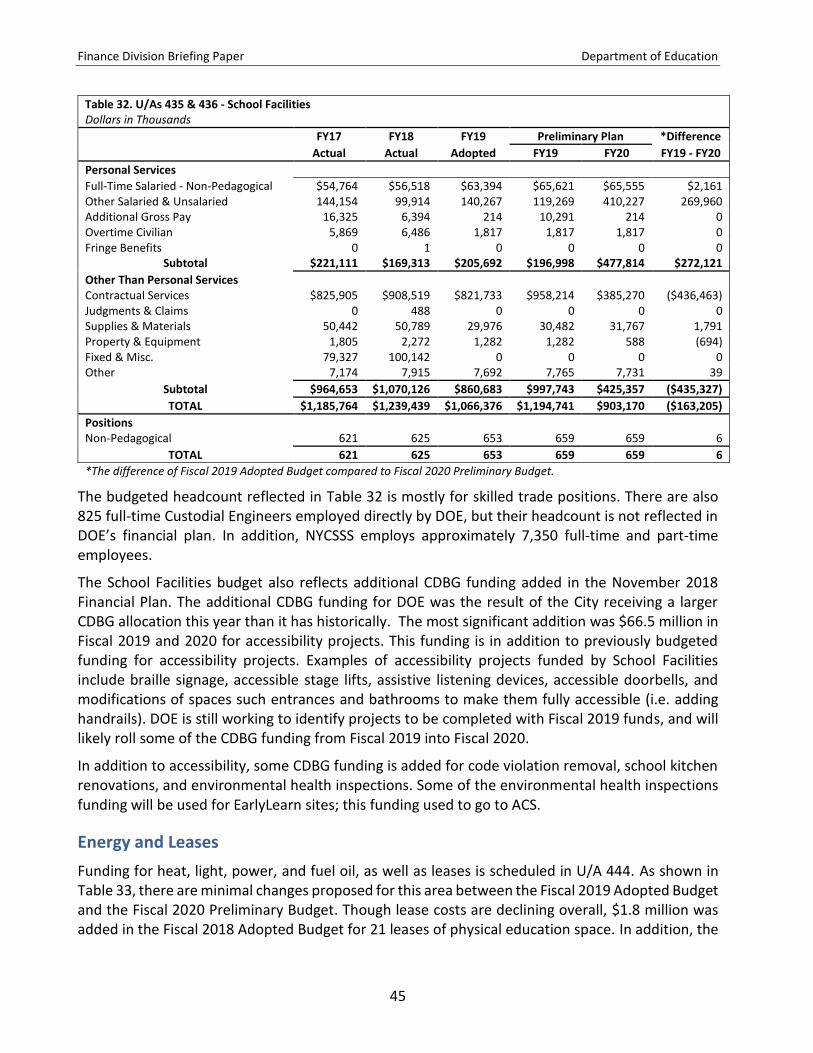
School Facilities ................................................................................................................................................ 44
Energy and Leases ............................................................................................................................................ 45
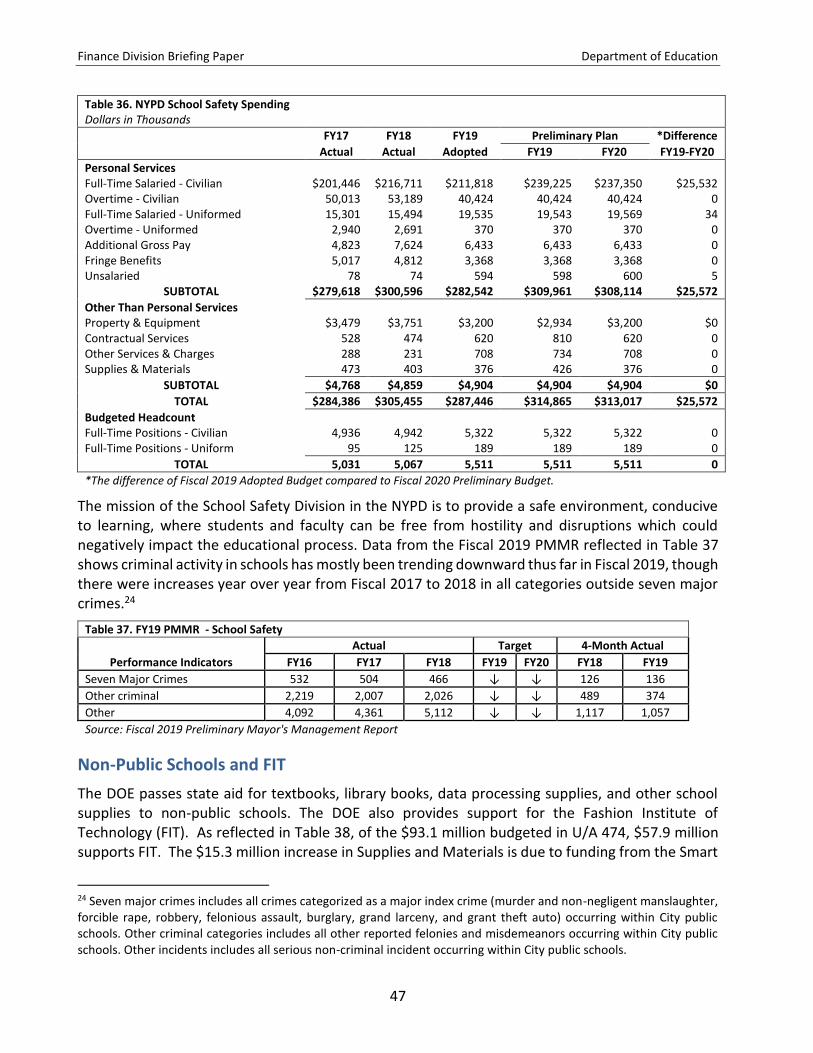
School Safety .................................................................................................................................................... 46
Non-Public Schools and FIT .............................................................................................................................. 47
Finance Division Briefing Paper Department of Education
A. Budget Actions since Fiscal 2019 Adoption ......................................................................................... 49
B. Council Initiatives ................................................................................................................................. 50
C. DOE FY20 Preliminary Contract Budget ............................................................................................... 52
Finance Division Briefing Paper Department of Education
1
Department of Education Overview
The Department of Education (DOE or the Department) provides early, primary, and secondary education to over one million students in New York City. The DOE prepares students to meet grade level standards in reading, writing, and math, and prepares high school students to graduate ready for college and careers.
The Department of Education is responsible for funding the education of students who attend New York City public schools, as well as those who attend charter schools, universal pre-Kindergarten, and 3-K programs in community-based centers, special education pre-schools, and other non-public schools. There are approximately 1,800 public schools in New York City; this includes 235 charter schools. As shown in Figure 1, student enrollment in DOE schools has increased over time, growing from 1.094 million students ages 4-21 in school year 2012-13 to 1.135 million in school year 2017-18. The student body as a whole is diverse, as shown in Figure 2.1
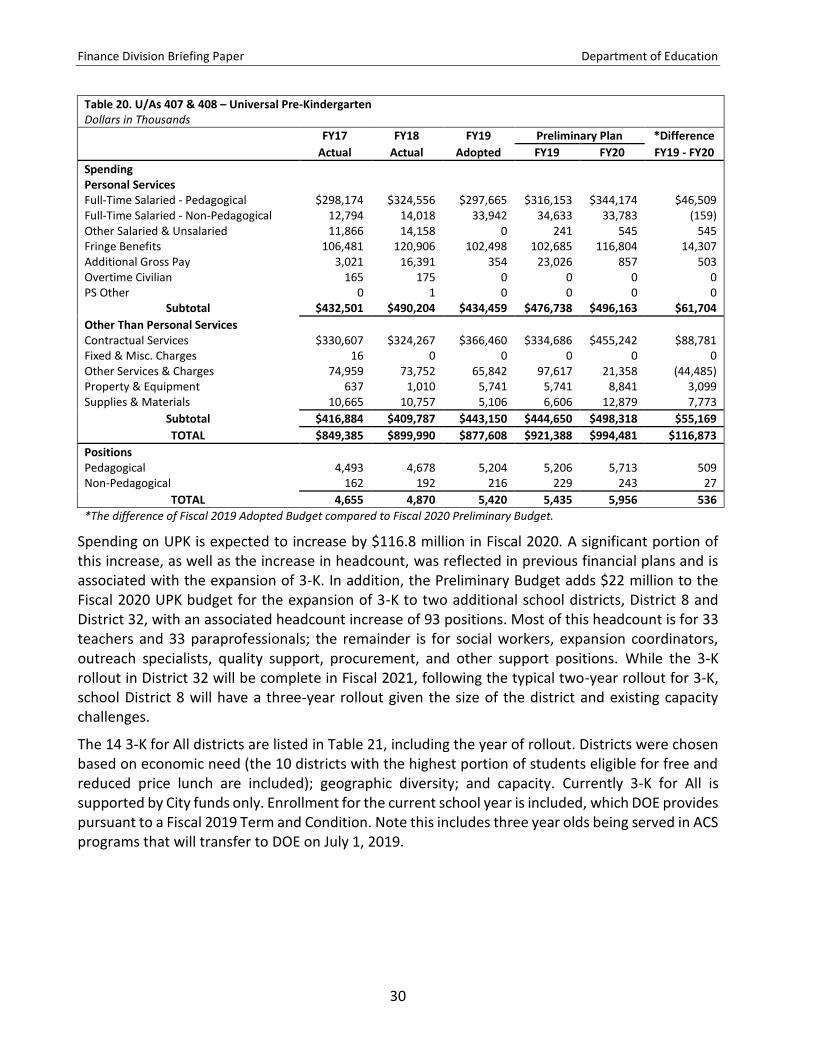
Beginning in Fiscal 2018, the DOE launched a new 3-K initiative, a public pre-school program for three year olds, which currently serves 5,091 students in six school districts.2 3-K will continue to expand through Fiscal 2021, at which point DOE expects to serve approximately 20,000 students across 14 school districts. In addition, beginning in Fiscal 2020, the birth-to-five child care system, including EarlyLearn, will transfer from the Administration for Children’s Services (ACS) to DOE; this will also increase the number of children served by DOE. See page 32 for further discussion of early childhood education at DOE.
1 The New York City Department of Education, NYC Data, Demographic Snapshot 2013-14 to 2017-18. Available at: https://infohub.nyced.org/ 2 3-K Enrollment Fiscal 2019 Term and Condition. Available at: https://council.nyc.gov/budget/fy2019/. This includes three year olds served by ACS programs that will transfer to DOE in Fiscal 2020.
Finance Division Briefing Paper Department of Education
2
This report provides a review of the Department’s $26.9 billion Preliminary Budget for Fiscal 2020. The first section presents an overview of DOE’s Fiscal 2020 Expense Budget, changes made to the budget since Fiscal 2019 adoption, the impact of State budget actions, and discusses significant gaps in DOE’s Fiscal 2020 Preliminary Budget. The report then presents the Department’s budget by units of appropriation (U/A), as well as discussing relevant sections of the Preliminary Mayor’s Management Report (PMMR) for Fiscal 2019. Finally, the Appendix provides changes to the budget included in the November and Preliminary Plans for Fiscal 2019 and 2020 and additional information that is referenced throughout the paper.
The Department’s capital program and $17 billion Proposed Fiscal 2020-2024 Five-Year Capital Plan are discussed in a separate report to the Committee on Education.
Fiscal 2020 Preliminary Budget
The Department of Education’s Fiscal 2020 Preliminary Budget totals $26.9 billion, 29 percent of the City’s total $92.2 billion budget. DOE’s budget does not include City spending on pensions and debt service for DOE; these costs are budgeted separately. Total pension costs for Fiscal 2020 are projected to be $3.98 billion, total debt service is $2.94 billion, health insurance for retired workers is $168 million, and the Stabilization Fund is $12.5 million. The City’s total Fiscal 2020 education-related spending is $33.9 billion, 37 percent of the City’s budget, as reflected in Figure 3. However, since pension and debt service costs are not included in the DOE’s budget, when discussing the Department’s Preliminary Budget we refer to the budget of $26.9 billion.
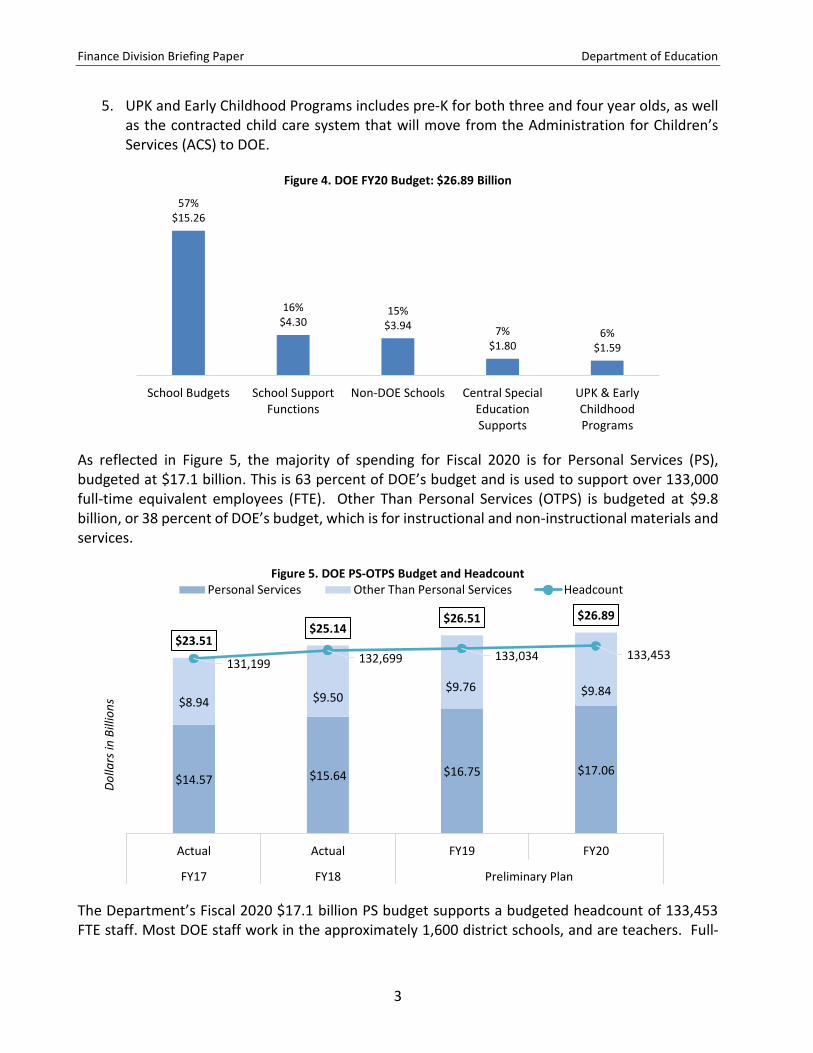
The Department’s budget is categorized into 31 different U/As. In this paper these categories are organized into five major areas of spending in order to guide review and analysis of the Preliminary Fiscal 2020 Budget. The five areas, reflected in Figure 4, are as follows:
1. School budgets includes general education and special education instruction and school leadership, as well as categorical program funding which largely goes to traditional DOE public schools. Figure 4 also includes all DOE fringe costs in school budgets, as school-based staff are associated with the majority of fringe costs.
2. School support functions includes school food, safety, transportation, facilities, school support organizations, and central administration.
3. Non-DOE schools includes special education pre-K, charter schools, and non-public schools.
4. Central Special Education supports includes District 75 schools and related services for students with Individualized Educational Programs (IEPs).
Education-related Spending
37%$33.89B
All Other Spending $58.32B
Figure 3. Education-related Spending is 37% of the $92.2B FY20 Budget
Finance Division Briefing Paper Department of Education
3
5. UPK and Early Childhood Programs includes pre-K for both three and four year olds, as well as the contracted child care system that will move from the Administration for Children’s Services (ACS) to DOE.
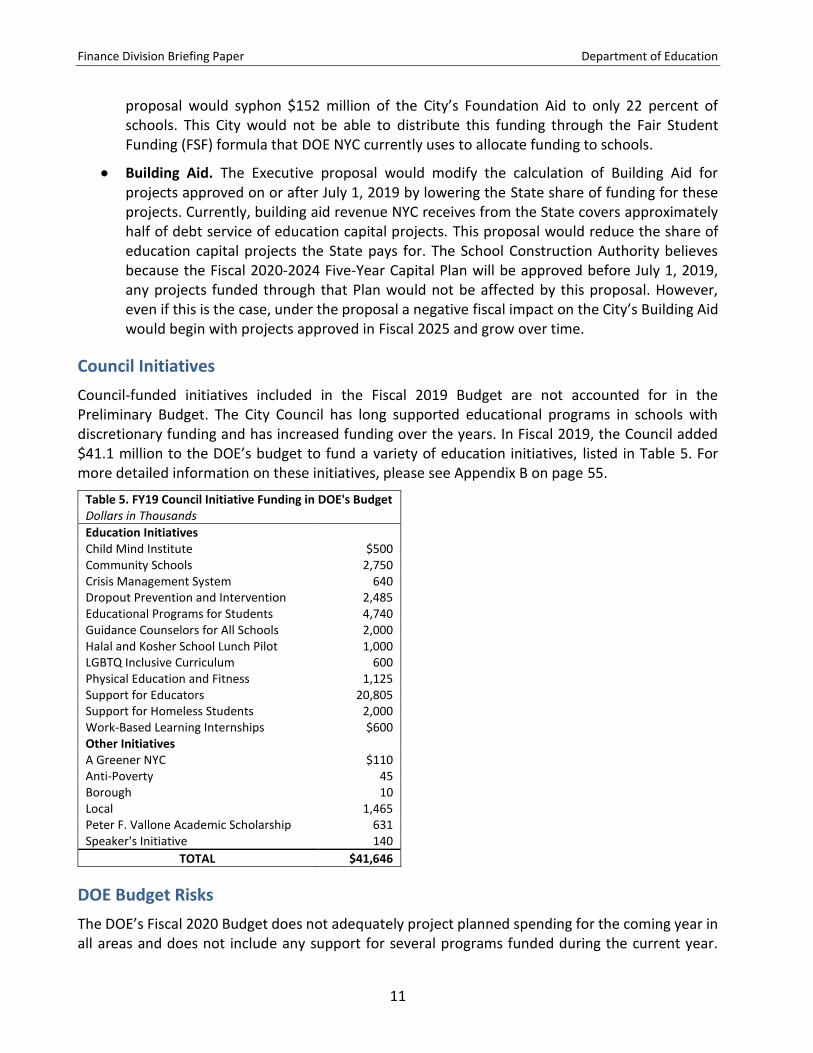
As reflected in Figure 5, the majority of spending for Fiscal 2020 is for Personal Services (PS), budgeted at $17.1 billion. This is 63 percent of DOE’s budget and is used to support over 133,000 full-time equivalent employees (FTE). Other Than Personal Services (OTPS) is budgeted at $9.8 billion, or 38 percent of DOE’s budget, which is for instructional and non-instructional materials and services.
The Department’s Fiscal 2020 $17.1 billion PS budget supports a budgeted headcount of 133,453 FTE staff. Most DOE staff work in the approximately 1,600 district schools, and are teachers. Full-
57%$15.26
16%$4.30
15%$3.94 7%
$1.806%
$1.59
School Budgets School SupportFunctions
Non-DOE Schools Central SpecialEducationSupports
UPK & EarlyChildhoodPrograms
Figure 4. DOE FY20 Budget: $26.89 Billion
$14.57 $15.64 $16.75 $17.06
$8.94 $9.50$9.76 $9.84
$23.51$25.14
$26.51 $26.89
131,199 132,699 133,034 133,453
100,000
105,000
110,000
115,000
120,000
125,000
130,000
135,000
140,000
$0.00
$5.00
$10.00
$15.00
$20.00
$25.00
$30.00
Actual Actual FY19 FY20
FY17 FY18 Preliminary Plan
Do
llars
in B
illio
ns
Figure 5. DOE PS-OTPS Budget and HeadcountPersonal Services Other Than Personal Services Headcount
Finance Division Briefing Paper Department of Education
4
time school-based DOE staff totaled 104,499 as of October 2018, approximately 79 percent of DOE’s Fiscal 2019 budgeted FTE headcount.3 There are approximately 89 different titles for school-based staff. The majority of school-based staff are in teacher titles; other common titles are paraprofessionals, school aids, assistant principal, guidance counselor, and school secretary. Teacher salaries range from $57,845 to $121,862, with an average teacher salary of approximately $87,000 in Fiscal 2019. The teacher salary range will increase on May 14, 2020 to $59,291 to $124,909.4 Increased headcount and increased wages due to collective bargaining agreements account for the increasing PS budget.
The increase in the OTPS budget is due to a variety of changes across program areas. The most significant change is a $112 million increase in spending on charter schools.
November 2018 Financial Plan and Fiscal 2020 Preliminary Budget Highlights
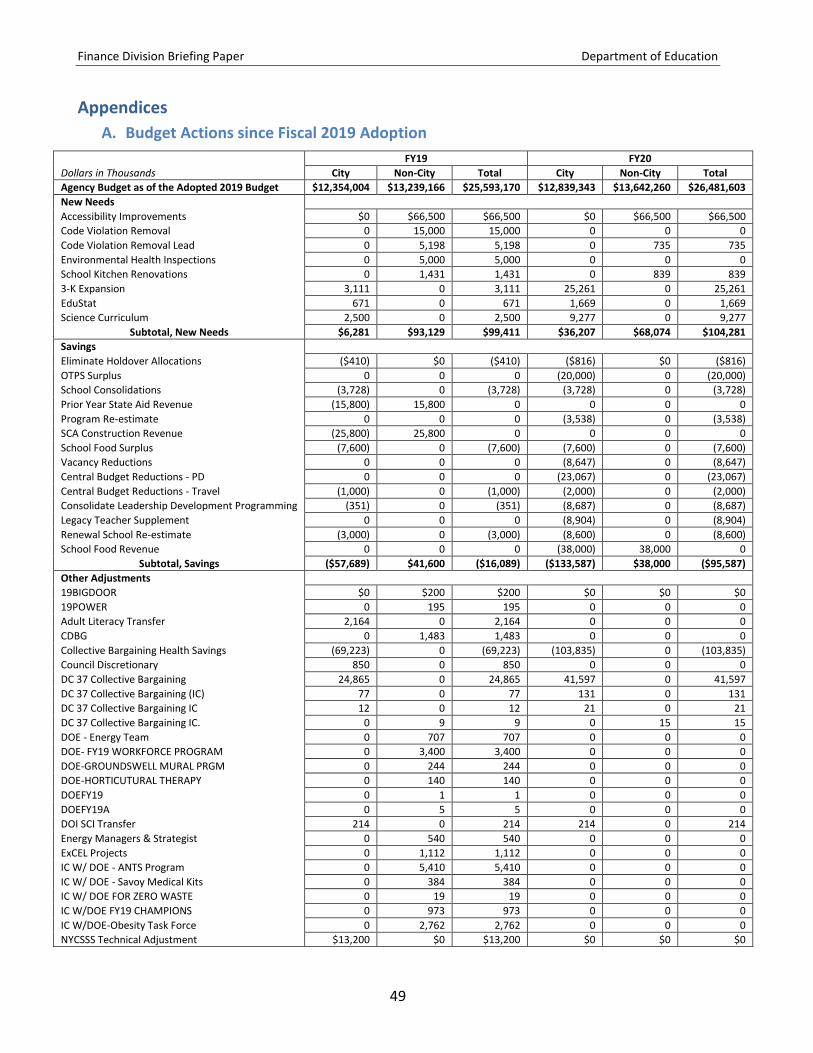
The Preliminary Budget increases the Fiscal 2020 Budget for the Department by $412 million. Changes introduced in the November 2018 and Preliminary Financial Plans increased DOE’s Fiscal 2019 Budget by $917 million. The changes include new needs that total $99.4 million, growing to $104 million in Fiscal 2020, and a savings package of $57.7 million in City funds, growing to $133.6 million in Fiscal 2020. Of this $133.6 million, $95.6 million is reoccurring through Fiscal 2022 and 2023. Other technical changes total $833.3 million in Fiscal 2019 and $403.3 million in Fiscal 2020. All of these changes are listed in Appendix A on page 52. Significant new needs, savings, and other adjustments across both the November 2018 and Preliminary Plan are discussed below.
New Needs
Accessibility. The November Plan added $66.5 million in both Fiscal 2019 and 2020 in federal Community Development Block Grant (CDBG) funding for accessibility projects. This funding supplements, not supplants, existing funding for accessibility projects in DOE’s expense budget.
New 3-K for All Districts. The Preliminary Plan added $25.3 million to the Fiscal 2020 budget, $35 million in Fiscal 2021, then growing to $41 million in Fiscal 2022 and in the outyears, to support the expansion of 3-K to two additional school districts: District 8 in the Bronx and District 32 in Brooklyn. The program will add 630 3-K seats in Fiscal 2020, 1,300 in Fiscal 2021, and 1,900 when the program is fully rolled out across both districts in Fiscal 2022.
EduStat. The Preliminary Plan added $1.7 million to the Fiscal 2020 budget, growing to $1.7 million in Fiscal 2021 and inthe outyears, for EduStat, a data monitoring system inspired by NYPD’s CompStat and ACS’s ChildStat. DOE plans to create a centralized database of information relevant to school operations to help administrators and school leaders assess where supports may be needed and triage/target issues more effectively. EduStat should link together many of the DOE’s existing data systems. The funding supports a headcount of 10 to develop and build the EduStat system.
3 Headcount Fiscal 2019 Term and Condition. Available at: https://council.nyc.gov/budget/fy2019/. 4 United Federation of Teachers Salary Schedule – 2018-2021. Available at: http://www.uft.org/our-rights/salary-schedules/doe/teachers.
Finance Division Briefing Paper Department of Education
5
Science Curriculum. An additional $9.3 million is added to the Fiscal 2020 and 2021 budget for science curriculum materials. New York State has adopted “Next Generation Science Standards” which requires DOE to update its science curriculum materials to meet the new standards.
Citywide Savings Program
OTPS Surplus. The November Plan baselined $20 million in OTPS savings that had been in the Fiscal 2019 Budget. This is unspent funding from school budgets. Prior to Fiscal 2019, schools rolled approximately $40 million from year-to-year; this baselines savings from 50 percent of the unspent money instead of rolling it from year-to-year.
School Consolidations. The November Plan baselined $3.7 million in savings from school consolidations. When schools are consolidated, administrative costs are lower because there is a base allocation to schools of approximately $357,000 (including fringe) to pay for school staff such as secretaries.
Vacancy Reductions. The November Plan baselined $8.6 million in savings from vacant headcount reductions that had been included in the Fiscal 2019 Budget. These savings are associated with a headcount reduction of 80: 32 field support center staff and 48 central staff. This is the only DOE savings associated with a reduction in headcount.
Central Budget Reductions – Professional Development (PD) and Travel. The Preliminary Plan baselines approximately $23.1 million in savings from professional development (PD) and $2 million in savings from travel costs. The PD savings will be found by consolidating the use of trainings and eliminating duplicative offerings. The travel savings will be achieved through better enforcement and oversight of policy, as recommended by the Comptroller in a November 2018 audit. The audit uncovered misuse of funding for travel and conference expenses.5
Renewal Schools. The Preliminary Plan recognized $3 million in savings from Renewal School costs in Fiscal 2019 and baselines $8.6 million in savings beginning in Fiscal 2020. These savings are being recognized in the contracts for central supports to Renewal Schools. Since 14 Renewal schools have closed, and 9 have been consolidated, not as many central supports are needed. Furthermore, in February 2019, the Chancellor announced the Renewal Schools program would be discontinued but Renewal Schools would continue to receive 100 percent of their Fair Student Funding (FSF), as well as funding to be community schools. This savings is not taken from either of these program areas and does not affect that school-level spending.
School Food. The Fiscal 2019 Preliminary Plan recognizes an additional $38 million in federal revenue for school food due to the switch to the Community Eligibility Program (CEP), which had been recognized for Fiscal 2018 and 2019 in prior financial plans. The Fiscal 2020 Preliminary Plan baselines this revenue through Fiscal 2021, because DOE is locked into CEP
5 New York City Comptroller, “Audit Report on the Department of Education’s Travel and Conference Expenses,” November 16, 2018. Available at: https://comptroller.nyc.gov/reports/audit-report-on-the-department-of-educations-travel-and-conference-expenses/.
Finance Division Briefing Paper Department of Education
6
eligibility for four years. The City will have to recertify their eligibility for Fiscal 2022 and the outyears.
Other savings. The Preliminary Plan baselines $8.7 million in savings by eliminating small leadership development programs for administrators and teachers “whose function continues to be served by other supports and strategies,” according to DOE. The Plan also baselines $8.9 million in savings from eliminating the Legacy Teacher Supplement Program. This program was created to support higher salaries of senior teachers during the transition to FSF and was scheduled to phase out as teachers retired or switched to new schools. In Fiscal 2019, 458 schools received $6.9 million through the Legacy Teacher Supplement Program; this amount that went directly to school budgets does not include the associated fringe, which is why the total savings is higher.
Other Adjustments
Table 1. Collective Bargaining Adjustments since Fiscal 2019 Adoption Dollars in Thousands
FY19 FY20 FY21 FY22
November Plan UFT Paid Parental Leave $36,427 $44,320 $44,320 $44,320 DC37 Contract 23,180 39,722 45,852 45,852 DC37 Welfare Adjustment 1,626 1,774 1,927 3,080 School Safety Agent Salary Schedule 27,322 25,385 22,408 20,337 School Safety Agent Salary Schedule Fringe 1,956 1,818 1,604 1,456 CB Health Savings (69,223) (103,835) (207,669) (219,091) DC37 Collective Bargaining IC 157 268 310 310
Subtotal, November Plan $21,445 $9,452 ($91,248) ($103,736)
Subtotal, Preliminary Plan $918,845 $352,167 $616,122 $846,462
TOTAL $940,290 $361,619 $524,874 $742,726
Collective Bargaining (CB). The November and Preliminary Plans recognize additional funding for recently settled collective bargaining (CB) agreements with unions representing DOE employees including the United Federation of Teachers (UFT) and District Council 37 (DC37). Collective bargaining adjustments included in the November and Preliminary Plans are shown in Table 1; the largest adjustments were for the UFT’s paid parental leave program (UFT PPL), the new UFT contract (UFT CB), and health savings associated with new contracts. The lump sums in Fiscal 2019 are the last retroactive payments agreed to in the contracts negotiated in 2014.
Finance Division Briefing Paper Department of Education
7
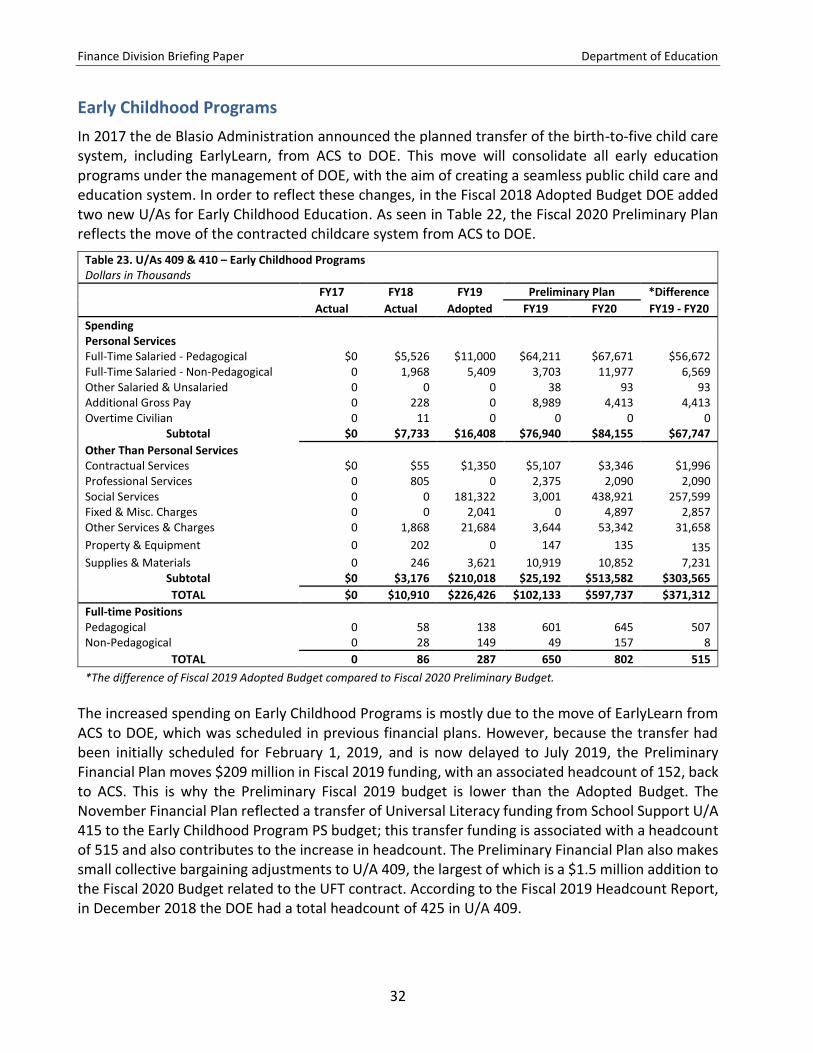
EarlyLearn Adjustment. The transfer of EarlyLearn and the birth-to-five child care system from ACS to DOE was originally scheduled for February 1, 2019, but was delayed to July 1, 2019. As a result, the Preliminary Plan moves $210 million back to Administration for Children’s Services (ACS) for Fiscal 2019. This funding had been moved to DOE in the Fiscal 2018 Executive Financial Plan.
DOI Special Commissioner of Investigation Transfer. The salary of the Special Commissioner of Investigation (SCI) at DOE, $214,000, which had been moved to the Department of Investigation’s budget last year, was moved back to DOE in the November Plan for Fiscal 2019 and in the outyears.
New York City School Support Services (NYCSSS). Both the November and Preliminary Plans adjusted funding for New York City School Support Services (NYCSSS), the non-profit that provides custodial staff to schools, to bring the total Fiscal 2019 NYCSSS budget to $649.4 million. This is an increase of $37.7 million from the Adopted Budget of $611.6 million. Of the total $37.7 million increase to NYCSSS, $24.5 million is reallocated from the Division of School Facilities (DSF) PS and custodial operations budget that is no longer needed given the transition to NYCSSS, and $13.2 million is new funding added to DOE’s budget to support NYCSSS. DOE anticipates the total cost for NYCSSS in Fiscal 2019 will be $672 million, so there is still a shortfall of approximately $22.6 million. No adjustment was made to the NYCSSS budget in Fiscal 2020 and the outyears.
Smart Schools Technology. The Preliminary Budget recognizes $152.8 million over Fiscal 2020-2023 in Smart Schools Bond Act (SSBA) supported spending for technology, including $40.7 million in Fiscal 2020. While the State allows SSBA funding to be used for items such as tablets, the City does not consider these capital eligible, so funding is recognized in the expense budget. Most SSBA is reflected in the DOE’s capital budget, and discussed in the Finance Division’s report to the Committee on the DOE Capital Program and Five-Year Capital Plan.
Funding Summary The Department of Education receives federal and State aid in additional to its City tax-levy (CTL) funds. Table 2 shows the various funding sources, including notable State and federal aids. DOE’s total budget for Fiscal 2020 is $26.9 billion, approximately $1.3 billion more compared to the Fiscal 2019 Adopted Budget. The increase is driven primarily by the $729.1 million increase in City support and the projected $351.5 million increase in State funding, while federal revenue increases by $135.2 million.
Finance Division Briefing Paper Department of Education
8
Table 2. Funding Source Summary Dollars in Thousands
Adopted Preliminary Plan *Difference
FY19 FY19 FY20 FY19-FY20
City $12,354,004 $13,144,591 $13,083,117 $729,112
State Foundation Aid $7,740,304 $7,754,439 $8,159,395 $419,091 Formula Aid 1,517,541 1,550,463 1,517,541 0 Building Aid 522,568 522,568 514,126 (8,442) Categorical Programs 722,415 724,268 718,574 (3,841) Special Education Pre-K 588,655 588,655 533,302 (55,353) State Food Programs 16,520 16,520 16,520 0 Revenue in Other Agencies (2,500) (2,500) (2,500) 0
Subtotal State $11,105,503 $11,154,413 $11,456,959 $351,455
Federal Title I $679,101 $679,101 $679,101 $0 IDEA 287,782 287,782 269,782 (18,000) School Lunch 338,476 338,476 338,476 0 Title IIA 108,000 108,000 108,000 0 Breakfast Program 139,312 139,312 143,510 4,198 Medicaid 97,000 97,000 97,000 0 Education for Homeless Children 2,200 2,200 1,550 (650) Other 292,526 195,590 442,223 149,698
Subtotal Federal $1,944,397 $1,847,461 $2,079,642 $135,245
TOTAL DOE FUNDING $25,593,170 $26,509,743 $26,893,640 $1,300,470
*The difference of Fiscal 2019 Adopted compared to Fiscal 2020 Preliminary Budget. Source: New York City Office of Management and Budget, "Monitor's Briefing Package", FY20 Preliminary Plan.
City Funding The DOE’s Fiscal 2019 Preliminary Plan includes $13.1 billion in City funding, approximately 49 percent of the Department’s funding. The year-over-year increase in City funds, comparing the Fiscal 2019 Adopted Budget to the Preliminary Fiscal 2020 Budget, is $729 million, or six percent. City funding supports all new needs in the Fiscal 2020 Preliminary Budget and other programs such as 3-K for All, which is completely funded with City dollars. It is important to note that the City’s overall contribution to education-related expenses is greater than that shown in DOE’s budget, because City funding supports other education-related expenses including pension and debt service costs.
State Funding The DOE’s Fiscal 2020 Preliminary Budget shows a $351.5 million increase in State funds as compared to the Fiscal 2019 Adopted Budget. The biggest category of State funding is Foundation Aid, which provides unrestricted funding for schools, and the year-over-year increase in State funding is largely due to the expected growth in Foundation Aid. State revenue comprises 43 percent of the Fiscal 2020 Budget. DOE uses State funding to support essential programs and services in City schools. Many of these programs are mandated by the State and the City is required to support these programs without full State support. For example, the State pays for a portion of
Finance Division Briefing Paper Department of Education
9
charter school payments, special education services, transportation, and school food. State funding is primarily allocated through formulas based on a variety of factors including the number and type of students enrolled in New York City public schools. It is important to note that State funding reflected in DOE’s Preliminary Plan does not match the State’s proposed Fiscal 2020 Executive Budget, but rather reflects what the City expects to receive in the State’s Enacted Budget. See the discussion of the 2019-20 State Executive Budget on page 12 for further details.
Federal Funding The DOE’s Fiscal 2020 Preliminary Budget includes a $135.2 million increase in federal funds compared to the Fiscal 2019 Adopted Budget. This increase is largely due to the fact that the Fiscal 2020 DOE budget reflects federal funding for Child Care and Head Start that currently goes to ACS; this funding will now be reflected in DOE’s budget as a result of the transfer of the birth-to-five care system to DOE.
Other Funding Private/Other Categorical funding in Fiscal 2020 includes $50 million in private grants, $73 million from the School Construction Authority (SCA) for capital work performed by the Division of School Facilities (DSF), $1 million for non-resident tuition, and $6.7 million for the Retirement System (BERS). Private/Other Categorical funding has increased since Adoption, largely due to new funding for accessibility projects, funded by federal Community Development Block Grant (CDBG) revenue.
Miscellaneous Revenue In addition to revenue from outside sources, the Department also generates revenue from several programs, which is categorized as miscellaneous revenue. DOE’s miscellaneous revenue, shown in Table 3, is projected to total $52.7 million in Fiscal 2020. This includes $8.2 million in grant refunds, $36.5 million in rental fees, and $7 million in sundries such as UFT fees. The miscellaneous budget still includes food service fees because some adults purchase meals from school food.
Table 3. DOE Miscellaneous Revenue Budget Dollars in Thousands
Revenue Sources
Adopted Preliminary Plan *Difference
FY19 FY19 FY20 FY19 - FY20
Food Service Fees $1,000 $1,000 $1,000 $0 Grant Refunds 8,174 8,174 8,174 0 Rental (Extended use of School Buildings) 36,500 36,500 36,500 0 Sundries (UFT Fees, Misc. Coll/refunds) 7,000 7,000 7,000 0
TOTAL $52,674 $52,674 $52,674 $0
*The difference of Fiscal 2019 Adopted Budget compared to Fiscal 2020 Preliminary Budget. Source: New York City Office of Management and Budget, "Monitor's Briefing Package", FY20 Preliminary Plan.
Fiscal 2020 State Executive Budget Highlights
School Aid comprises the major source of State revenue for DOE, and includes Foundation Aid and expense-based aids. Expense-based aids are formula aids and include funding for pre-K, special education services, school supplies, transportation, and capital projects.
The Fiscal 2020 New York State Executive Budget proposes to increase funding for education by approximately $1 billion, including a $956 million (3.6 percent) increase in school aid across the State. The proposal includes a $338 million increase in Foundation Aid, of which $202 million is for
Finance Division Briefing Paper Department of Education
10
NYC. Total school aid for Fiscal 2020 is $27.69 billion. Table 4 shows estimated school aid to NYC under the State Executive Budget proposal compared to what the New York City (NYC) revenue budget reflects.
Table 4. FY20 State Executive Budget Impact on DOE’s Budget Dollars in Thousands
School Aid Type
NYS FY20 Executive Budget Proposal -
Estimated Aids to NYC NYC Budgeted
Revenue for FY20 FY20 Excess (shortfall)
Foundation Aid $7,940,775 $8,159,395 ($218,618)
Expense-Based Aid* 3,184,425 3,114,071 70,353
TOTAL $11,125,200 $11,273,466 ($148,266)
Community School Set-aside $117,696 Education Equity Set-Aside $151,725
*This includes Universal Pre-Kindergarten; Special Services; High Cost Excess Cost; Private Excess Cost; Hardware & Technology; Software, Library, Textbook Aid; Transportation Aid; Building Aid; and Academic Enhancement Aid.
Overall, NYC is budgeting for a 4 percent increase in school aid from the State in Fiscal 2020, while the State Executive Budget proposal includes a 2.6 percent increase in school aid to NYC. While school aid includes the major categories of revenue DOE receives from the State, it does not include all State revenue to DOE, such as payments for charter schools and grant programs.
The total shortfall in State funding for DOE is $300 million, which is comprised of the $148 million school aid shortfall plus the $152 million proposed Education Equity set-aside. The Education Equity set-aside is included in the shortfall because it would require DOE to redirect resources from where they are currently budgeted to schools designated by the State. These State Executive Budget Proposals that would have significant impact on the City’s budget are discussed in further detail below.
Foundation Aid. The Executive Budget proposes an increase of $337.6 million in Foundation Aid, for a total of $18.1 billion statewide; this is an increase of 1.9 percent. The Fiscal 2019 Executive Budget includes a Foundation Aid increase of $202.3 million to New York City, for a total of $7.94 billion. There is a $218.6 million shortfall between what NYC expects to receive in Foundation Aid and the estimated Foundation Aid for NYC under the State’s Fiscal 2020 Executive Budget. In addition, according to OMB’s latest calculations, the City is owed approximately $1.2 billion in Foundation Aid this year as a result of the Campaign for Equity (CFE) lawsuit. However, the Executive Budget Briefing Book argues “there is no legal connection between Foundation Aid and the CFE lawsuit . . . each year’s formula likewise has no connection to the CFE lawsuit.”
Education Equity. The Fiscal 2020 Executive Budget advances legislation requiring school districts to dedicate a significant portion of their Foundation Aid increase to address inequities between their most underfunded, neediest schools and their other schools, based on a plan that must be submitted to and approved by the State Education Department. This proposal would require the City to direct 75 percent of its Foundation Aid increase—$152 million—to schools the State determines are underfunded and high-need, rather than allowing NYC to direct the funding to schools. DOE estimates this funding would be directed to approximately 350 schools, or only 22 percent of all City schools. The Education Equity
Finance Division Briefing Paper Department of Education
11
proposal would syphon $152 million of the City’s Foundation Aid to only 22 percent of schools. This City would not be able to distribute this funding through the Fair Student Funding (FSF) formula that DOE NYC currently uses to allocate funding to schools.
Building Aid. The Executive proposal would modify the calculation of Building Aid for projects approved on or after July 1, 2019 by lowering the State share of funding for these projects. Currently, building aid revenue NYC receives from the State covers approximately half of debt service of education capital projects. This proposal would reduce the share of education capital projects the State pays for. The School Construction Authority believes because the Fiscal 2020-2024 Five-Year Capital Plan will be approved before July 1, 2019, any projects funded through that Plan would not be affected by this proposal. However, even if this is the case, under the proposal a negative fiscal impact on the City’s Building Aid would begin with projects approved in Fiscal 2025 and grow over time.
Council Initiatives
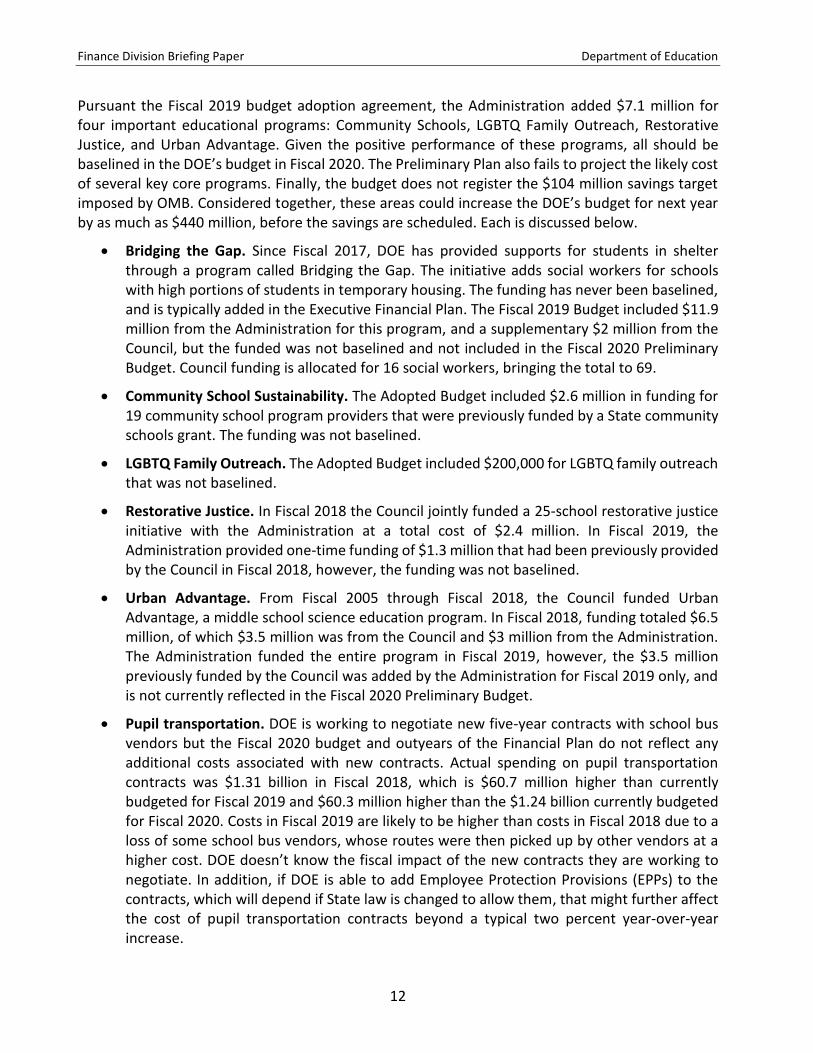
Council-funded initiatives included in the Fiscal 2019 Budget are not accounted for in the Preliminary Budget. The City Council has long supported educational programs in schools with discretionary funding and has increased funding over the years. In Fiscal 2019, the Council added $41.1 million to the DOE’s budget to fund a variety of education initiatives, listed in Table 5. For more detailed information on these initiatives, please see Appendix B on page 55.
Table 5. FY19 Council Initiative Funding in DOE's Budget Dollars in Thousands
Education Initiatives Child Mind Institute $500 Community Schools 2,750 Crisis Management System 640 Dropout Prevention and Intervention 2,485 Educational Programs for Students 4,740 Guidance Counselors for All Schools 2,000 Halal and Kosher School Lunch Pilot 1,000 LGBTQ Inclusive Curriculum 600 Physical Education and Fitness 1,125 Support for Educators 20,805 Support for Homeless Students 2,000 Work-Based Learning Internships $600 Other Initiatives A Greener NYC $110 Anti-Poverty 45 Borough 10 Local 1,465 Peter F. Vallone Academic Scholarship 631 Speaker's Initiative 140
TOTAL $41,646
DOE Budget Risks
The DOE’s Fiscal 2020 Budget does not adequately project planned spending for the coming year in all areas and does not include any support for several programs funded during the current year.
Finance Division Briefing Paper Department of Education
12
Pursuant the Fiscal 2019 budget adoption agreement, the Administration added $7.1 million for four important educational programs: Community Schools, LGBTQ Family Outreach, Restorative Justice, and Urban Advantage. Given the positive performance of these programs, all should be baselined in the DOE’s budget in Fiscal 2020. The Preliminary Plan also fails to project the likely cost of several key core programs. Finally, the budget does not register the $104 million savings target imposed by OMB. Considered together, these areas could increase the DOE’s budget for next year by as much as $440 million, before the savings are scheduled. Each is discussed below.
Bridging the Gap. Since Fiscal 2017, DOE has provided supports for students in shelter through a program called Bridging the Gap. The initiative adds social workers for schools with high portions of students in temporary housing. The funding has never been baselined, and is typically added in the Executive Financial Plan. The Fiscal 2019 Budget included $11.9 million from the Administration for this program, and a supplementary $2 million from the Council, but the funded was not baselined and not included in the Fiscal 2020 Preliminary Budget. Council funding is allocated for 16 social workers, bringing the total to 69.
Community School Sustainability. The Adopted Budget included $2.6 million in funding for 19 community school program providers that were previously funded by a State community schools grant. The funding was not baselined.
LGBTQ Family Outreach. The Adopted Budget included $200,000 for LGBTQ family outreach that was not baselined.
Restorative Justice. In Fiscal 2018 the Council jointly funded a 25-school restorative justice initiative with the Administration at a total cost of $2.4 million. In Fiscal 2019, the Administration provided one-time funding of $1.3 million that had been previously provided by the Council in Fiscal 2018, however, the funding was not baselined.
Urban Advantage. From Fiscal 2005 through Fiscal 2018, the Council funded Urban Advantage, a middle school science education program. In Fiscal 2018, funding totaled $6.5 million, of which $3.5 million was from the Council and $3 million from the Administration. The Administration funded the entire program in Fiscal 2019, however, the $3.5 million previously funded by the Council was added by the Administration for Fiscal 2019 only, and is not currently reflected in the Fiscal 2020 Preliminary Budget.
Pupil transportation. DOE is working to negotiate new five-year contracts with school bus vendors but the Fiscal 2020 budget and outyears of the Financial Plan do not reflect any additional costs associated with new contracts. Actual spending on pupil transportation contracts was $1.31 billion in Fiscal 2018, which is $60.7 million higher than currently budgeted for Fiscal 2019 and $60.3 million higher than the $1.24 billion currently budgeted for Fiscal 2020. Costs in Fiscal 2019 are likely to be higher than costs in Fiscal 2018 due to a loss of some school bus vendors, whose routes were then picked up by other vendors at a higher cost. DOE doesn’t know the fiscal impact of the new contracts they are working to negotiate. In addition, if DOE is able to add Employee Protection Provisions (EPPs) to the contracts, which will depend if State law is changed to allow them, that might further affect the cost of pupil transportation contracts beyond a typical two percent year-over-year increase.
Finance Division Briefing Paper Department of Education
13
The DOE has also issued a Request for Proposals (RFP) for a new school bus Global Positioning System (GPS), including bus routing and an app for parents. The cost of these new services is not reflected in the budget, and the GPS system is legislatively required to be in place by the start of the 2019-20 school year. This system is likely to cost at least $9 million to install on all 10,000 school buses used by DOE, based on the cost of the current GPS system used, which is less comprehensive. Maintenance of the system could cost $4 million or more annually to maintain. Beyond the cost of the actual system, DOE anticipates training costs could be approximately $24 million.
Office of Pupil Transportation (OPT). The budget does not reflect additional staff for OPT, although DOE testified in October 2018 that they are restructuring OPT. OPT was already given new leadership, a Senior Advisor who reports directly to the Chancellor. The OPT restructuring is ongoing, and could include converting part-time staff to full-time staff, and hiring additional staff where needed.
New York City School Support Services (NYCSSS). The budget for Fiscal 2020 and the outyears does not reflect the cost of the DOE’s contract with NYCSSS, which provides custodial staff in schools. The current budget for Fiscal 2019 is $649.3 million, while the budget for Fiscal 2020 is $45.1 million. The Council expects a budget realignment, given the Fiscal 2020 Budget doesn’t reflect the custodial services restructuring. However, even accounting for a restricting, if costs in Fiscal 2020 are exactly the same as in Fiscal 2019, the School Facilities budget is $163.2 million lower than needed. Moreover, the Council expects the Fiscal 2019 budget for the NYCSSS contract is inadequate, and an additional $22.7 million will need to be added to support the contract.
Carter Cases. Budgeted Carter Case spending for Fiscal 2019 is approximately $166.6 million below actual spending in Fiscal 2018, similarly, the Fiscal 2020 budget for Carter Cases is $153 million below actual spending in Fiscal 2020. The Council expects additional changes to be made in the Executive Budget to more accurately reflect Carter Case costs. In addition, DOE has been authorized to hire 25 additional staff to handle Carter Cases but these staff and their associated cost is not yet reflected in the and Central Administration budget.
SESIS. DOE announced they will be issuing an RFEI to replace the Special Education Student Information System (SESIS). The costs associated with this replacement are not reflected in the Fiscal 2020 budget or the outyears.
Charter Schools. The Independent Budget Office (IBO) believes that DOE is under-projecting charter school enrollment for Fiscal 2019 and in the outyears, resulting in a shortfall in budgeted funding given the DOE must pay charter schools per-pupil tuition. IBO estimates the shortfall in Fiscal 2019 to be $48 million and the shortfall in Fiscal 2020 to be $55 million.6
6 Independent Budget Office, “Overview: An Analysis of the Mayor’s Preliminary Budget for Fiscal 2020 and Financial Plan,” https://ibo.nyc.ny.us/iboreports/overview-an-analysis-of-the-mayors-preliminary-budget-for-2020-and-financial-plan-march-2019.pdf.
Finance Division Briefing Paper Department of Education
14
Program to Eliminate the Gap (PEG). OMB has given DOE a target of $104 million in efficiencies and savings as part of the Citywide goal to find $750 million total in PEGs for the Executive Budget. This is their cumulative goal for savings across Fiscal 2019 and 2020.
Financial Plan Summary
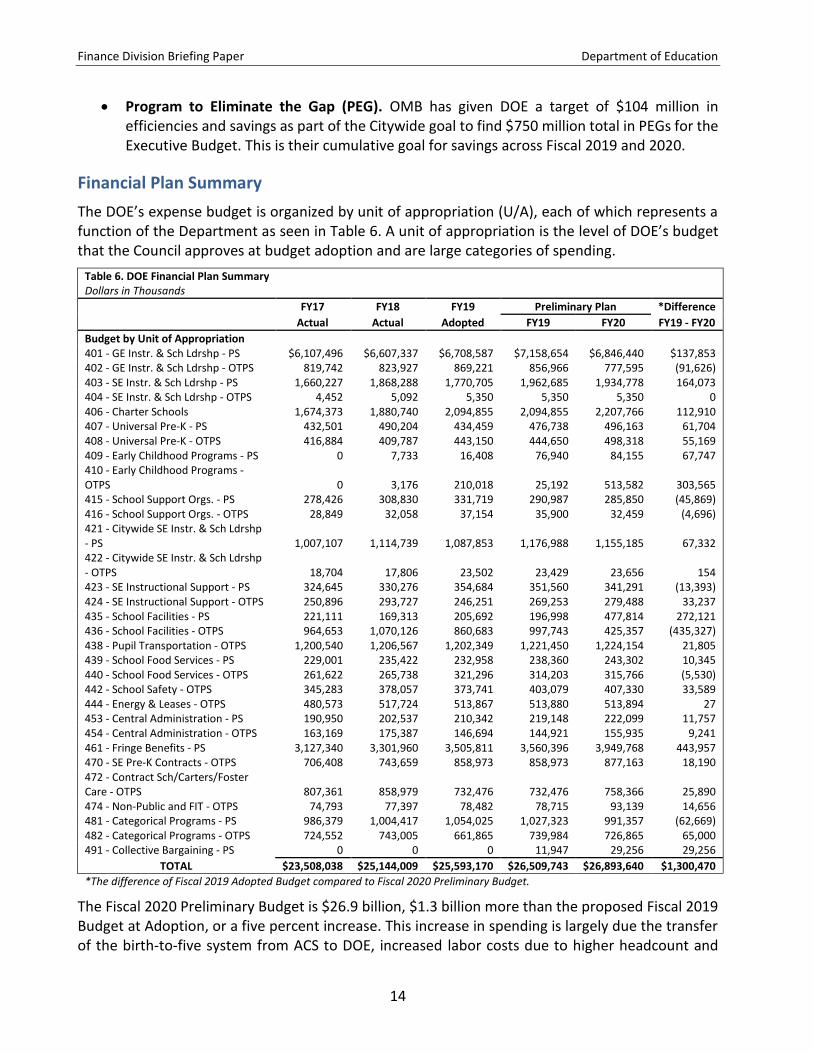
The DOE’s expense budget is organized by unit of appropriation (U/A), each of which represents a function of the Department as seen in Table 6. A unit of appropriation is the level of DOE’s budget that the Council approves at budget adoption and are large categories of spending.
Table 6. DOE Financial Plan Summary Dollars in Thousands
TOTAL $23,508,038 $25,144,009 $25,593,170 $26,509,743 $26,893,640 $1,300,470
*The difference of Fiscal 2019 Adopted Budget compared to Fiscal 2020 Preliminary Budget.
The Fiscal 2020 Preliminary Budget is $26.9 billion, $1.3 billion more than the proposed Fiscal 2019 Budget at Adoption, or a five percent increase. This increase in spending is largely due the transfer of the birth-to-five system from ACS to DOE, increased labor costs due to higher headcount and
Finance Division Briefing Paper Department of Education
15
collective bargaining agreements, and previously scheduled increases in the costs of mandated programs such as special education and charter schools. Table 6 provides a detailed list of spending for each U/A, with a comparison of the Fiscal 2020 Preliminary Plan to the 2019 Adopted Budget.
Significant Changes by U/A:
Fringe Benefits. The largest area of growth is for U/A 461, Fringe Benefits, with an increase of $444 million. The total budget for fringe benefits in Fiscal 2020 is projected to be $3.9 billion, or 15 percent of the DOE’s total budget. This increase is related to increases in headcount and collective bargaining agreements. While most of this increase is from previous financial plans, approximately $50 million of the increase is due to the collective bargaining adjustments made in the Fiscal 2020 Preliminary Financial Plan, as outlined on page 8.
Early Childhood Programs – OTPS. The second largest area of growth is in Early Childhood Programs OTPS, with an increase of $303.6 million. This accounts for the planned transfer of the EarlyLearn contracts from ACS to DOE.
General Instruction and School Leadership – PS. U/A 401, General Instruction and School Leadership PS, accounts for the third largest increase of $138 million in. Although this U/A totals $6.8 billion, approximately 26 percent of the entire DOE budget, the additional $138 million is only a two percent increase. Funding for General Education includes the direct instruction for general education students, and school supervision and instructional support services including professional development, parent coordinators, and school aides. Most of this increase is from previous plans, and reflects increased headcount related to increases in school budgets, as well as collective bargaining adjustments.
Charter Schools. Charter school spending is expected to increase by $112 million, or 5.4 percent, to a total of $2.21 billion in Fiscal 2020. Charter school payments comprise eight percent of the DOE’s Fiscal 2020 Budget. The projection for Fiscal 2020 includes the increase in per pupil charter school tuition and increased charter school enrollment, as well as increasing charter facilities payments.
Special Education: Across all U/As for special education—403, 404, 421, 422, 423, 424, 470 and 472—there is a total $295 million increase when comparing the Fiscal 2020 Preliminary Budget to the Fiscal 2019 Adopted Budget. Although the Administration highlighted this, it is important to note this does not reflect any new investment, but rather previously scheduled increases. These increases are largely for additional staff, the higher cost of staff due to collective bargaining agreements, and the expansion of specialized programs such as bilingual special education; Academics, Career, and Essential Skills programs (ACES); and Autism Spectrum Disorders (ASD) programs.
School Facilities PS and OTPS. The budget currently reflects a $272 million increase in U/A 435, School Facilities PS, and a $435 million decrease in U/A 436, School Facilities OTPS. This is because the Fiscal 2020 Budget does not accurately reflect planned spending on school facilities. When DOE restructured its custodial staff to be employed by NYCSSS and therefore paid through the OTPS budget, the associated budget adjustments were only made through Fiscal 2019, which is the last year of the current contract with NYCSSS, and funding
Finance Division Briefing Paper Department of Education
16
adjustments were not baselined. Overall, across the PS and OTPS School Facilities U/As, there is a budgeted decrease of $163 million. This reflects that even with a budget realignment the DOE is not fully funded for the cost of the NYCSSS contract in Fiscal 2020.
Contract Budget
The DOE has the largest agency contract budget among all City agencies, and in Fiscal 2020 it will comprise 50 percent of the City’s total $15.9 billion Contract Budget. The Fiscal 2020 Preliminary DOE Contract Budget includes a total of $8.02 billion for 6,409 contracts. Contractual spending as a portion of DOE’s expense budget has increased over the past three years, from 25 percent in Fiscal 2016 to an estimated 30 percent in the current fiscal year. The greatest areas of contractual spending are for:
Charter Schools (27 percent of the contract budget);
Contract Schools, which are private schools that provide special education services to children with conditions or disabilities who cannot be appropriately served by the City’s public schools (20 percent of the contract budget);
Pupil Transportation (16 percent of the contract budget);
Direct Educational Services (11 percent of the contract budget); and
Contractual Services – General (11 percent of the contract budget).
See Appendix C on page 56 for a detailed breakdown of DOE’s Contract Budget.
Most of the planned increase in contractual spending from Fiscal 2019 to Fiscal 2020 is due to an addition of $74 million for Head Start contracts and $182 million for day care contracts as a part of the transition of the birth-to-five care system from ACS to DOE. There is also an increase of $112 million for charter schools. The $513 million decrease in contracts for “Maintenance and Operation of Infrastructure” is due to the fact that the Fiscal 2020 budget doesn’t reflect the cost of the contract with NYCSSS, as previously mentioned, and further discussed under School Facilities.
School Budgets
The funding used to operate New York City’s 1,605 district public schools is appropriated to the DOE through several units of appropriation. The City’s budget does not include information on how much money any individual school receives, and it does not show how many employees any particular school has. The budget information is citywide. More detailed school-level budgetary information is made available by the DOE on its website.7
Most of the funding that is allocated to schools to support operations is budgeted centrally within three program areas:
General Education Instruction & School Leadership (U/As 401 & 402);
Special Education Instruction & School Leadership (U/As 403 & 404);
7 See https://infohub.nyced.org/reports-and-policies/financial-reports/financial-data-and-reports.
Finance Division Briefing Paper Department of Education
17
Categorical Programs (U/As 481 & 482); and
Collective Bargaining (U/A 491).
In this discussion the four U/A pairs that comprise the bulk of school funding are used as a measure of total funding available for school budgets. Although not all of the money budgeted in these U/As funds schools’ budgets, school budgets will generally be impacted by actions in these program areas. This section on school budgets provides an overview of the parts of the DOE’s budget that fund public schools’ budgets and support school-based jobs.
Figure 6 shows that the total funding for school budgets for Fiscal 2020 is $11.3 billion, with a full-time budgeted headcount of 103,506 positions. This is a $242 million increase when compared to the Fiscal 2019 Adopted Budget. Funding for school budgets is 42 percent of the entire DOE budget.
As seen in the table above, the total growth for school budgets includes an increase of $269 million in PS and a decrease of $27 million in OTPS. The only new need funded in these U/As is the science curriculum. Most of the year-over-year change in these U/As is from previous financial plans, though the Preliminary Financial Plan does add significant funding to these U/As related to the UFT collective bargaining agreement: $88 million in Fiscal 2019 and $216 million in Fiscal 2020. In addition, a majority of the professional development and travel savings in the Fiscal 2020 Preliminary Budget are taken from these U/As: $22.8 million and $1.4 million respectively.
The de Blasio administration has added millions of dollars of funding to DOE’s budget to support school budgets through Equity and Excellence initiatives, including Universal Literacy, Algebra for All, Advanced Placement for All, Computer Science for All, College Access for All, and Single Shepherd. However, it is difficult to judge the connection of these investments to improved outcomes, and therefore their efficacy and return on investment. Beyond the clear shortfall in Fair
$8.75 $9.48 $10.16 $9.80
$1.55$1.57
$1.60$1.51
$10.30$11.05 $11.76 $11.31
100,519 101,403103,032 103,506
50,000
60,000
70,000
80,000
90,000
100,000
$0.00
$2.00
$4.00
$6.00
$8.00
$10.00
$12.00
$14.00
Actual Actual FY19 FY20
FY17 FY18 Preliminary Plan
Figure 6. School Budgets
PS OTPS Headcount
Finance Division Briefing Paper Department of Education
18
Student Funding (FSF) discussed below, adequacy of education spending in school budgets is hard to determine.
The Department of Education funds the City’s individual schools through a variety of allocation formulas and pass-through funding. Fair Student Funding (FSF) is the primary funding source for schools’ budgets and is used by schools to cover basic instructional needs. It is funded primarily by the City and Foundation Aid from the State, and reflected in the school budget U/As.
Fair Student Funding Fair Student Funding (FSF) is $9.9 billion this school year and is used by schools to cover basic instructional needs.8 FSF funding comprises approximately 67 percent of an individual school’s budget on average, and principals may spend it at their discretion, with the ability and flexibility to decide how much to spend on teachers and other instructional needs.
The FSF formula allocates funding to schools through five categories (note funding allocated to
schools does not include associated fringe costs, which are budgeted separately):
1. Foundation, which is a fixed amount of $225,000 for each school and may be used at the principal’s discretion for administrative staff, teachers, or other services the principal would like to provide.
2. Grade weights, based on student grade levels;
3. Needs weights, based on students’ academic needs;
4. Enhanced weights for portfolio high schools, which include CTE and transfer schools; and
5. Collective Bargaining, related to increases for staff funded with FSF.
The DOE uses FSF to establish a funding entitlement for every school, other than district 75 schools. However, since DOE’s budget does not include enough money to fully fund FSF, not all schools actually receive their FSF entitlement. The DOE has, since Fiscal 2016, granted all community and renewal schools at least 100 percent of their FSF entitlement; newly opened schools are also fully funded. In Fiscal 2017 DOE lifted the FSF floor to 87 percent, and for this school year, with a $125 million FSF increase supported by the Council, DOE ensured that every school receives at least 90 percent of its FSF entitlement. On average, schools receive 93 percent of the FSF entitlement. It would cost $756 million in Fiscal 2019 to fund all schools at 100 percent.9
Headcount In order to track the actual school-based headcount, the Council included a Term and Condition on the Fiscal 2019 Adopted Budget to require the DOE to provide semiannual reports on actual
8 This includes “foundation” and collective bargaining costs. New York State School Funding Transparency Forms, FY 2019 New York State School Funding Transparency Form, Department of Education. Available at: https://infohub.nyced.org/reports-and-policies/financial-reports/financial-data-and-reports/new-york-state-school-funding-transparency-forms 9 This includes “foundation” and collective bargaining costs. New York State School Funding Transparency Forms, FY 2019 New York State School Funding Transparency Form, Department of Education. Available at: https://infohub.nyced.org/reports-and-policies/financial-reports/financial-data-and-reports/new-york-state-school-funding-transparency-forms.
Finance Division Briefing Paper Department of Education
19
headcount of school-based staff (funded through the School Budget U/As, as well as the Early Childhood Program and UPK U/As). Data from this Term and Condition is shown in Table 7. The December 2018 headcount report showed that DOE schools employed a total of 111,186 full and part-time staff. This headcount includes 72,469 teachers, 11,234 individualized education program (IEP) paraprofessionals, 5,824 school aids, 2,767 guidance counselors, 779 social workers, and 560 school psychologists.
Table 7. DOE School-based Staff Headcount
U/A and U/A Title Jun-17 Jun-18 Dec-18
401 Gen. Ed. Instr. & School Leadership 71,315 71,289 70,520 403 Special Ed. Instr. & School Leadership 27,428 28,409 27,968 407 UPK 4,938 5,339 409 Early Childhood 43 425 481 Categorical Programs 7,727 7,043 6,934
The Fiscal 2019 Preliminary Mayor’s Management Report (PMMR) gives insight into teacher and principal retention and experience. As outlined in Table 8, the percent of teachers with five or more years of experience has declined, however, the percent of principals with more than four years of experience has increased. Though the PMMR does not reflect a target for these indicators, more experienced teachers and principals are conventionally thought to improve educational outcomes for students; the DOE’s own report on the renewal school program highlighted the importance of strong principals.10 More experienced teachers and principals do cost the City more. The chart also demonstrates that teacher absenteeism has increased with almost 15 percent of teachers absent for more than 11 days in Fiscal 2018. High teacher absenteeism costs the DOE more because they must be covered with substitute teachers. However, spending on per session and substitute teachers are not identifiable though existing DOE budget lines.
10 New York City Department of Education, “New York City’s Renewal School Program: Lessons in School Turnaround.” Available at: https://cdn-blob-prd.azureedge.net/prd-pws/docs/default-source/default-document-library/renewalreport-25feb2019.pdf.
Finance Division Briefing Paper Department of Education
20
Table 8. FY19 PMMR - Teacher Data
Performance Indicators
Actual Target 4-Month Actual
FY16 FY17 FY18 FY19 FY20 FY18 FY19
Teachers 76,351 77,446 78,598 * * 78,598 78,761
Teachers with 5 or more years teaching experience (%) 68.5% 66.9% 66.5% * * 66.5% 67.3%
Principals with more than 4 years experience as principal 59.9% 63.2% 66.5% * * NA NA
Teachers absent more than 11 days 13.6% 13.0% 14.8% * * NA NA
Class Size Class sizes in any given school result from a combination of factors. The amount of funding available to schools to hire teachers, the number of classrooms in a school, and choices made by school leaders determines the number of students in each class. Table 9 lists data from the PMMR showing average class size per grade.
Table 9. FY19 PMMR - Class Size Data
Average class size Actual Target 4-Month Actual
FY16 FY17 FY18 FY19 FY20 FY18 FY19
Kindergarten 22.6 22 21.8 20.8 20.8 21.9 21.6
Grade 1 24.9 24.5 24.2 23.2 23.2 24.3 24.4
Grade 2 25.2 25.1 24.6 23.6 23.6 24.7 24.7
Grade 3 25.7 25.4 25.1 24.1 24.1 25.2 25.1
Grade 4 26.1 26.1 25.6 24.6 24.6 25.6 25.6
Grade 5 26.3 26.1 26.1 25.1 25.1 26.1 25.8
Grade 6 26.7 26.8 26.6 25.6 25.6 26.7 27
Grade 7 27.1 27 27.2 26.2 26.2 27.3 27.3
Grade 8 27.4 27.4 27.4 26.4 26.4 27.6 27.6
There has been little fluctuation in average class sizes by grade for the past three years. However, citywide averages mask significant variation among schools and districts. In addition, average class sizes can also obscure a wide distribution of class sizes, and different class sizes based on program areas. This data is currently provided in the DOE Class Size Report, required by Local Law 125 of 2005 and available on DOE’s website.11 The PMMR should include additional performance indicators to reflect these more nuanced measures of class size, such as the number of students in classes with 30 or more students (or another appropriate threshold) and pupil-teacher ratio. Since class size is at least partially a function of school budgets, this would allow for better alignment of performance indicators and spending.
The class size targets appear to be exactly one percentage point lower than whatever the actual class size was for the prior year. This blunt class size reduction target does not appear to reflect any real analysis of the City’s ability to reduce K-8 class sizes, and does not reflect a true effort to reduce class sizes with a meaningful goal. Any effort to reduce class sizes would come with a significant shift of existing resources to add more teachers to the classroom, or require hiring additional teachers.
Large class sizes can also be a result of school overcrowding. Many school buildings enroll more students than they have capacity for, and approximately half of all students go to schools that are
11 Available at: https://infohub.nyced.org/reports-and-policies/government/intergovernmental-affairs/class-size-reports.
Finance Division Briefing Paper Department of Education
21
overcrowded. The PMMR should introduce indicators to capture the reasons for overly large classes, such as the class size in schools that are over capacity. Issues related to school capacity are discussed in further detail in the Council’s report to the committee on the DOE’s Preliminary Capital Budget.
General Education Instruction & School Leadership
The first two units of appropriation in the DOE’s budget, 401 and 402, support the core school programs – general education instruction and school leadership. General Education Instruction and School Leadership (General Education) is a vast category that encompasses school instruction, school supervision and instructional support services including professional development, parent coordinators, and math and literacy coaches for elementary, middle, and high schools. This U/A pair also funds high school vocational, alternative, Career Education, school correction facilities, and off-site education centers. In addition, instructional funds for summer and evening instructional programs, before and after school time, as well as extended use and special purposes for New York State Testing and Learning are included in this U/A pair.
Table 10. U/As 401 & 402 - General Education Instruction & School Leadership Dollars in Thousands
FY17 FY18 FY19 Preliminary Plan *Difference Actual Actual Adopted FY19 FY20 FY19 - FY20
Other Than Personal Services Contractual Services $278,447 $288,109 $281,498 $274,075 $235,986 ($45,512) OTPS Other 541,295 535,819 587,722 582,891 541,609 (46,114)
*The difference of Fiscal 2019 Adopted Budget compared to Fiscal 2020 Preliminary Budget.
This area of spending is very large, amounting to 28 percent of the DOE’s $26.9 billion Fiscal 2020 projected expense budget. As Table 10 indicates, PS spending is budgeted at $6.85 billion in Fiscal 2020, or 90 percent of the total general education budget. Most of school spending is for full-time pedagogical staff salaries. The budget shows that schools would employ 64,124 full-time general education pedagogical staff next year, and 2,849 non-pedagogical staff, for a total headcount of 66,973. The projected decline in headcount is largely due to the fact that 53 Bridging the Gap social workers who are accounted for in the Fiscal 2019 Budget are not reflected for in the Fiscal 2020 budget. Note the 16 Council-funded Bridging the Gap social workers were not accounted for in
Finance Division Briefing Paper Department of Education
22
budgeted headcount at Fiscal 2019 Adoption, and were recognized in the Fiscal 2020 Preliminary Financial Plan.
Funding for General Education is projected to increase by $46 million in Fiscal 2020 when compared to the Fiscal 2019 Adopted Budget. The growth was mostly accounted for in earlier financial plans. The only new need in this U/A pair is the additional funding for the new science curriculum, $9.3 million in Fiscal 2020. Given the influx of supplies needed for implementation, a total of $21.1 million is added across Fiscal 2019-2021. Once these supplies have been purchased, State funding for textbooks and classroom materials will continue to fund subsequent replacements, additions, or modifications as normal, which is why no additional investment is required in Fiscal 2022 or beyond.
This U/A pair also reflects collective bargaining adjustments funded in the November and Preliminary Financial Plans, as well as the $20 million school budget OTPS savings baselined in the November Financial Plan. Other savings taken in this U/A pair include $2.6 million in school consolidations, $22.8 million in PD savings, $1.4 million in travel savings, and $6.2 million of the Legacy Teacher Supplement savings.
Special Education Instruction & School Leadership
The Special Education Instruction and School Leadership (Special Education Instruction) budget, U/As 403 and 404, supports the special education programs provided by schools. This funding provides for the direct special education instruction, school supervision, and support services for elementary, middle, and high schools in a resource room, self-contained, and collaborative team classroom setting. These U/As also include funds required for related services such as mandated speech and counseling. Almost all of the funding budgeted in these U/As is allocated directly to schools. Some of it, however, supports centrally administered programs and services that support the work of schools. Examples of this include professional development courses for school staff and some student assessment tools. Special Education Instruction totals seven percent of the Fiscal 2020 Preliminary Budget.
Finance Division Briefing Paper Department of Education
23
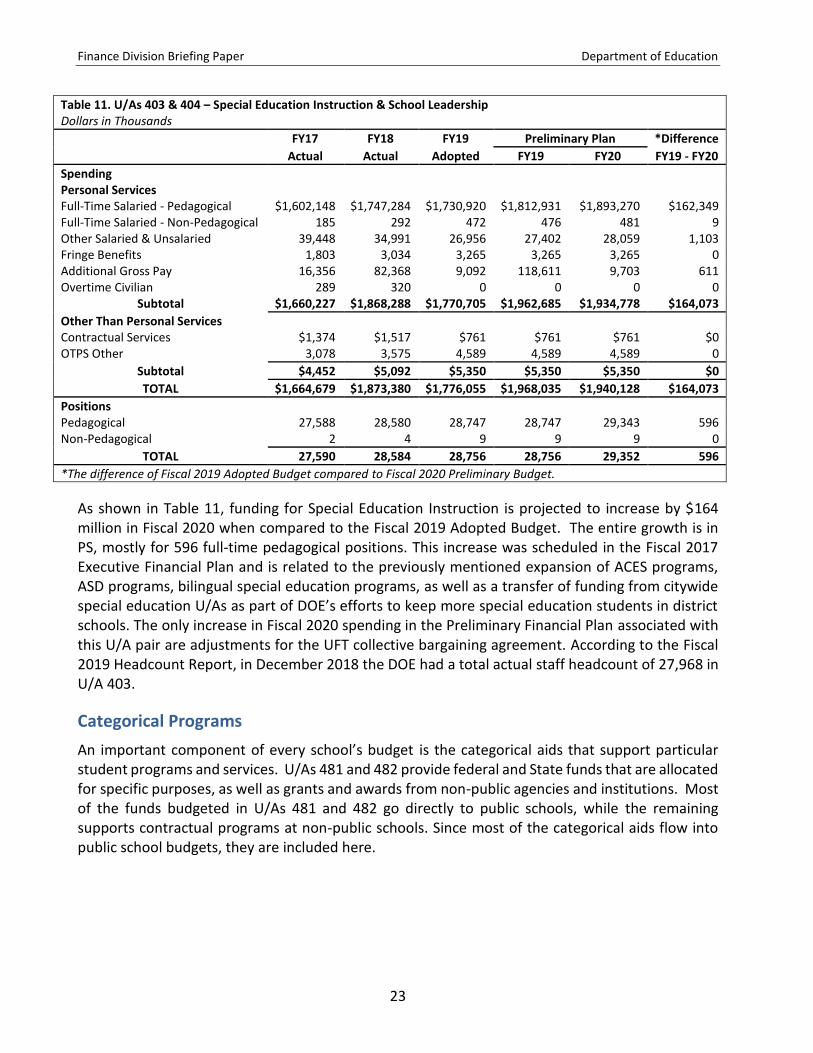
Table 11. U/As 403 & 404 – Special Education Instruction & School Leadership Dollars in Thousands FY17 FY18 FY19 Preliminary Plan *Difference Actual Actual Adopted FY19 FY20 FY19 - FY20
*The difference of Fiscal 2019 Adopted Budget compared to Fiscal 2020 Preliminary Budget.
As shown in Table 11, funding for Special Education Instruction is projected to increase by $164 million in Fiscal 2020 when compared to the Fiscal 2019 Adopted Budget. The entire growth is in PS, mostly for 596 full-time pedagogical positions. This increase was scheduled in the Fiscal 2017 Executive Financial Plan and is related to the previously mentioned expansion of ACES programs, ASD programs, bilingual special education programs, as well as a transfer of funding from citywide special education U/As as part of DOE’s efforts to keep more special education students in district schools. The only increase in Fiscal 2020 spending in the Preliminary Financial Plan associated with this U/A pair are adjustments for the UFT collective bargaining agreement. According to the Fiscal 2019 Headcount Report, in December 2018 the DOE had a total actual staff headcount of 27,968 in U/A 403.
Categorical Programs
An important component of every school’s budget is the categorical aids that support particular student programs and services. U/As 481 and 482 provide federal and State funds that are allocated for specific purposes, as well as grants and awards from non-public agencies and institutions. Most of the funds budgeted in U/As 481 and 482 go directly to public schools, while the remaining supports contractual programs at non-public schools. Since most of the categorical aids flow into public school budgets, they are included here.
Finance Division Briefing Paper Department of Education
24
Table 12. U/As 481 & 482 – Categorical Programs Dollars in Thousands FY17 FY18 FY19 Preliminary Plan *Difference Actual Actual Adopted FY19 FY20 FY19 - FY20
Other Than Personal Services Contractual Services $331,229 $362,107 $380,350 $381,588 $380,350 $0 OTPS Other 393,323 380,899 281,515 358,395 346,515 65,000
*The difference of Fiscal 2019 Adopted Budget compared to Fiscal 2020 Preliminary Budget.
As reflected in Table 12, there is a net increase of $2.3 million for categorical programs as a result of a $62.7 million PS decrease and a $65 million OTPS increase. PS spending, mostly on full-time pedagogical positions, is projected to decrease by $63 million for a total of $991 million, or 58 percent of the total budget for Categorical Programs. This increase in OTPS spending is a result of a budget realignment in the November 2018 Financial Plan which moved $65 million from PS to OTPS spending to reflect actual spending. The only increase in Fiscal 2020 spending in the Preliminary Financial Plan associated with this U/A pair are adjustments for the UFT collective bargaining agreement.
There are no budgeted headcount changes. The difference in headcount between the current Fiscal 2019 Budget and the Fiscal 2020 Budget is due to 50 Substance Abuse Prevention and Intervention Specialists (SAPIS) workers who were recognized in the November 2018 Financial Plan for Fiscal 2019 only. The City matches State funding for SAPIS workers, and typically only reflects the City-funded SAPIS workers one year at a time, after continued State funding is included in the Enacted State Budget. According to the Fiscal 2019 December Headcount Report, the DOE had a total staff headcount of 6,934 in U/A 481.
Collective Bargaining
The Fiscal 2020 Preliminary Plan includes funding in U/A 491 for Collective Bargaining costs. This funding will be redistributed to the appropriate U/As in the Executive Budget. Most of this funding will be redistributed to the U/As containing school budgets because it is associated with the UFT
Finance Division Briefing Paper Department of Education
25
contract, though some is associated with DC37 and managerial contracts and so will be redistributed to other U/As accordingly.
Table 13. U/A 491 - Collective Bargaining Dollars in Thousands
FY17 FY18 FY19 Preliminary Plan *Difference Actual Actual Adopted FY19 FY20 FY19 - FY20
Amounts to be Scheduled $0 $0 $0 $11,947 $29,256 $29,256
TOTAL $0 $0 $0 $11,947 $29,256 $29,256
*The difference of Fiscal 2019 Adopted Budget compared to Fiscal 2020 Preliminary Budget.
Fringe Benefits
DOE, unlike other City agencies, maintains a U/A for fringe benefits, which includes social security, health insurance, payments to welfare funds, annuity contributions, workers compensation and unemployment benefits, and a reserve to fund costs associated with collective bargaining agreements. As reflected in Table 14, the Fringe Benefits total budget is $3.9 billion in Fiscal 2020, an increase of $444 million compared to the Fiscal 2019 Adopted Budget. This increase directly relates to increases in headcount and collective bargaining costs. Fringe benefits are 15 percent of DOE’s total budget for Fiscal 2020 and 23 percent of the PS budget.
Table 14. U/A 461 - Fringe Benefits Dollars in Thousands
FY17 FY18 FY19 Preliminary Plan *Difference
Actual Actual Adopted FY19 FY20 FY19 - FY20
Personal Services $3,127,340 $3,301,960 $3,505,811 $3,560,396 $3,949,768 $443,957
TOTAL $3,127,340 $3,301,960 $3,505,811 $3,560,396 $3,949,768 $443,957
*The difference of Fiscal 2019 Adopted Budget compared to Fiscal 2020 Preliminary Budget.
Citywide Special Education & Special Education Instructional Support
Funds budgeted in Citywide Special Education Instruction and School Leadership, U/As 421 and 422, provide direct citywide special education instruction and school supervision for severely handicapped children in self-contained classrooms and home and hospital instruction, and for instructional support services and related services. These U/As include funding for District 75 schools, which provide educational, vocational, and behavior support programs for students who are on the autism spectrum, have significant cognitive delays, are severely emotionally challenged, are sensory impaired, and/or are multiply disabled. DOE does not use FSF to budget for District 75 schools, DOE uses a cost of service method based on students’ needs to fund these schools. U/As 423 and 424, Special Education Instructional Support, contain funds for centrally-managed special education related services such as occupational therapy, physical therapy, and nurses. The DOE uses both employees and contractual providers to deliver mandated services to students. Funding budgeted in these U/As also pays for evaluations of students performed by school-based support teams.
Finance Division Briefing Paper Department of Education
26
Table 15. U/As 421, 422, 423, 424 - Citywide Special Education & Special Education Instructional Support Dollars in Thousands
FY17 FY18 FY19 Preliminary Plan *Difference Actual Actual Adopted FY19 FY20 FY19 - FY20
Other Than Personal Services Contractual Services $238,935 $279,718 $231,986 $253,178 $255,892 $23,906 OTPS Other 11,961 14,008 14,265 16,075 23,596 9,330
*The difference of Fiscal 2019 Adopted Budget compared to Fiscal 2020 Preliminary Budget.
As reflected in Table 15, total citywide special education budget is projected to be $1.8 billion in Fiscal 2020, or seven percent of DOE’s Fiscal 2020 Budget. Of the $1.8 billion, $1.5 billion supports PS and the staff that provides direct instruction of students and $303 million is for OTPS expenses. Most of this, $249.7 million, is for related services for students provided through contracts. The total citywide special education budget is projected to increase by $87 million when compared to the Fiscal 2019 Adopted Budget. This increase in spending was scheduled in the Fiscal 2017 Preliminary Financial Plan. The only increase in Fiscal 2020 spending associated with these U/As in the Preliminary Financial Plan are adjustments for collective bargaining agreements, and a small amount of the central budget travel savings.
Finance Division Briefing Paper Department of Education
27
Headcount is expected to decrease by 723 in Fiscal 2020 compared to the Fiscal 2019 Budget at Adoption. Most of the decrease in headcount was scheduled in the Fiscal 2017 Executive Financial Plan, which scheduled the transfer of funding and headcount from these U/As to the Special Education Instruction U/A, 403; this transfer was related to DOE’s effort to keep more special education students in district schools. In addition, 10 positions related to supports for students in temporary housing are budgeted for Fiscal 2019 but not Fiscal 2020.
Table 16 shows that the number of students receiving special education services has increased, which corresponds with the increased budget for citywide special education services. The table also shows the increase of school-aged students, both in public and private schools, who are enrolled in special education.
Table 16. FY19 PMMR - Special Education Enrollment
- Public school 206,839 212,121 216,105 * * 214,965 217,593
- Non-public school 44,916 48,361 49,664 * * 50,405 51,946
The PMMR provides further details on the number of students recommended for special education, which has increased slightly, and those no longer in need of special education services, which has decreased slightly. Additionally, PMMR reflects the including the percent of students progressing into a higher level of English Language Arts and Math, both of which have increased, though the educational outcomes of students receiving special education services remain worse than their peers receiving general education services. These indicators are shown in Table 17.
Table 17. FY19 PMMR Special Education Services and Outcomes
Performance Indicators
Actual Target 4-Month Actual
FY16 FY17 FY18 FY19 FY20 FY18 FY19
Students receiving special education services (preliminary unaudited) 283,017 292,065 297,314 * * 288,742 293,068
Students recommended for special education 29,179 29,410 29,899 * * 4,454 4,050
Students no longer in need of special education 5,864 7,276 7,238 * * 2,650 2,540
Students in special education scoring below standards progressing into a higher level
English Language Arts 21.7% 23.6% 26.1% 28.1% 28.1% NA NA
Math 14.7% 14.3% 14.8% 16.8% 16.8% NA NA
Pursuant to Local Law 27 of 2015, as amended by Local Law 183 of 2017 and Local Law 89 of 2018, the DOE reports additional information regarding students receiving special education services. According to the report, the percentage of students receiving their recommended special education programs increased from 73 to 78 percent in the 2017-18 school year.12
Related Services Spending on related services is contained in the Citywide Special Education U/As, as well as the Special Education Instruction U/As. Spending on related services is shown in Table 18. Related Services can be provided by DOE employees, which is reflected in the PS spending, and by
12 New York City Department of Education, “Annual Special Education Data Report – School Year 2017-18.” Available at: https://infohub.nyced.org/reports-and-policies/government/intergovernmental-affairs/special-education-reports.
Finance Division Briefing Paper Department of Education
28
contracted providers, which is reflected in the OTPS spending. Changes in the related service spending PS budget include collective bargaining adjustments made in the Preliminary Plan. Increases in the OTPS budget were accounted for in prior financial plans, and include planned increases in spending given the growing number of special education students and related services required, and funding for the purchase of Chromebooks for related service providers to use to track their services. Planned spending in Fiscal 2019 and 2020 is significantly lower than actual spending in both Fiscal 2017 and 2018; it is unclear if additional funding will need to be added to support the budget for related services. As of January 2019 year-to-date obligations for related services totaled $709.6 million.
Table 18. DOE Related Services Spending (U/As 403, 404, 421, 422, 423, & 424) Dollars in Thousands
FY17 FY18 FY19 Preliminary Plan *Difference Actual Actual Adopted FY19 FY20 FY19 - FY20
TOTAL $1,394,235 $1,576,167 $1,202,556 $1,273,162 $1,277,939 $75,382
*The difference of Fiscal 2019 Adopted Budget compared to Fiscal 2020 Preliminary Budget.
Charter Schools
Charter schools are privately operated schools that run under a public charter issued by the DOE, the State Education Department, or the State University of New York. They are considered public schools and funded through DOE’s expense budget. As required by a Fiscal 2019 Adopted Budget Term and Condition, the Department provides semi-annual reports to the Council on charter schools. According to the most recent report, as of December 2017, there were 235 charter schools located in New York City, and five charter schools outside of the City that serve City residents, for a total of 240 charter schools serving City students. According to the New York City Charter School Center, charter schools enroll approximately 123,000 students, of which 18 percent have an IEP and 7 percent are English language learners (ELLs). Students enrolled in charter schools represent over 10 percent of all New York City public school students.13
Charter schools are primarily publically funded through the DOE. The DOE pays each charter school on a per pupil basis based on enrollment. The New York State Education Department sets the per pupil rate based on a formula that is meant to mirror the per-pupil spending by the DOE on district schools. The Fiscal 2019 rate is $15,307, a $780 increase from the Fiscal 2018 rate.14 For special education students, the DOE must pay the tuition rate plus a supplemental rate that varies depending on the type of disability in order to cover the additional expenses related to providing special education services to students.
13 “NYC Charter School Facts 2018-2019,” New York City Charter School Center. Available at: https://www.nyccharterschools.org/sites/default/files/resources/NYC-Charter-Facts.pdf 14 New York State Education Department, “2018-19 Charter School Basic Tuition and Supplemental Basic Tuition.” Available at: https://stateaid.nysed.gov/charter/html_docs/charter_1819_rates.htm.
TOTAL $1,674,373 $1,880,740 $2,094,855 $2,094,855 $2,207,766 $112,910
*The difference of Fiscal 2019 Adopted Budget compared to Fiscal 2020 Preliminary Budget.
As reflected in Table 19, City spending on charter schools is projected to be $2.21 billion in Fiscal 2020, a $113 million increase when compared to the Fiscal 2019 Adopted Budget. In total, charter school costs represent eight percent of the DOE’s budget. Funding for charter schools from DOE includes the per-pupil tuition for all enrolled students, supplementary funding for students with special needs, and facilities payments. Budgeted facilities payments are expected to grow by $7.3 million, from $61.4 million in Fiscal 2019 to $68.7 in Fiscal 2020; this includes $5.6 million for charter school leases paid directly by DOE. All of the expected year-over-year change was budgeted in prior financial plans. This budgeted increase accounts for the increase in per pupil charter tuition rates, the increased charter school population at existing charter schools that are expanding grades, and DOE’s best estimate of the increased charter school population at new charter schools that will open for the 2019-20 school year. The Independent Budget Office (IBO) believes that DOE is under-projecting charter school enrollment for Fiscal 2019 and in the outyears, and DOE will need to spend an additional $48 million in Fiscal 2019 and $55 million in Fiscal 2020 on charter school tuition.
Universal Pre-Kindergarten
The Department of Education added two new U/As for Universal Pre-Kindergarten (UPK) beginning in Fiscal 2016. U/As 407 and 408 include the PS and OTPS spending for UPK. UPK is now available for all four year olds in New York City in the following types of settings: 1) DOE pre-K Centers: programs exclusively for pre-k students led and operated by the DOE; 2) DOE District Schools: programs located within public elementary schools and overseen by the school’s principal; 3) NYC Early Education Centers (NYCEEC), which are community-based organizations that contract with the DOE to provide pre-k; and 4) Charter Schools: programs that operate under state-authorized charter.15 These U/As also reflect spending on 3-K.
Table 20 reflects spending on UPK with associated headcount. Spending in this area is evenly split between PS and OTPS. This is because of the types of settings in which pre-K is available; approximately half of pre-K seats are contracted out to community-based providers.
15 NYC Department of Education, Pre-Kindergarten. Available at: http://schools.nyc.gov/ChoicesEnrollment/PreK/ default.htm.
*The difference of Fiscal 2019 Adopted Budget compared to Fiscal 2020 Preliminary Budget.
Spending on UPK is expected to increase by $116.8 million in Fiscal 2020. A significant portion of this increase, as well as the increase in headcount, was reflected in previous financial plans and is associated with the expansion of 3-K. In addition, the Preliminary Budget adds $22 million to the Fiscal 2020 UPK budget for the expansion of 3-K to two additional school districts, District 8 and District 32, with an associated headcount increase of 93 positions. Most of this headcount is for 33 teachers and 33 paraprofessionals; the remainder is for social workers, expansion coordinators, outreach specialists, quality support, procurement, and other support positions. While the 3-K rollout in District 32 will be complete in Fiscal 2021, following the typical two-year rollout for 3-K, school District 8 will have a three-year rollout given the size of the district and existing capacity challenges.
The 14 3-K for All districts are listed in Table 21, including the year of rollout. Districts were chosen based on economic need (the 10 districts with the highest portion of students eligible for free and reduced price lunch are included); geographic diversity; and capacity. Currently 3-K for All is supported by City funds only. Enrollment for the current school year is included, which DOE provides pursuant to a Fiscal 2019 Term and Condition. Note this includes three year olds being served in ACS programs that will transfer to DOE on July 1, 2019.
Finance Division Briefing Paper Department of Education
31
Table 21. 3-K Program
First year of 3-K Community
School District Borough
2018-19 enrollment
2017-18 7 BX 1,098
23 BK 848
2018-19
4 MN 668
5 MN 630
16 BK 536
27 Q 1,311
2019-20
6 MN n/a
8 BX n/a
9 BX n/a
19 BK n/a
31 SI n/a
32 BK n/a
2020-21 12 BX n/a
29 Q n/a
The November and Preliminary Financial Plans also make collective bargaining adjustments to U/A 407, the largest of which is for the UFT contract, which increases the Fiscal 2020 UPK budget by $11 million. According to the Fiscal 2019 Headcount Report, in December 2018 the DOE had a total actual headcount of 5,339 in U/A 407.
As shown in Table 22, according to the PMMR, pre-K enrollment has remained fairly steady over the past three years, actually declining slightly in Fiscal 2018 compared to the previous two years. According to a Fiscal 2019 Term and Condition on pre-K enrollment, as of October 2018 there were 66,854 students enrolled in full-day UPK, of which 30,313, or 45 percent, were enrolled in a DOE pre-K Center or district public school. In addition, there were 2,044 students enrolled in a half-day pre-K program.16 The PMMR should include additional indictors reflecting the number of pre-k students by setting. Finally, the PMMR should reflect the portion of four year olds enrolled in City pre-K programs.
Full-day pre-K enrollment 68,547 69,510 67,881 * * NA NA
The PMMR does not include information about 3-K enrollment. According to a Fiscal 2019 Term and Condition on 3-K enrollment, enrollment in the current school year totals 5,091, as reflected in Table 21. The PMMR should include an indicator on 3-K enrollment, and should disaggregate enrollment by setting.
16 This is the unaudited registered as of October 31, 2018.
Finance Division Briefing Paper Department of Education
32
Early Childhood Programs
In 2017 the de Blasio Administration announced the planned transfer of the birth-to-five child care system, including EarlyLearn, from ACS to DOE. This move will consolidate all early education programs under the management of DOE, with the aim of creating a seamless public child care and education system. In order to reflect these changes, in the Fiscal 2018 Adopted Budget DOE added two new U/As for Early Childhood Education. As seen in Table 22, the Fiscal 2020 Preliminary Plan reflects the move of the contracted childcare system from ACS to DOE.
Table 23. U/As 409 & 410 – Early Childhood Programs Dollars in Thousands FY17 FY18 FY19 Preliminary Plan *Difference Actual Actual Adopted FY19 FY20 FY19 - FY20
*The difference of Fiscal 2019 Adopted Budget compared to Fiscal 2020 Preliminary Budget.
The increased spending on Early Childhood Programs is mostly due to the move of EarlyLearn from ACS to DOE, which was scheduled in previous financial plans. However, because the transfer had been initially scheduled for February 1, 2019, and is now delayed to July 2019, the Preliminary Financial Plan moves $209 million in Fiscal 2019 funding, with an associated headcount of 152, back to ACS. This is why the Preliminary Fiscal 2019 budget is lower than the Adopted Budget. The November Financial Plan reflected a transfer of Universal Literacy funding from School Support U/A 415 to the Early Childhood Program PS budget; this transfer funding is associated with a headcount of 515 and also contributes to the increase in headcount. The Preliminary Financial Plan also makes small collective bargaining adjustments to U/A 409, the largest of which is a $1.5 million addition to the Fiscal 2020 Budget related to the UFT contract. According to the Fiscal 2019 Headcount Report, in December 2018 the DOE had a total headcount of 425 in U/A 409.
Finance Division Briefing Paper Department of Education
33
The management and administration for all child care programs that serve approximately 30,000 children, including EarlyLearn center-based programs and Family Child Care Networks, will move from ACS to DOE July 1, 2019. On March 5, 2019, DOE released RFPs for early childhood education services beginning in Fiscal 2021. DOE expects to award contracts in Fall 2019 for services beginning in July 2020. All current EarlyLearn contracts will remain intact and will receive a contract extension until July 2020.
All providers with ACS child care and Head Start contracts, and DOE UPK and 3-K contracts, regardless of their contract expiration date, have been asked to apply to this RFP. DOE also anticipates applying for the new federal Head Start grant and will manage that as well; an RFP for Head Start/Early Head Start was released March 13, 2019. Finally, DOE expects to release an RFP for Family Child Care (FCC) Networks before the end of 2019. Only the contracted childcare system will move from ACS to DOE; ACS will continue to issue childcare vouchers to eligible families.
While this move should allow for a more streamlined early education system, there are areas of concern for the Council, including pay rates across the early childhood education system as well as ensuring the continuity of childcare sites. After the last EarlyLearn RFP, the Council stepped in to use discretionary funding to support programs that were community-supported but had not been awarded a contract; the Council does not want to repeat this situation. Currently, DOE does not have a plan to address pay parity.
School Support Organizations
Funding budgeted for School Support Organizations enables the DOE to provide field-based administrative and operational support to schools. This allocation also supports executive superintendents, community district education councils, family engagement staff, student placement offices, and the five borough offices that provide business, special education, and operational support to schools.
As reflected in Table 24, funding for school support is budgeted to decrease by $50.6 million in Fiscal 2020 when compared to the Fiscal 2019 Adopted Budget. Most of this decrease is due to a transfer of $53.7 million for Universal Literacy from U/A 415 to U/A 409, Early Childhood Programs; this also accounts for the decreased headcount. In addition, the Preliminary Plan accounts for a small amount of Central Budget travel savings in U/A 416, as well as some collective bargaining adjustments in U/A 415. Finally, the $8.6 million in baselined savings from Renewal School supports is taken from U/A 416. As previously mentioned, these are centrally procured contracts that are being reduced since the number of Renewal Schools has decreased; these savings to not affect school-based Renewal School supports.
Finance Division Briefing Paper Department of Education
34
Table 24. U/As 415 & 416 - School Support Dollars in Thousands FY17 FY18 FY19 Preliminary Plan *Difference Actual Actual Adopted FY19 FY20 FY19 - FY20
*The difference of Fiscal 2019 Adopted Budget compared to Fiscal 2020 Preliminary Budget.
Special Education Pre-Kindergarten
The DOE provides special education instructional services and related therapeutic services to pre-kindergarten aged children through contracts with non-public schools and private providers. None of the services funded in this program area, U/A 470, are directly provided by the DOE. The DOE also provides door-to-door bus transportation for these children.
As demonstrated in Table 25, Special Education Pre-Kindergarten is comprised of three service areas: tuition, professional direct education services, and transportation. Tuition is the largest spending area and totals $472.8 million in Fiscal 2020. Professional services, related to the direct instruction of students, are projected to be $300 million, and $105 million would be allocated to pupil transportation. The total Special Education Pre-Kindergarten budget is projected to be $877 million in Fiscal 2020, of which approximately two-thirds is reimbursed by the State. Overall, there is an increase in professional services, slightly offset by decreases in tuition and pupil transportation, when comparing the Fiscal 2020 Preliminary Budget to the Fiscal 2019 Adopted Budget. The changes in spending were reflected in previous financial plans; no adjustments to this U/A are made in the Preliminary Budget.
Table 25. U/A 470 - Special Education Pre-Kindergarten
Dollars in Thousands
2017 2018 2019 Preliminary Plan *Difference
Actual Actual Adopted 2019 2020 2019 - 2020
Other Than Personal Services Tuition $416,273 $436,932 $474,752 $474,752 $472,482 ($2,270) Professional Services 207,277 213,212 276,877 276,877 299,607 22,730 Pupil Transportation 82,859 93,515 107,343 107,343 105,073 (2,270)
TOTAL $706,408 $743,659 $858,973 $858,973 $877,163 $18,190
*The difference of Fiscal 2019 Adopted Budget compared to Fiscal 2020 Preliminary Budget.
Finance Division Briefing Paper Department of Education
35
There is significant concern that there are not enough special education pre-K seats for all the students who need them. At a recent Council hearing on special education, DOE testified they are aware of approximately 300 students who may need special education pre-K seats but do not have a seat. DOE has historically relied on private pre-school program to serve all children. Due to several factors, many private pre-schools have closed or are no longer part of the special education pre-K system. The State identified a need for additional special education pre-K programs across all five boroughs as of February 7, 2019; the full list of program shortages is available on the New York State Education Department website.17 The shortage of programs is partially attributed to the fact that the New York State Education Department, which sets the rate of reimbursement for these programs, has not increased the rate in many years. While DOE is working to open more special education pre-K classrooms, the cost of DOE providing these programs is significantly higher than the current rate of reimbursement set by the State.
Most special education pre-K students are served in non-public school settings, as reflected in data from the PMMR in Table 26. The number of students enrolled in special education pre-school remained approximately the same between Fiscal 2017 and 2018, though the portion enrolled in public school increased slightly.
Table 26. FY19 PMMR Pre-K Special Education Enrollment
- Non-public school 29,138 29,059 28,733 * * 21,352 21,104
Contract Schools, Carter Cases and Foster Care
Funds for Contract Schools, Carter Cases, foster care and blind and deaf schools are budgeted in U/A 472. Contract schools are private schools authorized by the State to provide special education instructional services and related therapies to children with conditions or disabilities who cannot be appropriately served by the City’s public schools. Carter cases refer to lawsuits in which the DOE is ordered by a court to reimburse parents for tuition costs at any private school after showing that the public school placement is inadequate. This program area also includes funding to pay for schooling provided to foster care children placed outside the New York City school district. Finally, funding for blind and deaf students’ instruction flow through this U/A. Table 27 reflects the costs of these program areas funded through U/A 472.
The Fiscal 2020 Preliminary Budget is $758 million, an increase of $26 million when compared to the Fiscal 2019 Adopted Budget. The increase in funding results from the combination of a $12 million increase in funding for in-state contract schools and a $13 million increase in funding for Carter Cases. These increases were budgeted in a prior financial plan as part of an adjustment to
17 New York State Education Department, “Seeking Applications – Preschool Programs in NYC.” Available at: http://www.p12.nysed.gov/specialed/publications/preschool/regional-need.html.
TOTAL $807,361 $858,979 $732,476 $732,476 $758,366 $25,890
*The difference of Fiscal 2019 Adopted Budget compared to Fiscal 2020 Preliminary Budget.
The Department provides little information regarding the number of students enrolled in private schools and the cost of enrollment at these schools. The PMMR should include indicators related to contract schools. According to a legislatively required report provided by DOE on students in out-of-state schools, there were 215 students in an out-of-state school as of December 31, 2018, at an average cost per student of $111,000.19
There has been a large increase in the number of carter cases, however, this area of the budget also lacks transparency as there is no publically available information on the number of carter cases annually, or the reasons children are being placed in private settings instead of finding appropriate placement in the public school system. As shown in Figure 7, while the Preliminary Budget reflects a $170 million decline in spending on Carter Cases in Fiscal 2019 compared to actual spending in Fiscal 2018, this does not accurately reflect expected spending. The Fiscal 2019 Executive Financial Plan added $80 million for Carter Cases in Fiscal 2018 only. The Council anticipates further changes will be made to the budget for Carter Cases in the Executive Financial Plan.
18 Actual spending in Fiscal 2018 was presented incorrectly in budget documents because approximately $70 million in spending on Carter Cases was incorrectly booked as spending on blind and deaf schools. Table 27 shows the approximate correct amount of actual spending in Fiscal 2018 based on adjusting $70 million of spending from blind and deaf schools to Carter Cases. DOE is working with the Comptroller’s office to update official budget documents to reflect the accurate spending amount. 19 New York City Department of Education, “Local Law 68 of 2009 – Billy’s Law Reporting, February 1, 2019.” Available at: https://infohub.nyced.org/docs/default-source/default-document-library/billys-law-report-2-1-2019.pdf.
Finance Division Briefing Paper Department of Education
37
An additional challenge in understanding spending on Carter Cases is that spending in any fiscal year includes payments for services in prior years; it is unclear what portion or amount of Carter Case spending in recent years has been for prior-year services.
Finally, there is concern that even though the de Blasio Administration has moved to settle Carter Cases more quickly, payments to parents are frequently delayed. At least a portion of this delay is due to inadequate staff for handling Carter Cases at DOE. These staff are budgeted with Central Administration, but no changes are made to these staffing levels in the Preliminary Budget. The Council expects to see changes to Central Administration spending on Carter Cases in the Executive Financial Plan as well. Year-to-date obligations for Carter Cases were $155.3 million as of January 2019.
Pupil Transportation
Funding budgeted in U/A 438 supports transportation service for students. Services include mandated door-to-door bus transportation for special education students and stop-to-school yellow bus transportation for qualifying elementary school students. Students not eligible for yellow bus service and older students receive free or half-fare passes for public bus and train lines, which include New York City Transit (MTA) and Staten Island Rapid Transit (SIRT). Funding included in U/A 438 does not include all of the DOE’s spending on student transportation: additional student transportation services are budgeted in U/A 470, Special Education Pre-Kindergarten, and administrative costs for the Office of Pupil Transportation (OPT) are budgeted in the Central Administration program area, U/As 453 and 454. Table 28 shows spending in U/A 438 related to
$199.0$222.2
$234.4
$312.3
$416.9
$463.3
$293.2$306.7
FY13 FY14 FY15 FY16 FY17 FY18 FY19 FY20
Actual Budgeted
Do
llars
in M
illio
ns
Figure 7. Cost of Carter Cases is Rising and Not Accurately Budgeted
Finance Division Briefing Paper Department of Education
38
pupil transportation. Spending for pupil transportation is a large part of the DOE’s budget, comprising 4.6 percent of the proposed Fiscal 2020 Preliminary Budget.
Table 28. U/A 438 - Pupil Transportation Dollars in Thousands
FY17 FY18 FY19 Preliminary Plan *Difference Actual Actual Adopted FY19 FY20 FY19 - FY20
Other Than Personal Services
Special Education Buses $747,747 $804,059 $779,195 $798,296 $788,706 $9,511 General Education Buses 380,347 374,174 347,067 347,067 359,361 12,294 GE Franchise Bus Payment 12,556 12,206 15,450 15,450 15,450 0 MTA Subsidy 45,000 527 45,000 45,000 45,000 0 SIRT Subsidy 1,104 876 1,723 1,723 1,723 0 Other 13,786 14,726 14,726 14,726 14,726 0 Financial Plan Savings 0 0 (813) (813) (813) 0
TOTAL $1,200,540 $1,206,567 $1,202,349 $1,221,450 $1,224,154 $21,805
*The difference of Fiscal 2019 Adopted Budget compared to Fiscal 2020 Preliminary Budget.
As shown in Table 27, the pupil transportation budget is budgeted to increase by $21.8 million for a total budget of $1.22 billion in Fiscal 2020. This increase was budgeted in previous financial plans. Note the DOE pre-paid most of its Fiscal 2018 bill for student MetroCards in Fiscal 2017. The Preliminary Budget reflects the DOE resuming standard MTA payments in Fiscal 2019 and in the outyears. There is also $813,000 in unspecified savings in Fiscal 2019 and 2020; these savings were baselined beginning in Fiscal 2019 in the Fiscal 2019 Preliminary Financial Plan.
According to information provided by the DOE to the Council in October 2018, there were 50 school bus vendors serving approximately 162,000 students on 8,100 bus routes. Of these students, approximately 54,000, or 33 percent, are special education students, however, special education routes comprise approximately 69 percent of all routes.
DOE provides busing to students according to eligibility criteria outlined on its website.20 The State require the City providing busing to private school students; the budget does not break out the cost of these bus routes. In addition, in 2016, the DOE began providing special routes for busing students in Department of Homeless Services (DHS) shelters. DOE can transport some children in shelters on existing yellow school bus routes, but in some cases, additional routes must be added, therefore increasing the overall cost for general education transportation. It is unclear how much DOE spends on the additional bus service for these students; DOE does not provide the number of additional routes it has specifically for students in shelter which would allow an estimate of the cost. According to a Fiscal 2019 Term and Condition, for the period from July 1, 2018 through December 15, 2018, a total of 8,859 students in shelter were provided with a bus route for at least one day, and an additional 416 students in shelter were waiting to be routed.21 Because students’ housing status change regularly there are always students in shelter waiting to be routed; according to DOE
20 Department of Education, “Bus Eligibility.” Available at: https://www.schools.nyc.gov/school-life/transportation/bus-eligibility. 21 These totals include students with IEPs requiring transportation, students who would be otherwise eligible for busing under typical busing rules, as well as students receiving bus service because they reside in shelter. Because a students’ status can change over time, it is possible that a student is counted as both having received busing services during the reporting period as and waiting to be routed as of December 14, 2018.
Finance Division Briefing Paper Department of Education
39
students in shelter are typically routed within a week of completed information being received by the Office of Pupil Transportation (OPT).
The PMMR does not provide any performance indicators regarding student transportation. Most critically, the PMMR does not include data on the number of students who use OPT services, either yellow bus service or passes for public transportation. While NYC Open Data does provide some information on bus routes, bus drivers and attendants, bus breakdowns and delays, vehicles, and transportation sites, performance data related to student transportation should be included in the PMMR to better align indicators with spending. Ideally, PMMR indicators related to pupil transportation would help to explain if changes in pupil transportation spending are due to increases in the number of students served, the number of bus routes, increased baseline contract costs, or some combination of these factors. They would also reflect the quality of the pupil transportation service being provided. Pursuant to Local Law 34 of 2019, the DOE will be required to report on pupil transportation services beginning in October 2019.
In addition, pursuant to Local Law 32 of 2019, the DOE is required to equip all school buses with GPS technology by the start of the 2019-20 school year. While the approximately 6,000 buses used for special education bus routes are already equipped with GPS, on March 8, 2019, the DOE issued a RFP for school bus GPS technology for all approximately 10,000 school buses. The services requested under this RFP also include school bus routing software and a school bus route app for both the DOE and students’ parents/guardians. The cost of this new comprehensive GPS and routing system is not yet reflected in the Fiscal 2020 Preliminary Budget.
Pupil Transportation Contracts
OPT does not own any school buses or employ any bus drivers; all school bus service is contracted with various school bus companies (bus vendors). Bus drivers and attendants (sometimes referred to as ‘escorts’) are employed by bus vendors themselves.
Contracts covering approximately 83 percent of school bus routes expired on June 30, 2018; the rest of the school bus routes are covered by contracts that expire June 30, 2019. DOE is currently using thirty-day emergency contract extensions to continue these services while they negotiate new five-year contracts with existing pupil transportation vendors. It is unclear how these new contracts will affect the overall cost of pupil transportation and how costs would compare to those under the emergency contracts, which are simply based on the costs of the most recent expired contracts.
Figure 8 shows total spending on pupil transportation contracts across all U/As (while most of the spending is budgeted in U/A 438, small amounts are budgeted in school budgets, in the UPK budget, and in the Contract Schools budget). Actual costs for in Fiscal 2018 were approximately $61 million higher than is currently budgeted, and DOE expects actual spending in Fiscal 2019 will exceed the budgeted amount. This is partly due to the fact that some vendors have discontinued providing services since their contracts expired on June 30, 2018 and these routes at to be reassigned to other vendors, usually at a higher cost. Whether or not new bus contracts include employee protection provisions (EPPs) will also affect their cost; this is discussed further under School Bus Grant Program.
Finance Division Briefing Paper Department of Education
40
School Bus Grant Program & Employee Protection Provisions (EPPs) At the end of the 2013-14 school year the City rebid school bus contracts for approximately 1,600 routes and removed the employee protection provisions (EPPs), which had previously been included in these contracts. EPPs required school transportation contractors to give priority in hiring to employees who became unemployed because their employer lost DOE bus contract work and to pay these employees the same wages and benefits they received before becoming unemployed.
In order to extend the wage protections formerly offered by the EPP, Local Law 44 of 2014 authorized the Department of Small Business Services (SBS) to establish a voluntary grant program to supplement the wages of school bus employees who lost their employee protection provisions through the newly awarded bus contracts. The Local Law expired on December 31, 2015, however, SBS has continued the School Bus Grant Program every year since. Total spending on the NYC School Bus Grant Program from Fiscal 2014-2018 is approximately $183 million. This funding has supported only one vendor: Reliant Transportation. SBS’s Fiscal 2020 Preliminary Budget does not include funding for the School Bus Grant Program.
On December 29, 2017 DOE issued a request for bids (RFB) for school bus services on 1,600 of the City’s approximately 8,200 routes to replace existing contracts that expired in June 2018. The RFB included employee protections for seniority and pay, however, the DOE was prevented from opening the bids under a lawsuit challenging the legality of these employee protections.
If the State provides the City with the authority to include EPPs in its school bus contracts, this may further affect the cost of the pupil transportation contracts the DOE is currently negotiating, or may result in new contracts that are procured at a later date and include EPPs.
School Food Services
The Department’s Office of School Food oversees DOE’s breakfast and lunch programs and is supported with funding allocated to U/As 439 and 440. According to the DOE, School Food works to promote healthy food choices by students and maintains high nutritional standards while offering healthy menu choices. School breakfast and lunch are free for any public school student.
$1,305$1,245 $1,245
$0
$200
$400
$600
$800
$1,000
$1,200
$1,400
FY13 FY14 FY15 FY16 FY17 FY18 FY19 FY20
Actual Budgeted
Do
llars
in M
illio
ns
Figure 8. DOE Pupil Transportation Contract Spending Is Increasing, Not Appropriately Budgeted
Finance Division Briefing Paper Department of Education
41
DOE began providing free school lunch to all students, including students enrolled in charters and non-public schools who participate in the DOE School Food program, through the federal Community Eligibility Program (CEP) at the start of the 2017-18 school year. DOE now collects the highest rate of reimbursement for each lunch served. Last year, DOE’s budget recognized an additional $38 million in federal revenue due to the switch to the CEP. Since the City’s certification for the CEP is for four years, the Preliminary Plan recognizes this revenue through Fiscal 2021.
DOE also provides free breakfast to all public school students. School Breakfast is offered three ways in schools.
1. Breakfast in the Classroom (BIC): students eat in their classroom while the teacher takes attendance and/or makes announcements.
2. Grab & Go: stations are set up, determined by the principal in consultation with the School Food Service Manager, and students can pick up a packaged breakfast and take it with them to class.
3. A traditional service line in a cafeteria prior to the school day where students are provided breakfast.
As reflected in Table 29, only small changes are budgeted for school food. The small increases in PS spending are due to collective bargaining agreement adjustments. In addition, the November 2018 Financial Plan baselined $7.6 million in school food savings, accounting for most of the reduction in OTPS spending. These savings are is slightly offset by planned increases in OTPS spending for BIC expansion scheduled in the Fiscal 2018 Adopted Financial Plan.
Table 29. U/As 439 & 440 - School Food Dollars in Thousands
FY17 FY18 FY19 Preliminary Plan *Difference Actual Actual Adopted FY19 FY20 FY19 - FY20
*The difference of Fiscal 2019 Adopted Budget compared to Fiscal 2020 Preliminary Budget.
Finance Division Briefing Paper Department of Education
42
As reflected in Table 30, the PMMR for Fiscal 2019 shows that from Fiscal 2016 to 2018 both the average number of school lunches and breakfasts served daily increased. The increase in school lunches served from Fiscal 2017 to 2018 is attributed to the transition to universal free lunch.
Table 30. FY19 PMMR - School Meals
Performance Indicators
Actual Target 4-Month Actual
FY16 FY17 FY18 FY19 FY20 FY18 FY19
Average lunches served daily 599,920 584,439 610,138 * * NA NA
Average breakfasts served daily 244,666 268,286 271,601 * * NA NA
The PMMR and MMR should report additional metrics and costs associated with school food, such as average cost per breakfast and average cost per lunch, in order to paint a more complete picture of spending associated with providing schools meals.
Additionally, the PMMR and MMR should include information to demonstrate how BIC is performing. In April 2018, the New York State Budget included a mandate that any school with at least 70 percent of students qualifying for free or reduced price lunch must implement a Breakfast After the Bell program starting in September 2018. In May 2018, the New York State Education Department released the list of schools mandated to implement Breakfast After the Bell, including approximately 1,100 schools in New York City.22 However, it is unclear how many of these schools are actually implementing Breakfast after the Bell. According to a report required by Local Law 60 of 2011, in the 2017-18 school year only 420 schools had implemented BIC.23
Central Administration
U/As 453 and 454 contain funding for the DOE’s administrative offices. Functions include portfolio planning, operations, finance and school budget planning, enrollment, school safety, youth development, special investigations, intergovernmental affairs, equal opportunity, public information, community engagement, legal services, and labor relations.
As reflected in Table 31, spending for Central Administration is projected to increase by $21 million in Fiscal 2020 when compared to the Fiscal 2019 Adopted Budget. This increase is largely due to $25.4 million added to the Preliminary Budget for technology funded by the Smart Schools Bond Act (SSBA). In addition, the Preliminary Plan makes collective bargaining adjustments to Central Administration PS spending, adds headcount of 10 to support the new need for EduStat at a cost of $1.2 million in Fiscal 2020, adds funding to support the expansion of 3-K to two additional districts, and baselines some savings related to central budget professional development and travel. In addition, the November 2018 Financial Plan baselined $4 million in savings from a reduction of 48 positions that had already been recognized for Fiscal 2019 in a prior financial plan.
22 New York State Education Department, “New York State Legislation: Mandatory Breakfast After the Bell Implementation and Reporting of Breakfast Delivery Methods.” Available at: http://www.cn.nysed.gov/content/breakfast-after-bell-implementation-and-reporting-breakfast-delivery-methods. 23 New York City Department of Education, Local Law 60 of 2011. Available at: https://infohub.nyced.org/reports-and-policies/government/intergovernmental-affairs/local-law-60-2011.
*The difference of Fiscal 2019 Adopted Budget compared to Fiscal 2020 Preliminary Budget.
The largest area of Central Administration spending is for the Division of Instructional and Information Technology (DIIT). DIIT’s headcount as of December 2018 is 345. These and other Central Administration areas of spending over $10 million in Fiscal 2020 are shown in Figure 9.
Spending on Legal Services and Pupil Transportation may be under budgeted. As previously discussed, the number of Carter Cases is increasing, and caseloads are too high for existing DOE staff. DOE has been given the authorization to hire additional staff to handle Carter Cases but this
$97,419
$25,426
$22,061
$19,873
$15,180
$14,004
$10,304
$11,539
$11,176
$11,175
$11,114
$11,052
$117,709
DIIT
Smart Schools Technology
Division of Assessment and Accountability
Division of Human Resources
Division of Finance Operations
Office of Student Enrollment Planning and Operations
Division of Support Services
Financial Systems and Business Ops
Office of Legal Services
Office of Pupil Transportation
Recruitment
Office of Purchasing Management
Other
Dollars in Thousands
Figure 9. DOE FY20 Central Administration Budet by Program Areas
Finance Division Briefing Paper Department of Education
44
headcount and its associated cost is not yet reflected in the Fiscal 2019 or 2020 budget. The DOE General Counsel and Office of Legal Services’ headcount as of December 2018 is 166. According to testimony offered at a Council hearing on OPT in October 2018, DOE is working to restructure OPT, which may include hiring additional staff and/or converting part-time staff to full-time staff. No changes reflecting restructuring are made to the OPT budget. OPT’s headcount as of December 2018 is 105.
School Facilities
School Facilities funding is budgeted in U/As 435 and 436. Funding for this program area supports the DOE’s building maintenance and custodial operations. The Division of School Facilities (DSF) also completes some capital projects for which DOE receives revenue from the School Construction Authority, though this revenue is not necessarily received in the same year in which the projects are completed. DSF handles small capital projects such as classroom conversions and bathroom upgrades and these are largely done using job-order contracts funded in the OTPS budget.
School Facilities funding also supports the contract with New York City School Support Services (NYCSSS), a non-profit created in April 2016 to provide custodial staff for DOE schools. Custodial engineers, cleaners, handypersons, firepersons, and stationary engineers that work in DOE schools are employed through NYCSSS and overseen by DSF.
When NYCSSS was created, adjustments to the School Facilities budget reflecting the new custodial services structure were only made through Fiscal 2019, the final year of the initial three-year contract. As a result, the Fiscal 2020 budget does not account for the cost of the NYCSSS contract or the custodial restructuring. The current budgeted spending for School Facilities is inaccurate, reflecting PS spending that needs to be reallocated to the OTPS budget for the NYCSSS contract, given the NYCSSS workers are no longer employed directly by DOE. This why Table 32 reflects significant changes when comparing the Fiscal 2020 Preliminary Budget to the Fiscal 2019 Adopted Budget. It is unclear how much NYCSSS will cost in Fiscal 2020 and the outyears; OMB has said they are working with DOE to understand the full cost of NYCSSS and efficiencies generated from the changed custodial structure; they expect to reflect the updated cost in the Executive Budget.
While the creation of NYCSSS was meant to be cost-neutral, this initial projection was incorrect. In In Fiscal 2017 significant funding for NYCSSS start-up costs were added to the budget: approximately $42 million annually in Fiscal 2017-2019, and $36 million in Fiscal 2020. Some of the funding was to ensure that school custodial staff are paid prevailing wage rates. Further modifications have been made to support the NYCSSS contract in subsequent financial plans, including adjustments made in the November 2018 Financial Plan and the Preliminary Plan. These adjustments were made to account for higher than expected fringe costs, as well as additional custodial services required for new schools. While the current budget for the NYCSSS contract is $649 million, DOE expects to spend $672 million on the NYCSSS contract in the current fiscal year, a shortfall of approximately $22 million.
Finance Division Briefing Paper Department of Education
45
Table 32. U/As 435 & 436 - School Facilities Dollars in Thousands
FY17 FY18 FY19 Preliminary Plan *Difference Actual Actual Adopted FY19 FY20 FY19 - FY20
TOTAL $1,185,764 $1,239,439 $1,066,376 $1,194,741 $903,170 ($163,205)
Positions Non-Pedagogical 621 625 653 659 659 6
TOTAL 621 625 653 659 659 6
*The difference of Fiscal 2019 Adopted Budget compared to Fiscal 2020 Preliminary Budget.
The budgeted headcount reflected in Table 32 is mostly for skilled trade positions. There are also 825 full-time Custodial Engineers employed directly by DOE, but their headcount is not reflected in DOE’s financial plan. In addition, NYCSSS employs approximately 7,350 full-time and part-time employees.
The School Facilities budget also reflects additional CDBG funding added in the November 2018 Financial Plan. The additional CDBG funding for DOE was the result of the City receiving a larger CDBG allocation this year than it has historically. The most significant addition was $66.5 million in Fiscal 2019 and 2020 for accessibility projects. This funding is in addition to previously budgeted funding for accessibility projects. Examples of accessibility projects funded by School Facilities include braille signage, accessible stage lifts, assistive listening devices, accessible doorbells, and modifications of spaces such entrances and bathrooms to make them fully accessible (i.e. adding handrails). DOE is still working to identify projects to be completed with Fiscal 2019 funds, and will likely roll some of the CDBG funding from Fiscal 2019 into Fiscal 2020.
In addition to accessibility, some CDBG funding is added for code violation removal, school kitchen renovations, and environmental health inspections. Some of the environmental health inspections funding will be used for EarlyLearn sites; this funding used to go to ACS.
Energy and Leases
Funding for heat, light, power, and fuel oil, as well as leases is scheduled in U/A 444. As shown in Table 33, there are minimal changes proposed for this area between the Fiscal 2019 Adopted Budget and the Fiscal 2020 Preliminary Budget. Though lease costs are declining overall, $1.8 million was added in the Fiscal 2018 Adopted Budget for 21 leases of physical education space. In addition, the
Finance Division Briefing Paper Department of Education
46
Preliminary Budget doesn’t yet reflect the lease costs of six newly leased pre-K sites that will open for the 2019-20 school year. DOE expects these costs to be reflected in the Executive Financial Plan.
According to a DOE Term and Condition on lease costs, the Department leases 267 buildings at a total cost of $262.4 million. Table 34 shows the number of leases held by DOE with their expiration date. While half of leases won’t expire for at least 10 years, 12 leases have already expired and another 52 leases will expire sometime in the next five years.
Table 34. DOE Leases
Expiration Date # of Leases % of Leases
Expired 12 4%
2019-23 52 19%
2024-28 68 25%
2029- 135 51%
School Safety
The Department of Education pays the New York Police Department (NYPD) via an intra-city payment to provide security services at all public schools. The school safety agents who work in the schools are employees of the NYPD, not the DOE. A Memorandum of Understanding between the two departments outlines the NYPD’s role in securing the schools.
As reflected in Table 35, funding for School Safety is $407 million in the Fiscal 2020 Preliminary Budget, an increase of $34 million from the Fiscal 2019 Adopted Budget. This increase is entirely to support the increased cost of existing staff due to collective bargaining agreements; there is no budgeted increase in headcount. A total of $290.9 million goes directly to the NYPD through an intra-city payment; the remaining funding goes to the miscellaneous budget to support fringe costs associated with NYPD school safety staff.
Table 35. U/A 442 - School Safety Dollars in Thousands
FY17 FY18 FY19 Preliminary Plan *Difference Actual Actual Adopted FY19 FY20 FY19-FY20
TOTAL $345,283 $378,057 $373,741 $403,079 $407,330 $33,589
*The difference of Fiscal 2019 Adopted Budget compared to Fiscal 2020 Preliminary Budget.
Table 36 shows spending on school safety in NYPD’s budget. As previously mentioned, all of the increased spending is related to the increased cost of school safety agents given their salary schedule.
Table 33. U/A 444 - Energy & Leases Dollars in Thousands
2017 2018 2019 Preliminary Plan *Difference Actual Actual Adopted 2019 2020 2019 - 2020
Other Than Personal Services Leases $228,673 $235,331 $227,128 $227,128 $227,128 $0 Heat, Light, Power & Fuel Oil 212,084 231,415 221,615 221,615 221,615 0 Fuel 39,816 50,978 65,125 65,138 65,151 27
TOTAL $480,573 $517,724 $513,867 $513,880 $513,894 $0
*The difference of Fiscal 2019 Adopted Budget compared to Fiscal 2020 Preliminary Budget.
Finance Division Briefing Paper Department of Education
47
Table 36. NYPD School Safety Spending Dollars in Thousands
*The difference of Fiscal 2019 Adopted Budget compared to Fiscal 2020 Preliminary Budget.
The mission of the School Safety Division in the NYPD is to provide a safe environment, conducive to learning, where students and faculty can be free from hostility and disruptions which could negatively impact the educational process. Data from the Fiscal 2019 PMMR reflected in Table 37 shows criminal activity in schools has mostly been trending downward thus far in Fiscal 2019, though there were increases year over year from Fiscal 2017 to 2018 in all categories outside seven major crimes.24
The DOE passes state aid for textbooks, library books, data processing supplies, and other school supplies to non-public schools. The DOE also provides support for the Fashion Institute of Technology (FIT). As reflected in Table 38, of the $93.1 million budgeted in U/A 474, $57.9 million supports FIT. The $15.3 million increase in Supplies and Materials is due to funding from the Smart
24 Seven major crimes includes all crimes categorized as a major index crime (murder and non-negligent manslaughter, forcible rape, robbery, felonious assault, burglary, grand larceny, and grant theft auto) occurring within City public schools. Other criminal categories includes all other reported felonies and misdemeanors occurring within City public schools. Other incidents includes all serious non-criminal incident occurring within City public schools.
Finance Division Briefing Paper Department of Education
48
School Bond Act for technology; all Smart Schools Bond Act funding that DOE will receive in the expense budget (rather than spending through the Capital Budget) is being recognized in the Preliminary Financial Plan. The DOE does not control the amount of funding budgeted in U/A 474, as all of the allocations are formulaic pass-through funding required by the State.
Table 38. U/A 474 - Non-Public Schools Dollars in Thousands
FY17 FY18 FY19 Preliminary Plan *Difference Actual Actual Adopted FY19 FY20 FY19-FY20
Subtotal, Other Adjustments $841,994 ($8,742) $833,252 $341,153 $62,190 $403,343
TOTAL, All Changes $790,587 $125,987 $916,574 $243,774 $168,264 $412,037
Agency Budget as of the Preliminary 2020 Budget $13,144,591 $13,365,153 $26,509,744 $13,083,117 $13,810,524 $26,893,641
B. Council Initiatives
A Greener NYC ($110,000). This initiative supports environmentally friendly focused programs that encourage education, advocacy, community service, and green-job training, contributing to the improvement and conservation of NYC’s air, land, energy, open spaces, and other vital resources.
Child Mind Institute ($500,000). The supports the Child Mind Institute’s Stress and Resilience program, which provides mental health services to students exposed to trauma, and supports and builds the capacity of school personnel and parents to effectively treat symptoms of trauma and stress.
Community Schools ($2,750,000). Funds support the NYC Community Learning Schools Initiative, and will directly support community school resource directors, social workers, health services, and
Finance Division Briefing Paper Department of Education
51
professional development. This initiative also supports the Children’s Health Fund to provide the Healthy and Ready to Learn Program, which provides technical assistance, training, and resources to schools throughout the City.
Crisis Management System, CMS ($640,000). CMS is a collection of interrelated programs intended to reduce incidences of shootings in the City. The CMS is anchored by cure violence programs. Additional programs include, job training, mental health supports, public messaging, community therapeutic work, legal services, school-based youth development programs that work together to help communities heal from gun violence, prevent gun violence and change community norms.
Dropout Prevention and Intervention Initiative ($2,485,000). This allocation supports a range of student support, school restructuring, and professional development services intended to prevent high school dropout.
Educational Programs for Students ($4,740,000). This allocation supports direct educational initiatives for students including, but not limited to literacy, math, science and technology programs.
LGBT Inclusive Curriculum ($600,000). This allocation funds the DOE’s effort to support the needs of LGBTQ youth and address the intersectionality of race, sexual orientation and gender identity through DOE’s general curriculum. The funding supports professional development for public school teachers as well as integrating LGBTQ inclusive curriculum into literacy and history classes.
Peter F. Vallone Academic Scholarship ($631,000). This allocation provides scholarships to eligible CUNY and FIT students during the 2018-19 academic year.
Physical Education and Fitness ($1,125,000). This allocation helps to improve fitness levels and the overall health of students by providing physical activity and fitness programs. Programs supported under this initiative include the Small Schools Athletic League ($1,000,000) and CHAMPS ($125,000). In addition, $800,000 supports the New York Junior Tennis League’s School Time Tennis Program, Community Tennis Program, and other educational programs.
Support for Educators ($20,804,500). This allocation to DOE supports the Teacher’s Choice program, which reimburses school staff for supplies. In addition, $450,000 is allocated to the Council of School Supervisors and Administrators to support the Executive Leadership Institute.
Work-Based Learning Internships ($600,000). This allocation supports paid internships for students enrolled in DOE Career and Technical education Programs (CTE). CTE programs provide work-based learning opportunities for students in industries aligned with their CTE program.
Finance Division Briefing Paper Department of Education
52
C. DOE FY20 Preliminary Contract Budget Dollars in Thousands
Category FY19
Adopted # of
Contracts FY19
Preliminary # of
Contracts FY20
Preliminary # of
Contracts *Difference FY19 - FY20
Bank Charges - Public Assistance Accounts $154 1 $154 1 $154 1 $0 Bus Transportation for Reimbursable Programs 40 1 40 1 40 1 0 Charter Schools 2,091,412 235 2,091,412 235 2,204,114 235 112,702 Cleaning Services 181 3 181 3 181 3 0 Contractual Services - General 844,440 60 905,926 60 899,360 60 54,921 Data Processing Equipment 37,443 76 32,638 77 38,845 77 1,402 Day Care Of Children 128,137 669 2,000 669 310,275 669 182,138 Educ. and Rec. Expenditures for Youth Programs 3,724 120 4,725 121 4,725 121 1,001 Head Start 53,185 89 0 89 127,645 89 74,460 Maintenance and Operation of Infrastructure 824,315 419 968,832 420 311,639 418 (512,676) Maintenance and Repairs - Motor Vehicle Equip 178 6 178 6 178 6 0 Office Equipment Maintenance 1,837 58 1,837 58 1,822 58 (15) Payments to Delegate Agencies 59 1 59 1 59 1 0 Pmt to Contract & Corporate Schools for Handicapped Kids 1,499,161 1,781 1,467,321 1,781 1,611,498 1,781 112,337 Printing Services 7,458 53 14,477 54 6,553 54 (905) Prof. Services - Accounting Services 3,210 2 3,210 2 3,210 2 0 Prof. Services - Computer Services 36,566 84 35,458 84 35,998 84 (568) Prof. Services - Curriculum and Professional Develop. 155,296 605 156,816 606 133,660 606 (21,636) Prof. Services - Direct Educational Services to Students 832,231 1,149 854,992 1,149 875,476 1,149 43,244 Prof. Services - Engineering and Architectural Services 1,836 7 1,833 7 1,833 7 (3) Prof. Services - Legal Services 12,034 52 12,034 52 10,834 52 (1,200) Prof. Services - Other 177,011 434 173,726 435 157,426 435 (19,586) Security Services 322 4 322 4 322 4 0 Telecommunications Maintenance 5,392 48 5,392 48 4,230 48 (1,162) Temporary Services 24,611 76 24,462 77 24,497 77 (114) Training Program for City Employees 4,457 3 4,629 3 4,292 3 (165) Transportation Of Pupils 1,225,310 344 1,244,536 345 1,244,894 344 19,585 Transportation Services 4,882 24 4,882 24 4,882 24 0
TOTAL $7,974,884 6,404 $8,012,072 6,412 $8,018,642 6,409 $43,758