Energy Sector Management Assistance Program Formal Report 333/10 May 2010 Honduras: Power Sector Issues and Options Formal Report 333/10 Honduras: Power Sector Issues and Options Public Disclosure Authorized Public Disclosure Authorized Public Disclosure Authorized Public Disclosure Authorized
Transcript
Energy Sector Management Assistance Program
Formal Report 333/10
May 2010
Ho
nd
uras: P
owe
r Se
ctor Issu
es and
Op
tion
sFo
rmal R
ep
ort 3
33
/10
Honduras: Power SectorIssues and Options
5176-COVR.pdf ii 5/19/10 1:11 PM
Pub
lic D
iscl
osur
e A
utho
rized
Pub
lic D
iscl
osur
e A
utho
rized
Pub
lic D
iscl
osur
e A
utho
rized
Pub
lic D
iscl
osur
e A
utho
rized
wb406484
Typewritten Text
72296
Green Initiative
Environmental Benefi ts Statement
The Energy Sector Management Assistance Program, together with the World Bank, is committed to
preserving endangered forests and natural resources. To this end, this publication has been printed
on chlorine-free, recycled paper with 30 percent postconsumer fi ber in accordance with recom-
mended standards for paper usage set by the Green Press Initiative, a nonprofi t program supporting
publishers in using fi ber that is not sourced from endangered forests. For more information, visit
All rights reservedProduced in the United StatesFirst printing May 2010
ESMAP Reports are published to communicate the results of ESMAP’s work to the development community with the least possible delay. Some sources cited in this paper may be informal documents that are not readily available.
The fi ndings, interpretations, and conclusions expressed in this paper are entirely those of the author and should not be attributed in any manner to the World Bank or its affi liated organizations, or to members of its Board of Executive Directors or the countries they represent. The World Bank does not guarantee the accuracy of the data included in this publication and accepts no responsibility whatsoever for any consequence of their use. The Boundaries, colors, denominations, other information shown on any map in this volume do not imply on the part of the World Bank Group any judgment on the legal status of any territory or the endorsement or acceptance of such boundaries.
The material in this publication is copyrighted. Requests for permission to reproduce portions of it should be sent to the ESMAP Manager at the address shown in the copyright notice above. ESMAP encourages dissemina-tion of its work and will normally give permission promptly and, when the reproduction is for noncommercial purposes, without asking a fee.
5176-FM.pdf ii 5/19/10 1:12 PM
iii
Acknowledgments ixCurrency Equivalents xiList of Acronyms xiiiExecutive Summary xv
2. Fiscal Impact 9Electricity Subsidies and Financial Losses 9Equity Contributions and Net Transfers to ENEE 9Tax Exemptions 10
3. Reliability of Power Supply 11Retrospective 11Generation Expansion 17
4. Institutional Arrangements and the Regional Power Market 25Introduction 25The Sector Reform of 1994 25
5. Pricing Policies 33Electricity Price Setting 33Need to Update Tariffs 33Comparison with Economic Costs 34Comparison with Central America’s Tariffs 34Subsidies 34Normalizing ENEE’s Tariffs 37
6. Access to Electricity 41Introduction 41The Institutional Framework 42Existing Social Electrifi cation Policies and Regulations 42Current Coverage of Electricity Service 43Level of Investment and Sources of Funding 44Electrifi cation Challenges 44
Contents
5176-FM.pdf iii 5/25/10 10:33 AM
HONDURAS: POWER SECTOR ISSUES AND OPTIONS
PART B—POLICY OPTIONS TO MEET SECTOR CHALLENGES 47
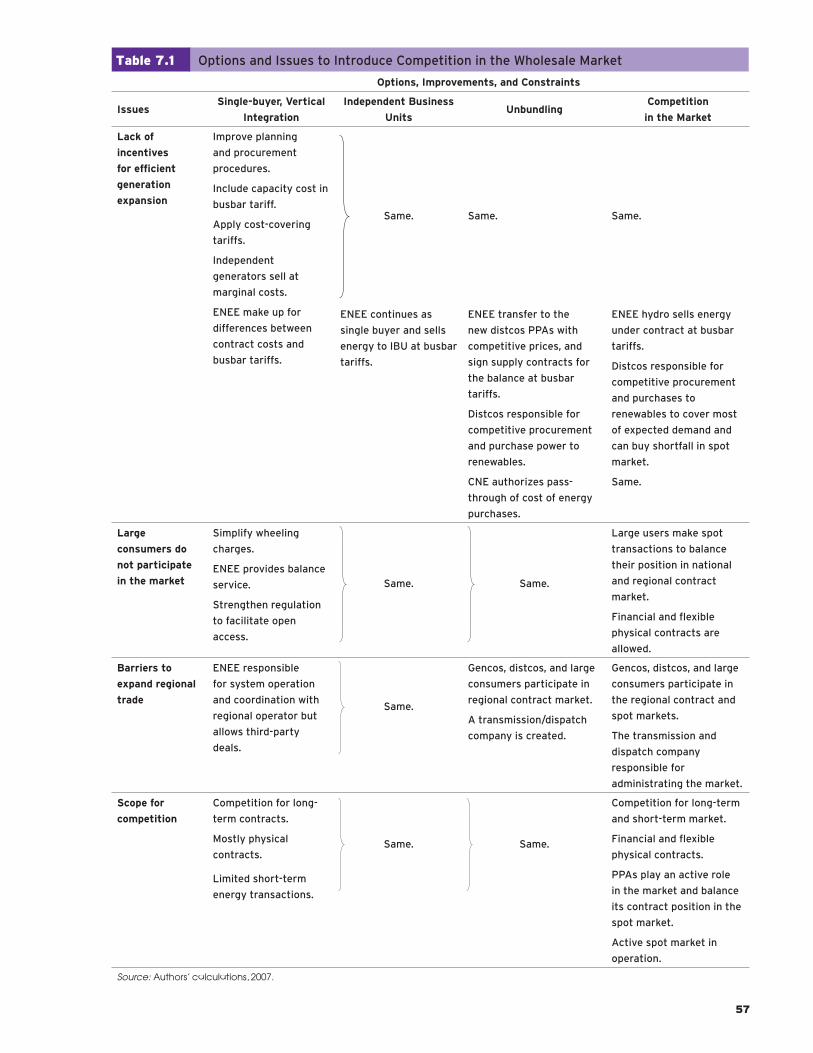
7. Improving Sector Effi ciency 49Good Corporate Governance and Management of ENEE 49Developing a Competitive Wholesale Power Market 53Improving the Institutional Arrangements 56
8. Ensuring Financial Sustainability 59Cost of Energy Purchases 59ENEE’s Investment Program 60Financial Projections 62
9. Improving Electricity Coverage 67Assessment of Electrifi cation Policies 67Identifying Investment Needs 68Analysis of Tariffs and Subsidies—Recommendations for a Sustainable Scheme 70
10. Diversifying Energy Sources 75Development of Large- and Medium-sized Capital-intensive Projects 76Development of Small Renewable Energy Projects 80Expanding Energy Trade with the Regional Market 81Energy Effi ciency 82
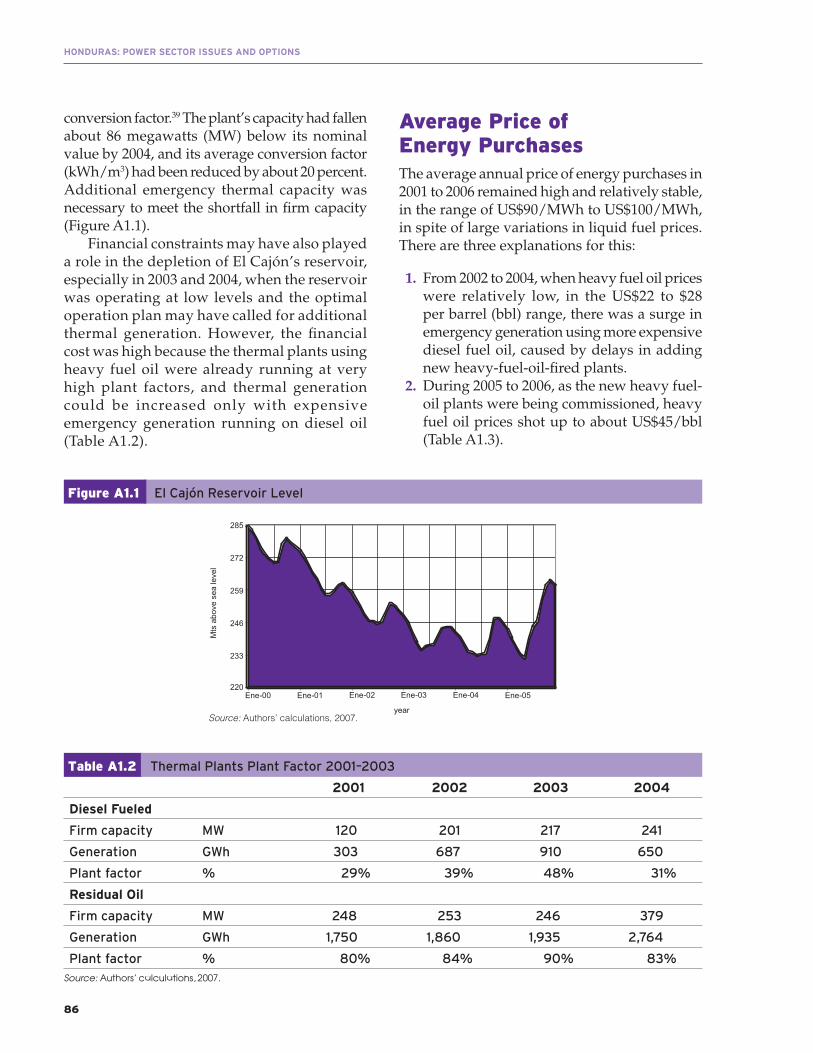
Annex 1: ENEE’s Financial Situation—Detailed Analysis 85Drop in Hydroelectric Generation 85Average Price of Energy Purchases 86The Surge of Thermal Generation Using Diesel Oil 87Investment 91Balance Sheet 91
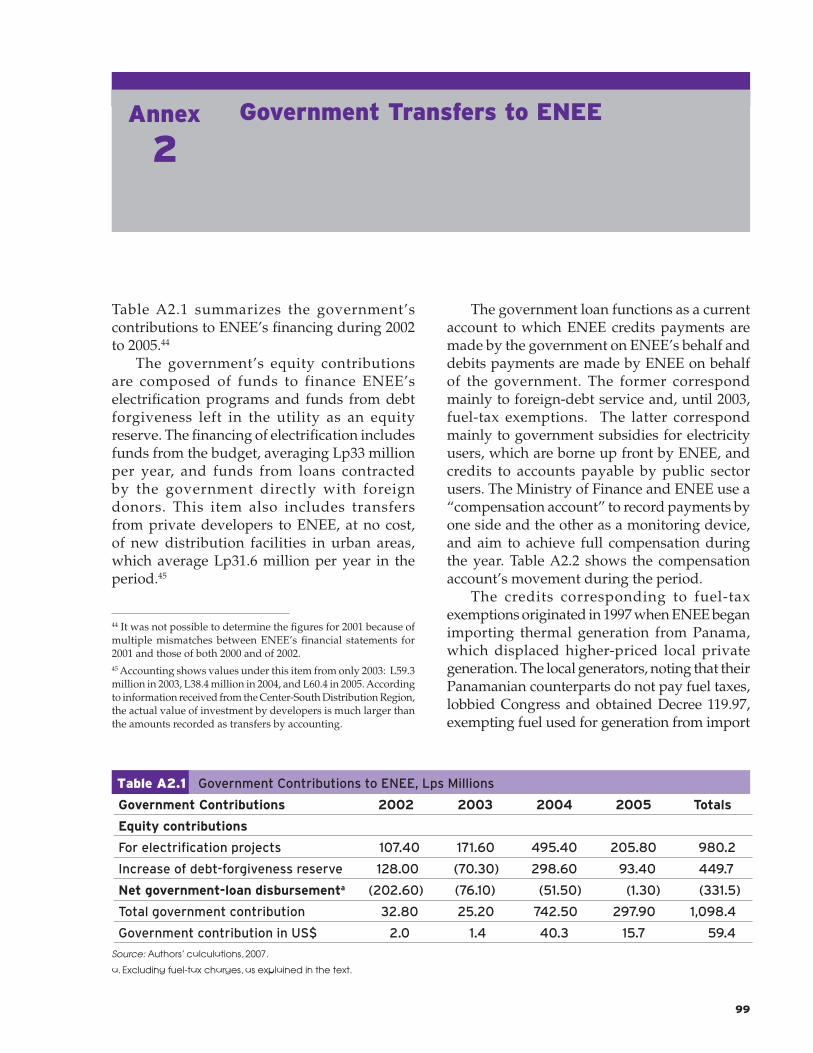
Annex 2: Government Transfers to ENEE 99
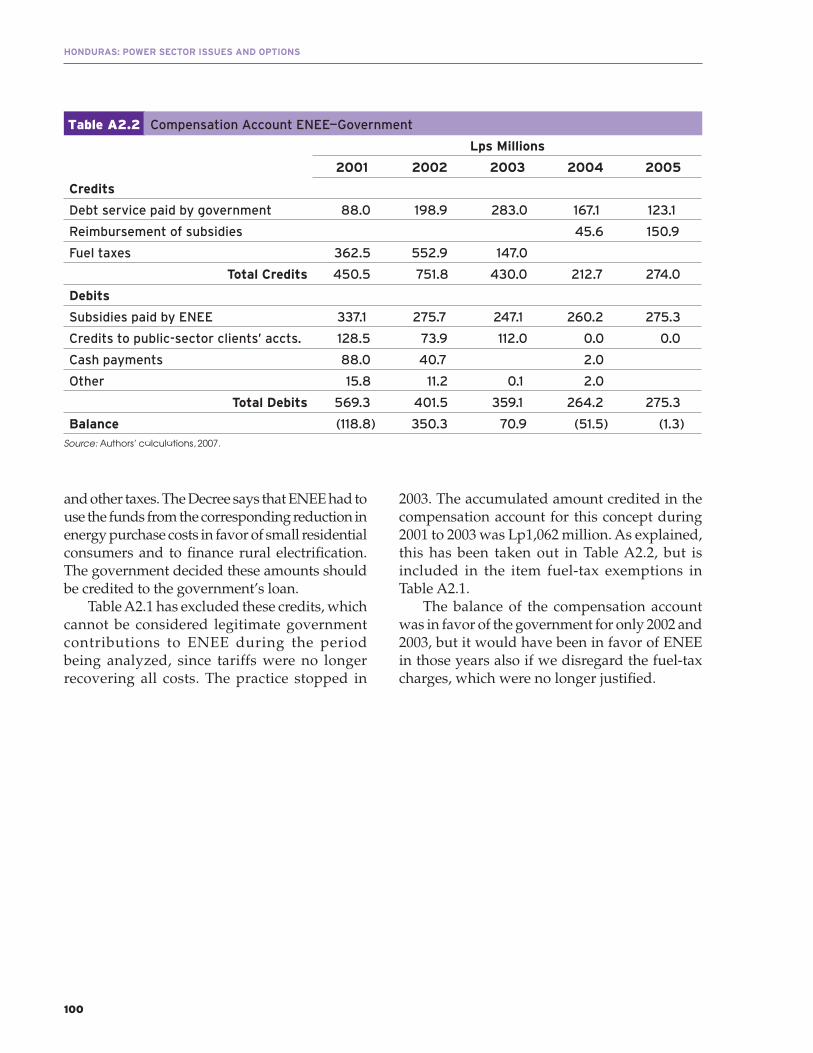
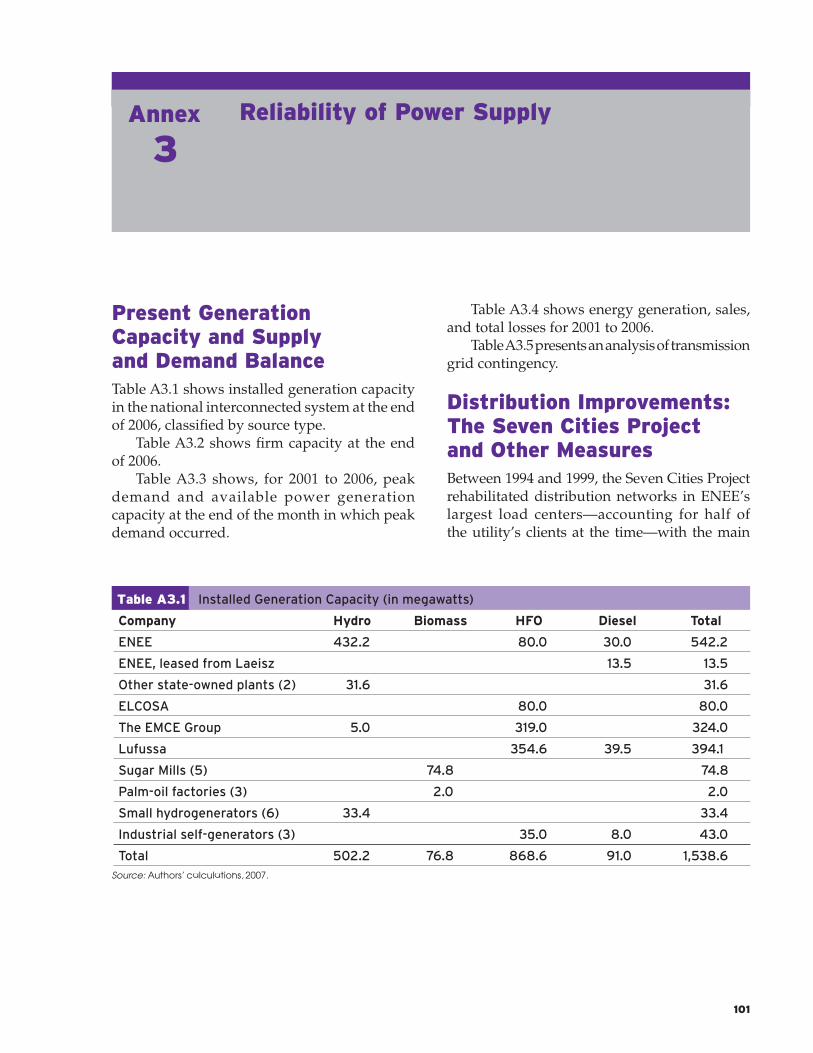
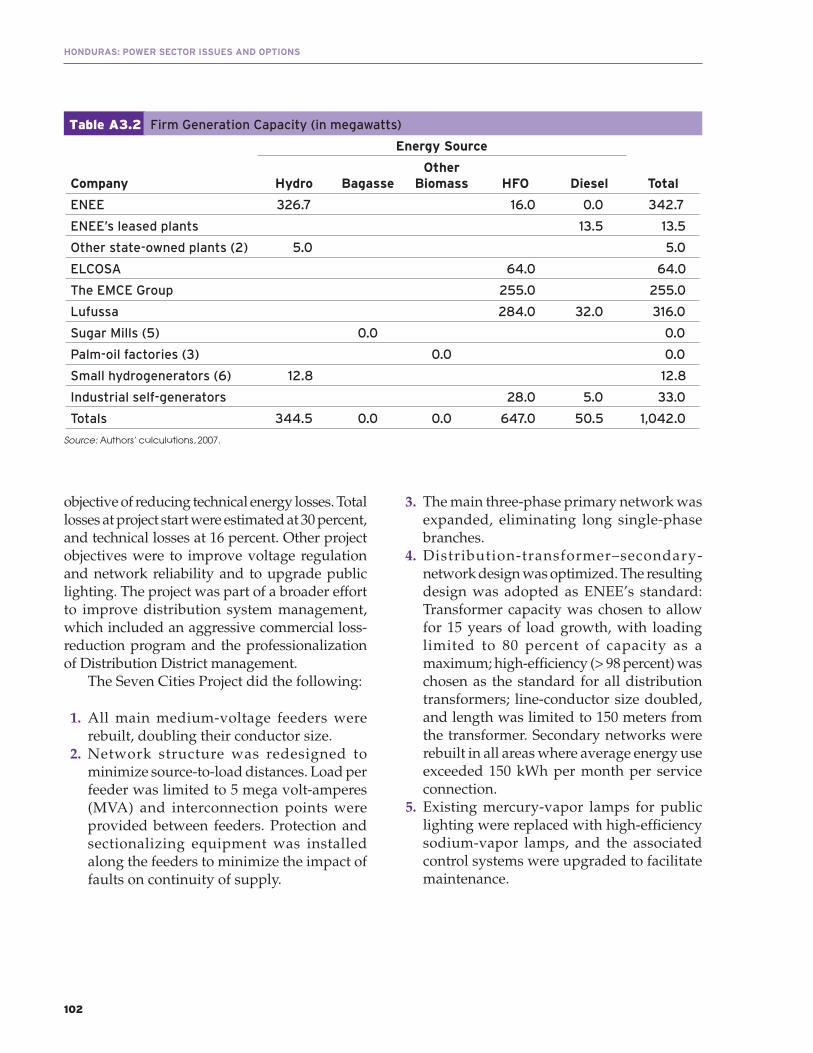
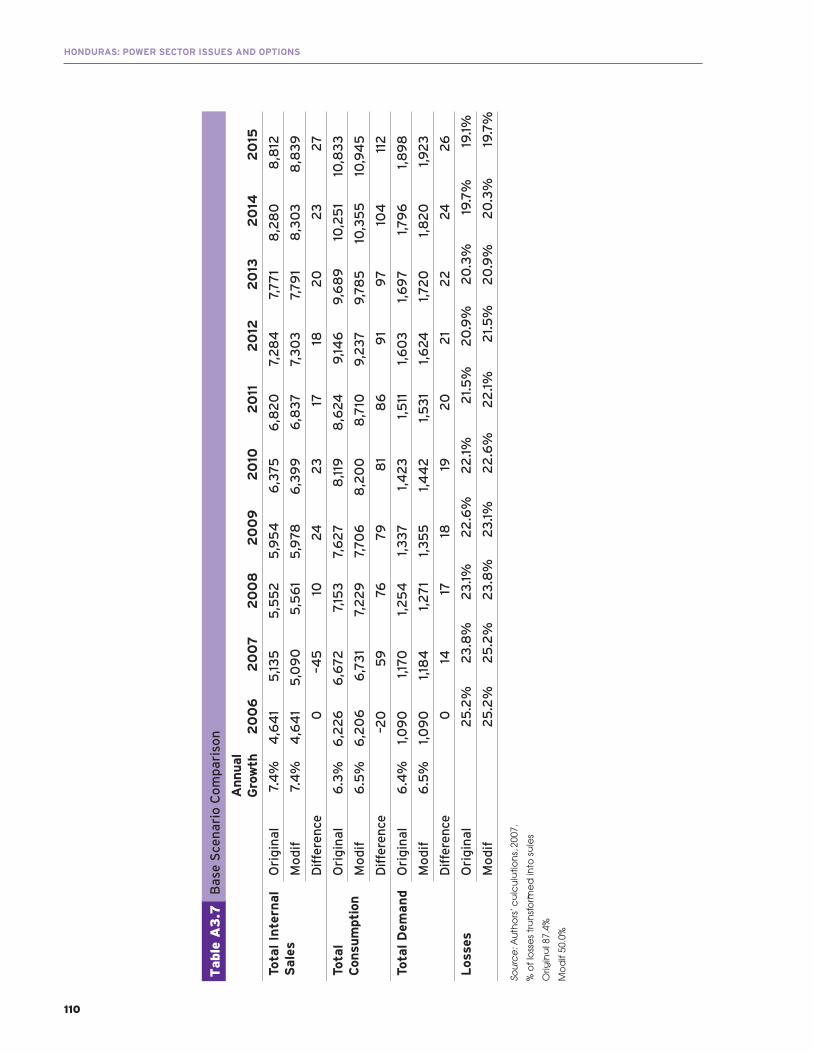
Annex 3: Reliability of Power Supply 101Present Generation Capacity and Supply and Demand Balance 101Distribution Improvements: The Seven Cities Project and Other Measures 101Generation Expansion—Assumptions and Details 107Generation Candidates 108
Annex 4: Historical Background 115ENEE’s Creation and Golden Years—Crisis and the Electricity Law 115The Legal Framework 116National and Regional Power Markets 118
Annex 5: Pricing Policies 125Honduras’s Electricity Pricing System 125
Annex 6: Electricity Coverage Index by Department, 2006 133
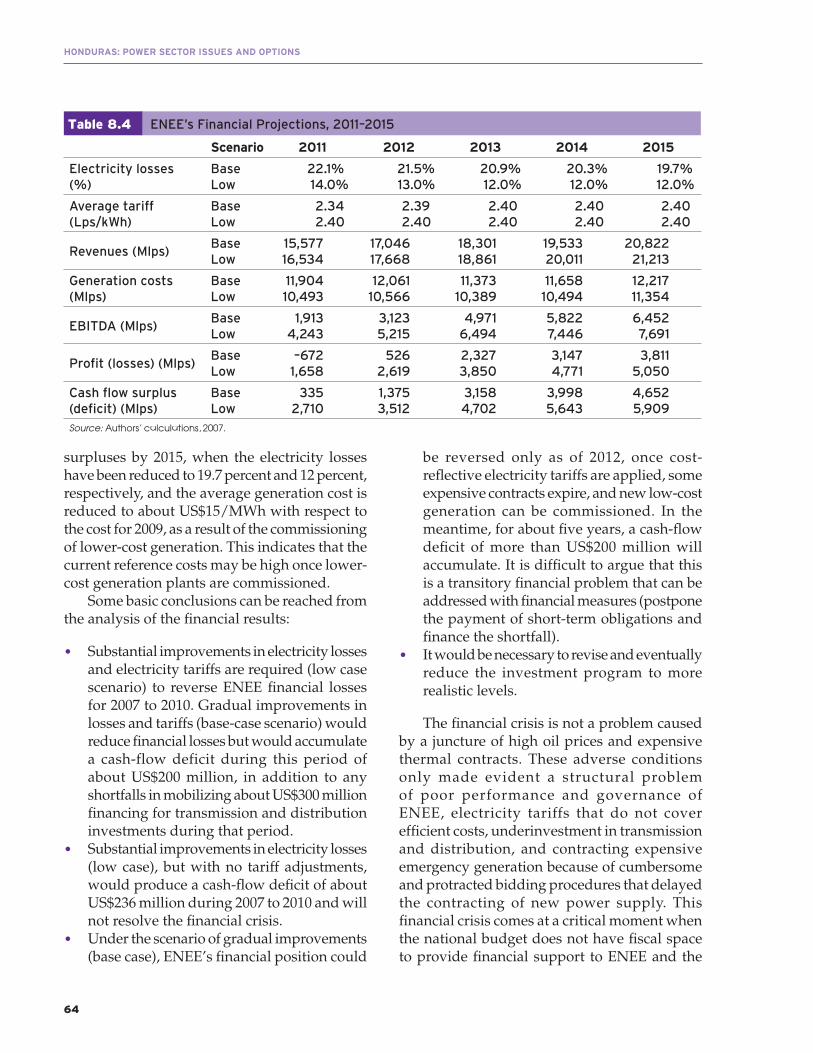
Annex 7: Financial Projections—Assumptions and Detailed Results 137Cost of Energy Purchases 137Financial Projections 139
iv
5176-FM.pdf iv 5/25/10 10:33 AM
v
Contents
Annex 8: Increasing Access to Electricity 149Estimates of Investment Needs for Three Off-grid Scenarios 149Policy Options with Tariff and Subsidies 157
Annex 9: Development of Renewable Energy and Energy Effi ciency 165Renewable Energy 165Institutional and Financial Challenges of Renewable Energy 170Barriers to the Development of Small On-grid Renewables 173Partnerships to Overcome Financing Constraints 173Relevant International Experience in Renewable Energy 174Potential for Energy Effi ciency Alternatives 179Experiences with Energy Effi ciency Programs in Honduras 183Assessment of the Honduran Experience 186
BoxesBox 5.1 Electricity Tariff Principles and Tariff Setting under the Electricity Law 33Box 7.1 The Corporate Governance of State-owned Enterprises 49Box A9.1 El CATEX Case Study: Process Transformation in the Textile Industry
to Leverage Co-generation Potential 184Box A9.2 Sale of Compact Fluorescent Lamps Case Study: Joint Project by UREE
and the Dutch Agency for Cooperation, 2000 to 2003 185
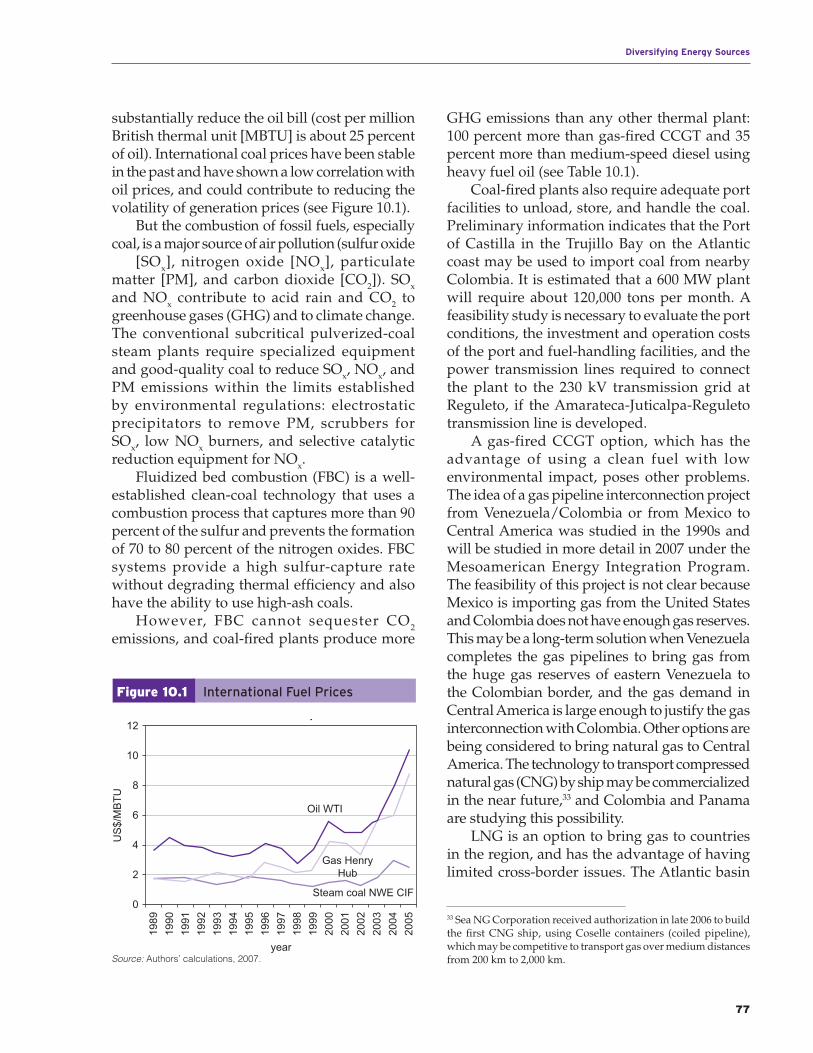
FiguresFigure 1 Supply/Demand Balance 2007–2010 xviiFigure 2 Financial Projection 2007–2010, Business as Usual Scenario xviiiFigure 3 Electricity: Percent Distributional Losses xxFigure 1.1 ENEE’s Income Statement 3Figure 1.2 Honduras Energy Balance and Losses 2001–2006 4Figure 1.3 Energy Purchase Price vs. Fuel Price; Amount of Energy Purchases, by Fuel 5Figure 1.4 Energy Supply Costs and Prices 5Figure 1.5 Sources and Application (in million Lps) 6Figure 3.1 Generation Capacity (MW) in December 2006 11Figure 3.2 Electricity: Average Duration and Frequency of Interruptions per Connection 16Figure 3.3 Peak Demand 20Figure 3.4 Fuel Prices, 2007–2020 21Figure 4.1 Electricity: Residential Connection and Energy Sold per Employee 27Figure 4.2 Percent Interconnection Capacity, 2005–2007 30Figure 5.1 Historical Trend of Average Tariff in Nominal and Real Terms (Lps/kWh) 34Figure 5.2 Electricity: Average Residential and Industrial Tariff (per GWh, in dollars) 36Figure 5.3 Electricity: Energy Sold per Connection (GWh/yr) 37Figure 6.1 Electricity: Coverage 41Figure 8.1 Monthly Energy Balance, 2007–2015, Base Case 60Figure 8.2 Fuel Costs and Fixed Costs, Thermal Contracts, Base Case, 2007–2014 60Figure 8.3 Average Energy Purchase Cost 61Figure 10.1 International Fuel Prices 77Figure A1.1 El Cajón Reservoir Level 86Figure A3.1 Energy Loss in Percent, Twelve-month Average 107Figure A5.1 Relationship between Sale Price and Cost per kWh 127Figure A9.1a Demand Curve in Tegucigalpa and Comayaguela for a Typical Workday 182Figure A9.1b Demand Curve in La Ceiba for a Typical Workday 182
5176-FM.pdf v 5/19/10 1:12 PM
HONDURAS: POWER SECTOR ISSUES AND OPTIONS
vi
Figure A9.2 Average Residential Consumption in Various Central American Countries, kWh/month 186
Figure A9.3 Average Electricity Consumption and Price (US$/kWh) in Central America 187
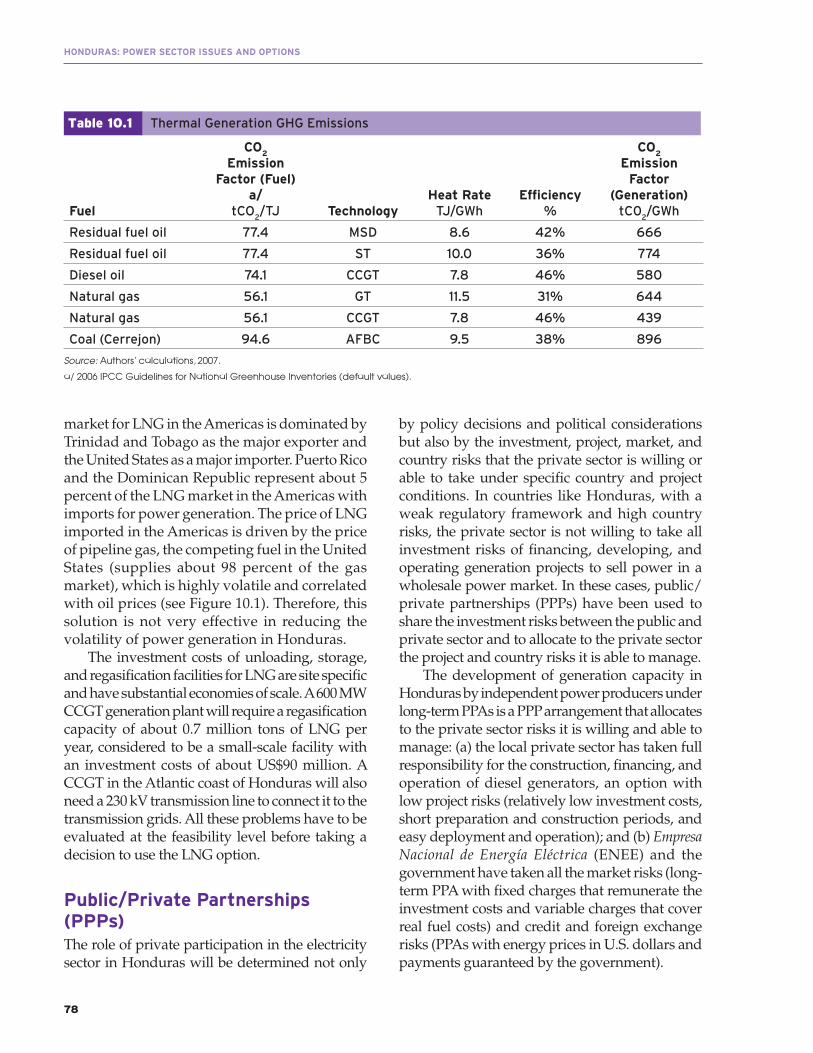
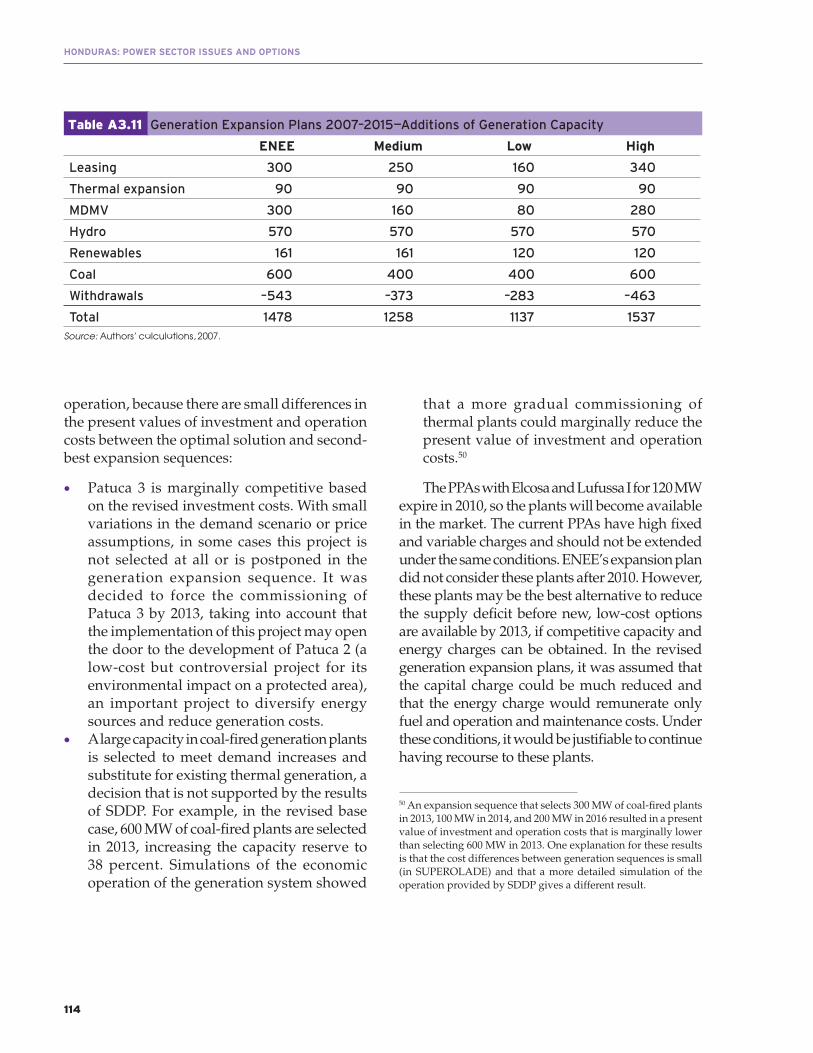
TablesTable 1 ENEE’s Financial Projections (2007–2010) xixTable 2 Breakdown of Commercial Losses, in Percent xxTable 3 Summary Results Tariff Adjustment Options xxiTable 4 Honduras Power Market Development xxivTable 5 Summary Matrix of Objectives and Short- and Medium-term Options xxviiiTable 6 Summary Results Scenarios xxxiTable 1.1 ENEE Accounts Receivables 7Table 1.2 Percentage of Amount Billed in February 2006 Collected up to 12 Months after Billing 7Table 1.3 Key Financial Indicators that Summarize ENEE’s Financial Performance 7Table 2.1 Annual Electricity Subsidies (in million Lps) 9Table 2.2 Equity Contributions and Transfers to ENEE (in million Lps) 10Table 2.3 Tax Exemptions (in million Lps) 10Table 3.1 Power Generation and Peak Demand (in MW) 12Table 3.2 Energy Generation, Sales, and Losses (GWh) 13Table 3.3 Equivalent Outage Duration in Hours 15Table 3.4 Peak Shaving in MW in 2003 16Table 3.5 Breakdown of Commercial Losses, in Percent 17Table 3.6 Peak Demand Projections: Three Scenarios 19Table 3.7 Peak Demand Balance 2007–2010 (in April of EachYear) 20Table 3.8 Generation Expansion Plans, 2007–2015: Capacity Additions (MW) 22Table 3.9 Generation Expansion Plans 24Table 4.1 Large Consumers 29Table 4.2 Electricity Traded in 2007 in Central America (GWh) 31Table 5.1 Comparison of Unit Costs, Tariffs (with Cross Subsidy) and Final Prices (after
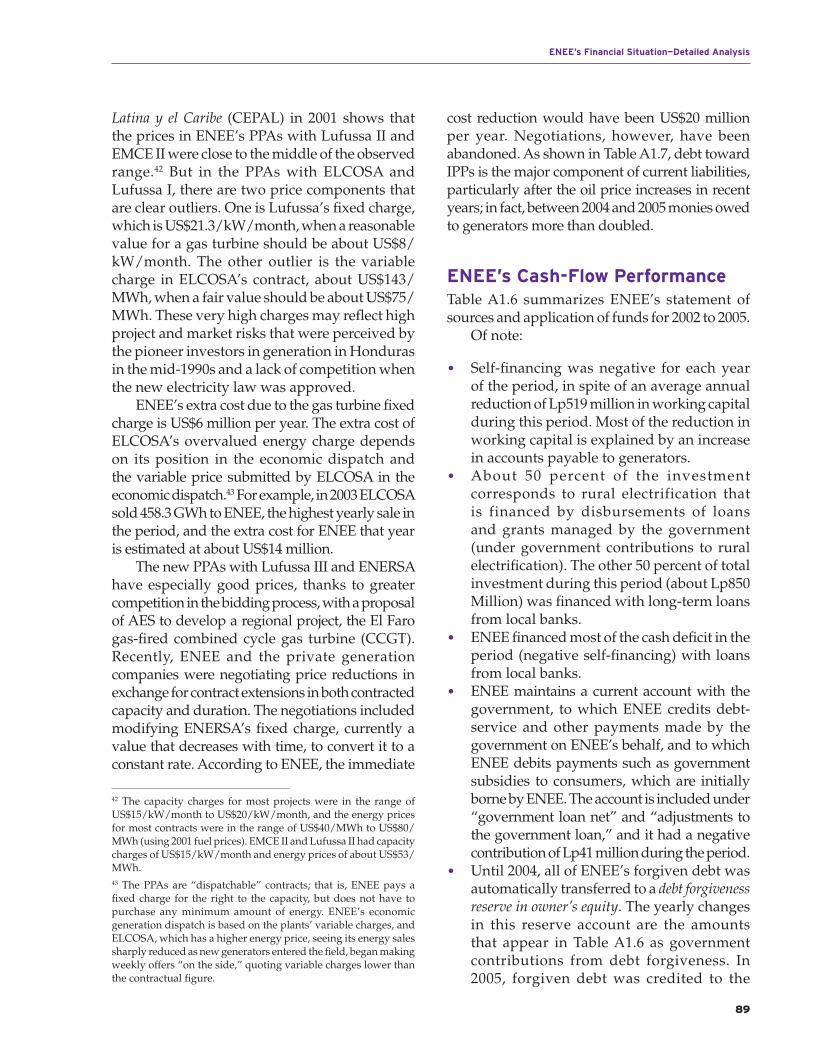
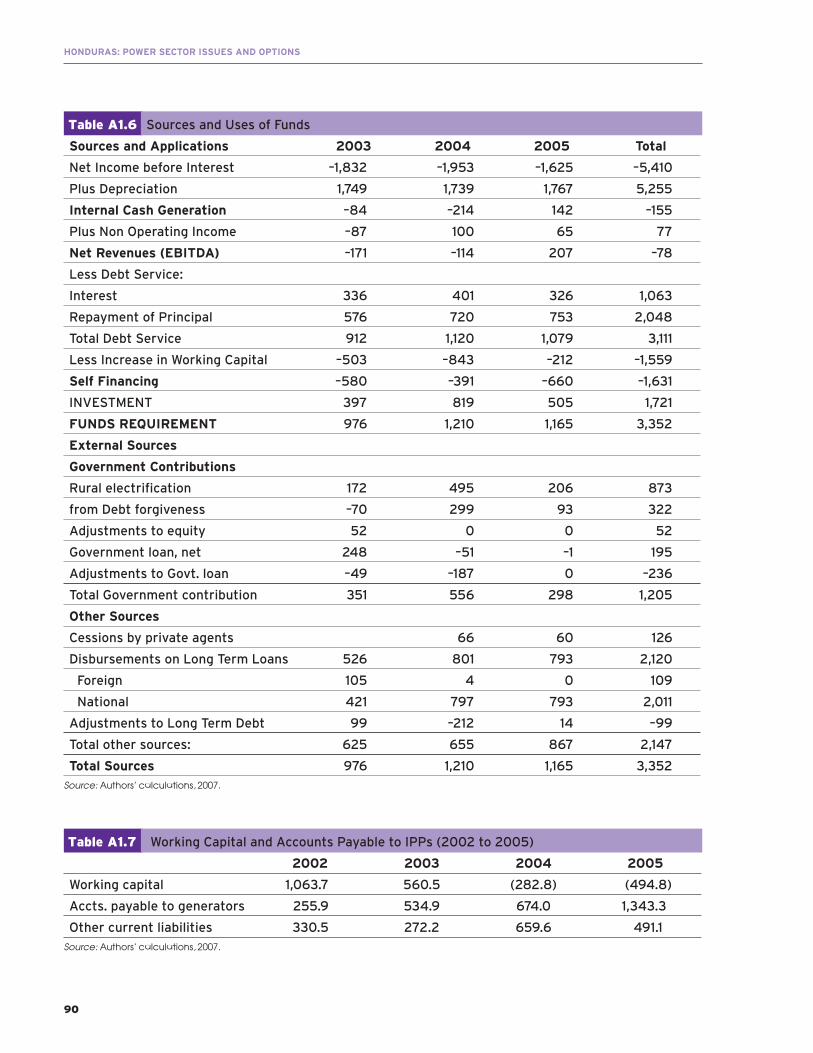
Direct Subsidy) 35Table 5.2 Distribution of Subsidies, July 2006 36Table 5.3 Comparison between Current and Proposed Tariff Adjustment 38Table 5.4 Option 1: Current and Proposed Final Price 38Table 5.5 Option 2: Current and Proposed Final Price 39Table 5.6 Medium Voltage Tariffs in Central America 39Table 6.1 Urban and Rural Access to Electricity, 2006 43Table 6.2 Access by Municipalities 44Table 7.1 Options and Issues to Introduce Competition in the Wholesale Market 57Table 8.1 ENEE’s Investment Plan, 2007–2015 (US$M) 61Table 8.2 Transmission Lines and Substations Investment Program (000 US$) 62Table 8.3 ENEE’s Financial Projections, 2007–2010 63Table 8.4 ENEE’s Financial Projections, 2011–2015 64Table 9.1 Cost of Initial Investment per Connection Using Different Technologies 69Table 9.2 Households Benefi ting from Subsidies 71Table 10.1 Thermal Generation GHG Emissions 78Table 10.2 Program to Reduce Energy Demand 82Table A1.1 El Cajón—Reservoir Operations 2001–2005 85Table A1.2 Thermal Plants Plant Factor 2001–2003 86Table A1.3 Energy Purchases vs. Fuel Prices 2001–2006 87Table A1.4 Diesel Fueled Generation and Costs 88Table A1.5 ENEE’s Energy Purchase Contracts as of Jan 2007 (Thermoelectric Generators) 88Table A1.6 Sources and Uses of Funds 90
5176-FM.pdf vi 5/25/10 10:34 AM
vii
Contents
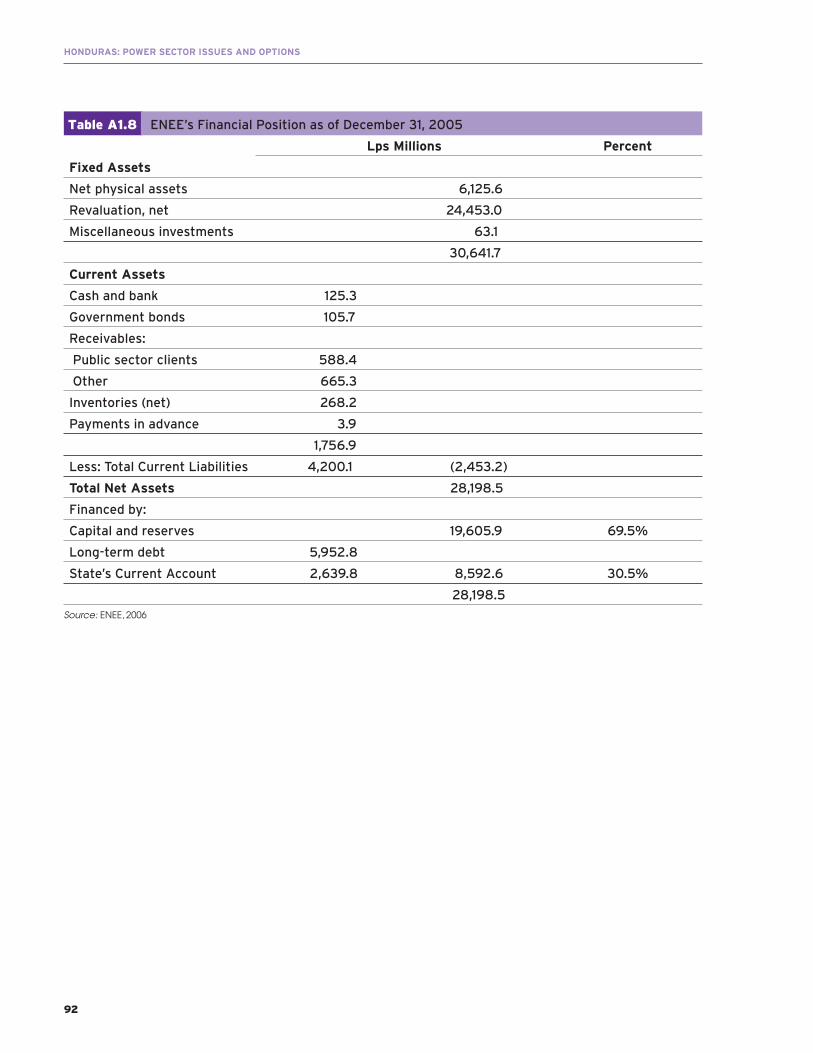
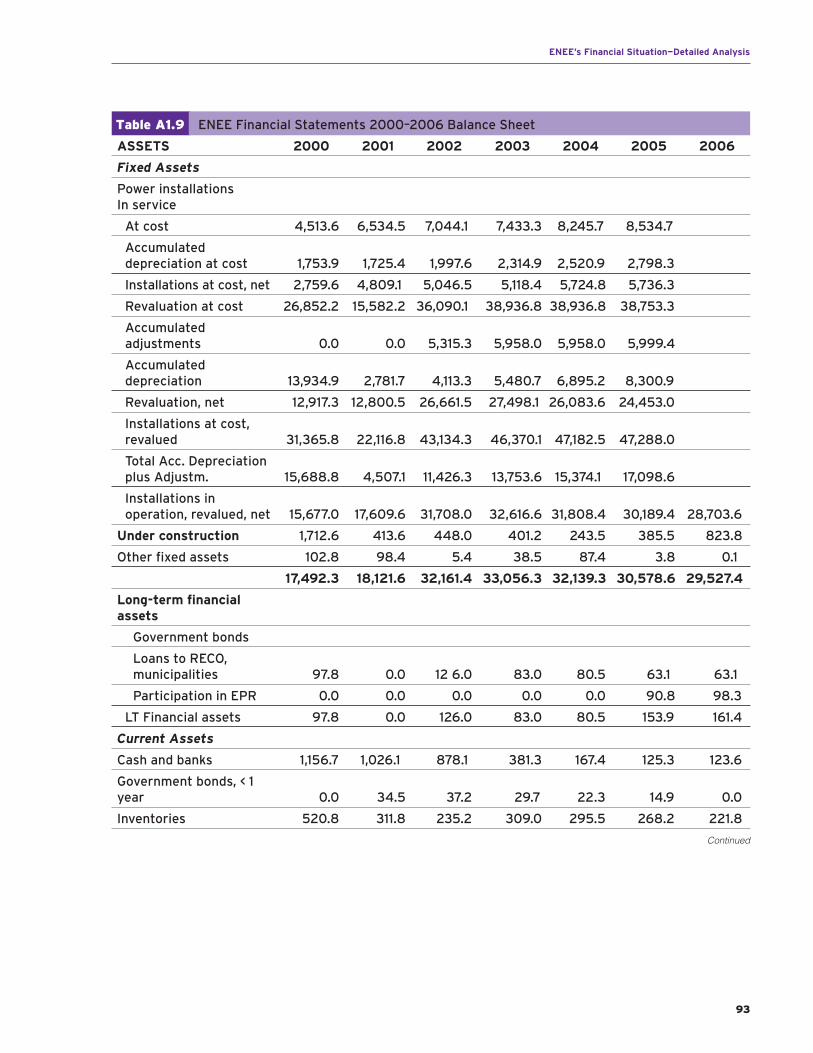
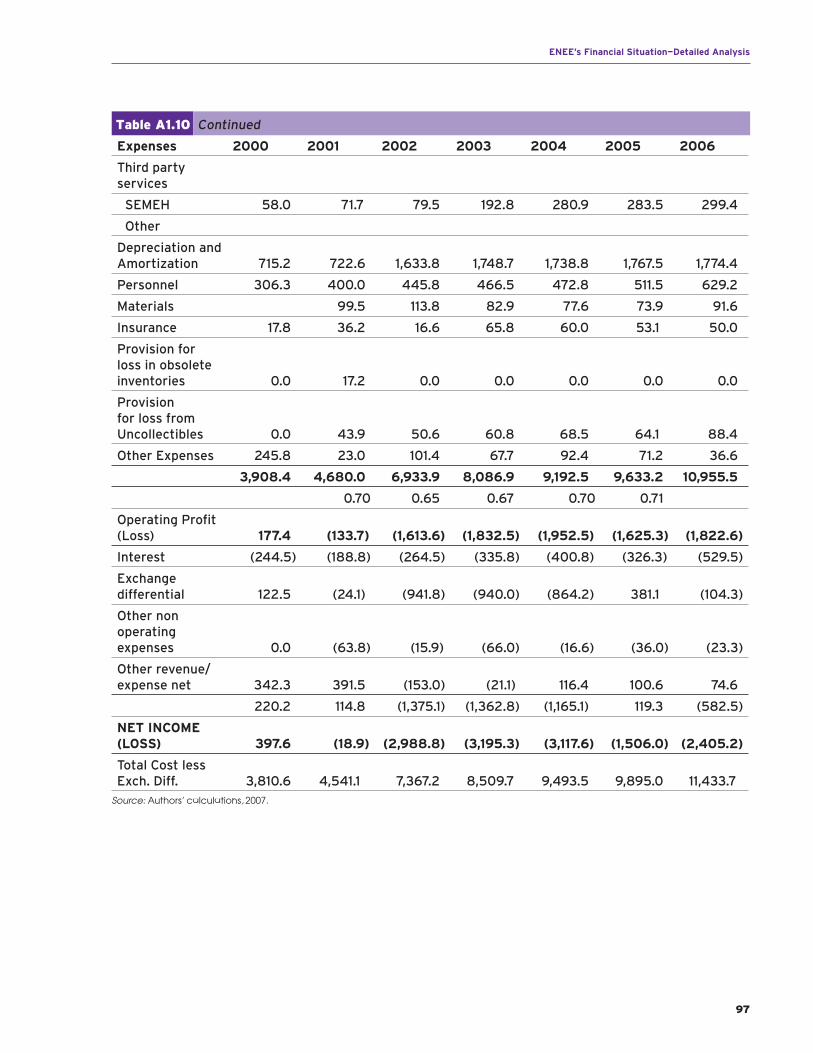
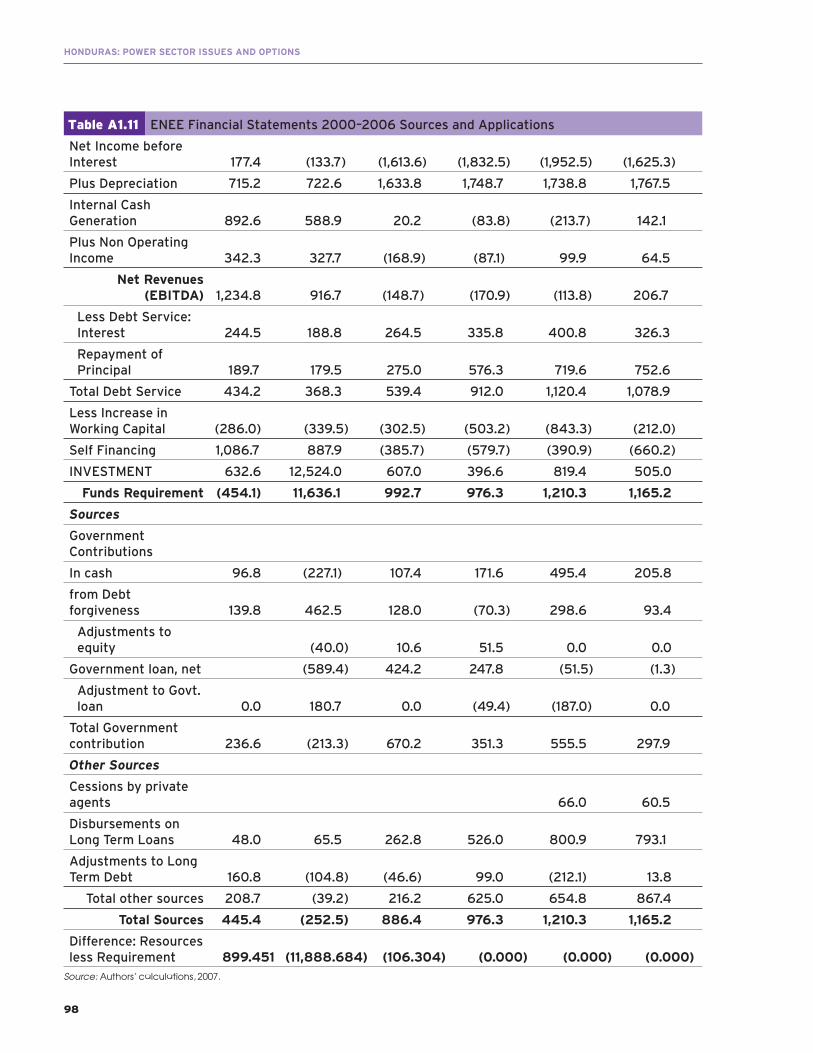
Table A1.7 Working Capital and Accounts Payable to IPPs (2002 to 2005) 90Table A1.8 ENEE’s Financial Position as of December 31, 2005 92Table A1.9 ENEE Financial Statements 2000–2006 Balance Sheet 93Table A1.10 ENEE Financial Statements 2000–2006 Income Statement 96Table A1.11 ENEE Financial Statements 2000–2006 Sources and Applications 98Table A2.1 Government Contributions to ENEE, Lps Millions 99Table A2.2 Compensation Account ENEE—Government 100Table A3.1 Installed Generation Capacity (in megawatts) 101Table A3.2 Firm Generation Capacity (in megawatts) 102Table A3.3 Power Generation and Peak Demand (in MW) 103Table A3.4 Energy Generation, Sales and Losses (in GWh) 104Table A3.5 Transmission Grid Contingency Analysis (February 2007) 105Table A3.6 Assumptions for Demand Projections 2007–2015 109Table A3.7 Base Scenario Comparison 110Table A3.8 Fuel Price Forecasts 111Table A3.9 Costs for Generation Candidate Projects 2007 Prices 112Table A3.10 Costs for Generation Candidate Projects 2007 Prices—Adjusted Investment
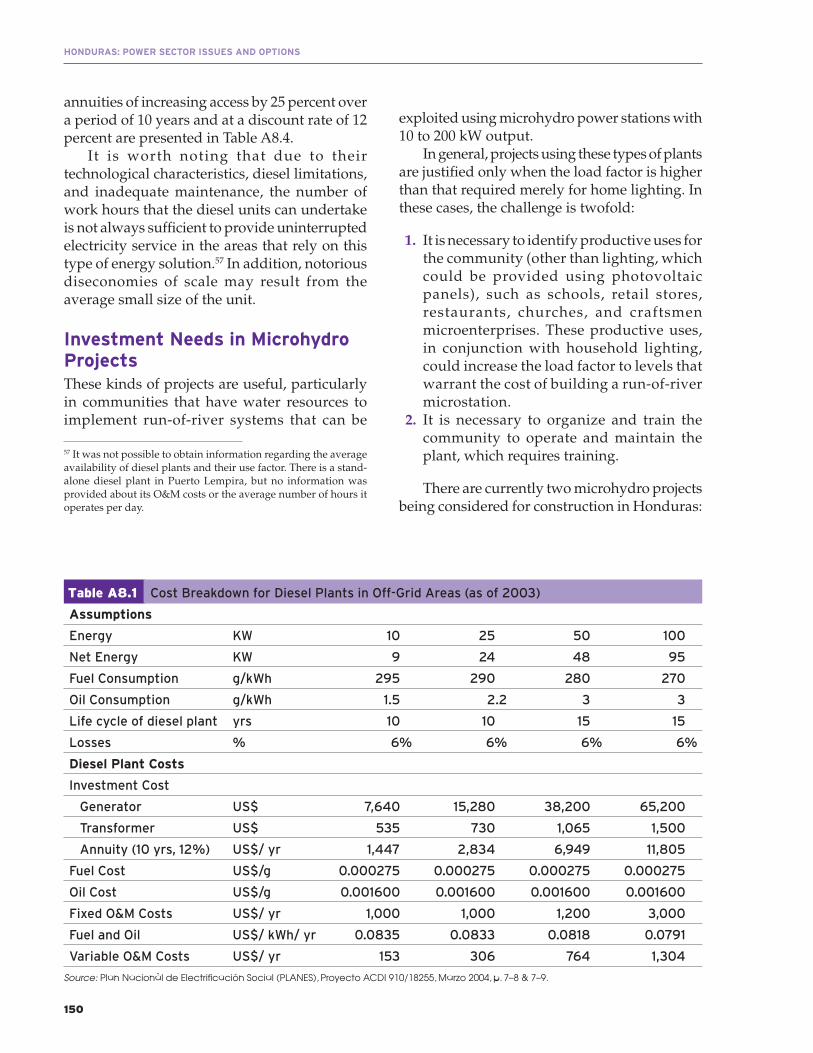
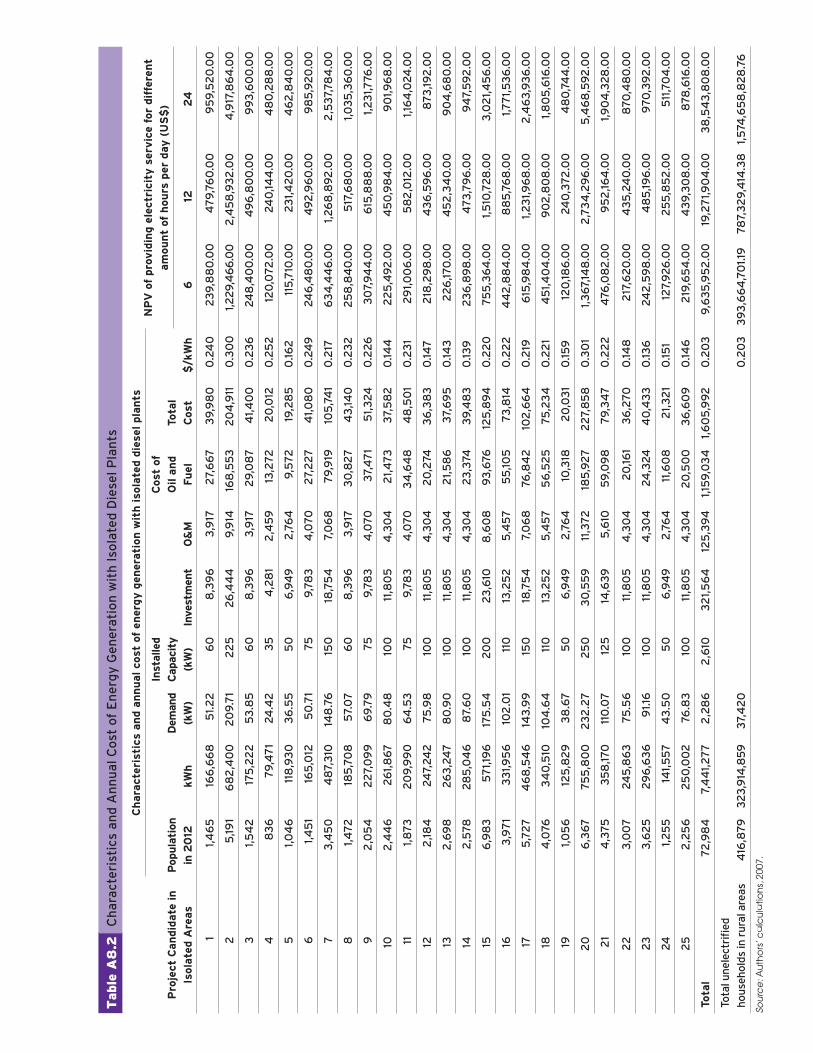
Costs for Coal and LNG 113Table A3.11 Generation Expansion Plans 2007–2015—Additions of Generation Capacity 114Table A5.1 Reference Tariff Based on Economic Costs 128Table A5.2 Proposed Reallocation of Cross- and Direct Subsidies 130Table A5.3 Modifi ed Tariff Based on Economic Costs with Increased Cross-Subsidy 132Table A6.1 Electricity Coverage Index by Department, 2006 134Table A6.2 Electrifi cation Projects, 1995 to 2006 135Table A7.1 Summary of Generation Costs: New Base Scenario 138Table A7.2 Summary of Generation Costs: New Low Scenario 140Table A7.3 Summary of Generation Costs: New High Scenario 141Table A7.4 Financial Projections Scenario: Medium 142Table A7.5 Financial Projections Scenario: Low 144Table A7.6 Financial Projections Scenario: Low Tariff Change 146Table A8.1 Cost Breakdown for Diesel Plants in Off-Grid Areas (as of 2003) 150Table A8.2 Characteristics and Annual Cost of Energy Generation with Isolated Diesel Plants 151Table A8.3 Decision Matrix for Diesel Plants: Investments 152Table A8.4 Decision Matrix for Diesel Plants: Annuities for Investments 152Table A8.5 Scenario 1: Program Cost of $400,000—Cost of Installing Microhydro Stations,
Assuming That Unelectrifi ed Rural Households Are Isolated and Dispersed 154 Table A8.6 Scenario 2: Program Cost of $500,000—Cost of Installing Microhydro Stations
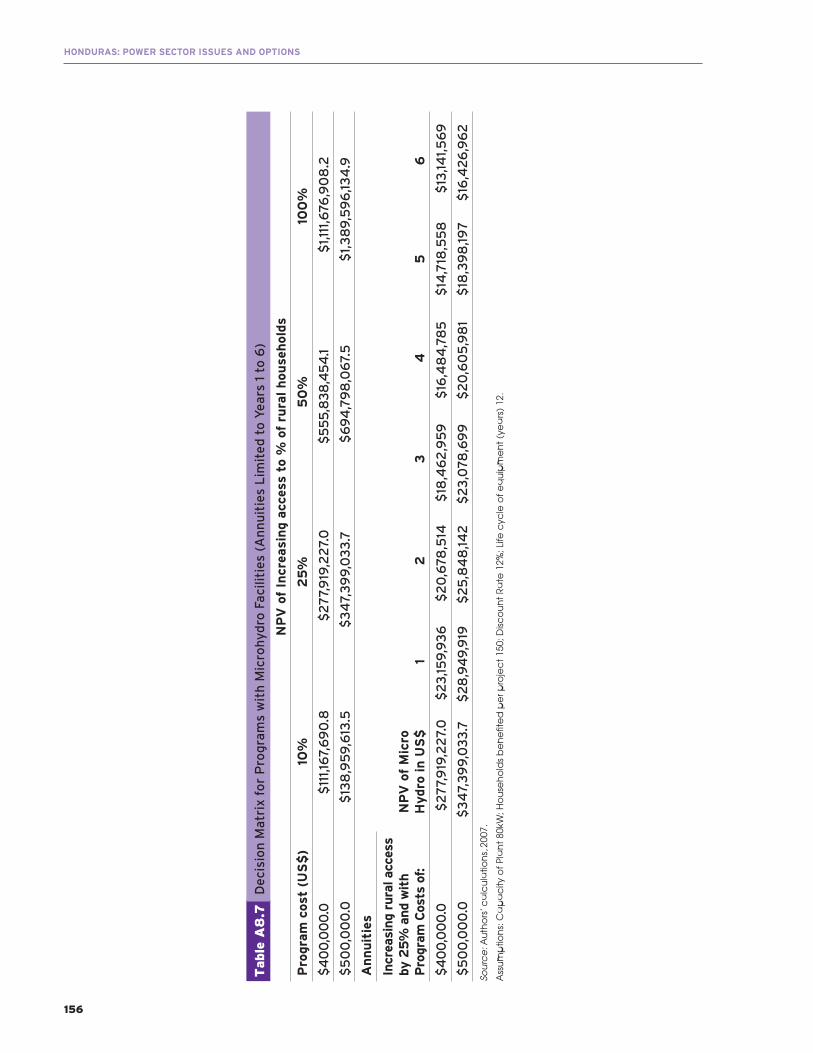
Assuming That Unelectrifi ed Rural Households Are Isolated and Dispersed 155Table A8.7 Decision Matrix for Programs with Microhydro Facilities (Annuities Limited
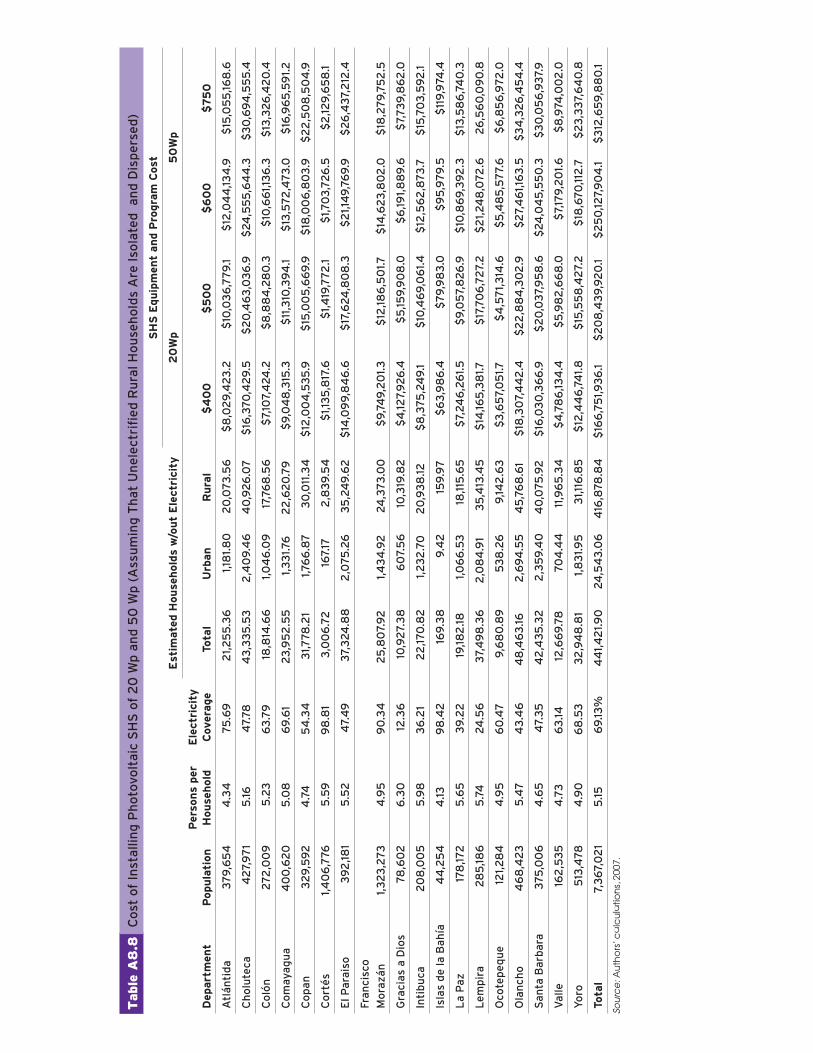
to Years 1 to 6) 156Table A8.8 Cost of Installing Photovoltaic SHS of 20 Wp and 50 Wp (Assuming That
Unelectrifi ed Rural Households Are Isolated and Dispersed) 158Table A8.9 Decision Matrix for Programs with SHS 159Table A8.10 Decision Matrix: Annuities for Programs with SHS 159Table A8.11 Public Policy Mix: Increases in Tariff and Direct Subsidy 160Table A8.12 Public Policy Mix: Increase in Tariff and Decrease in Direct Subsidy 161Table A8.13 Scenarios for Increasing Residential Tariff 162Table A8.14 Scenarios for Adjusting Government Direct Subsidy Policy 163Table A8.15 Financial Implications of Meeting the Electrifi cation Target Based on Current Tariff
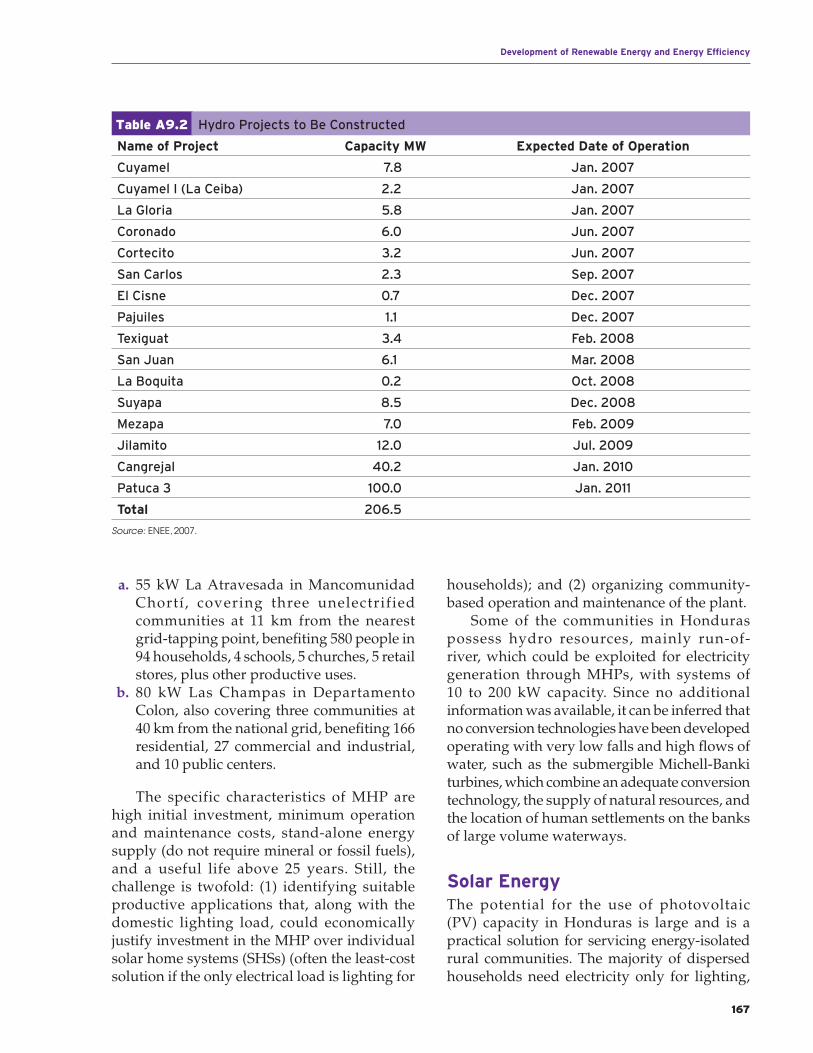
and Subsidy Structure 164Table A9.1 Distribution of Hydropower Plants by Size 166Table A9.2 Hydro Projects to Be Constructed 167
5176-FM.pdf vii 5/19/10 1:12 PM
HONDURAS: POWER SECTOR ISSUES AND OPTIONS
viii
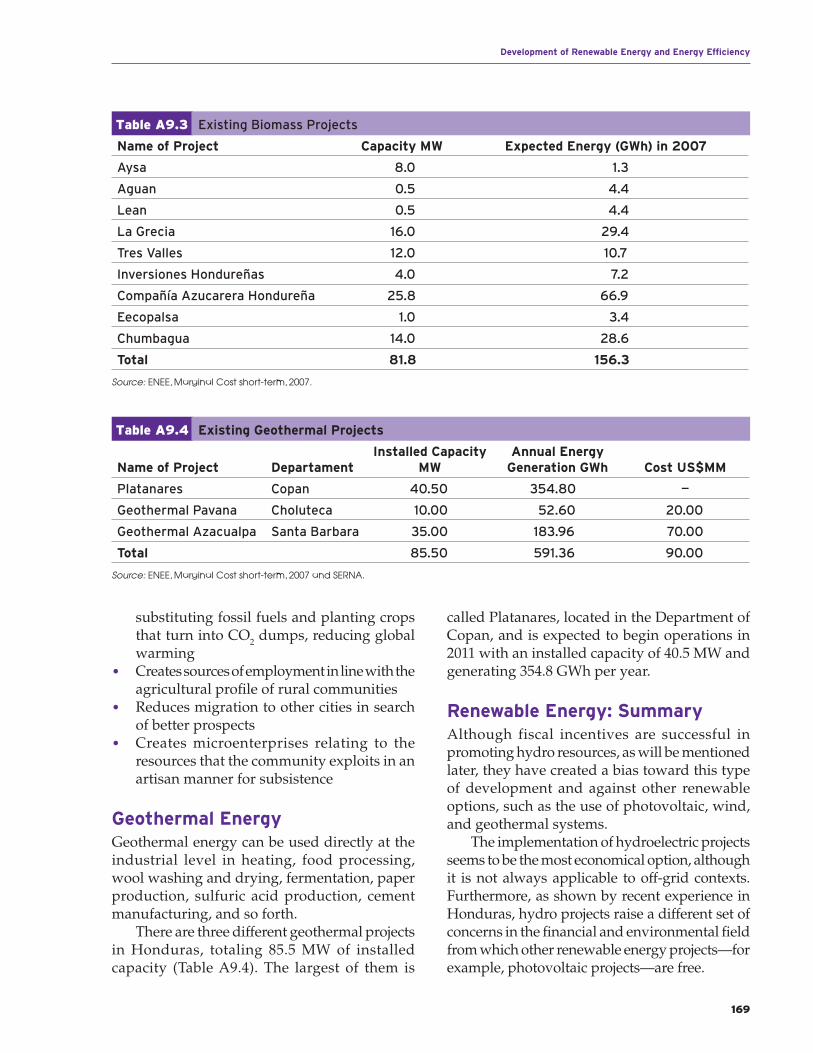
Table A9.3 Existing Biomass Projects 169Table A9.4 Existing Geothermal Projects 169Table A9.5 Share of Renewable Energy in Primary Energy Supply Mix in Central America 170Table A9.6 GIURE Program to Reduce National Electricity Demand 186Table A9.7 Impact of a Lightbulb Substitution Campaign 191Table A9.8 Impact of a Campaign for Optimizing the Use of Air-conditioning
in the Commercial Sector 193
5176-FM.pdf viii 5/19/10 1:12 PM
ix
This report was made possible thanks to the fi nancial and technical support by the Energy Sector Management Assistance Program (ESMAP). The study is the product of a collaborative effort between the International Development Association (IDA) and the government of Honduras—in particular, the Secretaría de Recursos Naturales y Ambiente (SERNA), the Comisión Presidencial de Modernización del Estado (CPME), and the Empresa Nacional de Energía Eléctrica (ENEE). The report was prepared by a core IDA team consisting of Lucio Monari (task team leader), Xiaoping Wang (energy specialist), Dante Mossi (economist), Manuel Dussan, and Angel Baide and Juan Manuel Rojas (consultants). Alma Domenech and Fowzia Hassan were responsible for desktop publishing. Peer reviewers included Pedro Sánchez Gamarra (senior energy specialist, SASEI) and Prasad V.S.N. Tallapragada (senior energy specialist, AFTEG). The team completed its work early 2007 and the consulting fi rm made their fi nal report available to the team in July of the same year. After undergoing a series of internal and external reviews, the report was put into production under the publishing guidance of ESMAP. Although the authors note that some of the information contained in this report may be particular to the year 2007, the overall report’s conclusions and lessons learned remain valid. The Authors hope the fi ndings, projections and insights of this report are useful to all who read it. The report was edited and typeset by Shepherd, Inc. Ms. Marjorie K. Araya (ESMAP) carried out comprehensive proofreading, coordinated the production of the fi nal report and its dissemination. Special thanks to Jeffrey Lecksell, World Bank Map Unit.
Acknowledgments
5176-FM.pdf ix 5/19/10 1:12 PM
5176-FM.pdf x 5/19/10 1:12 PM
xi
(Effective July 10, 2007)Currency unit = Lempiras (Lps.)US$1.00 = Lps. 18.89
Currency Equivalents
5176-FM.pdf xi 5/19/10 1:12 PM
5176-FM.pdf xii 5/19/10 1:12 PM
xiii
ACDI Agencia Canadiense de Desarrollo Internacional (Canadian International Development Agency, CIDA)
AFTEG Africa Energy UnitBbl barrelBCIE Banco Centroamericano para la Integración Económica (Central American Bank
of Economic Integration)BOT build-own-transferCCGT combined cycle gas turbineCEHDES Consejo Empresarial Hondureño para el Desarrollo SostenibleCFLs compact fl uorescent lampsCIMEQH Colegio de Ingenieros Mecánicos, Electricistas y QuímicosCNE Comisión Nacional de EnergíaCNG compressed natural gasCOHEP Consejo Hondureño de la Empresa PrivadaCO2 carbon dioxide Comp. componentCPI consumer price indexCPME Comisión Presidencial de Modernización del EstadoCRIE Comisión Regional de Interconexión EléctricaDSM demand-side management programsEBITDA earnings before interests, taxes, depreciation and amortizationECLAC Economic Commission for Latin America and the CaribbeanElCATEX Elásticos Centroamericanos y Textiles, S. A.EMCE Empresa de Mantenimiento, Construcción y ElectricidadENEE Empresa Nacional de Energía EléctricaENERSA Energía Renovable, S. A.EOR Ente Operador Regional, Regional System OperatorERP enterprise resource planningFBC fl uidized bed combustionFCN Fondo Cafetero NacionalFOSODE Social Fund for Electricity Development, Fondo Social de Desarrollo EléctricoGAUREE Generación Autónoma y Uso Racional de la Energía EléctricaGDP gross domestic productGEF Global Environment FacilityGHG greenhouse gasesGIS Geographic Information SystemGIURE Inter-Institutional Group for the Effi cient Use of EnergyGOH Government of HondurasGT gas turbineGWh gigawatt hour
List of Acronyms
5176-FM.pdf xiii 5/19/10 1:12 PM
xiv
HONDURAS: POWER SECTOR ISSUES AND OPTIONS
HFO heavy fuel oilHV-MV high voltage to medium voltage IBU independent business unitICE Instituto Costarricense de ElectricidadIDA International Development AssociationIDB Inter-American Development BankIFI International Finance InstitutionsINE Instituto Nacional de EstadísticaISA Interconexión Eléctrica S.A.kV kilovoltkW kilowattkWh kilowatt-hourLNG liquefi ed natural gasLPG liquefi ed petroleum gasLUFUSSA Luz y Fuerza de San Lorenzo, S. A.MBTU million British thermal unitMHP microhydro powerMSD medium-speed dieselMVA mega volt-ampereMW megawattMWh megawatt-hourNGO nongovernmental organizationNOx nitrogen oxideNPV net present valueOES Ofi cina de Electrifi cación SocialO&M operations and maintenancePESIC Proyecto de Efi ciencia Energética en los Sectores Industrial y Comercial de HondurasPLANES National Social Electifi cation Plan, Plan Nacional de Electrifi cación SocialPM particulate matterPPA power purchase agreementPPP public/private partnershipPREEICA Proyecto de Energía Eléctrica de Istmo CentroamericanoPV photovoltaicRE renewable energyROM rehabilitate, operate, maintainSASEI South Asia Energy and Infrastructure UnitSDDP Stochastic Dual Dynamic ProgrammingSEMEH Servicio de Medición Eléctrica de HondurasSERNA Ministry of Natural Resources and Environment, Secretaría de Recursos Naturales y AmbienteSHS solar home systemsSIEPAC Sistema de Interconexión Eléctrica para América CentralSOE state-owned enterpriseSOx sulfur oxideSSM supply-side management programsUN United NationsUNAH Universidad Nacional Autónoma de HondurasWP windpowerWTI West Texas Intermediate
5176-FM.pdf xiv 5/19/10 1:12 PM
xv
IntroductionThis report was prepared in response to a request by the government of Honduras for assistance in the preparation of a power sector strategy for the country. Specifically, the government asked for help in identifying the main issues in the power sector, and in addressing them through formulation of a clearly defined, achievable strategy. Left unresolved, these issues risk derailing the country’s macroeconomic framework, potentially damaging the competitiveness of the country and its prospects for poverty reduction.
The main issues to be analyzed in the study were identifi ed at a workshop held on September 19, 2006, in Tegucigalpa, jointly with the Secretaría de Recursos Naturales y Ambiente (SERNA) and the Comisión Presidencial de Modernización del Estado (CPME), and with the participation of representatives from the Empresa Nacional de Energía Eléctrica (ENEE), civil society, the private sector, Congress, public sector agencies, donors, utilities, and ministries. It was decided that the study would be divided into two components: (a) the fi rst would identify and evaluate options on institutional reforms, particularly ENEE’s restructuring and management, and securing electricity supply; and (b) the second would formulate a power sector strategy. Two reports will be prepared, with the second report to be finalized according to the timing of the government’s decision.
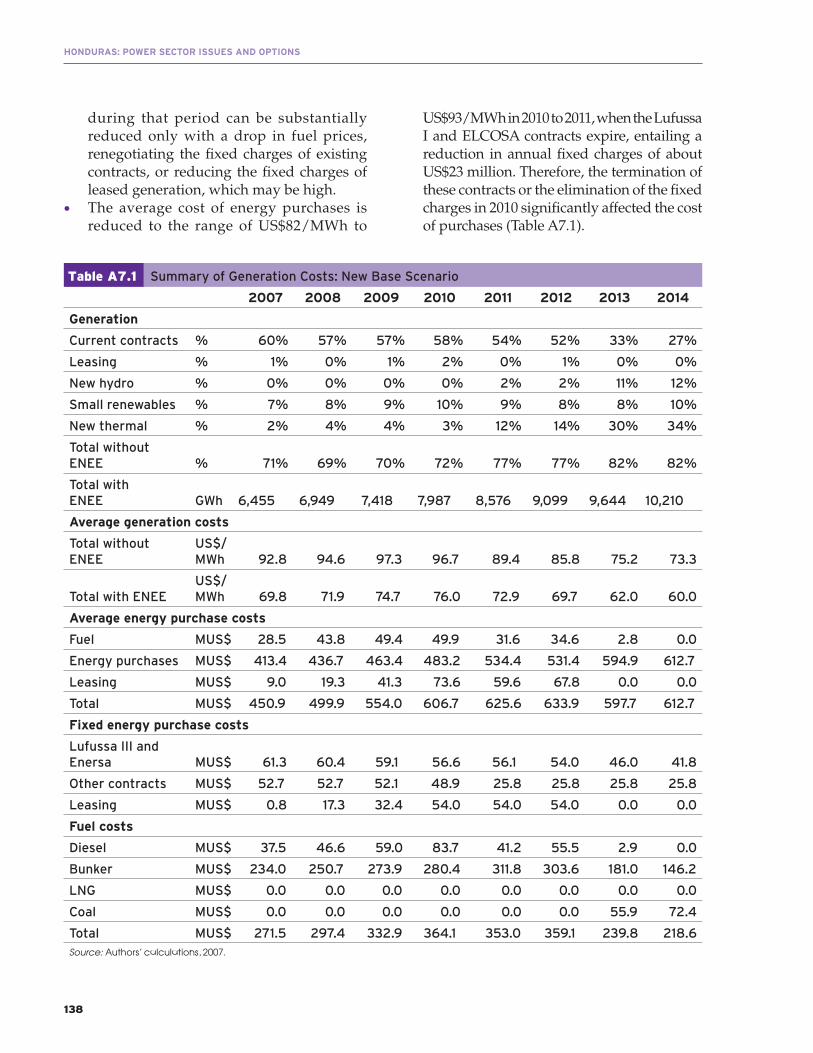
This fi rst report analyzes the institutional and policy issues; fi nancial and fi scal concerns; social aspects, such as tariffs and subsidies, and access to electricity; and investment requirements—including the development of
Executive Summary
renewable resources. The report is divided into two parts. Part A presents a diagnostic of the electricity sector, including ENEE’s fi nancial performance, fi scal impacts, reliability of supply, institutional and legal framework, pricing policy, and electricity coverage. Part B evaluates the options available to improve sector effi ciency, ensure financial sustainability, promote the diversifi cation of energy sources, and increase electrifi cation coverage.
Diagnostic of the SectorIn the early 1990s, the electricity sector in Honduras experienced a severe fi nancial crisis when electricity tariffs were not adjusted to cover the debt service of the El Cajón hydroelectric project commissioned in the mid-1980s, and ENEE’s performance was poor (electricity losses of about 28 percent, overstaffi ng, and poor maintenance of thermal plants). The fi nancial crisis led to the energy crisis of 1993, when a severe drought coincided with a lack of generation reserve capacity. There was an urgent need to mobilize private fi nancing to expand generation capacity and to improve ENEE’s performance.
The response to this crisis was the sector reform of 1994, based on a new Electricity Law that established a competitive power market (vertical unbundling, freedom of entry to all sector activities, open access to transmission and distribution networks, and freedom of choice for large users); the separation of the roles of policy making, regulation, and provision of electricity services; application of cost-recovery tariffs and targeted subsidies; and private provision of electricity services.
5176-FM.pdf xv 5/19/10 1:12 PM
xvi
HONDURAS: POWER SECTOR ISSUES AND OPTIONS
The new market model, and the underlying assumptions made by the reformers, proved to be too ambitious for Honduras, with a small power system, a tradition of political clientelism, and weak institutions. First, the competitive market envisioned in the law was not implemented because the distribution networks were not unbundled and privatized, and ENEE continued operating as a vertically integrated state-owned enterprise and a de facto single buyer, responsible for procuring all the new energy required to meet demand. Second, the separation of the government roles was not effective: SERNA and the new Energy Cabinet lacked the technical support and expertise to conduct energy planning and policy making, and ENEE continued to play a major role in these activities. The new regulator, the Comisión Nacional de Energía (CNE), had a marginal role due both to a lack of political support to implement the new regulations and to its lack of resources and ENEE’s dominant role in the sector. Third, the principles of cost-covering tariffs and targeted subsidies have not been implemented due to inadequate political commitment, but also because of the dependency on imported oil for power generation, which resulted in high and volatile generation prices that were not passed on to retail tariffs.
The de facto single-buyer model has been successful in attracting private investment to expand generation capacity based on long-term power purchase agreements (PPAs) with thermal generators and small renewable projects. The combination of PPAs, backed by payment guarantees of the government, and the selection of diesel plants, with low capital costs and short construction periods, reduced the market and project risks for private investors. Since 1994, private developers have invested some US$600 million in about 800 megawatts (MW) of medium-speed diesel and gas-turbine capacity. In addition, they have invested some US$70 million in 110 MW of small hydro and bagasse-fi red capacity that benefi ted from fi scal and price
incentives. Reliance on the private sector has thus become the norm for generation capacity expansion.
ENEE’s performance is still poor. Electricity losses increased from about 20 percent in 2001 to 25 percent in 2006, mostly related to theft, fraud, and illegal connections. The expectation of a future restructuring and privatization postponed needed actions to improve ENEE’s corporate governance and modernize its information systems and commercial practices.
The hydro-dominated generation system of the mid-1990s was converted to a thermo-dominated system, and Honduras now depends on imported fuels for about 70 percent of its power generation (almost all thermal generation under PPAs). The cost of energy purchases and fuel expenses doubled from 2001 to 2006, due to a higher share of thermal generation and the steep increase in heavy fuel oil prices. ENEE’s revenues, eroded by high nontechnical losses, could not cover the increases in costs.
ENEE had to rely on emergency generation to meet demand during 2001 to 2004 due to delays in procuring new generation capacity. About 180 MW in skid-mounted diesel generators were leased in 2002 to 2004 to meet an energy shortfall in the period before 410 MW in new PPAs were commissioned. In 2007, the supply/demand balance has again been tight, with a capacity reserve of about 5 percent.
The visible results of this situation are twofold: (a) the looming energy crisis that could affect Honduras over the next two years, and (b) the fi nancial crisis of ENEE.
The Emerging Energy CrisisThe new generation capacity, which is planned to be commissioned in 2007 to 2010 (about 150 MW, mainly in renewable power), is not suffi cient to meet demand growth. A capacity shortfall of about 70 MW is estimated for 2008, which would increase to 275 MW by 2010 (see Figure 1). Considering that no new power has been contracted, and that development of new
5176-FM.pdf xvi 5/19/10 1:12 PM
xvii
Executive Summary
generation projects would take about three years, it is likely that Honduras would have to rely again on expensive emergency generation to meet demand during 2007 to 2010. Although the need for new generation capacity by 2009 was anticipated two years ago, the development of the required generation projects has been delayed due to a slow decision process.
There is a large backlog of transmission and subtransmission investments that could not be implemented as planned due to fi nancial constraints. ENEE had to install expensive diesel generation in some congested industrial areas in the north and downgrade the transmission planning reliability criteria. Further delays in strengthening the transmission networks will increase the probability of blackouts, operating costs, and electricity losses, and worsen the quality of service.
ENEE’s Financial CrisisENEE has been incurring annual financial losses of about Lps.2.5 billion (equivalent to almost 2 percent of Honduras’s gross domestic product). Its internal cash generation has been
negative, and ENEE has had to postpone needed investment in distribution and transmission and has had to fi nance the shortfall with expensive revolving loans from local banks and credits from thermal generators on the payment of energy purchases that amounted to Lps.2.3 billion in 2003 to 2005. Debt service coverage and contribution to investments have been negative during the past fi ve years.
The fi nancial crisis can be explained by a combination of factors: (a) poor performance (high electricity system losses); (b) the vulnerability of generation costs of a thermo-based power system to high and volatile international oil prices; (c) high costs of the long-term PPAs contracted in the 1990s, which refl ect high market risks and expensive emergency solutions; and (d) the average electricity tariff, which covers only about 80 percent of the effi cient supply costs.
Government direct contribution to alleviate ENEE’s financial crisis during 2001 to 2005 was moderate. The net direct contribution, estimated at about Lps.1 billion, was mostly for rural electrifi cation projects. In addition, the government has paid about Lps.1.4 billion in
Figure 1 Supply/Demand Balance 2007–2010
2,000
month/year
1,600
1,200
800
400
0
Jan-
07
Jul-0
7
Jan-
08
Jul-0
8
Jan-
09
Jul-0
9
Jan-
10
Jul-1
0
y
Peak demand Small renewables Shortfall
MW
Thermoelectric
Hydro ENEE
Source: Authors’ calculations, 2007.
5176-FM.pdf xvii 5/19/10 1:12 PM
xviii
HONDURAS: POWER SECTOR ISSUES AND OPTIONS
direct tariff subsidies to residential consumers. However, ENEE’s annual fi nancial losses during 2002 to 2006 are a more appropriate refl ection of the economic cost, because they reveal the huge need for investments in the sector, the alarming cash-fl ow position, and the structural imbalances between costs and revenues.
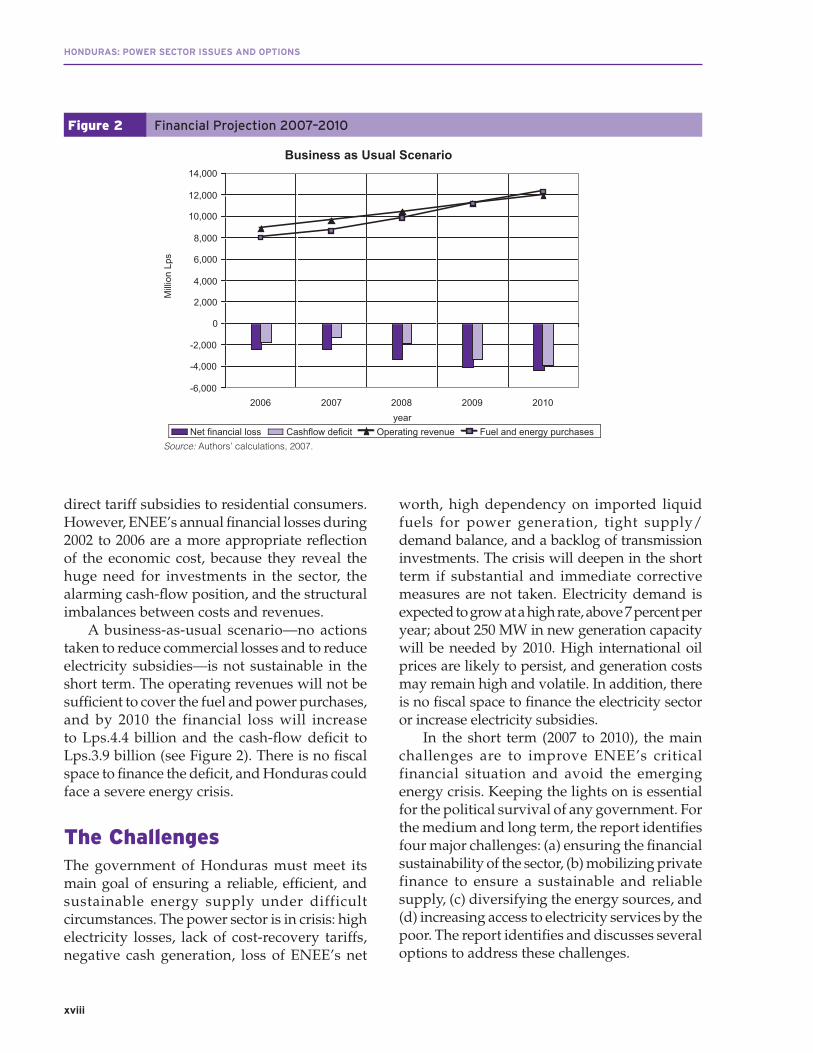
A business-as-usual scenario—no actions taken to reduce commercial losses and to reduce electricity subsidies—is not sustainable in the short term. The operating revenues will not be suffi cient to cover the fuel and power purchases, and by 2010 the financial loss will increase to Lps.4.4 billion and the cash-fl ow defi cit to Lps.3.9 billion (see Figure 2). There is no fi scal space to fi nance the defi cit, and Honduras could face a severe energy crisis.
The Challenges The government of Honduras must meet its main goal of ensuring a reliable, effi cient, and sustainable energy supply under difficult circumstances. The power sector is in crisis: high electricity losses, lack of cost-recovery tariffs, negative cash generation, loss of ENEE’s net
Figure 2 Financial Projection 2007–2010
worth, high dependency on imported liquid fuels for power generation, tight supply/demand balance, and a backlog of transmission investments. The crisis will deepen in the short term if substantial and immediate corrective measures are not taken. Electricity demand is expected to grow at a high rate, above 7 percent per year; about 250 MW in new generation capacity will be needed by 2010. High international oil prices are likely to persist, and generation costs may remain high and volatile. In addition, there is no fi scal space to fi nance the electricity sector or increase electricity subsidies.
In the short term (2007 to 2010), the main challenges are to improve ENEE’s critical financial situation and avoid the emerging energy crisis. Keeping the lights on is essential for the political survival of any government. For the medium and long term, the report identifi es four major challenges: (a) ensuring the fi nancial sustainability of the sector, (b) mobilizing private finance to ensure a sustainable and reliable supply, (c) diversifying the energy sources, and (d) increasing access to electricity services by the poor. The report identifi es and discusses several options to address these challenges.
Business as Usual Scenario
-6,000
-4,000
-2,000
0
2,000
4,000
6,000
8,000
10,000
12,000
14,000
2006 2007 2008year
2009 2010
Milli
on L
ps
Net financial loss Cashflow deficit Operating revenue Fuel and energy purchasesSource: Authors’ calculations, 2007.
5176-FM.pdf xviii 5/19/10 1:12 PM
xix
Executive Summary
Short-Term Challenges and OptionsImproving the Financial Performance of ENEEThe main factors under the control of ENEE and the government that have a substantial impact on ENEE’s fi nancial performance in the short term (2007 to 2010) are electricity losses and electricity prices. Any reduction in commercial losses is converted into more sales and less generation, which means higher revenues and lower energy purchase costs. Any increase in average retail prices is converted into higher revenues and energy savings.
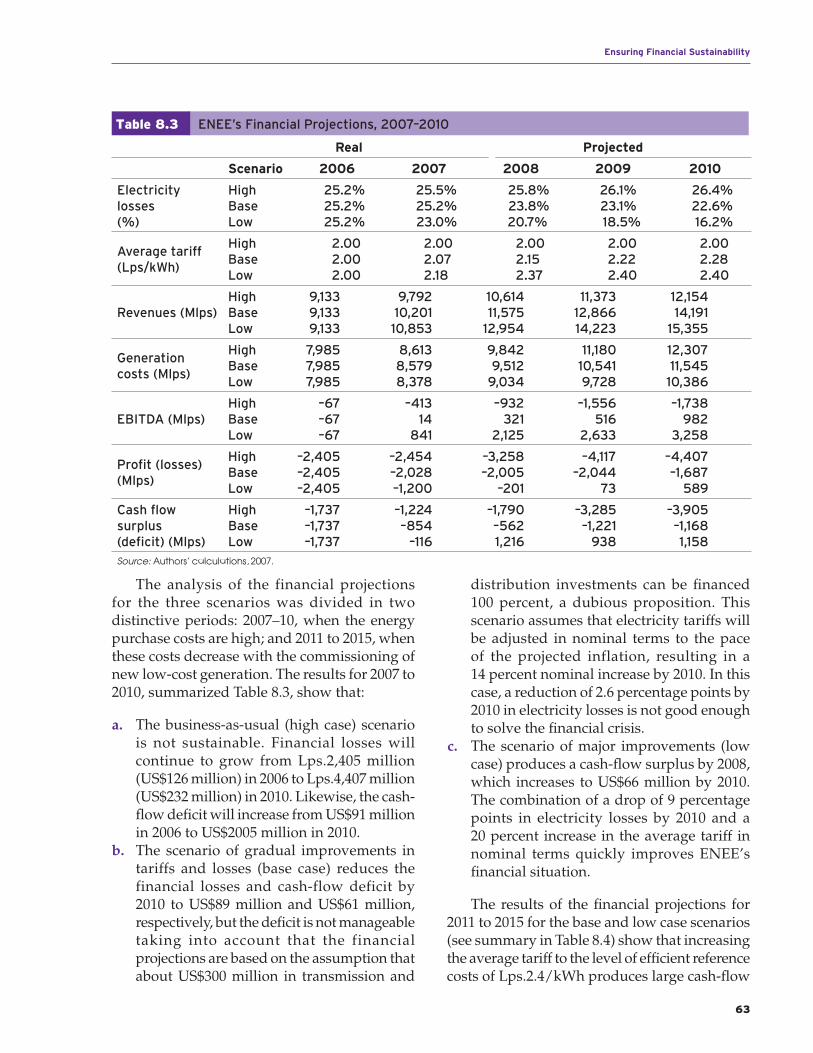
Substantial improvements in electricity losses and electricity tariffs are required to reverse ENEE fi nancial losses during 2007 to 2010. The analysis of ENEE’s fi nancial projections under different scenarios shows that reducing electricity losses to about 16 percent in four years and aligning average tariffs with economic costs in about three years would produce a cumulative cash-fl ow surplus during this period. A gradual improvement in losses and tariffs would result in a cumulative cash-fl ow defi cit of about US$200 million and would not be sustainable, taking into account fi scal constraints. A substantial
improvement in losses with no tariff adjustments would also result in a defi cit of US$239 million (see Table 1).
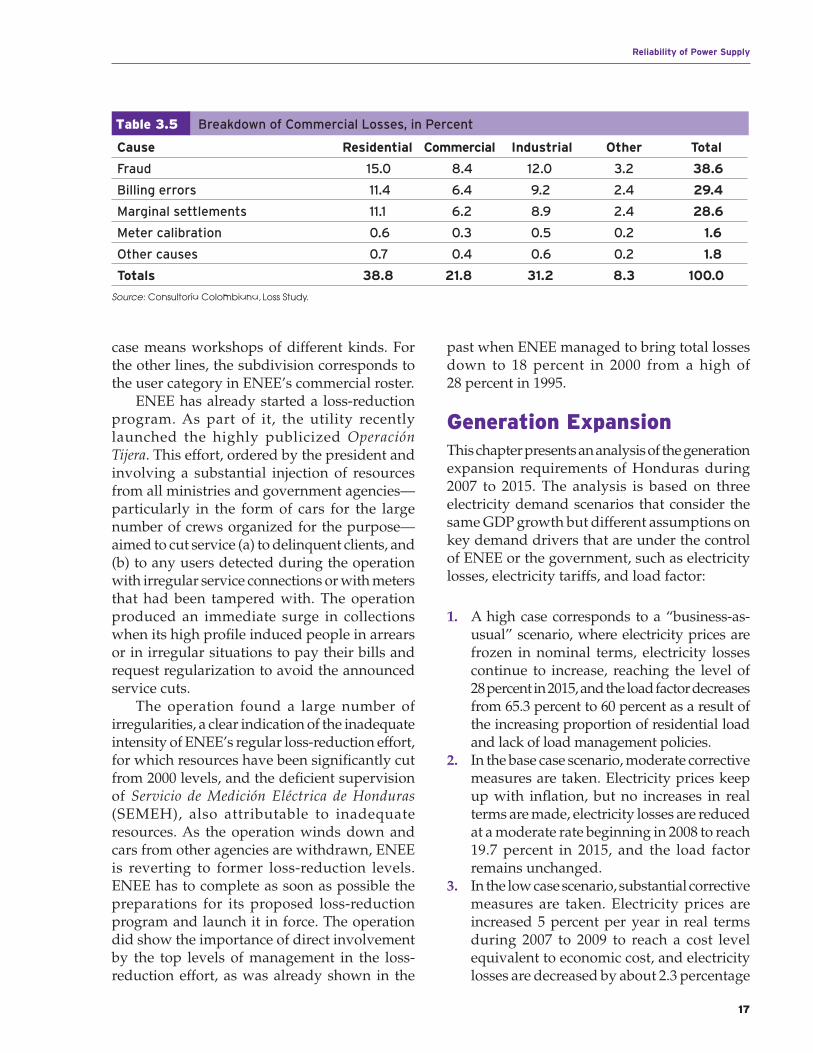
Most of the electricity losses are commercial losses that can be reduced in the short term with substantial corrective measures. A recent study estimated that technical losses are about 10 percent, implying that current commercial losses are about 15 percent, of which about 39 percent corresponds to fraud, 29 percent to illegal settlements, and 29 percent to billing errors (see Table 2).
A comparison with regional countries indicates that electricity losses in Honduras are high and that all countries in the region (except Nicaragua) have been able to keep losses near or below 15 percent, an indication that this target can be achieved by good management and better commercial practices (Figure 3).
ENEE is currently implementing a loss-reduction program as a key element of a short-term financial recovery plan. The program includes a high-profi le and publicized operation (Operación Tijera) that has motivated consumers in arrears or in irregular situations to pay their bills or request regularization of their connections in order to avoid the announced service cuts. The program includes a US$30 million investment in prepaid meters, tamper-proof connections,
Moderate Corrective Measures
Major Corrective Measures
No Tariff Adjustment
System losses200620082010
%%%
25.2% 23.8% 22.6%
25.2% 20.7% 16.2%
25.2% 20.7% 16.2%
Average retail tariff200620082010
Lp/kWhLp/kWhLp/kWh
2.00 2.15 2.28
2.00 2.37 2.40
2.00 2.00 2.00
Additional generationcapacity requirement
MW 275 170 170
Cumulative cash fl ow US$MM –200 168 –239
Table 1 ENEE’s Financial Projections (2007–2010)
Source: Consultoría Colombiana, Loss study and Authors’ calculations, 2007.
5176-FM.pdf xix 5/19/10 1:12 PM
xx
HONDURAS: POWER SECTOR ISSUES AND OPTIONS
and other equipment. The operation shows the importance of direct involvement in the loss-reduction program by the top levels of management, as was already done when ENEE managed to bring losses down to 18 percent in 2000 from a high of 28 percent in 1995.
As a complement to the loss-reduction program, the government may consider in the short term other options (management contracts) to attract experienced private operators and improve ENEE’s performance (see page xxii).
On electricity prices, the report concludes that there are substantial distortions in the tariff structure and that the average electricity tariff
Cause Residential Commercial Industrial Other Total
Fraud 15.0 8.4 12.0 3.2 38.6
Billing errors 11.4 6.4 9.2 2.4 29.4
Marginal settlements 11.1 6.2 8.9 2.4 28.6
Meter calibration 0.6 0.3 0.5 0.2 1.6
Other causes 0.7 0.4 0.6 0.2 1.8
Totals 38.8 21.8 31.2 8.3 100.0
Source: Consultoría Colombiana, Loss study.
Table 2 Breakdown of Commercial Losses, in Percent
covers about 81 percent of the economic costs of supply. There is a generalized cross-subsidy that exceeds the limits established in the Electricity Law and benefi ts mainly nonpoor residential consumers with monthly consumption above 150 kWh/month. The analysis shows that the generalized subsidy and a direct subsidy paid by the government are poorly targeted and regressive.
All options to align tariffs with economic costs and target subsidies to protect low-income consumers have a relatively high political cost. The government would have to consider substantial tariff adjustments in this
El Salvador Guatemala HondurasNicaragua R. Dominicana Belize Panama
Source: LAC Electricity Benchmarking Database, The World Bank, 2007.
5176-FM.pdf xx 5/19/10 1:12 PM
xxi
Executive Summary
presidential period to about 370,000 nonpoor residential consumers, who currently pay between 50 percent and 80 percent of economic costs and have one of the lowest residential tariffs in the region. Average tariffs for industrial and commercial consumers already cover economic costs and are one of the highest in the region. Two options are discussed in the report: one would involve increasing tariffs for nonresidential categories by about 5.1 percent, and the other considers an 11 percent increase for other categories to mitigate the tariff impact on residential consumers with consumption below 150 kWh/month, as shown in Table 3.
The argument that increasing tariffs is counterproductive and is a bad option, because electricity fraud will also increase in response to higher tariffs, is weak in this case. Well-targeted subsidies can protect low-income consumers that may not be able to afford to pay a large tariff increase. Other residential consumers have relatively low electricity tariffs and most likely can afford to pay a large tariff increase distributed in monthly adjustments over two or three years. What is important is to show that
tariff increases and reduction of commercial losses are necessary actions to avoid energy shortages, the option with the highest economic cost for consumers and the biggest political cost for the government.
The renegotiation of PPAs, included in ENEE’s short-term recovery plan, may marginally reduce the fi nancial burden of energy purchases and should be used with care. The annual capacity charges of existing PPAs now amount to about US$110 million, or 25 percent of the cost of energy purchases. A survey of PPA prices in Central America completed in 2001 shows that only the prices of Lufussa I and Elcosa contracts are clear outliers, which may refl ect high project risks perceived by the pioneer investors in the generation and use of expensive emergency solutions. The new contracts with Lufussa III and Enersa have very competitive prices. It has been reported that a preliminary agreement was reached to reduce the annual payments for 2007 to 2009 by US$20 million, but presumably Lufussa and Elcosa are asking for an extension of the expensive contracts expiring in 2010, and its fi nancial impact should be assessed with care.
5176-FM.pdf xxi 5/19/10 1:12 PM
xxii
HONDURAS: POWER SECTOR ISSUES AND OPTIONS
Avoiding the Emerging Energy CrisisThe analysis of the generation expansion plans shows that, in the short term, there is a defi cit of fi rm power in 2007 to 2010 of between 170 MW and 380 MW, depending on the scenario (business as usual, moderate actions, and major actions), which can be addressed only by leasing skid-mounted diesel generation, which can be deployed in the short term, and the implementation of load management programs. The supply/demand balances of the neighboring countries appear to be too tight to provide fi rm capacity support in this period.
Progress made in taking effective measures to reduce electricity losses and to introduce cost-recovery tariffs and energy effi ciency programs would have a substantial impact on avoiding an energy crisis by reducing additional generation capacity requirements. This would also produce large fi nancial benefi ts to ENEE by avoiding contracting expensive emergency generation for 2007 to 2010. The difference between the electricity demand of the “business-as-usual” scenario and the “major actions” scenario is such that about 180 MW of expensive generation could be saved.
Medium- and Long-Term OptionsEnsuring the Financial Sustainability of the SectorThe loss-reduction program and tariff adjustments are necessary short-term options to improve ENEE’s fi nancial situation. However, it is unlikely that substantial and sustainable improvements in the performance of ENEE can be achieved if its corporate governance is not strengthened. Good performance is a necessary condition to ensure financial sustainability, because passing on ENEE’s inefficiencies to tariffs or providing fi scal support are not valid options in this case. Credible and competent price regulation is another necessary condition.
The report discusses medium-term institutional options to improve ENEE’s performance, including the creation of independent business units, management contracts, corporatization and partial private control, and alternatives to use competition as a further pressure for better performance.
The restructuring of ENEE and the creation of independent business units (IBUs) for distribution, transmission/dispatch, and generation, with separate accounts and transfer prices, will provide incentives to improve efficiency (performance of individual units can be monitored and rewarded), facilitate regulation of distribution and transmission (separate regulatory accounts, transparent pricing, and benchmarking), and help develop competition (reduce barriers to open access and increase autonomy of dispatch). This is a medium-term option that will be initiated with the restructuring study that the government is expected to contract shortly.
However, the creation of IBUs is not suffi cient to improve the weak corporate governance of ENEE. The transformation of these units into separate companies subject to private-sector corporate law, with an independent board of directors and professional management and with the participation of minority shareholders, is an option that should be considered for the longer term.
In the meantime, it is essential to reduce commercial losses and improve the management of ENEE. The recent ad hoc government interventions in the management of ENEE (four changes in about one year) have not been effective and are not sustainable. A management contract (transfer full or partial responsibility for day-to-day operations to an outside operator) is a low-risk public/private partnership that can be used as an interim arrangement to attract experienced private operators and improve performance. However, the international experience with management contracts in electricity shows that they usually fail if the operator does not have full autonomy to make key decisions and
5176-FM.pdf xxii 5/19/10 1:12 PM
xxiii
Executive Summary
implement its proposed measures to improve performance, and does not have a financial stake in the operation of the utility (payments linked to specifi c and measurable performance improvements).
The contract with the Servicio de Medición Eléctrica de Honduras (SEMEH) for reading, billing, and collections is not an appropriate management contract to reduce losses, because it is limited in scope and creates weak incentives for performance. Several options are suggested, such as soliciting international competitive bids for a new management contract, renegotiating the existing SEMEH contract, or contracting private operators with full responsibility for reducing losses in clusters of distribution feeders with high losses.
A gradual transition from a single-buyer model to a competitive wholesale power market is an option to improve effi ciency in the power sector of Honduras. In the short term, it is possible to increase the benefi ts of competition for long-term contracts under the single-buyer model by using public/private partnerships to facilitate private development of the capital-intensive projects required by 2013, by strengthening the fi nancial position of the buyer, and by establishing transparent competitive bidding procedures to procure new power.
In the medium term, once ENEE is restructured and corporatized, the PPAs with competitive prices can be transferred to the distribution companies, which will be responsible for competitive procurement of new power under long-term supply contracts to meet projected demand. Additional competition can be introduced by promoting the development of the market for large consumers (open access to transmission and distribution grids).
Finally, in the long term, once the Sistema de Interconexión Eléctrica para América Central (SIEPAC) project is commissioned in 2009 and the market of large consumers is expanded with the creation of new industrial parks, a spot market can be established to complement the market for long-term energy supply contracts, facilitate
regional trade, and promote competition for the market of large consumers. Changes in the law will be required to create the institutions and trading arrangements necessary to operate a competitive market.
The improvements of corporate governance and the development of a competitive market will require capable policy making and regulation. A short-term solution to improve policy making is to strengthen the energy group of SERNA and eliminate the Energy Cabinet. Improvements in regulation require, fi rst, political support and government commitment to implement the rules. Improving CNE’s credibility is a longer-term process that requires changes in the law to increase its autonomy, transparency, and technical competence.
Table 4 shows the timing and linkages between the options for a gradual development of a competitive market and the options for improving the corporate governance of ENEE.
Ensuring a Sustainable and Reliable Power SupplyThe report analyzes the generation expansion requirements and the fi nancial results of ENEE under three demand scenarios for 2007 to 2015, which consider different assumptions on the corrective measures taken to reduce electricity losses and adjust electricity tariffs. In a business-as-usual scenario (high case), no measures are taken (electricity prices are frozen in nominal terms and electricity losses continue to increase gradually). In a base case scenario, moderate corrective measures are taken (electricity prices keep up with infl ation, and electricity losses are reduced at a moderate rate). In a low case scenario, substantial corrective measures are taken (electricity prices are increased to reach a cost level equivalent to economic cost, and electricity losses are reduced to 12 percent).
In the medium term, capacity additions of about 600 MW in large hydroelectric and thermoelectric projects will be necessary at the earliest commissioning date, estimated for 2013, in order to meet demand growth and
5176-FM.pdf xxiii 5/19/10 1:12 PM
xxiv
HONDURAS: POWER SECTOR ISSUES AND OPTIONS
Tab
le 4
H
on
du
ras
Pow
er
Mar
ket
Dev
elo
pm
en
t
Trading and Pricing ArrangmentsRestructuring and Corporate Governance
Un
bu
nd
ling
/
pri
vati
zati
on
Lo
ng
-te
rm
Un
bu
nd
ling
/ m
ino
rity
shar
eh
old
ers
Lo
ng
-te
rm
Un
bu
nd
ling
/
corp
ora
tiza
tio
nM
ed
ium
te
rm
Se
par
atio
n o
f ac
cou
nts
(IB
Us)
20
09
–?
Ve
rtic
al in
teg
rati
on
/
ren
eg
oit
iate
d S
EM
EH
or
man
age
me
nt
con
trac
t
20
08
–20
09
Ve
rtic
al in
teg
rati
on
/
SE
ME
H c
on
trac
t2
00
7
Lo
ng
te
rm-c
on
trac
ts
PP
As
wit
h E
NE
EIm
pro
vem
en
ts in
co
mp
etit
ive
bid
din
g
pro
ced
ure
s
PP
As
wit
h E
NE
ETr
ansf
er
pri
ces
bet
we
en
G a
nd
D
un
its
PP
As
are
tra
nsf
ere
d t
o d
istc
os
Lo
ng
-te
rm c
on
trac
ts w
ith
dis
tco
s
Fle
xib
le p
hysi
cal/
fi n
anci
al
con
trac
tsO
blig
atio
n t
o m
eet
d
em
and
wit
h c
on
trac
ts
Lar
ge
co
nsu
me
rsp
arti
cip
atio
nP
rom
ote
par
tici
pat
ion
in c
on
trac
t m
arke
t w
ith
tra
nsp
are
nt
tran
smis
sio
n c
har
ges
Par
tici
pat
ion
in s
po
t an
d
con
trac
t m
arke
ts
En
erg
y b
alan
ce a
nd
auxi
liary
se
rvic
esP
rovi
de
d b
y E
NE
EC
reat
ion
of
mar
ket
adm
inis
trat
or
and
sp
ot
mar
ket
Re
gio
nal
mar
ket
Tran
sact
ion
s to
op
tim
ize
op
era
tio
n
and
me
et e
ne
rgy
sh
ort
fall
Dis
tco
s an
d la
rge
co
nsu
me
rs
trad
e in
co
ntr
act
mar
ket
Act
ive
tra
din
g in
co
ntr
act
and
sp
ot
mar
ket
Ge
ne
rati
on
pri
ceA
vera
ge
of
mar
gin
al c
ost
Ave
rag
e c
ost
of
lon
g t
erm
co
ntr
acts
Ave
rag
e o
f co
ntr
acts
an
d s
po
t
Mar
ket
mo
de
lS
ing
le-b
uye
rW
ho
lesa
le c
om
pet
itio
nSo
urc
e: A
uth
ors
’ ca
lcu
latio
ns,
2007
.
5176-FM.pdf xxiv 5/19/10 1:12 PM
xxv
Executive Summary
replace costly emergency generation to reduce generation costs. Attracting the private sector for the development of these capital-intensive projects with long construction periods by 2013 poses a major challenge. It will be necessary to complete technical and economic feasibility studies and environmental impact assessments, fi nd and select project sponsors, and implement an adequate fi nancing structure (public/private partnership) to manage market and project risks.
The planning and procurement process for the development of new generation plants has to be improved. ENEE had to rely on costly emergency generation to meet demand during 2001 to 2004, and will have to do the same during 2008 to 2010, due to delays and defi ciencies in this process. The planning process should guide future government actions (policies, investment incentives) and provide a signal to investors to induce an effi cient allocation of resources. CNE should establish rules and procedures for energy procurement that promote competition and least-cost generation expansion, providing suffi cient lead time for the preparation of proposals, ensuring project fi nancing and construction of competitive projects.
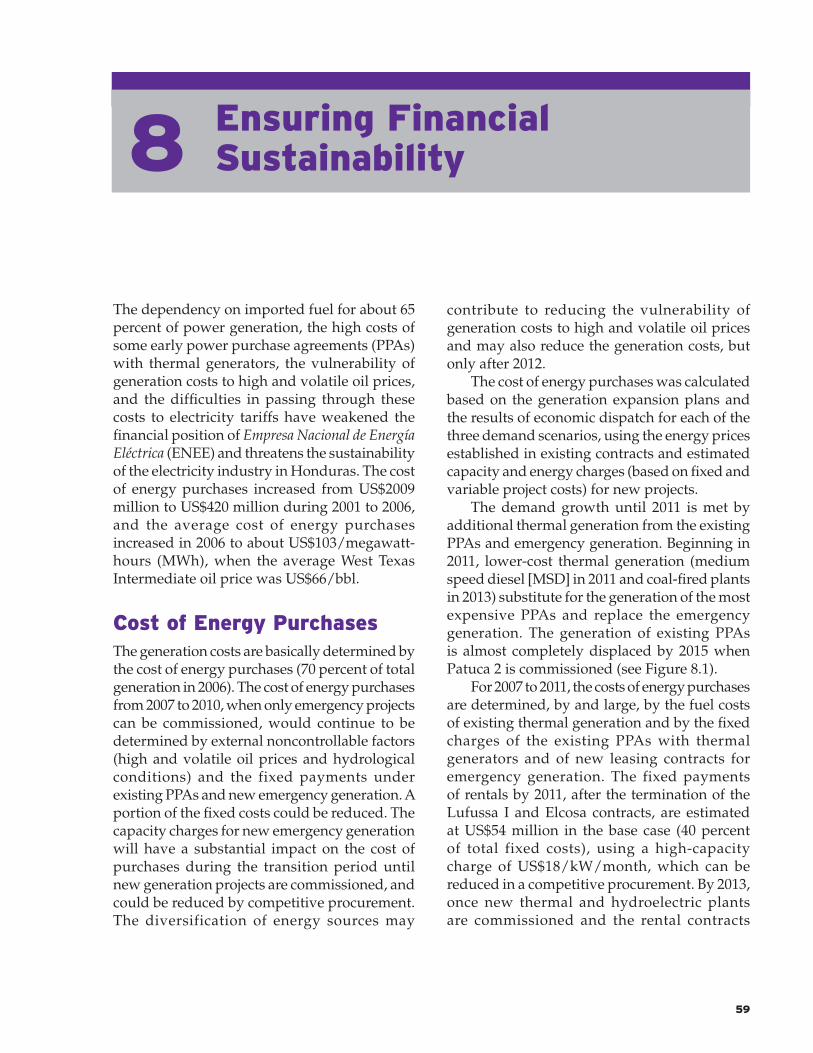
Timely implementation of the least-cost indicative generation plan is essential to reduce generation costs. The report shows that the average energy purchase price would be reduced from about US$95/MWh in 2007 to 2010 to about US$87/MWh by 2011 and to US$75/MWh by 2013, with the retirement of expensive PPAs and emergency generation and with the commissioning of lower-cost generation plants beginning in 2011.
Diversifying Energy SourcesHonduras has the opportunity to implement a diversifi cation policy to reduce the volatility of energy prices, decrease generation costs, and improve energy security. There is a substantial potential of untapped indigenous renewable resources that can be developed at competitive prices, because a long-term trend of high oil prices is likely. Furthermore, the commissioning
of the SIEPAC project will expand the potential for regional energy trade and the development of large regional generation projects. Large and economic coal-fi red and gas-fi red thermal projects will not reduce the dependency on imported fuels but can contribute to reducing the volatility of generation prices (coal projects) or to the development of clean energy (gas projects).
To implement an effective diversifi cation policy, the following is recommended:
a. Promote public/private partnerships to develop medium and large hydroelectric projects and large coal-fi red thermoelectric projects, where the public sector supports the completion of feasibility and environmental studies; secures timely granting of licenses and permits, and the implementation of environmental mitigation plans and settlement programs; provides financial support mechanisms to ensure long-term financing; and implements the projects necessary to strengthen the 230 kV transmission grid.
b. Eliminate the barriers to expanding regional energy trade, mainly the lack of a spot energy market in Honduras, the operation of ENEE as a vertically integrated monopoly, the lack of clarity of ENEE’s exclusive rights for importing and exporting electricity, and the preferential rights of local demand on local generation.
Renewables. The development of renewable sources is an important element of the strategy to diversify energy supply, reduce vulnerability to external shocks, and mitigate the environmental impacts of energy production. Recent progress in implementing this strategy has been made largely as a result of fi scal and tariff incentives sanctioned in a 1998 law. The current focus is on the development of large hydropower projects and on providing additional incentives for the grid-connected renewable projects. The potential for the development of off-grid and small renewable sources appears to be largely
5176-FM.pdf xxv 5/19/10 1:12 PM
xxvi
HONDURAS: POWER SECTOR ISSUES AND OPTIONS
untapped, though a resource base assessment is not available. Little has been done to promote micro- and pico-hydro power and the use of photovoltaic capacity due to the lack of specific incentives and policies for off-grid rural electrifi cation programs. Even the new Renewable Energy Bill, which is now before Congress, fails to emphasize specifi c incentives and mechanisms for off-grid solutions.
Energy Effi ciency. Energy effi ciency measures at both supply and demand are the most economical options to reduce the need for additional generation capacity and to improve security of supply. In the case of Honduras, the implementation of a well-structured loss-reduction program could effectively reduce the short-term need for emergency generation and/or power rationing. Furthermore, energy effi ciency measures on the demand side could be used in conjunction with rural electrifi cation programs to improve access and reduce the impact of higher electricity tariffs.
Despite some recent progress under the Generación Autónoma y Uso Racional de Energía Eléctrica (GAUREE) project, financed by the European Union between 2000 and 2007, Honduras is still lagging behind other countries in the region in terms of design and implementation of energy effi ciency programs. Large effi ciency improvements could be made in the areas of air conditioning for both the residential and commercial sectors. The electricity tariff structure for residential consumers with tariffs for low consumption that do not cover marginal generation cost is also an impediment to the success of energy effi ciency programs.
A good opportunity to start a comprehensive program for energy effi ciency in the country is the recently established Inter-Institutional Group for the Effi cient Use of Energy (GIURE), with the participation of SERNA, the Consejo Hondureño de la Empresa Privada (COHEP), the
Ministry of Education, ENEE, the Universidad Nacional Autónoma de Honduras (UNAH), the Consejo Empresarial Hondureño para el Desarrollo Sostenible/Proyecto de Eficiencia Energética en los Sectores Industrial y Comercial de Honduras (CEHDES/PESIC), CNE, and the Colegio de Ingenieros Mecánicos, Electricistas y Químicos (CIMEQH). The group has formulated a plan to reduce the national energy demand by 100 MW in 2008, equivalent to an 8 percent reduction of the peak demand forecasted by ENEE. The plan includes a number of activities and projects to be carried out by the individual agencies.
Improving Electricity CoverageSocial electrification is an important part of the government’s poverty reduction strategy, particularly in rural areas where the electricity coverage reaches only 45 percent compared to 94 percent in urban areas in 2006. Electrifi cation was programmed under the 1994 Electricity Law for the Electricity Sector with the creation of the Social Fund for Electricity Development (FOSODE). The early outcome has been positive, increasing the national coverage from 43 percent in 1994 to 69 percent in 2006.
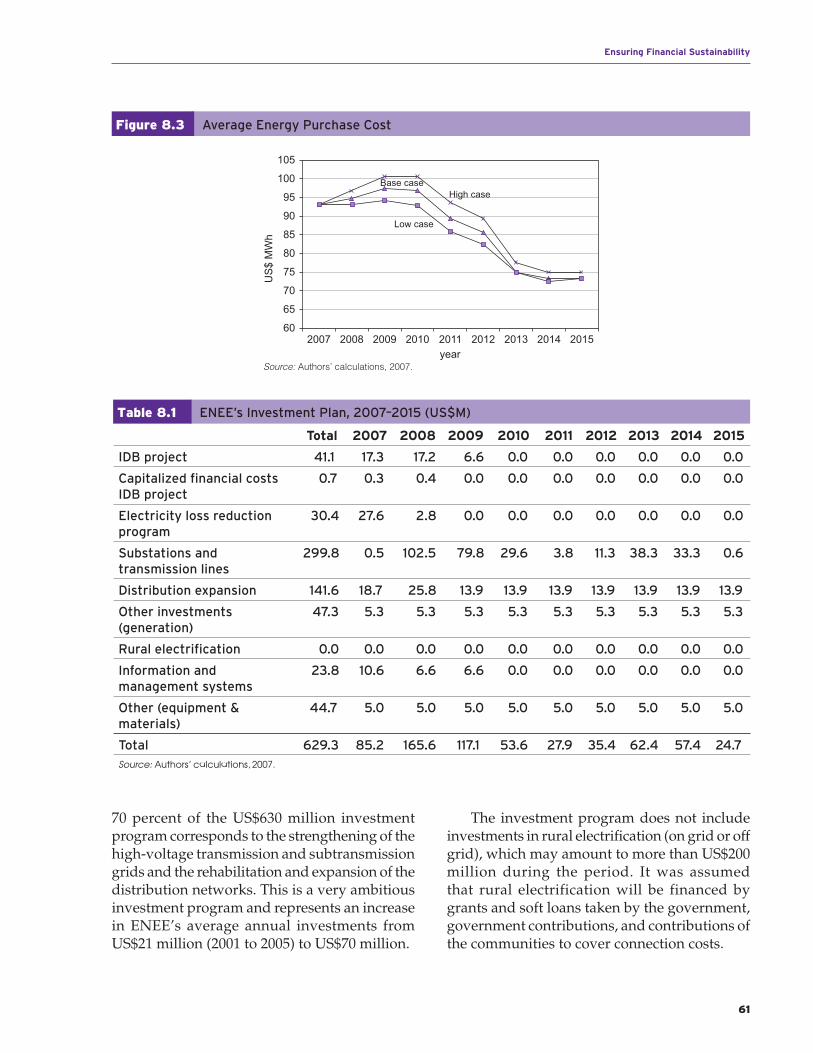
The government set a target to increase national electricity coverage to 80 percent by 2015, giving equal priority to urban and rural areas. The unit connection cost by grid extension is projected to further increase because more remote and less densely populated areas are to be connected. The annual investment needs are estimated by FOSODE to be around US$16million. However, this cost estimate covers only the direct costs of extending the existing grid to the users, and does not include the investment costs for subtransmission networks and running costs for the needed new generation capacity. Moreover, since the current tariff to new users is much below the cost-recovery level of providing electric services, there will be profound fi scal impacts on cross- and direct-subsidies associated
5176-FM.pdf xxvi 5/19/10 1:12 PM
xxvii
Executive Summary
with achieving the government’s electrifi cation targets. At the current tariff level and current consumption level for the newly connected customers, the tariff defi cit and the direct subsidy resulting from new connections are estimated to be US$4.1 million in 2007 and to increase to US$48 million in 2015.
The government’s current policy of subsidizing consumption seems to be ineffi cient. First, the cross-subsidy schemes embedded in the current tariff structure have benefi ted the segment of the population that is not most needy. Only 42 percent of the poor households have access to electricity, suggesting an error of exclusion of about 58 percent and an error of inclusion of 52 percent. Second, the direct subsidy on consumption by grid-connected users has resulted in the grid-connected users paying much less than the unconnected residents for getting the same level of electric services, even though evidence shows that the grid-connected users can afford to pay a higher tariff.
The challenges ahead include the need for an integrated policy for rural electrifi cation, improving human resource capacity and the funding level of FOSODE, increasing the participation of the private sector and local governments, mobilizing fi nancial resources to meet investment needs, promoting and developing economically viable off-grid solutions, rectifying the error of inclusion in subsidy, and retargeting the resources toward new connections.
To meet these challenges on the institutional front, it is recommended to, in the short term: (a) strengthen SERNA as the de facto energy
ministry in its capacity of developing strategy, planning, and policy formulations in rural electrifi cation; and (b) strengthen the technical capacity of FOSODE with the necessary training in electrification options based on stand-alone technology, renewable energy, and in the development of business models that use alternative energy options. In the long term, it is recommended to transform FOSODE into an autonomous, unified fund through which all current electrifi cation efforts can be promoted, both for grid extension and stand-alone systems. It is also desirable to correct the distorted residential tariff structure and transfer the residential tariff subsidy to increasing coverage.
On the policy alternatives regarding tariffs and subsidies, it is recommended to increase the tariff to the cost-recovery level and retarget the subsidy to the neediest, thus freeing up resources that could be used to increase electricity coverage. A policy mix of increasing the residential tariff by 20 percent and reducing direct subsidy by 10 percent would lead to almost doubling the benefi ts to the low-consumption customers, increasing the ENEE’s revenue from tariff collection by US$2.6 million per month, and freeing up the government’s subsidy of US$121,000 per month. If these resources were available, nearly 46,000 new connections could be added each year, assuming an average connection cost of US$700. This would mean that the government target of 400,000 new connections up to 2015 could be met without the need to mobilize other resources (see Table 5).
5176-FM.pdf xxvii 5/19/10 1:12 PM
xxviii
HONDURAS: POWER SECTOR ISSUES AND OPTIONS
Obje
ctiv
eP
olicy
Mea
sure
sS
hort
-ter
m O
pti
on
sM
ediu
m-t
erm
Opti
on
s
Imp
rovi
ng
th
e fi
nan
cial
p
erf
orm
ance
of
EN
EE
an
d
red
uci
ng
its
ne
gat
ive
fi s
cal
imp
act
• Im
pro
ve s
ect
or
effi
cie
ncy
.•
Cre
ate
inst
itu
tio
nal
op
tio
ns
aim
ed
at
str
en
gth
en
ing
man
age
me
nt
and
co
rpo
rate
gov
ern
ance
.•
Red
uce
sys
tem
loss
es.
• E
nlis
t g
ove
rnm
en
t su
pp
ort
to
p
en
aliz
e t
he
ft o
f e
lect
rici
ty.
• A
dd
new
inve
stm
en
ts w
ith
ext
ern
al
sup
po
rt in
clu
din
g p
riva
te s
ect
or
par
tici
pat
ion
in m
anag
em
en
t o
f lo
w/m
ed
ium
vo
ltag
e li
nes
.
• C
reat
e in
stit
uti
on
al o
pti
on
s ai
me
d a
t m
ovin
g t
owar
d a
m
ore
mar
ket-
ori
en
ted
ind
ust
ry
stru
ctu
re.
• S
ust
ain
low
leve
l of
loss
es.
• M
ain
tain
gov
ern
me
nt
sup
po
rt.
• F
inan
ce in
vest
me
nt
thro
ug
h
inte
rnal
an
d c
om
me
rcia
l so
urc
es.
• Ta
rget
su
bsi
die
s.•
Gra
du
ally
re
du
ce c
ross
-su
bsi
die
s.•
Re
du
ce e
ligib
le le
vels
of
Bo
no
80
.•
Mai
nta
in li
felin
e s
ub
sid
ies.
• C
han
ne
l su
bsi
die
s th
rou
gh
“p
ove
rty
car
ds.
”
• A
dju
st r
etai
l tar
iffs
to
refl
ect
e
con
om
ic c
ost
of
sup
ply
.•
Gra
du
ally
incr
ease
tar
iff
in r
eal
term
s.•
Rev
ise
bas
e t
arif
f.
• A
pp
ly f
orm
ula
fo
r au
tom
atic
ad
just
me
nt
me
chan
ism
to
new
b
ase
tar
iff.
• R
en
eg
oti
ate
PP
As
and
S
EM
EH
.•
Ag
ree
on
an
d s
tart
a p
roce
ss o
f re
ne
go
tiat
ion
.
Imp
rovi
ng
re
liab
ility
of
sup
ply
• Im
ple
me
nt
load
man
age
me
nt
mea
sure
s.•
Intr
od
uce
tim
e-o
f-th
e-d
ay t
arif
fs,
and
inte
rru
pti
ble
tar
iffs
.•
Des
ign
a p
rog
ram
fo
r sh
avin
g p
eak
de
man
d.
• Im
ple
me
nt
pro
gra
m.
• S
tre
ng
the
n p
owe
r p
lan
nin
g
and
en
erg
y p
rocu
rem
en
t p
roce
ss.
• Fo
llow
du
e r
eg
ula
tory
pro
cess
fo
r ap
pro
val o
f ex
pan
sio
n p
rog
ram
an
d t
ime
ly p
rep
are
an
d is
sue
co
mp
etit
ive
te
nd
ers
.•
Incr
ease
te
chn
ical
an
d o
pe
rati
on
al
cap
acit
y o
f E
NE
E, C
NE
, an
d S
ER
NA
to
ide
nti
fy a
nd
stu
dy
sit
e-s
pe
cifi
c ca
nd
idat
e p
roje
cts.
• C
NE
to
est
ablis
h r
ule
s an
d
pro
ced
ure
s fo
r e
ne
rgy
pro
cure
me
nt
pro
mo
tin
g c
om
pet
itio
n a
nd
leas
t-co
st g
en
era
tio
n.
• D
eve
lop
ap
pro
pri
ate
po
licie
s to
pro
mo
te p
ub
lic/p
riva
te
par
tne
rsh
ip f
or
new
ge
ne
rati
on
p
roje
cts.
Tab
le 5
S
um
mar
y M
atri
x o
f O
bje
ctiv
es a
nd
Sh
ort
- an
d M
ed
ium
-te
rm O
pti
on
s
Co
ntin
ue
d
5176-FM.pdf xxviii 5/19/10 1:12 PM
xxix
Executive Summary
Obje
ctiv
eP
olicy
Mea
sure
sS
hort
-ter
m O
pti
on
sM
ediu
m-t
erm
Opti
on
s
• S
tart
pro
cure
me
nt
of
new
th
erm
al p
owe
r g
en
era
tio
n.
• In
itia
te in
tern
atio
nal
co
mp
etit
ive
b
idd
ing
pro
cess
fo
r e
me
rge
ncy
g
en
era
tio
n p
roje
cts.
• P
rep
are
fea
sib
ility
an
d
env
iro
nm
en
tal i
mp
act
asse
ssm
ent
stu
die
s fo
r n
ew
the
rmal
ge
ne
rati
on
pro
ject
s.
• E
nh
ance
inve
stm
en
t in
tr
ansm
issi
on
an
d d
istr
ibu
tio
n.
• P
rep
are
inte
rnat
ion
al c
om
pet
itiv
e
bid
din
g p
roce
ss f
or
BO
O/B
OT
tr
ansm
issi
on
inve
stm
en
ts.
• P
rom
ote
de
cen
tral
ize
d s
olu
tio
ns
for
dis
trib
uti
on
inve
stm
en
ts a
nd
co
mm
erc
ial m
anag
em
en
t.
• A
dap
t re
gu
lati
on
s to
act
ive
ly
par
tici
pat
e in
re
gio
nal
e
lect
rici
ty m
arke
t.
• C
lari
fy w
het
he
r n
ew le
gis
lati
on
is
re
qu
ire
d t
o e
limin
ate
EN
EE
’s
excl
usi
vity
.•
Est
ablis
h B
usi
nes
s U
nit
s in
EN
EE
an
d t
ran
sfe
r p
rice
s.
• If
ne
cess
ary,
am
en
d le
gis
lati
on
.
Div
ers
ify
ing
en
erg
y s
ou
rce
s•
Pro
mo
te e
ne
rgy
effi
cie
ncy
.•
Sta
rt im
ple
me
nta
tio
n o
f th
e
Cam
pañ
a d
e P
rom
oci
ón
y A
ho
rro
de
E
fi ci
en
cia
En
erg
éti
ca.
• C
on
solid
ate
an
d e
xpan
d
pro
gra
m.
• P
rom
ote
hyd
rop
owe
r d
eve
lop
me
nt.
• P
rep
are
env
iro
nm
en
tal a
nd
so
cial
im
pac
t as
sess
men
t fo
r m
ajo
r si
tes/
bas
ins.
• P
rep
are
pla
n f
or
pri
vate
se
cto
r p
arti
cip
atio
n.
• Im
ple
me
nt
hyd
rop
owe
r sc
he
mes
wit
h p
ub
lic/p
riva
te
sect
or
dev
elo
pm
en
t u
nd
er
inte
rnat
ion
al c
om
pet
itiv
e
bid
din
g.
• P
rom
ote
dev
elo
pm
en
t o
f sm
all r
en
ewab
le p
roje
cts,
in
clu
din
g m
icro
hyd
ro a
nd
p
ho
tovo
ltai
c.
• R
evis
e R
en
ewab
le E
ne
rgy
Bill
to
pro
mo
te o
ff-g
rid
re
new
able
p
roje
cts.
• P
rom
ote
co
al a
nd
LN
G-b
ase
d
pow
er
pro
ject
s.•
Pre
par
e f
easi
bili
ty a
nd
e
nvir
on
me
nta
l im
pac
t as
sess
men
t st
ud
ies
for
coal
an
d L
NG
pro
ject
s.
• P
rep
are
inte
rnat
ion
al
com
pet
itiv
e b
idd
ing
pro
cess
fo
r n
ew p
roje
cts.
Tab
le 5
C
on
tin
ue
d
Co
ntin
ue
d
5176-FM.pdf xxix 5/19/10 1:12 PM
xxx
HONDURAS: POWER SECTOR ISSUES AND OPTIONS
Obje
ctiv
eP
olicy
Mea
sure
sS
hort
-ter
m O
pti
on
sM
ediu
m-t
erm
Opti
on
s
Imp
rovi
ng
ele
ctri
city
co
vera
ge
• S
tre
ng
the
n t
he
inst
itu
tio
nal
ca
pac
ity
an
d c
oo
rdin
atio
n o
f S
ER
NA
an
d F
OS
OD
E.
• Im
pro
ve t
he
te
chn
ical
cap
acit
y o
f S
ER
NA
in d
eve
lop
ing
str
ate
gie
s,
pla
nn
ing
, an
d p
olic
y f
orm
ula
tio
n in
ru
ral e
lect
rifi
cati
on
.•
Incr
ease
th
e t
ech
nic
al c
apac
ity
o
f FO
SO
DE
wit
h t
rain
ing
in
ele
ctri
fi ca
tio
n o
pti
on
s fo
r st
and
-al
on
e t
ech
no
log
ies,
re
new
able
e
ne
rgy,
an
d p
ub
lic/p
riva
te
par
tne
rsh
ip m
od
els
. •
Co
rre
ct d
isto
rte
d t
arif
f st
ruct
ure
to
pro
vid
e in
cen
tive
s fo
r in
crea
sin
g
ele
ctri
fi ca
tio
n.
• Tr
ansf
orm
FO
SO
DE
into
an
au
ton
om
ou
s, u
nifi
ed
fu
nd
to
p
rom
ote
bo
th g
rid
ext
en
sio
n
and
sta
nd
-alo
ne
sys
tem
s.
• P
rom
ote
off
-gri
d s
olu
tio
ns
wit
h p
riva
te s
ect
or
and
loca
l g
ove
rnm
en
t p
arti
cip
atio
n.
• R
evis
e R
en
ewab
le E
ne
rgy
Bill
to
pro
mo
te o
ff-g
rid
re
new
able
p
roje
cts
and
pri
vate
se
cto
r an
d
loca
l par
tici
pat
ion
. So
urc
e: A
uth
ors
’ ca
lcu
latio
ns,
2007
.
Tab
le 5
C
on
tin
ue
d
5176-FM.pdf xxx 5/19/10 1:12 PM
xxxi
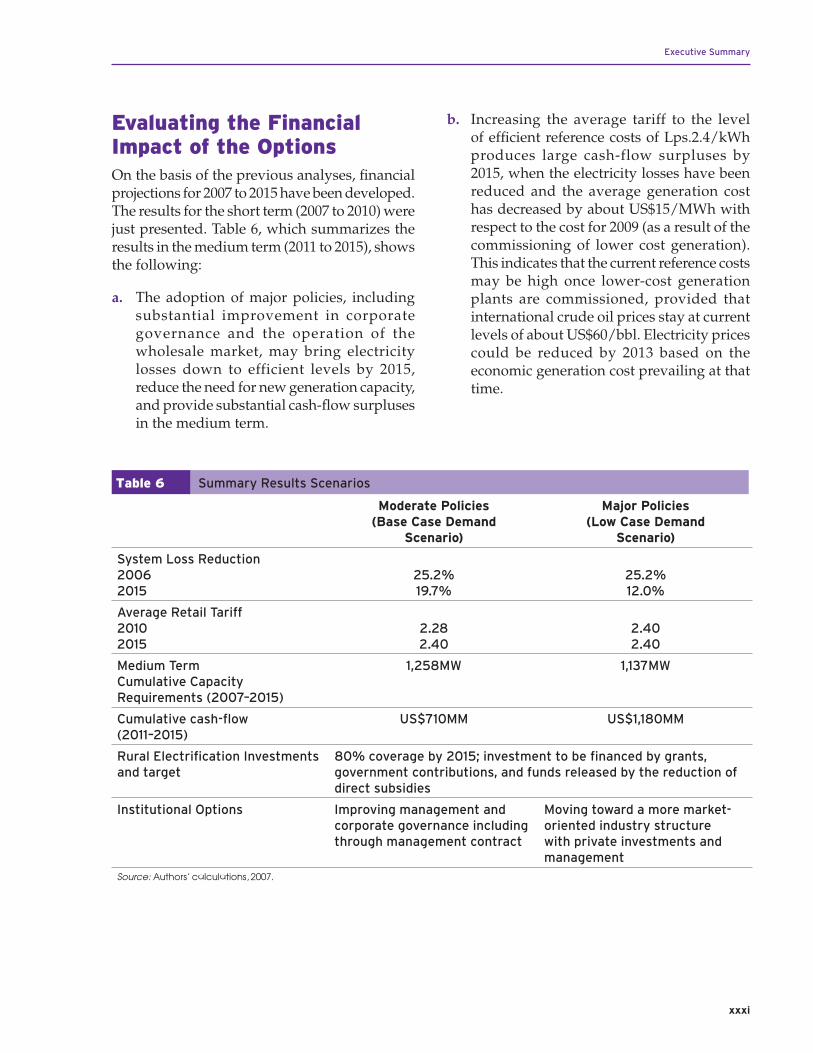
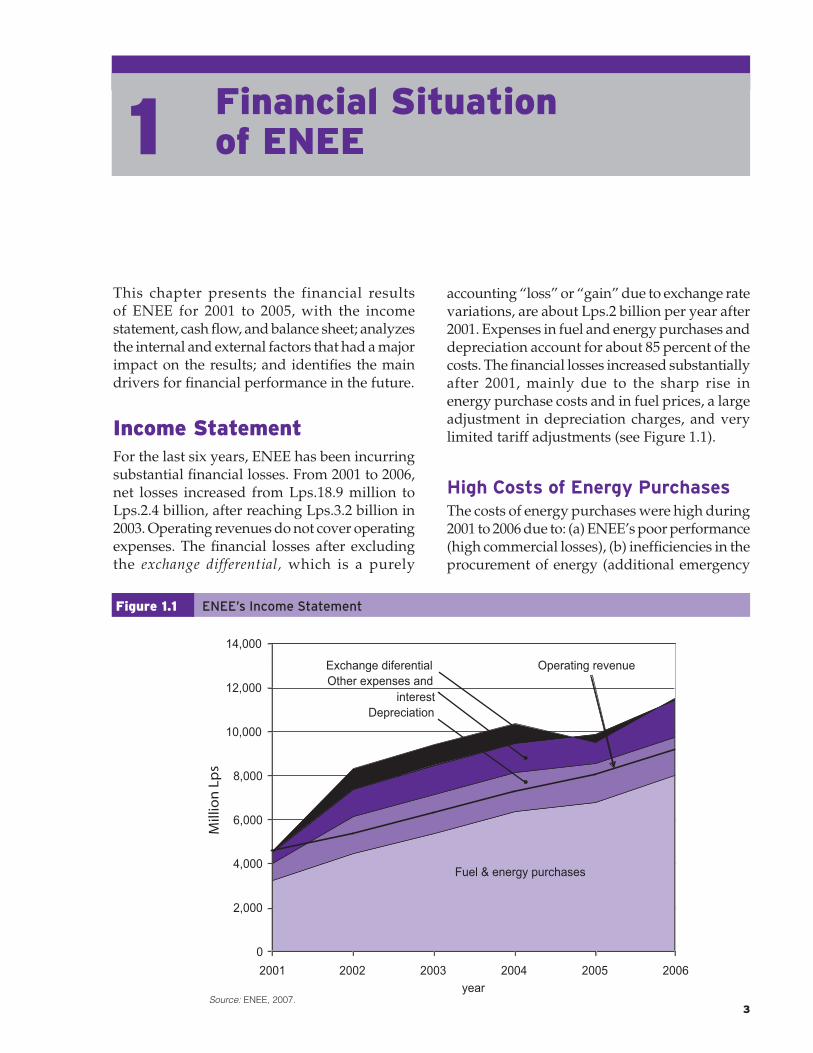
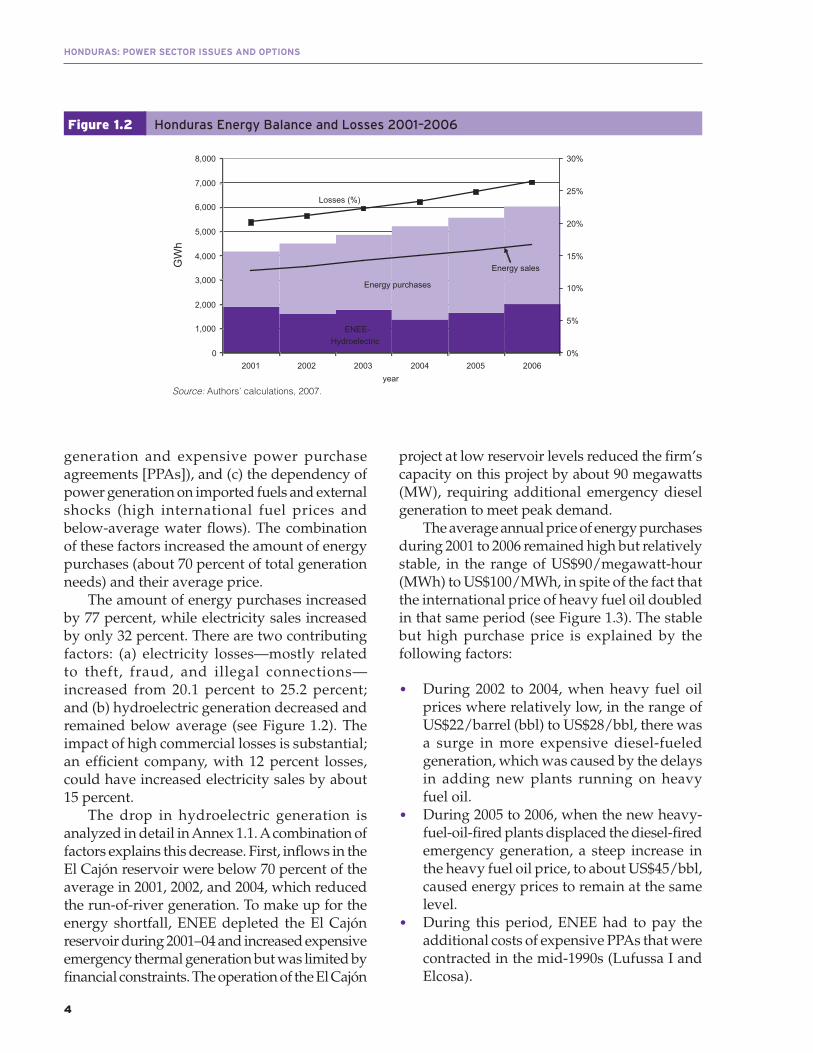
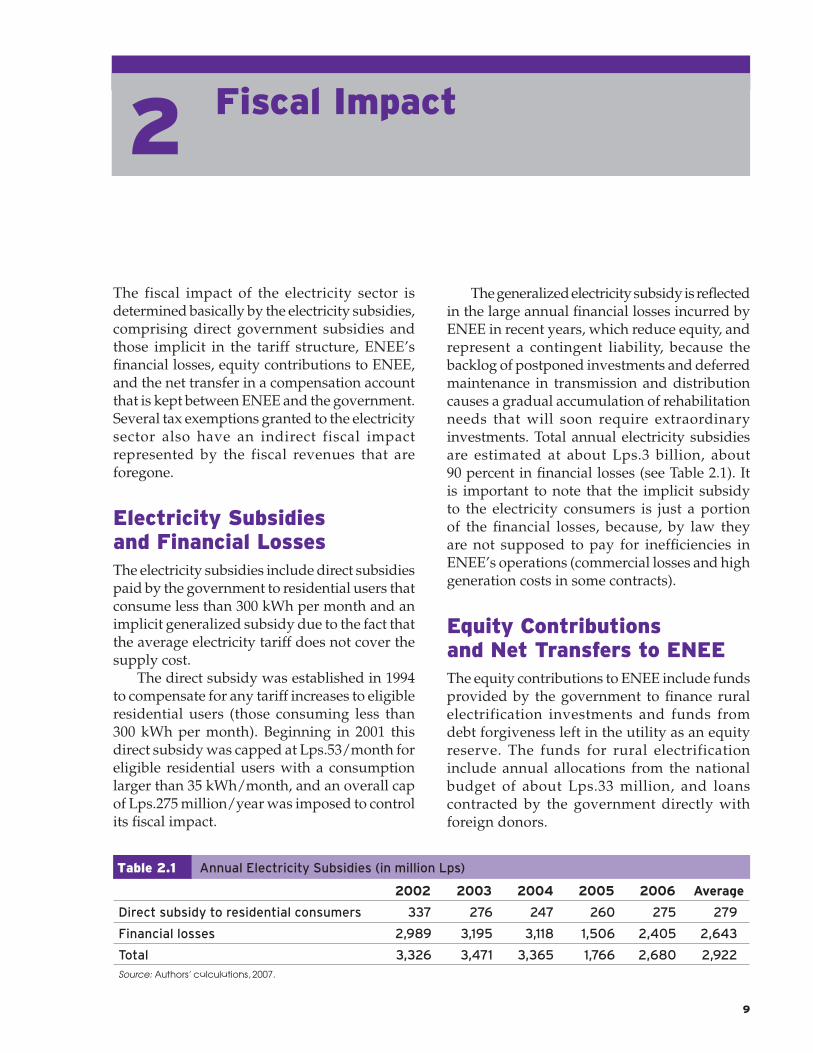
Executive Summary
Evaluating the Financial Impact of the OptionsOn the basis of the previous analyses, fi nancial projections for 2007 to 2015 have been developed. The results for the short term (2007 to 2010) were just presented. Table 6, which summarizes the results in the medium term (2011 to 2015), shows the following:
a. The adoption of major policies, including substantial improvement in corporate governance and the operation of the wholesale market, may bring electricity losses down to efficient levels by 2015, reduce the need for new generation capacity, and provide substantial cash-fl ow surpluses in the medium term.
Moderate Policies (Base Case Demand
Scenario)
Major Policies (Low Case Demand
Scenario)
System Loss Reduction 2006 2015
25.2% 19.7%
25.2% 12.0%
Average Retail Tariff 2010 2015
2.28 2.40
2.40 2.40
Medium Term Cumulative Capacity Requirements (2007–2015)
1,258MW 1,137MW
Cumulative cash-fl ow (2011–2015)
US$710MM US$1,180MM
Rural Electrifi cation Investments and target
80% coverage by 2015; investment to be fi nanced by grants, government contributions, and funds released by the reduction of direct subsidies
Institutional Options Improving management and corporate governance including through management contract
Moving toward a more market-oriented industry structure with private investments and management
Source: Authors’ calculations, 2007.
Table 6 Summary Results Scenarios
b. Increasing the average tariff to the level of effi cient reference costs of Lps.2.4/kWh produces large cash-flow surpluses by 2015, when the electricity losses have been reduced and the average generation cost has decreased by about US$15/MWh with respect to the cost for 2009 (as a result of the commissioning of lower cost generation). This indicates that the current reference costs may be high once lower-cost generation plants are commissioned, provided that international crude oil prices stay at current levels of about US$60/bbl. Electricity prices could be reduced by 2013 based on the economic generation cost prevailing at that time.
5176-FM.pdf xxxi 5/19/10 1:12 PM
5176-FM.pdf xxxii 5/19/10 1:12 PM
In the last few years, the fi nancial and operational performance of the state-owned vertically integrated utility, the Empresa Nacional de Energía Eléctrica (ENEE), has seriously deteriorated, and with a defi cit above 2 percent of gross domestic product (GDP) is threatening the stability of the macroeconomic framework and the prospects for poverty reduction. Action is also needed to ensure the availability of additional generation capacity for 2008. The oil price hike of the last two years has translated into a large increase in the cost of electricity supply because Honduras’s power generation is largely based on petroleum
1
The Electricity Sector Diagnostic
Part A
imports. Furthermore, last year ’s policy to freeze electricity tariffs and retail petroleum prices on the eve of the national election is being continued by the new administration, and has widened the gap between the utility’s costs and revenues. The root causes are (a) the institutional imbalances in the sector; (b) political interference in the operation of the ENEE; (c) poorly targeted subsidies; (d) high generation costs; and (e) uncertain policies regarding the development of new generation projects, including renewable energy. These issues are described in this chapter.
5176-CH01.pdf 1 5/19/10 1:13 PM
5176-CH01.pdf 2 5/19/10 1:13 PM
3
This chapter presents the financial results of ENEE for 2001 to 2005, with the income statement, cash fl ow, and balance sheet; analyzes the internal and external factors that had a major impact on the results; and identifi es the main drivers for fi nancial performance in the future.
Income StatementFor the last six years, ENEE has been incurring substantial fi nancial losses. From 2001 to 2006, net losses increased from Lps.18.9 million to Lps.2.4 billion, after reaching Lps.3.2 billion in 2003. Operating revenues do not cover operating expenses. The fi nancial losses after excluding the exchange differential, which is a purely
Financial Situation of ENEE1
accounting “loss” or “gain” due to exchange rate variations, are about Lps.2 billion per year after 2001. Expenses in fuel and energy purchases and depreciation account for about 85 percent of the costs. The fi nancial losses increased substantially after 2001, mainly due to the sharp rise in energy purchase costs and in fuel prices, a large adjustment in depreciation charges, and very limited tariff adjustments (see Figure 1.1).
High Costs of Energy PurchasesThe costs of energy purchases were high during 2001 to 2006 due to: (a) ENEE’s poor performance (high commercial losses), (b) ineffi ciencies in the procurement of energy (additional emergency
Figure 1.1 ENEE’s Income Statement
0
2,000
4,000
6,000
8,000
10,000
12,000
14,000
2001 2002 2003 2004year
2005 2006
Fuel & energy purchases
Exchange diferentialOther expenses and
interestDepreciation
Operating revenue
Mill
ion
Lp
s
Source: ENEE, 2007.
5176-CH01.pdf 3 5/19/10 1:13 PM
HONDURAS: POWER SECTOR ISSUES AND OPTIONS
4
generation and expensive power purchase agreements [PPAs]), and (c) the dependency of power generation on imported fuels and external shocks (high international fuel prices and below-average water fl ows). The combination of these factors increased the amount of energy purchases (about 70 percent of total generation needs) and their average price.
The amount of energy purchases increased by 77 percent, while electricity sales increased by only 32 percent. There are two contributing factors: (a) electricity losses—mostly related to theft, fraud, and illegal connections—increased from 20.1 percent to 25.2 percent; and (b) hydroelectric generation decreased and remained below average (see Figure 1.2). The impact of high commercial losses is substantial; an effi cient company, with 12 percent losses, could have increased electricity sales by about 15 percent.
The drop in hydroelectric generation is analyzed in detail in Annex 1.1. A combination of factors explains this decrease. First, infl ows in the El Cajón reservoir were below 70 percent of the average in 2001, 2002, and 2004, which reduced the run-of-river generation. To make up for the energy shortfall, ENEE depleted the El Cajón reservoir during 2001–04 and increased expensive emergency thermal generation but was limited by fi nancial constraints. The operation of the El Cajón
project at low reservoir levels reduced the fi rm’s capacity on this project by about 90 megawatts (MW), requiring additional emergency diesel generation to meet peak demand.
The average annual price of energy purchases during 2001 to 2006 remained high but relatively stable, in the range of US$90/megawatt-hour (MWh) to US$100/MWh, in spite of the fact that the international price of heavy fuel oil doubled in that same period (see Figure 1.3). The stable but high purchase price is explained by the following factors:
• During 2002 to 2004, when heavy fuel oil prices where relatively low, in the range of US$22/barrel (bbl) to US$28/bbl, there was a surge in more expensive diesel-fueled generation, which was caused by the delays in adding new plants running on heavy fuel oil.
• During 2005 to 2006, when the new heavy-fuel-oil-fi red plants displaced the diesel-fi red emergency generation, a steep increase in the heavy fuel oil price, to about US$45/bbl, caused energy prices to remain at the same level.
• During this period, ENEE had to pay the additional costs of expensive PPAs that were contracted in the mid-1990s (Lufussa I and Elcosa).
Figure 1.2 Honduras Energy Balance and Losses 2001–2006
ENEE-Hydroelectric
Energy purchases
Energy sales
Losses (%)
0
1,000
2,000
3,000
4,000
5,000
6,000
7,000
8,000
2001
GW
h
2002 2003year
2004 2005 20060%
5%
10%
15%
20%
25%
30%
Source: Authors’ calculations, 2007.
5176-CH01.pdf 4 5/19/10 1:13 PM
5
Financial Situation of ENEE
Depreciation ChargesENEE has been revaluing its assets yearly since 1978, based on conditions included in an International Development Association (IDA) credit. More recently, ENEE’s external auditors discovered that certain arithmetic errors had been systematically made in applying the method, and they recommended that ENEE go back, correct the mistakes, and adjust the amount of the accumulated revaluation. This adjustment was made in 2002 and, as a result, the net value of fi xed assets, including the revaluation, was increased from Lps.14 billion to Lps.33 billion, and the depreciation expenses increased from Lps.0.7 billion to Lps.1.6 billion. A preliminary analysis shows that assets are overvalued, suggesting the need for a revaluation based on
an engineering, economic, and legal assessment, in addition to accounting considerations.
Low Electricity TariffsInadequate electricity tariffs that did not cover supply costs have contributed to the heavy financial losses. Electricity tariffs were low from the fi nancial and economic point of view. From the fi nancial point of view, a comparison of average electricity prices with unit costs (see Figure 1.4) shows the following:
• The average electricity price increased during 2001 to 2006 from US$85/MWh to US$105/MWh.
• The unit cost of supply (total operating expenses and financial costs, excluding
Figure 1.3 Energy Purchase Price vs. Fuel Price; Amount of Energy Purchases, by Fuel
Energy purchase price vs. fuel price
HFO price (US$/bbl)
Energy purchase price (US$/MWh)
0
20
40
60
80
100
120
2001 2002 2003year
2004 2005 20060
10
20
30
40
50
60
US
$/M
Wh
year
US
$/bb
l
Amount of energy purchases by fuel
0%
20%
40%
60%
80%
100%
2001 2002 2003 2004 2005 2006
Diesel fueled HFO fueled Other
Source: Authors’ calculations, 2007.
Figure 1.4 Energy Supply Costs and Prices
0
20
40
60
80
100
120
140
2001 2002 2003year
2004 2005 2006
Average tariff 12% losses Unit cost
US$
/MW
h
Source: Authors’ calculations, 2007.
5176-CH01.pdf 5 5/19/10 1:13 PM
HONDURAS: POWER SECTOR ISSUES AND OPTIONS
6
exchange rate differential divided by total energy sales) increased from US$87/MWh to US$135/MWh. However, the large increase in unit costs took place in 2002, when there was a substantial adjustment in depreciation expenses plus a surge in diesel-fi red generation.
• Average electricity prices for 2006 did not even cover the unit costs corrected to take into account only efficient system losses (12 percent ).1
From an economic point of view, an analysis of the effi cient supply costs (see Chapter 5 on electricity prices) shows that ENEE’s average supply cost is about US$127/MWh. A 23 percent tariff increase would be necessary to cover these costs. This tariff increase in 2006 is equivalent to additional revenues of US$93 million or Lps.1,780 million, sufficient to cover about 75 percent of the fi nancial defi cit.
1 Current regulations allow distribution costs based on 15 percent system losses. However, other countries in the region with good performance have system losses below 12 percent (Costa Rica and El Salvador).
ENEE’s Cash-fl ow PerformanceThe analysis of ENEE’s cash fl ow for 2003 to 2005 shows that the internal cash generation was negative during that period, and ENEE had to manage a very diffi cult cash situation (see Figure 1.5) by:
a. Delaying needed investment in transmission and urban distribution. The annual investment was very small, about US$15 million, if the investment in rural electrification is excluded, most of which is financed by government contributions.
b. Financing about 50 percent of the investment plus debt service with expensive revolving loans from local Banks (about Lps.2.3 billion during the period).
c. Government contributions represented about Lps.1.2 billion, 70 percent of which corresponded to rural electrifi cation, with marginal contributions from debt forgiveness (see Chapter 2).
Accounts receivable for 2002 to 2004 show a stark contrast between ENEE’s performance
Figure 1.5 Sources and Application (in Million Lps)
-500
0
500
1,000
Mill
ion
Lps
1,500
2,000
2003 2004year
2005
Debt service Investment Internal sources+ decrease in working capital + government contribution Total sources
Source: Authors’ calculations, 2007.
5176-CH01.pdf 6 5/19/10 1:13 PM
7
Financial Situation of ENEE
in collecting bills from private customers and public customers. Average arrears, expressed in months of sales, for public sector customers were 9 months to 13 months, while for private customers they were about 1 month (see Table 1.1). Although sales to public-sector clients represent only about 6.8 percent of total sales, the amount of accounts receivable from public sector clients at the end of 2005 represented 48 percent of accounts receivable from all clients.
Table 1.2 shows the percentage of amounts billed in February 2006 that were collected up to 12 months after billing.
Considering that sales to public sector clients are about 6.8 percent of total sales and that they are paid after 12 months, it would mean that about 2.4 percent of sales are never collected.
Table 1.2 also highlights the cash-fl ow diffi culties due to delay in bill collection as less than 80 percent of the electricity bills are paid within 1 month.
Financial IndicatorsTable 1.3 shows key financial indicators that summarize ENEE’s fi nancial performance. The current ratio fell below 1 after 2002, refl ecting ENEE’s difficulties in paying its short-term obligations. As for debt-service coverage, it was satisfactory in 2001, but became negative for the rest of the period. ENEE’s contribution to investment was also negative during the same period.
Table 1.2 Percentage of Amount Billed in February 2006 Collected up to 12 Months after Billing
Source: ENEE, 2007.
Indicator 2001 2002 2003 2004 2005
Current ratio 1.9 1 0.6 0.4 0.4
Debt/Equity ratio 39/61 26/74 28/72 30/70 30/70
Debt service coverage-times 4.9 –0.2 –0.1 –0.1 0.1
Contribution to investment, % –142.2 –140.4 –114.2 –279.1
Table 1.3 Key Financial Indicators that Summarize ENEE’s Financial Performance
Source: ENEE, 2007.
5176-CH01.pdf 7 5/19/10 1:13 PM
5176-CH01.pdf 8 5/19/10 1:13 PM
9
The fiscal impact of the electricity sector is determined basically by the electricity subsidies, comprising direct government subsidies and those implicit in the tariff structure, ENEE’s fi nancial losses, equity contributions to ENEE, and the net transfer in a compensation account that is kept between ENEE and the government. Several tax exemptions granted to the electricity sector also have an indirect fiscal impact represented by the fiscal revenues that are foregone.
Electricity Subsidies and Financial LossesThe electricity subsidies include direct subsidies paid by the government to residential users that consume less than 300 kWh per month and an implicit generalized subsidy due to the fact that the average electricity tariff does not cover the supply cost.
The direct subsidy was established in 1994 to compensate for any tariff increases to eligible residential users (those consuming less than 300 kWh per month). Beginning in 2001 this direct subsidy was capped at Lps.53/month for eligible residential users with a consumption larger than 35 kWh/month, and an overall cap of Lps.275 million/year was imposed to control its fi scal impact.
Fiscal Impact2
The generalized electricity subsidy is refl ected in the large annual fi nancial losses incurred by ENEE in recent years, which reduce equity, and represent a contingent liability, because the backlog of postponed investments and deferred maintenance in transmission and distribution causes a gradual accumulation of rehabilitation needs that will soon require extraordinary investments. Total annual electricity subsidies are estimated at about Lps.3 billion, about 90 percent in fi nancial losses (see Table 2.1). It is important to note that the implicit subsidy to the electricity consumers is just a portion of the fi nancial losses, because, by law they are not supposed to pay for ineffi ciencies in ENEE’s operations (commercial losses and high generation costs in some contracts).
Equity Contributions and Net Transfers to ENEEThe equity contributions to ENEE include funds provided by the government to fi nance rural electrification investments and funds from debt forgiveness left in the utility as an equity reserve. The funds for rural electrification include annual allocations from the national budget of about Lps.33 million, and loans contracted by the government directly with foreign donors.
2002 2003 2004 2005 2006 Average
Direct subsidy to residential consumers 337 276 247 260 275 279
Total 3,326 3,471 3,365 1,766 2,680 2,922Source: Authors’ calculations, 2007.
Table 2.1 Annual Electricity Subsidies (in million Lps)
5176-CH02.pdf 9 5/19/10 1:13 PM
HONDURAS: POWER SECTOR ISSUES AND OPTIONS
10
The compensation account is credited with payments made by the government on ENEE’s behalf, mainly foreign-debt service and, until 2003, import tax exemptions for diesel oil used for power generation, and is debited with the direct subsidies for electricity users, which are borne up front by ENEE, and payments to reduce the accumulated arrears for electricity sales to public sector institutions (see details in Annex 2). The fuel tax exemptions were established in 1997 and included in the compensation account because ENEE was supposed to use the “savings” for rural electrifi cation and electricity subsidies. However, for 2002 to 2006, this cannot be counted as a valid government contribution because ENEE’s tariffs were no longer recovering costs. Accordingly, for the analysis shown in Annex 2; the fuel taxes were excluded from the compensation account and included as part of the tax exemptions. Total average annual equity contributions and net transfers amounted to Lps.439 million (Table 2.2).
Tax ExemptionsThe electricity sector enjoys several tax exemptions: import tax exemptions for fuels used by ENEE and other power companies for electricity generation, import and sales taxes on equipment and materials for rural electrifi cation projects, import taxes on equipment and materials for power plants using renewable energy sources, and sales tax on electricity sales. The total average annual tax exemptions are estimated at about Lps.2 billion, mostly fuel taxes and sales taxes on electricity consumption (Table 2.3).
Summarizing, direct annual contributions from the government to the sector are estimated at about Lps.3.4 billion, or about 2 percent of GDP, mostly represented by fi nancial losses, and annual indirect contributions in tax exemptions are estimated at about Lps.1.9 billion, or 1.1 percent of GDP.
2002 2003 2004 2005 2006 Average
Equity contributions
For electrifi cation projects 107 172 495 206 980 392
Increase of debt-forgiveness reserve 128 –70 299 93 10 180
Net contribution from compensation account
–203 –76 –52 –1 –332 –133
Total government contribution 33 25 743 298 658 439Source: ENEE, 2007.
Table 2.2 Equity Contributions and Transfers to ENEE (in million Lps)
2001 2002 2003 2004 2005 Average
Equipment taxes 16 18 20 41 29 25
Sales tax on electricity 527 607 728 844 939 729
Fuel taxes 363 553 1,328 1,820 1,757 1,164
Total 906 1,178 2,076 2,705 2,725 1,918Source: ENEE, 2007.
Table 2.3 Tax Exemptions (in million Lps)
5176-CH02.pdf 10 5/19/10 1:13 PM
11
All segments of Honduras’s power system show signs of delayed or insuffi cient investment to expand infrastructure at the pace required by demand growth. This problem is made more acute by the low tariffs for residential consumers, which inflate demand, thereby hastening the need for new investments, while diminishing the Empresa Nacional de Energía Eléctrica’s (ENEE’s) ability to fi nance them.
Installed generation capacity is relatively high compared to peak demand, but much of it is not fi rm, because of different limitations and operational constraints. Today, ENEE is late in preparing the next procurement process for new generation capacity, so there is again the prospect of a recurring period of higher costs and possible supply disruptions.
Transmission congestion is forcing ENEE to use expensive local generation around Naco and La Ceiba. The lack of investment in transmission
Reliability of Power Supply3
expansion is also constraining distribution network expansion. Transformer capacity at the interface between transmission and distribution is inadequate. Localized power interruptions will become more frequent if investments in the network are not undertaken.
RetrospectiveGenerationIn Figure 3.1, the fi rm-capacity bar refl ects a tight situation because fi rm capacity is substantially lower than installed capacity due to seasonality, the natural uncertainty affecting hydroelectric generation, the old age of some of the plants, and mothballing of thermal capacity.
Thermal plants, including the bagasse- and other biomass-fired power stations, account for 67.5 percent of total installed capacity.
Figure 3.1 Generation Capacity (MW) in December 2006
0
500
1000
1500
2000
Installed FirmHFO Hydro Diesel Biomass
2006 Peak1088
Source: ENEE, 2007.
5176-CH03.pdf 11 5/19/10 1:12 PM
HONDURAS: POWER SECTOR ISSUES AND OPTIONS
12
Thermal plants using only petroleum fuels account for 62 percent of the total. There are 110 MW installed under the incentives regime for renewable energies, or 7.2 percent of the total.
Table 3.1 shows peak demand and available power generation capacity at the end of the month in which peak demand occurred, for 2001 to 2006.
Margins between available capacity and peak demand were tight, except for 2004 and 2005. El Cajón’s capacity was limited in most of the years by the low reservoir level, and in 2004 and 2006, also because of maintenance. Table 3.1 shows the power that was being imported at the moment of the annual peak demand.
Table 3.2 shows the trends in energy generation sales and losses.
Table 3.2 shows the surge in leased-plant generation caused by delays in contracting for new baseload capacity. It also shows the dramatic increase in sugar-mill and small-hydro generation in response to the incentives regime for the development of renewable energy sources. Sales to ENEE by industrial co-generators also took off, because of the guaranteed purchase at the short-term marginal cost on the basis of article 12 (b) of the Electricity Law.
Although generation based on renewable sources offers limited fi rm capacity, and can be expected to contribute only a small percentage to the total system requirements, it is a desirable
complement to the more traditional generation sources because of diversification, domestic development, and lower environmental impact. ENEE could do more to encourage this kind of plant by determining a realistic short-term marginal cost, and also by ensuring suffi cient transmission capacity, which is often a constraint to taking up their production.
ENEE’s hydroelectric generation decreased from 2001 to 2004, and began recovering after that, but remained below average during the whole period. As already mentioned, this was mostly caused by below-average rainfall. Because of the low reservoir levels, the capacity of El Cajón was below its nominal value most of the time. This implies a cost to replace the capacity shortfall, and also in energy produced, since a low reservoir level means less energy is generated for each cubic meter of water used.
Concerning energy losses, Table 3.2 shows how they grew from 20 to 25 percent of total energy made available to the grid. However, the rate of growth of this percentage seems to have slowed during the last year, when ENEE began implementing a loss-reduction program.
TransmissionENEE’s transmission network comprises 620 kilometers (km) of 230-kilovolt (kV) lines, 860 km of 138-kV lines, and 400 km of 69-kV
Capacity Available End of Month of Maximum Demand
2001 2002 2003 2004 2005 2006
ENEE thermal 93.1 77.1 91 40.9 34.4 45.5
ENEE hydro 393 388 342.7 253.4 348.5 366
Other state-owned hydro 1.6 1.6 30 30 30 30
Total state-owned capacity 487.7 466.7 463.7 324.3 412.9 441.5
Large private generators 311 401 375.1 739 736 654
Small-hydro, bagasse, other 8.5 8.5 10.2 32.7 33.2 62.5
Total private capacity 319.5 409.5 385.3 771.7 769.2 716.5
GRAND TOTAL 807.2 876.2 849 1,096.00 1,182.10 1,158.00
Table 3.1 Power Generation and Peak Demand (in MW)
5176-CH03.pdf 12 5/19/10 1:12 PM
13
Reliability of Power Supply
lines. Transformer capacity linking these voltage levels is 750 mega volt-ampere (MVA). High- to medium-voltage (HV-MV) transformer capacity, linking the transmission network and the distribution networks, is 1,550 MVA.
The lack of fi nancing has hindered ENEE from expanding transmission according to its plans. This has slowed grid development, causing it to lag behind demand and generation growth. The largest investment in transmission after 1985 was the approximately US$38 million laid out in 2004 and 2005 by Lufussa and Enersa to build 230-kV
and 138-kV lines and substations in connection with their latest generating plants.
When ENEE launched in 2001 the bidding process that led to those new plants being built, the transmission grid was not capable of absorbing and ensuring the outfl ow of the 210 MW originally being procured. For that reason, the bidding documents required the bidders to include in their projects the transmission reinforcements needed. All the transmission built with those generation projects was later transferred to ENEE.
2001 2002 2003 2004 2005 2006
ENEE
Hydroelectric 1,903 1,610 1,738 1,371 1,647 1,938
Thermal* 352 432 540 484 76 64
Total ENEE 2,255 2,042 2,278 1,855 1,722 2,003
Other sources
ELCOSA** 332 343 458 422 130 168
EMCE-ENERSA 397 403 361 915 1,347 1,525
LUFUSSA 735 777 691 935 2,052 1,968
Leased plants 159 508 708 570 56 31
Sugar mills 0 4 20 43 76 100
Private small hydro 1 1 3 30 71 132
Industrial self-generators 0 0 0 61 42 13
Total other sources 1,624 2,034 2,241 2,975 3,774 3,938
National production 3,879 4,076 4,519 4,831 5,496 5,940
Imports 311 427 351 456 132 96
Exports 3 5 8 49 84 113
Net Imports 308 422 343 407 48 –17
Total available 4,187 4,498 4,862 5,237 5,543 5,924
Total sales 3,341 3,541 3,765 3,996 4,172 4,431
Losses, GWh 847 957 1,097 1,241 1,371 1,493
Losses, percent 20 21 23 24 25 25
Increase in percent loss 1 1 1 1 1Source: Authors’ calculations, 2007.
*Includes generation in ENEE’s plants of La Ceiba, Puerto Cortés I, and Puerto Cortés II, operated by Empresa de Mantenimiento, Construcción y Electricidad (EMCE).
**Excluding energy produced by Elcosa for direct sale to industrial clients plus the associated transmission-loss.
Table 3.2 Energy Generation, Sales, and Losses (GWh)
5176-CH03.pdf 13 5/19/10 1:12 PM
HONDURAS: POWER SECTOR ISSUES AND OPTIONS
14
Transmission congestion, particularly around Naco, forces ENEE to use expensive diesel generation from leased plants. The most recent industrial complex in this area, the Green Valley Industrial Park, had to install its own generation, 14 MW, in view of ENEE’s lack of capacity to supply their demand. Another case is La Ceiba and the Aguan Valley, where load has grown considerably over the 30 years since they were incorporated into the transmission grid in 1974 and 1978, respectively. The transmission lines in those areas have not been upgraded since then, and ENEE is experiencing problems with voltage regulation. ENEE’s voltage records at La Ceiba show transmission voltage falling at peak times to 121 kV, or 88 percent of the nominal 138 kV.
ENEE has had in its plans for many years a 230-kV line from Tegucigalpa to the Aguán Valley through the Department of Olancho, which it cannot build for lack of financing. Olancho is a large area currently served from Tegucigalpa through 69 kV lines that have reached the limit of their capacity.
During summer months, there is congestion also between El Cajón and San Pedro Sula and surroundings. One solution would be to convert the connections between El Progreso and San Pedro Sula to 230 kV. The interconnection of Río Lindo and El Cajón is also necessary, and in fact is included in the Sistema de Interconexión Eléctrica para América Central (SIEPAC) project.
ENEE recently contracted for the supply of four 25-MVA mobile high- to medium-voltage transformers at a cost of $37 million to shore up capacity at substations in the north. In practically all the cases, the loss of one of the transformers serving a load center causes service interruptions, either because there is no backup transformer or because the remaining transformers do not have enough capacity to take up the additional load fl ow.
Concerning the Dispatch Center, its 1970s technology is now obsolete. Links with the system’s power plants and substations are also insuffi cient, because ENEE has not been able to increase them at the same pace as the power system has grown. A new Dispatch Center is included in a recent Inter-American Development Bank (IDB) loan to ENEE.
Insufficient investment in transmission development increases total generation costs in three ways:
1. ENEE is forced to use expensive generation locally in affected areas. This is currently the case around Naco.
2. Similarly, heavy load on certain lines causes voltage to fall below normal in areas relatively far from the main generation centers. In those cases, local generation is required to maintain voltage within the normal range. This is the case around La Ceiba.
3. Also, lightly loaded transmission lines, in periods of low system demand, require absorption of reactive power to maintain voltage within the normal range. The most effi cient way of doing this is by means of “reactive power compensators.” ENEE uses El Cajón to do this, thus using water ineffi ciently.
Lack of sufficient backup transmission capacity forces ENEE to keep lightly loaded hydroelectric units running during the early morning hours, which is another deviation with respect to optimal dispatch, to be able to pick up load quickly in case a transmission line is lost. Again, water is used ineffi ciently.
DistributionENEE’s distribution networks can be classifi ed into three groups. The fi rst group is formed by those networks serving the larger load centers, with more than 10,000 clients each, specifi cally: San Pedro Sula, Puerto Cortés, El Progreso, Tela, La Ceiba, Tegucigalpa, and Choluteca. The second group is formed by networks serving small communities with less than 3,000 clients, built during the last 20 years by the rural electrifi cation programs. These networks have acceptable technical conditions, although their secondary circuits are sometimes very long and prone to large voltage drops and high losses. Nevertheless, demand levels are also very low, which limits the impact of these conditions.
The third group is formed by systems of between 3,000 and 10,000 clients. These are very
5176-CH03.pdf 14 5/19/10 1:12 PM
15
Reliability of Power Supply
old networks, in bad condition, with high energy losses and offering poor-quality service. ENEE needs to rebuild these networks but does not have the fi nancial means to do so. The second and third groups often serve remote areas and are fed by very long single lines, diffi cult to maintain and exposed to faults that take a long time to repair.
In the larger urban centers, ENEE takes advantage of the directive in article 43 of the Electricity Law stating that, in urban areas, excepting “marginal zones,” it behooves the parties interested in obtaining electric service to build all the installations required. Article 43 is ambiguous concerning transfer of the installations to ENEE and compensation of investors. In practically all cases, developers—or municipalities, in the case of public works—invest in building the network extensions required and then transfer the works to ENEE for free.
ENEE’s own investment in urban areas is very limited. For example, the Center-South Distribution Region’s investment budget for 2007 is only L32 million, or $1.7 million. Also, as population centers have grown, the lack of financing for transmission expansion has meant that no new source substations could be created as would have been necessary, so that the standards introduced by the Seven Cities Project limiting load per circuit and circuit length have had to be abandoned. This increases energy losses and reduces quality of service.
Because of the tight margins in HV-MV transformer capacity, ENEE recently contracted for the supply of four mobile substations of 25 MVA each that will allow it to shore up the most stressed substations in and around San Pedro Sula.
An essential component of distribution investment would have to be in the electrifi cation of all “marginal colonies.” Neglecting this component means growing commercial losses for the utility. The proliferation and growth of these illegal settlements are an important factor in ENEE’s energy losses, because these groups build their own rudimentary networks and take electricity from ENEE’s grid without paying for it.
Reliability of SupplyAnnex 3 analyzes transmission grid reliability by detailing the consequences of losing major lines and transformers. In most cases, the loss causes widespread service interruptions. In areas where there is no redundancy, the network is split in two parts, with one of them having a defi cit of generation capacity. In areas where there is network redundancy, the parallel routes do not have the capacity to take up the load fl owing through the line before that was lost.
ENEE monitors reliability of supply to the distribution networks by means of an indicator designated as “Equivalent Outage Duration,” calculated from data on nonserved energy.2 Table 3.3 shows the evolution of this parameter for different geographic areas and for the system as a whole.
Table 3.3 shows the situation improving markedly from 2001 to 2004. ENEE explains this evolution, which appears at fi rst inconsistent
2 For any circuit or region, the equivalent outage duration is equal to nonserved energy divided by average power demand. A one-hour outage at peak has an equivalent duration greater than one hour. A one-hour outage at 3:00 a.m., when demand is very low, counts for less than one hour in equivalent duration.
Area 2001 2002 2003 2004 2005
Atlantic Shore 90.4 72.7 29.2 20.3 35.3
North-western 34.5 22.6 23.4 18.5 31.4
Canaveral 419.3 220.2 72.8 79.1 57.4
Center-East 29.1 20.7 31.2 26.5 39.5
South 71.5 48.8 39.2 41.5 50.8
National 47 32.7 28.6 24.1 36.3Source: Authors’ calculations, 2007.
Table 3.3 Equivalent Outage Duration in Hours
5176-CH03.pdf 15 5/19/10 1:12 PM
HONDURAS: POWER SECTOR ISSUES AND OPTIONS
16
with the tightening of capacity margins in 2002 and especially in 2003, as the result of a continued effort, initiated under a total quality program implemented by management during 1998 to 2001, to systematically investigate and correct outages causes in generation, transmission, and distribution systems.
A comparison of indicators of quality of power supply in Honduras with the other Central America countries (see Figure 3.2) shows that duration of interruptions per connection are very high, although their frequency is lower than in neighboring countries.
Although the effects of the tight generation capacity margins are not readily detectable in terms of nonserved energy and equivalent outage time, ENEE had in fact to resort to peak-shaving from April to September 2003 to meet peak demand. Table 3.4 shows for that period the constrained peak supplied by generation, the power cut at peak time, and what the unconstrained peak would have been. The maximum cut occurred in May and was about 56 MW, or 6.5 percent of unconstrained peak demand.
Nonserved energy due only to these cuts is estimated by ENEE at 2.93 GWh, which translates into a contribution of 6.5 hours to the total equivalent outage time of 28.6 hours shown in Table 3.3 for 2003.
Energy LossesA recent study by a Colombian consulting company, in preparation for ENEE’s loss-reduction program, a component of the IDB project, determined that ENEE’s total technical losses amount to 10 percent of energy injected into the grid, of which 3 percent corresponds to transmission and 7 percent to distribution. Since total loss is estimated at 25 percent of energy injected into the grid, this means that commercial loss corresponds to the remaining 15 percent of the net total energy injected. Table 3.5 displays the study’s breakdown of commercial losses by user category and by cause.
The subdivision for the line “marginal settlements,” in residential, commercial, industrial, and other, is an estimate based on the consultants’ observations. Industrial in this
Figure 3.2 Electricity: Average Duration and Frequency of Interruptions per Connection
Electricity - Avg. Duration of Interruptions per Connection (hrs/yr)
050
100
150
1995 2000year
2005
Electricity - Avg. Frequency of Interruptions per Connection (#/yr)
Source: LAC Electricity Benchmarking Database, The World Bank, 2007. Source: LAC Electricity Benchmarking Database, The World Bank, 2007.
5176-CH03.pdf 16 5/19/10 1:12 PM
17
Reliability of Power Supply
case means workshops of different kinds. For the other lines, the subdivision corresponds to the user category in ENEE’s commercial roster.
ENEE has already started a loss-reduction program. As part of it, the utility recently launched the highly publicized Operación Tijera. This effort, ordered by the president and involving a substantial injection of resources from all ministries and government agencies—particularly in the form of cars for the large number of crews organized for the purpose—aimed to cut service (a) to delinquent clients, and (b) to any users detected during the operation with irregular service connections or with meters that had been tampered with. The operation produced an immediate surge in collections when its high profi le induced people in arrears or in irregular situations to pay their bills and request regularization to avoid the announced service cuts.
The operation found a large number of irregularities, a clear indication of the inadequate intensity of ENEE’s regular loss-reduction effort, for which resources have been signifi cantly cut from 2000 levels, and the defi cient supervision of Servicio de Medición Eléctrica de Honduras (SEMEH), also attributable to inadequate resources. As the operation winds down and cars from other agencies are withdrawn, ENEE is reverting to former loss-reduction levels. ENEE has to complete as soon as possible the preparations for its proposed loss-reduction program and launch it in force. The operation did show the importance of direct involvement by the top levels of management in the loss-reduction effort, as was already shown in the
past when ENEE managed to bring total losses down to 18 percent in 2000 from a high of 28 percent in 1995.
Generation ExpansionThis chapter presents an analysis of the generation expansion requirements of Honduras during 2007 to 2015. The analysis is based on three electricity demand scenarios that consider the same GDP growth but different assumptions on key demand drivers that are under the control of ENEE or the government, such as electricity losses, electricity tariffs, and load factor:
1. A high case corresponds to a “business-as-usual” scenario, where electricity prices are frozen in nominal terms, electricity losses continue to increase, reaching the level of 28 percent in 2015, and the load factor decreases from 65.3 percent to 60 percent as a result of the increasing proportion of residential load and lack of load management policies.
2. In the base case scenario, moderate corrective measures are taken. Electricity prices keep up with infl ation, but no increases in real terms are made, electricity losses are reduced at a moderate rate beginning in 2008 to reach 19.7 percent in 2015, and the load factor remains unchanged.
3. In the low case scenario, substantial corrective measures are taken. Electricity prices are increased 5 percent per year in real terms during 2007 to 2009 to reach a cost level equivalent to economic cost, and electricity losses are decreased by about 2.3 percentage
Cause Residential Commercial Industrial Other Total
Fraud 15.0 8.4 12.0 3.2 38.6
Billing errors 11.4 6.4 9.2 2.4 29.4
Marginal settlements 11.1 6.2 8.9 2.4 28.6
Meter calibration 0.6 0.3 0.5 0.2 1.6
Other causes 0.7 0.4 0.6 0.2 1.8
Totals 38.8 21.8 31.2 8.3 100.0
Source: Consultoría Colombiana, Loss Study.
Table 3.5 Breakdown of Commercial Losses, in Percent
5176-CH03.pdf 17 5/19/10 1:12 PM
HONDURAS: POWER SECTOR ISSUES AND OPTIONS
18
all the demand scenarios, there is a defi cit in 2007 (in the range of 30 MW to 69 MW), which would increase to 172 MW to 377 MW by 2010 (see Table 3.7). This defi cit already takes into account the small renewable projects under construction expected to be commissioned in this period (about 120 MW), some additions in thermal capacity available in the short term4 (90 MW), and about 36 MW of old diesel engines that will be taken out of service.
The defi cit in fi rm power for 2007 to 2010 can be addressed only by leasing of skid-mounted diesel generation that can be deployed in the short term, imports from the regional energy market, or peak load shaving measures. Preliminary information indicates that fi rm power would not be available from the regional market for this period because most of the countries in the region have a tight supply/demand balance. Peak load shaving measures (time-of-the-day tariffs, use of effi cient lighting fi xtures, and so forth), and voluntary power rationing and load shedding could be implemented and make a contribution to reducing peak load, but do not replace the need to lease generation capacity in the short term.
The process of contracting and developing new generation with lower costs (medium-speed diesel, hydro plants, coal-fi red plants) will take more that four years and therefore would not contribute to reducing the capacity defi cit in 2007 to 2010. The renewable power that could be developed before 2011 taking advantage of existing incentives (short-term marginal energy cost plus 10 percent and fi scal incentives) is an attractive option to reduce the capacity defi cit, provided that it contributes fi rm power.
Generation Expansion PlansSince the late 1990s, the generation expansion in Honduras has been based mainly on medium-speed diesel plants, characterized by relatively low capital costs, short construction periods, and
points per year to reach 12 percent by 2013. The annual load factor gradually increases from 65.3 percent to 68 percent by 2015 due to the implementation of load management programs and energy effi ciency actions.
Demand ProjectionsThe assumptions and methodology used for projecting the demand are explained in Annex 3. The results for the three demand scenarios are summarized in Table 3.6. Of note:
• The annual rate of growth of energy demand at generation level is between 5.6 percent and 7.3 percent, reflecting the different assumptions regarding prices policies and loss reduction.
• Peak demand would increase at a rate from 5.2 percent to 8.2 percent, reflecting the assumptions regarding loss reduction and the implementation of load management and energy effi ciency programs.
Figure 3.3 shows the peak demand projections for the three scenarios. The annual rate of growth of demand for 2007 to 2015 fluctuates from 5.2 percent to 8.2 percent for the low and high case scenarios, with 6.5 percent for the base case. The difference in peak demand by 2015 between the low and the high case scenarios represents about 500 MW.
Generation Capacity Reserve during 2007 to 2010The existing installed generation capacity, complemented by the generation capacity currently under construction, does not provide an adequate firm reserve to meet expected demand for 2007 to 2010. A simple indicator of the reliability problem is the shortfall in fi rm capacity to meet a 10 percent reserve.3 Under
3 A reserve of 10 percent of peak demand is a simple indicator that can be used to obtain a ballpark estimate of the required reserve in Honduras, and it exceeds the size of the largest unit (75 MW). However, ENEE determines the reserve requirements using the Stochastic Dual Dynamic Programming (SDDP) operation program, which takes into account the availability indexes for individual generation units and the impact of hydrology on fi rm power.
4 Put back into service 60 MW of ENEE’s diesel generators formerly under a rehabilitate-operate-maintain (ROM) contract and accept a proposal to increase by about 30 MW the capacity currently contracted with the Lufussa III and ENERSA, provided by improvements in the effi ciency of these plants.
5176-CH03.pdf 18 5/19/10 1:13 PM
19
Reliability of Power Supply
Ele
ctri
city
Dem
an
d P
roje
ctio
ns
20
07–
20
15
Sce
n.
Rate
of
gro
wth
20
06
20
07
20
08
20
09
20
102
011
20
122
013
20
142
015
Ge
ne
rati
on
ne
ed
s (G
Wh)
Hig
h
Bas
e
Lo
w
7.3
%6
.5%
5.6
%
6,2
26
6
,22
6
6,2
26
6,7
41
6,7
31
6,6
27
7,3
19
7,2
29
7,
06
0
7,8
62
7,
706
7,
42
8
8,4
23
8
,20
0
7,7
97
9,0
11
8,7
10
8,17
0
9,6
33
9
,23
7
8,6
20
10,2
87
9
,78
5
9,0
89
10,9
74
10,3
55
9
,63
1
11,6
95
10
,94
5
10,19
9
Pea
k d
em
and
(M
W)
Hig
h
Bas
e
Lo
w
8.2
%6
.5%
5.2
%
1,0
90
1,
09
0
1,0
90
1,19
2
1,18
2
1,15
7
1,3
06
1,
27
1 1,
22
7
1,4
15
1,3
55
1,
28
5
1,5
30
1,
44
2
1,3
43
1,6
51
1,5
31
1,4
01
1,78
1 1,
62
4
1,4
72
1,92
0
1,72
0
1,5
45
2,0
68
1,
82
0
1,6
31
2,2
25
1,9
23
1,7
19So
urc
e: A
uth
ors
’ ca
lcu
latio
ns,
2007
.
Tab
le 3
.6
Pea
k D
em
and
Pro
ject
ion
s: T
hre
e S
cen
ario
s
5176-CH03.pdf 19 5/19/10 1:13 PM
HONDURAS: POWER SECTOR ISSUES AND OPTIONS
20
relatively high effi ciency, a combination of factors that reduced project risks for the investors and provided low-cost generation until 2004, before the sharp increase in international oil prices.
The generation expansion plans assume that international oil prices will remain high for 2007 to 2020, in the range of US$50/barrels
Figure 3.3 Peak Demand
0
500
1,000
1,500
2,000
2,500
2006 2007 2008 2009 2010 2011 2012 2013 2014 2015
Low: 5.2% p.a.
Base: 6.5% p.a.High: 8.2% p.a.M
W
(bbl) to US$60/bbl. Figure 3.4 compares the annual evolution of prices, expressed in US$/million British thermal units (MBTU). Prices of heavy fuel oil and liquefi ed natural gas (LNG) remain in the medium range of US$8/MBTU to US$6/MBTU. Diesel oil prices stay in a very high range (US$13/MBTU to US$11/MBTU)
Table 3.7 Peak Demand Balance 2007–2010 (in April of Each Year)
Source: Authors’ calculations, 2007.
5176-CH03.pdf 20 5/19/10 1:13 PM
21
Reliability of Power Supply
and coal prices in a low range (US$3/MBTU to US$2.5/MBTU).
ENEE’s generation expansion plans consider a large portfolio of candidate generation projects: thermal generation (diesel generator, conventional steam, fl uidized bed combustion plants, gas turbine, and combined cycle gas turbine [CCGT]), medium and large hydro projects with prefeasibility and feasibility studies, and small renewable projects under development. An analysis of the levelized generation costs shows that the Patuca 2 hydroelectric project, coal-fi red steam plants, and gas-fired CCGT are the most attractive projects for baseload operation (generation costs of about US$60/MWh) and could contribute to reducing the generation costs, and that most of the other medium and large hydro projects are competitive for peak load operation, with average costs of about US$90/MWh.
The expansion plan prepared by ENEE in late 20065 was revised to take into account the new demand projections, fuel prices, and earliest
Figure 3.4 Fuel Prices, 2007–2020
Residual USGC
Diesel USGC
GNL CIF
Coal CIF
0
2
4
6
8
10
12
14
2007 2008 2009 2010 2011 2012 a 2020
US
$/M
BTU
5 This is an updated version of the expansion plan used by ENEE to calculate the marginal generation cost adopted in 2007, which assumed that coal-fi red plants could be commissioned by 2011. The least-cost generation expansion plan is determined using the SUPEROLADE planning model and adjusted to meet reliability standards using the SDDP optimization model.
commissioning dates for the new generation projects considered as candidates. Based on the results for the three scenarios, we note that the following:
• The most competitive projects (coal-fi red and hydro) are introduced in the expansion plan at the earliest commissioning date.
• The postponement o f the ear l ies t commissioning dates of coal-fi red plants and new hydroelectric projects to 2013, forced the selection of a medium-speed diesel project by 2011 (the best option among candidates that can be commissioned by that date) to meet the defi cit in supply before 2013.
• A substantial capacity in emergency generation is needed to meet the deficit before 2011 (between 160 MW and 340 MW).
• The generation expansion plans select the same technologies for 2007 to 2015, with differences in the capacity that is required (Table 3.8).
• The investment costs for coal-fi red thermal plants and CCGT using LNG are rough estimates that did not assess the required investments in port and fuel-handling facilities and in transmission works. Technical and economic feasibility studies of these alternatives should be prepared.
Source: Authors’ calculations, 2007.
5176-CH03.pdf 21 5/19/10 1:13 PM
HONDURAS: POWER SECTOR ISSUES AND OPTIONS
22
The following are some important conclusions and observations about the generation expansion plans:
• Progress made in taking effective measures to reduce electricity losses and implement cost-covering tariffs and energy effi ciency measures would have a substantial impact by reducing additional capacity requirements. This would also produce large financial benefi ts for ENEE by avoiding contracting expensive emergency generation during 2007 to 2010. The difference between the electricity demand of the business-as-usual scenario and the low case scenario is such that about 180 MW of expensive generation could be saved.
• The expansion plans do not consider the impact of regional energy trade on supply and demand in Honduras. In the short term (2007 to 2010), preliminary information suggests that there is not a generation surplus in the neighboring countries to provide fi rm power to Honduras. In the longer term, after 2013, Honduras could benefit from economies of scale of large regional projects (thermal plants and some hydroelectric projects) that could be developed for the regional market.
In any case, Honduras could continue taking advantage of the regional market to optimize the operation of its generation plants with transactions in the spot market according to seasonal availability and prevailing spot prices.
• Substantial capacity additions in large hydroelectric and thermoelectric projects (about 600 MW) will be necessary by 2013 to meet demand growth, replace costly emergency rental contracts, and reduce generation costs. Development of these projects by 2013 is a major challenge because critical activities are pending: seeking or confi rming sponsors, preparing technical and economic feasibility studies and environmental impact studies, selecting a project developer, and ensuring fi nancing. A public/private partnership would facilitate the development of these capital-intensive projects.
• As happened during the 1990s, Honduras would have to rely on expensive emergency solutions to meet demand growth for 2007 to 2010. In addition to demand management and energy-saving programs, it is very important to design adequate bidding procedures to reduce the cost of generation
5176-CH03.pdf 22 5/19/10 1:13 PM
23
Reliability of Power Supply
rentals, including multiyear contracts, and call for bids in advance to provide suffi cient time for the preparation of proposals and deploying the generation equipment.
• The expiration of the Elcosa and Lufussa I supply contracts in 2010 will increase the generation capacity defi cit in 2011 and call for prompt decisions. These contracts could be replaced by new contracts with generation capacity that could be commissioned by 2011 (gas turbines or diesel generators) if the process of preparing tender documents
and bidding is completed in 2007. The other option is to renegotiate new short-term contracts with Elcosa and Lufussa I with substantial reductions in the fixed and variable charges to make these plants competitive with new generation. The negotiation position could be strengthened if ENEE advances the energy procurement process and demonstrates that it has the option to contract energy supply from new generation by 2010 to 2011.
5176-CH03.pdf 23 5/19/10 1:13 PM
24
Yea
r
EN
EE
Bas
e s
cen
ario
Bas
e c
ase
sce
nar
ioL
ow c
ase
sce
nar
ioH
igh
cas
e s
cen
ario
Ge
ne
rati
on
pla
nt
Cap
acit
yG
en
era
tio
n P
lan
tC
apac
ity
Ge
ne
rati
on
Pla
nt
Cap
acit
yG
en
era
tio
n P
lan
tC
apac
ity
Add
edTo
tal
Add
edTo
tal
Add
edTo
tal
Add
edTo
tal
20
07
Sm
all r
en
ewab
le
Th
erm
al A
lsth
om
, Su
lze
r,
EN
ER
SA
, Lu
fuss
a II
I
42
90
4
2
13
2
Sm
all r
en
ewab
le
Th
erm
al A
lsth
om
, Su
lze
r,
EN
ER
SA
, Lu
fuss
a II
I
42
90
42
132
Sm
all r
en
ewab
le
Th
erm
al A
lsth
om
, Su
lze
r,
EN
ER
SA
, Lu
fuss
a II
I
42
90
42
132
Sm
all r
en
ewab
le
Th
erm
al A
lsth
om
, Su
lze
r,
EN
ER
SA
, Lu
fuss
a II
I
42
90
42
132
20
08
Sm
all r
en
ewab
le
Re
nta
ls
Ou
t N
AC
O, S
anta
Fe
18 70 –19
15
0.4
22
0.4
20
1.9
Sm
all r
en
ewab
le
Re
nta
ls
Ou
t N
AC
O, S
anta
Fe
18 80
–19
150
23
0
212
Sm
all r
en
ewab
le
Re
nta
ls
Ou
t N
AC
O, S
anta
Fe
18 40
–19
150
190
172
Sm
all r
en
ewab
le
Re
nta
ls
Ou
t N
AC
O, S
anta
Fe
18
120
–19
150
270
25
2
20
09
Re
nta
ls
Win
d
80
60
28
1.9
34
1.9
Re
nta
ls70
28
2
28
2
Re
nta
ls4
02
12
212
Re
nta
ls10
03
52
35
2
20
10
Re
nta
ls
Ou
t L
ufu
ssa
I, E
lco
sa
Ou
t C
eib
a
120
–12
0
–27
46
1.9
34
2.4
315
.8
Re
nta
ls
Win
d
Ou
t C
eib
a
100
60
–27
38
2
44
2
415
Re
nta
ls
Win
d
Ou
t C
eib
a
80
60
–27
29
2
35
2
32
5
Re
nta
ls
Win
d
Ou
t C
eib
a
120
60
–27
472
53
2
50
5
20
11
Can
gre
jal
Re
nta
ls
Pla
tan
ares
Pat
uca
3
MS
D
40
30 41
100
30
0
35
5.8
38
5.8
42
6.8
52
6.8
82
6.8
Can
gre
jal
MS
D
40
160
45
5
45
5
45
5
45
5
615
Can
gre
jal
MS
D
40
80
36
5
36
5
36
5
36
5
44
5
Can
gre
jal
MS
D
40
28
0
54
5
54
5
54
5
54
5
82
5
20
12To
rnill
ito
s16
0 9
86
.86
154
45
82
5
20
13
Pat
uca
3
PF
BC
Ou
t re
nta
ls
270
40
0
–30
0
125
6.8
125
6.8
165
6.8
135
6.8
Pat
uca
3
Torn
illit
os
PF
BC
Ou
t re
nta
ls
100
160
30
0
–25
0
715
875
1,175
92
5
Pat
uca
3
Torn
illit
os
PF
BC
Ou
t re
nta
ls
100
160
40
0
–16
0
54
5
705
1,10
5
94
5
Pat
uca
2
Torn
illit
os
PF
BC
Ou
t re
nta
ls
100
160
60
0
–34
0
92
5
1,0
85
1,6
85
1,3
45
20
14
Ou
t A
lsth
om
y S
ulz
er
–60
135
6.8
135
6.8
129
6.8
Pla
tan
ares
PF
BC
Ou
t A
lsth
om
y S
ulz
er
41
100
–60
96
6
1.0
66
1,0
06
Ou
t A
lsth
om
y S
ulz
er
–60
94
5
94
5
88
5O
ut
Als
tho
m y
Su
lze
r–6
0
1,3
45
1,3
45
1,2
85
20
15P
FB
C
Ou
t L
a P
ue
rta
20
0
–18
149
6.8
1478
.8
Pat
uca
2
Ou
t L
a P
ue
rta
270 –18
1,2
76
1,2
58
Pat
uca
2
Ou
t L
a P
ue
rta
270 –18
1,15
5
1,13
7
Pat
uca
2
Ou
t L
a P
ue
rta
270 –18
1,5
55
1,5
37
Sou
rce
: Au
tho
rs’ c
alc
ula
tion
s, 20
07.
Tab
le 3
.9
Ge
ne
rati
on
Exp
ansi
on
Pla
ns
5176-CH03.pdf 24 5/19/10 1:13 PM
25
IntroductionUntil 1957,6 when the Empresa Nacional de Energía Eléctrica (ENEE) was created as a vertically integrated state-owned company responsible for promoting the country’s electrifi cation, electric public service was provided by isolated power systems run by private companies in the north, and by municipalities and the government in other areas. During its first 25 years, ENEE expanded quickly, developing a national transmission grid and the fi rst international interconnection with Nicaragua in 1976. In 1985, with the support of the International Finance Institutions (IFIs), it commissioned the 300-MW hydroelectric plant of El Cajón. This brought total installed capacity to 550 MW, in a year when peak demand reached only 220 MW.
The high demand growth envisioned years before had not materialized, and now the country was left with a large excess capacity and ENEE with an unsustainable debt burden. An aggressive rural electrifi cation program was launched after El Cajón, but the domestic tariff was not adjusted to cover the cost of the debt service, causing ENEE’s fi nancial situation to worsen. Eventually, ENEE stopped paying its debt service, contributing to Honduras’s 1989 debt default with the multilateral financial institutions. Afterward, devaluation eroded the dollar value of tariff revenues, which, combined with growing electricity losses (eventually reaching 28 percent), led to a fi nancial crisis.
The motivation for the 1994 sector reform was a combination of factors: the fi nancial crisis
Institutional Arrangements and the Regional Power Market
4
of the late 1980s, which was the origin of the 1993 to 1994 energy crisis; the urgent need to mobilize private investment for power expansion; the lack of cost-covering tariffs; and the ineffi ciencies and poor performance of ENEE (high electricity losses, overstaffi ng, and neglected maintenance of thermal generation).
The Sector Reform of 1994The Electricity Law of 1994 defi nes an institutional structure and industrial organization for the electric power industry that contains the basic elements of the standard model used practically worldwide to promote the sustainable development of an effi cient and suffi cient power supply to meet expected demand. The model introduced competition wherever feasible; economic regulation of natural monopolies; separation of the roles of policy making, regulation, and service provider; and private provision of electricity services.
The Electricity Law promotes competition in the wholesale power market by vertical unbundling of generation, transmission/dispatch and distribution, freedom of entry to all sector activities, open access to transmission and distribution networks, and freedom of large consumers to choose their energy supplier and energy transactions in a wholesale market. The monopolistic segments, transmission, and distribution, were subject to price regulation based on economic costs.
Under the Electricity Law the policy making function was assigned to an Energy Cabinet chaired by the country’s president or to the Ministry of Natural Resources and Environment (Secretaria de Recursos Naturales y Ambiente,
6 See Annex 4 for a historical background of the creation and evolution of ENEE.
5176-CH04.pdf 25 5/19/10 1:12 PM
HONDURAS: POWER SECTOR ISSUES AND OPTIONS
26
SERNA) as its secretary and coordinator. A new regulatory agency, the Comisión Nacional de Energía (CNE), was created.
The implementation of the new sector model established in the law was partial and had limited success in addressing the sector problems that motivated the reform. Crucially, distribution networks were not privatized as the law had mandated, leaving ENEE as a vertically integrated utility, sole distributor served from the transmission grid and in control of all generation facilities, either as owner or through the respective power purchase agreements (PPAs). Indeed, in the absence of separate distributors, ENEE became the single buyer for the whole system and retained its dominant presence in the sector.
Achievements: New Investments in Thermal Power GenerationThe reform solved the root cause of the 1994 energy crisis. Despite diffi culties in the energy contracting processes, the de facto single-buyer model has been successful in attracting private investment to expand generation capacity, helped also by the incentives for the development of renewable sources. Since 1994, private developers have invested some US$600 million in about 800 MW of medium-speed diesel and gas turbine capacity. In addition, they have invested some US$70 million in 110 MW of small hydro- and bagasse-fired capacity. Reliance on the private sector has thus become the norm for generation capacity expansion.
Since 1994, generation expansion has been predominantly thermal based. Hydropower plant capacity has gone from 90 percent to only 30 percent. This results from a combination of factors. First, once the IFI’s soft fi nancing of hydroelectric development disappeared, hydroelectric generation became substantially more expensive and thus much less competitive at the fuel prices prevailing at the time. Second, from the point of view of the private investors, the lower risks and shorter maturity of thermal generation projects favored expansion based on heavy fuel oil, medium-speed diesels. Finally, in bidding for new capacity, ENEE has
given interested bidders lead times of only 18 to 24 months, limiting the range of available technological choices.
As time has passed, the development of larger hydroelectric projects has also become more diffi cult because of a greater awareness about their environmental impacts and the now seemingly unavoidable opposition of rural populations organized and supported by international nongovernmental organizations, making their development a more complicated process for the government.
Diffi cultiesPolicy Making and Regulation
The Energy Cabinet has met only a few times since its creation, less than once a year, chaired by the minister of the presidency. SERNA has not been proactive in its role as the cabinet’s secretary and coordinator to set the agenda and to supply the technical groundwork for decisions. The consequence of this void at the cabinet level is that ENEE becomes for the government the default focal point for energy expertise, to which it turns even for matters that fall into the fi eld of policy making or regulation, thus contributing to a weak separation of roles.
SERNA’s weakness is due in part to limited budgets, and in part to the weakness of the civil service system. There is a complete turnover of ministry staff every four years, when a new government takes over, even when it is of the same political party. Governments should be able to count on a professional group at the ministry, a group with an adequate budget and capable of isolating its staff from the periodic replacement after a new administration takes offi ce.
The power sector planning process has not worked well. Although ENEE has prepared indicative generation expansion plans regularly, the formal presentation to and adoption of these plans by the Energy Cabinet has not taken place. More important, the procurement process to contract new generation capacity has experienced difficulties and delays, making it necessary to contract expensive emergency generation. Recently, the promotion and development of
5176-CH04.pdf 26 5/19/10 1:12 PM
27
Institutional Arrangements and the Regional Power Market
the Patuca 3 hydroelectric project, needed to meet demand growth and diversify energy sources, had substantial delays due to a lack of clear policies and procedures to mobilize private fi nancing, again probably making it necessary to contract expensive emergency generation.
The regulator has had a marginal existence, which is consistent with the incomplete implementation of reform, the lack of awareness by governments of the scheme defined in the law, the continued dominance of state-owned ENEE and the politicization of its management, and the political sensitivity of tariffs. All of this undermines the credibility of a regulatory agency, the responsibility of which is a transparent and objective application of the new rules and regulations and to implement cost-covering tariffs.
Poor Performance of ENEE
After the 1994 reform, the announced restruc-turing and privatization of ENEE did not take place and its corporate governance and management did not improve. ENEE faces today a new financial crisis, caused in part by poor performance. ENEE’s problems can be associated with a lack of commitment by the government and the political parties to implement cost-covering tariffs and to restructure and improve ENEE’s corporate governance. Ensuring sustainable, good-quality electric service requires healthy fi nances and
professional management, including modern information systems.
In Honduras, article 264 of the Constitution states that “general managers of state-owned companies will last up to four years in their positions. . . .” Every time a new government is sworn in, a new general manager—not necessarily with previous knowledge of the sector—is appointed. The heads of ENEE’s three distribution regions have also become subjects of political appointment. The rotation at the top levels of management makes it diffi cult to maintain a long-term strategy.
In terms of employment, Figure 4.1, which compares the number of residential connections per employee and the energy sold per employee in Honduras with the other utilities in Central America, shows that ENEE appears to be overstaffed.
Under the distribution regional managers are the key positions of Jefes de Sistema, or district chiefs, the heads of ENEE’s distribution in towns with 5,000 clients or more,7 who supervise distribution and commercial operations in those centers and in a number of smaller towns around them. Despite the fact that since 1991 the board of directors issued a directive requiring these
7 Such as Puerto Cortés, Tela, Trujillo, Progreso, Santa Barbara, Santa Rosa de Copán, Ocotepeque, Gracias, Siguatepeque, Comayagua, La Esperanza, Juticalpa, Catacamas, Choluteca, and others.
Figure 4.1 Electricity: Residential Connection and Energy Sold per Employee
1995 2000 2005year
Costa Rica El Salvador Guatemala HondurasNicaragua R. Dominicana Belize Panama
Electricity - Residential Connection per employee
1995 2000 2005year
Costa Rica El Salvador Guatemala HondurasNicaragua R. Dominicana Belize Panama
Electricity - Energy sold per employee
020
060
040
080
010
00
010
0020
0030
0040
00
Source: LAC Electricity Benchmarking Database, The World Bank, 2007. Source: LAC Electricity Benchmarking Database, The World Bank, 2007.
5176-CH04.pdf 27 5/19/10 1:12 PM
HONDURAS: POWER SECTOR ISSUES AND OPTIONS
28
positions to be fi lled by engineers, they have been reserved for political activists, also replaced every three or four years.
From about 1998 to 2001, ENEE carried out a program to professionalize the district chief positions. It took years to implement, because it had to be done against the resistance of political patrons, but it produced dramatic results, both in terms of commercial-loss reduction and quality-of-service improvements. However, as soon as the next government came in, the engineers were again replaced with political activists.
With the growth of private generation, the new companies have recruited many of ENEE’s best professionals. Gradually, ENEE seems to have come to see the private sector and the market mechanisms introduced by the electricity law as a threat, particularly when payments to private generators have increased and tariffs have not.
ENEE’s commercial management uses obsolete software, dating from the 1970s, which is all patched up. For perhaps as many as 50 percent of service accounts, ENEE does not know who its clients are. For most residential service accounts, the account is in the name of the fi rst person ever to request service for the premises. Many are dead. The same happens even with large, well-known corporate clients. This means that in most cases ENEE cannot legally sue users for nonpayment, since there is no contract obliging the user.
Tariff Regulation
Cost-covering tariffs and focalized subsidies, two principles established in the electricity law, have not been implemented. Rather, electricity prices have become more and more a political issue. ENEE does not apply the methods and procedures established in the law to set tariffs.
ENEE has not submitted to CNE a tariff proposal for busbar or retail tariffs in years, and the current tariff structure and level do not refl ect the actual economic supply costs as established in the law.
Implementing a Competitive Market
The wholesale market design in the Electricity Law ignored the technical and economic limitations of a small power system, which
could not meet one of the basic conditions to introduce effective competition: participation of a suffi cient number of capable buyers and sellers are necessary to reduce potential problems of market power. The possible gains in lower energy prices due to competition would not compensate for the loss in economies of scale and scope of unbundling companies in a small market; the number of large industrial consumers willing to participate in the market was small, and regional energy trade was constrained by the limited transmission capacity of the regional interconnection. Some analysts argue that the de facto single-buyer model was more appropriate for Honduras and that fortunately the market model envisioned in the law was not fully implemented.8
Other basic conditions to ensure effective competition in the market were not met: open access to the transportation networks was hindered when ENEE remained a vertically integrated company; the method used to determine transmission charges is complex and discouraged energy transactions by large users; the methods applied to regulate wholesale prices for distributors, in the busbar tariff, discouraged generation expansion; and the lack of a transparent spot market hindered needed short-term transactions.
Large Consumers
The potential market for large industrial consumers (>1 MW) is today, in principle, relatively important: 76 consumers with a noncoincident peak demand of 255 MW (see Table 4.1). However, this market has not developed. There are three reasons that explain this situation:
1. The method to determine the wheeling price, issued by CNE in 2000, charges variable and fixed costs to each transaction, and costs increase with distance. There have been negotiations in several cases, but
8 Ian Walker and Juan Benavides, “Sustainability of Power Sector Reform in Latin America: The Reform in Honduras,” IDB, 2002; Jaime Millán, “Entre el Mercado y el estado: tres décadas de reformas en el sector eléctrico de América Latina,” IDB, 2006.
5176-CH04.pdf 28 5/19/10 1:12 PM
29
Institutional Arrangements and the Regional Power Market
interested parties have complained that wheeling charges quoted to them by ENEE are excessive.
2. ENEE, in its position as a vertically integrated monopoly, is not interested in promoting the development of the market of large consumers and risking that local and regional generators try to cream-skim its consumer base.
3. The gradual erosion of ENEE’s tariffs for industrial clients removes the incentive to look for alternative suppliers.
Regulation of Generation Prices
In the pricing scheme introduced by the Electricity Law, the short-term marginal cost is primarily an economic signal for generators, to encourage supply. As a component of the busbar tariff—to be proposed every year by the generators to the regulator—it is the price at which the generators are willing to guarantee supply to distributors. For that reason, it is also the generation cost passed through to fi nal consumers in the tariffs.
The Electricity Law defi nes the short-run marginal cost as the economic cost of supplying an additional kilowatt and kilowatt-hour over fi ve years. The defi nition refers to the cost of supplying additional power, or capacity (a kilowatt), and to the cost of supplying additional energy (a kilowatt-hour). However, the current practice is that every year ENEE calculates the short-term marginal cost of energy.
The calculation of a busbar tariff that excludes the marginal costs of capacity and is calculated annually based on a fi ve-year average
of future marginal energy costs is effective to ensure price stability, but discourages the development of a contract market between generators and distributors. The theory and the practice show that an effi cient generator selling energy at the marginal energy costs may not cover all its investment costs, and that the calculation of future marginal costs is very sensitive to many parameters and assumptions that can be manipulated.9
It is therefore not surprising that private generators prefer to sell energy to ENEE under long-term contracts at prices determined by competitive bidding procedures, which include fi xed charges and energy charges indexed to fuel prices and variations in the Consumer Price Index (CPI), or that small renewable-based generators prefer a fi xed price of energy for the duration of the contract, eliminating the risk of future reductions in the marginal cost.
The Spot Market10
The Electricity Law allowed spot transactions between generators and ENEE but did not establish a formal spot market based on hourly energy prices. There are only two generators regularly selling to ENEE at the system’s short-run marginal cost, Elásticos Centroamericanos y Textiles, S. A. (ELCATEX), an industrial self-generator selling between 3 MW and 5 MW excess capacity, and EMCE, one of the private producers, using 5 MW of extra capacity not included in its PPA with ENEE. The sales by generators having PPAs with ENEE, which make offers “on the side” to ensure they get dispatched, could be classifi ed under the same category.
ENEE’s dispatch does not determine the system’s hourly marginal cost. Although ENEE uses a well-known software tool for medium-term operations planning, the Stochastic Dual Dynamic Programming (SDDP), it has never
9 In Chile and Peru the regulations include a capacity charge and establish that the marginal energy cost should be in line with the price of energy in the market of large consumers, which is competitive.10 See Annex 4 for details about the national and regional wholesale power markets.
Peak Demand (kW)
Number of Consumers
Peak Demand (non-coincident)
Min Max MW
100 200 290 41
200 500 180 53
500 1000 30 23
1000 76 255
Source: CNE estimations based on billing database. Includes commercial and industrial consumers.
Table 4.1 Large Consumers
5176-CH04.pdf 29 5/19/10 1:12 PM
HONDURAS: POWER SECTOR ISSUES AND OPTIONS
30
enabled the program’s short-term module, which the dispatch center should be using for day-to-day dispatch and which would allow it to determine the hourly short-term marginal cost. The calculation of the hourly marginal cost would facilitate the implementation of a spot or balance market, required to accommodate flexible energy contracts11 and increase the effi ciency of energy transactions.
The Regional Energy Market10
In the late 1990s, the Central American countries of Costa Rica, El Salvador, Guatemala, Honduras, Nicaragua, and Panama decided to increase the bilateral electricity connections among them through the construction of an 1,800 km 230kV transmission line. The project would increase
the interconnection capacity for commercial transactions of electricity among the six countries from the present 50MW to about 300 MW initially and to 600 MW later on (Figure 4.2).12 In parallel, two regional institutions, the Comisión Regional de Interconexión Eléctrica (CRIE) and the Ente Operador Regional (EOR), were created for the regulation and the system operator, respectively, of the regional transactions on the market. The development of more open and competitive market mechanisms, along with the enhanced transmission line for the power interchange, would provide incentives for the development of new generation projects to serve the regional market.
Commercial arrangements among countries are in the form of contracts and spot-market transactions. As shown in Table 4.2, in 2005 most interchanges were made under contracts between countries, and in particular from Guatemala.
11 The existing PPAs are physical contracts that impose constraints on the operation of the power system and the power market. For example, generators refuse to provide ancillary services because the PPAs do not include a specifi c remuneration for the provision of these services. The PPAs do not require settling the deviations between the contracted energy and energy dispatched by merit order. This is good because they do not constrain economic dispatch, but bad because they cannot handle fl exible and effi cient fi nancial contracts that settle the differences at marginal costs.
12 All Sistema de Interconexión Eléctrica para América Central (SIEPAC) lines will be built for double circuit, but will be equipped with only one circuit initially.
Guatemala - El Salvador >80MW <100MWEl Salvador - Honduras >80MW <80MWHonduras - Nicaragua >80MW <80MWNicaragua - Costa Rica >80MW <80MWCosta Rica - Panama >30MW <100MW
All Countries 300MW
Guatemala
Honduras
Source: SIEPAC, 2007.
5176-CH04.pdf 30 5/19/10 1:12 PM
31
Institutional Arrangements and the Regional Power Market
Source: UNDP-CEPAL–Istmo Centro Americano Estadisticas del Subsector Electrico 2005.
Table 4.2 Electricity Traded in 2007 in Central America (GWh)
5176-CH04.pdf 31 5/19/10 1:12 PM
5176-CH04.pdf 32 5/19/10 1:12 PM
33
Electricity Price SettingHonduras’s electricity tariff system is established in the Electricity Law, which in this respect follows the Peruvian Law on Electrical Concessions of 1992. The scheme presented in Box 5.1 corresponds to the industry structure the law envisioned, with multiple generators and multiple private distributors.
Pricing Policies5
The Empresa Nacional de Energía Eléctrica ENEE), which has remained vertically integrated, has never applied the offi cial tariff-calculation or tariff-adjustment methods, nor has it observed the indicated frequency of tariff calculations.13
Need to Update TariffsENEE’s current tariffs, published by the Comisión Nacional de Energía (CNE) in the offi cial Gazette in February 2000, no longer refl ect the economic costs of supply. First, the study was based on cost projections covering 2000 to 2004. Since 1999, installed capacity has more than doubled and ENEE’s cost structure has changed. The indexation formulas are no longer appropriate.
13 ENEE submitted a tariff proposal at the end of 2001, and new tariffs were published in May 2002, but their application was suspended a few days later following a temporary freeze on public service tariffs agreed by the government with workers and employers associations. The freeze ended in July 2003, but ENEE has yet to submit a new tariff proposal.
Box 5.1 Electricity Tariff Principles and Tariff Setting under the Electricity Law
Distributors were to buy power and energy at a regulated price, designated as the Busbar Tariff, refl ecting generation and transmission costs. This tariff would be calculated every year by the generators and approved by the regulator together with indexation formulas permitting its modification during the year whenever costs changed by more than 5 percent due to variations in fuel prices and the exchange rate. The tariff, and its eventual modifi cations in case of adjustments, had to be published in the offi cial Gazette to become effective.
The distributors would submit every fi ve years retail tariffs and their indexation formulas for approval by the regulator. (The retail tariffs can be recalculated before the end of the fi ve-year period if the adjustment indicated by the indexation formulas exceeds the original tariff value.) These retail tariffs would refl ect the cost of power and energy purchased in bulk at the Busbar Tariff plus a “Distribution Value Added” based on the costs of a “Model, effi cient, distribution company.” Retail tariffs were to be adjusted when costs varied by more than 5 percent due to changes in the Busbar Tariff and the exchange rate.
In calculating the distribution value added, distribution costs are averaged over different types of zones, which implies a subsidy from urban to rural areas. In addition, the law permits, but does not mandate, an explicit cross-subsidy in favor of the “Small Residential Consumers,” defi ned as those using less than 300 kWh per month, and establishes caps on this subsidy. Today, an additional direct government subsidy is provided to small residential consumers, equivalent on average to US$1.90 per client per month, which is deducted by ENEE from the electricity bill, and reimbursed by the government to ENEE.
5176-CH05.pdf 33 5/19/10 1:14 PM
HONDURAS: POWER SECTOR ISSUES AND OPTIONS
34
The accumulated adjustment according to the formulas is today more than 100 percent of the original tariff.
Figure 5.1 shows the evolution of ENEE’s average price (tariff plus adjustment) in both nominal and real terms. The average price expressed in current lempiras increased by 52 percent between 2001 and 2006. When expressed in constant lempiras of 2005, however, it has remained practically constant.
Comparison with Economic CostsTable 5.1 shows a comparison for all consumer categories of: (a) economic cost of supply (which recognizes a level of 15 percent losses), (b) ENEE’s tariffs, and (c) fi nal prices paid by consumers after deducting the direct subsidy. The economic cost of supply was estimated by CNE applying the methods prescribed by the Electricity Law and using data obtained from ENEE and other sources, as explained in Annex 5.
Table 5.1 shows that, overall, ENEE’s prices cover only 81 percent of the economic cost of supply and a distortion of the tariff structure, with residential prices substantially below economic cost. The average tariff for the residential category is 60 percent of the economic cost of supply, and only 54 percent after deducting the government’s direct subsidy.
The tariff for households consuming less than 100 kWh per month is equivalent to 22 percent of cost, and for those consuming between 0 and 300 kWh—84 percent of all residential clients—39 percent of cost. Even clients consuming more than 500 kWh per month pay only 82 percent of the cost of supply. Tariffs for municipalities are equivalent to about 77 percent of cost. For the other consumer categories, tariffs are at about the same level of cost, thus leaving ENEE with a defi cit.
Comparison with Central America’s TariffsFigure 5.2 presents a comparison of ENEE’s average electricity tariffs for industrial and residential consumers in Central America. The fi gure shows that residential tariffs are among the lowest in the region while industrial tariffs are among the highest.
SubsidiesThe explicit cross-subsidy incorporated in the current tariff structure goes beyond the caps set by the Electricity Law. Most residential consumers have been subsidized since the tariffs were published in February 2000. To compensate this, the surcharges to other consumer categories exceeded the limits established in the law. As the cost of service has increased and the tariffs have
Figure 5.1 Historical Trend of Average Tariff in Nominal and Real Terms (Lps/kWh)
Lp./kWh
Tariff in current Lp Tariff in Constant Lp
2.5
2
1.5
1
0.5
0
Jan-0
1Ju
l-01
Jan-0
2Ju
l-02
Jan-0
3Ju
l-03
Jan-0
4Ju
l-04
Jan-0
5Ju
l-05
Jan-0
6Ju
l-06
Source: Authors’ calculations, 2007.
5176-CH05.pdf 34 5/19/10 1:14 PM
35
Pricing Policies
Cu
stom
er C
lass
an
d
Con
sum
pti
on
Blo
ck
Aver
age
Eco
nom
ic
Cos
t $
/kW
h
Aver
age
Tari
ffC
on
sum
pti
on
Dir
ect
Su
bsi
dy
Pri
ce
aft
er
Dir
ect
Su
bsi
dy
% o
f C
ost
$/k
Wh
% o
f C
ost
Nbr
of
Clien
ts—
Dm
ax
MW
En
ergy
M
Wh
US
$$
/kW
h
A-R
esid
enti
al
0–2
0 k
Wh
/mo
nth
0.4
04
30
.09
172
2.7
%8
6,4
98
63
415
,159
0.0
23
90
.06
7816
.8%
21–
50
0.18
780
.04
81
25
.6%
87,
84
03
,114
47,
978
0.0
154
0.0
32
717
.4%
51–
100
0.15
780
.05
723
6.3
%13
2,8
04
10,0
62
177,
39
70
.017
60
.03
96
25
.1%
101–
130
0.14
740
.06
64
45
.1%7
7,0
179
,64
318
5,8
38
0.0
193
0.0
472
32
.0%
131–
150
0.14
740
.06
64
45
.1%5
1,3
44
6,4
29
123
,89
20
.019
30
.04
723
2.0
%
151–
30
00
.140
80
.078
35
5.6
%2
42
,72
35
1,90
66
58
,40
80
.012
70
.06
56
46
.6%
30
1–5
00
0.13
67
0.0
88
76
4.8
%8
3,3
68
31,
29
20
0.0
88
76
4.8
%
>50
00
.133
60
.109
18
1.7%
43
,74
73
9,4
190
0.10
91
81.7
%
Tota
l R
esid
enti
al
0.14
20
0.0
85
26
0.0
%8
05
,34
115
2,4
99
1,2
08
,672
0.0
07
90
.07
73
54
.4%
B-C
om
mer
cial
Sin
gle
ph
ase
0.13
180
.132
810
0.8
%5
3,9
50
36
,85
10
.132
810
0.8
%
Th
ree
ph
ase
0.12
91
0.13
28
102
.9%
5,7
95
58
,171
0.13
28
102
.9%
Tota
l C
om
mer
cial
0.13
02
0.13
28
102
.0%
59
,74
59
5,0
21
0.13
28
102
.0%
Indu
stri
al M
ediu
m V
olt
age
0.10
700
.105
29
8.3
%13
411
4.13
44
,919
0.10
52
98
.3%
Indu
stri
al H
igh
volt
age
0.0
98
50
.09
33
94
.7%
1812
1.5
25
1,4
43
0.0
93
39
4.7
%
Pu
blic
Sec
tor
0.12
54
0.13
62
108
.6%
5,0
41
12,9
40
0.13
62
108
.6%
Mu
nic
ipal
Sin
gle
ph
ase
0.12
67
0.0
97
376
.8%
62
55
98
0.0
97
376
.8%
Th
ree
ph
ase
0.12
56
0.0
97
37
7.5
%72
81,
54
20
.09
73
77.
5%
Tota
l M
un
icip
al
0.12
59
0.0
97
37
7.3
%1,
35
32
,140
0.0
97
37
7.3
%
Tota
l E
NE
E0
.12
75
0.1
03
48
1.1%
87
1,6
32
35
8,9
63
1,2
08
,67
20
.00
34
0.1
00
07
8.4
%So
urc
e: A
uth
ors
’ ca
lcu
latio
ns,
2007
.
Tab
le 5
.1
Co
mp
aris
on
of
Un
it C
ost
s, T
arif
fs (
wit
h C
ross
Su
bsi
dy)
an
d F
inal
Pri
ces
(aft
er
Dir
ect
Su
bsi
dy)
5176-CH05.pdf 35 5/19/10 1:14 PM
HONDURAS: POWER SECTOR ISSUES AND OPTIONS
36
not been adjusted correspondingly, the subsidy to residential consumers has further escalated, while the surcharges to other consumers have been eroded.
Neither the cross-subsidy nor the direct government subsidy is efficiently targeted. Table 5.2 shows the distribution of both subsidies for July 2006 and the percentage of each that benefits the poor, based on the assumption that electricity use of 130 kWh per month is, on average, the dividing line between poor
and nonpoor.14 Table 5.2 shows the targeting indicator, �, defi ned as the percentage of the total subsidy amount received by the poor divided by the percentage of the population that is poor—62 percent in the case of Honduras. A value of � = 1.0 would indicate a neutral distribution. An � of less than 1.0 refl ects a regressive distribution,
14 This dividing line has been estimated based on surveys by Honduras’s Instituto Nacional de Estadística (INE) and ENEE’s commercial database.
Figure 5.2 Electricity: Average Residential and Industrial Tariff (per GWh, in dollars)
Costa RicaNicaragua
El SalvadorR. Dominicana
GuatemalaBelize
HondurasPanama
Costa RicaNicaragua
El SalvadorR. Dominicana
GuatemalaBelize
HondurasPanama
1995
5010
015
020
025
0
2000year
2005 1995
6080
100
120
140
160
2000year
2005
Electricity - Avg. Residential Tariff (per GWh, in dollars) Electricity - Avg. Industrial Tariff (per GWh, in dollars)
Source: LAC Electricity Benchmarking Database, The World Bank, 2007.
Source: LAC Electricity Benchmarking Database, The World Bank, 2007.
5176-CH05.pdf 36 5/19/10 1:14 PM
37
Pricing Policies
with proportionately more subsidies benefi ting nonpoor households.
Table 5.2 shows that cross-subsidies and direct subsidies are very regressive. The cross-subsidy incorporated in the tariff is the difference between the cost of service valued at the economic cost and the bill based on the current retail tariff. Its total monthly value is US$8.7 million. In terms of direct subsidies15 provided by the government, 35 percent benefi t poor households.
The low tariffs and the direct government subsidy are promoting excess consumption. Average residential use in Honduras is about 200 kWh per month, almost double the average residential use in El Salvador and Guatemala (see
15 The government’s direct subsidy targets all residential users consuming less than 300 kWh per month. The total amount of this subsidy has been capped at Lp275 million per year, equivalent to about $1.2 million per month. The monthly subsidy amount per consumer increases with increasing levels of consumption, up to a certain point, and then it remains fl at according to a method proposed by ENEE and approved by the Energy Cabinet. Today, the subsidy remains fl at above 135 kWh per month. As the level of consumption to be subsidized has increased over time due to the growing number of consumers, ENEE, to respect the global cap, has gradually reduced both the consumption beyond which the per capita amount remains fl at and the maximum per capita amount.
Costa RicaNicaragua
El SalvadorR. Dominicana
GuatemalaBelize
HondurasPanama
1995
24
68
10
2000year
2005
Figure 5.3 Electricity: Energy Sold per Connection (GWh/yr)
Figure 5.3), despite the fact that per capita income in those countries is more than double what it is in Honduras. The low electricity prices also promote ineffi cient interfuel substitution, particularly for cooking and water heating, because electricity, although a more ineffi cient and economically expensive option, is cheaper for the consumer than, say, liquefi ed petroleum gas (LPG).
Normalizing ENEE’s TariffsIn order to determine what ENEE’s tariffs should be, a simulation has been carried out by CNE to calculate a reference tariff schedule applying the methods indicated in the Electricity Law and using updated costs. The reference tariff schedule incorporates a cross-subsidy going from nonresidential users and from residential users with consumption larger than 300 kWh/month to residential users with consumption lower than 300 kWh/month, with larger subsidies provided to those with a consumption of up to 50 kWh/month. As a result of the simulation, the average residential tariff is about 5.7 percent below the average cost of supply. To fi nance this gap, other consumer categories have to pay a surcharge of 5.1 percent above their
Source: LAC Electricity Benchmarking Database, The World Bank, 2007.
Table 5.4 Option 1: Current and Proposed Final Price
cost of supply. Table 5.3 shows the comparison between the current and reference tariff schedule for residential consumers.
To reduce the tariff impact on the smaller consumers, it is necessary to reallocate the government’s direct subsidy to residential users. Table 5.4 presents a comparison of the fi nal price residential users currently pay, after deducting the direct subsidy, with the fi nal price that would result from applying the reference tariff schedule and deducting a direct subsidy reallocated to target mostly the smaller consumers.
The tariff structure outlined in Table 5.4 and the direct subsidies, could be further adjusted to maintain about the same fi nal price to residential users with a consumption of up to 150 kWh/month. To do so, it would be necessary to modify the reference tariff schedule in order to reduce, on the one hand, the price for these users, and to increase, on the other, the surcharge on nonresidential users, which would become 11 percent of their supply cost. Table 5.5 shows the comparison of fi nal price for residential consumers, with the new tariff and
Table 5.5 Option 2: Current and Proposed Final Price
Industrial Medium Voltage
$/kW-month $/kWh
Honduras (current) 10.86 0.078
Honduras (under Option 2)
9.41 0.095
Guatemala 9.16 0.062
El Salvador 8.68 0.079
Nicaragua 12.03 0.104
Costa Rica 9.97 0.034
Panama 9.45 0.110Source: Economic Commission for Latin America and the Caribbean (ECLAC) and United Nations (UN), 2006. .
Table 5.6 Medium Voltage Tariffs in Central America
16 High voltage tariffs were not available for a similar comparison, because in the rest of Central America most large industries procure their energy in the electricity market. Given the relationship between medium voltage and high voltage costs, however, it is estimated that the situation would be similar to the one for the medium voltage tariffs.
a new reallocation of the direct subsidy after these changes.
The new tariff will recover the economic cost of service, generating US$8.9 million per month in additional revenue for ENEE. Tariff increases for industrial customers, which today are paying slightly below their cost of service, will be 13 percent for medium-voltage consumers and 17 percent for high-voltage consumers. A comparison of the resulting medium voltage tariff16 with those prevailing in other Central American countries shows that the impact would not be very large (Table 5.6).
5176-CH05.pdf 39 5/25/10 10:34 AM
5176-CH05.pdf 40 5/19/10 1:14 PM
41
IntroductionIn the fi eld of electrifi cation, the 1994 Electricity Law set forth the creation of the Social Fund for Electricity Development (Fondo Social de Desarrollo Eléctrico, FOSODE) designed to support electrifi cation in both rural and marginal urban areas. FOSODE was to be administrated by the Empresa Nacional de Energía Eléctrica, ENEE), through the Social Electrifi cation Offi ce created for that purpose.
The early outcome of social electrifi cation supported by the law was positive in terms of coverage, increasing access at a rate of approximately 2 percent per year, and extending national coverage from 43 percent in 1994
Access to Electricity6
to 69 percent in 2006.17 In addition, FOSODE has played a key role in connecting isolated and underprivileged communities, extending electricity service to 2,381 rural communities in its fi rst 10 years of operation.18
However, in spite of the electrification efforts undertaken in the last 10 years, the overall rate of access to electricity service in Honduras continues to be among the lowest in Latin America and the second lowest in Central America after Nicaragua (see Figure 6.1).
In rural areas, the coverage rate is particularly low compared with the average coverage reported in urban areas (45 percent compared to 94 percent in 2006). There are also extreme cases of unequal access based on both region and
17 As of December 2006.18 As of February 2007; information provided by ENEE Ofi cina de Planifi cación.
Figure 6.1 Electricity: Coverage
Costa RicaNicaragua
El SalvadorR. Dominicana
GuatemalaBelize
HondurasPanama
1995
46
810
2000year
2005
Source: LAC Electricity Benchmarking Database, The World Bank, 2007.
5176-CH06.pdf 41 5/19/10 1:12 PM
HONDURAS: POWER SECTOR ISSUES AND OPTIONS
42
income groups. For example, the Department of Cortes reports 98.8 percent average coverage, while the Department of Lempira reaches only 24.6 percent; the poorest quintile of the population is at 30 percent, while the wealthiest quintile enjoys almost universal coverage.19 In terms of accelerating electricity access to the most underprivileged population, the area of highest concern is the lack of an adequate institutional framework for implementing rural electrifi cation programs. Although the 1994 law mandated the creation of FOSODE, a structural plan for social electrifi cation, called Plan Nacional de Electrifi cación Social, was not designed until 2002.
This chapter provides a critical description of the core aspects and results of electrifi cation programs in Honduras and the future challenges to meet the government electrifi cation targets.
The Institutional FrameworkENEE is responsible for social electrifi cation in rural and poor urban areas and, to that end, it manages FOSODE. The Fund was created by the 1994 Framework Law (Section 62, subsequently amended by Decree 89-98, dated October 1998).
The Framework Law mandates that FOSODE be capitalized with at least Lps.15 million on an annual basis by the federal government and ENEE. FOSODE is specifi cally funded by ENEE contributions equivalent to 1 percent of its annual revenues from energy sales (or not less than Lps.15 million). In addition, the Fund gets fi nancing from the fees municipalities impose on electricity companies in their jurisdiction as long as electrifi cation takes place within the particular municipalities. Finally, the Fund also has access to external fi nancing through concession loans and donations.
ENEE created the Social Electrification Office (Oficina de Electrificación Social, OES), for planning, managing, and executing social electrification projects in rural and urban areas. At present, OES comprises three major areas: customer service, technical design, and planning.
Although OES has been performing its designated function as part of ENEE, it will not become the agency that directs all the players involved in social electrifi cation. The extremely low level of rural electrification coverage warrants turning social electrifi cation into a state-run policy, led and coordinated at the ministerial level, rather than from a division or offi ce that falls under the state-run energy utility. Therefore, there should be a review of the Long-Term Sector Approach and the Strategic Plan for the Social Electrifi cation Sector prepared by OES, which not only calls for updating the legislation associated with social electrifi cation, but also promotes elevating the sector policy to a higher government echelon.
Existing Social Electrifi cation Policies and RegulationsSince the establishment of FOSODE, electrifi cation demand from isolated communities has grown considerably. During the Fund’s over 10 years of operation, the response to such demand was the funding of rural electrifi cation projects with government funds and other internal and external sources of funding that reached approximately US$10 million per year. Between 1995 and 2006, these efforts enabled the electrifi cation of 2,381 rural communities in Honduras.
Nevertheless, in order to achieve realistic short- and medium-term goals, while relying on an orderly electrifi cation plan that enables the prioritization of projects according to need, OES-FOSODE and ENEE authorities decided to prepare the National Social Electrifi cation Plan (Plan Nacional de Electrifi cación Social, PLANES) in 2002.
OES has led the development of a long-term electrifi cation plan (2005 to 2015), which is aligned with the guidelines set out by the Poverty Reduction Strategy (Estrategia para la Reducción de la Pobreza) and which is aimed at coordinating actions and resources with public, private, and international institutions. With the support of the Canadian government (the Canadian International Development Agency,
19 The worst case in terms of electricity coverage is the Department of Gracias a Dios, reaching just 12.36 percent.
5176-CH06.pdf 42 5/19/10 1:12 PM
43
Access to Electricity
ACDI), and through the Proyecto de Energía Eléctrica de Istmo Centroamericano (PREEICA), ENEE prepared PLANES for rural areas. PLANES is made up of two components: (a) a long-term electrifi cation plan (through 2012), and (b) a short-term electrifi cation plan (2003 to 2005).
The methodological process used to prepare PLANES included three main stages applied to a total set of projects exclusively focused on grid extension programs.
The fi rst stage is the short-listing of projects, based on financial sustainability criteria for rejecting projects whose annual tariff revenues are not suffi cient to meet at least their recurring costs (that is, the cost of energy purchased by the distributor plus operation and maintenance costs, and commercial costs). The second stage is the arrangement and prioritization of projects, aimed at maximizing the impact of funds allocated to electrifi cation, giving priority to the lower-cost projects. The third and last stage entails the arrangement of projects according to government priorities in order to identify those with a higher impact on poverty reduction.
Based on the 2002 PLANES program, a preliminary definition of investments and programs that would enable meeting the targets set out in the Poverty Reduction Strategy has been completed, and some of these programs are already being implemented.
Current Coverage of Electricity ServiceThe overall rate of access to electricity service reached 69 percent by the end of 2006. According to the last census and subsequent projections, the total population of Honduras’s 18 departments,
including rural and urban areas, is roughly 7.36 million. Therefore, if the electrification index is applied, approximately 5.09 million inhabitants have access to electricity service and over 2.2 million lack service.
Taking into account the government’s Household Survey, including illegal users (excluded from the coverage ratio calculated by ENEE), total coverage is roughly 75 to 80 percent.
As shown in Table 6.1, it is estimated that more than half the population of Honduras live in rural areas (54.5 percent), where electricity coverage reached only 44.8 percent in 2006. By contrast, there are about 3.35 million inhabitants living in urban areas, of which 94.4 percent have access to electricity.
There are approximately 420,000 unelectrifi ed households in rural areas, totaling 2.2 million people without access to electricity. Meanwhile, in urban areas, just 128,000 people lack service. Moreover, there are signifi cant differences in coverage among departments and, in particular, among the rural areas of the 18 departments. There are extreme cases of unequal access both among regions and among income groups. Although the department of Cortes, for example, has an average coverage of 98.8 percent and over 15,000 unelectrifi ed rural inhabitants, coverage in the Department of Gracias a Dios reaches only 12.4 percent. Moreover, the departments of Choluteca, Lempira, and Olancho all have over 200,000 unelectrifi ed rural inhabitants (see Annex 6 for details).
There are 298 municipalities in Honduras, 167 of which have fewer than 10,000 inhabitants. Several of these communities have chosen to partner together and form mancomunidades with independent legal status, in order to
Total 7,367,021 100.0% 1,430,118 100.0% 988,696 100.0% 69.1%
Source: ENEE, Subdirección de Planifi cación.
Table 6.1 Urban and Rural Access to Electricity, 2006
5176-CH06.pdf 43 5/19/10 1:12 PM
HONDURAS: POWER SECTOR ISSUES AND OPTIONS
44
conduct local development and environmental protection programs. Approximately 50 such mancomunidades exist in the country, many of which barely have access to electricity service. As shown in Table 6.2, there are 23 municipalities (7.7 percent) that have no access at all, and in 119 municipalities (39.9 percent), coverage is under 30 percent.
Level of Investment and Sources of FundingIn the fi eld of social electrifi cation, the major investments have been made by FOSODE, which has demonstrated ample capacity to raise funds through development resources and from external fi nancing, in addition to the budgetary resources that the government provides every year as required by law. As shown in Annex 6, Table A6.2, between 1995 and 2006, FOSODE invested US$91.4 million in rural electrifi cation, raising coverage from 45 percent in 1995 to 69.1 percent in 2006, at the relatively low connection cost of US$300 to US$400 per household.
Electrification projects have been carried out with resources from fi nancial organizations such as the Central American Bank for Economic Integration (Banco Centroamericano de Integración Económica), and with cooperation from countries such as Finland, Japan, Korea, and Norway. In addition, there is an agreement in place with the Fondo Cafetero Nacional (FCN) for the electrifi cation of coffee-producing regions. Table A6.2 presents a summary of the social electrifi cation projects conducted from 1995 to 2006.
Electrifi cation ChallengesThe overall target of the social electrifi cation subsector is to extend national electricity coverage to 80 percent of the total population by 2015, giving equal priority to urban and rural areas.
The National Social Electrification Plan (PLANES) in its original version set a target of an electrifi cation access rate of 71 percent by 2012, with an estimated 100 percent electrifi cation of urban areas. These targets would be
% of Access No. of Municipalities % Cumulative
90%–100% 41 13.8% 100.0%
80%–90% 11 3.7% 86.2%
70%–80% 13 4.4% 82.6%
60%–70% 19 6.4% 78.2%
50%–60% 30 10.1% 71.8%
40%–50% 27 9.1% 61.7%
30%–40% 38 12.8% 52.7%
20%–30% 41 13.8% 39.9%
10%–20% 33 11.1% 26.2%
Up to 10% 22 7.4% 15.1%
No access (0%) 23 7.7% 7.7%
Total Municipalities 298 100.0%
Source: ENEE, 2006.
Table 6.2 Access by Municipalities
5176-CH06.pdf 44 5/19/10 1:12 PM
45
Access to Electricity
made possible through the investment of US$144.4 million in three phases: 2004 to 2005, 2006 to 2009, and 2010 to 2012. To achieve these goals by 2012, PLANES intends to generate 160,000 new connections, with an annual investment of US$16 million and an average connection cost of US$900.
The electrifi cation program has been updated using the PLANES methodology for 2004 to 2015, aiming to raise the coverage level from 62.1 percent in 2004 (when the program was designed) to 80 percent by 2015, taking into account population growth. This new target of 80 percent national coverage represents more than 400,000 new connections and an annual growth rate of electricity coverage of 4.9 percent. It is estimated that the new connections will represent 10 percent of residential consumption and 7 percent of total consumption by 2015.
To date, virtually all government-sponsored rural electrification projects have focused on grid extension. However, this technical option is not economically viable for many distant communities that are isolated and more dispersed from the interconnected system. Many of the new connections are more complex than those carried out by ENEE during the fi rst years of the program and, if the new connections are to be effi cient, they should use alternative
renewable energy technologies for stand-alone systems rather than grid extensions.
As interconnection requirements from the most distant rural communities increase, costs rise rapidly, so much so that in the last projects supported by ENEE, costs have exceeded US$700 per household.20 Other analysts, like Dussan (2005), believe investment costs per new connection via grid extension to be greater than US$1,000, since ENEE’s connection cost estimates did not include the additional investments in subtransmission networks required by such projects.21 Therefore, to reach the target of 80 percent by 2015, Dussan estimated an annual average investment of US$40 million over the next 10 years, more than four times the annual investment up to 2008 forecasted by FOSODE. In addition, as discussed in Chapter 5, the tariff residential electricity consumption in Honduras is much lower than the supplied cost, and the residential consumption is thus heavily subsidized. The newly connected customers are subject to the same tariff as existing customers and, hence, the subsidy. When the tariff subsidy to the newly connected customers is accounted for, the investment needs for electrifi cation are even larger. An analysis of different institutional, technological, and fi nancing options to meet these challenges is presented in Chapter 9.
20 According to the “Honduras GEF Project Appraisal Document.”21 M. Dussan, “Problemática de la Energía Eléctrica en Honduras: Impacto Fiscal,” FIDE, 2005, p.16.
5176-CH06.pdf 45 5/19/10 1:12 PM
5176-CH06.pdf 46 5/19/10 1:12 PM
47
The review of the performance of the electricity sector in the last fi ve years (Part A) shows that although progress has been made, many of the problems that motivated the reform process in 1994 still persist. In particular, the sector is affected by ineffi ciency and poor performance of the Empresa Nacional de Energía Eléctrica (ENEE) (high electricity losses, poor corporate governance); a lack of private investment, for power expansion at that time, now for transmission and distribution; a fi nancial crisis of ENEE; delays in taking effective actions to ensure the required generation capacity additions to meet expected demand; electricity tariffs do not cover costs and tariff subsidies are not targeted; and the need to continue expanding electricity access to the rural areas.
The review shows that although the fi nancial crisis and the poor performance of the sector was exacerbated by external shocks (high oil prices, some dry seasons) and some expensive power purchase agreements, it was caused by structural problems and it can continue for many years or become a recurrent event if these problems are not addressed.
First, if the management and corporate governance of the state-owned company is not strengthened, it is unlikely that substantial and sustainable improvements in the performance of the transmission and distribution businesses of ENEE will be achieved. High nontechnical
Policy Options to Meet Sector Challenges
Part B
losses, nonpayment of electricity by government institutions, and a backlog of needed investments in distribution and transmission are major contributing factors to the current fi nancial crisis and to a looming energy crisis.
Second, no sector structure or market model, public or private, monopolist or competitive, can be sustainable in Honduras if the electricity tariffs do not cover efficient costs, and if electricity theft and fraud are not penalized and payment discipline enforced. Simply, it is not possible to reduce the fi nancial defi cit under these conditions, and the central government does not have the fi scal space and ENEE does not have the economic rent of hydro resources to fi nance the expected cash-fl ow defi cit during the next fi ve years. The tariff issue has a strong political component (electricity prices are a political commodity), but also becomes more diffi cult to tackle when generation prices are vulnerable to high and volatile international oil prices.
Third, the current de facto single-buyer model limits the options to restructure ENEE, improve its performance, introduce workable competition in the market, and take advantage of the benefi ts of expanded trade in the regional wholesale market.
Fourth, power generation is vulnerable to high and volatile international oil prices, which make it diffi cult, from the political point of view,
5176-CH07.pdf 47 5/19/10 1:12 PM
HONDURAS: POWER SECTOR ISSUES AND OPTIONS
48
to pass through the generation cost to tariffs. Diversifi cation of energy sources is necessary to mitigate this problem.
Fifth, increasing access for the poor to electricity services, mostly in sparsely populated rural areas, requires new policies and strategies focused on off-grid solutions.
The following chapters discuss the short- and medium-term options to implement a new
energy strategy, based on four major components, which can be effective in addressing the structural problems: (a) improving sector efficiency, (b) ensuring fi nancial sustainability, (c) improving electricity coverage; and (d) and diversifying energy sources.
5176-CH07.pdf 48 5/19/10 1:12 PM
49
This chapter discusses the following options to improve the effi ciency in electricity supply: establishing conditions for a good corporate governance and management of the Empresa Nacional de Energía Eléctrica (ENEE), promoting effective competition in the wholesale power market, and strengthening policy making and regulation.
Good Corporate Governance and Management of ENEEThe delays, uncertainty, and lack of decision in the process of unbundling ENEE and privatizing the distribution activities deteriorated ENEE’s management and performance. On one hand, it continued to operate as a vertically integrated state-owned enterprise (SOE) but, with the expectation of pending restructuring, it postponed needed investments and plans to reorganize its operations, and update and improve information and accounting systems, offi ces, technological platform, and software required to supervise and effi ciently manage its operations. On the other hand, it continued operating as an SOE with weak corporate governance. A combination of poor corporate governance and outmoded technology, know-how, commercial practices, and information and management systems contributed to poor performance.22
To improve the performance of government-owned electricity utilities (see Box 7.1), the rules
Improving Sector Effi ciency7
Box 7.1 The Corporate Governance of State-owned Enterprises
Corporate governance of state-owned enterprises (SOEs) refers to the rules that defi ne the relationship between the company and the government as its owner. Corporate governance of most SOEs in developing countries is weak, and ENEE is no exception. There are two fundamental problems: (a) politicians and government offi cials do not act as ordinary, profi t-motivated shareholders, and many times pressure the company to pursue noncommercial goals; (b) the government faces a confl ict of interest as policymaker and provider of electricity service that undermines the quality of policy and regulation, when the rules are modifi ed in a somewhat arbitrary manner to protect SOEs or to achieve noncommercial goals.
This explains why SOEs are usually subject to both micromanagement and politically motivated interference by the government; accountability for the performance of SOEs is diffuse, with the intervention of boards of directors, ministries, the President’s offi ce, and politicians; SOEs sometimes hold a monopoly position and are not subject to the discipline of a market; SOEs do not apply high standards of transparency and disclosure of financial and operational results; the administration of the SOEs lack operational autonomy to defi ne their budget, make investment and borrowing decisions, procure goods and services, and so forth; and the board of directors lacks the authority and independence to guide and supervise the management. Furthermore, SOEs are immune to two threats that discipline the management of private corporations and provide incentives for good performance: takeover and bankruptcy.
22 Timothy Irwin and Chiaki Yamamoto, “Some Options for Improving the Governance of State-owned Electricity Utilities,” World Bank, Energy and Mining Sector Board Paper No. 11, 2004.
5176-CH07.pdf 49 5/19/10 1:12 PM
HONDURAS: POWER SECTOR ISSUES AND OPTIONS
50
and practices must be changed to make it harder for politicians and other interested parties to use the utilities for noncommercial purposes, and easier to introduce new sources of pressure to perform well. Privatization, competition, and good regulation are effective instruments to improve corporate governance and were adopted in the Electricity Law. Substantial advances were made in private participation with the development of all new generation capacity by private investors since 1994. Although the privatization of distribution was not implemented and it appears that is no longer an option from the political point of view, some advances were made to get private operators involved in distribution. ENEE hired in 1999 the services of Servicio de Medición Eléctrica de Honduras (SEMEH) to manage the commercial operations of reading, billing, and collection. Recently, ENEE tried a short-term build-own-transfer (BOT) scheme to fi nance, construct, and operate some distribution and subtransmission works and is considering the development of transmission lines under BOT schemes.
However, these actions failed to improve the performance of the distribution business as distribution losses continued to increase. ENEE and the government are now proposing, as part of the short-term action plan to recover the electricity sector, to modernize ENEE’s information, accounting, and management systems and to hire an international consultant to prepare a one-year study of the options to restructure ENEE in independent business units (IBUs) for generation, transmission, distribution, and system control. The IBU would have separate accounts, financial statements, and administrations with fi nancial autonomy.
The creation of IBU for generation, transmission/dispatch, and two or three distribution regions with separate accounts, transfer prices, and financial autonomy can bring several potential benefi ts:
• Provide incentives for better performance. Each IBU will establish a business plan and performance targets, consistent with ENEE’s corporate plan. The performance of individual units can be monitored using
economic value added or similar indicators and can be rewarded with salary bonuses, promotions, and benchmarking against other units. Each individual manager will be accountable for the fi nancial and operational results of its business unit and will be isolated from other units by having separate accounts, transfer prices, and transparent procedures to allocate the common costs of the central unit.
• Improve and facilitate economic regulation. The creation of separate regulatory accounts will facilitate the calculation of the value added for distribution and transmission based on economic costs and the application of the principles and procedures for economic regulation of tariffs established in the law. The separation into two or three distribution units will make it possible to use benchmarking regulation.
• Facilitate development of competition. The creation of a separate business unit responsible for transmission/system operation/dispatch will reduce the barriers to open access of large consumers and independent generators to the transmission grid. It will also increase independence and transparency of economic dispatch and the calculation of short-term marginal costs. In addition, the transmission unit will be responsible for transmission planning and expansion and reducing transmission constraints.
The creation of IBUs is not a simple task and will take some time—one year to complete the restructuring study and another year to modernize ENEE’s information and accounting systems. However, no substantial improvements in performance might be expected if the IBUs continue operating as part of ENEE, subject to the problems of weak corporate governance mentioned above. The creation of IBUs represents a transitory arrangement that opens the door to more permanent and sustainable solutions—corporatization of the IBUs with the participation of minority local shareholders; or complements other transitory arrangements—management or lease contracts for distribution with experienced international operators.
5176-CH07.pdf 50 5/19/10 1:12 PM
51
Improving Sector Effi ciency
Corporatization Short of Full PrivatizationThe corporatization of SOEs without privatization subjects the utilities to private sector company law and ensures that the utility has a legal identity separate from its shareholders; that the directors, not the shareholders, are legally liable for managing the company; and that the management has operational autonomy but is accountable for the commercial performance of the company. In principle, the corporatization of IBUs, good regulation, and competition would introduce the principles of good corporate governance of the private sector and help improve its performance.
An essential requirement for a successful corporatization is that the SOE is restructured and commercialized fi rst—cost-covering tariffs, renegotiation of debt and other liabilities, renegotiation of labor contracts—so it can become fi nancially viable if it improves performance. Managers cannot be accountable for a company that cannot be fi nancially viable due to structural problems.
The experience in some countries that have tried this solution is that corporatization facilitates a commercial operation of the company (less cumbersome procurement procedures, more operational autonomy, and so forth) but, to be effective in improving performance, an independent board of directors and a professional management should be established to set up a commercial operation to reduce political interference.23 Additional commercial pressures are usually necessary for a better performance.
The discipline of commercial lending, participation of minority shareholders, and stronger and independent regulation has
been used to bring additional commercial pressures to SOEs and improve performance. Requiring the utility to borrow from commercial lenders without the comfort of sovereign guarantees will put the pressure of the lenders for better financial performance. Minority shareholders (pension funds, small local investors, employees) have a residual claim on the utility’s assets and depend strongly on the fi nancial performance of the utility to maintain the value of its investment. Supporting a strong and independent regulation mitigates the confl ict of interest of the government as owner, policy maker, and regulator, and puts more pressure on the SOE to improve performance. An essential requirement for the successful participation of minority shareholders is that the corporatized SOEs have achieved adequate fi nancial results and are able to distribute dividends.
There are some success stories. Interconexión Eléctrica S.A. (ISA) in Colombia, an SOE with a tradition of good management, was corporatized and placed 24.2 percent of equity among about 90,000 small shareholders in two public offerings of common shares. The national government that controls this company adopted and has respected the principles of good governance, including the protection of the rights of minority shareholders. ISA has been able to expand its operations in Latin America, taking over transmission companies and projects in Bolivia, Brazil, Ecuador, and Peru.
Management and Lease ContractsHonduras has used, as a main model for private participation in the power sector, project fi nancing of independent power producers backed by long-term power purchase agreements (PPAs). This arrangement is well suited for a country with a weak regulatory framework with substantial market and country risks. The private investors are shielded from market and price risks under their PPAs with government guarantees. ENEE has also used rehabilitate, operate, and maintain (ROM) contracts to mobilize private capital and know-how for the operation of its thermal units, reducing investment risks taken by the private sector.
23 Colombia reformed its power sector in 1993, introduced a competitive wholesale power market, and established a leveled playing fi eld for the participation of SOEs and private companies. All SOEs had the option of adopting a new legal entity subject to private company law. Many SOEs were corporatized without private participation, but the results were mixed because many of them remained under the control and interference of politicians and government offi cials.
5176-CH07.pdf 51 5/19/10 1:12 PM
HONDURAS: POWER SECTOR ISSUES AND OPTIONS
52
In the case of electricity distribution in Honduras, where straight privatization does not appear to be an option now due to political opposition and the unwillingness of private investors to take the high regulatory risks and investment risks involved with a business in fi nancial distress, there are models of public/private partnerships that can be used to attract private operators and improve performance, while reducing the risks assigned to the private partner.
Under a management contract, the SOE continues to own the distribution assets, continues to be responsible for making capital investments, and controls the revenues of the company, but assigns full or partial responsibility for day-to-day operations to an outside private operator. The operator is compensated with a fee for its services. Under a lease contract, the SOE continues to own the assets and is responsible for capital investments, but assigns to a private operator complete control over the management and financial results of the company. The operator makes lease payments to the SOE for the use of the assets.
Management contracts have been used extensively in water supply companies and power distribution companies in countries or companies with distressed public services and poor investment climates, especially in Africa. The evaluation of eight management contracts made in the power sector in Africa during the 1990s (Congo, Ghana, Mali, Rwanda, Sierra Leone, and Zimbabwe) indicates that they were mostly unsuccessful in improving performance and that the service providers did not have enough incentives to take risks.24 The major difficulties have been the clear definition of responsibilities between the owner and the operator and ensuring the support of the owners and employees for this arrangement. Lessons learned include that the operator should have full autonomy to make key decisions and implement its proposed measures to improve performance, and should have a fi nancial stake in the operation
of the utility (payments linked to specifi c and measurable performance improvements), that the contract should preferably be fi nanced by the increased revenues, and that the government should be highly committed to the reforms.
Some successes with well-structured management contracts have been reported, like the case of Tanzania where a private operator was able in two years to reduce losses by 5 percentage points, reduce operational expenses by 10 percent, and reverse a fi nancial defi cit of the power utility. The management contract was structured with a retainer fee and a success fee funded from increased revenue collections.
A management contract can be considered as an interim arrangement to improve performance of the distribution business in Honduras:
• Restructuring ENEE could take about two years. Corporatization and commercialization could be implemented in parallel with strong political support. In the meantime, it is essential to reduce electricity losses to mitigate the fi nancial crisis. Implementation of the electricity loss-reduction program without expert support is likely to fail, as demonstrated by the Seven Cities Project (see Annex 3).
• ENEE is proposing to modernize all its information and management systems as a key action to improve performance. However, if ENEE’s management and corporate governance are not improved fi rst, this proposal is unlikely to produce positive results.
• A two-year management contract to implement a short - term corporate recovery plan (reduce electricity losses, improve information systems, and assist in restructuring of ENEE) can be an effective fi rst step to improving corporate governance and restructuring of ENEE, instead of insisting on ad hoc interventions.
The contract with SEMEH is a management contract with limited scope and many limitations. SEMEH is responsible for most of the commercial functions: reading, providing information to update the billing database, billing, customer
24 World Bank, “Power for Development: A Review of the World Bank Group’s Experience with Private Participation in the Electricity Sector,” 2003.
5176-CH07.pdf 52 5/19/10 1:12 PM
53
Improving Sector Effi ciency
service (billing complaints), debugging the consumer database, reducing arrears, servicing disconnection and restoration, reporting illegal connections, and detecting possible fraud. However, ENEE keeps several commercial functions, including updating and maintaining the billing database, handling electricity service complaints, and responsibility for taking actions to reduce electricity losses. The contract with SEMEH has weak incentives for performance: it receives a fee for its services based on a percentage of monthly collections.
Although SEMEH provides crit ical information for the detection of fraud, the scope of the contract does not include the reduction of electricity losses. SEMEH maintains a geographic information system (GIS) linked to the customer database, but it does not include the distribution network maps. SEMEH is part of the solution to reduce losses but is not responsible for this activity.
With so many links between the SEMEH contract and the loss-reduction program, it is not clear whether a new management contract with a separate operator can be effective in improving ENEE’s performance in the short term, taking into account that the following:
• The electricity loss-reduction program proposed by the consultant25 requires as a first step a survey of the distribution networks of the major cities and the preparation of distribution maps linked to the customer database in a GIS. The consultant recommended the outsourcing of these services.
• T h e c o n s u l t a n t a l s o re c o m m e n d s implementing an Enterprise Resource Planning (ERP) system to integrate into a corporate database the main activities of ENEE. ENEE has accepted this recommendation and has allocated resources in the budget. However, the definition and design of an ERP system should have a clear roadmap for the restructuring,
commercialization, and corporatization of ENEE, which has not been defi ned yet.
We suggest that it would be better to consider options that consolidate most of the operations in one management contract and to do the following:
• Terminate the contract with SEMEH and solicit international competitive bidding for a new management contract that includes responsibility for all commercial operations, the implementation of the loss-reduction program, and improvements in information systems, with payments linked to performance.
• Renegotiate the contract with SEMEH to include full responsibility for the reduction of electricity losses and improvements in information systems, with payments linked to performance. However, there are many legal issues to be evaluated, including the experience and technical capability of this company.
• Another option is to consider a decentralized solution to reduce losses, allocating groups of distribution feeders with high losses to separate operators with full responsibility for loss reduction, with payments linked to increases in revenues related to loss reduction.26
Developing a Competitive Wholesale Power MarketA well-designed wholesale market structure should ensure a reliable, suffi cient, and economic energy supply to meet electricity demand. Although the de facto single-buyer model used in Honduras has been effective in mobilizing private capital to develop additional generation capacity and was a good transition option for a small power market, the experience in Honduras confi rms the risks associated with
25 Consultoría Colombiana S.A., “ENEE: Consultoría para la elaboración de un plan de reducción de pérdidas,” 2005.
26 This approach is being considered by EDEESTE, a private distribution company in the Dominican Republic, to address an endemic problem of high commercial losses.
5176-CH07.pdf 53 5/19/10 1:12 PM
HONDURAS: POWER SECTOR ISSUES AND OPTIONS
54
this scheme when the single buyer is a vertically integrated SOE:
• The scheme is sometimes used by governments to postpone needed tariff increases and increase cross-subsidies, using the single buyer to finance the shortfall between the real cost of energy supply and the generation price that is passed through to the consumer.
• It centralizes the decision to purchase new energy, increasing the risk that ineffi ciency or mistakes in the bidding process may have a major impact on the cost and reliability of supply.
• It may become an obstacle to moving to more competitive arrangements, because long-term PPAs are physical contracts, which impose many constraints on active participation in the market,27 and may have prices out of line with market prices (stranded costs).
The use of a fi ve-year average of short-run marginal costs as a reference to regulate the generation prices that are included in retail tariffs imposes serious price risks for buyers or sellers of energy in the regulated market. On one hand, the average of future short-run marginal costs does not necessarily cover the costs of new, effi cient generation in a market that does not remunerate fi rm capacity. On the other hand, the calculation of future marginal costs depends on many assumptions made by the planner and can be manipulated. In these conditions,
private generators are not willing to sell power at regulated prices and assume the risk of not being able to recover the investment costs.28 A distribution company, private or public, is not willing to purchase power at the price determined in competitive bids and assume the risk of not being able to recover the contract costs in electricity tariffs based on short-run marginal costs. Only ENEE, supported by the economic rent of hydroelectric resources and government guarantees, can assume these risks, and keep signing long-term PPAs with private generators to meet demand.
The de facto single-buyer arrangement can be improved to support a market model based on competition for a share in the market of long-term contracts (competition for the market) and can help reduce wholesale electricity prices and improve the quality of supply. Competition for the market is important in Honduras, because long-term power supply contracts will continue to play a dominant role in the wholesale power market since private generators will continue to require the comfort of these contracts to fi nance the new generation required to meet demand, especially now that capital-intensive projects have to be developed. The basic improvements are as follows:
• To obtain the benefi ts of competition for long-term contracts, adequate conditions should be established to promote the participation of a large number of qualifi ed investors: adoption of fi nancing schemes that allocate to the private investor the market and project risks that it can manage effi ciently, implement competitive procurement procedures to reduce the costs of power purchases, and improve the fi nancial health of the off-taker. Public/private partnerships are necessary to facilitate private development of capital-intensive projects (see Chapter 10). The procurement procedures should encourage
27 The PPA used in Honduras is a standard physical contract that defi nes all the rights and obligations of the generator, and in practice insulates the generator from the risks of participating in a competitive power market. The PPAs are suitable for the operation on a single-buyer model. They impose, however, many hindrances to the transition to a competitive market where all generators play an active role in the market and comply with the market rules: Instead of balancing its contract position with purchases and sales of energy in the spot market, based on market prices, the generator has the obligation to guarantee a fi rm capacity and, in the case of default, pay penalties that may not be effi cient. Usually the generator does not have the obligation to provide ancillary services according to the market rules, and it does not have the fl exibility of selling generation surpluses in the market (above the contracted capacity).
28 Private generators are developing small renewable projects based on long-term PPAs with ENEE at energy prices equal to the marginal cost adopted by SERNA. However, the price is fi xed when the contract is signed and is not adjusted to refl ect future marginal costs adopted by the authority.
5176-CH07.pdf 54 5/19/10 1:12 PM
55
Improving Sector Effi ciency
the participation of new generators, apply transparent competitive bidding principles, facilitate private fi nancing of new generation, and help create a portfolio of contracts to manage price risks. A strong fi nancial position of the off-taker reduces credit risks and encourages more competition.
• In this regard, it is necessary to improve the expansion planning and energy procurement processes (see Chapter 10).
• When the procurement procedures are effective in creating competitive conditions in the contract market, the Comisión Nacional de Energía (CNE) can authorize passing on to tariffs the costs of energy purchases under contracts and eliminating the price risk of busbar tariffs based on average short-term marginal costs. Short-term marginal costs can be used to provide a benchmark for energy purchases from small renewable power under long-term contracts and from independent generators under short-term contracts.
The de facto single-buyer model can accommodate, with some limitations, a market of large consumers and short-term energy sales by generators, based on the existing trading arrangements. ENEE as a vertically integrated company and system operator can provide wheeling services for transactions between large consumers and independent generators and buy surplus energy from independent generators at marginal costs. However, as explained in Chapter 4, the market of large consumers has not developed, and short-term energy transactions are insignifi cant. Some improvements can be made, mainly by improving the regulation of the transmission activity (simple and transparent wheeling charges).
Competition in the market, based on a wholesale power market of long-term energy contracts between generators, distributors, and large users, complemented with energy transactions in a spot market, is a market model that can capture the benefi ts of a more dynamic competition: in addition to competition for the market of long-term contracts, the market members (generators, distributors, and large
users) can make short-term energy transactions to adjust their positions in the contract market to real-time supply/demand conditions in the national and regional markets.
However, the lessons learned in the design of competitive wholesale power markets in small power systems in the region indicate that it is necessary to mitigate the potential for abuses of market power in the spot market by: (a) establishing the obligation that distribution companies should meet a substantial portion of expected energy demand with long-term contracts, so the spot market is used basically as a balance market and is small compared to the contract market; and (b) the spot energy transactions are based on a centralized merit order dispatch of the variable costs of the generating units. Therefore, the power market would continue to be dominated by the market for long-term contracts.
However, the power market of Honduras does not currently meet the minimum conditions to implement competition in the market, for the following reasons:
• The size of the power system in Honduras is too small to create a suffi cient number of buyers and sellers that can compete effectively in the market.
• Vertical unbundling of ENEE in separate generation, transmission/dispatch, and distribution companies is necessary.
• Open access to transport facilities is essential but will not be effective if ENEE remains vertically integrated. If ENEE maintains generation and transmission/dispatch under the same corporate group, it will have serious confl icts of interest and opportunities for discrimination.
• The electricity law did not establish the basic principles and regulations for the operation of a spot market (for example, hourly transactions, rules to determine spot prices, a market administrator).
Honduras could meet in the medium term the minimum conditions for the introduction of workable competition in the market: the development of new industrial parks will increase
5176-CH07.pdf 55 5/19/10 1:12 PM
HONDURAS: POWER SECTOR ISSUES AND OPTIONS
56
the number of large users able and willing to participate in the market; the commissioning of the SIEPAC project in 2009 will expand both the possibilities for energy trade in the regional market and the number of buyers and sellers that can participate in the national market; a study of options for vertical unbundling of ENEE and the creation of independent business units will be prepared this year; and a simpler methodology for the calculation of transmission charges will be adopted, which would facilitate open access.
A gradual transition from a single-buyer scheme to competition in the market appears to be possible in the case of Honduras, according to the following process:
1. Implement the suggested improvements in the single-buyer model.
2. Create the independent business units. 3. The generation unit of ENEE performs the
function of single buyer and sells energy to the distribution business units at the regulated wholesale price.
4. The generation unit of ENEE transfers to the distribution units the PPAs that have competitive prices, and signs supply contracts with the distribution units at the regulated price using the hydroelectric rent to compensate for the higher-cost PPAs that expire in the late 2010s. The distribution units are responsible for competitive procurement of new power and procurement of small renewable power at avoided costs. CNE authorizes passing on to tariffs the cost of energy purchased in a competitive contract market.
5. Competition in the market is fully implemented with the creation of a spot market.
The fi rst three steps can be implemented based on the existing legislation and the creation of independent business units. However, the market would continue to operate as a single-buyer model with more effi cient procurement procedures, but with the shortcomings already discussed.
The fourth step requires the unbundling of ENEE in separate companies, which can be done based on existing legislation. The main objective of this step is to corporatize and commercialize the business units and to create conditions for the operation of a wholesale market where distribution companies meet expected demand with long-term power purchase contracts, subject to competitive bidding, and can recover in the tariffs the full cost of energy purchases. The participation of large consumers in the market continues to be marginal.
The last step requires changes in the law to establish all the infrastructure necessary to operate a spot market: hourly energy transactions, a capacity market, expanding the functions of the dispatch center to include the function of market administrator, and formulating detailed rules and regulations for the operation of the market (procedures for the economic dispatch based on variable costs, predispatch and postdispatch arrangements, rules to calculate hourly marginal costs, rules to settle energy transactions, billing and collection, rules for the remuneration of fi rm capacity, rights and obligations of eligible market agents). This is something similar in scope to the regulations of the regional energy market.
The options and issues to introduce competition in the wholesale market are summarized in Table 7.1.
Improving the Institutional ArrangementsThe separation of roles of the government as policy maker, regulator, and service provider was an essential element of the electricity sector reform of 1994. The central government should concentrate on its primary role of policy maker and assign to a separate and independent institution the responsibility of applying the regulatory framework to provide credibility and stability to the new rules. The separation of roles is also important to establish a leveled and nondiscriminatory playing fi eld for private and state-owned companies, improve the investment
5176-CH07.pdf 56 5/19/10 1:12 PM
57
Options, Improvements, and Constraints
IssuesSingle-buyer, Vertical
Integration
Independent Business
UnitsUnbundling
Competition
in the Market
Lack of
incentives
for effi cient
generation
expansion
Improve planning
and procurement
procedures.
Include capacity cost in
busbar tariff.
Apply cost-covering
tariffs.
Independent
generators sell at
marginal costs.
ENEE make up for
differences between
contract costs and
busbar tariffs.
Same.
ENEE continues as
single buyer and sells
energy to IBU at busbar
tariffs.
Same.
ENEE transfer to the
new distcos PPAs with
competitive prices, and
sign supply contracts for
the balance at busbar
tariffs.
Distcos responsible for
competitive procurement
and purchase power to
renewables.
CNE authorizes pass-
through of cost of energy
purchases.
Same.
ENEE hydro sells energy
under contract at busbar
tariffs.
Distcos responsible for
competitive procurement
and purchases to
renewables to cover most
of expected demand and
can buy shortfall in spot
market.
Same.
Large
consumers do
not participate
in the market
Simplify wheeling
charges.
ENEE provides balance
service.
Strengthen regulation
to facilitate open
access.
Same. Same.
Large users make spot
transactions to balance
their position in national
and regional contract
market.
Financial and fl exible
physical contracts are
allowed.
Barriers to
expand regional
trade
ENEE responsible
for system operation
and coordination with
regional operator but
allows third-party
deals.
Same.
Gencos, distcos, and large
consumers participate in
regional contract market.
A transmission/dispatch
company is created.
Gencos, distcos, and large
consumers participate in
the regional contract and
spot markets.
The transmission and
dispatch company
responsible for
administrating the market.
Scope for
competition
Competition for long-
term contracts.
Mostly physical
contracts.
Limited short-term
energy transactions.
Same. Same.
Competition for long-term
and short-term market.
Financial and fl exible
physical contracts.
PPAs play an active role
in the market and balance
its contract position in the
spot market.
Active spot market in
operation.
Source: Authors’ calculations, 2007.
Table 7.1 Options and Issues to Introduce Competition in the Wholesale Market
5176-CH07.pdf 57 5/19/10 1:12 PM
HONDURAS: POWER SECTOR ISSUES AND OPTIONS
58
climate for private capital, and improve the corporate governance of SOEs.
However, in Honduras the separation of roles has not worked as envisioned (see Chapter 4). The policy making and planning functions are dispersed and weak. CNE does not have the autonomy, transparency, and competence required to build credibility. ENEE does not operate as a commercial company and is involved in policy making. The central government continues to intervene in the three roles. The private sector manages the risks of a weak regulatory framework by participating as independent power producers insulated from these risks under the terms of their PPAs, backed by sovereign guarantees.
The separation and strengthening of roles is important for improving the performance of the electricity sector, even in the case that distribution is not privatized. The sector reform initiated in 1994 was partially implemented and is necessary to defi ne a new energy strategy and revise the energy policy to address the structural problems faced by the sector. There is a need to have a permanent technical group that supports the formulation of energy policy, and is responsible for designing and coordinating action plans for its implementation. A strong and independent regulator is needed to apply the regulatory framework. ENEE should be restructured and corporatized, as discussed in this chapter, to operate as a commercial enterprise that is not involved in policy making or regulation.
The Ministry of Natural Resources and Environment (Secretaria de Recursos Naturales y Ambiente, SERNA) is the de facto energy ministry with responsibilities for policy making and supervision of the electricity sector. It is the secretariat and coordinator of the Energy Cabinet, chairman of the board of directors of ENEE, grants operation licenses for distribution companies, issues technical regulations, approves any PPA signed by ENEE, and grants environmental licenses for electricity projects. However, it lacks the resources and a stable technical group to discharge its responsibilities (Chapter 4). A simple solution to improve policy
making is to strengthen the energy group in SERNA and eliminate the Energy Cabinet. However, a different ministry (Ministry of Finance) should be responsible for representing the government as owner of ENEE to avoid confl icts of interest between policy making and provision of electricity services.
CNE has played a marginal role in the sector, impaired by lack of autonomy, the diffi culties of regulating a vertically integrated SOE, and a lack of the government’s commitment to implement the tariff regulations and the separation of roles. Other regulatory institutions in the region have faced similar diffi culties (for example, Nicaragua and the Dominican Republic). However, the lack of a credible and capable institution responsible for applying the new market rules and pricing principles is a barrier to the development of the electricity market, improving the performance of ENEE, and attracting private capital to other activities. Credibility can be improved with autonomy, transparency, and technical competence.
A long-term solution to improve the credibility of CNE is to change the Electricity Law to adopt the best practices for strengthening the regulatory function, which have been used in other countries in the region, mainly: ensure fi nancial resources with a regulatory fee to be paid by the regulated electricity companies; establish competitive salaries to attract the best-qualifi ed professionals; longer (more that one presidential period) and staggered terms of appointment of commissioners to provide continuity and stability; and establish clear procedures for public consultation and transparent reporting and justifi cation of regulatory decisions. These conditions are well known in Honduras, have been discussed in the past, and have been included in several failed initiatives to reform the Electricity Law. However, credible regulation cannot be established if there is a lack of political support and commitment to implement the rules and strengthen regulations. The interference of the government and of powerful SOEs has weakened the autonomy and credibility of the regulator in many countries in the region.
5176-CH07.pdf 58 5/19/10 1:12 PM
59
The dependency on imported fuel for about 65 percent of power generation, the high costs of some early power purchase agreements (PPAs) with thermal generators, the vulnerability of generation costs to high and volatile oil prices, and the diffi culties in passing through these costs to electricity tariffs have weakened the fi nancial position of Empresa Nacional de Energía Eléctrica (ENEE) and threatens the sustainability of the electricity industry in Honduras. The cost of energy purchases increased from US$2009 million to US$420 million during 2001 to 2006, and the average cost of energy purchases increased in 2006 to about US$103/megawatt-hours (MWh), when the average West Texas Intermediate oil price was US$66/bbl.
Cost of Energy PurchasesThe generation costs are basically determined by the cost of energy purchases (70 percent of total generation in 2006). The cost of energy purchases from 2007 to 2010, when only emergency projects can be commissioned, would continue to be determined by external noncontrollable factors (high and volatile oil prices and hydrological conditions) and the fixed payments under existing PPAs and new emergency generation. A portion of the fi xed costs could be reduced. The capacity charges for new emergency generation will have a substantial impact on the cost of purchases during the transition period until new generation projects are commissioned, and could be reduced by competitive procurement. The diversification of energy sources may
Ensuring Financial Sustainability8
contribute to reducing the vulnerability of generation costs to high and volatile oil prices and may also reduce the generation costs, but only after 2012.
The cost of energy purchases was calculated based on the generation expansion plans and the results of economic dispatch for each of the three demand scenarios, using the energy prices established in existing contracts and estimated capacity and energy charges (based on fi xed and variable project costs) for new projects.
The demand growth until 2011 is met by additional thermal generation from the existing PPAs and emergency generation. Beginning in 2011, lower-cost thermal generation (medium speed diesel [MSD] in 2011 and coal-fi red plants in 2013) substitute for the generation of the most expensive PPAs and replace the emergency generation. The generation of existing PPAs is almost completely displaced by 2015 when Patuca 2 is commissioned (see Figure 8.1).
For 2007 to 2011, the costs of energy purchases are determined, by and large, by the fuel costs of existing thermal generation and by the fi xed charges of the existing PPAs with thermal generators and of new leasing contracts for emergency generation. The fixed payments of rentals by 2011, after the termination of the Lufussa I and Elcosa contracts, are estimated at US$54 million in the base case (40 percent of total fixed costs), using a high-capacity charge of US$18/kW/month, which can be reduced in a competitive procurement. By 2013, once new thermal and hydroelectric plants are commissioned and the rental contracts
5176-CH08.pdf 59 5/19/10 1:12 PM
HONDURAS: POWER SECTOR ISSUES AND OPTIONS
60
are terminated, the cost of fuel and the fi xed payments under existing contracts are reduced by almost 50 percent (Figure 8.2).
The reduction in the cost of purchases with the retirement of expensive generation and the commissioning of lower-cost generation plants beginning in 2011 have a substantial impact on the average energy purchase costs. For the base case, the average cost is reduced from about US$95/MWh during 2007 to 2010 to about US$87/MWh by 2011 and to US$75/MWh by 2013. A comparison of the average cost in the three scenarios shows signifi cant differences in 2007 to 2012 (about US$7/MWh between low and high) when expensive emergency is used in the margin to meet any increase in demand,
to minor differences by 2013 when new low-cost generation is commissioned to meet expected demand in each case (see Figure 8.3).
ENEE’s Investment ProgramENEE’s investment program for 2007 to 2015 is front loaded with a backlog of transmission and subtransmission works that could not be implemented in the past due to fi nancial constraints, investments in a loss-reduction program, and proposed investments to improve ENEE’s information and management systems. It also includes the implementation of the Inter-American Development Bank’s (IDB’s) energy investment loan (see Table 8.1). About
Figure 8.1 Monthly Energy Balance, 2007–2015, Base Case
1200
Small renewable
New large hdyro
Existing thermal
New thermal
1000
800
600G
Wh
year
Jan-
07
Jan-
08
Jan-
09
Jan-
10
Jan-
11
Jan-
12
Jan-
13
Jan-
14
Jan-
15
400
200
0
Figure 8.2 Fuel Costs and Fixed Costs, Thermal Contracts, Base Case, 2007–2014
70 percent of the US$630 million investment program corresponds to the strengthening of the high-voltage transmission and subtransmission grids and the rehabilitation and expansion of the distribution networks. This is a very ambitious investment program and represents an increase in ENEE’s average annual investments from US$21 million (2001 to 2005) to US$70 million.
The investment program does not include investments in rural electrifi cation (on grid or off grid), which may amount to more than US$200 million during the period. It was assumed that rural electrification will be financed by grants and soft loans taken by the government, government contributions, and contributions of the communities to cover connection costs.
Figure 8.3 Average Energy Purchase Cost
105
100
95
90
US
$ M
Wh
year
85
80
75
70
65
602007 2008 2009
Base case
Low case
High case
2010 2011 2012 2013 2014 2015
Total 2007 2008 2009 2010 2011 2012 2013 2014 2015
Table 8.2 shows the investment program for transmission and subtransmission works, with details about projects with investment over US$10 million. We note the following:
• Almost all the large projects are components of the 230 kV transmission expansion plan to (i) improve the quality and reliability of supply to the north and eastern regions now served by 69 kilovolts (kV) and 138 kV lines, respectively, and to facilitate the connection to the grid of hydroelectric projects in the Patuca basin: Amarateca substation, Amarateca-Juticalpa-Reguleto-El Progreso transmission lines; and (ii) improve the quality and reliability of supply to the distribution networks in Tegucigalpa and San Pedro Sula: expansion of Tocontín Substation, new San Pedro Sula Sur substation, and Rio Lindo-San Pedro Sula Sur transmission lines.
• Some urgent substransmission works (at a cost of about US$40 million) were awarded using a three-year build-own-transfer (BOT) fi nancing scheme.
Financial ProjectionsThe main critical drivers of ENEE’s fi nancial performance, which are under the control of ENEE or the government, are electricity losses and electricity prices. The three basic demand scenarios described in Chapter 3 consider different corrective actions on the key drivers: the high case corresponds to a business-as-usual scenario, the base case corresponds to a scenario where moderate results are achieved, and the low case corresponds to a scenario where substantial actions are taken and substantial improvements are achieved.
The average electricity tariff was adjusted according to the underlying assumptions made in each scenario, (fi xed in nominal terms for the high case, fi xed in real terms for the base case, and 15 percent increase in real terms for the low scenario), until the average tariff reached the level of effi cient costs (US$126/MWh or Lps.2.4/kWh). Therefore, the cost of ineffi ciencies (high losses and high generation costs) are not passed through to consumers.
Lines and substations Total 2007 2008 2009 2010 2011 2012 2013 2014 2015
BOT 39.8 11.4 16.0 12.5
Expansion Tocontin I & II 15.1 13.0 0.8 1.3
Amarateca substation 16.9 16.9
San Pedro Sula Sur substation
12.3 1.2 4.4 6.6
Line Rio Lindo-SSS 230 kV 10.3 4.1 6.2
La Entrada substation 11.0 4.4 6.6
Line Amarateca-Juticalpa 230 kV
39.8 15.9 23.9
Line Juticalpa-Reguleto 230 kV
30.4 12.2 18.3
Line El Progreso-Reguleto 53.5 21.4 32.1
Line Tocontin-Danli 138 kV 14.8 5.9 8.9
Other works 95.7 0.5 38.9 21.7 15.5 3.8 5.4 8.1 1.3 0.6
Total lines and substations 339.7 11.9 118.5 92.3 29.6 3.8 11.3 38.3 33.3 0.6
Table 8.2 Transmission Lines and Substations Investment Program (000 US$)
5176-CH08.pdf 62 5/19/10 1:12 PM
63
Ensuring Financial Sustainability
The analysis of the financial projections for the three scenarios was divided in two distinctive periods: 2007–10, when the energy purchase costs are high; and 2011 to 2015, when these costs decrease with the commissioning of new low-cost generation. The results for 2007 to 2010, summarized Table 8.3, show that:
a. The business-as-usual (high case) scenario is not sustainable. Financial losses will continue to grow from Lps.2,405 million (US$126 million) in 2006 to Lps.4,407 million (US$232 million) in 2010. Likewise, the cash-fl ow defi cit will increase from US$91 million in 2006 to US$2005 million in 2010.
b. The scenario of gradual improvements in tariffs and losses (base case) reduces the financial losses and cash-flow deficit by 2010 to US$89 million and US$61 million, respectively, but the defi cit is not manageable taking into account that the financial projections are based on the assumption that about US$300 million in transmission and
Real Projected
Scenario 2006 2007 2008 2009 2010
Electricity losses (%)
HighBaseLow
25.2%25.2%25.2%
25.5%25.2%23.0%
25.8%23.8%20.7%
26.1%23.1%18.5%
26.4%22.6%16.2%
Average tariff (Lps/kWh)
HighBaseLow
2.002.002.00
2.002.072.18
2.002.152.37
2.002.222.40
2.002.282.40
Revenues (Mlps)HighBaseLow
9,1339,1339,133
9,79210,20110,853
10,61411,575
12,954
11,37312,86614,223
12,15414,191
15,355
Generation costs (Mlps)
HighBaseLow
7,9857,9857,985
8,6138,5798,378
9,8429,512
9,034
11,18010,5419,728
12,30711,545
10,386
EBITDA (Mlps)HighBaseLow
–67–67–67
–41314
841
–932321
2,125
–1,556516
2,633
–1,738982
3,258
Profi t (losses) (Mlps)
HighBaseLow
–2,405–2,405–2,405
–2,454–2,028–1,200
–3,258–2,005
–201
–4,117–2,044
73
–4,407–1,687
589
Cash fl ow surplus (defi cit) (Mlps)
HighBaseLow
–1,737–1,737–1,737
–1,224–854
–116
–1,790–5621,216
–3,285–1,221
938
–3,905–1,1681,158
Source: Authors’ calculations, 2007.
Table 8.3 ENEE’s Financial Projections, 2007–2010
distribution investments can be fi nanced 100 percent, a dubious proposition. This scenario assumes that electricity tariffs will be adjusted in nominal terms to the pace of the projected inflation, resulting in a 14 percent nominal increase by 2010. In this case, a reduction of 2.6 percentage points by 2010 in electricity losses is not good enough to solve the fi nancial crisis.
c. The scenario of major improvements (low case) produces a cash-fl ow surplus by 2008, which increases to US$66 million by 2010. The combination of a drop of 9 percentage points in electricity losses by 2010 and a 20 percent increase in the average tariff in nominal terms quickly improves ENEE’s fi nancial situation.
The results of the fi nancial projections for 2011 to 2015 for the base and low case scenarios (see summary in Table 8.4) show that increasing the average tariff to the level of effi cient reference costs of Lps.2.4/kWh produces large cash-fl ow
5176-CH08.pdf 63 5/19/10 1:12 PM
HONDURAS: POWER SECTOR ISSUES AND OPTIONS
64
surpluses by 2015, when the electricity losses have been reduced to 19.7 percent and 12 percent, respectively, and the average generation cost is reduced to about US$15/MWh with respect to the cost for 2009, as a result of the commissioning of lower-cost generation. This indicates that the current reference costs may be high once lower-cost generation plants are commissioned.
Some basic conclusions can be reached from the analysis of the fi nancial results:
• Substantial improvements in electricity losses and electricity tariffs are required (low case scenario) to reverse ENEE fi nancial losses for 2007 to 2010. Gradual improvements in losses and tariffs (base-case scenario) would reduce fi nancial losses but would accumulate a cash-flow deficit during this period of about US$200 million, in addition to any shortfalls in mobilizing about US$300 million fi nancing for transmission and distribution investments during that period.
• Substantial improvements in electricity losses (low case), but with no tariff adjustments, would produce a cash-fl ow defi cit of about US$236 million during 2007 to 2010 and will not resolve the fi nancial crisis.
• Under the scenario of gradual improvements (base case), ENEE’s fi nancial position could
be reversed only as of 2012, once cost-refl ective electricity tariffs are applied, some expensive contracts expire, and new low-cost generation can be commissioned. In the meantime, for about fi ve years, a cash-fl ow defi cit of more than US$200 million will accumulate. It is diffi cult to argue that this is a transitory fi nancial problem that can be addressed with fi nancial measures (postpone the payment of short-term obligations and fi nance the shortfall).
• It would be necessary to revise and eventually reduce the investment program to more realistic levels.
The fi nancial crisis is not a problem caused by a juncture of high oil prices and expensive thermal contracts. These adverse conditions only made evident a structural problem of poor performance and governance of ENEE, electricity tariffs that do not cover effi cient costs, underinvestment in transmission and distribution, and contracting expensive emergency generation because of cumbersome and protracted bidding procedures that delayed the contracting of new power supply. This fi nancial crisis comes at a critical moment when the national budget does not have fi scal space to provide fi nancial support to ENEE and the
Scenario 2011 2012 2013 2014 2015
Electricity losses (%)
BaseLow
22.1%14.0%
21.5%13.0%
20.9%12.0%
20.3%12.0%
19.7%12.0%
Average tariff (Lps/kWh)
BaseLow
2.342.40
2.392.40
2.402.40
2.402.40
2.402.40
Revenues (Mlps)BaseLow
15,57716,534
17,04617,668
18,30118,861
19,53320,011
20,82221,213
Generation costs (Mlps)
BaseLow
11,90410,493
12,06110,566
11,37310,389
11,65810,494
12,21711,354
EBITDA (Mlps)BaseLow
1,9134,243
3,1235,215
4,9716,494
5,8227,446
6,4527,691
Profi t (losses) (Mlps)BaseLow
–6721,658
5262,619
2,3273,850
3,1474,771
3,8115,050
Cash fl ow surplus (defi cit) (Mlps)
BaseLow
3352,710
1,3753,512
3,1584,702
3,9985,643
4,6525,909
Source: Authors’ calculations, 2007.
Table 8.4 ENEE’s Financial Projections, 2011–2015
5176-CH08.pdf 64 5/19/10 1:12 PM
65
Ensuring Financial Sustainability
hydroelectric rent is not suffi cient to compensate for the high costs of energy purchased by ENEE under PPAs.
ENEE proposed a short-term plan29 to improve and reverse the critical financial situation, with the following main actions:
a. Implementing a loss-reduction program comprising: a short-term investment of about US$30 million, approval of a new law to penalize electricity fraud and theft, and formation of several fi eld teams responsible for controlling losses;
b. Renegotiating the existing PPAs with thermal generators to reduce the cost of energy purchases by 15 percent;
c. Resuming a monthly increase of the tariff adjustment factor in 2007, which would result in an increase of about 8.5 percent of the average tariff (this action has not been supported by the central government);
d. Approving a new law that provides additional incentives for the development of renewable energy;
e. Targeting of the Bono 80; f. Restructuring ENEE in business units and
implementing a program to improve its information and management systems; and
g. Refinancing the short-term debt with generators and local banks.
The results of the fi nancial projections show that the proposed actions (a) and (c), to reduce electricity losses and increase tariffs are both essential to reverse the fi nancial losses, but are not suffi cient. The loss-reduction program had a slow start and may not achieve the short-term improvements that are required.30 The proposed tariff increase does not reach the level of cost recovery and was not approved by the
government. Actions (d), (e), and (f) would not have a short-term impact on fi nancial results of ENEE.
Actions (b) and (g) aim to renegotiate ENNE’s short-term obligations and postpone their payment, but are not suffi cient to resolve the fi nancial crisis if tariffs are not increased. Renegotiations of PPAs usually are based on the principle that the cash fl ow of capacity and energy payments may change to better suit the fi nancial limitations of the buyer, but the present value of the cash fl ow of payments does not change. The new government is renegotiating the PPAs with thermal generators and it has been reported that the capacity charges for 2007 to 2009 could be reduced by about US$20 million per year. This action reduces the cash-flow defi cit but cannot substitute for a tariff increase. It is important to note that an extension of the contract of Lufussa I and Elcosa (keeping the same prices) to compensate for the reduction in capacity charges will increase the cost of energy purchases after 2010 and would reduce the space for commissioning lower-cost generation by 2012.
Two other short-term actions would contribute to reducing the cost of energy purchases:
1. Implementing load management and energy-saving programs to reduce the peak demand and the need for expensive generation rentals.
2. Studying options to reduce the cost of generation rentals: multiyear contracts and international tendering to promote competition. A reduction of 30 percent in the capacity charge of US$18/kW/month would represent annual savings of US$16 million.
29 “Plan de acción para la recuperación del sector eléctrico 2007–2015,” ENEE, diciembre de 2006.30 There are delays in providing transportation and other equipment to the task force responsible for detecting and correcting illegal connections and fraud. The targets established in the low case seem to be too optimistic if the current arrangements are not improved. The base case scenario seems more likely.
5176-CH08.pdf 65 5/19/10 1:12 PM
5176-CH08.pdf 66 5/19/10 1:12 PM
67
This chapter: (a) evaluates the electrifi cation policies, including the related institutional framework; (b) identifi es investment needs in rural areas and the appropriate incentives for encouraging alternative energy programs; and (c) analyzes policy options for improving tariff design and subsidy targeting mechanisms for rural electrifi cation.
Assessment of Electrifi cation PoliciesThe National Social Electrifi cation Plan (Plan Nacional de Electrifi cación Social, PLANES) was designed and structured using comprehensive data on Honduras’s rural areas, in which customer consumption patterns and service needs were identified. However, the grid extension model applied by Social Fund for Electricity Development (Fondo Social de Desarrollo Eléctrico, FOSODE) under PLANES, while effective in extending coverage by conventional means—mainly grid extension—has performed poorly in the application of decentralized options. Decentralized electrifi cation projects were partially studied within PLANES to extend service to 25 isolated communities by means of diesel generators, but other technologies, such as photovoltaic (PV) systems or micro/small hydroelectric stations, which could be more effi cient and profi table because they do not depend on fossil-fuel consumption, were left aside.
The existence of a weak institutional framework for the electricity sector affects the quality and effi ciency of rural electrifi cation
Improving Electricity Coverage9
efforts. The main problem in this fi eld is that Honduras does not have an integrated policy for rural electrifi cation. This is evidenced by the fact that, while FOSODE has the resources to implement grid extension projects selected under the PLANES methodology, the Honduran Ministry of Natural Resources and the Environment (Secretaría de Recursos Naturales y Ambiente, SERNA) is in parallel promoting some renewable energy projects even though it does not have a mandate on electrifi cation.
The existence of two entities promoting electrification programs—FOSODE and SERNA—undermines the legitimacy of the efforts and diminishes the credibility of social electrification programs by weakening the institutional framework and the incentives to attract other players, such as private investors, communities, and nongovernmental organizations. Moreover, there are other issues that are challenging the ability to promote social electrifi cation: (a) lack of political will to enforce prices that strictly refl ect the actual cost of service (even accepting that cross- but explicit subsidies available to the neediest are reasonable); (b) the state as the only service provider in rural areas in practice; (c) weak governmental structure in the sector, without ministerial presence; and (d) delays in the implementation of flexible environmental standards.
The crit icism of Honduras’s social electrifi cation programs is attributable to the fact that a specifi c or detailed model of how to carry out electrifi cation with non-conventional options was never designed. What existed instead was, on one hand, an articulated proliferation of grid
5176-CH09.pdf 67 5/19/10 1:12 PM
HONDURAS: POWER SECTOR ISSUES AND OPTIONS
68
extension projects carried out under PLANES and, on the other hand, an unarticulated promotion of renewable energy, which lacked planning or coordination by a government agency with clear functions and objectives to undertake an electrifi cation strategy.
This policy gap over the past 10 years, and the absence of adequate rural electrification models, has encouraged the emergence of proposals that tend to deepen a delivery model that is dependent on the state and, in particular, on the Empresa Nacional de Energía Eléctrica (ENEE). The fact that ENEE has dominated the electrifi cation programs has led to public and community skepticism regarding the possibility of a stronger participation of private and nongovernmental players. The thesis proposed in this report is that social electrifi cation projects in Honduras, mostly grid extensions, have been carried out without a clearly defi ned program that articulates, among other processes, the decentralization at a local level, the involvement of municipalities and the private sector, and the use of various alternative energy supply methods, which could optimize the use of local resources.
Corrective measures that could be implemented in the short term include: (a) strengthening SERNA as the de facto energy ministry in the capacity of developing strategy, planning, and policy formulations in rural electrifi cation; and (b) strengthening the technical capacity of FOSODE with the necessary training in electrification options based on stand-alone technology, renewable energy, and the development of business models that use alternative energy options.
In the long term, it is recommended that FOSODE be transformed into an autonomous, unified fund through which all current electrifi cation efforts can be promoted, both for grid extension and stand-alone systems. FOSODE’s successful experience with grid extension, and its serious and practical track record as an implementer, suggest that it could transform into an autonomous organization with clear policies and transparent rules for project selection based on cost-benefi t criteria, using rational and realistic fi nancing mechanisms.
Identifying Investment NeedsIn electrifi cation projects, the more remote and dispersed the community, the more diffi cult and expensive the extension of access. The paradox in these cases is that these isolated communities are generally the poorest ones and, consequently, have a lower payment capacity, requiring signifi cant subsidization.
As mentioned in Chapter 6, only 44.8 percent of households in rural areas are currently electrifi ed. It is estimated that in those areas there are approximately 416,879 unserved households (over 2.1 million people).
Rural areas in Honduras are the regions with the most acute need for investment in electricity infrastructure. These areas are typically very poor with many unmet basic needs and surviving on subsistence agriculture. Consequently, infrastructure needs mostly relate to subsistence energy supply.
The electrifi cation process of households in isolated regions of Honduras can take two forms. One consists of electrifying isolated rural areas by connecting them to the national or regional grid, thus integrating them into Honduras’s national interconnected system. The other form of electrification consists of providing rural areas with stand-alone energy solutions when connecting to the grids is not a viable option due to either technical or economic restrictions associated with their geographic location.
When electrification using stand-alone solutions is considered, the options are to use conventional sources of energy (basically, hydroelectric mini-stations or diesel plants), or to select alternative, nonconventional energy sources (for example, wind, solar, biomass). As will be seen in the renewable energy chapter of this report, the adoption of solutions based on nonconventional sources has been rare in Honduras.
To evaluate investment needs in rural areas, three types of scenarios were examined:
1. Investment needs were simulated to enable increasing service provision with conventional diesel systems. This was applied to a set of projects identifi ed within
5176-CH09.pdf 68 5/19/10 1:12 PM
69
Improving Electricity Coverage
the PLANES and to different departments, considering different prices for diesel fuel and investment and operation costs of the equipment. To that end, data available from ENEE were used.
2. Assuming that the population that is currently not being reached by some type of service provision scheme is made up of dispersed households, a simulation was made of what it would cost to provide electricity by building microhydro facilities, assuming that a certain percentage of the areas meet the conditions to benefi t from this type of technology.
3. Assuming once again that the population that is currently not being served by some type of service provision scheme is made up of dispersed households, a simulation was made of what it would cost to install a 20 windpower (Wp) or 50 Wp photovoltaic panel in each of those houses.
For each case, the costs were added up to come up with the net present value of investments (total amount in 2006 U.S. dollars) that would be necessary to increase coverage by 10 percent, 25 percent, 50 percent, and 100 percent
in rural areas. The annuities for some of these options were also estimated, considering the fi nancial restriction reported by FOSODE. The results of those analyses are reported in Annex 9, Table A9-1 and briefl y discussed here.
It should be noted that the estimated investments correspond with several of the many possible combinations, and the analysis has omitted the intertemporal needs of fi nancing the investments. In other words, although the estimates indicate how much it would cost to improve service and extend coverage today, this does not mean to imply that the investments should all be made in the same time period.
Table 9.1 compares the unit connection cost of each technology and shows that: (a) grid extension is not necessarily the most cost-efficient option; (b) the microhydro plants are quite expensive and should be used only when the local water resources are available and when preinvestment studies have been done to show it is the least-cost option for the local communities; and (c) solar home systems (SHS) stand out as an attractive option in terms of cost. Nonetheless, it is important to note that the business model used for delivering the SHS is critically important, with the particular
Technology Unit Cost per Connection Remarks
Grid Extensiona
US$400 Average cost in the past 10 years by FOSODE
US$700 Projected for the future without investments in subtransmission
US$1,000 Projected for the future with investments in subtransmission
Isolated Diesel Plantb
US$950 Operating 6 hours per day
US$1,900 Operating 12 hours per day
US$3,800 Operating 24 hours per day
Microhydro
US$2,700 Excl. productive uses, program costs of US$400,000
US$3,300 Excl. productive uses, program costs of US$500,000
SHS (PV technology)
US$400–500 Installing 20 Wp solar PV panels
US$600–750 Installing 50 Wp solar PV panels
Source: Authors’ calculations, 2007.a This does not include the marginal cost of supply of electricity, which is currently calculated by ENEE as US$79/MWh for 2006 to 2010.b The costs include capital costs, diesel, and operation and maintenance costs over the 15 years of the expected system lifetime.
Table 9.1 Cost of Initial Investment per Connection Using Different Technologies
5176-CH09.pdf 69 5/19/10 1:12 PM
HONDURAS: POWER SECTOR ISSUES AND OPTIONS
70
challenge of providing technical support and service in rural communities, as experiences in Honduras and other countries showed.
According to the simulations, the most economic option to meet the government’s goal of 400,000 new connections by 2015 would be installing in 50 percent of the targeted households (80,000) SHS of 20 Wp at an approximate program cost of US$400, and installing in the other 50 percent SHS of 50 Wp at an approximate program cost of US$600. This combination would have a net present value of US$200 million, much lower than the cost of grid extensions. This economic SHS option would require annual disbursements from the government of approximately US$22 million in its initial years, well above the US$16 million that were programmed under PLANES.
If the government’s intention is to invest around US$16 million per year (according to PLANES), none of the annuities from the different options presented in Table A9-4 provide a viable scenario. In other words, more fi nancing sources will defi nitely be required to meet the target of 80 percent electrification by 2015. However, the annuities presented in Table A9-4 provide fl exibility in terms of making different combinations of electrifi cation programs with different technologies.
Furthermore, the state need not be the one that fi nances all the investments. Investments can be implemented with funds from various sources, and they can even be partially fi nanced by the benefi ciaries themselves, provided that their payment capacity is considered.
Finally, the problem with energy service provision for rural areas is not strictly fi nancial in nature, considering that the mere injection of funding in and of itself—without changing the current structure—would not suffi ce to improve service delivery. This funding defi cit aggravates the other defi ciencies associated with the lack of parties responsible for the service and the scarcity of technical and administrative skills.
Although communities have taken part in service provision on prior occasions, a general framework is required to stimulate their participation, such as support and training, in order to adapt the relevant organizations, and
with the additional benefi t of creating a source of employment for the communities.
Therefore, one of the major challenges faced by the Honduran government is to design service provision business models for the electrifi cation of isolated rural areas that are distinct from grid extension projects. There are currently multiple technologies available for stand-alone systems that are more economical and fl exible in meeting demand than grid extensions, and there are positive international experiences reported with the different business models.
Nevertheless, certain obstacles must be surmounted in order to enable the introduction of electrifi cation projects based on alternative technologies and different business models.
The fi rst such obstacle has to do with the fact that there is currently no institutional mechanism for subsidy allocation to off-grid renewable energy projects.
The second obstacle is that due to the technical characteristics and the different types of ownership of service provision in rural areas, it is necessary to adapt the existing regulations to the different types of renewable energy business models. The process is not a simple one and, on occasion, it requires delegating responsibility, control, and oversight tasks to specialized organizations. This issue will be discussed thoroughly in the next chapter.
Finally, it is essential to work on the technical training of FOSODE personnel so that in the short term electrifi cation projects can be undertaken in communities that cannot connect to the grid. Lack of the necessary knowledge and skills for off-grid electrifi cation technologies, and the inadequate business models, are some of the major barriers to implementing these projects.
Analysis of Tariffs and Subsidies—Recommendations for a Sustainable SchemeThis chapter presents the results of the tariff analysis and of the subsidy mechanism related to electrification that are currently used by Honduras. Considering that a thorough tariff analysis was carried out in Chapter 5, in the
5176-CH09.pdf 70 5/19/10 1:12 PM
71
Improving Electricity Coverage
fi rst part of this section, a brief evaluation is made of the subsidy disbursement mechanism, emphasizing the amounts disbursed as subsidies and the number of beneficiaries, and also verifying that the subsidy recipients are really from the neediest sectors of the population. In a second part, policy options with tariffs and subsidies are evaluated, an analysis is made of how the government’s direct subsidy can be refocused, and how the new connections that are planned to be carried out under the PLANES will impact ENEE’s fi nances.
Subsidies: Benefi ciaries and RecipientsIn contradiction to the provisions set out in the Electricity Law, currently tariffs have been set at levels much lower than the requested level in order to cover at least part of the service costs. Hence, a generalized subsidy for all residential customers is currently being applied (rather than a stepped rate), leading to many nonpoor customers getting subsidies. Table 9.2 summarizes the number of poor and nonpoor households that benefi t from the cross-subsidies and the direct subsidies provided by the government.
It is possible to derive from Table 9.2 the error of exclusion (percentage of poor households that benefi t from the subsidies), which is equivalent to 58 percent, and the error of inclusion (non-poor benefi ting from the subsidies over total subsidy benefi ciaries), which is equivalent to 52 percent. These high levels indicate that electricity subsidies in Honduras are highly mistargeted.
Because in Honduras a signifi cant percentage of the population is without access to the grid in the lowest-income deciles, subsidizing consumption is not the most equitable solution. A more sensible alternative would include
subsidizing access, a proposal that should be considered in the government’s electrifi cation strategy. However, no information was available about subsidies to connection, which is FOSODE’s current practice. Hence, it is necessary to evaluate how the subsidy level is determined on a connection-by-connection basis.
Policy Options with Tariffs and SubsidiesIt is possible to design different policy alternatives that permit refocusing the subsidy or achieving a higher cost recovery for ENEE through tariff increases. A summary of those options is presented in the matrix shown in Table A8.14, which combines different policy alternatives dealing with tariff or direct subsidy modifi cations, thus freeing up resources that could be used to promote other electrifi cation activities.
This kind of analysis is useful for policy-making purposes. For example, looking at the analyses illustrated in Table A8.14, a policy option is to increase residential tariffs by 20 percent and reduce direct subsidies by 10 percent. Under this option, the average tariff for residential customers with consumption levels between 0 kWh and 20 kWh would move from recovering 16 percent of the service cost to 32 percent; for those with consumption levels of between 101 kWh and 150 kWh, the average tariff would increase cost recovery from 32 percent to 66 percent; for those with consumption levels of between 151 kWh and 300 kWh, from 47 percent to 74 percent; and for those with consumption levels greater than 501 kWh the average tariff would be almost at par with the service cost (98.5 percent).
Although residential customers will continue to be heavily subsidized, this pricing policy
Households Subsidies Benefi ciaries Nonbenefi ciaries Total
Poor 384,159 525,523 909,682
Nonpoor 421,182 185,362 606,544
Total 805,341 710,885 1,516,226Source: Authors’ calculations, 2007.
Table 9.2 Households Benefi ting from Subsidies
5176-CH09.pdf 71 5/19/10 1:12 PM
HONDURAS: POWER SECTOR ISSUES AND OPTIONS
72
option would have signifi cant fi nancial impacts. It would increase ENEE’s revenues from residential tariff collection by US$2.6 million per month and free up about US$1.5 million per year of direct government subsidy that can be employed in alternative electrifi cation investments. To put this in perspective, the overall resources made available by this policy option are suffi cient to fi nance approximately 46,000 additional new connections per year, assuming US$700 per connection, if tariffs were modifi ed and subsidies were better targeted.
If the policy objective is to release the largest amount of resources for alternative electrifi cation uses, then the optimum mix of measures in this case would require increasing tariffs at par with service provision costs, while completely eliminating the government’s subsidy to residential users and redirecting the money to promote connections in remote rural areas. It is necessary, however, to assess the degree of social and political acceptance that such measures would face.
Another policy option would be increasing tariffs by 20 percent and eliminating the government’s direct subsidy, while maintaining cross-subsidies for the residential category. Such a pricing policy would imply freeing up resources amounting to approximately US$3.8 million per month (about 65,000 new connections per year, assuming US$700 per connection). Again, the social and political acceptance of increasing tariffs and eliminating the direct subsidy would need to be evaluated.
For example, Foster and Yepes (2006) studied the burden that these kinds of charges might represent for urban households in Latin America and in Honduras.31 They found that in Bolivia, Honduras, and Nicaragua, utility bills of around US$10 per month already represent a substantial burden for 30 to 50 percent of urban households.
However, when the same exercise is repeated in public/private partnership (PPP) terms for Honduras, utility bills in the range US$10 to US$15 per month appear to be affordable to a greater percentage of the population, while less than 14 percent of the population would appear to face genuine problems of affordability at any of the levels considered.
An additional issue that needs to be considered is the impact that the new connections, planned under the PLANES, will have on ENEE’s fi nances. The fi nancial burden on ENEE will increase substantially, as will the amount of direct subsidy that the government will have to provide, if it is assumed that the adjusted tariff and direct subsidy are kept as they are today, and that all 400,000 new connections planned under the PLANES are of poor customers with an average monthly consumption in between 51 kWh and 100 kWh. If approximately 45,000 new connections are made per year until 2015, (in order to meet the target set under the PLANES), and each new customer has an average monthly consumption of 65 kWh,32 then the estimated annual tariff defi cit caused by the new connections is US$3.5 million. In turn, the additional direct subsidy needed per year from the government would be approximately US$619,000. The estimated annual tariff defi cit caused by the new and existing connections in 2015 could reach US$41.1 million, while the amount of the direct subsidy, to keep the status quo, will be US$7.1 million.
Targeting Subsidies and Improving Tariff Design: SummaryA key issue in tariff design is the trade-off that exists between the economic criterion of allocation efficiency and the political considerations relating to tariff acceptance by the public. This issue can be particularly complex with some specifi c social sectors. The analysis presented in Annex 9 shows that the status quo is not 31 Foster and Yepes estimated the percentage of the urban
population within each Latin American country that would need to spend more than 5 percent of their income to purchase a subsistence block of water or electricity at different cost levels in current U.S. dollars. For greater detail, see V. Foster and T. Yepes, “Is Cost Recovery a Feasible Objective for Water and Electricity? The Latin American Experience,” World Bank Policy Research Working Paper 3943, June 2006.
32 In the PLANES, annual average consumption rates are presented for different departments. The national annual average consumption rate was estimated using an average of the different consumption rates per department, reaching approximately 777 kWh (approx 65 kWh/month).
5176-CH09.pdf 72 5/19/10 1:12 PM
73
Improving Electricity Coverage
fi nancially sustainable for ENEE, that there are different options to improve tariff design and subsidy targeting, and that fi nancial resources currently focused ineffi ciently can be liberalized and directed to the neediest. However, these policy options are dependent on the political will of the government and the social acceptance of the public.
The governance structure of marginal urban and rural areas, and the informal relations that characterize these settings, make it diffi cult to reach the desired benefi ciaries. For example, different experiences in other countries have shown that, frequently, subsidies collected by the utilities through tariffs paid by existing customers were channeled to the benefi t of other customers who were not in need or, in the worst cases, to the utility’s own benefi t. In other cases, the subsidies provided to residents in marginal urban areas frequently ended up in the hands of illegal service providers.
Hence, one of the major challenges to providing subsidies lies in minimizing errors
of inclusion; that is, minimizing the proportion of subsidy recipients who are not the intended customers. Thus, how to transfer subsidies becomes a truly relevant policy-making challenge for the government authorities in Honduras. Further analytical work on subsidy delivery mechanisms will have to be done, and revision of alternative experiences with, for example, cash payments/transfers should also be evaluated.
In turn, when designing lifeline tariffs, the main challenge is to arrive at the appropriate level of consumption to be subsidized, if inclusion and exclusion errors are to be minimized and perverse incentives are to be avoided. Some mechanisms, such as effective metering systems, like the prepaid meters, can be used to minimize exclusion errors, that is, the proportion of intended subsidy recipients who do not actually get the benefi ts. However, exclusion errors may still appear if there is diffi culty in accommodating household size in setting the tariff, something that can easily happen in slums.
5176-CH09.pdf 73 5/19/10 1:12 PM
5176-CH09.pdf 74 5/19/10 1:12 PM
75
The diversification of energy sources is a key element of the energy strategy to reduce the volatility of generation prices, reduce dependency on imported fuel, and improve energy security. The experience in Honduras shows that reliance on a single source of energy to meet energy demand (for example, hydroelectric generation or oil-based thermal generation) increases the vulnerability of energy supply, either to energy shortages during drought conditions or to the volatility of oil prices. Reliance on a single source of supply—a large generation project, energy imports from one country—is also a risky strategy because energy supply is vulnerable to disruptions in the source of supply.
Diversifi cation of energy sources usually comes at an additional cost. It may be that a single source of energy or a source of supply is cheaper than other sources, and that the use of other sources to diversify supply increases costs. The additional costs should be compensated by the benefi ts of increased security or reduced vulnerability.
Fortunately, the diversifi cation of energy sources in Honduras under current conditions may contribute to reducing generation costs. The results of the generation expansion plans (Chapter 3) show that diversifi cation based on the development of hydroelectric resources, renewable power, and coal-fi red generation is consistent with least-cost generation expansion.
Diversifying Energy Sources10
It is the right moment to promote a diversifi cation policy because of the following:
• A long-term scenario of high international oil prices is likely.
• Oil-fired thermal generation is no longer competitive under a high oil price scenario.
• About 120 MW in expensive power purchase agreement (PPAs) with thermal plants will expire in 2010.
• There is a substantial potential of untapped hydroelectric and small renewable resources.
• The Sistema de Interconexión Eléctrica para América Central (SIEPAC) project will be commissioned in 2009.
• Energy consumption per capita is high.
Moreover, Honduras has many options to diversify energy sources, including:
• Development of indigenous renewable resources, mainly large and medium hydro, minihydro, windpower, and biomass, which can be economically competitive.
• Development of coal-fired or gas-fired thermal generation based on imported fuels.
• Expanding electricity trade with the regional energy market.
• Promoting energy efficiency and load management programs. More effi cient and better use of energy is a diversification option that reduces the need to expand energy supply.
5176-CH10.pdf 75 5/19/10 1:14 PM
HONDURAS: POWER SECTOR ISSUES AND OPTIONS
76
Development of Large- and Medium-sized Capital-intensive ProjectsThe indicative least-cost generation expansion plans for the three demand scenarios are dominated by coal-fi red plants and hydroelectric projects, capital-intensive projects that increase market, and project risks for private developers. Hence, the scenarios represent a policy challenge in terms of how to create the right incentives and conditions to mobilize private investment to fi nance these projects. This chapter discusses these issues.
Hydroelectric ProjectsThe development of hydroelectric projects in Honduras faces the following diffi culties:
a. The lower Patuca river basin is a protected area in the Mesoamerican Biological Corridor. In the past, initiatives to develop the Patuca 2 project were unsuccessful due to the opposition of international environmental groups and nongovernmental organizations. The development of the Cangrejal project also has had strong opposition from environmental groups for other reasons. Therefore, the development of the Patuca River basin requires careful consideration of the environmental impact in the downstream area and a complex process of public consultation with native populations and local communities, which have substantial political clout (international support).
b. Several licenses and permits should be obtained to develop a hydroelectric project, in addition to a long-term supply agreement: environmental license, water rights contract, and operation contract, which have to be approved by the National Congress (except for the environmental license). The operation contract adds complexity and uncertainty because it duplicates part of the PPA and gives to the government the right to terminate in advance the contract and the intervention of the project for reasons of
national interest (provisions to guarantee an essential public service).
c. The hydroelectric projects in the Patuca River basin are located in the northeast part of the country, a region with weak interconnections to the load centers in Tegucugalpa and San Pedro Sula. The US$40 million Amarateca-Juticalpa 230 kilovolt (kV) transmission line is needed to interconnect the Patuca 2 and 3 projects to the load center. However, the full cost of this transmission line should not be charged to the generation projects, because this line is necessary to attend the demand growth of the northeast region and has been included in the transmission expansion plans.
The development of hydroelectric projects by the private sector under nonrecourse project fi nance schemes has faced diffi culties. The arrangements whereby all risks are ring-fenced by contracts is expensive, because each shareholder should make a generous provision for risks that are expensive to manage if they are not pooled. Thus, it makes sense that the public sector assumes the risks that cannot be managed effi ciently by the private sector. In this case, a public/private partnership is necessary and justifi able to mobilize private participation.
Coal-fi red and Gas-fi red Thermal PlantsA coal-fi red generation plant is very attractive as a baseload plant to meet projected demand in the 2010s. The levelized generation costs are in the range of US$56/megawatt-hour (MWh) to US$70/MWh depending of the investment costs and the technology. At the higher cost range a combined cycle gas turbine (CCGT) plant using imported liquefi ed natural gas (LNG) becomes competitive.
Coal-fi red plants are an interesting option to diversify energy sources in Honduras and help reduce generation costs and price volatility. Although these plants do not reduce the dependency on imported fuels, they can
5176-CH10.pdf 76 5/19/10 1:14 PM
77
Diversifying Energy Sources
GHG emissions than any other thermal plant: 100 percent more than gas-fi red CCGT and 35 percent more than medium-speed diesel using heavy fuel oil (see Table 10.1).
Coal-fi red plants also require adequate port facilities to unload, store, and handle the coal. Preliminary information indicates that the Port of Castilla in the Trujillo Bay on the Atlantic coast may be used to import coal from nearby Colombia. It is estimated that a 600 MW plant will require about 120,000 tons per month. A feasibility study is necessary to evaluate the port conditions, the investment and operation costs of the port and fuel-handling facilities, and the power transmission lines required to connect the plant to the 230 kV transmission grid at Reguleto, if the Amarateca-Juticalpa-Reguleto transmission line is developed.
A gas-fired CCGT option, which has the advantage of using a clean fuel with low environmental impact, poses other problems. The idea of a gas pipeline interconnection project from Venezuela/Colombia or from Mexico to Central America was studied in the 1990s and will be studied in more detail in 2007 under the Mesoamerican Energy Integration Program. The feasibility of this project is not clear because Mexico is importing gas from the United States and Colombia does not have enough gas reserves. This may be a long-term solution when Venezuela completes the gas pipelines to bring gas from the huge gas reserves of eastern Venezuela to the Colombian border, and the gas demand in Central America is large enough to justify the gas interconnection with Colombia. Other options are being considered to bring natural gas to Central America. The technology to transport compressed natural gas (CNG) by ship may be commercialized in the near future,33 and Colombia and Panama are studying this possibility.
LNG is an option to bring gas to countries in the region, and has the advantage of having limited cross-border issues. The Atlantic basin
33 Sea NG Corporation received authorization in late 2006 to build the fi rst CNG ship, using Coselle containers (coiled pipeline), which may be competitive to transport gas over medium distances from 200 km to 2,000 km.
substantially reduce the oil bill (cost per million British thermal unit [MBTU] is about 25 percent of oil). International coal prices have been stable in the past and have shown a low correlation with oil prices, and could contribute to reducing the volatility of generation prices (see Figure 10.1).
But the combustion of fossil fuels, especially coal, is a major source of air pollution (sulfur oxide
[SOx], nitrogen oxide [NOx], particulate matter [PM], and carbon dioxide [CO2]). SOx and NOx contribute to acid rain and CO2 to greenhouse gases (GHG) and to climate change. The conventional subcritical pulverized-coal steam plants require specialized equipment and good-quality coal to reduce SOx, NOx, and PM emissions within the limits established by environmental regulations: electrostatic precipitators to remove PM, scrubbers for SOx, low NOx burners, and selective catalytic reduction equipment for NOx.
Fluidized bed combustion (FBC) is a well-established clean-coal technology that uses a combustion process that captures more than 90 percent of the sulfur and prevents the formation of 70 to 80 percent of the nitrogen oxides. FBC systems provide a high sulfur-capture rate without degrading thermal effi ciency and also have the ability to use high-ash coals.
However, FBC cannot sequester CO2 emissions, and coal-fi red plants produce more
Figure 10.1 International Fuel Prices
p12
Oil WTI
Gas HenryHub
Steam coal NWE CIF
10
8
6
US
$/M
BTU
year
4
2
0
1989
1990
1991
1992
1993
1994
1995
1996
1997
1998
1999
2000
2001
2002
2003
2004
2005
Source: Authors’ calculations, 2007.
5176-CH10.pdf 77 5/19/10 1:14 PM
HONDURAS: POWER SECTOR ISSUES AND OPTIONS
78
market for LNG in the Americas is dominated by Trinidad and Tobago as the major exporter and the United States as a major importer. Puerto Rico and the Dominican Republic represent about 5 percent of the LNG market in the Americas with imports for power generation. The price of LNG imported in the Americas is driven by the price of pipeline gas, the competing fuel in the United States (supplies about 98 percent of the gas market), which is highly volatile and correlated with oil prices (see Figure 10.1). Therefore, this solution is not very effective in reducing the volatility of power generation in Honduras.
The investment costs of unloading, storage, and regasifi cation facilities for LNG are site specifi c and have substantial economies of scale. A 600 MW CCGT generation plant will require a regasifi cation capacity of about 0.7 million tons of LNG per year, considered to be a small-scale facility with an investment costs of about US$90 million. A CCGT in the Atlantic coast of Honduras will also need a 230 kV transmission line to connect it to the transmission grids. All these problems have to be evaluated at the feasibility level before taking a decision to use the LNG option.
Public/Private Partnerships (PPPs)The role of private participation in the electricity sector in Honduras will be determined not only
by policy decisions and political considerations but also by the investment, project, market, and country risks that the private sector is willing or able to take under specifi c country and project conditions. In countries like Honduras, with a weak regulatory framework and high country risks, the private sector is not willing to take all investment risks of fi nancing, developing, and operating generation projects to sell power in a wholesale power market. In these cases, public/private partnerships (PPPs) have been used to share the investment risks between the public and private sector and to allocate to the private sector the project and country risks it is able to manage.
The development of generation capacity in Honduras by independent power producers under long-term PPAs is a PPP arrangement that allocates to the private sector risks it is willing and able to manage: (a) the local private sector has taken full responsibility for the construction, fi nancing, and operation of diesel generators, an option with low project risks (relatively low investment costs, short preparation and construction periods, and easy deployment and operation); and (b) Empresa Nacional de Energía Eléctrica (ENEE) and the government have taken all the market risks (long-term PPA with fi xed charges that remunerate the investment costs and variable charges that cover real fuel costs) and credit and foreign exchange risks (PPAs with energy prices in U.S. dollars and payments guaranteed by the government).
Fuel
CO2
Emission Factor (Fuel)
a/ tCO
2/TJ Technology
Heat RateTJ/GWh
Effi ciency%
CO2
Emission Factor
(Generation) tC0
2/GWh
Residual fuel oil 77.4 MSD 8.6 42% 666
Residual fuel oil 77.4 ST 10.0 36% 774
Diesel oil 74.1 CCGT 7.8 46% 580
Natural gas 56.1 GT 11.5 31% 644
Natural gas 56.1 CCGT 7.8 46% 439
Coal (Cerrejon) 94.6 AFBC 9.5 38% 896
Source: Authors’ calculations, 2007.
a/ 2006 IPCC Guidelines for National Greenhouse Inventories (default values).
Table 10.1 Thermal Generation GHG Emissions
5176-CH10.pdf 78 5/19/10 1:14 PM
79
Diversifying Energy Sources
This PPP arrangement does not work for the development of hydroelectric projects and large thermoelectric projects that are included in the least-cost generation expansion plan, characterized by high capital costs, long construction and amortization periods, complex environmental issues, and need of additional investments in transmission and/or fuel-handling facilities. It is unlikely that the private sector will be willing to take all the construction and development risks of these projects: completion of feasibility and environmental impact studies, obtaining all the required licenses and permits, completing the required port facilities and transmission expansion, obtaining long-term fi nancing, and so forth.
For these kinds of partnerships to work, they must provide their members with a prospect that allows them to advance their interests. Specifi cally, the results of these kinds of partnership agreements should not be uncertain; they should be predictable to a certain degree of likelihood rather than in a discretionary manner. Experience shows that it is necessary to defi ne ex ante what the rights and obligations of each member of the partnership are. The rights and obligations of public and private players have to be related to the extent of control that each stakeholder has over the factors that give rise to risks. The rationale behind this is that stakeholders should have incentives to mitigate/eliminate the adverse events from which risks emerge.
Hence, what is needed is a PPP arrangement where the public partner supports the completion of feasibility and environmental impact studies; secures timely granting of licenses and permits; supports the process of public consultation, approval, and implementation of the environmental mitigation plan; facilitates resettlement of displaced population; provides payment guarantees and facilitates other financial support mechanisms that reduce the fi nancial costs and ensure required long-term financing; and takes responsibility for implementing the transmission expansion plans to strengthen the 230 kV grid. The private sector will provide its technical, commercial,
and managerial expertise to design, structure, ensure fi nancing for, construct, and operate and maintain generation projects.
Improving Expansion Planning and Energy ProcurementThe generation expansion planning and energy procurement process operates as follows:
a. ENEE prepares an indicative generation expansion plan, submits i t for the consideration of the Comisión Nacional de Energía (CNE), and CNE presents it to the Energy Cabinet for approval.
b. The expansion program is an indicative plan that provides information to investors about future electricity demand growth, and needs and options, to develop a sufficient and effi cient power supply.
c. Project developers can request SERNA to grant exclusive rights to study site-specifi c generation projects for a maximum of two years.
d. ENEE, acting as a single buyer, uses the indicative plan to determine the size and timing of additional generation capacity and the type of plant that is required (peak, baseload, and so forth).
e. ENEE requests proposals to provide required generation capacity using competitive bidding procedures and gives flexibility to bidders for the selection of the location, technology, and fuel for the new generation. The proposals include the transmission works required to connect the plant to the transmission grid, complying with reliability norms.
f. Bidders should submit proposals to supply fi rm capacity.
g. The tender documents require that thermoelectric generation plants are subject to economic dispatch based on merit order of energy price bids.
The expansion planning and procurement procedures for a single-buyer scheme or a wholesale market that allows competition for
5176-CH10.pdf 79 5/19/10 1:14 PM
HONDURAS: POWER SECTOR ISSUES AND OPTIONS
80
the market should guide future government actions (policies and regulations) and provide a signal to investors to induce an efficient allocation of resources. Private investors respond to these signals and to government policies and investment incentives, and take investment decisions based on their strategies and their expectations on rate of return adjusted for risk. Although the existing procedures are reasonable, some improvements are necessary to facilitate the development of large capital-intensive generation projects that help diversify the energy sources:
a. The government units responsible for planning and policy formulation should strengthen its technical and operational capabilities to identify and assess the potential and prepare basic studies for site-specific candidate projects: small hydro, wind, medium, and large hydroelectric projects.
b. The government should formulate and adopt appropriate policies and incentives to develop the generation projects that can contribute effi ciently to the implementation of the diversifi cation policy, including the PPP arrangements discussed above.
c. The generation expansion plans should provide suffi cient information and analysis to guide government policy: for example, need to promote renewable power, assess vulnerability of power supply and actions to manage risks, and options to mobilize private fi nancing. A least-cost solution alone is not very helpful.
d. CNE should establish rules and procedures for energy procurement that promote competition and least-cost generation expansion: sufficient lead time for the preparation of proposals and commissioning of competitive projects; nondiscriminatory and transparent procedures to evaluate different generation technologies; planning in advance of the bidding process to ensure timely commissioning of required capacity; limits on contract duration, long enough to facilitate private financing, but short
enough to promote competition and reduce the risks of stranded costs; and energy pricing schemes and dispatch requirements adequate for the operation of a competitive wholesale power market.
Development of Small Renewable Energy ProjectsThe development of renewable energy generation projects (defi ned as up to 50 MW) has been promoted by Decrees No. 85-98 and 267-98, complementing the Electricity Law of 1994. This law contemplates tax breaks to developers and a secure buyer for energy at attractive prices (ENEE is the default buyer at prices with a premium.). Under this umbrella, private sponsors have negotiated about 30 PPAs with ENEE for small renewable energy plants.
Despite this, the potential for the development of off-grid renewable sources appears to be largely untapped, though a resource base assessment for the different sources is not available. Generation projects based on biomass,34 geothermal,35 and wind36 are at a more advanced stage of development, while little has been done to promote and develop microhydro power37 and the use of photovoltaic (PV) capacity,38 due to the lack of specifi c incentives and policies for off-grid rural electrification programs. Even the new Renewable Bill, which is now before the Congress and is reviewed in Annex 9, fails to emphasize specifi c incentives and mechanisms for off-grid solutions.
A review of the international experience on the development of renewable energy is presented in Annex 9.
34 Nine projects for 81.8 MW are now in operation.35 Three projects for a combined 85.5 MW of installed capacity are at different stages of implementation.36 Wind projects for about 60 MW of installed capacity are currently under study.37 No information on microhydro appears to be available. A project co-fi nanced by IDA, GEF, and the European Union is developing some potential on a pilot basis.38 It is estimated that there are 5,000 PV systems installed in the country. The size of the potential rural market, including households, commercial users (retail stores, restaurants, and so forth), and institutions (schools, clinics, community centers) appears to be very large.
5176-CH10.pdf 80 5/19/10 1:14 PM
81
Diversifying Energy Sources
Expanding Energy Trade with the Regional MarketThe Comisión Regional de Interconexión Eléctrica (CRIE) approved in 2005 the fi nal Rules and Regulations for the Regional Electricity Market that will apply once the SIEPAC project is commissioned in 2009. These regulations confi rmed the basic market design proposed by the consultants in 2003:
• The regional market is the seventh market, independent of the six national markets, that can handle all the market models adopted in the region: single buyer, and competitive wholesale markets with spot markets based on declaration of variable costs or energy price bids.
• The regional market is based on the principle that market agents (generators, distributors, marketers, or large consumers) can trade energy freely, with open access to the regional and national transmission grids, and have the right to install generation plants in any of the national grids.
• Energy trade in the regional market is done in a regional contract market and a regional spot market. The contract market allows fi rm and non-fi rm physical contracts and fi nancial contracts. The spot market is based on hourly price bids for incremental sales and purchases of energy.
• According to the framework treaty for the regional market, a country can authorize a single vertically integrated company to do all energy transactions with the regional market, provided that this company has established independent business units with separate accounts.
The expansion of the capacity for energy trade in the regional market in 2009 represents an opportunity to diversify the energy sources in Honduras and facilitate the development of a competitive wholesale national market: private investors can develop generation projects in Honduras to sell energy to the local and the regional markets, the distribution units can
have the option to buy energy in the regional market, and large consumers in Honduras can have the option to purchase energy from the regional market.
Apparently not all benefi ts of the regional market can be achieved with the existing legal framework in Honduras. The Electricity Law of 1994 grants to ENEE exclusive rights to sign energy import and export contracts (art. 9) and establishes that the local demand should be supplied fi rst with the local generation, and only surplus energy can be exported (art. 13). These rules would limit the potential benefi ts of the regional market: (a) ENEE becomes an intermediary in all international contracts and may have a confl ict of interest when a large consumer wants to buy energy from the regional market, and (b) generators installed in Honduras would not be able to sign fi rm physical contracts to export energy.
However, the government may have the option to clarify, through regulations, the scope of the exclusivity clause and to give it a less restrictive interpretation. Third parties may participate in the regional contract and spot markets, provided that they have signed agreements with the ENEE for the use of the transmission lines and comply with the rules and regulations for the operation and economic dispatch of the national interconnected system. ENEE has exclusive rights for the coordination of international energy trade, in its role of system operator and power market administrator, but is not an intermediary that takes ownership of all energy that is traded with the regional market.
The adoption of policies and regulations in Honduras that promote regional energy trade and competition in the regional market will facilitate the transition from a de facto single-buyer model to a competitive wholesale power market (see Chapter 7). The barriers for regional trade established in the Electricity Law can be reduced substantially in the medium term by taking actions that do not require changes in the law: a less restrictive interpretation of the exclusivity clause, the restructuring of ENEE and the creation of independent business units, and the application of simple transmission
5176-CH10.pdf 81 5/19/10 1:14 PM
HONDURAS: POWER SECTOR ISSUES AND OPTIONS
82
charges to facilitate open access. Remaining barriers can be eliminated in the longer term with changes in the law to create a spot power market and allow exportation of fi rm energy, and by the corporatization of the independent business unit.
Energy Effi ciencyEnergy efficiency measures at both supply and demand are the most economical options to reduce the need for additional generation capacity, and to improve security of supply through a reduction in consumption. In the case of Honduras, the implementation of energy effi ciency measures could effectively reduce the short-term need for emergency generation and/or power rationing. Furthermore, energy effi ciency measures on the demand side could be used in conjunction with rural electrifi cation programs to improve access, and reduce the impact of higher electricity tariffs. Under the Proyecto de Generación Autónoma y Uso Racional de Energía Eléctrica (GAUREE), financed by the European Union since 1999, ENEE has developed a number of studies to identify energy efficiency opportunities. A compact fl uorescent bulbs program for the marketing and sales pilot program to increase the use of energy-effi cient compact fl uorescent lamps (CFLs) has been designed. The program envisions giving away, in a three-phased operation, a free 20W CFL bulb to 800,000 households (the majority of
Honduran households still use ineffi cient 60W, 75W, and 100W bulbs).
Although some progress has been achieved, Honduras is still lagging behind other countries in the region in terms of design and implementation of energy effi ciency programs. Large effi ciency improvements could be made in the areas of air conditioning for both the residential and commercial sectors. The electricity tariff structure for residential consumers is also an impediment to the success of energy effi ciency programs. The potential for energy effi ciency is presented in Annex 10.
Recently, an Inter-Institutional Group for the Effi cient Use of Energy (GIURE) was established in Honduras with the participation of SERNA, the Consejo Hondureño de la Empresa Privada (COHEP), the Ministry of Education, ENEE, the Universidad Nacional Autónoma de Honduras (UNAH), the Consejo Empresarial Hondureño para el Desarrollo Sostenible/Proyecto de Efi ciencia Energética en los Sectores Industrial y Comercial de Honduras (CEHDES/PESIC), CNE, and the Colegio de Ingenieros Mecánicos, Electricistas y Químicos (CIMEQH) to promote energy effi ciency measures. GIURE has set out a plan to reduce the national energy demand by 100 MW in 2008, equivalent to an 8 percent reduction of the peak demand forecasted by ENEE. To that end, it has designed the following programs, outlined in Table 10.2.
GIURE is also working on a strategic partnership with the Ministry of Education to
Activities Entity Responsible
Program of energy-effi cient bulb replacement GAUREE/ENEE/SERNA/UNAH
Promotion of gas stove use COHEP/SERNA
Rationalization of subsidies and tariffs ENEE/SERNA
Use of clean development mechanisms SERNA/ENEE
Educational campaign GAUREE/ENEE-SERNA
Effi ciency in the industrial and commercial sectors PESIC
Mass communication campaign COHEP
Create a Foundation COHEP/PESIC
Source: Campaña de Promoción y Ahorro de Efi ciencia Energética, February 2007.
Table 10.2 Program to Reduce Energy Demand
5176-CH10.pdf 82 5/19/10 1:14 PM
83
Diversifying Energy Sources
implement the Guardianes de Energía (Energy Guardians) program to help children become drivers of change at home. In addition, the strategic partnership seeks the inclusion of energy effi ciency in the school curriculum using dynamic and interactive programs.
Furthermore, ENEE’s GAUREE designed a pilot project to deliver energy-saving lamps. To that end, arrangements are being made to
purchase 50,000 bulbs, to be used as part of a pilot project that will take place in certain cities in Honduras, including major ones. They will be sold by public and private school students, who will train potential users in how to use the lamps. The pilot project is in the demonstration phase and the discussion regarding its continuity has not started yet.
5176-CH10.pdf 83 5/19/10 1:14 PM
5176-CH10.pdf 84 5/19/10 1:14 PM
85
Financial losses of the Empresa Nacional de Energía Eléctrica (ENEE) during 2001 to 2006 resulted from high costs and the insuffi cient revenue provided by low tariffs. The largest operation costs were the costs of fuel and energy purchases, which were infl uenced by several factors. This annex explains in greater detail the factors that contributed to ENEE’s high costs during the period. The annex also presents ENEE’s detailed fi nancial statements.
Drop in Hydroelectric GenerationTwo major factors contr ibuted to the hydroelectric generation decrease in 2002 to 2004: insuffi cient rainfall, and depletion of El Cajón’s reservoir. Water infl ows to El Cajón during 2001 to 2004 were 70 percent below
ENEE’s Financial Situation—Detailed Analysis
Annex
1
average, except for 2003 (when they were 81 percent below average). To compensate for these reduced fl ows, ENEE drew down the reservoir by some 2,250 million cubic meters (m3) in 2001–2003, equivalent to 23.7 cubic meters per second (m3/sec), 33 percent of the average natural infl ows in that period. In spite of the substantial use of water reserves, the annual generation of El Cajón for 2002 to 2003 was below average, estimated at 1,300 gigawatt hours (GWh) (Table A1.1).
The depletion of El Cajón’s reservoir in 2001 to 2003 made it possible to maintain generation levels to compensate for scarce rainfall. However, lowering the reservoir level caused a substantial reduction of the plant’s firm capacity and
Table A1.1 El Cajón—Reservoir Operations 2001–2005
39 El Cajón’s turbines are at the level of the dam’s base, so that the plant’s net head is determined basically by the water level behind the dam.
5176-ANNEX1.pdf 85 5/19/10 1:13 PM
HONDURAS: POWER SECTOR ISSUES AND OPTIONS
86
conversion factor.39 The plant’s capacity had fallen about 86 megawatts (MW) below its nominal value by 2004, and its average conversion factor (kWh/m3) had been reduced by about 20 percent. Additional emergency thermal capacity was necessary to meet the shortfall in fi rm capacity (Figure A1.1).
Financial constraints may have also played a role in the depletion of El Cajón’s reservoir, especially in 2003 and 2004, when the reservoir was operating at low levels and the optimal operation plan may have called for additional thermal generation. However, the fi nancial cost was high because the thermal plants using heavy fuel oil were already running at very high plant factors, and thermal generation could be increased only with expensive emergency generation running on diesel oil (Table A1.2).
Average Price of Energy PurchasesThe average annual price of energy purchases in 2001 to 2006 remained high and relatively stable, in the range of US$90/MWh to US$100/MWh, in spite of large variations in liquid fuel prices. There are three explanations for this:
1. From 2002 to 2004, when heavy fuel oil prices were relatively low, in the US$22 to $28 per barrel (bbl) range, there was a surge in emergency generation using more expensive diesel fuel oil, caused by delays in adding new heavy-fuel-oil-fi red plants.
2. During 2005 to 2006, as the new heavy fuel-oil plants were being commissioned, heavy fuel oil prices shot up to about US$45/bbl (Table A1.3).
3. During the period, ENEE had to continue paying the extra costs of expensive power purchase agreements (PPAs) contracted in the mid-1990s.
The Surge of Thermal Generation Using Diesel Oil ENEE’s planning indicated in 1999 that 210 MW of fi rm baseload-generating capacity would be needed by the beginning of 2002, but due to delays in launching the bidding process, ENEE was forced to lease a large number of trailer-mounted diesel-fueled generating units of about 2 MW capacity each, amounting to some 160 MW by 2003. This emergency generation, combined with a 39.5 MW gas turbine (contracted under a long-term PPA in 1995) and ENEE’s own small diesel plants—all operating at low plant factors (less that 50 percent)—was producing 910 GWh, equivalent to 30 percent of energy purchases by 2003. The fi xed charges and fuel costs for these plants added up to about US$100 million that year, equivalent to 33 percent of total energy-purchase costs. Fortunately, the price of diesel was then relatively low (US$33.8/bbl), so the average energy price from the leased plants was not too high (US$101/MWh). In 2004, when the average price of diesel increased to US$45.5/bbl, the average energy price of the leased plants increased to US$132/MWh, but the average price of all purchases remained at about US$90/MWh, since by mid-2004 the
new efficient diesel plants had been partially commissioned and the generation of emergency plants had decreased (Table A1.4).
PPA PricesENEE has PPAs with six larger thermal generators, for a total of about 650 MW, all equipped with diesel engines running on residual fuel oil, except for a gas turbine using diesel oil (Lufussa I). The monthly capacity charges and the levelized energy costs (at 2007 fuel prices) decline sharply with contract date, as more effi cient plants were commissioned and better contract conditions obtained. The capacity charges for contracts signed in the 1990s are in the range of about US$20/kW/month, decreasing to about US$16/kW/month for contracts in the late 1990s, and down to about US$12/kW/month for contracts from the mid-2000s.40 The levelized energy charge, calculated at current fuel prices, shows a steep reduction from about US$200/MWh initially (for the gas turbine) to US$128/MWh for the late 1990s, and down to US$90/MWh for the new contracts (Table A1.5).
A survey of PPA prices in Central America41 carried out by Comisión Económica para América
Table A1.3 Energy Purchases vs. Fuel Prices 2001–2006
Residual Fuel Price USGC 1%S
Average Price Energy Purchases Energy Purchases Energy Purchases
40 The fi xed charge for the Energía Renovable S. A. (ENERSA) contract is estimated at US$13.3/kW/month for 2007, but this charge declines with time, in terms of US dollars, and in present value is lower than the Lufussa III fi xed charges.41 “El Mercado Eléctrico Regional: Contratos PPA en El Salvador, Guatemala, Honduras y Nicaragua,” Documento LC/MEX/L493, CEPAL, 2001.
5176-ANNEX1.pdf 87 5/19/10 1:13 PM
88
Source: Authors’ calculations, 2007.
* Estimated based on diesel consumption and average annual fuel price.
** Estimated based on contract charges and real generation.
Latina y el Caribe (CEPAL) in 2001 shows that the prices in ENEE’s PPAs with Lufussa II and EMCE II were close to the middle of the observed range.42 But in the PPAs with ELCOSA and Lufussa I, there are two price components that are clear outliers. One is Lufussa’s fi xed charge, which is US$21.3/kW/month, when a reasonable value for a gas turbine should be about US$8/kW/month. The other outlier is the variable charge in ELCOSA’s contract, about US$143/MWh, when a fair value should be about US$75/MWh. These very high charges may refl ect high project and market risks that were perceived by the pioneer investors in generation in Honduras in the mid-1990s and a lack of competition when the new electricity law was approved.
ENEE’s extra cost due to the gas turbine fi xed charge is US$6 million per year. The extra cost of ELCOSA’s overvalued energy charge depends on its position in the economic dispatch and the variable price submitted by ELCOSA in the economic dispatch.43 For example, in 2003 ELCOSA sold 458.3 GWh to ENEE, the highest yearly sale in the period, and the extra cost for ENEE that year is estimated at about US$14 million.
The new PPAs with Lufussa III and ENERSA have especially good prices, thanks to greater competition in the bidding process, with a proposal of AES to develop a regional project, the El Faro gas-fi red combined cycle gas turbine (CCGT). Recently, ENEE and the private generation companies were negotiating price reductions in exchange for contract extensions in both contracted capacity and duration. The negotiations included modifying ENERSA’s fi xed charge, currently a value that decreases with time, to convert it to a constant rate. According to ENEE, the immediate
cost reduction would have been US$20 million per year. Negotiations, however, have been abandoned. As shown in Table A1.7, debt toward IPPs is the major component of current liabilities, particularly after the oil price increases in recent years; in fact, between 2004 and 2005 monies owed to generators more than doubled.
ENEE’s Cash-Flow PerformanceTable A1.6 summarizes ENEE’s statement of sources and application of funds for 2002 to 2005.
Of note:
• Self-fi nancing was negative for each year of the period, in spite of an average annual reduction of Lp519 million in working capital during this period. Most of the reduction in working capital is explained by an increase in accounts payable to generators.
• About 50 percent of the investment corresponds to rural electrification that is financed by disbursements of loans and grants managed by the government (under government contributions to rural electrifi cation). The other 50 percent of total investment during this period (about Lp850 Million) was fi nanced with long-term loans from local banks.
• ENEE fi nanced most of the cash defi cit in the period (negative self-fi nancing) with loans from local banks.
• ENEE maintains a current account with the government, to which ENEE credits debt-service and other payments made by the government on ENEE’s behalf, and to which ENEE debits payments such as government subsidies to consumers, which are initially borne by ENEE. The account is included under “government loan net” and “adjustments to the government loan,” and it had a negative contribution of Lp41 million during the period.
• Until 2004, all of ENEE’s forgiven debt was automatically transferred to a debt forgiveness reserve in owner’s equity. The yearly changes in this reserve account are the amounts that appear in Table A1.6 as government contributions from debt forgiveness. In 2005, forgiven debt was credited to the
42 The capacity charges for most projects were in the range of US$15/kW/month to US$20/kW/month, and the energy prices for most contracts were in the range of US$40/MWh to US$80/MWh (using 2001 fuel prices). EMCE II and Lufussa II had capacity charges of US$15/kW/month and energy prices of about US$53/MWh.43 The PPAs are “dispatchable” contracts; that is, ENEE pays a fi xed charge for the right to the capacity, but does not have to purchase any minimum amount of energy. ENEE’s economic generation dispatch is based on the plants’ variable charges, and ELCOSA, which has a higher energy price, seeing its energy sales sharply reduced as new generators entered the fi eld, began making weekly offers “on the side,” quoting variable charges lower than the contractual fi gure.
5176-ANNEX1.pdf 89 5/19/10 1:13 PM
HONDURAS: POWER SECTOR ISSUES AND OPTIONS
90
Table A1.6 Sources and Uses of Funds
Sources and Applications 2003 2004 2005 Total
Net Income before Interest –1,832 –1,953 –1,625 –5,410
Plus Depreciation 1,749 1,739 1,767 5,255
Internal Cash Generation –84 –214 142 –155
Plus Non Operating Income –87 100 65 77
Net Revenues (EBITDA) –171 –114 207 –78
Less Debt Service:
Interest 336 401 326 1,063
Repayment of Principal 576 720 753 2,048
Total Debt Service 912 1,120 1,079 3,111
Less Increase in Working Capital –503 –843 –212 –1,559
Self Financing –580 –391 –660 –1,631
INVESTMENT 397 819 505 1,721
FUNDS REQUIREMENT 976 1,210 1,165 3,352
External Sources
Government Contributions
Rural electrifi cation 172 495 206 873
from Debt forgiveness –70 299 93 322
Adjustments to equity 52 0 0 52
Government loan, net 248 –51 –1 195
Adjustments to Govt. loan –49 –187 0 –236
Total Government contribution 351 556 298 1,205
Other Sources
Cessions by private agents 66 60 126
Disbursements on Long Term Loans 526 801 793 2,120
Foreign 105 4 0 109
National 421 797 793 2,011
Adjustments to Long Term Debt 99 –212 14 –99
Total other sources: 625 655 867 2,147
Total Sources 976 1,210 1,165 3,352Source: Authors’ calculations, 2007.
Source: Authors’ calculations, 2007.
Table A1.7 Working Capital and Accounts Payable to IPPs (2002 to 2005)
2002 2003 2004 2005
Working capital 1,063.7 560.5 (282.8) (494.8)
Accts. payable to generators 255.9 534.9 674.0 1,343.3
Other current liabilities 330.5 272.2 659.6 491.1
5176-ANNEX1.pdf 90 5/19/10 1:13 PM
91
ENEE’s Financial Situation—Detailed Analysis
government’s loan; in other words, ENEE began recognizing that it still had an obligation to pay the amounts that were forgiven, with only a change of creditor. The government will use the funds for poverty reduction.
InvestmentThe investment in 2003 to 2005, excluding investment in rural electrification, was very small (about US$15 million per year). Investment in the expansion of distribution networks in urban areas is financed almost exclusively by third parties—private developers and municipalities—and the installations are transferred to ENEE at no cost. The annual investment made in this manner may be estimated at around Lp400 million.
ENEE’s operations are being increasingly hampered by transmission constraints arising from lagging development of the grid. The bidding documents issued in 2001 to contract for 210 MW in generation capacity required bidders to build all transmission reinforcements necessary to ensure smooth and reliable power fl ows from the new plant. Indeed, there was at
the time not a single point in the transmission grid capable of absorbing the 210 MW being procured.
ENEE’s fi nancial diffi culties continue to be a barrier to transmission and subtransmission grid expansion. This has a particularly negative impact on distribution network development, because required new sources—new high-voltage to medium-voltage substations—cannot be created at the rate required by urban growth and distribution network extensions.
Balance SheetTable A1.8 displays ENEE’s fi nancial position as of December 31, 2005.
The unusual debt/equity ratio of 30/70 is in part the result of the overvaluation of assets discussed in Chapter 1 under the depreciation charges. If the more reasonable asset value of Lp21 billion is substituted, as explained in Chapter 1, then the owner’s equity, obtained as the difference between total assets of Lp21 billion and total liabilities of Lp12.7 billion, would be Lp8.4 billion, and the debt-to-equity ratio would be 52/48 (Tables A1.9 through A1.11).
5176-ANNEX1.pdf 91 5/19/10 1:13 PM
HONDURAS: POWER SECTOR ISSUES AND OPTIONS
92
Source: ENEE, 2006
Table A1.8 ENEE’s Financial Position as of December 31, 2005
from Debt forgiveness 139.8 462.5 128.0 (70.3) 298.6 93.4
Adjustments to equity (40.0) 10.6 51.5 0.0 0.0
Government loan, net (589.4) 424.2 247.8 (51.5) (1.3)
Adjustment to Govt. loan 0.0 180.7 0.0 (49.4) (187.0) 0.0
Total Government contribution 236.6 (213.3) 670.2 351.3 555.5 297.9
Other Sources
Cessions by private agents 66.0 60.5
Disbursements on Long Term Loans 48.0 65.5 262.8 526.0 800.9 793.1
Adjustments to Long Term Debt 160.8 (104.8) (46.6) 99.0 (212.1) 13.8
Total other sources 208.7 (39.2) 216.2 625.0 654.8 867.4
Total Sources 445.4 (252.5) 886.4 976.3 1,210.3 1,165.2
Difference: Resources less Requirement 899.451 (11,888.684) (106.304) (0.000) (0.000) (0.000)
Source: Authors’ calculations, 2007.
5176-ANNEX1.pdf 98 5/19/10 1:13 PM
99
Table A2.1 summarizes the government’s contributions to ENEE’s fi nancing during 2002 to 2005.44
The government’s equity contributions are composed of funds to finance ENEE’s electrifi cation programs and funds from debt forgiveness left in the utility as an equity reserve. The fi nancing of electrifi cation includes funds from the budget, averaging Lp33 million per year, and funds from loans contracted by the government directly with foreign donors. This item also includes transfers from private developers to ENEE, at no cost, of new distribution facilities in urban areas, which average Lp31.6 million per year in the period.45
Government Transfers to ENEEAnnex
2
The government loan functions as a current account to which ENEE credits payments are made by the government on ENEE’s behalf and debits payments are made by ENEE on behalf of the government. The former correspond mainly to foreign-debt service and, until 2003, fuel-tax exemptions. The latter correspond mainly to government subsidies for electricity users, which are borne up front by ENEE, and credits to accounts payable by public sector users. The Ministry of Finance and ENEE use a “compensation account” to record payments by one side and the other as a monitoring device, and aim to achieve full compensation during the year. Table A2.2 shows the compensation account’s movement during the period.
The credits corresponding to fuel-tax exemptions originated in 1997 when ENEE began importing thermal generation from Panama, which displaced higher-priced local private generation. The local generators, noting that their Panamanian counterparts do not pay fuel taxes, lobbied Congress and obtained Decree 119.97, exempting fuel used for generation from import
Source: Authors’ calculations, 2007.
a. Excluding fuel-tax charges, as explained in the text.
Table A2.1 Government Contributions to ENEE, Lps Millions
Government Contributions 2002 2003 2004 2005 Totals
Equity contributions
For electrifi cation projects 107.40 171.60 495.40 205.80 980.2
Increase of debt-forgiveness reserve 128.00 (70.30) 298.60 93.40 449.7
Net government-loan disbursementa (202.60) (76.10) (51.50) (1.30) (331.5)
Total government contribution 32.80 25.20 742.50 297.90 1,098.4
Government contribution in US$ 2.0 1.4 40.3 15.7 59.4
44 It was not possible to determine the fi gures for 2001 because of multiple mismatches between ENEE’s fi nancial statements for 2001 and those of both 2000 and of 2002.45 Accounting shows values under this item from only 2003: L59.3 million in 2003, L38.4 million in 2004, and L60.4 in 2005. According to information received from the Center-South Distribution Region, the actual value of investment by developers is much larger than the amounts recorded as transfers by accounting.
5176-ANNEX2.pdf 99 5/19/10 1:14 PM
HONDURAS: POWER SECTOR ISSUES AND OPTIONS
100
and other taxes. The Decree says that ENEE had to use the funds from the corresponding reduction in energy purchase costs in favor of small residential consumers and to fi nance rural electrifi cation. The government decided these amounts should be credited to the government’s loan.
Table A2.1 has excluded these credits, which cannot be considered legitimate government contributions to ENEE during the period being analyzed, since tariffs were no longer recovering all costs. The practice stopped in
2003. The accumulated amount credited in the compensation account for this concept during 2001 to 2003 was Lp1,062 million. As explained, this has been taken out in Table A2.2, but is included in the item fuel-tax exemptions in Table A2.1.
The balance of the compensation account was in favor of the government for only 2002 and 2003, but it would have been in favor of ENEE in those years also if we disregard the fuel-tax charges, which were no longer justifi ed.
Source: Authors’ calculations, 2007.
Table A2.2 Compensation Account ENEE—Government
Lps Millions
2001 2002 2003 2004 2005
Credits
Debt service paid by government 88.0 198.9 283.0 167.1 123.1
Reimbursement of subsidies 45.6 150.9
Fuel taxes 362.5 552.9 147.0
Total Credits 450.5 751.8 430.0 212.7 274.0
Debits
Subsidies paid by ENEE 337.1 275.7 247.1 260.2 275.3
Credits to public-sector clients’ accts. 128.5 73.9 112.0 0.0 0.0
Cash payments 88.0 40.7 2.0
Other 15.8 11.2 0.1 2.0
Total Debits 569.3 401.5 359.1 264.2 275.3
Balance (118.8) 350.3 70.9 (51.5) (1.3)
5176-ANNEX2.pdf 100 5/19/10 1:14 PM
101
Present Generation Capacity and Supply and Demand BalanceTable A3.1 shows installed generation capacity in the national interconnected system at the end of 2006, classifi ed by source type.
Table A3.2 shows fi rm capacity at the end of 2006.
Table A3.3 shows, for 2001 to 2006, peak demand and available power generation capacity at the end of the month in which peak demand occurred.
Reliability of Power SupplyAnnex
3
Table A3.4 shows energy generation, sales, and total losses for 2001 to 2006.
Table A3.5 presents an analysis of transmission grid contingency.
Distribution Improvements: The Seven Cities Project and Other Measures Between 1994 and 1999, the Seven Cities Project rehabilitated distribution networks in ENEE’s largest load centers—accounting for half of the utility’s clients at the time—with the main
Source: Authors’ calculations, 2007.
Table A3.1 Installed Generation Capacity (in megawatts)
Company Hydro Biomass HFO Diesel Total
ENEE 432.2 80.0 30.0 542.2
ENEE, leased from Laeisz 13.5 13.5
Other state-owned plants (2) 31.6 31.6
ELCOSA 80.0 80.0
The EMCE Group 5.0 319.0 324.0
Lufussa 354.6 39.5 394.1
Sugar Mills (5) 74.8 74.8
Palm-oil factories (3) 2.0 2.0
Small hydrogenerators (6) 33.4 33.4
Industrial self-generators (3) 35.0 8.0 43.0
Total 502.2 76.8 868.6 91.0 1,538.6
5176-ANNEX3.pdf 101 5/19/10 1:12 PM
HONDURAS: POWER SECTOR ISSUES AND OPTIONS
102
objective of reducing technical energy losses. Total losses at project start were estimated at 30 percent, and technical losses at 16 percent. Other project objectives were to improve voltage regulation and network reliability and to upgrade public lighting. The project was part of a broader effort to improve distribution system management, which included an aggressive commercial loss-reduction program and the professionalization of Distribution District management.
The Seven Cities Project did the following:
1. All main medium-voltage feeders were rebuilt, doubling their conductor size.
2. Network structure was redesigned to minimize source-to-load distances. Load per feeder was limited to 5 mega volt-amperes (MVA) and interconnection points were provided between feeders. Protection and sectionalizing equipment was installed along the feeders to minimize the impact of faults on continuity of supply.
3. The main three-phase primary network was expanded, eliminating long single-phase branches.
4. Distribution-transformer–secondary-network design was optimized. The resulting design was adopted as ENEE’s standard: Transformer capacity was chosen to allow for 15 years of load growth, with loading limited to 80 percent of capacity as a maximum; high-effi ciency (> 98 percent) was chosen as the standard for all distribution transformers; line-conductor size doubled, and length was limited to 150 meters from the transformer. Secondary networks were rebuilt in all areas where average energy use exceeded 150 kWh per month per service connection.
5. Existing mercury-vapor lamps for public lighting were replaced with high-effi ciency sodium-vapor lamps, and the associated control systems were upgraded to facilitate maintenance.
Source: Authors’ calculations, 2007.
Table A3.2 Firm Generation Capacity (in megawatts)
Company
Energy Source
TotalHydro BagasseOther
Biomass HFO Diesel
ENEE 326.7 16.0 0.0 342.7
ENEE’s leased plants 13.5 13.5
Other state-owned plants (2) 5.0 5.0
ELCOSA 64.0 64.0
The EMCE Group 255.0 255.0
Lufussa 284.0 32.0 316.0
Sugar Mills (5) 0.0 0.0
Palm-oil factories (3) 0.0 0.0
Small hydrogenerators (6) 12.8 12.8
Industrial self-generators 28.0 5.0 33.0
Totals 344.5 0.0 0.0 647.0 50.5 1,042.0
5176-ANNEX3.pdf 102 5/19/10 1:12 PM
103
Reliability of Power Supply
Source: ENEE, 2007.
Table A3.3 Power Generation and Peak Demand (in MW)
Cañaveral
Capacity Available End of Month of Maximum Demand
2001 2002 2003 2004 2005 2006
29.0 29.0 29.0 29.0 29.0 29.0
Río Lindo 76.0 80.0 80.0 80.0 80.0 80.0
El Níspero 0.0 23.0 23.0 23.4 22.5 22.5
El Cajón 288.0 256.0 210.0 120.0 216.0 234.0
Santa María del Real 0.0 0.0 0.7 1.0 1.0 0.5
Total ENEE Hydro 393.0 388.0 342.7 253.4 348.5 366.0
Nacaome 0.0 0.0 30.0 30.0 30.0 30.0
El Coyolar 1.6 1.6 0.0 0.0 0.0 0.0
Total Other State Hydro 1.6 1.6 30.0 30.0 30.0 30.0
Santa Fe 2.4 2.4 4.4 2.2 2.0 4.4
La Puerta I 16.0 16.0 16.0 16.0 16.0 16.0
La Puerta II 10.0 0.0 0.0 0.0 0.0 10.0
Total ENEE Diesel 28.4 18.4 20.4 18.2 18.0 30.4
Total ENEE HFO 64.7 58.7 70.6 22.7 16.4 15.1
Lufussa I 37.0 38.0 39.0 39.5 39.5 39.5
Leased plants 68.0 168.0 167.0 188.5 63.5 13.5
Total Private Diesel 105.0 206.0 206.0 228.0 103.0 53.0
ELCOSA 79.0 79.0 70.1 80.0 70.0 70.0
EMCE Choloma 55.0 44.0 44.0 55.0 55.0 44.0
Lufussa II 72.0 72.0 55.0 77.0 77.0 77.0
Lufussa III 0.0 0.0 0.0 210.0 231.0 210.0
ENERSA 0.0 0.0 0.0 89.0 200.0 200.0
Total Private HFO 206.0 195.0 169.1 511.0 633.0 601.0
Small Hydro 0.5 0.5 2.2 10.7 11.2 33.5
Bagasse 0.0 0.0 0.0 0.0 0.0 0.0
Auto producers 8.0 8.0 8.0 22.0 22.0 29.0
Total Other 8.5 8.5 10.2 32.7 33.2 62.5
GRAND TOTAL 807.2 876.2 849.0 1,096.0 1,182.1 1,158.0
The project rebuilt 1,750 km of distribution lines at a cost of US$43 million. The total project cost, including engineering, personnel training, work vehicles, kWh-meters, and testing equipment was US$52 million, of which IDB fi nanced US$34 million.
ENEE organized in parallel a well-coordinated countrywide effort to reduce commercial energy losses, driven and closely monitored by top management, and a program to improve quality of service by systematically fi nding out and eliminating causes of network faults. As part of the effort to improve distribution-system
management, ENEE implemented a program to fi ll all Distribution District Chief (Jefes de Sistema) positions with engineers. This was based on a 1990 board of directors decision stating that all centers with more than 5,000 clients were to be directed by engineers, but still required much effort to dismantle the political patronage system that had previously decided the district chief appointments.
The Seven Cities Project and the rest of the program achieved their loss-reduction objective. Technical losses in the renovated networks were reduced to between 3 and 4 percent—that
Source: ENEE, 2007.
Table A3.4 Energy Generation, Sales and Losses (in GWh)
1 To face this contingency, a transfer-trip scheme has been implemented, which upon detecting overloading of any of the transformers, (T613 or T614) trips all the load served by transformers T520 and T522 in Progreso, and by substations Santa Marta, between Progreso and San Pedro Sula, and Circunvalación in San Pedro Sula.2 To prevent the tripping of L 614 in this case, a transfer-trip scheme has been implemented, which, upon detecting overload of L614, trips both Lufussa’s generation in the south and load in Tegucigalpa.
These three 50-MVA transformers operate in parallel; if any one of them trips, the other two are overloaded.
Load served from Tegucigalpa substations of: Suyapa, Leona, Laínez, Santa Fé;In other areas: Guaimaca, Juticalpa, Zamorano, and Danlí.
Suyapa 138/69 kV T510; T542 Santa Fe 138/69 kV T509
Dê Intermediate
These three transformers operate in parallel; if any one of them trips, the other two are overloaded.
Load served from the substations of Leona, Laínez, Guaimaca, Juticalpa, Zamorano, and Danlí.
Progreso 230/138kV Transformers T613 to T614
Dê 850MW These two transformers operate in parallel; if one trips, the other one is overloaded.
Total outage in North and Atlantic Shore regions. Risk of system instability and collapse.1
ENERSA’s Power station
Dê Intermediate
This baseload plant in the North is generating 180 MW or more all the time; when it trips, transformers T613 and T614 in Progreso are overloaded.
Total outage in North and Atlantic Shore regions. Risk of system instability and collapse. See Note 1.
230-kVdouble-circuit lines L610 and L611 Agua Caliente-Toncontin
Dê Intermediate
If both circuits trip simultaneously, the 230-kV line L614 between Pavana and Suyapa is overloaded. Tripping of the three lines causes the loss of close to 300 MW of generation from Lufussa in the south and the separation of the Honduran network from the rest of Central America.
Systemwide automatic load-shedding triggered by low frequency.2
230-kV lines L612 Toncontin-Suyapa and L613 Cajón-Suyapa
All load conditions
Due to an inadequate busbar arrangement in Suyapa, tripping of these two lines causes the disconnection of 230-kV line L614, Pavana-Suyapa, and the loss of the three 230/138 kV transformers T611, T612, and T613 in Suyapa for a total of 300 MVA.
Load served from Tegucigalpa substations of: Suyapa, Leona, Laínez, Santa Fé;In other areas: Guaimaca, Juticalpa, Zamorano, and Danlí.
230-kVlines L613 and L622 Cajon-Tegucigalpa
Dê 850MW Simultaneous tripping of these lines causes voltage to collapse along the 138.kV transmission corridor Cañaveral–Tegucigalpa.
Load-shedding in Tegucigalpa to recover voltage.
5176-ANNEX3.pdf 105 5/19/10 1:12 PM
HONDURAS: POWER SECTOR ISSUES AND OPTIONS
106
Source: Authors’ calculations, 2007.3 To prevent the tripping of transformers T510 and T542, a transfer-trip scheme has been implemented, which, upon the tripping of L522 and detection of load-fl ow reversal in transformer T509, disconnects load served from Santa Fe.
Table A3.5 Continued
System ElementDemand Scenario Comments
Areas Left without Service
Bermejo 138/69 kV Transformer T505
All load conditions
This transformer has no backup; it feeds 69/13.8.kV Transformer T406 in the same substation of Bermejo in San Pedro Sula.
All load served by transformer T406 is lost.
138.kV line L515Progreso-Tela
All load conditions
Transmission originating in Progreso to connect the Atlantic Shore region, continuing on to the Aguan Valley is all radial. Tripping of any of the transmission lines after L515 causes a total outage from that point on.
All load served from the substations of Guaymas, Tela, Ceiba, San Isidro, Bonito Oriental-Reguleto Isletas, and Coyoles Central.
138.kV line L516Tela-Ceiba
All load conditions
Line in the radial transmission system of the Atlantic shore and Aguan.
All load served from the substations of Ceiba, San Isidro, Bonito Oriental-Reguleto, Isletas, and Coyoles Central.
138.kV line L517Ceiba-San Isidro
All load conditions
Line in the radial transmission system of the Atlantic shore and Aguan.
All load served from the substations of San Isidro, Bonito Oriental-Reguleto, Isletas, and Coyoles Central.
138.kV line L518San Isidro—Reguleto
All load conditions
Line in the radial transmission system of the Atlantic shore and Aguan.
All load served from the substations of Bonito Oriental-Reguleto, Isletas, and Coyoles Central.
138.kV line L550 Cañaveral-Piedras Azules
Dê 850MW Risks overloading 138.kV line L552 linking the substations of Santa Fe and Suyapa in Tegucigalpa, which is the next event analyzed.
138.kV line L552 Suyapa-Santa Fe
Dê Intermediate
Tripping of this line would cause overloading of 138/69.kV transformers T510 and T542 in Suyapa and fl ow reversal in transformer T509 in Santa Fe. Tripping of transformers T510 and T542 overloads transformer T509 in Santa Fe, which also trips.
Loss of the 69.kV network serving Tegucigalpa and the eastern region. Load served from the substations in Tegucigalpa: Leona and Laínez;In other areas: Guaimaca, Juticalpa, Zamorano, and Danlí.3
69.kV line L422Suyapa-Zamorano
All load conditions
This is the fi rst line in a radial 69.kV system serving the Department of El Paraiso in southeastern Honduras.
All load served from the substations of Zamorano and Danlí.
69.kV line L441Santa Fe-Guaimaca
All load conditions
This is the fi rst line in another radial 69.kV system serving the Departments of Francisco Morazan and Olancho.
All load served from the substations of Guaimaca and Juticalpa.
5176-ANNEX3.pdf 106 5/19/10 1:12 PM
107
Reliability of Power Supply
is, to within international standards. Total losses decreased during project execution from 28 percent in December 1995 to 18 percent in November 2000, as shown in Figure A3.1.
Quality of service also improved notably. The number of distribution-network faults decreased from 1,674 recorded in 1998 to 875 recorded in 2000. Distribution departments reported that the cases of burned distribution transformers due to overload practically disappeared.
Generation Expansion—Assumptions and DetailsThis section examines the generation expansion plan, including its basic assumptions (demand growth, fuel prices, candidate projects) and shows the results obtained from the analysis.
Electricity Demand Projections In late 2006, ENEE prepared electricity demand projections that were used for the calculation of the offi cial short-run marginal costs adopted for
2007. The methodology used for projecting the demand is a combination of econometric models (for residential and industrial sectors), trend models (for commercial and offi cial sectors), and surveys (for large industrial loads). The econometric model for residential sales is a simple model based on the elasticity of average residential sales per consumer to income, price of electricity, and price of fuel substitutes. For industrial demand it uses the elasticity to industrial value added, price of machinery, and electricity prices. This is combined with assumptions on electricity losses to estimate energy demand, generation needs, and peak demand, taking into account that reductions in commercial losses are partially converted to energy sales.
ENEE’s demand projection model was used to prepare three demand scenarios: base, high, and low, which share a common macroeconomic growth scenario but make different assumptions on electricity pricing and demand management policies, and on the results of the electricity loss-reduction program, three key drivers of
Figure A3.1 Energy Loss in Percent, Twelve-month Average
���������������������������������
�����
����
������
���
���
����
������
���
���
����
������
���
���
������ ���
����
������
���
���
����
������
���
���
����
����
Source: ENEE, 2007.
5176-ANNEX3.pdf 107 5/19/10 1:12 PM
HONDURAS: POWER SECTOR ISSUES AND OPTIONS
108
electricity demand. The macroeconomic scenario is consistent with a 4.5 percent annual growth of GDP. We observe the following:
• The high case corresponds to a “business-as-usual” scenario, where electricity prices are frozen in nominal terms, electricity losses continue to increase, and the load factor46 decreases due to a lack of load management policies (no time-of-the-day tariffs, no energy-effi ciency programs).
• The base case corresponds to a scenario where moderate corrective measures are taken. Electricity prices keep up with infl ation, but no increases in real terms are made. Electricity losses are reduced at a moderate rate beginning in 2008 as a result of the implementation of the loss-reduction program, and the load factor remains unchanged.
• The low case is a scenario where substantial corrective measures are taken. Electricity prices are increased 5 percent per year in real terms in 2007 to 2009, and electricity losses are decreased about 2.3 percentage points per year to reach 12 percent by 2013. The annual load factor gradually increases from 65.3 percent to 68 percent by 2015 due to the implementation of load management programs and energy-effi ciency actions (see Table A3.6).
The results of the base case scenario are quite similar to ENEE’s base demand projections, although the assumptions made are different. The impact of some corrections made to the methodology used to convert loss reduction to additional sales balanced out with changes in other assumptions (Table A3.7).
Fuel PricesThe generation expansion plan prepared by ENEE evaluates the available generation options to meet projected demand for 2007 to 2020, assuming
that international crude oil prices will remain high during the planning period, in the range of US$50 to US$60/barrel, which is consistent with a reference case scenario presented in EIA’s 2006 annual energy outlook. It is assumed that for the initial years the price of liquid fuels stays at about the same level of the last quarter of 2006. The differences in prices with respect to ENEE’s assumptions are minor (see Table A3.8).
Generation CandidatesThe levelized generation costs of the main generation alternatives considered by ENEE are compared in Table A3.9. The hydroelectric investment costs reflect the most recent information available from prefeasibility and feasibility studies, updated using construction price indexes for civil works.47 The investment and operation costs for thermoelectric projects refl ect typical costs for thermal projects used for the analysis of regional generation expansion plans in Central America, updated to 2007 prices. Analysis of the generation costs indicates the following:
• Except for Patuca 2, the levelized generation costs of the hydroelectric projects are high, in the range of US$85 to US$98/MWh, and would not contribute to reducing generation costs. However, most of these projects would operate as peak plants and may be competitive with thermal options. Some hydroelectric projects with average costs above US$100/MWh have other uses (irrigation and fl ood control).
• Fluidized bed combustion (FBC) thermal plants with an investment cost of about US$1,500/kW (US$1,829/kW including interest during construction) are the best option for baseload operation (levelized cost of about US$56/MWh).
• Medium-speed diesel generation (MSD) is no longer competitive at projected residual oil
47 Bureau of Reclamation construction cost trends 2000 to 2006.
46 The load factor is the ratio of average power demand (proportional to energy supplied) to peak demand that has to be satisfi ed for the same energy sold.
prices. Although investment costs in Honduras for this technology may be 35 percent lower than the reference costs assumed by ENEE,48 levelized costs for baseload operation would not be competitive with coal plants or gas-fi red plants (about 77 compared to US$56/MWh to US$66/MWh).
• It is unlikely that any large generation project, which may contribute to diversifying the energy sources, can be commissioned before 2013. The revision of the earliest commissioning dates for the generation options, taking into account the project’s state of preparation and using conservative estimates for the time required to complete feasibility studies, competitive bidding procedures, environmental studies, fi nancial closure, and project construction, showed that only Cangrejal and El Tablón, two medium-size hydroelectric projects, could be
commissioned before 2013. The only option left in the short term is to contract emergency generation.
If the earliest commissioning date for new large projects (2013) cannot be advanced, problems arise:
• There is a large defi cit of generation capacity before 2013. As already mentioned, the defi cit for 2008 to 2010 can be met mostly by emergency generation. However, meeting the defi cit for 2011 to 2012 would require new permanent generation and, if coal-fi red plants or hydroelectric projects cannot be commissioned by then, the only solution would be long-term PPAs with MSD or gas turbines, an expensive solution (at projected fuel prices) that will delay the plans to diversify energy sources.
• Oil imports for power generation would continue to increase until 2012, power generation would become more dependent
48 Owners of MSD projects in Honduras report total investment costs of about US$950/kW for 20 MW units.
5176-ANNEX3.pdf 111 5/19/10 1:12 PM
HONDURAS: POWER SECTOR ISSUES AND OPTIONS
112
on thermal plants using liquid fuels, and generation costs would not decrease if oil prices remain high as expected.
The generation costs for coal-fi red thermal plants and combined cycle gas turbine (CCGT) using liquefi ed natural gas (LNG) are preliminary estimates that should be confi rmed by feasibility studies taking into account all the required investments in port and fuel-handling facilities and updated investment costs based on current market conditions for the supply of electromechanical equipment:
• Investment costs for coal-fi red thermal plants in the international market soared recently,
driven by high demand for these plants in India and China. Investment costs of up to US$2,500/kW have been reported for new plants under construction.
• The installation of a coal-fi red thermal plant in Honduras will require investments in port facilities and transmission lines that have not been evaluated.
• The use of LNG for thermal generation will require investments in a regasifi cation terminal and a large gas demand (at least 600 MW).
• Table A3.10 shows the levelized cost for thermal candidates, assuming that the investment cost of a pressurized fl uidized bed combustion (PFBC) coal plant increases to US$2,100/kW and that an investment cost of a
Source: Authors’ calculations, 2007.
CIF fuel prices
Bunker 3%S 38.0 US$/bbl
Coal 69.6 US$/ton
LNG 5.9 US$/MBTU
Table A3.9 Costs for Generation Candidate Projects 2007 Prices
ProjectCapacity
MW
Investment Costs + IDC
US$/kW
Fixed Charges
US$/kw-
month
Average Generation
GWh
Plant Factor
%
Monomial Cost US$/MWh
Earliest Date for Start of
Operations
Hydroelectric
Cangrejal 40.0 2,896 29.5 150 43% 94.5 2011
Patuca 3 104.0 2,622 26.7 340 37% 98.1 2013
Patuca 2 270.0 2,515 25.7 1,337 57% 62.2 2015
Los Llanitos 98.2 5,128 51.9 370 43% 165.0 2013
Agua de la Reina 52.0 6,743 68.1 243 53% 175.1 2013
Tornillito 160.2 2,186 22.4 503 36% 85.4 2013
Jicatuyo 172.9 2,925 29.8 667 44% 92.6 2014
EI Tablón 18.6 5,467 55.3 92 57% 133.7 2012
Thermoelectric
Monomial Cost (US$/MWH) @ FP
Variable Charges
US$/MWH37% 57% 90%
MDMV 20 1,348 15.4 117.3 97.7 84.1 2011 60.6
PFBC Coal 150 1,829 18.9 97.0 73.1 56.4 2013 27.7
CC LNG 600 912 11.2 89.9 75.8 66.0 2013 49.0
5176-ANNEX3.pdf 112 5/19/10 1:12 PM
113
Reliability of Power Supply
49 The least-cost generation expansion plan is determined using the SUPEROLADE planning model and adjusted to meet reliability standards using the stochastic dual dynamic programming (SDDP) optimization model.
Source: Authors’ calculations, 2007.
CIF fuel prices
Bunker 3%S 38.0 US$/bbl
Coal 69.6 US$/ton
LNS 5.9 US$/MBTU
Table A3.10 Costs for Generation Candidate Projects 2007 Prices—Adjusted Investment Costs for Coal and LNG
Thermoelectric
Cap (unit) MW
Investment Cost + IDC US$/kW
Fixed Charges S$/kw-month
Monomial Cost (US$/MWH) @ FP
Earliest Date for Start of
Operations
Variable Charges
US$/MWH37% 57% 90%
MDMV 20 1,348 15.4 117.3 97.7 84.1 2011 60.6
PFBC Coal 150 1,829 18.9 97.0 73.1 56.4 2013 27.7
CC LNG 600 912 11.2 89.9 75.8 66.0 2013 49.0
regasifi cation plant (US$266/kW) is included in the investment cost of the plant instead of considering it as an additional fuel cost. The results indicate that the levelized generation costs of coal-fi red plants will increase and will be similar to the cost of gas-fi red CCGT plants, but still competitive with MSD plants.
Least-Cost Generation Expansion PlansThe generation expansion plan prepared by ENEE in late 2006 was revised49 on the basis of the new demand projections, fuel prices, and earliest commissioning date for the new generation projects considered as candidates. The results for the three scenarios show that all the expansion plans include the same hydroelectric projects (Cangrejal, Patuca 3 and 2, Tornillito), and coal-fi red plants:
• The most competitive projects are introduced in the expansion plan at the earliest commissioning date. For example, the expansion plan prepared by ENEE selected Patuca 3 and Patuca 2 in 2011 and 2013, Tornillito by 2012, and coal-fired plants in 2013, the earliest commissioning dates assumed for these projects. The expansion
plan used by ENEE to calculate the marginal generation cost that was adopted in 2007 assumed that coal-fired plants could be commissioned by 2011.
• The postponement o f the ear l ies t commissioning dates for coal-fi red plants and new hydroelectric projects to 2013 forced the selection of MSD project by 2011 (the best option among candidates that can be commissioned by that date) to meet the defi cit in supply before 2013.
• The defi cit of generation reserve estimated for 2010 was reasonable. For example, in the base-case scenario the generation expansion plan calls for the commissioning of 250 MW in emergency generation by 2010, and the defi cit in reserve for 2007 was 275 MW.
• The generation capacity additions for the three scenarios select the same generation technologies for 2007 to 2015, with differences in the capacity that is required in MSD in 2011, the additions in emergency generation by 2010, and the capacity of coal plants, which can be explained by differences in the peak demand (low, base, and high scenarios) and the assumptions on the earliest commissioning dates (ENEE case) (Table A3.11).
The least-cost solution selected by SUPEROLADE is quite sensitive to minor changes in the assumptions and to the simulation of the
5176-ANNEX3.pdf 113 5/19/10 1:12 PM
HONDURAS: POWER SECTOR ISSUES AND OPTIONS
114
operation, because there are small differences in the present values of investment and operation costs between the optimal solution and second-best expansion sequences:
• Patuca 3 is marginally competitive based on the revised investment costs. With small variations in the demand scenario or price assumptions, in some cases this project is not selected at all or is postponed in the generation expansion sequence. It was decided to force the commissioning of Patuca 3 by 2013, taking into account that the implementation of this project may open the door to the development of Patuca 2 (a low-cost but controversial project for its environmental impact on a protected area), an important project to diversify energy sources and reduce generation costs.
• A large capacity in coal-fi red generation plants is selected to meet demand increases and substitute for existing thermal generation, a decision that is not supported by the results of SDDP. For example, in the revised base case, 600 MW of coal-fi red plants are selected in 2013, increasing the capacity reserve to 38 percent. Simulations of the economic operation of the generation system showed
that a more gradual commissioning of thermal plants could marginally reduce the present value of investment and operation costs.50
The PPAs with Elcosa and Lufussa I for 120 MW expire in 2010, so the plants will become available in the market. The current PPAs have high fi xed and variable charges and should not be extended under the same conditions. ENEE’s expansion plan did not consider these plants after 2010. However, these plants may be the best alternative to reduce the supply defi cit before new, low-cost options are available by 2013, if competitive capacity and energy charges can be obtained. In the revised generation expansion plans, it was assumed that the capital charge could be much reduced and that the energy charge would remunerate only fuel and operation and maintenance costs. Under these conditions, it would be justifi able to continue having recourse to these plants.
50 An expansion sequence that selects 300 MW of coal-fi red plants in 2013, 100 MW in 2014, and 200 MW in 2016 resulted in a present value of investment and operation costs that is marginally lower than selecting 600 MW in 2013. One explanation for these results is that the cost differences between generation sequences is small (in SUPEROLADE) and that a more detailed simulation of the operation provided by SDDP gives a different result.
Table A3.11 Generation Expansion Plans 2007–2015—Additions of Generation Capacity
ENEE Medium Low High
Leasing 300 250 160 340
Thermal expansion 90 90 90 90
MDMV 300 160 80 280
Hydro 570 570 570 570
Renewables 161 161 120 120
Coal 600 400 400 600
Withdrawals –543 –373 –283 –463
Total 1478 1258 1137 1537Source: Authors’ calculations, 2007.
5176-ANNEX3.pdf 114 5/19/10 1:12 PM
115
ENEE’s Creation and Golden Years—Crisis and the Electricity Law ENEE was created in 1957 as an autonomous public service organization, by means of Decree 48, the Ley Constitutiva de la Empresa Nacional de Energía Eléctrica—the Constitutive Law. Its object is defi ned broadly as the promotion of the country’s electrifi cation through the study, construction, and operation of electrifi cation works; government representation in any electric company in which the government was a shareholder; and providing assistance to any private generator or distributor that would require it.
ENEE is governed by a board of directors the composition of which has varied as institutions have been transformed or eliminated. Today, it is formed by the following:
• Minister of Natural Resources and the Environment, who chairs the board
• Minister of Public Works, Transportation and Housing
• Minister of Finance• Minister of Industry and Commerce• Minister of Foreign Cooperation• A representative of the Honduran Council
of Private Enterprise (COHEP)
The board appoints a general manager, who acts as its secretary but has no vote. In practice, the appointment by the board is only a formality, since the general manager is really chosen by the country’s president.
The Constitutive Law states that ENEE will exert its activities subject to regulations to be issued by a National Electrical Energy
Historical BackgroundAnnex
4
Commission. This regulatory body, however, was not created. The Board was responsible for, among other things, setting ENEE’s tariffs. It was also responsible for issuing “the enterprise’s regulations.” This obviously refers to the company’s internal regulations, but, given the absence of the foreseen regulatory agency, the board issued on this basis the technical regulations applying to electric public service.
Thus, the operations and regulatory roles were combined in ENEE from the beginning. The ministry chairing the board—originally the Ministry of Public Works—did not have the organization or expertise to develop regulations to be imposed on the utility, or to supervise ENEE’s operations. In practice, ENEE was the organism through which the government made policy, defi ned strategy, issued regulations, and set electricity prices.
Article 81 of the Electricity Law of 1994 allows ENEE to continue operating under its Constitutive Law, but with the following changes:
• It would no longer set its own tariffs.• It would be freed from restrictions the
Constitutive Law had imposed on it: to acquire participation in “Limited Responsibility” companies and to provide payment guarantees.
• It would no longer be tax-exempt. ENEE had been exempted from all taxes “at the national, municipal or district levels.”
The Electricity Law also makes clear that sector regulations would henceforth be issued by the Ministry in charge of energy, and not by ENEE’s board of directors, as the practice had been.
5176-ANNEX4.pdf 115 5/19/10 1:13 PM
HONDURAS: POWER SECTOR ISSUES AND OPTIONS
116
The Electricity Law assigned to ENEE the following responsibilities:
• To ensure the power system’s economic dispatch, that is, to be the system operator.
• To prepare system expansion plans, which it has to submit to the regulator every two years for review.
• To contract for the import and export of electrical energy, “in conformity with existing legal norms, and established uses and procedures,” granting it exclusivity in this domain.51
The electricity law ordered ENEE to divide its distribution networks by regions and, after Comisión Nacional de Energía’s (CNE’s) approval of the partition, to sell those networks to cooperatives, municipalities, workers’ associations, other similar types of groups, or to private companies. According to the Law (article 24), electricity distribution was to be carried out “in priority” by private companies under a concession regime.
At the time ENEE was created, electric power service was provided in many towns by private utilities, in other cases by municipalities, and in the capital by the government. There was no transmission network; all centers functioned as isolated systems.
During its fi rst 25 years of operation, ENEE, with the technical and fi nancial support of the World Bank and other international fi nancial organizations, expanded very quickly. It built one hydroelectric project after another, extended and reinforced the transmission network, incorporating all economically active areas of the country into the national grid, interconnected with Nicaragua in 1976, and through that country with Costa Rica (1982) and Panama (1986).
The largest project ENEE undertook was the hydroelectric plant of El Cajón (300 MW), commissioned in 1985. Peak demand that
year reached 220 MW, and previously existing installed capacity was 250 MW. The demand growth projections on which the decision to proceed had been based had not materialized. The country was left with a large excess capacity and ENEE with a heavy debt burden.
Because of the large excess capacity, there was a hiatus in project construction after El Cajón. It was not until 1990 or 1991 that ENEE again approached the World Bank to seek fi nancing for a new project. But the World Bank was then changing its policy of support for the power sector and informed ENEE that it would have to look for private fi nancing. ENEE prepared and launched a bidding process in 1993, which unfortunately failed. Time had been lost, rains had been bad for three years in a row, and this precipitated the rationing that opened the way for reform.
The Legal FrameworkThis section examines the underlying statutes that currently govern the sector, viz. the Electricity Law enacted in 1996, and the renewables decree of 1998.
The Electricity LawThe sources of the Electricity Law are to be found in South American legislation, and for tariff policy particularly, in Peru’s 1992 Electricity Concessions Law. But there is one important exception; the source for the use of the system’s short-run marginal cost as a price signal for generators is an idea taken from U.S. law, the Public Utilities Regulatory Policy Act, or PURPA, of 1978.
Offi cial policy for the electric power sector, as established in the Electricity Law, can be summarized in the following 17 points:
1. Electric power generation, transmission, and distribution are open to private-sector participation and investment.
2. Any company wishing to do business in the power sector needs to obtain an operations license (called by the law “operations
51 Since, at the time the Electricity Law was enacted, the Treaty for the Central American Electricity Market had not been signed yet, it can be argued that the meaning of this exclusivity must be reinterpreted taking into account the Treaty and regulations that derive from it.
5176-ANNEX4.pdf 116 5/19/10 1:13 PM
117
Historical Background
contract”) from the ministry responsible for the energy sector. The law requires that this contract be approved by the National Congress.
3. The executive, through the ministry responsible for the energy sector, is responsible for issuing, at the regulator’s proposal, technical regulations applicable to the power sector.
4. According to the law, electric power distribution is to be carried out “in priority” by private companies under concession from the executive. The law ordered ENEE to divest its distribution assets.
5. The state reserves for itself the activity of system operations, to be carried out by ENEE’s Dispatch Center. The Center is granted full authority over transmission and generation facilities for this purpose. The Dispatch Center will determine how much energy each generating unit has to produce, valuing generated energy and nonsupplied energy at their economic cost. This implies determination of the system’s hourly marginal cost of generation.
6. Generators can sell directly to distributors and to large consumers. The latter must be certifi ed as such by the regulator. A user qualifies as a large consumer when it is connected at a voltage of 34.5 kV or higher, and has a peak demand of 1,000 kW or more. These conditions have to be revised every year by the regulator, and gradually lowered so as to increase the number of large consumers in the system (article 11 of the Reglamento de la Ley Marco).
7. Transmission and distribution networks are subject to an open access rule. Owners have to allow their use by third parties against a regulated price. CNE defi nes the method to determine that price.
8. ENEE guarantees purchase of all energy offered by generators at their own initiative, on condition the price does not exceed the system’s short-run marginal cost. (This is the idea fi rst introduced in power sector legislation in the United States in 1978 by
PURPA.) ENEE can also take the initiative to call for bids from generators to procure capacity and energy when necessary.
9. ENEE is authorized to contract for electrical energy imports and exports, in conformity with existing legal norms, and with established uses and procedures, and is granted exclusivity in this activity. This provision should therefore be interpreted to facilitate transactions between market agents, taking into account the Treaty for the Central American Electricity Market, which was signed at a later date. Generators can export after national requirements are satisfied. They have to pay ENEE transmission wheeling charges and administrative fees.
10. The law foresees a future undefi ned “further liberalization of the market” to be approved by the Energy Cabinet at the proposal of the regulator.
11. As an alternative to the possibility of freely negotiated contracts between generators and distributors, the latter are guaranteed supply of their capacity and energy requirements at a regulated price, the Busbar tariff. This price has to be proposed every year by “the generators”52 to the regulator, which approves it.
12. The law establishes (article 20) an obligation for distributors to have with generators valid supply contracts of at least fi ve years’ duration. But the law fails to indicate a minimum quantity. (The corresponding provision in the Peruvian Law says that a distributor is obliged to have valid contracts with generators so as to guarantee satisfaction of its total power and energy requirements during the coming 24 months as a minimum.) Based on this and on point (h) above, the responsibility to satisfy the Resource Adequacy Requirement—that is, “the obligation for Load Serving Entities to
52 In the Peruvian Law, which the electricity law took as a model, the system operator, which groups the generators and the transmission owner, proposes this price. The system operator also “guarantees security of supply,” that is, is responsible for ensuring generation “resource adequacy.”
5176-ANNEX4.pdf 117 5/19/10 1:13 PM
HONDURAS: POWER SECTOR ISSUES AND OPTIONS
118
acquire resources to cover peak loads plus 15 percent to 17 percent planning reserves,”—falls implicitly on ENEE.
13. ENEE is responsible for planning system expansion. Every two years, it has to submit to the regulator expansion plans for review, which in turn has to submit them for approval to the Energy Cabinet. For private companies, these plans are only indicative. Implicitly, they are mandatory for ENEE concerning procurement of new-generation capacity when required, and transmission expansion.
14. In determining the optimal expansion plan, ENEE shall prefer any sequence including renewable-based generation, provided the net present value of the sequence’s cost does not exceed by more than 10 percent that of the least-cost expansion plan.
15. Tariffs to fi nal users are to be proposed every fi ve years by distributors to the regulator for review and approval. The review process includes public audiences to hear the opinions of consumers. In calculating tariffs to fi nal users, the distributor has to calculate the cost of its capacity and energy purchases, valuing them at the Busbar tariff.
16. Both the Busbar tariff and the tariffs to fi nal users are to be accompanied by automatic adjustment formulas allowing the utilities to modify the tariffs when their costs vary by more than 5 percent under the effect of external factors.
17. Tariffs must satisfy the following: i. They have to ensure the utilities’ fi nancial
health, but on condition of efficient operations.
ii. They have to induce effi cient use, that is, refl ect as closely as possible the economic cost of supply.
iii. They can include a cross-subsidy in favor of small residential consumers.
Incentive Legislation to Promote Renewable Energy SourcesIn 1998, the National Congress enacted Decree 85-98, introducing incentives for the development of renewable energy sources
for electricity generation. This decree was later reformed, and then complemented by other decrees with the same purpose. These decrees were inspired by Spanish legislation on the matter.53 They are based on the principle introduced by article 12 of the Electricity Law: ENEE will guarantee purchase—in this case by means of long-term contracts that can have a duration of up to 20 years—paying a negotiated “base price” that cannot exceed the short-run generation marginal cost valid at the time of contract signature. In addition, for plants of less than 50 MW, ENEE will pay a premium equal to 10 percent of the same short-run marginal cost.
Every year that U.S. inflation exceeds 1.5 percent, the contractual base price is to be increased by 1.5 percent. The price can be differentiated by time of day or can be a single price referred to the global average short-run marginal cost. No later than January 15 of each year, SERNA has to publish the values of the short-run marginal cost that will apply for the year. ENEE has to calculate these values and submit them to CNE for review. The short-run marginal cost values have traditionally been determined separately for peak-, intermediate-, and low-load conditions, and for dry and rainy seasons.
Decree 85-98 and its reforms also establish tax exemptions in favor of developers: import and sales taxes on equipment, and a fi ve-year income tax holiday.
National and Regional Power MarketsThe legal framework described in the preceding section sets the foundation for a national electricity market, albeit rudimentary. That market comprises two types of transactions:
53 Particularly, Spain’s Electricity Law (Ley 154, 1997 del Sector Eléctrico), and Real Decreto 2818 of 1998 on electricity generation using renewable energy sources.
5176-ANNEX4.pdf 118 5/19/10 1:13 PM
119
Historical Background
1. Spot transactions, with ENEE as the buyer. 2. Buying and selling between agents on the
basis of contracts.
The Spot MarketAccording to the law, generators can take the initiative in selling to ENEE, with the utility guaranteeing purchase on condition the price offered does not exceed the system’s short-run marginal cost. If the true system’s marginal cost was determined and communicated to all interested parties at all times, this would reproduce the condition of a competitive market in which price equals marginal cost. There are two generators that today take advantage of this provision and sell to ENEE at the published time-of-day marginal cost.
A related type of transaction has developed in practice, derived from ENEE’s long-term PPAs, which are all dispatchable—that is, they do not require purchasing a minimum quantity of energy. ENEE pays fixed charges for the capacity, and a variable charge for energy only if it calls on the generator to produce. As new private plants with lower-priced PPAs began coming online, the older plants saw their energy sales reduced, so they began making weekly offers “on the side” at an energy price lower than their contractual variable charges.
This practice continues. The prices offered vary with time of day. When the generators know all plants will be needed, they quote the contract price; at other times, they offer discounts. Furthermore, given this experience, the last two PPAs with Lufussa (210 MW) and ENERSA (200 MW) stipulate that the generator will make daily or weekly offers on the variable charge, with the contract setting only the maximum these offers cannot exceed.
In this manner, ENEE as system operator and buyer can and does receive from generators (1) offers of capacity not tied in PPAs, accepting the published short-run marginal cost; and (2) offers of capacity under PPAs at prices below the contractual variable charges. The prices offered in the latter case are normally above the offi cial system’s short-run marginal cost.
The Electricity Law does not foresee the reciprocal operation—that is, purchase by distributors or large consumers from ENEE at a price not to fall short of the system’s marginal cost.
Several problems limit the potential benefi ts of this system. The first has to do with the defi nition of short-run marginal cost included in article 1 of the Electricity Law:
It is the economic cost of supplying an additional kilowatt and kilowatt-hour over a period of fi ve years.
The definition of the short-run marginal cost as an average over fi ve years tends to produce values that are lower than present-day energy prices. Although this feature is consistent with the use of the short-run marginal cost as a tariff component, as in the Peruvian Law, it is inconsistent with the idea of spot transactions introduced by article 12, which is clearly inspired by PURPA (averaging for tariff calculations is already indicated in the law’s chapter on tariffs). For the latter, an hourly marginal cost is what makes sense.
In addition, fuel-price volatility along a year can make the real marginal costs differ considerably from the official values.54 For this, however, article 18 of the Regulations (Reglamento de la Ley Marco) offers a remedy, because it permits adjustment of the average short-run marginal cost along the year by means of indexation formulas approved by the regulator. This mechanism, which has been applied only during 2006, would allow the system’s short-run marginal cost to better refl ect actual costs as long as the defi nition has not been revised.
By contrast, at present, ENEE’s Dispatch does not determine the system’s hourly marginal cost. ENEE uses a well-known software tool
54 Several years ago, a sugar mill offered to sell energy in the off-season at $70/MWh. ENEE had to reject the offer because the offi cial short-run marginal cost was lower, even if it was at the time buying energy at higher prices in the regional market.
5176-ANNEX4.pdf 119 5/19/10 1:13 PM
HONDURAS: POWER SECTOR ISSUES AND OPTIONS
120
for medium-term operations planning, the Stochastic Dual Dynamic Programming (SDDP), but it has never enabled the program’s short-term module, which the Dispatch Center could use for day-to-day dispatch and would allow determining the hourly short-run marginal cost. Determination and publication of an hourly marginal cost would also be consistent with the rules and practice in the regional electricity market, making for a simpler interface with that market.
The defi nition of short-run marginal cost refers to both the cost of power, or capacity (a kilowatt), and the cost of energy (a kilowatt-hour). This is consistent with the theoretical foundation for remunerating generation at the short-run marginal cost, which shows both energy and power (contributed during peak) have to be paid for at their respective marginal costs to ensure full cost recovery. However, ENEE today calculates only an average marginal cost of energy. It does not determine a marginal cost of capacity.
Because for years ENEE has not been allowed to calculate tariffs, of which the short-run marginal cost is an essential component passing through generation costs to users, ENEE tends to look at the short-run marginal cost only as a price it will have to pay. And because of its fi nancial diffi culties, it faces a confl ict of interest, which has led it to try to limit the average marginal cost, thus undermining its function as an incentive to encourage capacity supplies at the initiative of private investors.
To better exploit the potential of the legal provisions described, the system’s hourly short-run marginal cost should be determined in an impartial, objective manner. For this, system operations should be made into a separate business unit, allowing it to put some distance between itself and ENEE as generator, transmitter, distributor, and trader. This business unit should also incorporate a committee of the other “market agents,” generators, and large consumers to strengthen that separation. Procurement of the required software tools can be included in the current project to build a new Dispatch Center, which
is fi nanced by the Inter-American Development Bank.
Contract MarketThe Electricity Law allows generators to sell directly to distributors and large consumers. ENEE can call for bids from generators for the supply of capacity and energy whenever it deems it necessary to ensure satisfaction of demand. In addition, Article 20 of the Electricity Law introduces the obligation for distributors to have contracts with generators that are of at least fi ve years’ duration.
Decree 85-98 and its reforms, establishing incentives for the development of renewable energy sources, introduced contracts taking the system’s short-run marginal cost as a reference for price: ENEE will purchase the production of all renewable-based generators by means of long-term contracts, paying a negotiated base price that cannot exceed the short-run marginal cost valid at the time of contract signature. The base price of energy in those contracts can be a single value, or it can be differentiated by time of day. The short-run marginal cost values that will be valid for a given year have to be published in the Gazette no later than January 15 of that same year.
Large consumers have to be recognized as such by the regulator to be able to contract directly with generators. The initial conditions to qualify as a large consumer were defi ned in the Law: to be connected at a voltage of no less than 35 kV and to have a yearly peak demand of no less than 1,000 kW. The regulations derived from the Electricity Law, Reglamento de la Ley Marco, state that these conditions will be reviewed annually by CNE, which, in so doing, shall keep in mind the following:
[T]he purpose of the Law is to promote competition and effi ciency in supply, so that the list of clients classified as large consumers should be as ample as possible, within the criteria indicated by the Law, as revised by the Commission.
5176-ANNEX4.pdf 120 5/19/10 1:13 PM
121
Historical Background
The largest contracts that ENEE has today are the product of bidding processes initiated by ENEE itself. ENEE also has a relatively large number of contracts with small power plants using renewable energy sources.
TransmissionDirect sales from generators to large consumers require use of the grid, and indeed, article 18 of the Electricity Law, imposes on transmission and distribution owners the obligation to allow use of their facilities by third parties against a regulated price. The regulator issued in 2000 a method, transmission grid database, and software to be applied by ENEE in determining transmission prices for specifi c transactions. The method charges a proportional amount of all fi xed and variable costs of all parallel paths taken by power fl ows to each individual transaction. Costs increase with distance, irrespective of the local marginal costs of energy.
Today, there are only two cases of generators selling directly to industrial consumers, and none uses the previously indicated transmission-pricing scheme. In the fi rst case, ELCOSA sells to a group of industrial clients. The rules applying to this case were agreed upon by ELCOSA and ENEE in 1993, before enactment of the Electricity Law. The wheeling charges and transmission losses the generator is responsible for are established in ELCOSA’s PPA. The other case is ELCATEX, an industrial co-generator selling to neighboring factories, but using medium-voltage lines it built for the purpose.
There have been several cases of industrial clients seeking to buy directly from generators, but none of the deals has materialized. The interested parties have complained that wheeling charges quoted by ENEE were too high. In view of this, CNE and ENEE have proposed: (1) to hiring specialized consultants to develop a new transmission pricing method, similar to the one adopted for the regional market, with a yearly access charge for the right to use the grid and only variable costs charged to each transaction; and (2) a simple postage-
stamp scheme for the interim. The latter was developed and is only awaiting the executive’s approval of a required change in the regulations to be adopted.
The modernization of the transmission pricing scheme is a condition to promote greater participation by large industrial consumers in the market. Another factor is ENEE’s tariffs. On the one hand, as long as ENEE’s industrial tariffs are below economic cost, large industrial users have no incentive to buy directly from generators—except, that is, if they come to fear ENEE’s diffi culties will lead to rationing of supply. On the other hand, if too large a surcharge is imposed on industrial tariffs in order to fi nance the cross-subsidy in favor of residential consumers, there will be an incentive for industrial clients to leave, which will cause problems with the subsidy scheme.
The changes indicated can be proposed as part of the greater liberalization of the market foreseen in the Electricity Law, to be approved by the energy cabinet at the proposal of the National Energy Commission. A justifi cation for them is the upcoming beginning of the regional market operations in its defi nitive form.
The Regional Electricity MarketThe Sistema de Interconexión Eléctrica para América Central (SIEPAC) project includes the creation of a regional electricity market. This market is already operating under “transitional regulations” approved by the regional regulator, the Comisión Regional de Interconexión Eléctrica (CRIE). The Regional System Operator (EOR), is based in El Salvador. The transmission facilities to be built by the project will be the property of a regional transmission company, of which the state-owned transmission companies of all six countries, including ENEE, are shareholders. The facilities built by the project will raise the maximum level of power fl ows from the current 100 MW to about 300 MW initially, and to 600 MW later on.55
55 All SIEPAC lines will be built for double circuit, but will be equipped with only one circuit initially.
5176-ANNEX4.pdf 121 5/19/10 1:13 PM
HONDURAS: POWER SECTOR ISSUES AND OPTIONS
122
ENEE is already acting in the regional market by offering every day to sell any excess capacity available from its PPAs, and offering to buy energy any time the market price falls below the variable cost of the most expensive thermal plant it projects to have online.
The countries have recognized from the beginning that most benefi ts of the regional market would result from its larger size, making the following possible:
• More competition, because of the larger number of agents
• Introduction of lower-cost generation technologies that require a larger scale to be feasible
• Development of hydroelectric projects too large for only a national market
• Greater reliability of service, because of the larger, more robust transmission grid
SIEPAC has recently recognized that all national markets should in the end merge into a single regional market; the project’s Advisory Panel has recommended this as an objective. The countries have also begun to explore ways to promote regional power plants more aggressively, suggesting the creation of state-owned multinational companies to undertake such projects in the case of large hydroelectric sites.
This represents an evolution. While the regional operation rules were being drafted, the regional market was referred to as “a seventh market, superposed to the national markets.” Two studies on the regional market ordered by the IDB, one by Soledad Arellano and the other by Frank Wolak,56 pointed out that this vision was unrealistic; that agents would fi nd a way to exploit every opportunity for arbitrage; that the natural evolution would lead to a single market; and that, in fact, the ultimate goal should be a single integrated market for all six countries.
Being a party to the treaty, Honduras is formally committed to the development of the regional electricity market. However, the government needs to deliberately define its policy concerning SIEPAC and the regional electricity market, and make sure that this policy is promoted in a coordinated manner through its participation in the regional bodies, particularly in CRIE, to contribute to shaping the regional market for maximum value. In so doing, the government should adopt a broad view, recognizing that ENEE’s current structure as a vertically integrated utility is inconsistent with a market environment, and often puts it in confl ict-of-interest situations. In fact, article 5 of the Regional Market Treaty orders the unbundling of ENEE’s different activities into separate business units, and the keeping of separate accounts for each of them.
Consistent with the recommendation to facilitate participation of large consumers in the market, we think Honduras should promote maximum participation of national agents in the regional market. The regional market design recognizes that its benefi ts will increase with the number of participants, and that the countries should facilitate participation. SIEPAC has proposed that anybody recognized by the national authority as an agent of the national electricity market shall automatically be recognized as an agent of the regional market, having all the rights and obligations pertaining to that condition.
The government of Honduras can implement a policy of openness, promoting maximum participation in the regional electricity market by national generators, distributors, and large consumers by interpreting in a restricted way the “exclusivity” granted to ENEE by the Electricity Law concerning contracts for the importation and exportation of electrical energy. This can be done considering that “importation and exportation,” as limited to the two operations required to coordinate injection and withdrawal of the energy as part of the system operations process and to the transmission required:
a. The regional market agents in Honduras are free to enter into contracts with agents
56 M. Soledad Arellano, “Competencia en el Mercado Eléctrico de América Central,” Report for IDB’s Infrastructure and Financial Markets Division, April 2003; and Frank Wolak, “Report on Monitoring Competition in the Central American Electricity Market: The Case of El Salvador and Guatemala,” December 2003. Available at Frank Wolak’s website.
5176-ANNEX4.pdf 122 5/19/10 1:13 PM
123
Historical Background
in other countries to buy and sell electrical energy.
b. Regional market agents in Honduras have to enter into an agreement with ENEE as dispatcher and as owner of the transmission grid to ensure coordination of the operations needed for any physical transfer the contracts may require, and for energy transmission to and from the points where the buyer and the seller are connected.
It is recommended that the government adopt this interpretation in order to grant individual agents freedom to buy and sell between themselves.
One initial step needed to implement this solution is to offi cially defi ne by means of a technical regulation the “national market agent,” a designation not used by the Electricity Law. The defi nition should include all generation and distribution companies connected to the transmission grid and exceeding a given
minimum size, and large consumers that have been certifi ed by CNE as required by the law. ENEE’s different business units would each be counted as a different market agent, except for the unit in charge of system operations, which would be the national market administrator and not a market agent.
In making decisions about sector structure and operations looking to the future, the government should systematically take into account the regional dimension and the market structure surrounding ENEE. ENEE’s procurement of new generation capacity, in particular, must recognize the regional dimension. The bidding documents should allow supplies from other countries, at least from those with which Honduras has borders. Transmission expansion planning also needs to keep in sight the opportunities of both buying and selling in the regional market. Transmission projects may be justifi ed just to import or export energy.
5176-ANNEX4.pdf 123 5/19/10 1:13 PM
5176-ANNEX4.pdf 124 5/19/10 1:13 PM
125
Honduras’s Electricity Pricing SystemHonduras’s Electricity Law followed Peru’s Law on Electrical Concessions of 1992 when defi ning the country’s electricity tariff system. The scheme corresponds to the industry structure the law envisioned, with multiple generators and multiple private distributors. It can be summarized in the following three points:
a) Distributors have the option of buying power and energy at the high-voltage transmission busbars at a regulated price, designated as the Busbar tariff. There were to be as many different Busbar tariffs as distributors. This price refl ects generation and transmission costs. The Busbar tariffs were to be calculated every year by “the generators” and submitted to the Comisión Nacional de Energía (CNE) for approval and publication. In the Peruvian case, the Busbar tariffs are calculated by the system operator, which in Peru is an association of the generators and the transmitter.
The generation cost included in the Busbar tariff is the average short-run marginal cost of generation estimated over a period of fi ve years into the future. Although the Electricity Law does not give details on the respective calculations, the definition of short-run marginal cost in its article 1 expressly refers to both the cost of capacity and the cost of energy. In view of this, CNE has instructed the Empresa Nacional de Energía Eléctrica (ENEE) to calculate both and include them in the Busbar tariff.
Pricing PoliciesAnnex
5
ENEE calculates the short-run marginal cost of energy using the Stochastic Dual Dynamic Programming (SDDP) simulation model for system operations. According to the Electricity Law, generators’ variable costs are taken as the corresponding economic costs, not the contractual prices for the case of plants under power purchase agreements (PPAs). The economic variable costs to be used are authorized by CNE considering the price of fuel at the plant’s site, as published by the Technical Unit for Petroleum, standard fuel-effi ciency and lube-oil consumption, according to the type and age of the plant, and a standard variable operation and maintenance cost also dependent on the type and age of the plant.
Traditionally, ENEE has calculated average values of the short-run marginal cost of energy separately for three different hourly blocks, corresponding to peak, low, and intermediate load conditions, and each of those separately for the dry and the rainy seasons.
Transmission cost is included in the Busbar tariff as the average total transmission cost estimated also over five years into the future. Total transmission cost includes annualized investment costs and operation and maintenance costs, particularly power and energy losses, all corresponding to effi cient management.
The Electricity Law indicates that the generators have to submit to CNE every year, together with the proposed Busbar tariffs, indexation formulas they will use to modify their tariffs automatically in response to
5176-ANNEX5.pdf 125 5/19/10 1:13 PM
HONDURAS: POWER SECTOR ISSUES AND OPTIONS
126
changes in fuel prices and the exchange rate. The generators have to apply these formulas whenever their costs change under the effect of the indicated external factors by more than 5 percent with respect to those refl ected in the current tariff level. The modifi ed tariffs must be published in the offi cial Gazette to become effective.
The annualized costs of investment are calculated, applying a discount rate approved by CNE. This rate is today equal to 12 percent. The offi cial discount rate is intended to indirectly determine the return on equity for investors.
b) The retail tariffs, or tariffs to fi nal consumers, are the prices that distributors are authorized to charge to fi nal users. These tariffs refl ect the cost of power and energy purchased in bulk at the Busbar tariff by the distributor, plus the distribution value added, a concept taken from the Peruvian Law and usual in South American power sector legislation. The distribution value added comprises annualized investment costs, operation and maintenance costs, particularly power and energy losses, and commercialization costs. These costs have to be those of a “model, effi cient, distribution company.”
Distributors have to determine their unit distribution value added separately for the different types of “zones” found within their operation area, and then average those costs using weights determined by CNE. This is taken from the Peruvian Law, and aims to make explicit the cost of service to areas with different load densities and customer-class mix, even if the tariff applied will be the same for all.
Because the distribution value added has to be based on the costs of a model, effi cient, distribution company, CNE and ENEE have to determine standard distribution costs defi ning that model company. These costs comprise standard investment costs corresponding to optimal design and construction standards for primary and secondary networks; standard losses for different load conditions; and other standard
operation and maintenance costs, and standard commercialization costs.
Distributors have to propose indexation formulas, together with the retail tariffs. They will use these formulas to modify their tariffs automatically when their costs vary by more than 5 percent with respect to the costs refl ected in the current tariff level due to changes of the Busbar tariff and the exchange rate. The modifi ed tariffs must be published in the offi cial Gazette to become effective.
The Electricity Law says distributors will calculate every fi ve years the retail tariffs, together with their indexation formulas, and submit them to CNE for review and approval. The review process must include public audiences called by CNE to hear the opinion of users. Article 53 of the Law says that tariffs and adjustment formulas are to remain valid for five years, but it authorizes recalculation before that time if the accumulated adjustment becomes as large as the original tariff.
c) In addition to the cross-subsidy implicit in the averaging of distribution costs over different types of zones, the Electricity Law allows distributors to incorporate an explicit cross-subsidy in the tariff in favor of the “small residential consumers.” The Electricity Law defi nes small residential customers as those using less than 300 kWh per month. Article 46 establishes the following limits to the cross-subsidy:• Residential consumption between 0 kWh
and 100 kWh per month shall be billed at no less than 45 percent of cost.
• Residential consumption between 101 kWh and 300 kWh per month shall be billed at no less than 80 percent of cost.
• Residential consumption between 301 kWh and 500 kWh per month shall be billed at no less than 100 percent of cost.
• Residential consumption beyond 500 kWh per month shall be billed at 110 percent of cost.
• Consumption by all other classes shall be billed at between 100 and 120 percent of cost.
5176-ANNEX5.pdf 126 5/19/10 1:13 PM
127
Pricing Policies
These indications are satisfied by the following simple system. For residential consumers, the following conditions apply:• The first 50 kWh will be billed at 50
percent of cost.• All kWh above 50 will be billed at 110
percent of cost.
For all other consumer classes, all kWh will be billed at cost plus a surcharge, the same for all. This surcharge will be determined so that it shall exactly fi nance the net subsidy to residential consumers.
With this tariff system, residential users who consume 100 kWh in a month will be billed exactly 80 percent of cost, and if they consume 300 kWh they will be billed exactly 100 percent of cost. Figure A5.1 shows the variation of the price/cost ratio for residential consumers as a function of kWh used per month.
Because ENEE remained vertically integrated, it is responsible as generator for calculating and proposing the Busbar tariff every year, and as distributor, the tariffs to fi nal consumers every fi ve years. However, it has not complied with these regulations.
Normalization of ENEE’s TariffsCNE has calculated a reference tariff based on economic costs applying the methods prescribed by the Electricity law and incorporating a cross-subsidy as described. Table A5.1 shows the reference tariff and compares it to the existing tariff. In order to limit the tariff increase for users below 100 kWh per month, the table also reallocates the government’s direct subsidy without changing its total amount.
An increase in tariffs will produce a reduction in electricity consumption and a
Figure A5.1 Relationship between Sale Price and Cost per kWh
kWh/month
Source: Authors’ calculations, 2007.
5176-ANNEX5.pdf 127 5/19/10 1:13 PM
128
Tab
le A
5.1
R
efe
ren
ce T
arif
f B
ase
d o
n E
con
om
ic C
ost
s
Use
r C
lass
and
Con
sum
ptio
n
Blo
ck
Nu
mber
of
C
lien
ts
Aver
age
Eco
nom
ic
Cos
t $
/kW
h
Ref
eren
ce T
ari
ff
Tari
ff
Incr
ease
In
%
Extr
a
Inco
me
for
EN
EE
US
$
Cu
rren
t A
ver
age
Tari
ff $
/kW
h
Fin
al
Pri
ce
aft
er
Dir
ect
Su
bsi
dy
Rea
lloca
ted
Dir
ect
Su
bsi
dy
U
S$
Fin
al
Pri
ce a
fter
R
eallo
cate
d
Subs
idy $
/kW
h
Pri
ce
Incr
ease
aft
er
Dir
ect
Su
bsi
dy
Fix
ed
Char
ge
$/c
lient-
mo
Dem
an
d
Ch
arg
e $
/kW
-m
En
ergy
C
harg
e $
/kW
h
Aver
age
Tari
ff $
/kW
h
A-R
esid
enti
al
0–2
0 k
Wh
/m
on
th8
6,4
98
0.4
04
31.
00
0.0
65
70
.20
21
120
.5%
70,0
34
0.0
917
0.0
678
92
,83
80
.05
57
–17.
8%
21–
50
87,
84
00
.1878
1.0
00
.06
57
0.0
93
99
5.1%
142
,53
40
.04
81
0.0
32
711
8,9
750
.05
57
70.2
%
51–
100
132
,80
40
.1578
1.0
00
.144
50
.105
78
4.7
%4
87,
619
0.0
572
0.0
39
64
33
,64
10
.06
26
58
.0%
101–
130
77,
017
0.14
741.
60
0.14
45
0.12
58
89
.4%
572
,94
30
.06
64
0.0
472
39
3,2
760
.08
51
80
.4%
131–
150
51,
34
40
.1474
1.6
00
.144
50
.125
88
9.4
%3
81,9
61
0.0
66
40
.04
7216
9,9
42
0.0
99
411
0.8
%
151–
30
02
42
,72
30
.140
81.
60
0.14
45
0.13
36
70.6
%2
,86
8,8
04
0.0
783
0.0
65
60
0.13
36
103
.5%
30
1–5
00
83
,36
80
.136
72
.00
0.14
45
0.13
94
57.
2%
1,5
86
,76
40
.08
87
0.0
88
70
0.13
94
57.
2%
>50
04
3,7
47
0.13
36
2.2
00
.144
50
.142
63
0.7
%1,
319
,35
60
.109
10
.109
10
0.14
26
30
.7%
Tota
l R
esid
enti
al
80
5,3
41
0.14
20
0.13
39
7,4
30
,016
0.0
85
21,
20
8,6
720
.126
0
B-C
omm
erci
al
Sin
gle
ph
ase
53
,95
00
.1318
2.10
0.13
55
0.13
86
4.3
%2
12,8
53
0.13
28
0.13
28
Th
ree
ph
ase
5,7
95
0.12
91
2.10
0.13
55
0.13
57
2.2
%17
1,0
46
0.13
28
0.13
28
Tota
l C
om
mer
cial
59
,74
50
.130
22
.100
.135
50
.136
93
.0%
38
3,8
99
0.13
28
0.13
28
Indu
stri
al
Med
ium
V
olt
age
134
0.10
702
1.0
38
.90
170
.08
98
0.11
24
6.9
%3
24
,60
80
.105
20
.105
2
Indu
stri
al
Hig
h V
olt
age
180
.09
85
210
.27
7.7
910
0.0
85
10
.103
510
.9%
52
3,3
56
0.0
93
30
.09
33
Pu
blic
Sec
tor
5,0
41
0.12
54
2.10
0.13
110
.1319
–3.2
%–5
6,2
88
0.13
62
0.13
62
Mu
nic
ipal
Sin
gle
ph
ase
62
50
.126
72
.00
0.12
47
0.12
67
30
.2%
17,5
95
0.0
97
30
.09
73
Th
ree
ph
ase
728
0.12
56
2.0
00
.124
70
.125
62
9.1%
43
,62
50
.09
73
0.0
97
3
Tota
l M
un
icip
al
1,3
53
0.1
25
92
.00
0.1
24
70
.12
59
ı29
.4%
61,
22
00
.09
73
0.0
97
3
Tota
l E
NE
E8
71,
63
20
.12
75
0.1
275
23
.4%
8,6
75
,17
20
.10
34
0.1
00
11,
20
8,6
72
0.1
24
2
Sou
rce
: Au
tho
rs’ c
alc
ula
tion
s, 20
07.
5176-ANNEX5.pdf 128 5/19/10 1:13 PM
129
Pricing Policies
redistribution of residential users among the different consumption blocks. Because the redistribution is not known, the table shows comparisons between the old and new tariffs based on the same consumption structure.
Table A5.2 compares the current distribution of both the cross- and direct subsidies with the new distribution. In both cases, the targeting is much improved.
Calculation of Economic Costs of SupplyCNE regularly calculates the economic cost of electricity supply by ENEE in order to monitor differences between the current tariff and those costs. The costs used as a basis for the reference tariff were calculated following the methods prescribed by the Electricity Law as developed by CNE itself. The assumptions and data used in the calculation are described as follows.
Generation costs include: (1) the short-run marginal costs of energy during peak, intermediate, and low load conditions, calculated by ENEE for the five-year period 2006–10, adjusted for fuel prices of July 2006, equal respectively to: US$86.5, US$77.8, and US$73.6 per MWh; and (2) a marginal cost of capacity estimated by CNE at US$7/kW/month based on the unit fi xed costs of a gas-turbine plant.
Transmission costs were estimated by CNE for 2006 to 2010, including annualized investment costs of both existing installations and projected additions, annual costs of power and energy losses in the grid, and other administration, and operation and maintenance costs calculated as 2 percent of the estimated original investment. Existing installations are valued at replacement cost, using ENEE’s Engineering Division typical costs, and then depreciated. The annual investment cost is calculated using a discount rate of 12 percent and a useful life of 30 years, save for land and rights of way, for which duration is indefi nite.
Future transmission works and investment were those in ENEE’s investment program of
2001, which has varied little until today, since ENEE has not been able to execute those plans. Network technical-loss rates are differentiated for peak intermediate and low-load conditions. Global technical energy losses in the transmission network are 3 percent, corresponding to the fi ndings of a recent loss study. Energy losses are valued at the corresponding marginal generation cost of energy and power losses during peak at the marginal generation cost of capacity. The cost of energy losses is charged to the energy demand served, while the cost of investment, power losses, and operation and maintenance is charged to power demand.
Distribution costs are calculated separately for high- to medium-voltage substations and medium-voltage networks on one hand, and medium- to low-voltage transformers and low-voltage networks on the other. These costs include annualized investment costs, the costs of administration, operation and maintenance, particularly the costs of power and energy losses, and commercial costs. All these costs are estimated for a model effi cient distributor.
Investment costs for existing high-voltage/medium-voltage substations are estimated, as was the case for transmission applying typical unit costs to the equipment inventory. For the case of distribution networks, because ENEE does not have an inventory of its installations, lengths of lines (with all accessory equipment) and quantities of distribution transformers are estimated on the basis of global indexes supplied by ENEE giving meters of primary and secondary lines per user, and distribution transformer kVAs per peak kW served in low voltage.
To the quantities so determined are applied typical unit costs based on CNE’s research of ENEE’s own engineering data and of international data, and the total cost is depreciated assuming an estimated average remaining life of existing networks of 18 years out of a total 30. Investment costs for distribution networks are estimated from the growth projections of the number of consumers and peak demands, applying indexes
5176-ANNEX5.pdf 129 5/25/10 10:35 AM
Tab
le A
5.2
P
rop
ose
d R
eallo
cati
on
of
Cro
ss-
and
Dir
ect
Su
bsi
die
s
Blo
ck
kWh
/mN
um
ber
of
Use
rs
Cro
ss S
ubsi
dy
Dir
ect
Su
bsi
dy
Tota
l S
ubsi
dy
Cu
rren
tP
ropos
edC
urr
ent
Pro
pos
edC
urr
ent
Pro
pos
ed
US
$Ta
rget
ing
US
$Ta
rget
ing
US
$Ta
rget
ing
US
$Ta
rget
ing
US
$Ta
rget
ing
US
$Ta
rget
ing
0–2
08
6,4
98
20
0,4
63
28
.1%
128
,153
69
.3%
15,15
93
5.3
%9
2,8
38
85
.9%
215
,62
22
9.0
%2
20
,99
176
.3%
21–
50
87,
84
04
39
,56
22
92
,40
64
7,9
7811
8,9
754
87,
54
04
11,3
81
51–
100
132
,80
41,
018
,72
7�
= 0
.45
52
4,12
1�
= 1
.1217
7,3
97
� =
0.5
74
33
,64
1�
= 1
.39
1,19
6,12
4�
= 0
.47
95
7,76
2�
= 1
.23
101–
130
77,
017
784
,69
42
07,
69
918
5,8
38
39
3,2
769
70,5
32
60
0,9
75
131–
150
51,
34
45
23
,126
138
,46
312
3,8
92
169
,94
26
47,
018
30
8,4
05
151–
30
02
42
,72
33
,25
3,4
43
37
1,8
68
65
8,4
08
03
,911
,85
13
71,
86
8
30
1–5
00
83
,36
81,
50
8,6
03
–82
,54
81,
50
8,6
03
–82
,54
8
> 5
00
43
,74
79
66
,22
9
–35
4,2
77
9
66
,22
9
–35
4,2
77
Tota
ls8
05
,34
18
,69
4,8
47
1,22
5,8
85
1,2
08
,672
1,2
08
,672
9,9
03
,519
2,4
34
,55
7So
urc
e: A
uth
ors
’ ca
lcu
latio
ns,
2007
.
5176-ANNEX5.pdf 130 5/19/10 1:13 PM
131
Pricing Policies
as before to go from those numbers to quantities of distribution lines and transformers.
Technical energy-loss rates are differentiated by hourly block, and are such that global energy loss corresponds to the rates found in the latest loss study. Commercial losses are represented as extra consumption in the user modules served at different voltage levels, and are distributed also in the proportions found by the loss study. Commercial losses recognized for tariff calculations are of 5 percent of energy
injected into the grid, to complete total losses of 15 percent.
A second tariff option was generated, taking the reference tariff as a basis, aiming to leave practically unchanged current electricity prices to residential users consuming up to 150 kWh per month. To do this, the cross-subsidy was modifi ed, increasing the surcharge on the nonresidential user classes from 5.1 percent to 11 percent. The results are shown in Table A5.3.
5176-ANNEX5.pdf 131 5/19/10 1:13 PM
132
Tab
le A
5.3
M
od
ifi e
d T
arif
f B
ase
d o
n E
con
om
ic C
ost
s w
ith
In
crea
sed
Cro
ss-S
ub
sid
y
Use
r C
lass
an
d
Con
sum
pti
on
B
lock
Nu
mber
of
Clien
ts
Aver
age
Eco
nom
ic
Cos
t $
/kW
h
Modifi
ed T
ari
ff
Tari
ff
Incr
ease
In
%
Extr
a
Inco
me
for
EN
EE
US
$
Cu
rren
t A
ver
age
Tari
ff
$/k
Wh
Fin
al
Pri
ce
aft
er
Dir
ect
Su
bsi
dy
Rea
lloca
ted
Dir
ect
Su
bsi
dy
U
S$
Fin
al
Pri
ce a
fter
R
ealloca
ted
Su
bsi
dy
$/
kWh
Pri
ce
Incr
ease
aft
er
Dir
ect
Su
bsi
dy
Fix
ed
Ch
arg
e $
/clien
t-m
o
Dem
and
Ch
arg
e $
/kW
-m
En
ergy
C
harg
e $
/kW
h
Aver
age
Tari
ff $
/kW
h
A-
Res
iden
tial
0–2
0 k
Wh
/m
on
th8
6,4
98
0.4
04
30
.50
0.0
59
10
.127
33
8.9
%2
2,6
20
0.0
917
0.0
678
44
,96
90
.05
64
-16
.7%
21–
50
87,
84
00
.1878
0.5
00
.05
91
0.0
73
25
2.1%
78,15
80
.04
81
0.0
32
711
9,7
58
0.0
34
86
.3%
51–
100
132
,80
40
.1578
0.7
00
.09
720
.08
134
2.1%
24
2,2
95
0.0
572
0.0
39
64
11,0
21
0.0
40
52
.2%
101–
130
77,
017
0.14
740
.70
0.0
972
0.0
876
31.9
%2
04
,30
40
.06
64
0.0
472
38
5,6
56
0.0
476
1.0
%
131–
150
51,
34
40
.1474
0.7
00
.09
720
.08
763
1.9%
136
,20
10
.06
64
0.0
472
24
7,2
69
0.0
49
24
.2%
151–
30
02
42
,72
30
.140
81.
51
0.13
66
0.12
56
60
.3%
2,4
51,
53
80
.078
30
.06
56
00
.125
69
1.3
%
30
1–5
00
83
,36
80
.136
72
.00
0.14
45
0.13
85
56
.2%
1,5
59
,37
70
.08
87
0.0
88
70
0.13
85
56
.2%
>50
04
3,7
47
0.13
36
2.2
00
.144
50
.142
23
0.3
%1,
30
4,9
84
0.10
91
0.10
91
00
.142
23
0.3
%
Tota
l R
esid
enti
al
80
5,3
41
0.1
42
00
.12
45
46
.2%
5,9
99
,47
70
.08
52
0.0
77
31,
20
8,6
72
0.1
166
B-
Com
mer
cial
Sin
gle
ph
ase
53
,95
00
.1318
2.2
20
.143
30
.146
510
.3%
50
4,0
750
.132
80
.132
8
Th
ree
ph
ase
5,7
95
0.12
91
2.2
20
.143
30
.143
58
.0%
62
1,2
44
0.13
28
0.13
28
Tota
l C
om
mer
cial
59
,74
50
.13
02
2.2
20
.13
55
0.1
44
78
.9%
1,12
5,3
20
0.1
32
80
.13
28
Indu
stri
al
Med
ium
V
olt
age
134
0.10
702
2.2
39
.40
93
0.0
95
00
.118
813
.0%
612
,50
00
.105
20
.105
2
Indu
stri
al H
igh
V
olt
age
180
.09
85
22
2.2
68
.23
52
0.0
89
90
.109
417
.2%
82
6,8
09
0.0
93
30
.09
33
Pu
blic
Sec
tor
5,0
41
0.12
54
2.2
20
.138
50
.139
42
.3%
41,
00
70
.136
20
.136
2
Mu
nic
ipal
Sin
gle
ph
ase
62
50
.126
72
.00
0.12
47
0.12
67
30
.2%
17,5
95
0.0
97
30
.09
73
Th
ree
ph
ase
728
0.12
56
2.0
00
.124
70
.125
62
9.1%
43
,62
50
.09
73
0.0
97
3
Tota
l M
un
icip
al
1,3
53
0.1
25
92
.00
0.1
24
70
.12
59
29
.4%
61,
22
00
.09
73
0.0
97
3
Tota
l E
NE
E8
71,
63
20
.12
75
0.1
275
23
.4%
8,6
75
,17
10
.10
34
0.1
00
11,
20
8,6
72
0.1
24
2
Sou
rce
: Au
tho
rs’ c
alc
ula
tion
s, 20
07.
5176-ANNEX5.pdf 132 5/19/10 1:13 PM
133
This section presents data on access to electricity, together with data on distribution projects being implemented in different areas.
Electricity Coverage Index by Department, 2006
Annex
6
5176-ANNEX6.pdf 133 5/19/10 1:13 PM
134
Tab
le A
6.1
E
lect
rici
ty C
ove
rag
e I
nd
ex b
y D
ep
artm
en
t, 2
00
6
Dep
art
men
tP
opu
lati
on
No.
of
Hou
seh
old
sP
erso
ns
per
H
ou
seh
old
No.
of
Clien
tsE
lect
rici
ty
Cov
erage
Est
imati
on
s
Hou
seh
old
s w
ith
ou
t E
lect
rici
ty1
Popu
lati
on
wit
hou
t E
lect
rici
ty
Tota
lU
rban
Ru
ral
Tota
lU
rban
Ru
ral
Atl
ánti
da
37
9,6
54
87,
43
74
.34
66
,182
75.6
92
1,2
55
1,18
22
0,0
749
2,2
91
5,13
18
7,16
0
Ch
olu
teca
42
7,9
71
82
,99
35
.163
9,6
58
47.
784
3,3
36
2,4
09
40
,92
62
23
,46
812
,42
52
11,0
43
Co
lón
272
,00
95
1,96
35
.23
33
,148
63
.79
18,8
151,
04
617
,76
99
8,4
89
5,4
769
3,0
13
Co
may
agu
a4
00
,62
078
,82
25
.08
54
,870
69
.61
23
,95
31,
33
22
2,6
21
121,7
41
6,7
69
114
,972
Co
pan
32
9,5
92
69
,59
64
.74
37,
818
54
.34
31,7
781,7
67
30
,011
150
,49
58
,36
814
2,12
8
Co
rté
s1,
40
6,7
762
51,
85
55
.59
24
8,8
48
98
.81
3,0
07
167
2,8
40
16,7
95
93
415
,86
1
El P
arai
so3
92
,181
71,
08
55
.52
33
,76
04
7.4
93
7,3
25
2,0
753
5,2
50
20
5,9
24
11,4
49
194
,475
Fran
cisc
o
Mo
razá
n1,
32
3,2
73
26
7,2
87
4.9
52
41,
47
99
0.3
42
5,8
08
1,4
35
24
,37
312
7,76
97,
104
120
,66
5
Gra
cias
a
Dio
s78
,60
212
,46
86
.30
1,5
40
12.3
610
,92
76
08
10,3
20
68
,89
13
,83
06
5,0
60
Inti
bu
ca2
08
,00
53
4,7
57
5.9
812
,58
63
6.2
12
2,17
11,
23
32
0,9
38
132
,68
37,
37
712
5,3
06
Isla
s d
e la
B
ahía
44
,25
410
,713
4.13
10,5
44
98
.42
169
916
070
03
96
61
La
Paz
178
,172
31,
56
05
.65
12,3
783
9.2
219
,182
1,0
67
18,11
610
8,2
93
6,0
21
102
,272
Le
mp
ira
28
5,18
64
9,7
09
5.7
412
,210
24
.56
37,
49
82
,08
53
5,4
132
15,13
411
,96
12
03
,173
Oco
tep
eq
ue
121,
28
42
4,4
87
4.9
514
,80
66
0.4
79
,68
15
38
9,14
34
7,9
49
2,6
66
45
,28
3
Ola
nch
o4
68
,42
38
5,7
115
.47
37,
24
84
3.4
64
8,4
63
2,6
95
45
,76
92
64
,85
714
,72
62
50
,131
San
ta
Bar
bar
a3
75,0
06
80
,59
54
.65
38
,159
47.
35
42
,43
52
,35
94
0,0
7619
7,4
51
10,9
7818
6,4
73
Val
le16
2,5
35
34
,375
4.7
32
1,70
56
3.14
12,6
7070
411
,96
55
9,9
07
3,3
31
56
,576
Yo
ro5
13,4
7810
4,7
06
4.9
07
1,75
76
8.5
33
2,9
49
1,8
32
31,1
1716
1,5
81
8,9
84
152
,59
7
Tota
l7,
36
7,0
21
1,4
30
,118
5.1
59
88
,69
66
9.1
3%
44
1,4
22
24
,54
34
16,8
79
2,2
94
,417
127,
57
02
,16
6,8
48
Sou
rce
: EN
EE, 2
007
an
d a
uth
ors
’ ca
lcu
latio
ns,
2007
.1 A
cc
ord
ing
to
EN
EE, 5
1.02
% o
f th
e t
ota
l ho
use
ho
lds
in H
on
du
ras
are
ru
ral a
nd
48.
98%
are
urb
an
. Ho
we
ver,
in u
rba
n a
rea
s th
e o
vera
ll ra
te o
f a
cc
ess
to
ele
ctr
icity
is m
uc
h g
rea
ter t
ha
n in
ru
ral a
rea
s (9
4.44
% v
s. 44
.83%
). H
en
ce
, it
is a
ssu
me
d t
ha
t 5.
56%
of
the
to
tal u
ne
lec
trifi
ed
ho
use
ho
lds
are
urb
an
an
d t
ha
t 94
.44%
, are
un
ele
ctr
ifi e
d r
ura
l ho
use
ho
lds.
Tho
ug
h v
alu
es
ma
y d
iffe
r pe
r de
pa
rtm
en
t in
te
rms
of
rura
l an
d u
rba
n
ac
ce
ss (
the
re a
re d
ep
art
me
nts
in w
hic
h t
he
re a
re a
gre
ate
r am
ou
nt
of
rura
l ho
use
ho
lds
tha
n u
rba
n a
nd
vic
eve
rsa
), it
is a
use
ful a
ssu
mp
tion
to
ide
ntif
y to
th
e t
ota
l po
pu
latio
n t
o b
e s
erv
ed
in r
ura
l are
as
at
the
n
atio
na
l le
vel.
5176-ANNEX6.pdf 134 5/19/10 1:13 PM
Tab
le A
6.2
E
lect
rifi
cati
on
Pro
ject
s, 1
99
5 t
o 2
00
6
Pro
ject
Dep
art
men
tF
OS
OD
E
Com
p.
AA
20
00
A
lloca
tion
C
om
p.
Th
e K
ingdom
of
Th
e N
eth
erla
nds
Com
p.E
NE
E
Com
p.E
R-5
80
/91
Com
p.D
EC
. N
o.8
8
Com
p.E
S-N
97
C
om
p.
ES
-N9
8/
AM
P 1
C
om
p.
ES
-N
98
AM
P 2
C
om
p.
Atl
ánti
da
18
72
Co
lón
3
39
Co
may
agu
a
517
1112
3
Co
pán
32
116
151
22
1
Co
rté
s
13
27
65
22
Ch
olu
teca
1
131
107
El P
arai
so
32
99
7
Fran
cisc
o M
ora
zán
15
1710
25
1117
45
8
Gra
cias
A D
ios
Inti
bu
cá
81
68
210
Isla
s D
e L
a B
ahía
1
La
Paz
11
162
4
Le
mp
ira
7
31
132
2
Oco
tep
eq
ue
1
912
5
Ola
nch
o8
114
21
22
San
ta B
árb
ara
7
112
142
03
Val
le
17
81
153
Yo
ro
116
1315
23
5
Tota
l10
36
22
612
318
22
28
918
510
5
Inves
tmen
t (U
s$ M
illion
s)
3.6
30
.88
0.6
82
.93
18.8
80
.76
2.7
17.
82
10
Type
Of
Fin
an
cin
g
Th
e K
ingdom
of
Th
e N
eth
erla
nds
Th
e K
ingdom
of
Th
e N
eth
erla
nds
EN
EE
BC
IE
Th
e K
ingdom
of
Th
e N
eth
erla
nds
Norw
ayN
orw
ayN
orw
ay
Loa
nL
oan
Loa
nL
oan
Sta
tus
of P
roje
ct10
0%
C
om
ple
ted
100
%
Co
mp
lete
d5
0%
C
om
ple
ted
100
%
Co
mp
lete
d10
0%
C
om
ple
ted
100
%
Co
mp
lete
d10
0%
C
om
ple
ted
100
%
Co
mp
lete
d10
0%
C
om
ple
ted
Con
tinue
d
5176-ANNEX6.pdf 135 5/19/10 1:13 PM
Tab
le A
6.2
C
on
tin
ue
d
Pro
ject
Dep
art
men
tJ
apan
1
Com
p.J
apan
2
Com
p.K
ore
a C
om
p.E
S-N
DF-
20
00
Com
p.E
NE
E-F
CN
C
om
p.J
apan
3
Com
p.E
S-E
RP
-20
02
C
om
p.To
tal
Com
p.
Atl
ánti
da
49
62
38
119
7
Co
lón
42
82
1713
61
Co
may
agu
a17
26
22
119
1719
169
Co
pán
68
23
97
22
316
6
Co
rté
s4
33
19
21
416
24
2
Ch
olu
teca
513
31
101
1513
120
El P
arai
so13
20
1912
37
1812
2
Fran
cisc
o M
ora
zán
31
37
60
35
55
718
39
1
Gra
cias
A D
ios
22
Inti
bu
cá1
513
117
108
2
Isla
s D
e L
a B
ahía
23
La
Paz
55
111
176
26
95
Le
mp
ira
22
99
515
115
Oco
tep
eq
ue
45
27
96
28
88
Ola
nch
o6
103
02
610
23
32
20
3
San
ta B
árb
ara
62
32
115
913
1515
9
Val
le5
619
106
23
104
Yo
ro6
914
36
816
162
Tota
l16
02
113
22
20
076
23
72
78
23
81
Inves
tmen
t (U
S$
million
s)1.
52
9.6
10.0
02
.71.
1812
.79
1.3
5
Type
of F
inan
cin
gJ
apan
Japan
Kore
aF
inla
nd
Cooper
ati
on
Fu
nd o
f T
he
Kin
gdom
of
Th
e N
eth
erla
nds
Japan
BC
IE
Don
ati
on
Don
ati
on
Loa
nL
oan
Don
ati
on
Loa
n
Sta
tus
of p
roje
ct10
0%
C
om
ple
ted
100
%
Co
mp
lete
d9
0%
C
om
ple
ted
Sig
nin
g
con
trac
ts10
0%
C
om
ple
ted
90
%
Co
mp
lete
dIn
im
ple
me
nta
tio
nSo
urc
e: E
NEE
, 200
7.
5176-ANNEX6.pdf 136 5/19/10 1:13 PM
137
Cost of Energy PurchasesThe following assumptions were used to determine the cost of energy purchases from new generation:
• All capacity additions required to meet projected demand growth will be fi nanced by private investment, either in response to ENEE’s calls for bids for energy supply contracts or through power supply agreements with renewable energy sources based on incentive legislation.
• The generation expansion programs for each demand scenario are used as a reference to determine the required capacity additions and the price of energy purchases. The capacity charge is calculated as an annual installment that covers a 12 percent return on investment, taking into account the economic life of the projects (generation plant and related transmission works) and the fi xed operation and maintenance (O&M) costs. The energy charge covers the variable costs of the projects (fuel and variable O&M). In the case of leased generation, a capacity charge of US$18/kW-month was used based on information provided by a local contractor for one- to three-year leases of diesel generators. For new renewable projects under construction, the energy charges negotiated in the PPAs were used.
• ELCOSA and Lufussa I plants will continue operating after 2010 as an emergency solution to meet demand before large generation projects are commissioned by
Financial Projections—Assumptions and Detailed Results
Annex
7
2013. The capacity charge will cover only fi xed O&M costs and the energy charge the variable costs.
The reference generation expansion plans provide information to private investors about future generation needs and the competitive position of different technologies. However, private investors, responding to incentives and requests from ENEE for energy supply, will propose the location, technology, and characteristics of new generation projects and the price of energy supply. The actual cost of energy purchases would depend on market conditions, the risks faced by investors, the investment costs of the projects selected by the investors, and the level of competition.
The cost of energy purchases was calculated based on the generation expansion plans and the results of economic dispatch for each of the three scenarios, using the estimated capacity and energy charges for new projects and the energy prices established in the contracts for existing plants. The results for each scenario are shown in Tables A7.1, A7.2, and A7.3. Some important conclusions can be reached:
• The average costs of energy purchases remain high in 2007 to 2010 at levels between US$92/MWh and US$100/MWh. These costs are driven mainly by the variable (fuel and other) and fi xed charges of existing thermal contracts. For example, in 2010 the fi xed charges explain about 29 percent of average costs and the fuel charges about 56 percent. Therefore, the cost of energy purchases
5176-ANNEX7.pdf 137 5/19/10 1:14 PM
HONDURAS: POWER SECTOR ISSUES AND OPTIONS
138
during that period can be substantially reduced only with a drop in fuel prices, renegotiating the fi xed charges of existing contracts, or reducing the fi xed charges of leased generation, which may be high.
• The average cost of energy purchases is reduced to the range of US$82/MWh to
US$93/MWh in 2010 to 2011, when the Lufussa I and ELCOSA contracts expire, entailing a reduction in annual fi xed charges of about US$23 million. Therefore, the termination of these contracts or the elimination of the fi xed charges in 2010 signifi cantly affected the cost of purchases (Table A7.1).
Table A7.1 Summary of Generation Costs: New Base Scenario
Financial Projections—Assumptions and Detailed Results
• The average cost of energy purchases would be reduced to the 73 to 78 percent range in 2013 to 2014 with the commissioning of large coal-fi red plants and hydro plants.
• The participation of ENEE’s generation in total generation drops from about 30 percent in 2007 to about 20 percent in 2014, reducing the dampening effect of existing hydroelectric plants on the average generation costs. This can be seen, for example, in the base case, where in 2007 the average cost of energy purchases was US$92.8/MWh, but the average generation cost (including ENEE’s hydro generation) was US$69.8/MWh, 25 percent lower, while in 2014, the same costs were US$73/MWh and US$60/MWh, respectively, with a reduction of only 18 percent.
• At the margin, ENEE has to use expensive resources (diesel-fueled generation) to meet demand increases, worsening its fi nancial position, because the incremental revenues are not suffi cient to cover the incremental costs of energy purchases (including losses) in 2007 to 2011. In the low case scenario, which assumes substantial tariff increases and reduction of system losses, in 2010 the incremental fuel cost of emergency generation per kWh sold is US$163/MWh, while the average tariff is US$126/MWh.
Financial ProjectionsThe results of the fi nancial projections are shown in Tables A7.2 through A7.6.
5176-ANNEX7.pdf 139 5/19/10 1:14 PM
HONDURAS: POWER SECTOR ISSUES AND OPTIONS
140
Table A7.2 Summary of Generation Costs: New Low Scenario
Financial Projections—Assumptions and Detailed Results
Tab
le A
7.4
C
on
tin
ue
d
20
06
20
07
20
08
20
09
20
102
011
20
122
013
20
142
015
Sou
rces
an
d u
ses
of f
un
ds
state
men
t
Net
In
com
e f
rom
o
pe
rati
on
sM
lps
–1,8
41.7
–1,7
68
.0–1
,50
9.5
–1,3
60
.1–9
29
.0–3
.91,
20
1.0
3,0
43
.03
,88
8.5
4,5
13.1
+ N
on
-op
era
tio
nal
in
com
eM
lps
70.6
0.0
0.0
0.0
0.0
0.0
0.0
0.0
0.0
0.0
+ D
ep
reci
atio
nM
lps
1,774
.41,7
81.7
1,8
30
.91,
876
.41,9
10.7
1,916
.41,9
22
.11,9
27.
81,9
33
.51,9
39
.2
+ U
nco
llect
ible
ac
cou
nts
Mlp
s8
8.5
100
.011
3.5
126
.113
9.1
152
.716
7.1
179
.419
1.5
20
4.1
= T
ota
l in
tern
al
sou
rces
Mlp
s9
1.8
113
.74
34
.96
42
.41,1
20
.82
,06
5.2
3,2
90
.25
,150
.26
,013
.56
,65
6.5
+ E
xte
rnal
so
urc
esM
lps
1,915
.29
00
.62
,89
9.3
2,0
36
.68
27.
23
36
.54
79
.69
93
.98
99
.02
76.5
= T
ota
l so
urc
esM
lps
2,0
07.
01,
014
.33
,33
4.1
2,6
79
.01,9
48
.02
,40
1.8
3,7
69
.86
,144
.26
,912
.56
,93
2.9
Tota
l de
bt
serv
ice
Mlp
s2
,817
.78
20
.41,
05
5.3
1,5
84
.52
,02
8.2
1,4
82
.01,
67
9.2
1,78
8.4
1,8
26
.81,
82
7.5
+ C
on
stru
ctio
n c
ost
sM
lps
574
.91,
33
3.6
3,10
2.0
2,2
31.
01,
02
1.6
53
1.0
674
.11,1
88
.41,
09
3.4
470
.9
+ W
ork
ing
cap
ital
in
crea
seM
lps
35
1.7–2
86
.0–2
61.
28
4.3
65
.95
3.5
41.
29
.8–6
.2–1
6.9
= T
ota
l use
sM
lps
3,7
44
.21,
86
8.1
3,8
96
.03
,89
9.8
3,11
5.7
2,0
66
.52
,39
4.5
2,9
86
.62
,914
.12
,28
1.4
An
nu
al su
rplu
s (d
efi c
it)
Mlp
s–1
,73
7.2
–85
3.8
–56
1.9–1
,22
0.8
–1,16
7.7
33
5.3
1,3
75.3
3,15
7.6
3,9
98
.44
,65
1.5
No
n-a
ssu
red
fi
nan
cin
gM
lps
56
8.8
2,5
68
.51,9
09
.38
26
.53
35
.84
78.9
99
3.2
89
8.3
275
.8So
urc
e: A
uth
ors
’ ca
lcu
latio
ns,
2007
.
5176-ANNEX7.pdf 143 5/19/10 1:14 PM
HONDURAS: POWER SECTOR ISSUES AND OPTIONS
144
Tab
le A
7.5
F
inan
cial
Pro
ject
ion
s S
cen
ario
: Low
20
06
20
07
20
08
20
09
20
102
011
20
122
013
20
142
015
Los
ses
an
d e
arn
ings
Sal
esG
Wh
4,4
30
.64
,88
5.1
5,3
64
.55
,810
.16
,272
.36
,75
4.2
7,2
17.2
7,70
4.8
8,17
4.4
8,6
65
.6
Ave
rag
e t
arif
fL
ps/
kWh
2.0
02
.182
.37
2.4
02
.40
2.4
02
.40
2.4
02
.40
2.4
0
Sal
es r
eve
nu
esM
Lp
s8
,84
6.6
10,6
40
.512
,69
9.7
13,9
44
.315
,05
3.5
16,2
10.0
17,3
21.
418
,49
1.5
19,6
18.5
20
,79
7.3
Oth
er
reve
nu
esM
Lp
s2
86
.32
12.8
25
4.0
278
.93
01.1
32
4.2
34
6.4
36
9.8
39
2.4
415
.9
Tota
l in
com
e
fro
m o
pe
rati
on
sM
lps
9,13
2.8
10,8
53
.312
,95
3.7
14,2
23
.215
,35
4.5
16,5
34
.217
,66
7.8
18,8
61.
32
0,0
10.9
21,
213
.3
En
erg
y c
ost
sM
lps
7,9
85
.48
,378
.59
,03
3.8
9,7
28
.310
,38
6.1
10,4
93
.410
,56
6.4
10,3
88
.810
,49
3.9
11,3
54
.0
De
pre
ciat
ion
Mlp
s1,7
74.4
1,78
1.71,
83
0.9
1,8
76.4
1,910
.71,9
16.4
1,92
2.1
1,92
7.8
1,93
3.5
1,93
9.2
Oth
er
cost
sM
lps
1,2
14.7
1,6
33
.61,7
95
.31,
86
1.71,7
10.2
1,79
8.1
1,8
86
.11,9
78.4
2,0
71.
02
,167.
9
Op
era
tio
n c
ost
sM
lps
10,9
74.5
11,7
93
.812
,66
0.0
13,4
66
.314
,00
7.0
14,2
07.
914
,374
.514
,29
5.0
14,4
98
.415
,46
1.1
Net
inco
me
fro
m
op
era
tio
ns
Mlp
s–1
,84
1.7–9
40
.42
93
.775
6.9
1,3
47.
52
,32
6.3
3,2
93
.34
,56
6.4
5,5
12.5
5,7
52
.2
+ N
on-o
pera
tion
al
inco
me
Mlp
s70
.60
.00
.00
.00
.00
.00
.00
.00
.00
.0
– F
inan
cial
co
sts
Mlp
s6
34
.22
59
.64
95
.06
84
.375
8.5
66
8.3
674
.77
16.4
741.9
702
.2
Pro
fi t
(los
s)M
lps
–2,4
05
.2–1
,20
0.0
–20
1.3
72.6
58
9.1
1,6
58
.12
,618
.53
,85
0.0
4,7
70.6
5,0
50
.0
EB
ITD
AM
lps
–67.
38
41.
22
,124
.62
,63
3.2
3,2
58
.24
,24
2.7
5,2
15.4
6,4
94
.27,
44
5.9
7,6
91.
4
Co
ntin
ue
d
5176-ANNEX7.pdf 144 5/19/10 1:14 PM
145
Financial Projections—Assumptions and Detailed Results
Tab
le A
7.5
C
on
tin
ue
d
20
06
20
07
20
08
20
09
20
102
011
20
122
013
20
142
015
Sou
rces
an
d u
ses
of f
un
ds
state
men
t
Net
inco
me
fro
m
op
era
tio
ns
Mlp
s–1
,84
1.7–9
40
.42
93
.775
6.9
1,3
47.
52
,32
6.3
3,2
93
.34
,56
6.4
5,5
12.5
5,7
52
.2
+ N
on-o
pera
tion
al
inco
me
Mlp
s70
.60
.00
.00
.00
.00
.00
.00
.00
.00
.0
+ D
ep
reci
atio
nM
lps
1,774
.41,7
81.7
1,8
30
.91,
876
.41,9
10.7
1,916
.41,9
22
.11,9
27.
81,9
33
.51,9
39
.2
+ U
nco
llect
ible
ac
cou
nts
Mlp
s8
8.5
106
.412
7.0
139
.415
0.5
162
.117
3.2
184
.919
6.2
20
8.0
= T
ota
l in
tern
al
sou
rces
Mlp
s9
1.8
94
7.6
2,2
51.
62
,772
.73
,40
8.8
4,4
04
.85
,38
8.6
6,6
79
.17,
64
2.1
7,8
99
.4
+ E
xte
rnal
so
urc
esM
lps
1,915
.29
00
.62
,89
9.3
2,0
36
.68
27.
23
36
.54
79
.69
93
.98
99
.02
76.5
= T
ota
l so
urc
esM
lps
2,0
07.
01,
84
8.2
5,15
0.9
4,8
09
.34
,23
5.9
4,7
41.
45
,86
8.2
7,6
73
.08
,54
1.18
,175
.8
Tota
l de
bt
serv
ice
Mlp
s2
,817
.78
20
.41,
05
5.3
1,5
84
.52
,02
8.2
1,4
82
.01,
67
9.2
1,78
8.4
1,8
26
.81,
82
7.5
+ C
on
stru
ctio
n
cost
sM
lps
574
.91,
33
3.6
3,10
2.0
2,2
31.
01,
02
1.6
53
1.0
674
.11,1
88
.41,
09
3.4
470
.9
+ W
ork
ing
cap
ital
in
crea
seM
lps
35
1.7–1
90
.0–2
22
.05
5.6
27.
918
.52
.7–6
.0–2
2.0
–31.
4
= T
ota
l use
sM
lps
3,7
44
.21,9
64
.03
,93
5.2
3,8
71.1
3,0
77.
72
,03
1.5
2,3
56
.02
,970
.82
,89
8.3
2,2
66
.9
An
nu
al su
rplu
s (d
efi c
it)
Mlp
s–1
,73
7.2
–115
.81,
215
.69
38
.21,1
58
.32
,70
9.8
3,5
12.2
4,7
02
.25
,64
2.9
5,9
08
.9
No
n-a
ssu
red
fi
nan
cin
gM
lps
56
8.8
2,5
68
.51,9
09
.38
26
.53
35
.84
78.9
99
3.2
89
8.3
275
.8So
urc
e: A
uth
ors
’ ca
lcu
latio
ns,
2007
.
5176-ANNEX7.pdf 145 5/19/10 1:14 PM
HONDURAS: POWER SECTOR ISSUES AND OPTIONS
146
Tab
le A
7.6
F
inan
cial
Pro
ject
ion
s S
cen
ario
: Low
Tar
iff
Ch
ang
e
20
06
20
07
20
08
20
09
20
102
011
20
122
013
20
142
015
Los
ses
an
d e
arn
ings
Sal
esG
Wh
4,4
30
.64
,88
5.1
5,3
64
.55
,810
.16
,272
.36
,75
4.2
7,2
17.2
7,70
4.8
8,17
4.4
8,6
65
.6
Ave
rag
e t
arif
fL
ps/
kWh
2.0
02
.00
2.0
02
.00
2.0
02
.00
2.0
02
.00
2.0
02
.00
Sal
es r
eve
nu
esM
Lp
s8
,84
6.6
9,7
54
.110
,711
.211
,60
1.0
12,5
23
.813
,48
6.0
14,4
10.6
15,3
84
.116
,32
1.717
,30
2.4
Oth
er
reve
nu
esM
Lp
s2
86
.319
5.1
214
.22
32
.02
50
.52
69
.72
88
.23
07.
73
26
.43
46
.0
Tota
l in
com
e
fro
m o
pe
rati
on
sM
lps
9,13
2.8
9,9
49
.210
,92
5.4
11,8
33
.012
,774
.313
,75
5.7
14,6
98
.815
,69
1.8
16,6
48
.117
,64
8.5
En
erg
y c
ost
sM
lps
7,9
85
.48
,378
.59
,03
3.8
9,7
28
.310
,38
6.1
10,4
93
.410
,56
6.4
10,3
88
.810
,49
3.9
11,3
54
.0
De
pre
ciat
ion
Mlp
s1,7
74.4
1,78
1.71,
83
0.9
1,8
76.4
1,910
.71,9
16.4
1,92
2.1
1,92
7.8
1,93
3.5
1,93
9.2
Oth
er
cost
sM
lps
1,2
14.7
1,5
94
.81,7
19.5
1,772
.61,
612
.81,
69
4.1
1,776
.01,
86
1.91,9
48
.72
,03
9.5
Op
era
tio
n c
ost
sM
lps
10,9
74.5
11,7
54
.912
,58
4.2
13,3
77.
213
,90
9.6
14,10
4.0
14,2
64
.514
,178
.514
,376
.115
,33
2.6
Net
inco
me
fro
m
op
era
tio
ns
Mlp
s–1
,84
1.7–1
,80
5.8
–1,6
58
.8–1
,54
4.2
–1,13
5.3
–34
8.2
43
4.3
1,5
13.2
2,2
72.1
2,3
15.9
+ N
on
-o
pe
rati
on
al
inco
me
Mlp
s70
.60
.00
.00
.00
.00
.00
.00
.00
.00
.0
– F
inan
cial
co
sts
Mlp
s6
34
.22
59
.64
95
.06
84
.375
8.5
66
8.3
674
.77
16.4
741.9
702
.2
Pro
fi t
(los
s)M
lps
–2,4
05
.2–2
,06
5.4
–2,15
3.8
–2,2
28
.5–1
,89
3.8
–1,0
16.5
–24
0.4
79
6.9
1,5
30
.21,
613
.7
EB
ITD
AM
lps
–67.
3–2
4.1
172
.13
32
.27
75.3
1,5
68
.22
,35
6.4
3,4
41.
04
,20
5.5
4,2
55
.0
Co
ntin
ue
d
5176-ANNEX7.pdf 146 5/19/10 1:14 PM
147
Financial Projections—Assumptions and Detailed Results
Tab
le A
7.6
C
on
tin
ue
d
20
06
20
07
20
08
20
09
20
102
011
20
122
013
20
142
015
Sou
rces
an
d u
ses
of f
un
ds
state
men
t
Net
inco
me
fro
m
op
era
tio
ns
Mlp
s–1
,84
1.7–1
,80
5.8
–1,6
58
.8–1
,54
4.2
–1,13
5.3
–34
8.2
43
4.3
1,5
13.2
2,2
72.1
2,3
15.9
+ N
on-o
pera
tion
al
Inco
me
Mlp
s70
.60
.00
.00
.00
.00
.00
.00
.00
.00
.0
+ D
ep
reci
atio
nM
lps
1,774
.41,7
81.7
1,8
30
.91,
876
.41,9
10.7
1,916
.41,9
22
.11,9
27.
81,9
33
.51,9
39
.2
+ U
nco
llect
ible
ac
cou
nts
Mlp
s8
8.5
97.
510
7.1
116
.012
5.2
134
.914
4.1
153
.816
3.2
173
.0
= T
ota
l in
tern
al
sou
rces
Mlp
s9
1.8
73
.42
79
.24
48
.29
00
.61,7
03
.02
,50
0.5
3,5
94
.94
,36
8.8
4,4
28
.1
+ E
xte
rnal
so
urc
esM
lps
1,915
.29
00
.62
,89
9.3
2,0
36
.68
27.
23
36
.54
79
.69
93
.98
99
.02
76.5
= T
ota
l so
urc
esM
lps
2,0
07.
09
74.0
3,17
8.5
2,4
84
.81,7
27.
82
,03
9.6
2,9
80
.24
,58
8.8
5,2
67.
84
,70
4.5
Tota
l de
bt
serv
ice
Mlp
s2
,817
.78
20
.41,
05
5.3
1,5
84
.52
,02
8.2
1,4
82
.01,
67
9.2
1,78
8.4
1,8
26
.81,
82
7.5
+ C
on
stru
ctio
n
cost
sM
lps
574
.91,
33
3.6
3,10
2.0
2,2
31.
01,
02
1.6
53
1.0
674
.11,1
88
.41,
09
3.4
470
.9
+ W
ork
ing
cap
ital
in
crea
seM
lps
35
1.7–1
90
.0-2
22
.05
5.6
27.
918
.52
.7–6
.0–2
2.0
–31.
4
= T
ota
l use
sM
lps
3,7
44
.21,9
64
.03
,93
5.2
3,8
71.1
3,0
77.
72
,03
1.5
2,3
56
.02
,970
.82
,89
8.3
2,2
66
.9
An
nu
al su
rplu
s (d
efi c
it)
Mlp
s–1
,73
7.2
–99
0.1
–75
6.7
–1,3
86
.3–1
,34
9.9
8.0
62
4.2
1,6
18.0
2,3
69
.52
,43
7.6
No
n-a
ssu
red
fi
nan
cin
gM
lps
56
8.8
2,5
68
.51,9
09
.38
26
.53
35
.84
78.9
99
3.2
89
8.3
275
.8So
urc
e: A
uth
ors
’ ca
lcu
latio
ns,
2007
.
5176-ANNEX7.pdf 147 5/19/10 1:14 PM
5176-ANNEX7.pdf 148 5/19/10 1:14 PM
149
Estimates of Investment Needs for Three Off-grid ScenariosAnnex 6 presented the basic data regarding coverage of electricity service in Honduras. In the following, specific approaches for increasing access to electricity based on different technologies (conventional diesel, microhydro, and solar) are developed.
Investment Needs for Increasing Service Provision with Stand-alone Conventional Diesel PlantsTo make an estimate, the cost of generating each kilowatt (kW) was taken from the National Social Electrifi cation Plan (Plan Nacional de Electrifi cación Social, PLANES) 2004 report, and demand for each Department was estimated using the information on residential consumption patterns provided in the PLANES. This simulation evaluated the components of total costs of electricity generated from diesel technology for different plant sizes and generation costs (see Table A8.1 for a summary of the characteristics of different plant sizes and the assumptions that have been considered).
Scenarios were run for 25 diesel plant projects in isolated areas considered within the PLANES with costs of generation that ranged between US$0.13/kWh and US$0.30/kWh, depending on capacity, investment, kind of fuel, and operation and maintenance costs. It should be noted, however, that the cost estimate leaves aside any tariff consideration. The results of the estimates for these 25 projects are shown in Table A8.2. For example, the cost of providing the service
Increasing Access to ElectricityAnnex
8
24 hours a day to the population benefited from these 25 isolated diesel projects (72,984 inhabitants in 2012 or 14,168 households), and assuming that all 25 projects are implemented, is US$38.5 million.
Table A8.3 depicts the costs of serving all the unelectrifi ed rural households in Honduras (416,879) with stand-alone diesel plants, assuming a generation cost of US$0.203/kWh (the average of the 25 diesel projects shown in Table A8.2) and different access scenarios. Specifi cally, the results for different scenarios in which rural access is increased by 10 percent, 25 percent, 50 percent, and 100 percent are shown for different amounts of hours per day of service provision. For example, to provide universal access (100 percent) with these kinds of diesel plants, 12 hours per day, will cost US$787.3 million. In contrast, if access is to be increased by 25 percent and service is provided 12 hours a day, the net present value (NPV) cost would be US$196.8 million.
If the new government target of connecting 400,000 households by 2015 is assumed, and if they are to be served 12 hours a day, the NPV cost will reach US$755.5 million.
These estimates are a very useful tool for policy makers. For instance, the government might use them to estimate how much it would cost to duplicate service hours in the various departments where there are stand-alone diesel plants in place. Based on this analysis, it would be possible to design different policy alternatives that permit increasing rural access with diesel plants, at different generation costs and for different numbers of hours per day.
However, not all this money has to be disbursed instantly. For example, the fi nancial
5176-ANNEX8.pdf 149 5/19/10 1:13 PM
HONDURAS: POWER SECTOR ISSUES AND OPTIONS
150
annuities of increasing access by 25 percent over a period of 10 years and at a discount rate of 12 percent are presented in Table A8.4.
It is worth noting that due to their technological characteristics, diesel limitations, and inadequate maintenance, the number of work hours that the diesel units can undertake is not always suffi cient to provide uninterrupted electricity service in the areas that rely on this type of energy solution.57 In addition, notorious diseconomies of scale may result from the average small size of the unit.
Investment Needs in Microhydro Projects These kinds of projects are useful, particularly in communities that have water resources to implement run-of-river systems that can be
exploited using microhydro power stations with 10 to 200 kW output.
In general, projects using these types of plants are justifi ed only when the load factor is higher than that required merely for home lighting. In these cases, the challenge is twofold:
1. It is necessary to identify productive uses for the community (other than lighting, which could be provided using photovoltaic panels), such as schools, retail stores, restaurants, churches, and craftsmen microenterprises. These productive uses, in conjunction with household lighting, could increase the load factor to levels that warrant the cost of building a run-of-river microstation.
2. It is necessary to organize and train the community to operate and maintain the plant, which requires training.
There are currently two microhydro projects being considered for construction in Honduras:
57 It was not possible to obtain information regarding the average availability of diesel plants and their use factor. There is a stand-alone diesel plant in Puerto Lempira, but no information was provided about its O&M costs or the average number of hours it operates per day.
Table A8.1 Cost Breakdown for Diesel Plants in Off-Grid Areas (as of 2003)
Assumptions
Energy KW 10 25 50 100
Net Energy KW 9 24 48 95
Fuel Consumption g/kWh 295 290 280 270
Oil Consumption g/kWh 1.5 2.2 3 3
Life cycle of diesel plant yrs 10 10 15 15
Losses % 6% 6% 6% 6%
Diesel Plant Costs
Investment Cost
Generator US$ 7,640 15,280 38,200 65,200
Transformer US$ 535 730 1,065 1,500
Annuity (10 yrs, 12%) US$/ yr 1,447 2,834 6,949 11,805
Fuel and Oil US$/ kWh/ yr 0.0835 0.0833 0.0818 0.0791
Variable O&M Costs US$/ yr 153 306 764 1,304
Source: Plan Nacionàl de Electrifi cación Social (PLANES), Proyecto ACDI 910/18255, Marzo 2004, p. 7–8 & 7–9.
5176-ANNEX8.pdf 150 5/19/10 1:13 PM
Tab
le A
8.2
C
har
acte
rist
ics
and
An
nu
al C
ost
of
En
erg
y G
en
era
tio
n w
ith
Iso
late
d D
iese
l Pla
nts
Ch
ara
cter
isti
cs a
nd a
nn
ual co
st o
f en
ergy
gen
erati
on
wit
h iso
late
d d
iese
l pla
nts
NP
V o
f pro
vid
ing e
lect
rici
ty s
ervic
e fo
r dif
fere
nt
am
ou
nt
of h
ou
rs p
er d
ay (
US
$)
Pro
ject
Can
did
ate
in
Isola
ted A
reas
Pop
ula
tion
in 2
012
kWh
Dem
and
(kW
)
Inst
alle
d
Cap
acit
y
(kW
)In
vest
men
tO
&M
Cos
t of
Oil a
nd
Fu
el
Tota
l
Cos
t$
/kW
h6
122
4
11,
46
516
6,6
68
51.
22
60
8,3
96
3,9
172
7,6
67
39
,98
0
0.2
40
2
39
,88
0.0
04
79
,76
0.0
09
59
,52
0.0
0
25
,191
68
2,4
00
20
9.7
12
25
26
,44
49
,914
168
,55
32
04
,911
0
.30
0
1,2
29
,46
6.0
02
,45
8,9
32
.00
4,9
17,8
64
.00
31,
54
217
5,2
22
53
.85
60
8,3
96
3,9
172
9,0
87
41,
40
0
0.2
36
2
48
,40
0.0
04
96
,80
0.0
09
93
,60
0.0
0
48
36
79
,47
12
4.4
23
54
,28
12
,45
913
,272
20
,012
0
.25
2
120
,072
.00
24
0,14
4.0
04
80
,28
8.0
0
51,
04
611
8,9
30
36
.55
50
6,9
49
2,7
64
9,5
7219
,28
5
0.16
2
115
,710
.00
23
1,4
20
.00
46
2,8
40
.00
61,
45
116
5,0
125
0.7
175
9,7
83
4,0
702
7,2
27
41,
08
0
0.2
49
2
46
,48
0.0
04
92
,96
0.0
09
85
,92
0.0
0
73
,45
04
87,
310
148
.76
150
18,7
54
7,0
68
79
,919
105
,74
1
0.2
17
63
4,4
46
.00
1,2
68
,89
2.0
02
,53
7,78
4.0
0
81,
472
185
,70
85
7.0
76
08
,39
63
,917
30
,82
74
3,14
0
0.2
32
2
58
,84
0.0
05
17,6
80
.00
1,0
35
,36
0.0
0
92
,05
42
27,
09
96
9.7
975
9,7
83
4,0
703
7,4
71
51,
32
4
0.2
26
3
07,
94
4.0
06
15,8
88
.00
1,2
31,7
76.0
0
102
,44
62
61,
86
78
0.4
810
011
,80
54
,30
42
1,4
73
37,
58
2
0.14
4
22
5,4
92
.00
45
0,9
84
.00
90
1,96
8.0
0
111,
87
32
09
,99
06
4.5
375
9,7
83
4,0
703
4,6
48
48
,50
1
0.2
31
2
91,
00
6.0
05
82
,012
.00
1,16
4,0
24
.00
122
,184
24
7,2
42
75.9
810
011
,80
54
,30
42
0,2
743
6,3
83
0
.147
2
18,2
98
.00
43
6,5
96
.00
87
3,19
2.0
0
132
,69
82
63
,24
78
0.9
010
011
,80
54
,30
42
1,5
86
37,
69
5
0.14
3
22
6,17
0.0
04
52
,34
0.0
09
04
,68
0.0
0
142
,578
28
5,0
46
87.
60
100
11,8
05
4,3
04
23
,374
39
,48
3
0.13
9
23
6,8
98
.00
47
3,7
96
.00
94
7,5
92
.00
156
,98
35
71,1
96
175
.54
20
02
3,6
108
,60
89
3,6
7612
5,8
94
0
.22
0
755
,36
4.0
01,
510
,72
8.0
03
,02
1,4
56
.00
163
,97
13
31,9
56
102
.01
110
13,2
52
5,4
57
55
,105
73
,814
0
.22
2
44
2,8
84
.00
88
5,7
68
.00
1,77
1,5
36
.00
175
,72
74
68
,54
614
3.9
915
018
,75
47,
06
876
,84
210
2,6
64
0
.219
6
15,9
84
.00
1,2
31,9
68
.00
2,4
63
,93
6.0
0
184
,076
34
0,5
1010
4.6
411
013
,25
25
,45
75
6,5
25
75,2
34
0
.22
1
45
1,4
04
.00
90
2,8
08
.00
1,8
05
,616
.00
191,
05
612
5,8
29
38
.67
50
6,9
49
2,7
64
10,3
182
0,0
31
0
.159
12
0,18
6.0
02
40
,372
.00
48
0,7
44
.00
20
6,3
67
755
,80
02
32
.27
25
03
0,5
59
11,3
7218
5,9
27
22
7,8
58
0
.30
1
1,3
67,
148
.00
2,7
34
,29
6.0
05
,46
8,5
92
.00
21
4,3
753
58
,170
110
.07
125
14,6
39
5,6
105
9,0
98
79
,34
7
0.2
22
4
76,0
82
.00
95
2,16
4.0
01,9
04
,32
8.0
0
22
3,0
07
24
5,8
63
75.5
610
011
,80
54
,30
42
0,16
13
6,2
70
0.14
8
217
,62
0.0
04
35
,24
0.0
08
70,4
80
.00
23
3,6
25
29
6,6
36
91.1
610
011
,80
54
,30
42
4,3
24
40
,43
3
0.13
6
24
2,5
98
.00
48
5,19
6.0
09
70,3
92
.00
24
1,2
55
141,
55
74
3.5
05
06
,94
92
,76
411
,60
82
1,3
21
0
.151
12
7,9
26
.00
25
5,8
52
.00
511
,70
4.0
0
25
2,2
56
25
0,0
02
76.8
310
011
,80
54
,30
42
0,5
00
36
,60
9
0.14
6
219
,65
4.0
04
39
,30
8.0
08
78,6
16.0
0
Tota
l72
,98
47,
44
1,2
77
2,2
86
2,6
103
21,
56
412
5,3
94
1,15
9,0
34
1,6
05
,99
2
0.2
03
9
,63
5,9
52
.00
19
,27
1,90
4.0
03
8,5
43
,80
8.0
0
T ota
l une
lect
rifi
ed
hous
ehol
ds in
rur
al a
reas
416
,87
93
23
,914
,85
93
7,4
20
0
.20
3 3
93
,66
4,7
01.1
9
787,
32
9,4
14.3
81,
574
,65
8,8
28
.76
Sou
rce
: Au
tho
rs’ c
alc
ula
tion
s, 20
07.
5176-ANNEX8.pdf 151 5/19/10 1:13 PM
152
Tab
le A
8.3
D
eci
sio
n M
atri
x fo
r D
iese
l Pla
nts
: Inv
estm
en
ts
Incr
easi
ng r
ura
l acc
ess
by:
Tota
l H
ou
seh
old
s B
enefi
ted
NP
V o
f in
ves
tmen
t U
S$
for
an
est
imate
d h
ou
rs
of s
ervic
e pro
vis
ion
612
24
Pla
nes
tar
get
-25
off
-gri
d
pro
ject
s14
,168
$9
,63
5,9
52
.0$
9,2
71,9
04
.0$
38
,54
3,8
08
.0
10%
41,
68
8$
39
,36
6,4
70.7
$78
,73
2,9
41.
4$
157,
46
5,8
82
.9
25
%10
4,2
20
$ 9
8,4
16,17
6.8
$19
6,8
32
,35
3.6
$3
93
,66
4,7
07.
2
50
%2
08
,43
9$
196
,83
2,3
53
.6$
39
3,6
64
,70
7.2
$78
7,3
29
,414
.4
100
%4
16,8
79
$3
93
,66
4,7
07.
2$
787,
32
9,4
14.4
$1,
574
,65
8,8
28
.8
Gov
ern
me
nt’
s Ta
rget
of
40
0,0
00
co
nn
ect
ion
s4
00
,00
0$
37
7,72
5,7
74.7
$75
5,4
51,
54
9.5
$1,
510
,90
3,0
98
.9So
urc
e: A
uth
ors
’ ca
lcu
latio
ns,
2007
.
Tab
le A
8.4
D
eci
sio
n M
atri
x fo
r D
iese
l Pla
nts
: An
nu
itie
s fo
r In
vest
me
nts
Incr
easi
ng r
ura
l acc
ess
by 2
5%
an
d f
or:
NP
V o
f el
ectr
icit
y
serv
ice
(US
$)
Yea
rs
12
34
56
78
910
12 h
ou
rs p
er
day
$19
6,8
32
,35
4$
19,6
83
,23
5$
17,5
74,3
17$
15,6
91,
35
5$
14,0
10,13
8$
12,5
09
,05
2$
11,16
8,7
96
$9
,972
,140
$8
,90
3,6
96
$7,
94
9,7
29
$7,
09
7,9
72
24
ho
urs
pe
r d
ay$
39
3,6
64
,70
7$
39
,36
6,4
71
$3
5,14
8,6
35
$3
1,3
82
,70
9$
28
,02
0,2
76$
25
,018
,104
$2
2,3
37,
59
3$
19,9
44
,27
9$
17,8
07,
39
2$
15,8
99
,45
7$
14,19
5,9
44
Sou
rce
: Au
tho
rs’ c
alc
ula
tion
s, 20
07.
Ass
um
ptio
ns:
Disc
ou
nt
rate
12.
0%; L
ife c
ycle
of
die
sel p
lan
t (7
50–1
500
rpm
) 10
ye
ars
.
5176-ANNEX8.pdf 152 5/19/10 1:13 PM
153
Increasing Access to Electricity
La Atravesada and Las Champas. Each project costs approximately US$500,000:
1. 55 kW La Atravesada in Mancomunidad Chortí, covering three unelectrified communities located 11 km from the nearest grid-tapping point, benefi ting 580 people in 94 households, as well as 4 schools, 5 churches, 5 retail stores, and other productive uses.
2. 80 kW Las Champas in the Department of Colón, covering three communities located 40 km from the national grid, benefi ting 166 homes, 27 commercial and industrial sites, and 10 public centers.
Microhydro investments vary greatly by technical and geographic factors. Costs vary substantially, depending on the construction site (type of fall), water availability, seasonality, and how dispersed are the targeted communities and households. Hence, to estimate the potential investments with this kind of technology, the following assumptions had to be made:
• The average capacity of each installed facility is 80 kW.
• The average number of households benefi ting from each facility is 150.
• The average life of the turbines is 12 years.
Simulations were run considering different scenarios. It was assumed that only a certain number of households were located in settings that met the technical and physical standards required for these kinds of projects. Scenarios were run for an increase in electrifi cation rate by 10 percent, 25 percent, 50 percent, and 100 percent assuming that appropriate physical and technical conditions are met. In addition, each of the scenarios was evaluated under two different program costs per project (life cycle): US$400,000 and US$500,000.
The results of both scenarios with different program costs are presented in Tables A8.5 and A8.6. As shown in Table A8.5, if it is estimated that only 10 percent of the unelectrifi ed households are in areas that meet the conditions to benefi t from microhydro programs, and on average each project benefi ts 150 households,
then 278 microhydro facilities would have to be constructed. If the cost of each program were US$400,000, then the NPV of the investment would be US$111.2 million.
The results of the different simulations are summarized in the decision matrix presented in Table A8.7. As shown, assuming that 100 percent of the unelectrifi ed households are in areas that meet physical and technical standards, and if each project had a cost of US$500,000, the cost of achieving universal access with this technology would be almost US$1.4 billion. If access is to be increased by 25 percent, assuming the same conditions, the cost would be approximately US$347 million.
The fi nancial annuities of the option to increase access by 25 percent with microhydro technology over a period of 12 years and at a discount rate of 12 percent are also presented in Table A8.7. What these fi gures reveal is that these types of programs are more expensive than other electrification alternatives. Hence, they are justifi ed only when the load factor is higher than that required merely for home lighting, which entails taking advantage of the potential productive uses market that each project may have.
Investment Needs for Extending Coverage to Dispersed Users with Solar Home SystemsAlthough there is no precise information regarding the number of inhabitants in the dispersed areas of Honduras, some inferences may be drawn in estimating the costs of increasing coverage.
For instance, if it is assumed that the unconnected areas, where there are currently no diesel plants, small hydroelectric plants, or any other service provision technology, are dispersed areas, then the approximate cost of installing photovoltaic systems in those areas could be inferred. Although this exercise does provide an estimate, it has several limitations that are worth mentioning.
First, photovoltaic technology is not necessarily the most adequate or sustainable delivery mechanism for dispersed users. For
5176-ANNEX8.pdf 153 5/19/10 1:13 PM
Tab
le A
8.5
S
cen
ario
1:
Pro
gra
m C
ost
of
US
$4
00
,00
0—
Co
st o
f In
stal
ling
Mic
rohy
dro
Sta
tio
ns,
Ass
um
ing
Th
at U
ne
lect
rifi
ed
Ru
ral H
ou
seh
old
s A
re
Iso
late
d a
nd
Dis
pe
rse
d
Est
imate
d H
ou
seh
old
s
w/o
ut
Ele
ctri
city
Est
imate
d H
ou
seh
old
s T
hat
Mee
t
the
Con
dit
ion
s to
Ben
efi t
fro
m
Mic
rohydro
Pro
gra
ms
in R
ura
l A
reas
Am
ount
of M
icro
hydro
to
be
Built
to
Incr
ease
Acc
ess
Est
imate
d C
ost
If E
ach
Pro
gra
m H
as
an
Aver
age
Cos
t of
US
$4
00
,00
0
Dep
artm
ent
Tota
lU
rban
Ru
ral
10%
25
%5
0%
100
%10
%2
5%
50
%10
0%
10%
25
%5
0%
100
%
Atl
ánti
da
21,
25
51,1
82
20
,074
2,0
07
5,0
1810
,03
72
0,0
7413
33
67
134
$5
,35
2,9
48
.8$
13,3
82
,372
.1$
26
,76
4,7
44
.1$
53
,52
9,4
88
.3
Ch
olu
teca
43
,33
62
,40
94
0,9
26
4,0
93
10,2
32
20
,46
34
0,9
26
27
68
136
27
3$
10,9
13,6
19.7
$2
7,2
84
,04
9.2
$5
4,5
68
,09
8.4
$10
9,13
6,19
6.8
Co
lón
18,8
151,
04
617
,76
91,7
77
4,4
42
8,8
84
17,7
69
123
05
911
8$
4,7
38
,28
2.8
$11
,84
5,7
07.
0$
23
,69
1,4
14.1
$4
7,3
82
,82
8.1
Co
may
agu
a2
3,9
53
1,3
32
22
,62
12
,26
25
,65
511
,310
22
,62
115
38
7515
1$
6,0
32
,210
.2$
15,0
80
,52
5.5
$3
0,16
1,0
51.
0$
60
,32
2,10
2.1
Co
pan
31,7
781,7
67
30
,011
3,0
01
7,5
03
15,0
06
30
,011
20
50
100
20
0$
8,0
03
,02
4.0
$2
0,0
07,
55
9.9
$4
0,0
15,11
9.8
$8
0,0
30
,23
9.5
Co
rté
s3
,00
716
72
,84
02
84
710
1,4
20
2,8
40
25
919
$75
7,2
11.8
$1,
89
3,0
29
.4$
3,7
86
,05
8.8
$7,
572
,117.
7
El P
arai
so3
7,3
25
2,0
753
5,2
50
3,5
25
8,8
1217
,62
53
5,2
50
23
59
117
23
5$
9,3
99
,89
7.7
$2
3,4
99
,74
4.4
$4
6,9
99
,48
8.7
$9
3,9
98
,97
7.4
Fran
cisc
o
Mo
razá
n2
5,8
08
1,4
35
24
,37
32
,43
76
,09
312
,187
24
,37
316
41
81
162
$6
,49
9,4
67.
6$
16,2
48
,66
8.9
$3
2,4
97,
33
7.8
$6
4,9
94
,675
.5
Gra
cias
a
Dio
s10
,92
76
08
10,3
20
1,0
32
2,5
80
5,16
010
,32
07
173
46
9$
2,7
51,9
50
.9$
6,8
79
,87
7.3
$13
,75
9,7
54
.6$
27,
519
,50
9.2
Inti
bu
ca2
2,17
11,
23
32
0,9
38
2,0
94
5,2
35
10,4
69
20
,93
814
35
7014
0$
5,5
83
,49
9.4
$13
,95
8,7
48
.6$
27,
917
,49
7.2
$5
5,8
34
,99
4.3
IsIa
s d
e la
Bah
ía16
99
160
164
08
016
00
01
1$
42
,65
7.6
$10
6,6
43
.9$
213
,28
7.9
$4
26
,575
.8
La
Paz
19,18
21,
06
718
,116
1,8
124
,52
99
,05
818
,116
123
06
012
1$
4,8
30
,84
1.0
$12
,07
7,10
2.5
$2
4,15
4,2
05
.1$
48
,30
8,4
10.1
Le
mp
ira
37,
49
82
,08
53
5,4
133
,54
18
,85
317
,70
73
5,4
132
45
911
82
36
$9
,44
3,5
87.
8$
23
,60
8,9
69
.6$
47,
217
,93
9.1
$9
4,4
35
,878
.3
Oco
tep
eq
ue
9,6
81
53
89
,143
914
2,2
86
4,5
71
9,14
36
153
06
1$
2,4
38
,03
4.5
$6
,09
5,0
86
.2$
12,19
0,17
2.4
$2
4,3
80
,34
4.8
Ola
nch
o4
8,4
63
2,6
95
45
,76
94
,57
711
,44
22
2,8
84
45
,76
93
176
153
30
5$
12,2
04
,96
1.6
$3
0,5
12,4
03
.9$
61,
02
4,8
07.
9$
122
,04
9,6
15.7
San
ta
Bar
bar
a4
2,4
35
2,3
59
40
,076
4,0
08
10,0
192
0,0
38
40
,076
27
67
134
26
7$
10,6
86
,911
.2$
26
,717
,278
.1$
53
,43
4,5
56
.2$
106
,86
9,11
2.4
Val
le12
,670
704
11,9
65
1,19
72
,99
15
,98
311
,96
58
20
40
80
$3
,190
,75
6.3
$7,
976
,89
0.7
$15
,95
3,7
81.
3$
31,9
07,
56
2.6
Yo
ro3
2,9
49
1,8
32
31,1
173
,112
7,7
79
15,5
58
31,1
172
15
210
42
07
$8
,29
7,8
27.
9$
20
,74
4,5
69
.6$
41,
48
9,13
9.3
$8
2,9
78,2
78.6
Tota
l4
41,
42
22
4,5
43
416
,87
94
1,6
88
104
,22
02
08
,43
94
16,8
79
278
69
51,
39
02
,77
9$
111,1
67,
69
0.8
$2
77,
919
,22
7.0
$5
55
,83
8,4
54
.1$
1,111
,676
,90
8.2
Sou
rce
: Au
tho
rs’ c
alc
ula
tion
s, 20
07.
Ass
um
ptio
ns:
Ca
pa
city
of
Pla
nt
80kW
; Ho
use
ho
lds
be
ne
fi te
d p
er p
roje
ct
150;
Ave
rag
e c
ost
pe
r pro
gra
m (
US$
) 2
Sce
na
rios;
Life
cyc
le o
f e
qu
ipm
en
t (y
ea
rs)
12.
5176-ANNEX8.pdf 154 5/19/10 1:13 PM
Tab
le A
8.6
S
cen
ario
2:
Pro
gra
m C
ost
of
US
$5
00
,00
0—
Co
st o
f In
stal
ling
Mic
rohy
dro
Sta
tio
ns,
Ass
um
ing
Th
at U
ne
lect
rifi
ed
Ru
ral H
ou
seh
old
s A
re
Iso
late
d a
nd
Dis
pe
rse
d
Est
imate
d H
ou
seh
old
s
w/o
ut
Ele
ctri
city
Est
imate
d H
ou
seh
old
s T
hat
Mee
t
the
Con
dit
ion
s to
Ben
efi t
fro
m
Mic
rohydro
Pro
gra
ms
in R
ura
l A
reas
Am
ount
of M
icro
hydr
o to
Be
Built
to
Incr
ease
Acc
ess
Est
imate
d C
ost
If E
ach
Pro
gra
m H
as
an
Aver
age
Cos
t of
US
$5
00
,00
0
Dep
artm
ent
Tota
lU
rban
Ru
ral
10%
20
%5
0%
100
%10
%2
0%
50
%10
0%
10%
20
%5
0%
100
%
Atl
ánti
da
21,
25
51,1
82
20
,074
2,0
07
5,0
1810
,03
72
0,0
7413
33
67
134
$6
,69
1,18
6.0
$16
,72
7,9
65
.1$
33
,45
5,9
30
.2$
66
,911
,86
0.3
Ch
olu
teca
43
,33
62
,40
94
0,9
26
4,0
93
10,2
32
20
,46
34
0,9
26
27
68
136
27
3$
13,6
42
,02
4.6
$3
4,10
5,0
61.
5$
68
,210
,123
.0$
136
,42
0,2
46
.1
Co
lón
18,8
151,
04
617
,76
91,7
77
4,4
42
8,8
84
17,7
69
123
05
911
8$
5,9
22
.85
3.5
$14
,80
7,13
3.8
$2
9,6
14,2
67.
6$
59
,22
8,5
35
.2
Co
may
agu
a2
3,9
53
1,3
32
22
,62
12
,26
25
,65
511
,310
22
,62
115
38
7515
1$
7,5
40
,26
2.8
$18
,85
0,6
56
.9$
37,
701,
313
.8$
75,4
02
,62
7.6
Co
pan
31,7
781,7
67
30
,011
3,0
01
7,5
03
15,0
06
30
,011
20
50
100
20
0$
10,0
03
,77
9.9
$2
5,0
09
,44
9.8
$5
0,0
18,8
99
.7$
100
,03
7,7
99
.4
Co
rté
s3
,00
716
72
,84
02
84
710
1,4
20
2,8
40
25
919
$9
46
,514
.7$
2,3
66
,28
6.8
$4
,73
2,5
73
.5$
9,4
65
,147.
1
El P
arai
so3
7,3
25
2,0
753
5,2
50
3,5
25
8,8
1217
,62
53
5,2
50
23
59
117
23
5$
11,7
49
,872
.2$
29
,374
,68
0.4
$5
8,7
49
,36
0.9
$11
7,4
98
,72
1.8
Fran
cisc
o
Mo
razá
n2
5,8
08
1,4
35
24
,37
32
,43
76
,09
312
,187
24
,37
316
41
81
162
$8
,124
,33
4.4
$2
0,3
10,8
36
.1$
40
,62
1,6
72.2
$8
1,2
43
,34
4.4
Gra
cias
a
Dio
s10
,92
76
08
10,3
20
1,0
32
2,5
80
5,16
010
,32
07
173
46
9$
3,4
39
,93
8.7
$8
,59
9,8
46
.6$
17,19
9,6
93
.3$
34
,39
9,3
86
.5
Inti
bu
ca2
2,17
11,
23
32
0,9
38
2,0
94
5,2
35
10,4
69
20
,93
814
35
7014
0$
6,9
79
,374
.3$
17,4
48
,43
5.7
$3
4,8
96
,87
1.4
$6
9,7
93
,74
2.9
Isla
s d
e la
Bah
ía16
99
160
164
08
016
00
01
1$
53
,32
2.0
$13
3,3
04
.9$
26
6,6
09
.9$
53
3,2
19.7
La
Paz
19,18
21,
06
718
,116
1,8
124
,52
99
,05
818
,116
123
06
012
1$
6,0
38
,55
1.3
$15
,09
6,3
78.2
$3
0,19
2,7
56
.3$
60
,38
5,5
12.6
Le
mp
ira
37,
49
82
,08
53
5,4
133
,54
18
,85
317
,70
73
5,4
132
45
911
82
36
$11
,80
4,4
84
.8$
29
,511
,212
.0$
59
,02
2,4
23
.9$
118
,04
4,8
47.
8
Oco
tep
eq
ue
9,6
81
53
89
,143
914
2,2
86
4,5
71
9,14
36
153
06
1$
3,0
47,
54
3.1
$7,
618
,85
7.7
$15
,23
7,7
15.5
$3
0,4
75,4
31.
0
Ola
nch
o4
8,4
63
2,6
95
45
,76
94
,57
711
,44
22
2,8
84
45
,76
93
176
153
30
5$
15,2
56
,20
2.0
$3
8,14
0,5
04
.9$
76,2
81,
00
9.8
$15
2,5
62
,019
.6
San
ta
Bar
bar
a4
2,4
35
2,3
59
40
,076
4,0
08
10,0
192
0,0
38
40
,076
27
67
134
26
7$
13,3
58
,63
9.1
$3
3,3
96
,59
7.6
$6
6,7
93
,195
.3$
133
,58
6,3
90
.5
Val
le12
,670
704
11,9
65
1,19
72
,99
15
,98
311
,96
58
20
40
80
$3
,98
8,4
45
.3$
9,9
71,1
13.3
$19
,94
2,2
26
.6$
39
,88
4,4
53
.3
Yo
ro3
2,9
49
1,8
32
31,1
173
,112
7,7
79
15,5
58
31,1
172
15
210
42
07
$10
,372
,28
4.8
$2
5,9
30
,712
.1$
51,
86
1,4
24
.1$
103
,72
2,8
48
.2
Tota
l4
41,
42
22
4,5
43
416
,87
94
1,6
88
104
,22
02
08
,43
94
16,8
79
278
69
51,
39
02
,77
9$
138
,95
9,6
13.5
$3
47,
39
9,0
33
.7$
69
4,7
98
,06
7.5
$1,
38
9,5
96
,134
.9
Sou
rce
: Au
tho
rs’ c
alc
ula
tion
s, 20
07.
Ass
um
ptio
ns:
Ca
pa
city
of
Pla
nt
80kW
; Ho
use
ho
lds
Ben
efi t
ed
pe
r pro
jec
t 15
0; A
vera
ge
co
st p
er p
rog
ram
(U
S$)
2 Sc
en
ario
s; L
ife c
ycle
of
eq
uip
me
nt
(ye
ars
) 12
.
5176-ANNEX8.pdf 155 5/19/10 1:13 PM
HONDURAS: POWER SECTOR ISSUES AND OPTIONS
156
An
nu
itie
s
Incr
easi
ng
rura
l acc
ess
by 2
5%
and
wit
h
Pro
gram
Cos
ts o
f:N
PV
of
Mic
ro
Hydro
in
US
$1
23
45
6
$4
00
,00
0.0
$2
77,
919
,22
7.0
$2
3,15
9,9
36
$2
0,6
78,5
14$
18,4
62
,95
9$
16,4
84
,78
5$
14,7
18,5
58
$13
,141,
56
9
$5
00
,00
0.0
$3
47,
39
9,0
33
.7$
28
,94
9,9
19$
25
,84
8,14
2$
23
,078
,69
9$
20
,60
5,9
81
$18
,39
8,19
7$
16,4
26
,96
2
Sou
rce
: Au
tho
rs’ c
alc
ula
tion
s, 20
07.
Ass
um
ptio
ns:
Ca
pa
city
of
Pla
nt
80kW
; Ho
use
ho
lds
be
ne
fi te
d p
er p
roje
ct
150;
Disc
ou
nt
Ra
te 1
2%; L
ife c
ycle
of
eq
uip
me
nt
(ye
ars
) 12
.
Tab
le A
8.7
D
eci
sio
n M
atri
x fo
r P
rog
ram
s w
ith
Mic
rohy
dro
Fac
iliti
es (
An
nu
itie
s L
imit
ed
to
Yea
rs 1
to
6)
NP
V o
f In
crea
sin
g a
cces
s to
% o
f ru
ral h
ou
seh
old
s
Pro
gra
m c
ost
(US
$)
10%
25
%5
0%
100
%
$4
00
,00
0.0
$11
1,16
7,6
90
.8$
27
7,9
19,2
27.
0$
55
5,8
38
,45
4.1
$1,1
11,6
76,9
08
.2
$5
00
,00
0.0
$13
8,9
59
,613
.5$
34
7,3
99
,03
3.7
$6
94
,79
8,0
67.
5$
1,3
89
,59
6,13
4.9
5176-ANNEX8.pdf 156 5/19/10 1:13 PM
157
Increasing Access to Electricity
example, in some mountainous regions, the sun’s radiation is not powerful enough for photovoltaic panels to operate properly. For some of these areas, there are hydropeak or other alternative energy (wind, geothermal) technologies that could prove to be more effi cient and sustainable.
Second, there might be “dispersed” homes located near the interconnected transmission grid or a stand-alone diesel system. In these cases, the best solution may be grid connection, and not the installation of photovoltaic equipment.
Without overlooking the shortcomings of the exercise, Tables A8.8 and A8.9 present the costs of carrying out a program involving the installation of 50 Wp or 20 Wp photovoltaic systems in all homes that are currently unserved in rural areas. For each scenario, different program costs were considered based on the recent experience with similar projects in Latin America. For instance, it is assumed that a renewable energy program involving the installation of a 50-Wp panel costs between US$600 and US$750, while a program involving the installation of a 20-Wp panel ranges between US$400 and US$500.58
Given that the total number of households to be served in rural areas is 416,878, (there are on average 5.15 people per household), the cost of achieving universal access by installing 50-Wp panels, as part of a program that costs an average of US$750 per household, is US$312,659,880 (see Table A8.8).
If coverage were to be increased by installing smaller equipment (20 Wp), the cost of extending coverage to 100 percent of rural households, at a program cost of US$500, would be US$208,439,920.
These estimates were produced assuming the extension of coverage to 100 percent of unelectrified households, even when it is understood that full coverage is impossible from the perspective of economic effi ciency. Nevertheless, the exercise is useful as a decision-
making tool. As shown in Table A8.9, policy makers could choose the target of increasing coverage by 25 percent, installing 20-Wp photovoltaic panels to half of the homes and 50-Wp photovoltaic panels to the other half. In this case, the present value of such investments, at a program cost of US$500 and US$750, respectively, is approximately US$65 million. This type of combination is more in line with reality and with the payment capacity of users in rural areas.
In contrast, if coverage were to be increased by the same amount (25 percent), but at lower program costs (e.g., US$400 and US$600, respectively), the cost of increasing coverage would be approximately US$52 million. The fi nancial annuities of both options, over a period of 10 years and at a discount rate of 12 percent, are presented in Table A8.10.
Policy Options with Tariff and SubsidiesTables A8.11 and A8.12 represent separately the options of tariff increases or direct subsidy modifi cations. Although the exercise provides different estimates for policy options, it has several limitations that are worth mentioning.
First, estimates involving tariff/subsidy modi f i ca t ions do not inc lude pr ice/consumption elasticities. Hence, it is assumed that after increasing tariffs (or reducing subsidies), customers remain at the same level of consumption, something that can be true for residential households in the 0 kW to 100 kW category (subsistence consumption), but not necessarily true for categories above 100 kW (who may adjust consumption levels to keep costs in line with household income). Second, while the analysis is illustrative and useful, it must be based on many assumptions. Additional and more detailed information would be required to make precise recommendations on subsidy targeting and tariff design. Specifi cally, an in-depth tariff and subsidy study is recommended.
58 These costs include the panel cost, service costs for installation and three years of maintenance, and market development costs.
5176-ANNEX8.pdf 157 5/19/10 1:13 PM
Tab
le A
8.8
C
ost
of
Inst
allin
g P
ho
tovo
ltai
c S
HS
of
20
Wp
an
d 5
0 W
p (
Ass
um
ing
Th
at U
ne
lect
rifi
ed
Ru
ral H
ou
seh
old
s A
re I
sola
ted
an
d D
isp
ers
ed
)
Est
imate
d H
ou
seh
old
s w
/ou
t E
lect
rici
ty
SH
S E
qu
ipm
ent
an
d P
rogra
m C
ost
20
Wp
50
Wp
Dep
art
men
tP
opu
lati
on
Per
son
s per
H
ou
seh
old
Ele
ctri
city
C
over
age
Tota
lU
rban
Ru
ral
$4
00
$5
00
$6
00
$75
0
Atl
ánti
da
3
79
,65
44
.34
75.6
92
1,2
55
.36
1,18
1.8
02
0,0
73
.56
$8
,02
9,4
23
.2$
10,0
36
,77
9.1
$12
,04
4,13
4.9
$15
,05
5,16
8.6
Ch
olu
t eca
4
27,
97
15
.164
7.78
43
,33
5.5
32
,40
9.4
64
0,9
26
.07
$16
,370
,42
9.5
$2
0,4
63
,03
6.9
$2
4,5
55
,64
4.3
$3
0,6
94
,55
5.4
Co
lón
2
72,0
09
5.2
36
3.7
918
,814
.66
1,0
46
.09
17,7
68
.56
$7,
107,
42
4.2
$8
,88
4,2
80
.3$
10,6
61,1
36
.3$
13,3
26
,42
0.4
Co
may
agu
a
40
0,6
20
5.0
86
9.6
12
3,9
52
.55
1,3
31.7
62
2,6
20
.79
$9
,04
8,3
15.3
$11
,310
,39
4.1
$13
,572
,47
3.0
$16
,96
5,5
91.
2
Co
pan
3
29
,59
24
.74
54
.34
31,7
78.2
11,7
66
.87
30
,011
.34
$12
,00
4,5
35
.9$
15,0
05
,66
9.9
$18
,00
6,8
03
.9$
22
,50
8,5
04
.9
Co
rté
s
1,4
06
,776
5.5
99
8.8
13
,00
6.7
216
7.17
2,8
39
.54
$1,1
35
,817
.6$
1,4
19,7
72.1
$1,7
03
,72
6.5
$2
,129
,65
8.1
El P
arai
so
39
2,18
15
.52
47.
49
37,
32
4.8
82
,075
.26
35
,24
9.6
2$
14,0
99
,84
6.6
$17
,62
4,8
08
.3$
21,1
49
,76
9.9
$2
6,4
37,
212
.4
F ran
cisc
o
Mo
razá
n
1,3
23
,27
34
.95
90
.34
25
,80
7.9
21,
43
4.9
22
4,3
73
.00
$9
,74
9,2
01.
3$
12,18
6,5
01.7
$14
,62
3,8
02
.0$
18,2
79
,75
2.5
Gra
cias
a D
ios
78
,60
26
.30
12.3
610
,92
7.3
86
07.
56
10,3
19.8
2$
4,12
7,9
26
.4$
5,15
9,9
08
.0$
6,19
1,8
89
.6$
7,7
39
,86
2.0
Inti
bu
c a
20
8,0
05
5.9
83
6.2
12
2,17
0.8
21,
23
2.7
02
0,9
38
.12$
8,3
75,2
49
.1$
10,4
69
,06
1.4
$12
,56
2,8
73
.7$
15,7
03
,59
2.1
Isla
s d
e la
Bah
ía
44
,25
44
.139
8.4
216
9.3
89
.42
159
.97
$6
3,9
86
.4$
79
,98
3.0
$9
5,9
79
.5$
119
,974
.4
La
Paz
17
8,17
25
.65
39
.22
19,18
2.18
1,0
66
.53
18,11
5.6
5$
7,2
46
,26
1.5
$9
,05
7,8
26
.9$
10,8
69
,39
2.3
$13
,58
6,7
40
.3
Le
mp
ira
2
85
,186
5.7
42
4.5
63
7,4
98
.36
2,0
84
.91
35
,413
.45
$14
,165
,38
1.7$
17,7
06
,72
7.2
$2
1,2
48
,072
.62
6,5
60
,09
0.8
Oc o
tep
eq
ue
12
1,2
84
4.9
56
0.4
79
,68
0.8
95
38
.26
9,14
2.6
3$
3,6
57,
05
1.7$
4,5
71,
314
.6$
5,4
85
,57
7.6
$6
,85
6,9
72.0
Ola
nch
o
46
8,4
23
5.4
74
3.4
64
8,4
63
.162
,69
4.5
54
5,7
68
.61
$18
,30
7,4
42
.4$
22
,88
4,3
02
.9$
27,
46
1,16
3.5
$3
4,3
26
,45
4.4
San
ta B
arb
ara
3
75,0
06
4.6
54
7.3
54
2,4
35
.32
2,3
59
.40
40
,075
.92
$16
,03
0,3
66
.9$
20
,03
7,9
58
.6$
24
,04
5,5
50
.3$
30
,05
6,9
37.
9
Val
le
162
,53
54
.73
63
.1412
,66
9.7
870
4.4
411
,96
5.3
4$
4,7
86
,134
.4$
5,9
82
,66
8.0
$7,
179
,20
1.6
$8
,974
,00
2.0
Yo
ro
513
,478
4.9
06
8.5
33
2,9
48
.81
1,8
31.9
53
1,116
.85
$12
,44
6,7
41.
8$
15,5
58
,42
7.2
$18
,670
,112
.7$
23
,33
7,6
40
.8
Tota
l
7,3
67,
02
15
.156
9.13
%4
41,
42
1.90
24
,54
3.0
64
16,8
78.8
4$
166
,75
1,93
6.1
$2
08
,43
9,9
20
.1$
25
0,12
7,9
04
.1$
312
,65
9,8
80
.1
Sou
rce
: Au
tho
rs’ c
alc
ula
tion
s, 20
07.
5176-ANNEX8.pdf 158 5/19/10 1:13 PM
Sou
rce
: Au
tho
rs’ c
alc
ula
tion
s, 20
07.
Tab
le A
8.9
D
eci
sio
n M
atri
x fo
r P
rog
ram
s w
ith
SH
S
Siz
e of
SH
SP
rogra
m C
ost
(US
$)
NP
V o
f In
crea
sin
g A
cces
s to
% o
f R
ura
l H
ou
seh
old
s
10%
25
%5
0%
100
%
20
Wp
$4
00
.0$
16,6
75,19
3.6
$4
1,6
87,
98
4.0
$8
3,3
75,9
68
.0$
166
,75
1,93
6.1
$5
00
.0$
20
,84
3,9
92
.0$
52
,109
,98
0.0
$10
4,2
19,9
60
.0$
20
8,4
39
,92
0.1
50
Wp
$6
00
.0$
25
,012
,79
0.4
$6
2,5
31,9
76.0
$12
5,0
63
,95
2.1
$2
50
,127,
90
4.1
$75
0.0
$3
1,2
65
,98
8.0
$78
,164
,970
.0$
156
,32
9,9
40
.1$
312
,65
9,8
80
.1
Inst
allin
g 5
0%
of
20
Wp
(U
S$
40
0)
and
50
% o
f 5
0W
p
(US
$6
00
)$
20
,84
3,9
92
.0$
52
,109
,98
0.0
$10
4,2
19,9
60
.0$
20
8,4
39
,92
0.1
Inst
allin
g 5
0%
of
20
Wp
(U
S$
50
0)
and
50
% o
f 5
0W
p
(US
$75
0)
$2
6,0
54
,99
0.0
$6
5,13
7,4
75.0
$13
0,2
74,9
50
.1$
26
0,5
49
,90
0.1
Tab
le A
8.1
0 D
eci
sio
n M
atri
x: A
nn
uit
ies
for
Pro
gra
ms
wit
h S
HS
Incr
easi
ng r
ura
l acc
ess
by 2
5%
:
NP
V o
f S
HS
in U
S$
Yea
rs
12
34
56
78
910
Inst
allin
g 5
0%
of
20
Wp
(US
$4
00
) an
d 5
0%
of
50
Wp
(U
S$
60
0)
$5
2,10
9,9
80
$5
,210
,99
8$
4,6
52
,67
7$
4,15
4,17
6$
3,7
09
,08
5$
3,3
11,6
83
$2
,95
6,8
60
$2
,64
0,0
54
$2
,35
7,19
1$
2,10
4,6
35
$1,
87
9,13
8
Inst
allin
g 5
0%
of
20
Wp
(US
$5
00
) an
d 5
0%
of
50
Wp
(U
S$
750
)$
65
,137,
475
$6
,513
,74
8$
5,8
15,8
46
$5
,192
,72
0$
4,6
36
,35
7$
4,13
9,6
04
$3
,69
6,0
75$
3,3
00
,06
7$
2,9
46
,48
9$
2,6
30
,79
3$
2,3
48
,92
3
Sou
rce
: Au
tho
rs’ c
alc
ula
tion
s, 20
07.
Ass
um
ptio
ns:
Disc
ou
nt
rate
12.
0%; L
ife c
ycle
of
die
sel p
lan
t (7
50–1
500
rpm
) 10
ye
ars
.
5176-ANNEX8.pdf 159 5/19/10 1:14 PM
Tab
le A
8.1
1 P
ub
lic P
olic
y M
ix: I
ncr
ease
s in
Tar
iff
and
Dir
ect
Su
bsi
dy
Fin
al P
rice
to
Cu
stom
er $
/kW
h
Gov
ern
men
t D
irec
t S
ubsi
dy
Policy
Sta
tus-
qu
o10
% I
ncr
ease
in
Dir
ect
Su
bsi
dy
20
% I
ncr
ease
in
Dir
ect
Su
bsi
dy
$/k
Wh
% o
f C
ost
Am
ou
nt
of $
liber
alize
d$
/kW
h%
of
Cos
tA
mou
nt
of $
liber
alize
d$
/kW
h%
of
Cos
tA
mou
nt
of $
liber
alize
d
Tariff Policy
Sta
tus-
qu
o
0–2
0 k
Wh
0.0
670
16.13
%$
0.0
0.0
64
515
.53
%–$
1,5
15.9
0.0
62
014
.93
%–$
3,0
31.
8
21–
50
0.0
313
16.7
0%
$0
.00
.02
98
15.8
8%
–$4
,79
7.8
0.0
28
215
.06
%–$
9,5
95
.6
51–
100
0.0
39
02
4.7
8%
$0
.00
.03
722
3.6
6%
–$17
,73
9.7
0.0
35
52
2.5
4%
–35
,47
9.4
101–
150
0.0
46
93
1.91%
$0
.00
.04
50
30
.60
%–$
30
,86
7.4
0.0
43
12
9.2
9%
–61,7
34
.8
151–
30
00
.06
55
46
.67
%$
0.0
0.0
64
24
5.7
6%
–$6
5,8
40
.80
.06
30
44
.86
%–$
131,
68
1.6
30
1–5
00
0.0
88
76
5.0
2%
$0
.00
.08
87
65
.02
%$
0.0
0.0
88
76
5.0
2%
$0
.0
50
1 an
d >
0.10
93
82
.05
%$
0.0
0.10
93
82
.05
%$
0.0
0.10
93
82
.05
%$
0.0
Subt
otal
wit
hin
cat
egor
y$
0.0
$12
0,7
61.
6$
24
1,5
23
.2
10%
ta
riff
in
crea
se
0–2
0 k
Wh
0.0
762
18.3
5%
$5
,59
2.5
0.0
73
7
17.7
5%
$4
,076
.60
.07
1217
.15%
$2
,56
0.7
21–
50
0.0
36
019
.20
%$
14,5
46
.20
.03
44
18.3
7%
$9
,74
8.4
0.0
32
917
.55
%$
4,9
50
.6
51–
100
0.0
44
72
8.3
8%
$5
6,9
85
.90
.04
29
27.
26
%$
39
,24
6.2
0.0
411
26
.14%
$2
1,5
06
.5
101–
150
0.0
53
53
6.4
0%
$10
6,2
42
.90
.05
163
5.10
%$
75,3
75.5
0.0
49
73
3.7
9%
$4
4,5
08
.1
151–
30
00
.07
33
52
.24
%$
40
5,8
57.
70
.072
15
1.3
4%
$3
40
,016
.90
.070
85
0.4
3%
$2
74,17
6.1
30
1–5
00
0.0
975
71.
52
%$
27
7,4
11.3
0.0
975
71.
52
%$
27
7,4
11.3
0.0
975
71.
52
%$
27
7,4
11.3
50
1 an
d >
0.12
02
90
.25
%$
42
9,5
72.5
0.12
02
90
.25
%$
42
9,5
72.5
0.12
02
90
.25
%$
42
9,5
72.5
Subt
otal
wit
hin
cat
egor
y$
1,2
96
,20
9.0
$1,
175
,44
7.4
$1,
05
4,6
85
.8
20
%
tari
ff
incr
ease
0–2
0 k
Wh
0.0
85
42
0.5
6%
$11
,185
.00
.08
29
19.9
6%
$9
,66
9.1
0.0
80
419
.36
%$
8,15
3.2
21–
50
0.0
40
72
1.6
9%
$2
9,0
92
.40
.03
91
20
.87
%$
24
,29
4.6
0.0
376
20
.04
%$
19,4
96
.8
51–
100
0.0
50
33
1.98
%$
113
,97
1.8
0.0
48
63
0.8
6%
$9
6,2
32
.10
.04
68
29
.74
%$
78,4
92
.4
101–
150
0.0
60
14
0.9
0%
$2
12,4
65
.80
.05
82
39
.59
%$
181,
618
.40
.05
63
38
.29
%$
150
,75
1.0
151–
30
00
.08
115
7.8
1%$
811
,715
.50
.07
99
56
.91%
$74
5,8
74.7
0.0
786
56
.00
%$
68
0,0
33
.9
30
1–5
00
0.10
64
78.0
3%
$5
54
,82
2.5
0.10
64
78.0
3%
$5
54
,82
2.5
0.10
64
78.0
3%
$5
54
,82
2.5
50
1 an
d >
0.13
129
8.4
6%
$8
59
,145
.00
.1312
98
.46
%$
85
9,14
5.0
0.13
129
8.4
6%
$8
59
,145
.0
Subt
otal
wit
hin
cat
egor
y$
2,5
92
,418
.0$
2,4
71,
65
6.4
$2
,35
0,8
94
.8So
urc
e: A
uth
ors
’ ca
lcu
latio
ns,
2007
.
5176-ANNEX8.pdf 160 5/19/10 1:14 PM
Tab
le A
8.1
2 P
ub
lic P
olic
y M
ix: I
ncr
ease
in T
arif
f an
d D
ecr
ease
in D
ire
ct S
ub
sid
y
Gov
ern
men
t D
irec
t S
ubsi
dy
Policy
Fin
al P
rice
to C
ust
om
er $
/kW
h
10%
Dec
rease
in
Dir
ect
Su
bsi
dy
20
% D
ecre
ase
in
Dir
ect
Su
bsi
dy
Dir
ect
Su
bsi
dy
Elim
inati
on
$/k
Wh
% o
f C
ost
Am
ou
nt
of $
liber
alize
d$
/kW
h%
of
Cos
tA
mou
nt
of $
liber
alize
d$
/kW
h%
of
Cos
tA
mou
nt
of $
liber
alize
d
Tariff Policy
Sta
tus-
qu
o
0–2
0 k
Wh
0.11
44
27.
53
%$
1,5
15.9
0.11
192
6.9
3%
$3
,03
1.8
0.0
919
22
.13%
15,15
9
21–
50
0.0
60
63
2.3
2%
$4
,79
7.8
0.0
59
03
1.5
0%
$9
,59
5.6
0.0
46
72
4.9
3%
47,
978
51–
100
0.0
725
46
.06
%$
17,7
39
.70
.070
74
4.9
4%
$3
5,4
79
.40
.05
66
35
.98
%17
7,3
97
101–
150
0.0
83
45
6.7
3%
$3
0,8
67.
40
.08
155
5.4
3%
$6
1,73
4.8
0.0
66
14
4.9
7%
30
8,6
74
151–
30
00
.08
96
63
.84
%$
65
,84
0.8
0.0
88
36
2.9
3%
$13
1,6
81.
60
.078
25
5.7
1%6
58
,40
8
30
1–5
00
0.0
88
76
5.0
2%
$0
.00
.08
87
65
.02
%$
0.0
0.0
88
76
5.0
2%
50
1 an
d >
0.10
93
82
.05
%$
0.0
0.10
93
82
.05
%$
0.0
0.10
93
82
.05
%
Su
bto
tal w
ith
in c
ate
gory
$12
0,7
61.
6$
24
1,5
23
.2$
1,2
07,
616
.0
10%
tar
iff
incr
ease
0–2
0 k
Wh
0.12
35
29
.74
%$
7,10
8.4
0.12
112
9.14
%$
8,6
24
.30
.08
1119
.52
%$
20
,75
1.5
21–
50
0.0
65
33
4.8
2%
$19
,34
4.0
0.0
63
73
3.9
9%
$2
4,14
1.8
0.0
37
92
0.2
1%$
62
,52
4.2
51–
100
0.0
782
49
.66
%$
74,7
25
.60
.076
44
8.5
4%
$9
2,4
65
.30
.04
722
9.9
8%
$2
34
,38
2.9
101–
150
0.0
90
06
1.2
3%
$13
7,11
0.3
0.0
88
15
9.9
2%
$16
7,9
77.
70
.05
67
38
.61%
$4
14,9
16.9
151–
30
00
.09
746
9.4
1%$
47
1,6
98
.50
.09
62
68
.51%
$5
37,
53
9.3
0.0
79
35
6.4
7%
$1,
06
4,2
65
.7
30
1–5
00
0.0
975
71.
52
%$
27
7,4
11.3
0.0
975
71.
52
%$
27
7,4
11.3
0.10
73
78.6
8%
$2
77,
411
.3
50
1 an
d >
0.12
02
90
.25
%$
42
9,5
72.5
0.12
02
90
.25
%$
42
9,5
72.5
0.13
23
99
.28
%$
42
9,5
72.5
Su
bto
tal w
ith
in c
ate
gory
$1,
416
,970
.6$
1,5
37,
73
2.2
$2
,50
3,8
25
.0
20
% t
arif
f in
crea
se
0–2
0 k
Wh
0.13
27
31.9
6%
$12
,70
0.9
0.13
02
31.
36
%$
14,2
16.8
0.0
99
52
3.9
5%
$2
6,3
44
.0
21–
50
0.0
69
93
7.3
1%$
33
,89
0.2
0.0
68
43
6.4
9%
$3
8,6
88
.00
.04
69
25
.04
%$
77,
070
.4
51–
100
0.0
83
85
3.2
6%
$13
1,711
.50
.08
21
52
.14%
$14
9,4
51.
20
.05
83
37.
03
%$
29
1,3
68
.8
101–
150
0.0
96
66
5.7
3%
$2
43
,35
3.2
0.0
94
76
4.4
2%
$2
74,2
20
.60
.06
98
47.
51%
$5
21,1
59
.8
151–
30
00
.105
274
.98
%$
87
7,5
56
.30
.104
074
.08
%$
94
3,3
97.
10
.09
59
68
.29
%$
1,4
70,12
3.5
30
1–5
00
0.10
64
78.0
3%
$5
54
,82
2.5
0.10
64
78.0
3%
$5
54
,82
2.5
0.12
77
93
.63
%$
55
4,8
22
.5
50
1 an
d >
0.13
129
8.4
6%
$8
59
,145
.00
.1312
98
.46
%$
85
9,14
5.0
0.15
7411
8.15
%$
85
9,14
5.0
Su
bto
tal w
ith
in c
ate
gory
$2
,713
,17
9.6
$2
,83
3,9
41.
2$
3,8
00
,03
4.0
Sou
rce
: Au
tho
rs’ c
alc
ula
tion
s, 20
07.
5176-ANNEX8.pdf 161 5/19/10 1:14 PM
Tab
le A
8.1
3 S
cen
ario
s fo
r In
crea
sin
g R
esid
en
tial
Tar
iff
Con
sum
er C
ate
gory
Tari
ff I
ncr
ease
$A
vg T
ari
ff $
/kW
h%
of
Cos
t
10%
15%
20
%10
%15
%2
0%
10%
15%
20
%
A R
esid
enti
al
0–2
0 k
Wh
61,
518
64
,314
67,
110
0.10
110
.105
70
.110
32
4.3
4%
25
.45
%2
6.5
6%
21–
50
160
,00
816
7,2
81
174
,55
40
.05
140
.05
37
0.0
56
12
7.4
2%
28
.66
%2
9.9
1%
51–
100
62
6,8
45
65
5,3
38
68
3,8
31
0.0
62
30
.06
51
0.0
68
03
9.5
8%
41.
38
%4
3.18
%
101–
150
1,16
8,6
721,
22
1,79
31,
274
,915
0.0
727
0.0
760
0.0
79
34
9.4
7%
51.7
2%
53
.97
%
151–
30
04
,46
4,4
35
4,6
67,
36
44
,870
,29
30
.08
60
0.0
89
90
.09
38
61.
28
%6
4.0
6%
66
.85
%
30
1–5
00
3,0
51,
52
43
,190
,22
93
,32
8,9
35
0.0
975
0.10
190
.106
47
1.5
2%
74.7
8%
78.0
3%
50
1 an
d >
4,7
25
,29
74
,94
0,0
84
5,15
4,8
700
.120
20
.125
70
.1312
90
.25
%9
4.3
5%
98
.46
%
Tota
l re
siden
tial
14,2
58
,29
914
,90
6,4
04
15,5
54
,50
86
6.1
0%
69
.11%
72
.11%
Res
iden
tial S
tepped
Rate
s
Blo
ck 0
–10
0 k
Wh
84
8,3
71
88
6,9
33
92
5,4
95
35
.06
%3
6.6
5%
38
.24
%
Blo
ck 1
01–
30
0 k
Wh
5,6
33
,107
5,8
89
,157
6,14
5,2
08
58
.38
%6
1.0
4%
63
.39
%
Blo
ck 3
01–
50
0 k
Wh
3,0
51,
52
43
,190
,22
93
,32
8,9
35
71.
52
%74
.78
%78
.03
%
Blo
ck 5
01–
> kW
h4
,72
5,2
97
4,9
40
,08
45
,154
,870
90
.25
%9
4.3
5%
98
.46
%
Cu
mu
lati
ve
0–5
02
21,
52
62
31,
59
52
41,
66
51
26
.49
%2
7.6
9%
28
.90
%
0–1
00
84
8,3
71
88
6,9
33
92
5,4
95
13
5.0
6%
36
.65
%3
8.2
4%
0–3
00
6,4
81,
478
6,7
76,0
90
7,0
70,7
03
53
.71%
56
.15%
58
.59
%
0–5
00
9,5
33
,00
29
,96
6,3
20
10,3
99
,63
85
8.3
6%
61.
01%
63
.67
%
Tota
l E
NE
E4
0,8
49
,26
04
2,7
06
,04
54
4,5
62
,82
98
9.3
8%
93
.44
%9
7.5
0%
Addit
ion
al U
S$
du
e to
tari
ff
incr
ease
in
res
iden
tial
1,2
96
,20
91,
94
4,3
142
,59
2,4
18
Addit
ion
al U
S$
du
e to
tari
ff
incr
ease
in
all c
ate
gori
es3
,713
,56
95
,57
0,3
54
7,4
27,
138
Sou
rce
: Au
tho
rs’ c
alc
ula
tion
s, 20
07.
5176-ANNEX8.pdf 162 5/19/10 1:14 PM
163Tab
le A
8.1
4 S
cen
ario
s fo
r A
dju
stin
g G
ove
rnm
en
t D
ire
ct S
ub
sid
y P
olic
y
Con
sum
er C
ate
gory
Dir
ect
Su
bsi
dy
Policy
Fin
al P
rice
to C
ust
om
er
$10
% I
ncr
ease
in
D
irec
t S
ubsi
dy
20
% I
ncr
ease
in
D
irec
t S
ubsi
dy
10%
Dec
rease
in
D
irec
t S
ubsi
dy
20
% D
ecre
ase
in
D
irec
t S
ubsi
dy
Elim
inati
on
of
Dir
ect
Su
bsi
dy
10%
20
%–1
0%
–20
%$
/kW
h%
of
Cos
t$
/kW
h%
of
Cos
t$
/kW
h%
of
Cos
t$
/kW
h%
of
Cos
t$
/kW
h%
of
Cos
t
A R
esid
enti
al
0–2
0 k
Wh
16,6
7518
,191
13,6
43
12,12
70
.03
96
9.5
3%
0.0
37
18
.93
%0
.08
94
21.
53
%0
.08
69
20
.93
%0
.09
192
2.13
%
21–
50
52
,776
57,
574
43
,180
38
,38
20
.014
47.
66
%0
.012
86
.84
%0
.04
52
24
.10%
0.0
43
62
3.2
8%
0.0
46
72
4.9
3%
51–
100
195
,137
212
,876
159
,65
714
1,918
0.0
196
12.4
6%
0.0
178
11.3
4%
0.0
54
93
4.8
6%
0.0
53
13
3.7
4%
0.0
56
63
5.9
8%
101–
150
33
9,5
41
370
,40
92
77,
80
72
46
,93
90
.02
58
17.5
3%
0.0
23
916
.23
%0
.06
42
43
.67
%0
.06
23
42
.36
%0
.06
61
44
.97
%
151–
30
072
4,2
49
79
0,0
90
59
2,5
67
52
6,7
26
0.0
516
36
.73
%0
.05
03
35
.82
%0
.076
95
4.8
0%
0.0
757
53
.90
%0
.078
25
5.7
1%
30
1–5
00
00
00
0.0
88
76
5.0
2%
0.0
88
76
5.0
2%
0.0
88
76
5.0
2%
0.0
88
76
5.0
2%
0.0
88
76
5.0
2%
50
1 an
d >
00
00
0.10
93
82
.05
%0
.109
38
2.0
5%
0.10
93
82
.05
%0
.109
38
2.0
5%
0.10
93
82
.05
%
Tota
l re
siden
tial
1,3
28
,37
81,
44
9,1
39
1,0
86
,85
49
66
,09
30
.06
84
48
.34
%0
.06
76
47.
78
%0
.08
43
59
.53
%0
.08
35
58
.97
%0
.08
51
60
.09
%
Res
iden
tial S
tepped
Rate
s
Blo
ck 0
–10
0 k
Wh
26
4,5
87
28
8,6
41
216
,48
119
2,4
27
Blo
ck 1
01–
30
0 k
Wh
1,0
63
,79
01,1
60
,49
88
70,3
747
73
,66
6
Blo
ck 3
01–
50
0 k
Wh
00
00
Blo
ck 5
01–
> k
Wh
00
00
Cu
mu
lati
ve
0–5
06
9,4
51
75,7
64
56
,82
35
0,5
10
0–1
00
26
4,5
87
28
8,6
41
216
,48
119
2,4
27
0–3
00
1,3
28
,378
1,4
49
,139
1,0
86
,85
49
66
,09
3
0–5
00
1,3
28
,378
1,4
49
,139
1,0
86
,85
49
66
,09
3
Lib
eralize
d r
esou
rces
for
oth
er u
ses
–12
0,7
62
–24
1,5
23
120
,76
22
41,
52
3
Sou
rce
: Au
tho
rs’ c
alc
ula
tion
s, 20
07.
5176-ANNEX8.pdf 163 5/19/10 1:14 PM
Tab
le A
8.1
5 F
inan
cial
Im
plic
atio
ns
of
Me
etin
g t
he
Ele
ctri
fi ca
tio
n T
arg
et B
ase
d o
n C
urr
en
t Ta
riff
an
d S
ub
sid
y S
tru
ctu
re
Est
imate
d a
nn
ual defi
cit
cau
sed
by n
ew c
on
nec
tion
s
12
34
56
78
9
20
06
20
07
20
08
20
09
20
102
011
20
122
013
20
142
015
Nu
mb
er
of
cust
om
ers
in
cate
go
ry 5
0–1
00
kW
h/
mo
nth
132
,80
417
7,8
04
22
2,8
04
26
7,8
04
312
,80
43
57,
80
44
02
,80
44
47,
80
44
92
,80
45
37,
80
4
En
erg
y in
MW
h/
year
of
cust
om
ers
in 5
0–1
00
kW
h
con
sum
pti
on
cat
eg
ory
120
,74
012
3,6
65
126
,59
012
9,5
1513
2,4
40
135
,36
513
8,2
90
141,
215
144
,140
147,
06
5
Est
imat
ed
an
nu
al r
eve
nu
e w
ith
adju
ste
d t
arif
f fr
om
cu
sto
me
rs
in 5
0–1
00
kW
h c
on
sum
pti
on
cate
go
ry6
,83
8,3
09
7,8
44
,44
78
,99
3,5
87
10,3
05
,56
111
,80
2,9
01
13,5
11,2
02
15,4
59
,53
417
,68
0,9
04
20
,212
,78
52
3,0
97,
713
Est
imat
ed
an
nu
al c
ost
of
pro
vid
ing
se
rvic
e t
o c
ust
om
ers
in 5
0–1
00
kW
h c
on
sum
pti
on
cate
go
ry19
,00
5,8
00
21,
80
2,17
42
4,9
95
,99
42
8,6
42
,38
03
2,8
03
,95
53
7,5
51,
85
94
2,9
66
,88
34
9,14
0,7
66
56
,177,
65
76
4,19
5,7
75
An
nu
al t
arif
f d
efi
cit
cau
sed
in t
he
50
–10
0 k
Wh
/mo
nth
con
sum
pti
on
cat
eg
ory
–12
,167,
49
1–1
3,9
57,
727
–16
,00
2,4
07
–18
,33
6,8
19–2
1,0
01,
05
5–2
4,0
40
,65
7–2
7,5
07,
34
9–3
1,4
59
,86
2–3
5,9
64
,872
–41,
09
8,0
62
Est
imat
ed
to
tal d
ire
ct s
ub
sid
y
ne
ed
ed
pe
r ye
ar $
fo
r 5
0–1
00
kWh
co
nsu
mp
tio
n c
ate
go
ry2
,128
,76
42
,44
1,975
2,7
99
,70
23
,20
8,11
93
,674
,24
04
,20
6,0
34
4,8
12,5
50
5,5
04
,06
26
,29
2,2
36
7,19
0,3
13
Sou
rce
: Au
tho
rs’ c
alc
ula
tion
s, 20
07.
Ass
ump
tions
A.
No
. of
ne
w c
on
ne
ctio
ns
pe
r ye
ar,
un
til 2
015:
45,
000
B.
Ave
rag
e c
on
sum
ptio
n p
er y
ea
r of
ne
w c
on
ne
ctio
ns
is 77
7 kW
h (
PLA
NES
), h
en
ce
, ave
rag
e m
on
thly
co
nsu
mp
tion
in k
Wh
pe
r co
nn
ec
tion
is: 6
5
C.
Ave
rag
e A
dju
ste
d Ta
riff
for t
he
co
nsu
mp
tion
ca
teg
ory
is k
ep
t a
t le
vel o
f N
ov
06(U
S$/k
Wh
): 0
.056
6
D.
Dire
ct
Go
vern
me
nt
Sub
sidy
is ke
pt
at
the
sa
me
leve
l pe
r co
nsu
mp
tion
ca
teg
ory
(U
S$/k
Wh
): 0
.017
6
E.
Es
tima
ted
se
rvic
e c
ost
pe
r cu
sto
me
r in
th
e 5
1–10
0 kW
h c
on
sum
ptio
n c
ate
go
ry (
US$
/kW
h):
0.1
574
F.
Inte
rest
rate
-Disc
ou
nt
rate
: 12.
0%
Estim
atio
ns
G.
Estim
ate
d m
on
thly
reve
nu
e p
er n
ew
co
nn
ec
tion
with
ad
just
ed
ta
riff
US$
(B
× C
): 3
.7
H.
Estim
ate
d m
on
thly
co
st o
f se
rvic
e p
er n
ew
co
nn
ec
tion
US$
(E
× B
): 1
0.2
I.
Re
ven
ue
with
ad
just
ed
ta
riff
as
a %
of
co
st o
f se
rvic
e p
er n
ew
co
nn
ec
tion
(G
/H):
36.
0%
J.
A
nn
ua
l ta
riff
de
fi cit
ca
use
d b
y n
ew
co
nn
ec
tion
s U
S$ (
H –
G)
× A
) ×
12:
–U
S$3,
537,
175.
7
K.
Est
ima
ted
ad
diti
on
al m
on
thly
dire
ct
sub
sidy
ne
ed
ed
pe
r co
nn
ec
tion
US$
(D
× B
): U
S$1.
1
L.
Es
tima
ted
to
tal a
dd
itio
na
l dire
ct
sub
sidy
ne
ed
ed
pe
r ye
ar U
S$ (
K ×
A ×
12)
: US$
618,
846.
7
M.
Estim
ate
d a
dd
itio
na
l US$
ne
ed
ed
pe
r ye
ar t
o k
ee
p s
tatu
s q
uo
with
ta
riff
an
d d
irec
t su
bsid
y w
ith n
ew
co
nn
ec
tion
s (J
+ L
): U
S$4,
156,
022.
4
5176-ANNEX8.pdf 164 5/19/10 1:14 PM
165
Renewable Energy Increasing prices for oil have increased production costs, and with the shift from hydro-based production to a predominantly thermal-base structure, the system has faced important obstacles on the fi nancial front. One way of addressing the high cost structure consists of developing renewable resources. This annex examines the issues associated with such a development.
IntroductionIn 1998, the Honduran Congress approved legislation to promote the development of renewable-energy-generating plants (Decrees No. 85.98 and 267-98), complementing the Electricity Law issued in 1994. This legislation contemplates tax breaks to developers and a secure buyer for energy at prices equivalent to the system’s short-term marginal cost (the Empresa Nacional de Energía Eléctrica [ENEE] is the default buyer and pays a premium when the installed capacity is less than 50 megawatts [MW]). Under this umbrella, private sponsors have negotiated about 30 public/private partnerships (PPAs) with ENEE for small renewable energy plants (six of them under development).59
The Poverty Reduction Strategy Paper of Honduras also calls for the integration of renewable energy technologies into rural electrifi cation programs. This objective, however, has not yet been implemented. As next described, practically all rural electrification activities continue to be grid extensions, and the few projects centered on renewable energy sources in
Development of Renewable Energy and Energy Effi ciency
Annex
9
Honduras have been the result of isolated efforts and disarticulated investments. In the absence of a clear and consistent policy in the fi eld, efforts have focused particularly on individual projects, without leveraging the potential benefi ts that this type of energy could bring in reducing emissions and supporting regional productive processes.
Current State and Potential for Renewable Resources in Honduras Hydro EnergyIn Honduras, the potential of electricity generation based on hydro energy is substantial. At present, 33 percent (502 MW) of the installed capacity of the national interconnected system is hydro plants.
As shown in Table A9.1, there has been an intensive use of small- and medium-scale hydro energy, to the point that 14 of the 16 existing hydro plants are of a capacity between 0 MW and 30 MW. However, these plants represent only 24.3 percent of the total hydro capacity and just 8.3 percent of the total installed capacity in Honduras.
ENEE’s portfolio of hydroelectric projects that are expected to be constructed before 2011 is listed in Table A9.2.60 As shown, there are 11 small hydro projects in the range 1 to 10 MW, adding 53.4 MW and representing 24.4 percent
59 GEF, Project Appraisal Document, p. 20.
60 The information presented in Table A9.2 differs from the information reported in Table A3.9, in particular in the date of entry of the plants. The source is ENEE, but the tables are drawn from different documents (Table A3.9 is drawn from the Generation Expansion Plan, while Table A9.2 is drawn from the short-term marginal cost document for 2007). However, of concern are the signifi cant differences reported in terms of the date of entry into operation of several projects.
5176-ANNEX9.pdf 165 5/19/10 1:13 PM
HONDURAS: POWER SECTOR ISSUES AND OPTIONS
166
of the total hydro capacity to be added in the next four years.
Moreover, 15 of the 16 projects to be added in the next fi ve years are of less than 50 MW installed capacity, which means that developers are taking advantage of the tax breaks that have been provided to these kinds of projects. Specifically, private producers in charge of adding capacity in response to power and energy-bidding processes are taking advantage of fi scal incentives, tax exemptions, and the recognition of 10 percent of the short-term marginal cost per kWh as a premium for projects below 50 MW currently in place.
It was not possible to find information about existent microhydro power (MHP) stations in the sphere of isolated rural areas. However, efforts to implement this kind of renewable energy technology project were identified. In particular, the World Bank is currently leading a project with cofi nancing from the European Union, an International Development Association (IDA) credit, and a Global Environment Facility (GEF) grant, to build up to eight MHPs of capacity between 59 and 100 kW in different areas of Honduras. The first two pilots are estimated to cost approximately US$500,000 each:
Table A9.1 Distribution of Hydropower Plants by Size
Name of Hydro Plant Capacity (MW) Percent
El Cajon 300 59.7%
Rio Lindo 80 15.9%
Nacaome 30 6.0%
Canaveral 28.5 5.7%
El Nispero 22.5 4.5%
Cuyamapa 12.2 2.4%
La Esperanza II 11.5 2.3%
Rio Blanco 5 1.0%
Babilonia 4 0.8%
Cececapa I 2.9 0.6%
Coyolar 1.6 0.3%
La Esperanza I 1.2 0.2%
Santa Maria del Real 1.2 0.2%
Hydro Yojoa 0.6 0.1%
Zacapa 0.5 0.1%
La Nieve 0.5 0.1%
Total Hydro 502.2 100.0%
Total (Hydro+Biom+Ther) 1538.6 32.6%
Hydro per Power Range MW % Cumulative % No. of Plants
0–1 1.6 0.3% 0.3% 3
1–10 15.9 3.2% 3.5% 6
10–30 104.7 20.8% 24.3% 5
30–80 80 15.9% 40.3% 1
> 80 300 59.7% 100.0% 1
502.2 100.0% 16
Source: Authors’ calculation, 2007.
5176-ANNEX9.pdf 166 5/19/10 1:13 PM
167
Development of Renewable Energy and Energy Effi ciency
a. 55 kW La Atravesada in Mancomunidad Chortí, covering three unelectrified communities at 11 km from the nearest grid-tapping point, benefi ting 580 people in 94 households, 4 schools, 5 churches, 5 retail stores, plus other productive uses.
b. 80 kW Las Champas in Departamento Colon, also covering three communities at 40 km from the national grid, benefi ting 166 residential, 27 commercial and industrial, and 10 public centers.
The specific characteristics of MHP are high initial investment, minimum operation and maintenance costs, stand-alone energy supply (do not require mineral or fossil fuels), and a useful life above 25 years. Still, the challenge is twofold: (1) identifying suitable productive applications that, along with the domestic lighting load, could economically justify investment in the MHP over individual solar home systems (SHSs) (often the least-cost solution if the only electrical load is lighting for
households); and (2) organizing community-based operation and maintenance of the plant.
Some of the communities in Honduras possess hydro resources, mainly run-of-river, which could be exploited for electricity generation through MHPs, with systems of 10 to 200 kW capacity. Since no additional information was available, it can be inferred that no conversion technologies have been developed operating with very low falls and high fl ows of water, such as the submergible Michell-Banki turbines, which combine an adequate conversion technology, the supply of natural resources, and the location of human settlements on the banks of large volume waterways.
Solar EnergyThe potential for the use of photovoltaic (PV) capacity in Honduras is large and is a practical solution for servicing energy-isolated rural communities. The majority of dispersed households need electricity only for lighting,
Table A9.2 Hydro Projects to Be Constructed
Name of Project Capacity MW Expected Date of Operation
Cuyamel 7.8 Jan. 2007
Cuyamel I (La Ceiba) 2.2 Jan. 2007
La Gloria 5.8 Jan. 2007
Coronado 6.0 Jun. 2007
Cortecito 3.2 Jun. 2007
San Carlos 2.3 Sep. 2007
El Cisne 0.7 Dec. 2007
Pajuiles 1.1 Dec. 2007
Texiguat 3.4 Feb. 2008
San Juan 6.1 Mar. 2008
La Boquita 0.2 Oct. 2008
Suyapa 8.5 Dec. 2008
Mezapa 7.0 Feb. 2009
Jilamito 12.0 Jul. 2009
Cangrejal 40.2 Jan. 2010
Patuca 3 100.0 Jan. 2011
Total 206.5
Source: ENEE, 2007.
5176-ANNEX9.pdf 167 5/19/10 1:13 PM
HONDURAS: POWER SECTOR ISSUES AND OPTIONS
168
to replace traditional lighting sources (such as kerosene lamps that provide inferior illumination) and batteries (used mainly for radio). Individual SHSs ranging from 36 to 75 peak watts can provide power for electric lamps at much lower cost than typical grid-extension projects.
In total, it is estimated that there are about 5,000 systems installed in the country.61 If it is assumed that the average size of the installed equipment is between 30 Wp and 50 Wp, then the total capacity would be of approximately 15 to 25 kW of power.
The potential rural market for PV systems in Honduras includes households, commercial users (retail stores, rural restaurants, microenterprises, and so forth), and institutional users (schools, clinics, community centers) in dispersed off-grid areas. Households could be served mainly with 36 W to 50 W solar home systems that provide power for three to four low-wattage lights four to fi ve hours nightly, and for operating a radio or small black-and-white TV. Commercial and institutional users often require systems with capacity of 100 W or more. These applications, while larger individually, are clearly a smaller total market for PV than households.
The combination of high unit prices, absence of fi nancing assistance, and lack of government support has hampered the growth of a wider market for PV in Honduras. In the medium to long term, there are signifi cant opportunities for cost reduction through increase in sales volumes and establishment of commercial links with lower-cost suppliers in the region and elsewhere (for example, China). In the short term, however, assistance to the industry is needed to establish a rural sales and service network, and to stimulate consumer demand by reducing unit prices.
Wind EnergyKinetic energy contained in air currents (wind energy) is currently used in power generation and water pumping. In view of the wide-ranging unevenness of the Honduran landscape, the potential for this resource varies considerably. Currently, a 60 MW wind project has been
included in the Generation Expansion Plan. The project will be located in Cerro de Hula and it is expected to begin operation in 2009.
In addition, the World Bank will fi nance a project with at least one stand-alone wind-power system or a wind diesel/hybrid installation of about 100 kW, to determine its feasibility in remote areas with good wind regimes. A key requirement for the site of the demonstration would be the potential to use much of the scarce power for a productive application that benefi ts the community as a whole.
Biomass Energy Biomass energy can be used through various types of technologies, depending on the amount and type of biomass available. In Honduras its true potential is being exploited, in particular by the sugarcane industry.
As shown in Table A9.3, there are currently nine different biomass projects in operation, adding to a total of 81.75 MW of installed capacity. These projects are expected to generate 156.4 GWh during 2007, which corresponds to 2.3 percent of the total expected demand of energy in Honduras for this year (6,672.2 GWh).
Several of these projects operate in heating and cogeneration systems with sugarcane bagasse: AYSA (8 MW), property of Ingenio Azucarero Yojoa; La Grecia (16MW); and Compañía Azucarera Hondureña (25.75 MW); among others.
Prefeasibility studies are also being performed on the use of sugarcane for producing biofuels for electric energy generation. Electric energy can be generated from the use of the ethanol obtained from the distillation of juices produced from sugarcane grown in the area of the project. The benefi ts of this type of project include the following:
• Frees the use of fossil fuels that are used in electric power generation in isolated areas
• Facilitates extending coverage of the energy service to the communities in the vicinity of the project, having steady and reliable energy available
• Contributes to limiting the accumulation of carbon dioxide (CO2) in the atmosphere, by 61 GEF, Project Appraisal Document, p. 38.
5176-ANNEX9.pdf 168 5/19/10 1:13 PM
169
Development of Renewable Energy and Energy Effi ciency
substituting fossil fuels and planting crops that turn into CO2 dumps, reducing global warming
• Creates sources of employment in line with the agricultural profi le of rural communities
• Reduces migration to other cities in search of better prospects
• Creates microenterprises relating to the resources that the community exploits in an artisan manner for subsistence
Geothermal EnergyGeothermal energy can be used directly at the industrial level in heating, food processing, wool washing and drying, fermentation, paper production, sulfuric acid production, cement manufacturing, and so forth.
There are three different geothermal projects in Honduras, totaling 85.5 MW of installed capacity (Table A9.4). The largest of them is
called Platanares, located in the Department of Copan, and is expected to begin operations in 2011 with an installed capacity of 40.5 MW and generating 354.8 GWh per year.
Renewable Energy: SummaryAlthough fiscal incentives are successful in promoting hydro resources, as will be mentioned later, they have created a bias toward this type of development and against other renewable options, such as the use of photovoltaic, wind, and geothermal systems.
The implementation of hydroelectric projects seems to be the most economical option, although it is not always applicable to off-grid contexts. Furthermore, as shown by recent experience in Honduras, hydro projects raise a different set of concerns in the fi nancial and environmental fi eld from which other renewable energy projects—for example, photovoltaic projects—are free.
Table A9.3 Existing Biomass Projects
Name of Project Capacity MW Expected Energy (GWh) in 2007
Aysa 8.0 1.3
Aguan 0.5 4.4
Lean 0.5 4.4
La Grecia 16.0 29.4
Tres Valles 12.0 10.7
Inversiones Hondureñas 4.0 7.2
Compañía Azucarera Hondureña 25.8 66.9
Eecopalsa 1.0 3.4
Chumbagua 14.0 28.6
Total 81.8 156.3
Source: ENEE, Marginal Cost short-term, 2007.
Table A9.4 Existing Geothermal Projects
Name of Project DepartamentInstalled Capacity
MWAnnual Energy
Generation GWh Cost US$MM
Platanares Copan 40.50 354.80 —
Geothermal Pavana Choluteca 10.00 52.60 20.00
Geothermal Azacualpa Santa Barbara 35.00 183.96 70.00
Total 85.50 591.36 90.00
Source: ENEE, Marginal Cost short-term, 2007 and SERNA.
5176-ANNEX9.pdf 169 5/19/10 1:13 PM
HONDURAS: POWER SECTOR ISSUES AND OPTIONS
170
In addition to generation using hydro resources, the potential for developing renewable energy in Honduras has yet to be explored in depth. Renewable energy (RE) development is still in the early stages, and the information about resource assessment seems to be fragmentary and incomplete. Hence, it is necessary to quantify, using maps, the potential of renewable energy resources—different from hydro—that exist in the country.
At present, as illustrated by Table A9.5, 50 percent of total primary energy in Honduras is produced from renewable energy sources (hydro, geothermal, biomass, wind, solar, and waste fuels), very similar to other countries in the region. Nevertheless, considering that 37 percent of energy in 2006 was generated from hydro sources, only a small percentage was generated from alternative (nonconventional) renewable sources.
Institutional and Financial Challenges of Renewable EnergyHonduras lacks an adequate institutional framework for managing and implementing off-grid rural electrification programs with renewable energy. Currently, the sector has a weak governmental structure with delays in the implementation of fl exible environmental
standards and mixed-up roles in policymaking, regulation, control, and free-competition advocacy across the various agencies. The discussion taking place nowadays around a draft Renewable Energy Bill opens a window of opportunity to adjust the institutional framework by addressing the institutional and fi nancial challenges that must be amended if renewable energy in grid and off-grid areas is to be fostered. These challenges will be commented on briefl y in this section.
Evaluation of the Renewable Energy Bill Comments on the bill currently being considered in the Congress fall into seven categories:
1. Intent of the Law: Setting goals and policy incentives
2. Among on-grid RE, the draft law favors large hydro
3. The need to separate renewable grid and off-grid projects
4. The need for secondary legislation and regulation for off-grid RE generation
5. Specifying the role of the state and of other relevant actors
6. Strengthening the institutional framework 7. Fiscal implications
The Intent of the Law: Setting Goals and Policy Incentives
In Honduras, there is prior experience with political decisions regarding how resources are to be managed and assigned to increase generation installed capacity. Recently, with the establishment of the Social Fund for Electricity Development (Fondo Social de Desarrollo Eléctrico, FOSODE) and the crafting of the National Social Electifi cation Plan (Plan Nacional de Electrifi cación Social, PLANES), a similar initiative has been undertaken, but for managing electrifi cation resources. However, at present there is no regulatory framework to articulate both objectives with the use of renewable resources. The existing law does not fulfi ll that goal.
In the draft bill, policy incentives have been proposed but without clarity regarding what is
Table A9.5 Share of Renewable Energy in Primary Energy Supply Mix in Central America
Country
Renewable Energy as a % of Total Primary
Energy Produced
Costa Rica 42.4%
El Salvador 5.4%
Guatemala 57.3%
Honduras 50. 5%
Nicaragua 56.5%
Panama 28.7%
Source: Agencia Internacional de Energía, Renewables in Global Energy Supply: An IEA Fact Sheet, November 2002, www.iea.org.
5176-ANNEX9.pdf 170 5/19/10 1:13 PM
171
Development of Renewable Energy and Energy Effi ciency
to be achieved. If the objective is to transform the current energy consumption matrix of Honduras, highly dependent on fuel imports, into one characterized by the use of renewable sources, then targets should be set. The bill now before Congress is a fi rst step in this direction, but it is not enough. It is inspired more by the high price of energy purchased by ENEE (due to the rise in international oil prices) than by a legislative willingness to promote the use of generation using alternative and renewable sources.62
Among On-grid RE, the Draft Law Favors Large Hydro
In its draft version, the bill proposes tax incentives for projects that increase generation capacity with renewable sources—mainly hydro projects—but lacks any guidelines based on targets. Moreover, it should be noted that the tax incentives mentioned in Section 2 of the draft bill create a strong bias toward hydro projects and against other types of renewable energy, such as wind, solar, or geothermal.
Currently, the development of large hydro projects is not hampered by the lack of economic incentives but by institutional and environmental barriers. Although the tax exemption is the same for all kinds of REs, the bias is due to the fact that hydro projects—particularly the big ones—are usually more cost-competitive than other renewable energy options. Therefore, increasing exemptions for renewable energy projects other than hydro projects is not enough—the criteria for selecting a certain type of renewable energy instead of another should be defi ned.
The Need to Separate Renewable Grid and Off-grid Projects
In spite of the above considerations, Congress could take advantage of the discussion of the draft bill to send a signal regarding the institutional framework for the operation of both types of projects: (1) renewable energy projects with the potential for connecting to the national grid, and (2) off-grid renewable
energy-generation projects. The draft bill is biased toward hydro projects to be added to the interconnected system, but does not mention any incentives and policies for the use of renewable energy in off-grid rural projects.
In many cases, generation with off-grid renewable energy sources becomes the best partner in terms of electrification costs and technology, particularly in rural areas with a large number of inhabitants, which are the target of electricity access programs. For that reason, it is indispensable to include in the bill a separate section containing the principles, which, according to the Congress, could guide RE off-grid projects. Only the principles needed to make the law suffi ciently fl exible should be included. Subsequent regulations could provide more details and defi ne technology selection criteria. Examples to be considered include the following:
• Prioritizing certain clean technologies (small-scale generation projects with renewable energy versus diesel systems)
• Criteria for selecting network extension projects versus stand-alone systems
The Need for Secondary Legislation and Regulation for Off-grid RE Generation
Due to the technical characteristics of the different generation and service provision schemes and the different forms of ownership that exist for providing the service in off-grid areas, the regulatory frameworks and business models are completely different from those used in interconnected areas.
In the current wording of the bill, the incentives and mechanisms that are set forth would be applicable only to projects with renewable energy generation in interconnected areas, but not to off-grid projects.63 Regulations for grid connection and off-grid projects are totally different, have different applications, and
62 This can be corroborated by reading the motives that inspired the law, outlined at the beginning of the draft bill.
63 A clear example of this is paragraph “g” of Section 2 of the draft bill. It mentions a standard contract that ENEE, together with CNE, should design for the supply of capacity, energy, and ancillary services for each renewable resource type (hydro, wind, geothermal, biomass, and so forth). Said contract clearly is not applicable to an off-grid project.
5176-ANNEX9.pdf 171 5/19/10 1:13 PM
HONDURAS: POWER SECTOR ISSUES AND OPTIONS
172
entail different policy measures. Hence, the bill should set forth the criteria of how secondary legislation (executive decrees or other) should treat them separately.
Existing regulations for the interconnected system are very meticulous and have high technical standards; therefore, they are not apt for the alternative and renewable technologies and business models needed to serve off-grid areas. Inconsistent application of the existing regulation will harm the reputation of ENEE or the regulator (CNE). In addition, the regulatory system is also hurt if its formal requirements are clearly inapplicable and lead to permanent unilateral amendments in the absence of predictable and credible rules.
Although the regulatory issue is not addressed in depth in the draft bill, its importance cannot be overestimated. On the contrary, the lack of a proper regulatory framework for implementing off-grid generation with renewable energy is one of the reasons that explain the lack of these kinds of investments in rural areas. The absence of a proper regulatory framework may leave operators interested in serving off-grid areas legally unprotected, thus hindering the deployment of necessary investments.
Specifying the Role of the State and Other Relevant Actors
In another fi eld, the current draft bill contemplates the active involvement of the government, granting a leading role to ENEE.
Specifi cally, the draft bill is a clear invitation to strengthen, through offi cial measures, the role of ENEE in the sector as promoter and purchaser of last resort of the capacity and energy produced by independent providers. In turn, the draft bill also reinforces ENEE’s role as producer by transferring generation assets controlled by the Ministry of Natural Resources and Environment (Secretaria de Recursos Naturales y Ambiente, SERNA), and by increasing its investment budget to develop its own projects.64
For that reason, it is necessary to specify in detail and in a more extensive manner the role
that the legislative branch expects from players other than energy-generating companies. For instance, the following should be defi ned:
• The role to be played by current operators and suppliers, both formal and informal, in the provision of service to underprivileged unserved areas, and their responsibility in the process of strengthening the capacity of existing service providers.
• Mechanisms and instruments encouraging the participation of cooperatives, nongovernmental organizations (NGOs), International Financial Institutions, and local communities in generation and electrifi cation projects.
Strengthening the Institutional Framework
Finally, the draft bill fails to articulate any proposal to correct existing institutional weaknesses in the formulation and implementation of programs with renewable energy. Three main issues are worthy of mention:
1. There is no clarity about the role of SERNA and ENEE, and it is unclear who does what.
2. It is surprising that the bill does not contemplate the role that FOSODE can have in the promotion of generation projects with renewable energy in rural areas.
3. There is no mention of the role that municipalities and decentralized institutions play in the design, selection, and fi nancing of renewable energy projects.
Fiscal Implications
Another comment concerns the possible fi scal implications of the price premium in case the base price plus premium should exceed the generation component in ENEE’s tariffs. ENEE is, in fact, wary about these implications, which would make it undesirable for ENEE to contract new capacity with RE sources. Given that the new RE bill includes all types of RE sources, new RE-based generation is expected to become larger in size, with possible serious fi scal implications as to where the funding of the incentives would come from, who will bear the costs, and who will benefi t.64 See article 2 and articles 7 to 11 of the draft bill.
5176-ANNEX9.pdf 172 5/19/10 1:13 PM
173
Development of Renewable Energy and Energy Effi ciency
Barriers to the Development of Small On-grid RenewablesThough there are efforts to carry out institutional changes in order to stimulate the development of hydro projects, still several barriers must be overcome if other kinds of on-grid RE projects are to be implemented. These can be divided into three categories:
1. Economic barriers: These are high capital costs, which means higher fi nancing requirements per kW installed; subsidies for conventional forms of energy, and lack of fuel-price risk assessment in expansion plans; and the failure to internalize all costs and benefi ts of energy production and use (environmental, security, and diversifi cation benefi ts).
2. Regulatory barriers: These are the lack of a legal framework for independent power producers, making it difficult for small renewable power developers to plan and fi nance projects on the basis of known and consistent rules; the difficulties of small projects to access energy markets based on complex rules and with high standards and costs of connection to and use of the transmission grid.
3. Other barriers: These are high transaction costs on a per kW basis due to its small size and lack of information or familiarity with the new technologies, the impact of intermittent sources of energy in power system operation and reserves, the lack of adequate financial instruments, and the lack of technical or commercial skills and information on the new technologies.
Partnerships to Overcome Financing ConstraintsPublic/private partnerships are a useful mechanism to overcome many of the risks and fi nancing constraints that the development of large hydro projects entails. Usually, a public/private partnership approach must be used for the development of medium and large hydroelectric projects, in which the private
partner brings the best management practice and technical expertise and secures funding, and the public partner secures timely granting of licenses and permits, facilitates implementation of the environmental mitigation plan, provides payment guarantees, and facilitates other fi nancial support mechanisms that reduce the fi nancial costs.
A likely scenario of high oil prices, vulnerability to external shocks, and climate change concerns have renewed the interest of all countries in the region in developing a large and untapped potential of small renewable energy—mainly wind and biomass power, small hydro, and biofuels. Many countries in the region have established special incentives, programs, and targets for the development of RE by the private sector (e.g., Brazil, Costa Rica). Honduras has not been an exception; tax incentives have been granted to promote different small RE options.
However, the kind of public/private partnerships to develop medium and large hydroelectric projects is substantially different from the kind of partnerships required to carry out off-grid electrification approaches with renewable generation sources.
When confronted with the challenge of electrifi cation with renewable sources in rural areas, in many cases service providers (utilities, NGOs, microfi nance institutions, and so forth) and governments have found that partnering with the community contributes to building understanding and trust with customers. Hence, multisector partnerships in this fi eld are made up of three kinds of stakeholders: the formal service provider, the community—understood as the customers or organizations that represent them—and the local or national government.
Experience highlights that these partnerships are more critical in the initial pilot phase of a renewable energy project, when the service provider is unfamiliar with the rural area and needs the assistance of an NGO or community-based organization (CBO) to better understand the technical, fi nancial, and social conditions of the context where they will operate.
There are two main contractual forms between governments and service providers (which can
5176-ANNEX9.pdf 173 5/19/10 1:13 PM
HONDURAS: POWER SECTOR ISSUES AND OPTIONS
174
be a utility but not always): (1) concessions, in which operation and maintenance, capital investments, and commercial risks are borne by the service providers; and (2) management contracts, in which capital investments are usually fi nanced by the State, but implemented by the operator, operation and maintenance activities are carried out by the contractor, and the commercial risk is borne by the contractor.
However, contractual agreements can also take place between service providers and the community. In some cases, they involve formal agreements, while in others they only require an informal commitment developed on mutual trust.
International experience shows that the participation and involvement of the local and national government in the partnership is crucial if positive results are to be achieved from a small RE project. For companies and the community, the government’s intervention and its participation in such partnerships is indispensable, at least in four different ways:
1. Service providers and the community request a coherent legal framework from government for “legitimizing” customers and connections, and for solving landownership problems.
2. Given their limited power to combat fraud and pilferage, utilities also request the support of law enforcement institutions to implement reward-and-punishment systems, increasing compliance with their electrifi cation programs.
3. Investments by the service provider have to be matched by other public investments in other types of social infrastructure.
4. Operators must know both tariff and subsidy levels before they can make investment decisions.
The opportunities for designing small renewable energy programs for off-grid areas of Honduras that involve these kinds of multisectoral partnerships are plenty. However, appropriate program design requires support
from multilateral and development agencies, at least in the following areas:
• Long-term credits at preferential rates• Technical assistance to revise legal and
regulatory frameworks and reduce barriers to the development of RE
• Step-up carbon fi nance for RE projects
Relevant International Experience in Renewable EnergyRenewable energy has been extensively studied and applied in other countries where similar problems have appeared. Some of these are examined in the following.
IntroductionA balanced interaction between urban and rural sectors should be considered a basic condition in the development process of a country. The challenge of achieving complete and egalitarian development requires the incorporation of rural areas in the process of improving the socioeconomic condition of the society. However, the need to reach isolated and dispersed communities, usually very poor, must be balanced with the goals of sustainability, subsidy minimization, and the need to demonstrate viable solutions and to build local capacities to manage, operate, and maintain the off-grid systems providing market development services. This is often a long and costly process, but without it, the systems are bound to fail.
In rural areas with dispersed population or a complicated geography, there are usually technical and/or economic conditions that obstruct the extension of electricity grids because of the low effi ciency of power line extensions and high maintenance costs. In these areas and in most cases, the use of renewable energy sources such as SHS, microhydro facilities, and wind power stations are a feasible solution for improving the living conditions of the rural population and helping the development of some small-scale economic activities.
5176-ANNEX9.pdf 174 5/19/10 1:13 PM
175
Development of Renewable Energy and Energy Effi ciency
The objective of this section is to highlight the main issues from off-grid renewable energy projects carried out in other countries that are germane to the Honduran context. Lessons from international experience will be considered under four different areas: (1) main problems that may arise during program implementation and related to project design defi ciencies; (2) defi ning the kind of business model to be implemented; (3) regulation, control, and monitoring of programs; and (4) issues to be considered when comparing the different renewable energy business models that can be applied in Honduras.
Although different renewable energy programs have been revised, the lessons are drawn mainly from the following:
• The Argentine Renewable Energy for Rural Market project is aimed at providing electricity for lighting and social communication (radio and TV) to about 70,000 rural households and 1,100 schools through private concessionaires using mainly renewable energy systems.
• The Sri Lanka Energy Services Delivery (ESD) project works via commercial PV distributors for isolated households, and is aimed at the installation of 15,000 PV systems.
• The IDTR program in Bolivia includes medium-term service contracts to install and provide renewable energy services to 15,000 benefi ciaries during its fi rst phase. Service providers are paid different kinds of output-based subsidies against different market development activities and installations.
• The Chilean Rural Electrifi cation Program established goals at both the regional and national level with respect to electrifi cation coverage, and concurrently attempted to rationalize the use of government subsidies through competition at as many levels and stages as possible: among projects proposed by different rural communities, among distribution companies interested in supplying these communities, and among regions requesting funds from the Central Government.
• The company Enersol model developed both leasing and ESCO operations in the Dominican Republic and Honduras, whose principle of operation is the provision of PV systems via long-term lease contracts.
• The Indonesia Solar Home Systems Project provides PV systems in rural areas through a commercial (vendors) approach.
• The South African off-grid solar electrifi cation program works via concession approach.
• The SDDX Project in seven western provinces of China includes 721 PV and PV hybrid stations that have been installed benefi ting 300,000 households and 1.3 million people.
• The Consolidated License for Rural Electrifi cation Enterprises is in Cambodia.
Program Design Defi cienciesMajor problems—that usually stem from program design defi ciencies—could arise in projects with renewable energy stand-alone systems, most of which are related to the lack of sustainability of electrifi cation programs. Experiences in different contexts have shown that the main causes for these problems are that implementation schemes did not take into account one of the following factors: long- and medium-term maintenance actions, energy needs of the users, lack of local capacity to operate and manage facilities, an adequate regulatory framework, and/or economic sustainability related to tariffs and subsidies.
For example, the most common problem that emerges when implementing PV facilities in remote areas is that equipment is left under the responsibility of users for operation and maintenance, when users have no skills to maintain the systems or have no easy access to spare replacement parts, because of the lack of suppliers in the area, or the lack of economic resources to purchase them. This approach, in many cases, has had a negative impact, limiting the acceptance of these kinds of technological solutions or even making people think that the PV systems were not reliable.
Different kinds of experiences have revealed a number of constraints that hinder the long-term sustainability of renewable energy:
5176-ANNEX9.pdf 175 5/19/10 1:13 PM
HONDURAS: POWER SECTOR ISSUES AND OPTIONS
176
• Legal ownership of the assets: Ownership of RE assets and of their different components must be clarified from the outset of the project.
• Responsibility for management and operations: Who assumes a broad management responsibility and who is in charge of the day-to-day operation of the system must be clarifi ed from the outset of the project. Usually a local person, a member from the community, is assigned some of the day-to-day operational responsibility, given that they are in permanent contact with their community and easy to access on behalf of users.
• Responsibility for major replacements and repairs: This is an increasingly critical issue in the case of PVs, particularly related to battery replacements, which will be necessary, usually after the third year of the program.
• Types and levels of continuing support and regulation: Monitoring, supervision, and training, possibly from provincial and state government or other agencies, should be defined. In particular, if the regulatory responsibility is to be delegated, there is a need to defi ne precisely what supervision tasks are handed over and who keeps the sanctioning capacity. As mentioned earlier in this chapter, it is necessary to adapt regulatory frameworks to the various business models used to electrify distant isolated rural communities. These are no minor fi ndings given that, while they state that it is necessary for regulatory frameworks to match the various business models used to electrify rural areas, they also refl ect the risks of higher transaction costs by making regulation more “particular.”
• Tariffs: Defi ning the procedure for setting tariffs is crucial for diminishing the risks that potential bidders usually perceive in these kinds of processes. Service providers tend to view barriers or disincentives in terms of their effect on investment costs, O&M costs, or potential revenues derived from tariffs. These elements determine the operator’s return on investment.
In view of these mentioned problems, business models oriented to decentralized rural electrification should involve different approaches, all of which should adopt the concept of service. This entails focusing on the “service provider” and not the equipment supplier. Moreover, by focusing on service, attention can be directed to delivered outputs rather than to the specifi c characteristics of the operator (public, private, NGO, microfi nance organization, CBO, and so forth), allowing service providers greater freedom to meet customer demands through innovative business models.
However, the most positive experiences show that investments in electrifi cation have to be matched by public investments in other types of social infrastructure. Thus, it is necessary to evaluate, among other things, the fi nal size of the institutional and productive uses market in the different selected sites for carrying out pilot projects. There is evidence that development impact rises signifi cantly when electrifi cation business models are complemented with other infrastructure services and social investments.
Defi ning the Kind of Business Model to Be Implemented Different kinds of business models have been used worldwide to implement RE programs in isolated rural areas. Some examples are the following:• Competition for the market: Qualifi ed providers
bid for predefi ned areas against minimum subsidy or tariff/cost, designed as exclusive long-term concessions (for example, Argentina, Cape Verde, South Africa, Morocco). In this case, service delivery can take several forms, since the concessionaire is free to select the most suitable technology for electrifi cation. The preliminary condition for this kind of model is that government will provide subsidies. Funding support comprises two aspects: government will provide funding for all initial equipment investment, and then it might provide a subsidy for system O&M. Subsidy for O&M
5176-ANNEX9.pdf 176 5/19/10 1:13 PM
177
Development of Renewable Energy and Energy Effi ciency
can be paid based on outputs, depending on evaluation of the work done by the concessionaire.
• Competition by projects that are presented by qualifi ed providers in regular tenders for minimum subsidy or tariff (Chile Model, and the United Nations Development Programme PV projects in Bolivia).
• Competition in the market: Competitive bids to serve are employed, and promises of service are enforced but the service may be defi ned fl exibly and the right to serve the market is not exclusive (Sri Lanka Model, Indonesia, and Nicaragua). It is basically for household systems. The government provides subsidy to the business that directly sells products to households based on an agreed installed capacity (kW), or provides a subsidy directly to fi nal users based on a certain percentage, so as to reduce the product retail price or the fi nancing burden of fi nal users. This option can be implemented through competitive bids in which promises of service are enforced but the service may be defi ned with fl exibility and the right to serve the market may not be exclusive. This model, with some small variations, has been recommended for Honduras under a recent Global Environment Facility (GEF) project.
• Medium-term service contracts (MSC): This kind of business model is different from a traditional ESCO concession scheme since operators are not forced into a fee-for-service scheme—they also can sell cash or credit, whichever they (and their users) prefer, so that the user can own the system at the outset (e.g., the IDTR program in Bolivia). However, there is more attention to long-term service sustainability than in a pure dealer model, by paying output-based subsidies to the dealer for building a local service and users’ training network and establishing monitoring and evaluation systems. Users pay fully (and ad hoc) for replacements after the initial guarantee period, so they get used to preparing for payments they will face in the future. After about three to fi ve years, it is expected that
these local markets can “graduate” into free PV sales and commercial O&M. In other words, if one would aim at improving a pure dealer model (by adding mandatory O&M services of two to fi ve years and local market development to reduce information barriers), or if one would aim at improving an exclusive concession scheme (by limiting obligations to only two to fi ve years and opening it to a broader menu of ownership/payment options), the MSC model is where both would meet.
On the one hand, to bid areas for minimum subsidy and provide initial exclusivity for subsidy payments therein has the advantage that transaction costs can be kept controllable for all players, including the government and auditors. On the other hand, yardstick competition between the areas and opening the markets after the initial period of exclusive subsidy access can improve effi ciency.
Regulation, Control, and MonitoringEach form of off-grid electrifi cation entails a different form of controlling service and quality of the outputs delivered. Hence, defi ning the kind of institutional arrangement for supervising and monitoring the performance of the different business models is a crucial aspect to promote compliance with the electrifi cation program and to meet program targets.
When analyzing the regulatory and monitoring arrangements that have to be established to make each business model work, the following four principles should be considered:65
Principle 1: Adopt light-handed and simplifi ed regulation. For off-grid operators, one should be especially conscious of the costs of regulation, because most off-grid enterprises operate on the limits of commercial viability.
65 Reiche, Kilian, Bernard Tenenbaum, and Clemencia Torres. 2006. Promoting Electrifi cation: Regulatory Principles and a Model Law. Joint Publication of ESMAP and the Energy and Mining Sector Board. World Bank: Washington, D.C.
5176-ANNEX9.pdf 177 5/19/10 1:13 PM
HONDURAS: POWER SECTOR ISSUES AND OPTIONS
178
Unnecessary regulation can easily destroy the commercial viability of these enterprises. For example, while implementing a SHS program in Bolivia, the government made the mistake of imposing too-stringent legal structures for the entities in charge of day-to-day operations and too-strict reporting and technical requirements. The model turned out to be impractical and the program was adapted to become more fl exible in terms of both types of requirements. A showcase example of light-handed regulation is the case of Cambodia, where generic tariff tables were put in place so that no fi ling with the regulator was necessary and the adjustment was automatic without the burden of regulatory approval.
Principle 2: Allow (or require) the regulator to “contract out” or delegate, either temporarily or permanently, regulatory tasks to other government or nongovernment entities. In many countries, a rural electrifi cation agency or fund functions as a de facto regulator. Typically, the agency or fund imposes certain requirements in return for living grants or subsidized loans. For example, it may specify a maximum allowed tariff, a required technical quality for new installations, or technical and commercial quality for post-installation service. These are traditional regulatory functions—even if they are rarely described in that way. Given this reality, it makes sense for the regulator to delegate or “contract out” some traditional regulatory functions to the rural electrifi cation agency or fund, for example, to FOSODE in the case of Honduras. A good example would be the Rural Electrifi cation Board of Bangladesh, which is a semiautonomous agency within a ministry, taking up not only the roles of banker, technical advisor, procurement agent, construction agent, manager, supervisor, and trainer, but also the regulatory tasks related to setting maximum prices and minimum quality standards.
Principle 3: Allow the regulator to vary the nature of its regulation depending on the entity
that is being regulated. Provide the regulator with explicit legal authority to vary its methods depending on the type of entity being regulated. “Self-supply” offers the possibility of “self-regulation.” Such an approach has been adopted in Sri Lanka for off-grid village hydro systems that are owned and operated by community-based cooperatives. In this case cooperatives have no incentive to overcharge for the provision of electricity services.
Principle 4: Establish quality-of-service standards that are realistic, affordable, monitorable, and enforceable. A workable quality-of-service regulatory system should have the following characteristics: (a) the standards should be based on customer preferences and their willingness to pay for the costs of providing the specifi ed level of quality; (b) the standards need not be uniform across all customer categories or geographic areas; (c) offering a menu of service levels allows customer choice—but it can also increase transaction costs and decrease transparency if there are too many choices; (d) standards should be established for both technical and commercial dimensions of service; (e) required levels of service and associated penalties and rewards should be phased in over time and synchronized with changes in tariff levels; (f) where feasible and effi cient, penalties should be paid to individual consumers; (g) the regulatory entity should have the legal authority to delegate or contract out quality-of-service monitoring and the imposition of penalties to a third party subject to appropriate oversight.
Comparing Renewable Energy Business Models for the Off-grid Areas of HondurasEach business model should be compared in terms of how it performs in each of the following issues:
Financial issues:
• Who funds the initial investment and how is it fi nanced?
5176-ANNEX9.pdf 178 5/19/10 1:13 PM
179
Development of Renewable Energy and Energy Effi ciency
• How does the model contribute to improving the effi ciency of government investment?
• What kind of fi nancial burdens does the model add to customers?
• How does the model contribute to reducing system O&M costs?
• What kind of tariff structure does the model require?
• What kind of fl exibility in subsidy provision does the model allow (in cash, in-kind equipment, to the dealer or equipment retailer or users)?
• What is the most suitable subsidy mobilization scheme for the model? (Direct up-front customer subsidies on the initial investment cost, paid to the supplier on the basis of actual connections; service quality subsidies paid to supplier against installation and service performance targets; market development service subsidies, paid to the supplier against training of local technicians, yearly visits, users training, and so forth; and indirect market development subsidies related to overall promotion activities, support to the formulation of business development strategies, training, and technical assistance.)
• How fl exible is the model to the provision of fi nancing alternatives for customers and service providers?
• How flexible are the models to different payment options (for example, up-front cash, monthly payments, quarterly payments, and so forth).
Managerial and operational issues:
• What freedom does the model provide to the operator for defining the most suitable service delivery mechanism? (e.g., freedom to develop creative delivery models that allow for cost reduction and service improvements)
• How does the model contribute to the selection of the appropriate technology for electrifi cation?
• How does the model add to service sustainability, and what kind of services and market development activities are more appropriate for the model?
• How does the model promote the development of a replacement and spare parts market?
• What are the scalability and replication chances of the model?
• What kind of billing and collection does the model foster?
• What kind of managerial and operation entity does the model require?
• What kind of obligations and responsibilities in terms of O&M does the model impose on each party involved?
Legal, monitoring, and other relevant issues:
• What kind of flexibility does the model provide in terms of ownership of the assets?
• How are responsibilities and obligations of each party defi ned in the model?
• What kind of control and supervision is more suitable for the model in order to protect customers’ rights, and control that quality service standards are met and market development activities are carried out?
• How does the model contribute in the short, medium, and long term to the scale and rate of electrifi cation?
• How do they motivate community involvement and participation?
• How does the model match the promotion of productive and public uses?
Potential for Energy Effi ciency AlternativesAn alternative to installing additional production facilities consists of reducing demand through a better use of available resources. This can be accomplished by increasing effi ciency use of energy in different production processes.
IntroductionThe recent evolution of the electricity sector in Honduras, on the side of both demand and supply, raises the need to take immediate action in the area of energy effi ciency.
5176-ANNEX9.pdf 179 5/19/10 1:13 PM
HONDURAS: POWER SECTOR ISSUES AND OPTIONS
180
On the demand side, over the past two years, energy consumption in Honduras has grown by approximately 4.5 percent. Peak demand growth, however, has been much higher: more than 7 percent in 2003 and 2004, and 10 percent in 2005.66 Until July 2006, peak demand reached 1,065 MW, entailing a 5 percent increase, which is also higher than the growth experienced by consumption.
On the supply side, during the past six years, expansion of generation capacity has been limited mainly due to an unfavorable investment climate and the poor fi nancial performance of ENEE. Moreover, technical and commercial losses have increased substantially, reaching 30 percent in mid-2006. The dependence on small, low-capacity thermal plants tied to oil imports, with low capital costs and high variable costs, and the scarce investments in transmission and distribution, have cast doubt on the reliability of supply as of 2008.
Considering the rapid growth of consumption, and the limited capacity for new generation and network extension, there is an urgent need to address the implementation of measures in the area of demand management and the rational use of energy if unplanned blackouts are to be prevented. Therefore, the objective of this Annex is twofold.
First, it is intended to review the potential for deploying different short- and medium-term programs designed to drive energy effi ciency (EE) in Honduras, contributing to reducing consumption, thus reducing the need for increasing supply. Second, it aims to raise awareness of the need to take immediate action if costly blackouts are to be avoided in the short term. EE programs can help to reduce the need for the very expensive emergency supply that will have to be rented (arrendamiento) until 2013.
This section covers three topics. First, it provides an overview of the general characteristics of energy consumption in Honduras, according to the results of the Generación Autónoma y Uso Racional de la Energía Eléctrica (GAUREE) Project
in order to focus energy effi ciency programs on those sectors and electricity equipment that employ the greatest amount of energy. Then it briefly describes the programs that have already been promoted in Honduras in this fi eld and spells out the best practices with programs, germane to the Honduran context, that have been deployed internationally. Finally, it discusses the country’s existing potential to develop supply-side management programs (SSM) and demand-side management programs (DSM), with special emphasis on the residential and industrial sectors.
Overview of Energy Consumption in HondurasIn Honduras, 42.5 percent of energy consumption is attributed to the residential sector. The commercial, industrial (low voltage), industrial (high voltage), and government sectors represent 26.5 percent, 12.5 percent, 14.3 percent, and 3.6 percent, respectively. In the residential sector, 14.7 percent of energy consumption in the country corresponds to users in the 151 kWh to 300 kWh category, 8.7 percent to users in the 301 kWh to 500 kWh category, and 10.9 percent to users in the >501 kWh category.
It should be noted that, taking cities individually, the highest consumption of energy is also tied to the residential sector. According to demand categorization studies provided by the GAUREE 2 project in the cities of Tegucigalpa and La Ceiba, in the former, residential consumption represents 49.7 percent of total energy consumption, while in the latter, it represents 48.4 percent of total consumption.67 The commercial, industrial, and governmental sectors also refl ect consumption levels at a par with nationwide levels. In Tegucigalpa, they represent 30 percent (commercial), 10 percent (industrial), and 9 percent (governmental), while in La Ceiba, they represent 36 percent, 8 percent, and 7 percent, respectively.
66 ENEE, Gauree2 Project, “Generación Autónoma y Uso Racional de la Energía Eléctrica-Informe de Avance sobre una propuesta de para una campaña de promoción de lámparas fl uorescentes compactas (LFCs) en el sector residencial de Honduras – Modulo M4,” October 2006, p. 4.
67 GAUREE 2 Project, Soluciones Concretas, Generación Autónoma y Uso Racional de Energía Eléctrica, “Estudio de Caracterización de la Demanda en la Ciudad de la Ceiba – Lado Consumidores,” February 2006; and “Estudio de Caracterización de la Demanda de Tegucigalpa.”
5176-ANNEX9.pdf 180 5/19/10 1:13 PM
181
Development of Renewable Energy and Energy Effi ciency
Therefore, the residential category is the prevailing sector in terms of energy consumption, followed by the commercial sector. The low level of industrial consumption is remarkable, both nationwide and at the city level. Moreover, and given that access is expected to be increased to reach 80 percent of total population by 2015 (according to the government’s targets), the more than 400,000 estimated new connections will represent 10 percent of residential consumption and 7 percent of total consumption by 2015.
Nevertheless, an analysis of the average price of energy invoiced to the various types of consumers) shows that the incidence of the residential sector is very low, to a great extent due to the low price of energy and direct government subsidies. This distortion is due to a great extent to the tariff freeze and subsidy policy applied to the residential sector, in which even large consumers of this category are receiving subsidies. A better tariff structure can help to promote EE.
For example, there is a need to create a “pass-through” mechanism that ensures that the tariff revenues obtained by ENEE as the cost of supply match its energy purchase costs in the wholesale market. Currently, most electric energy is purchased from ENEE, which has PPAs defined under well-known conditions (particularly regarding prices and price adjustment mechanisms). The scheme that allows ENEE to pass through the purchase price of electricity to the tariff should refl ect operating restrictions and economic dispatch conditions. The expected result should be differentiated prices based on hour bands intended to promote the effi cient use of energy (for example, real-time pricing and time-of-the-day tariffs). Those mechanisms should be simple and transparent, and the implementation of bureaucratic procedures that hinder deployment should be avoided. Specifi cally, two key aspects are suggested for the defi nition of electricity energy purchase prices to be passed through to ENEE’s customers:
1. Defining at least two prices per unit of energy (US$/kWh), one for peak hours and another one for off-peak hours.
2. Defi ning charges per unit of power (which already exists) to reduce the uncertainty of generators in the market, securing a given revenue stream over time.
Characteristics of Load Curves per Category and Day
Based on the studies available from the GAUREE 2 Project about the characterization of demand for the cities of Tegucigalpa, San Pedro Sula, and La Ceiba, it may be concluded that the load curves have the following characteristics for weekdays, Saturdays, and Sundays:
• On workdays, two major peaks are observed (see Figure A9.1a for Tegucigalpa and Comayaguela and Figure A9.1b for La Ceiba). The highest load occurs between 7:00 p.m. and 8:00 p.m., and is produced by the contribution of all sectors, but mainly by the residential sector, followed by the commercial, industrial, and governmental sectors, in that order. The residential sector has an average share, for the three cities, of approximately 60 percent, followed by the commercial sector, with approximately 25 percent. The second peak in demand occurs between 11:00 a.m. and 12:00 a.m., with the residential sector also in the lead. The share of the residential sector averages 45 percent, followed by the commercial sector, with approximately 40 percent, the industrial sector, with 10 percent, the governmental sector with 6 percent, and the public lighting sector with almost zero (due to the time of day). A small demand peak can also be observed during the early morning, particularly at breakfast time, between 6:00 a.m. and 8:00 a.m.
• On Saturdays, as on workdays, there are two peaks: (1) the highest peak occurs at approximately 8:00 p.m. Here the residential sector has a 60 percent share, followed by the commercial sector with approximately 24 percent, the public lighting system with approximately 6 percent, and the industrial and governmental sectors with 5 percent each; (2) the midday peak occurs roughly between 11:00 a.m. and 1:00 p.m. and is slightly lower than on a workday.
5176-ANNEX9.pdf 181 5/19/10 1:13 PM
HONDURAS: POWER SECTOR ISSUES AND OPTIONS
182
Figure A9.1a Demand Curve in Tegucigalpa and Comayaguela for a Typical Workday
0
20,000
40,000
60,000
80,000
100,000
120,000
00:0
0
01:0
0
02:0
0
03:0
0
04:0
0
05:0
0
06:0
0
07:0
0
08:0
0
09:0
0
10:0
0
11:0
0
12:0
0
13:0
0
14:0
0
15:0
0
16:0
0
17:0
0
18:0
0
19:0
0
20:0
0
21:0
0
22:0
0
23:0
0
00:0
0
kW
G L O B A L A L U M B R A D O P U B L I C O G L O B A L C O M E R C I A L G L O B A L I N D U S T R I A L
G L O B A L G U B E R N A M E N T A L G L O B A L R E S I D E N C I A L
Source: GAUREE, Characterization Demand Study of Tegucigalpa.
Figure A9.1b Demand Curve in La Ceiba for a Typical Workday
0.0
5000.0
10000.0
15000.0
20000.0
25000.0
00:1
501
:0001
:4502
:3003
:1504
:0004
:4505
:3006
:1507
:0007
:4508
:3009
:1510
:0010
:4511
:3012
:1513
:0013
:4514
:3015
:1516
:0016
:4517
:3018
:1519
:0019
:4520
:3021
:1522
:0022
:4523
:30
Time, every 15 minutes
kW
Residential demand Commercial demandIndustrial demand Government demand
Demand for street lighting
Source: GAUREE 2 Project: Characterization Demand Study of Ceiba City: Consumer’s side, fi nal report, February 2006.
The share of the residential sector here is approximately 50 percent of the total, followed by the commercial sector with 37 percent, the industrial sector with 9 percent, and the governmental and public lighting sector with 5 and 0.3 percent, respectively.
• On Sundays, as on the rest of the days, there is a higher peak at night, and the residential
sector again has the highest share in system load.
Type of Consumption per Customer Category
According to different load curve studies, the main uses of energy match the consumption patterns reported by the surveys. In the residential consumption category, main uses
5176-ANNEX9.pdf 182 5/19/10 1:13 PM
183
Development of Renewable Energy and Energy Effi ciency
are for air conditioning, refrigeration, lighting with 60 W bulbs, electric stoves, and audiovisual equipment (mostly TV).
Based on the fi ndings of various studies regarding energy use, the following inferences can be drawn at the national level per customer category and the city level:
• According to the data gathered from studies of demand patterns carried out in the metropolitan areas of Tegucigalpa, San Pedro Sula, and La Ceiba, it can be concluded that lighting is one of the main uses of energy consumption in the residential sector. Average consumption for lighting purposes in the overall residential sector is 17 percent for Tegucigalpa, 16 percent for La Ceiba, and 10 percent for San Pedro Sula. Considering that in rural areas the impact of electric home appliances use is much lower than in urban areas, at the national level it is estimated that at least 17 percent of energy consumption is tied to lighting.
• In Tegucigalpa, the greatest impact on consumption is generated by the use of electric stoves for cooking, followed by refrigerators, lighting, and water heating.
• In San Pedro Sula, consumption is led by air conditioning, followed by refrigerators, electric stoves, and lighting.
• In La Ceiba, air conditioning and refrigerators account for 53 percent of residential consumption.
• In the commercial sector, the highest impact on consumption in kWh/year terms is that generated by the use of air conditioning (approximately 40 percent), followed by lighting (approximately 30 percent) and offi ce equipment applications (approximately 10 percent). The use of cooking stoves and refrigerators is concentrated on restaurants and hotels, while air-conditioning mostly involves split devices (condensed vapor). Only in large malls and hotels are there centralized air-conditioning systems.
• The main use of energy in the industrial sector is for air-conditioning (approximately 40
percent), engine and machinery applications (approximately 35 percent), and lighting (approximately 13 percent).
Consumer Load Curves and Energy Uses: A Summary Existing studies are clear that the residential sector has the largest share in consumption and is a key determinant of load curve peaks. Therefore, any energy effi ciency program to be designed and intended to lessen consumption peaks—to soften the curve of demand in peak times—should cover the residential sector and include policies designed to decrease, substitute, or optimize the use of some of the following equipment: air conditioners, refrigerators, lamps, and electric stoves.
The use of said equipment drives the peaks in consumption that determine demand curves: a slight peak during breakfast time, another major peak at noon, and the highest peak in the evening.
In addition, the use of air-conditioning has the highest impact across all categories—that is, its share is very high in energy consumption for the residential, commercial, and industrial segments. It is followed, in order of consumption, by lighting and refrigerators, though the latter is not as predominant in the industrial sector as equipment and machinery use.
Experiences with Energy Effi ciency Programs in HondurasThough the GAUREE Project has been in place for two years, in Honduras there are precedents of programs for the promotion of the rational use of energy. Two examples of programs that have permitted energy savings, though with variable results are cited here: (1) a successful program at the industrial level in the fi eld of co-generation, and (2) another program at the residential level involving a campaign to replace high-consumption incandescent lightbulbs with fl uorescent lamps.
5176-ANNEX9.pdf 183 5/19/10 1:13 PM
HONDURAS: POWER SECTOR ISSUES AND OPTIONS
184
Experiences in Energy Saving through Co-generationThe use of “waste heat” holds a major promise for energy savings in industrial environments, when manufacturing processes require, in addition to electricity, energy directly in the form of heat. Therefore, combined production of electricity and heat, known as co-generation, deserves special attention in any energy-effi ciency program targeted to the industrial sector.
Sugar mills in Honduras have been successful at using co-generation because the sugar-refi ning process requires steam. However, another example that is worth mentioning has to do with the conversion of processes in the textile industry to take advantage of the co-generation potential. One of these cases is ELCATEX, an industry based in Choloma, Cortés, whose experience is summarized in Box A9.1. As a
result of the industrial restructuring carried out, the production of electricity at ELCATEX today exceeds its needs, so the company is selling electricity to neighboring plants and to ENEE, as permitted by the legal framework of the Honduran electricity subsector. If such sale of electricity had not been legally permitted, it would have represented a barrier to effi ciency improvements.
Experiences of Campaigns to Replace Incandescent Bulbs with Compact Fluorescent Lamps (CFLs)The campaign was carried out between 2000 and 2003 and implemented by the company Uso Racional de Energía Eléctrica (UREE). The project was fostered by ENEE, SERNA, and Inpelca S.V. Philips, and had the support of the Dutch Agency for Cooperation by means of a US$1.2 million donation. A summary of this project is presented in Box A9.2.
The most interesting conclusions of this campaign have been as follows:
• Sales by installment in stores have diffi culties; direct sales through business representatives are more effective.
• Sales are conducted using several payment means, but the most widely used is payment by installment included in the monthly ENEE bill.
• The highest demand is for 15 W and 20 W bulbs and daylight tone.
• A factor that is distorting the market for CFLs has to do with the large number of noncertifi ed lamps existing in the Honduran marketplace; these are low-quality, low-price lamps. As a result, this type of lamp has lost credibility with part of the public.
Based largely on a successful CFL program carried out in Spain, the GAUREE 2 project has designed a marketing and sales pilot program to increase the use of energy-effi cient CFLs and therefore lower the consumption of energy by 50 million kWh per year. The plan of action includes giving away, in a three-phased operation, a free
Box A9.1 El CATEX Case Study
Process Transformation in the Textile Industry to Leverage Co-generation Potential
ELCATEX initially purchased electricity from ENEE for its own manufacturing needs, including air-conditioning. It also burned a heavy fuel, bunker C, to generate the necessary vapor in heaters for textile processing.
Today, ELCATEX uses bunkers to generate electricity in its own unit. With exhaust gases (taking advantage of waste heat), it produces vapor to meet the needs of its own industrial processes, and to generate, using a mechanical process, vacuum in a chiller, in which it produces iced water to be used as cooler for refrigeration purposes.
ELCATEX introduced these changes as a result of a proposal received from the SOLAR company, a subsidiary of Caterpillar. SOLAR is an energy service company whose business is to inform customers of energy-saving opportunities and selling solutions, which are usually paid for with the reduction in the energy bill.
Source: “Incorporación del Tema de la Efi ciencia Energética dentro de la Política Energética General,” p. 7.
5176-ANNEX9.pdf 184 5/19/10 1:13 PM
185
Development of Renewable Energy and Energy Effi ciency
20 W CFL bulb to 800,000 households (where the majority of Honduran households still use ineffi cient 60 W, 75 W, and 100 W bulbs).
The pilot will focus on distributing CFLs in Tegucigalpa, San Pedro Sula, and some rural areas. The fi rst step is to identify residential communities based around particular electricity grids. Once the first installment of CFLs—50,000—has been distributed and control groups have been chosen, residential customers and the control group will take part in a survey about the CFLs and comparisons will be made in terms of energy use. Based on these fi ndings, the project will enter the second and third phase, giving away 250,000 and 500,000 CFLs, respectively. The distribution of CFLs will include pamphlets to disseminate information on energy effi ciency and forms to collect data on customers.
GIUREAt present, with the purpose of facing the critical situation of supply to meet demand in the short term (2007 to 2008), the Inter-Institutional Group for the Efficient Use of
Energy (Grupo Interinstitucional de Uso Efi ciente de la Energía, GIURE) has been established. The group members are SERNA, the Consejo Hondureño de la Empresa Privada (COHEP), the Ministry of Education, ENEE, the Universidad Nacional Autónoma de Honduras (UNAH), the Consejo Empresarial Hondureño para el Desarrollo Sostenible/Proyecto de Eficiencia Energética en los Sectores Industrial y Comercial de Honduras (CEHDES/PESIC), CNE, and the Colegio de Ingenieros Mecánicos, Electricistas y Químicos (CIMEQH). GIURE is leading a nationwide initiative including different actions, to be implemented in the very short term, to promote energy effi ciency aimed at reducing costs and ensuring consistent supply.
On the demand side, GIURE is studying different international experiences with aggressive campaigns for energy savings in times of crisis. Particular emphasis has been placed on the lessons learned from campaigns deployed in Brazil, which achieved a 20 percent reduction in demand at the start of the decade, and in Peru, in the mid-1990s, which restrained demand growth for two years.
Box A9.2 Sale of Compact Fluorescent Lamps Case Study
Joint Project by UREE and the Dutch Agency for Cooperation, 2000 to 2003
The purpose of this project was to sell 300,000 compact fl uorescent lamps (CFLs) provided by Philips. The donation of the Dutch government (US$1.2 million) covered the expenses of the advertising campaign and the project startup. Efforts have concentrated on urban areas.
The sale of CFL lamps took place through the retail chain La Curacao, allowing consumers to pay in installments, included in ENEE’s monthly bills. The lamps used were high-quality 15 W and 20W lamps bulbs with a life of 10,000 hours, and sold for US$9.40 per unit price.
During the fi rst months, there were signifi cant sales, but after four to fi ve months sales dropped substantially. As a result, a door-to-door sales scheme was used to deliver CFLs to homes, stores, and hotels using sales representatives. Since the new sales scheme was implemented, the sales rate has risen to a steady rate of 5,000 CFLs per month. Based on this scheme sales rate, the project became economically self-sustaining. The most used payment plan was an installment plan paid through the usual ENEE monthly energy bill.
At the closing of the 2003 campaign, total sales had reached 125,000 CFLs. In 2004, support by the Dutch government ended due to the fact that the program became economically self-sustaining. In 2005, the Empresea Uso Racional de Energía Eléctrica (UREE) resumed the project under a commercial scheme, and now the company is selling about 6,000 CFLs per month using the same door-to-door sales scheme that was successful under GAUREE, and the program is not being externally subsidized because it continues to be self-sustaining.
Source: Proyecto GAUREE 2, Generación Autónoma y Uso Racional de Energía Eléctrica, Informe de Avance, “Propuestas para una campaña de promoción de lámparas fl uorescentes compactas (LFCs) en el sector residencial de Honduras–Modulo M4,” October 2006, p. 2.
5176-ANNEX9.pdf 185 5/19/10 1:13 PM
HONDURAS: POWER SECTOR ISSUES AND OPTIONS
186
implement the Guardianes de Energía (Energy Guardians) program to help children become drivers of change at home. In addition, the strategic partnership seeks the inclusion of Energy Effi ciency in the school curriculum using dynamic and interactive programs.
Furthermore, ENEE’s GAUREE designed a pilot project to deliver energy-saving lamps. To that end, arrangements are being made to purchase 50,000 bulbs, to be used as part of a pilot project that will take place in certain cities of the country, including major ones. They will be sold by public- and private-school students, who will train potential users in how to use the lamps. The pilot project is in the demonstration phase and a discussion regarding its continuity has not yet begun.
Assessment of the Honduran ExperienceAlthough some progress has been achieved, it should be emphasized that Honduras is still lagging behind other countries in the region in terms of energy-effi ciency programs. Average residential consumption is still high (Figure A9.2), which hints at the great potential for taking action and implementing programs in this fi eld. Two major concerns can be raised.
Table A9.6 GIURE Program to Reduce National Electricity Demand
Activities Responsible Entity
Program of energy-effi cient bulb replacement
GAUREE/ENEE/SERNA/UNAH
Promotion of gas stove use
COHEP/SERNA
Rationalization of subsidies and tariffs
ENEE/SERNA
Use of clean development mechanisms
SERNA/ENEE
Educational campaign GAUREE/ENEE-SERNA
Effi ciency in the industrial and commercial sectors
PESIC
Mass communication campaign
COHEP
Create a Foundation COHEP/PESIC
Source: GIURE, Campaign for Promoting Energy Effi ciency, February 2007.
Figure A9.2 Average Residential Consumption in Various Central American Countries, kWh/month
0
50
100
150
200
250
300
El Salvador Honduras Nicaragua Costa Rica Pana am
Source: GIURE, Campaign for Promoting Energy Effi ciency, February 2007.
GIURE has set out a plan to reduce national electricity demand by 100 MW in 2008, equivalent to an 8 percent reduction of maximum demand forecast by ENEE. To that end, it has designed the programs presented in Table A9.6.
GIURE is also working on a strategic partnership with the Ministry of Education to
5176-ANNEX9.pdf 186 5/19/10 1:13 PM
187
Development of Renewable Energy and Energy Effi ciency
First, to date, the GIURE has not designed a program to decrease, substitute, or optimize the use of air conditioners in the residential and commercial categories, when load curve studies have shown that this type of equipment is a key determinant of load curve peaks.
Second, it is of concern that these programs do not include measures to reduce losses and design tariffs that are more aligned with costs, particularly for the most privileged residential groups.
A tariff increase is a very effi cient mechanism to decrease consumption. In an international comparison, Honduras shows room for a tariff increase, at least in the residential segments with consumption levels in excess of 300 kWh/month. As Figure A9.3 indicates, in this aspect Honduras also lags behind other countries in the region.
Finally, there is extensive international best practices experience in the implementation of energy-effi ciency programs. A point worth mention is that successful programs depend not only on good design, but also on the leadership and management capacity of the company in charge of deploying them. Because these programs involve a diversity of stakeholders, their administration should be transparent, clear, and, above all, simple. In general, stakeholders in this type of programs are as follows:
• Consumers (homes, stores, factories, farms)
• Manufacturers, importers, and distributors of equipment that use power
• Designers and constructors of buildings and houses
• Importers, manufacturers, and distributors of energy systems (fuel and electricity)
• Existing and potential co-generators• Energy utilities• Commercial fi nancial institutions• Governments• International financial institutions and
development aid agencies.
For example, in the areas that are most relevant to Honduras, such as programs for making the consumption of air-conditioning equipment more effi cient and for replacing or decreasing the consumption of incandescent bulbs, many of these stakeholders would be involved if programs were created in these fi elds.
Taking into consideration international best practices, the following three key issues must be addressed in Honduras to increase the prospect of sustainability of the EE programs to be implemented:
Figure A9.3 Average Electricity Consumption and Price (US$/kWh) in Central America
0
50
100
150
200
250
300
El Salvador Honduras Nicaragua Costa Rica Pana am
Consumption(kWh/mes)
0
0.02
0.04
0.06
0.08
0.1
0.12
0.14
0.16
Price($/kWh)Consumption Price
Source: GIURE, Campaign for Promoting Energy Effi ciency, February 2007.
5176-ANNEX9.pdf 187 5/19/10 1:13 PM
HONDURAS: POWER SECTOR ISSUES AND OPTIONS
188
1. Does ENEE have the incentive (either through regulation or cost recovery for both program costs and lost revenues) to implement such programs? Moreover, what kind of fi nancial incentives are they willing to provide to, for example, induce residential customers to consider entering the programs?
2. Do ENEE/regulators or those in GIURE have the necessary staff and skills to evaluate such EE programs?
3. Does the program include provisions to sustain itself through ongoing and planned sector and pricing reforms? In particular, program success is conditioned on the substantial amount of partnering and collaborating that ENEE carries out with other energy organizations and with market actors, including manufacturers, distributors, and retailers. These kinds of partnerships provide programs with greater sustainability.
Potential for Energy Effi ciency in HondurasAs mentioned, Honduras has a very large potential for developing energy efficiency programs. Nevertheless, in view of the pressing current situation, there is an urgent need to raise awareness in all citizens about the importance of saving energy.
The potential for energy efficiency improvement comprises two cases: one in which technology for producing the service is maintained, but devices have become more effi cient; and one in which new technologies are introduced. New technologies, in turn, include those that entail a process improvement from the thermodynamic viewpoint, and the rest. Finally, a category of their own is reserved for cases in which organizational improvement and corporate actions are required, as is the case of the national electricity system and traffi c regulation by local authorities. These three options can be stated in this way:
1. The same technology, but more efficient devices or construction: a. Compact fl uorescent lamps b. High-effi ciency home appliances
c. Improved kilns for those who cook using wood
d. Effi cient electrical engines for industry uses
2. New technology: a. Process improvements from the
thermodynamic viewpoint: i. Co-generation ii. Substitution of electrical energy with
heat for cooking, hot water, and heating, through the use of LPG or heat pumps
b. Other new technologies: i. Light-emitting diodes (LEDs) and
other new lighting technologies ii. Hybrid vehicles for transportation iii. “Bio-climatic” architecture
3. Organizational changes and introduction of technology in corporate players: a. Improvement of the dispatch of
generating units and reduction of losses by ENEE
b. Organizational improvement and traffi c management techniques for large urban centers.
Considering this scheme, energy-effi ciency programs can be broken down in two categories: those that seek to increase or improve the quality of supply, and those aimed at making consumption more effi cient or at reducing demand (known as demand side management [DSM]).
Potential to Increase Generation Capacity and Reliability of SupplyOn the supply side, work is to be done in two different fi elds. On the one hand, action should be taken to add new generation capacity. On the other, an aggressive plan is needed for reducing technical and commercial losses.
Increasing Generation Capacity
GIURE has studied different options on the supply side (new generation capacity). The main diffi culty identifi ed is that some options take too long to implement or have high costs. According to their analysis and considering the shortage of supply foreseen for 2008, in the short term, GIURE believes that the only option that can be
5176-ANNEX9.pdf 188 5/19/10 1:13 PM
189
Development of Renewable Energy and Energy Effi ciency
implemented is the renting (arrendamiento) of new capacity. In this manner, it has determined that 110 MW should be leased in 2008 (possibly 150 MW, if existing demand continues), more than 60 MW in 2009, and at least 130 MW in 2010. EE will help reduce or avoid the need for the expensive arrendamiento in the shorter term.
Loss-reduction Program
It is surprising that GIURE actions do not take into account a loss-reduction program. The following is a discussion regarding specifi c actions based on different international experiences that would enable reducing commercial loss and energy theft, and are all applicable to the Honduran context.
Different technological applications may result in crucial tools for monitoring customers, increasing transparency, legality, and personnel safety. For example, for customers, metering technology can be benefi cial in two ways. First, some metering appliances can assist customers in managing their consumption, allowing them to reduce their electricity bills. Second, technological appliances foster the rational use of energy by making customers more responsible in the use of electrical appliances. In turn, prepaid meters benefi t utilities as customers are made more responsible, promoting a payment culture and, thus, increasing transparency and collectibles.
In turn, metering can be made reliable by using antitheft meters. Split meters can be installed and sealed. A reliable software support system can also improve close customer monitoring. Finally, special network and service upgrades are necessary to bring customers onto the network. What these options show is that to reduce losses, it is necessary to invest.
Proposals for Improving the Load CurveSeveral options exist to improve the load curve by diminishing and softening peaks. As mentioned, any proposal should include the residential sector, which has the largest share in consumption, and the strongest infl uence in the highest demand peak (7:00 p.m. to 8:00 p.m.).
Proposals for improving the load curve cover a broad universe and their outcome depends to a large extent on program management and the effi ciency with which it is implemented. Though proposed measures in most cases lead in the direction of energy savings or substitution of energy sources, because many of them are accountable for the existence of consumption peaks, their replacement would mean reducing said peaks in demand.
GAUREE Project reports identify some potential solutions and point to the challenges faced by some of these programs:
• Improvements in refrigerators and AC equipment. Needs include labeling regulations and energy-effi ciency rating for home appliances. Two specific problems relating to air conditioning follow:• In general, there is poor maintenance in
the residential sector (AC equipment is repaired only when it stops working), and therefore, cooling capacity decreases while maintaining the same consumption. A measure that has been adopted in some countries is applying a renewal plan providing a “discount coupon” for the purchase of new and effi cient equipment in replacement of a device that is a certain number of years old—an expensive but effective solution.
• The low quality of control systems in medium-quality equipment or equipment that is over eight years old; generally, analogue thermostats are not very sensitive.
• Lighting improvements. The only problem foreseen with this type of program is that it is often met with reluctance by consumers to purchase more expensive lamps, even when they entail short- or medium-term economic savings. In addition, there is a large number of low-quality, low-price, and poor-performance lamps that undermine the credibility of programs in this field. However, both problems can be controlled under a properly managed program.
• Replacement of electric stoves with gas stoves. This would involve a restructuring of the
5176-ANNEX9.pdf 189 5/19/10 1:13 PM
HONDURAS: POWER SECTOR ISSUES AND OPTIONS
190
electricity and LPG tariffs to encourage replacement, in addition to actions with gas distributors. Furthermore, it would be advisable to introduce voltage-limiting devices at home connections, which does not seem feasible in the short term.
• Replacement of electric water heaters with thermal solar panels or gas heaters or electric accumulating heaters with timers. Introducing solar systems would require regulatory incentives, because the general trend in the country is to purchase the cheapest elements available in the market (even when purchasing a more expensive product would bring savings in the medium or long term). As is the case with stoves, the use of gas heaters would require restructuring electricity and LPG tariffs.
Evaluating the Potential Savings from Different ProgramsThe proposals for improving the demand curve that look most attractive are the fi rst two—that is, improvements in refrigerators and air conditioning, and improvements in lighting systems. However, to implement these programs it is necessary to do the following:
• Clearly defi ne program objectives to avoid mixed goals and potential business confl icts.
• Identify early, visible successes that improve government and public support for the programs.
• Phase implementation, to allow for a gradual build-up of DSM program portfolio, scaling up successful pilots.
• Defi ne minimum program product technical specifications to improve technology credibility.
• Develop parallel financing facilities to support audit and other programs targeting industrial and commercial customers.
The following simulations are intended to identify the potential of these options, considering programs and scenarios with different penetration rates.
Table A9.7 shows the potential impact of a lamp substitution campaign in Honduras in
which incandescent 75 W lamps are replaced with LFC 20 W lamps. Program success depends on several factors, but perhaps the most important is the penetration rate. As shown in the table, a program that aims to replace 1 million lamps but has a penetration rate of 5 percent would be expected to save 1.6 MW in energy, and 3.3 GWh per year in terms, allowing for annual economic savings of US$266,600.
In contrast, if the penetration rate of the program is as high as 80 percent, the total energy saved would be of 26.3 MW, the expected annual saving in energy consumption would be of 53.3 GWh, and annual economic savings would reach US$4,265,500.
Table A9.8 shows the potential impact of a campaign for optimizing the use of air-conditioning in the commercial sector category—a sector where the use of air-conditioning represents almost 40 percent of total consumption by the sector—and under three different kinds of programs: (1) equipment revision and upgrade, (2) reducing air-conditioning consumption by 50 percent, and (3) reducing air-conditioning consumption completely.
The results are presented for programs with different penetration rates. For example, a program involving the revision and upgrading of AC equipment in the commercial sector, with a penetration rate of 20 percent, can have an expected saving in energy of 1,520 MWh, a savings of US$1.1 million.
Tables A9.7 and A9.8 are useful policy analysis tools, given that they illustrate clearly the trade-offs inherent in energy-effi ciency programs. For example, a program that aims to replace 500,000 lamps and has a penetration rate of 50 percent has the same results as a program that aims to replace 5 million lamps but has a penetration rate of just 5 percent. The big difference in this case will be in program costs. Thus, how to manage and implement these kinds of programs becomes crucial if success is to be achieved and resources are to be saved.
The impact of a campaign for optimizing the use of air conditioning in the commercial sector is presented in Table A9.8.
5176-ANNEX9.pdf 190 5/19/10 1:13 PM
Tab
le A
9.7
Im
pac
t o
f a
Lig
htb
ulb
Su
bst
itu
tio
n C
amp
aig
n
No.
of
Lam
ps
to B
e
Rep
lace
dR
esu
lts
Pro
gra
m P
enet
rati
on
Rate
%
5.0
%10
.0%
20
.0%
50
.0%
70
.0%
80
.0%
10,0
00
En
erg
y s
avin
g t
arg
ete
d b
y p
rog
ram
(M
W)
0.0
0.0
0.1
0.2
0.2
0.3
An
nu
al s
avin
g in
en
erg
y in
th
eo
ry (
GW
h/y
r)0
.80
.80
.80
.80
.80
.8
Exp
ect
ed
an
nu
al s
avin
g in
en
erg
y (
GW
h/y
r)0
.00
.10
.10
.30
.50
.5
Exp
ect
ed
an
nu
al e
con
om
ic s
avin
g (
US
$/y
r)2
.75
.310
.72
6.7
37.
34
2.7
Exp
ect
ed
sav
ing
in e
ne
rgy
du
rin
g la
mp
du
rati
on
pe
rio
d (
GW
h)0
.10
.30
.51.
41.9
2.2
Exp
ect
ed
eco
no
mic
sav
ing
du
rin
g la
mp
du
rati
on
pe
rio
d (
US
$)
11.0
21.9
43
.810
9.6
153
.417
5.3
50
0,0
00
En
erg
y s
avin
g t
arg
ete
d b
y p
rog
ram
(M
W)
0.8
1.6
3.3
8.2
11.5
13.1
An
nu
al s
avin
g in
en
erg
y in
th
eo
ry (
GW
h/y
r)4
0.2
40
.24
0.2
40
.24
0.2
40
.2
Exp
ect
ed
an
nu
al s
avin
g in
en
erg
y (
GW
h/y
r)1.7
3.3
6.7
16.7
23
.32
6.7
Exp
ect
ed
an
nu
al e
con
om
ic s
avin
g (
US
$/y
r)13
3.3
26
6.6
53
3.2
1,3
33
.01,
86
6.2
2,13
2.8
Exp
ect
ed
sav
ing
in e
ne
rgy
du
rin
g la
mp
du
rati
on
pe
rio
d (
GW
h)6
.813
.72
7.4
68
.59
5.9
109
.6
Exp
ect
ed
eco
no
mic
sav
ing
du
rin
g la
mp
du
rati
on
pe
rio
d (
US
$)
54
7.9
1,0
95
.72
,191.
45
,478
.57,
670
.08
,76
5.7
80
0,0
00
En
erg
y s
avin
g t
arg
ete
d b
y p
rog
ram
(M
W)
1.3
2.6
5.3
13.1
18.4
21.
0
An
nu
al s
avin
g in
en
erg
y in
th
eo
ry (
GW
h/y
r)6
4.2
64
.26
4.2
64
.26
4.2
64
.2
Exp
ect
ed
an
nu
al s
avin
g in
en
erg
y (
GW
h/y
r)2
.75
.310
.72
6.7
37.
34
2.7
Exp
ect
ed
an
nu
al e
con
om
ic s
avin
g (
US
$/y
r)2
13.3
42
6.6
85
3.1
2,13
2.8
2,9
85
.93
,412
.4
Exp
ect
ed
sav
ing
in e
ne
rgy
du
rin
g la
mp
du
rati
on
pe
rio
d (
GW
h)11
.02
1.94
3.8
109
.615
3.4
175
.3
Exp
ect
ed
eco
no
mic
sav
ing
du
rin
g la
mp
du
rati
on
pe
rio
d (
US
$)
876
.61,7
53
.13
,50
6.3
8,7
65
.712
,27
1.914
,02
5.1
1,0
00
,00
0E
ne
rgy
sav
ing
tar
ge
ted
by
pro
gra
m (
MW
)1.
63
.36
.616
.42
3.0
26
.3
An
nu
al s
avin
g in
en
erg
y in
th
eo
ry (
GW
h/y
r)8
0.3
80
.38
0.3
80
.38
0.3
80
.3
Exp
ect
ed
an
nu
al s
avin
g in
en
erg
y (
GW
h/y
r)3
.36
.713
.33
3.3
46
.75
3.3
Exp
ect
ed
an
nu
al e
con
om
ic s
avin
g (
US
$/y
r)2
66
.65
33
.21,
06
6.4
2,6
66
.03
,73
2.3
4,2
65
.5
Exp
ect
ed
sav
ing
in e
ne
rgy
du
rin
g la
mp
du
rati
on
pe
rio
d (
GW
h)13
.72
7.4
54
.813
7.0
191.7
219
.1
Exp
ect
ed
eco
no
mic
sav
ing
du
rin
g la
mp
du
rati
on
pe
rio
d (
US
$)
1,0
95
.72
,191.
44
,38
2.8
10,9
57.
115
,33
9.9
17,5
31.
4
Co
ntin
ue
d
5176-ANNEX9.pdf 191 5/19/10 1:13 PM
Tab
le A
9.7
C
on
tin
ue
d
No.
of
Lam
ps
to B
e
Rep
lace
dR
esu
lts
Pro
gra
m P
enet
rati
on
Rate
%
5.0
%10
.0%
20
.0%
50
.0%
70
.0%
80
.0%
2,0
00
,00
0E
ne
rgy
sav
ing
tar
ge
ted
by
pro
gra
m (
MW
)3
.36
.613
.13
2.9
46
.05
2.6
An
nu
al s
avin
g in
en
erg
y in
th
eo
ry (
GW
h/y
r)16
0.6
160
.616
0.6
160
.616
0.6
160
.6
Exp
ect
ed
an
nu
al s
avin
g in
en
erg
y (
GW
h/y
r)6
.713
.32
6.7
66
.69
3.3
106
.6
Exp
ect
ed
an
nu
al e
con
om
ic s
avin
g (
US
$/y
r)5
33
.21,
06
6.4
2,13
2.8
5,3
31.9
7,4
64
.78
,53
1.1
Exp
ect
ed
sav
ing
in e
ne
rgy
du
rin
g la
mp
du
rati
on
pe
rio
d (
GW
h)2
7.4
54
.810
9.6
27
3.9
38
3.5
43
8.3
Exp
ect
ed
eco
no
mic
sav
ing
du
rin
g la
mp
du
rati
on
pe
rio
d (
US
$)
2,19
1.4
4,3
82
.88
,76
5.7
21,9
14.2
30
,67
9.9
35
,06
2.7
5,0
00
,00
0E
ne
rgy
sav
ing
tar
ge
ted
by
pro
gra
m (
MW
)8
.216
.43
2.9
82
.111
5.0
131.
4
An
nu
al s
avin
g in
en
erg
y in
th
eo
ry (
GW
h/y
r)4
01.
54
01.
54
01.
54
01.
54
01.
54
01.
5
Exp
ect
ed
an
nu
al s
avin
g in
en
erg
y (
GW
h/y
r)16
.73
3.3
66
.616
6.6
23
3.3
26
6.6
Exp
ect
ed
an
nu
al e
con
om
ic s
avin
g (
US
$/y
r)1,
33
3.0
2,6
66
.05
,33
1.913
,32
9.8
18,6
61.7
21,
32
7.7
Exp
ect
ed
sav
ing
in e
ne
rgy
du
rin
g la
mp
du
rati
on
pe
rio
d (
GW
h)6
8.5
137.
02
73
.96
84
.89
58
.71,
09
5.7
Exp
ect
ed
eco
no
mic
sav
ing
du
rin
g la
mp
du
rati
on
pe
rio
d (
US
$)
5,4
78.5
10,9
57.
12
1,914
.25
4,7
85
.576
,69
9.7
87,
65
6.8
Sou
rce
: Au
tho
rs’ c
alc
ula
tion
s, 20
07.
Alte
rna
tive
: Im
pa
ct
of
a li
gh
t b
ulb
su
bst
itutio
n c
am
pa
ign
(re
pla
cin
g in
ca
nd
esc
en
t b
ulb
s fo
r LFC
s).
Ho
w m
an
y lig
htb
ulb
s h
ave
to
be
rep
lac
ed
if t
he
follo
win
g e
ne
rgy
savi
ng
ta
rge
ts a
re s
et,
un
de
r diff
ere
nt
pro
gra
m p
en
etr
atio
n ra
tes?
Use
fac
tor %
: 83%
5176-ANNEX9.pdf 192 5/19/10 1:13 PM
Tab
le A
9.8
Im
pact
of
a C
ampa
ign
for
Opt
imiz
ing
the
Use
of
Air
-con
diti
onin
g in
the
Com
mer
cial
Sec
tor
Pro
gra
m T
ype
Pro
gra
m P
enet
rati
on
Rate
%
Res
ult
s5
%10
%2
0%
50
%
Eq
uip
me
nt
Up
gra
de
Exp
ect
ed
sav
ing
in e
ne
rgy
(M
Wh)
3
80
,1
760
,2
1.5
20
,3
3.8
00
,8
Pri
mar
y e
ne
rgy
fu
el-
bu
nke
r (G
J)
1.9
39
,2
3.8
78,4
7.
756
,8
19.3
92
,0
A h
orr
o e
n e
ne
rgía
elé
ctri
ca e
n U
S$
28
5.3
48
,3
570
.69
6,7
1.1
41.
39
3,4
2.8
53
.48
3,5
A h
orr
o e
n e
mis
ion
es d
e C
O2 (
tn)
17
3.14
3,2
3
46
.28
6,4
6
92
.572
,9
1.73
1.4
32
,2
Re
du
cin
g A
C c
on
sum
pti
on
by
50
%
Exp
ect
ed
sav
ing
in e
ne
rgy
(M
Wh)
9
50
,2
1.90
0,4
3
.80
0,8
9
.50
2,1
Pri
mar
y e
ne
r gy
fu
el-
bu
nke
r (G
J)
4
.84
8,0
9
.69
6,0
19
.39
2,0
4
8.4
80
,1
A h
orr
o e
n e
ne
rgía
elé
ctri
ca e
n U
S$
7
13.3
70,9
1.
42
6.7
41,7
2.8
53
.48
3,5
7.
133
.70
8,7
A h
orr
o e
n e
mis
ion
es d
e C
O2 (
tn)
4
32
.85
8,1
8
65
.716
,1
1.73
1.4
32
,2 4
.32
8.5
80
,5
Re
du
cin
g A
C c
on
sum
pti
on
by
10
0%
Exp
ect
ed
sav
ing
in e
ne
rgy
(M
Wh)
1.9
00
,4
3.8
00
,8
7.6
01,7
19
.00
4,2
Pri
mar
y e
ne
r gy
fu
el-
bu
nke
r (G
J)
9
.69
6,0
19
.39
2,0
3
8.7
84
,1
96
.96
0,2
A h
orr
o e
n e
ne
rgía
elé
ctri
ca e
n U
S$
1.
42
6.7
41,7
2
.85
3.4
83
,5
5.7
06
.96
7,0
14
.26
7.4
17,4
A h
orr
o e
n e
mis
ion
es d
e C
O2 (
tn)
8
65
.716
,1
1.73
1.4
32
,2 3
.46
2.8
64
,4
8.6
57.
161,1
Sou
rce
: Au
tho
rs’ c
alc
ula
tion
s, 20
07.
Alte
rna
tive
: Im
pa
ct
of
a c
am
pa
ign
for o
ptim
izin
g t
he
use
of A
ir C
on
diti
on
ing
in t
he
Co
mm
erc
ial C
ate
go
ry.
Ass
um
ptio
ns
/1 :
Ene
rgy
co
nsu
mp
tion
by
the
Co
mm
erc
ial S
ec
tor (
MW
h)
Jul 0
6: 9
5.02
1,0
Use
of A
C a
s a
% o
f to
tal c
on
sum
ptio
n in
th
e C
om
me
rcia
l Se
cto
r: 40
%
Ene
rgy
co
nsu
mp
tion
by
AC
in t
he
Co
mm
erc
ial S
ec
tor (
MW
h):
38.
008,
4
Ave
rag
e t
arif
f p
er k
Wh
(U
S$/k
Wh
) fo
r Co
mm
erc
ial C
ate
go
ry: 0
,133
2
Ave
rag
e d
aily
use
of A
C (
hrs
pe
r da
y): 1
2
Op
era
ting
da
ys p
er y
ea
r (c
lose
d o
n S
un
da
ys a
nd
ho
lida
ys):
305
Ene
rgy
Effi c
ien
cy
ga
ine
d b
y e
qu
ipm
en
t u
pg
rad
e/r
evi
sion
: 20%
5176-ANNEX9.pdf 193 5/19/10 1:13 PM
5176-ANNEX9.pdf 194 5/19/10 1:13 PM
Region/Country Activity/Report Title Date Number
SUB-SAHARAN AFRICA (AFR)
Africa Regional Anglophone Africa Household Energy Workshop (English) 07/88 085/88
Regional Power Seminar on Reducing Electric Power System Losses in Africa (English) 08/88 087/88
Institutional Evaluation of EGL (English) 02/89 098/89
Francophone Household Energy Workshop (French) 08/89 ——
Interafrican Electrical Engineering College: Proposals for Short- and Long-Term Development (English) 03/90 112/90
Biomass Assessment and Mapping (English) 03/90 ——
Symposium on Power Sector Reform and Effi ciency Improvement in Sub-Saharan Africa (English) 06/96 182/96
Commercialization of Marginal Gas Fields (English) 12/97 201/97
Commercializing Natural Gas: Lessons from the Seminar in Nairobi for Sub-Saharan Africa and Beyond 01/00 225/00
Africa Gas Initiative—Main Report: Volume I 02/01 240/01
First World Bank Workshop on the Petroleum Products Sector in Sub-Saharan Africa 09/01 245/01
Ministerial Workshop on Women in Energy 10/01 250/01 and Poverty Reduction: Proceedings from a Multi-Sector and Multi-Stakeholder Workshop Addis Ababa, Ethiopia, October 23–25, 2002 03/03 266/03
Opportunities for Power Trade in the Nile Basin: Final Scoping Study 01/04 277/04
Energies modernes et réduction de la pauvreté: Un atelier multi-sectoriel. Actes de l’atelier régional. Dakar, Sénégal, du 4 au 6 février 2003 (French Only) 01/04 278/04
Énergies modernes et réduction de la pauvreté: Un atelier multi-sectoriel. Actes de l’atelier régional. Douala, Cameroun du 16-18 juillet 2003. (French Only) 09/04 286/04
195
List of Formal Reports
5176-LIST.pdf 195 5/19/10 1:14 PM
Honduras: Power Sector Issues and Options
196
Africa Regional Energy and Poverty Reduction: Proceedings from the Global Village Energy Partnership (GVEP) Workshops held in Africa 01/05 298/05
Power Sector Reform in Africa: Assessing the Impact on Poor People 08/05 306/05
The Vulnerability of African Countries to Oil Price Shocks: Major Factors and Policy Options. The Case of Oil Importing Countries 08/05 308/05
Maximizing the Productive Uses of Electricity to Increase the Impact of Rural Electrifi cation Programs 03/08 332/08
Angola Energy Assessment (English and Portuguese) 05/89 4708-ANG
Power Rehabilitation and Technical Assistance (English) 10/91 142/91
Africa Gas Initiative—Angola: Volume II 02/01 240/01
Benin Energy Assessment (English and French) 06/85 5222-BEN
Botswana Energy Assessment (English) 09/84 4998-BT
Pump Electrifi cation Prefeasibility Study (English) 01/86 047/86
Review of Electricity Service Connection Policy (English) 07/87 071/87
Tuli Block Farms Electrifi cation Study (English) 07/87 072/87
Household Energy Issues Study (English) 02/88 ——
Urban Household Energy Strategy Study (English) 05/91 132/91
Burkina Faso Energy Assessment (English and French) 01/86 5730-BUR
Technical Assistance Program (English) 03/86 052/86
Urban Household Energy Strategy Study (English and French) 06/91 134/91
Charcoal Utilization Pre-feasibility Study (English) 06/90 119/90
Integrated Energy Strategy Evaluation (English) 01/92 8768-ZIM
Energy Effi ciency Technical Assistance Project: Strategic Framework for a National Energy Effi ciency Improvement Program (English) 04/94 ——
Capacity Building for the National Energy Effi ciency Improvement Programme (NEEIP) (English) 12/94 ——
Rural Electrifi cation Study 03/00 228/00
Les réformes du secteur de l’électricite en Afrique: Evaluation de leurs conséquences pour les populations pauvres 11/06 306/06
EAST ASIA AND PACIFIC (EAP)
Asia Regional Pacifi c Household and Rural Energy Seminar (English) 11/90 ——
China County-Level Rural Energy Assessments (English) 05/89 101/89
Fuelwood Forestry Preinvestment Study (English) 12/89 105/89
Strategic Options for Power Sector Reform in China (English) 07/93 156/93
Energy Effi ciency and Pollution Control in Township and Village Enterprises (TVE) Industry (English) 11/94 168/94
Energy for Rural Development in China: An Assessment Based on a Joint Chinese/ESMAP Study in Six Counties (English) 06/96 183/96
Improving the Technical Effi ciency of Decentralized Power Companies 09/99 222/99
Air Pollution and Acid Rain Control: The Case of Shijiazhuang City and the Changsha Triangle Area 10/03 267/03
Toward a Sustainable Coal Sector In China 07/04 287/04
Demand Side Management in a Restructured Industry: How Regulation and Policy Can Deliver Demand-Side Management Benefi ts to a Growing Economy and a Changing Power System 12/05 314/05
A Strategy for CBM and CMM Development and Utilization in China 07/07 326/07
Development of National Heat Pricing and Billing Policy 03/08 330/08
5176-LIST.pdf 201 5/19/10 1:14 PM
Honduras: Power Sector Issues and Options
202
Fiji Energy Assessment (English) 06/83 4462-FIJ
Indonesia Energy Assessment (English) 11/81 3543-IND
Status Report (English) 09/84 022/84
Power Generation Effi ciency Study (English) 02/86 050/86
Energy Effi ciency in the Brick, Tile and Lime Industries (English) 04/87 067/87
Diesel Generating Plant Effi ciency Study (English) 12/88 095/88
Urban Household Energy Strategy Study (English) 02/90 107/90
Biomass Gasifi er Preinvestment Study Vols. I & II (English) 12/90 124/90
Indonesia Prospects for Biomass Power Generation with Emphasis on Palm Oil, Sugar, Rubberwood and Plywood Residues (English) 11/94 167/94
Lao PDR Urban Electricity Demand Assessment Study (English) 03/93 154/93
Institutional Development for Off-Grid Electrifi cation 06/99 215/99
Malaysia Sabah Power System Effi ciency Study (English) 03/87 068/87
Gas Utilization Study (English) 09/91 9645-MA
Mongolia Energy Effi ciency in the Electricity and District Heating Sectors 10/01 247/01
Improved Space Heating Stoves for Ulaanbaatar 03/02 254/02
Impact of Improved Stoves on Indoor Air Quality in Ulaanbaatar, Mongolia 11/05 313/05
Myanmar Energy Assessment (English) 06/85 5416-BA
Papua NewGuinea (PNG) Energy Assessment (English) 06/82 3882-
Status Report (English) 07/83 006/83
Institutional Review in the Energy Sector (English) 10/84 023/84
Power Tariff Study (English) 10/84 024/84
Philippines Commercial Potential for Power Production from Agricultural Residues (English) 12/93 157/93
Energy Conservation Study (English) 08/94 ——
Strengthening the Non-Conventional and Rural Energy Development Program in the Philippines: A Policy Framework and Action Plan 08/01 243/01
Rural Electrifi cation and Development in the Philippines: Measuring the Social and Economic Benefi ts 05/02 255/02
Solomon Islands Energy Assessment (English) 06/83 4404-SOL
Energy Assessment (English) 01/92 979-SOL
South Pacifi c Petroleum Transport in the South Pacifi c (English) 05/86 ——
Thailand Energy Assessment (English) 09/85 5793-TH
Rural Energy Issues and Options (English) 09/85 044/85
5176-LIST.pdf 202 5/19/10 1:14 PM
203
List of Formal Reports
Thailand Accelerated Dissemination of Improved Stoves and Charcoal Kilns (English) 09/87 079/87
Northeast Region Village Forestry and Woodfuels Preinvestment Study (English) 02/88 083/88
Impact of Lower Oil Prices (English) 08/88 ——
Coal Development and Utilization Study (English) 10/89 ——
Why Liberalization May Stall in a Mature Power Market: A Review of the Technical and Political Economy Factors that Constrained the Electricity Sector Reform in Thailand 1998–2002 12/03 270/03
Reducing Emissions from Motorcycles in Bangkok 10/03 275/03
Tonga Energy Assessment (English) 06/85 5498-
Vanuatu Energy Assessment (English) 06/85 5577-VA
Vietnam Rural and Household Energy-Issues and Options (English) 01/94 161/94
Power Sector Reform and Restructuring in Vietnam: Final Report to the Steering Committee (English and Vietnamese) 09/95 174/95
Household Energy Technical Assistance: Improved Coal Briquetting and Commercialized Dissemination of Higher Effi ciency Biomass and Coal Stoves (English) 01/96 178/96
Petroleum Fiscal Issues and Policies for Fluctuating Oil Prices In Vietnam 02/01 236/01
An Overnight Success: Vietnam’s Switch to Unleaded Gasoline 08/02 257/02
The Electricity Law for Vietnam—Status and Policy Issues— The Socialist Republic of Vietnam 08/02 259/02
Vietnam Petroleum Sector Technical Assistance for the Revision of the Existing Legal and Regulatory Framework 12/03 269/03
Western Samoa Energy Assessment (English) 06/85 5497
SOUTH ASIA (SAR)
SAR Regional Toward Cleaner Urban Air in South Asia: Tackling Transport Pollution, Understanding Sources 03/04 281/04
Bangladesh Energy Assessment (English) 10/82 3873-BD
Priority Investment Program (English) 05/83 002/83
Status Report (English) 04/84 015/84
Power System Effi ciency Study (English) 02/85 031/85
Small Scale Uses of Gas Pre-feasibility Study (English) 12/88 ——
Reducing Emissions from Baby-Taxis in Dhaka 01/02 253/02
India Opportunities for Commercialization of Non-conventional Energy Systems (English) 11/88 091/88
Maharashtra Bagasse Energy Effi ciency Project (English) 07/90 120/90
5176-LIST.pdf 203 5/19/10 1:14 PM
Honduras: Power Sector Issues and Options
204
India Mini-Hydro Development on Irrigation Dams and Canal Drops Vols. I, II and III (English) 07/91 139/91
WindFarm Pre-Investment Study (English) 12/92 150/92
Power Sector Reform Seminar (English) 04/94 166/94
Environmental Issues in the Power Sector (English) 06/98 205/98
Environmental Issues in the Power Sector: Manual for Environmental Decision Making (English) 06/99 213/99
Household Energy Strategies for Urban India: The Case of Hyderabad 06/99 214/99
Greenhouse Gas Mitigation In the Power Sector: Case Studies from India 02/01 237/01
Energy Strategies for Rural India: Evidence from Six States 08/02 258/02
Household Energy, Indoor Air Pollution, and Health 11/02 261/02
Access of the Poor to Clean Household Fuels 07/03 263/03
The Impact of Energy on Women’s Lives in Rural India 01/04 276/04
Environmental Issues in the Power Sector: Long-Term Impacts And Policy Options for Rajasthan 10/04 292/04
Environmental Issues in the Power Sector: Long-Term Impacts And Policy Options for Karnataka 10/04 293/04
Nepal Energy Assessment (English) 08/83 4474-NEP
Status Report (English) 01/85 028/84
Energy Effi ciency & Fuel Substitution in Industries (English) 06/93 158/93
Pakistan Household Energy Assessment (English) 05/88 ——
Assessment of Photovoltaic Programs, Applications, and Markets (English) 10/89 103/89
National Household Energy Survey and Strategy Formulation Study: Project Terminal Report (English) 03/94 ——
Managing the Energy Transition (English) 10/94 ——
Lighting Effi ciency Improvement Program
Phase 1: Commercial Buildings Five Year Plan (English) 10/94 ——
Clean Fuels 10/01 246/01
Household Use of Commercial Energy 05/06 320/06
Sri Lanka Energy Assessment (English) 05/82 3792-CE
Power System Loss Reduction Study (English) 07/83 007/83
Status Report (English) 01/84 010/84
Industrial Energy Conservation Study (English) 03/86 054/86
Sustainable Transport Options for Sri Lanka: Vol. I 02/03 262/03
Greenhouse Gas Mitigation Options in the Sri Lanka Power Sector: Vol. II 02/03 262/03
5176-LIST.pdf 204 5/19/10 1:14 PM
205
List of Formal Reports
Sri Lanka Sri Lanka Electric Power Technology Assessment (SLEPTA): Vol. III 02/03 262/03
Energy and Poverty Reduction: Proceedings from South Asia Practitioners Workshop How Can Modern Energy Services Contribute to Poverty Reduction? Colombo, Sri Lanka, June 2–4, 2003 11/03 268/03
EUROPE AND CENTRAL ASIA (ECA)
Armenia Development of Heat Strategies for Urban Areas of Low-income Transition Economies. Urban Heating Strategy for the Republic Of Armenia. Including a Summary of a Heating Strategy for the Kyrgyz Republic 04/04 282/04
Bulgaria Natural Gas Policies and Issues (English) 10/96 188/96
Energy Environment Review 10/02 260/02
Central Asia andThe Caucasus Cleaner Transport Fuels in Central Asia and the Caucasus 08/01 242/01
Central andEastern Europe Power Sector Reform in Selected Countries 07/97 196/97
Increasing the Effi ciency of Heating Systems in Central and Eastern Europe and the Former Soviet Union (English and Russian) 08/00 234/00
The Future of Natural Gas in Eastern Europe (English) 08/92 149/92
Kazakhstan &Kyrgyzstan Opportunities for Renewable Energy Development 11/97 16855-
Poland Energy Sector Restructuring Program Vols. I–V (English) 01/93 153/93
Natural Gas Upstream Policy (English and Polish) 08/98 206/98
Energy Sector Restructuring Program: Establishing the Energy Regulation Authority 10/98 208/98
Portugal Energy Assessment (English) 04/84 4824-PO
Romania Natural Gas Development Strategy (English) 12/96 192/96
Private Sector Participation in Market-Based Energy- Effi ciency Financing Schemes: Lessons Learned from Romania and International Experiences. 11/03 274/03
Slovenia Workshop on Private Participation in the Power Sector (English) 02/99 211/99
Turkey Energy Assessment (English) 03/83 3877-TU
Energy and the Environment: Issues and Options Paper 04/00 229/00
Energy and Environment Review: Synthesis Report 12/03 273/03
Turkey’s Experience with Greenfi eld Gas Distribution since 2003 03/07 325/05
5176-LIST.pdf 205 5/19/10 1:14 PM
Honduras: Power Sector Issues and Options
206
MIDDLE EAST AND NORTH AFRICA (MNA)
Arab Republicof Egypt Energy Assessment (English) 10/96 189/96
Energy Assessment (English and French) 03/84 4157-
Status Report (English and French) 01/86 048/86
Energy Sector Institutional Development Study (English and French) 07/95 173/95
Morocco Natural Gas Pricing Study (French) 10/98 209/98
Gas Development Plan Phase II (French) 02/99 210/99
Syria Energy Assessment (English) 05/86 5822-SYR
Syria Electric Power Effi ciency Study (English) 09/88 089/88
Energy Effi ciency Improvement in the Cement Sector (English) 04/89 099/89
Energy Effi ciency Improvement in the Fertilizer Sector (English) 06/90 115/90
Tunisia Fuel Substitution (English and French) 03/90 ——
Power Effi ciency Study (English and French) 02/92 136/91
Energy Management Strategy in the Residential and Tertiary Sectors (English) 04/92 146/92
Renewable Energy Strategy Study, Volume I (French) 11/96 190A/96
Renewable Energy Strategy Study, Volume II (French) 11/96 190B/96
Rural Electrifi cation in Tunisia: National Commitment, Effi cient Implementation and Sound Finances 08/05 307/05
Yemen Energy Assessment (English) 12/84 4892-YAR
Energy Investment Priorities (English) 02/87 6376-YAR
Household Energy Strategy Study Phase I (English) 03/91 126/91
Household Energy Supply and Use in Yemen. Volume I: Main Report and Volume II: Annexes 12/05 315/05
LATIN AMERICA AND THE CARIBBEAN REGION (LCR)
LCR Regional Regional Seminar on Electric Power System Loss Reduction
in the Caribbean (English) 07/89 ——
Elimination of Lead in Gasoline in Latin America and the Caribbean (English and Spanish) 04/97 194/97
Elimination of Lead in Gasoline in Latin America and the Caribbean—Status Report (English and Spanish) 12/97 200/97
Harmonization of Fuels Specifi cations in Latin America and the Caribbean (English and Spanish) 06/98 203/98
Energy and Poverty Reduction: Proceedings from the Global Village Energy Partnership (GVEP) Workshop held in Bolivia 06/05 202/05
5176-LIST.pdf 206 5/19/10 1:14 PM
207
List of Formal Reports
LCR Regional Power Sector Reform and the Rural Poor in Central America 12/04 297/04
Estudio Comparativo Sobre la Distribución de la Renta Petrolera en Bolivia, Colombia, Ecuador y Perú 08/05 304/05
OECS Energy Sector Reform and Renewable Energy/ Energy Effi ciency Options 02/06 317/06
The Landfi ll Gas-to-Energy Initiative for Latin America and the Caribbean 02/06 318/06
Bolivia Energy Assessment (English) 04/83 4213-BO
National Energy Plan (English) 12/87 ——
La Paz Private Power Technical Assistance (English) 11/90 111/90
Pre-feasibility Evaluation Rural Electrifi cation and Demand Assessment (English and Spanish) 04/91 129/91
National Energy Plan (Spanish) 08/91 131/91
Private Power Generation and Transmission (English) 01/92 137/91
Natural Gas Distribution: Economics and Regulation (English) 03/92 125/92
Natural Gas Sector Policies and Issues (English and Spanish) 12/93 164/93
Household Rural Energy Strategy (English and Spanish) 01/94 162/94
Preparation of Capitalization of the Hydrocarbon Sector 12/96 191/96
Introducing Competition into the Electricity Supply Industry in Developing Countries: Lessons from Bolivia 08/00 233/00
Final Report on Operational Activities Rural Energy and Energy Effi ciency 08/00 235/00
Oil Industry Training for Indigenous People: The Bolivian Experience (English and Spanish) 09/01 244/01
Capacitación de Pueblos Indígenas en la Actividad Petrolera Fase II 07/04 290/04
Boliva-Brazil Best Practices in Mainstreaming Environmental & Social Safeguards Into Gas Pipeline Projects 07/06 322/06
Estudio Sobre Aplicaciones en Pequeña Escala de Gas Natural 07/04 291/04
Brazil Energy Effi ciency & Conservation: Strategic Partnership for Energy Effi ciency in Brazil (English) 01/95 170/95
Hydro and Thermal Power Sector Study 09/97 197/97
Rural Electrifi cation with Renewable Energy Systems in the Northeast: A Preinvestment Study 07/00 232/00
Reducing Energy Costs in Municipal Water Supply Operations “Learning-while-doing” Energy M&T on the Brazilian Frontlines 07/03 265/03
Chile Energy Sector Review (English) 08/88 7129-CH
Colombia Energy Strategy Paper (English) 12/86 ——
Power Sector Restructuring (English) 11/94 169/94
5176-LIST.pdf 207 5/19/10 1:14 PM
Honduras: Power Sector Issues and Options
208
Colombia Energy Effi ciency Report for the Commercial and Public Sector (English) 06/96 184/96
Costa Rica Energy Assessment (English and Spanish) 01/84 4655-CR
Reforma del Sector Hidrocarburos (Spanish Only) 03/06 319/06
Peru Energy Assessment (English) 01/84 4677-PE
Status Report (English) 08/85 040/85
Proposal for a Stove Dissemination Program in the Sierra (English and Spanish) 02/87 064/87
Energy Strategy (English and Spanish) 12/90 ——
Study of Energy Taxation and Liberalization of the Hydrocarbons Sector (English and Spanish) 120/93 159/93
Reform and Privatization in the Hydrocarbon Sector (English and Spanish) 07/99 216/99
Rural Electrifi cation 02/01 238/01
Saint Lucia Energy Assessment (English) 09/84 5111-SLU
St. Vincent andthe Grenadines Energy Assessment (English) 09/84 5103-STV
Sub Andean Environmental and Social Regulation of Oil and Gas Operations in Sensitive Areas of the Sub-Andean Basin (English and Spanish) 07/99 217/99
Trinidad andTobago Energy Assessment (English) 12/85 5930-TR
GLOBAL
Energy End Use Effi ciency: Research and Strategy (English) 11/89 ——
Women and Energy—A Resource Guide The International Network: Policies and Experience (English) 04/90 ——
Guidelines for Utility Customer Management and Metering (English and Spanish) 07/91 ——
Assessment of Personal Computer Models for Energy Planning in Developing Countries (English) 10/91 ——
Long-Term Gas Contracts Principles and Applications (English) 02/93 152/93
Comparative Behavior of Firms Under Public and Private Ownership (English) 05/93 155/93
Development of Regional Electric Power Networks (English) 10/94 ——
Round-table on Energy Effi ciency (English) 02/95 171/95
5176-LIST.pdf 209 5/19/10 1:14 PM
Honduras: Power Sector Issues and Options
210
Assessing Pollution Abatement Policies with a Case Study of Ankara (English) 11/95 177/95
A Synopsis of the Third Annual Round-table on Independent Power Projects: Rhetoric and Reality (English) 08/96 187/96
Rural Energy and Development Round-table (English) 05/98 202/98
A Synopsis of the Second Round-table on Energy Effi ciency: Institutional and Financial Delivery Mechanisms (English) 09/98 207/98
The Effect of a Shadow Price on Carbon Emission in the Energy Portfolio of the World Bank: A Carbon Backcasting Exercise (English) 02/99 212/99
Increasing the Effi ciency of Gas Distribution Phase 1: Case Studies and Thematic Data Sheets 07/99 218/99
Global Energy Sector Reform in Developing Countries: A Scorecard 07/99 219/99
Global Lighting Services for the Poor Phase II: Text Marketing of Small “Solar” Batteries for Rural Electrifi cation Purposes 08/99 220/99
A Review of the Renewable Energy Activities of the UNDP/ World Bank Energy Sector Management Assistance Program 1993 to 1998 11/99 223/99
Energy, Transportation and Environment: Policy Options for Environmental Improvement 12/99 224/99
Privatization, Competition and Regulation in the British Electricity Industry, With Implications for Developing Countries 02/00 226/00
Reducing the Cost of Grid Extension for Rural Electrifi cation 02/00 227/00
Undeveloped Oil and Gas Fields in the Industrializing World 02/01 239/01
Best Practice Manual: Promoting Decentralized Electrifi cation Investment 10/01 248/01
Peri-Urban Electricity Consumers—A Forgotten but Important Group: What Can We Do to Electrify Them? 10/01 249/01
Village Power 2000: Empowering People and Transforming Markets 10/01 251/01
Private Financing for Community Infrastructure 05/02 256/02
Stakeholder Involvement in Options Assessment: Promoting Dialogue in Meeting Water and Energy Needs: A Sourcebook 07/03 264/03
A Review of ESMAP’s Energy Effi ciency Portfolio 11/03 271/03
A Review of ESMAP’s Rural Energy and Renewable Energy Portfolio 04/04 280/04
ESMAP Renewable Energy and Energy Effi ciency Reports 1998–2004 (CD Only) 05/04 283/04
5176-LIST.pdf 210 5/19/10 1:14 PM
211
List of Formal Reports
Regulation of Associated Gas Flaring and Venting: A Global Overview and Lessons Learned from International Experience 08/04 285/04
ESMAP Gender in Energy Reports and Other related Information (CD Only) 11/04 288/04
ESMAP Indoor Air Pollution Reports and Other related Information (CD Only) 11/04 289/04
Energy and Poverty Reduction: Proceedings from the Global Village Energy Partnership (GVEP) Workshop on the Pre- Investment Funding, Berlin, Germany, April 23–24, 2003. 11/04 294/04
Global Village Energy Partnership (GVEP) Annual Report 2003 12/04 295/04
Energy and Poverty Reduction: Proceedings from the Global Village Energy Partnership (GVEP) Workshop on Consumer Lending and Microfi nance to Expand Access to Energy Services, Manila, Philippines, May 19–21, 2004 12/04 296/04
The Impact of Higher Oil Prices on Low Income Countries And on the Poor 03/05 299/05
Advancing Bioenergy for Sustainable Development: Guideline For Policymakers and Investors 04/05 300/05
ESMAP Rural Energy Reports 1999-2005 03/05 301/05
Renewable Energy and Energy Effi ciency Financing and Policy Network: Options Study and Proceedings of the International Forum 07/05 303/05
Implementing Power Rationing in a Sensible Way: Lessons Learned and International Best Practices 08/05 305/05
The Urban Household Energy Transition. Joint Report with RFF Press/ESMAP. ISBN 1-933115-07-6 08/05 309/05
Pioneering New Approaches in Support of Sustainable Development In the Extractive Sector: Community Development Toolkit, also Includes a CD containing Supporting Reports 10/05 310/05
Analysis of Power Projects with Private Participation Under Stress 10/05 311/05
Potential for Biofuels for Transport in Developing Countries 10/05 312/05
Experiences with Oil Funds: Institutional and Financial Aspects 06/06 321/06
Coping with Higher Oil Prices 06/06 323/06
Designing Strategies and Instruments to Address Power Projects Stress Situations 02/08 329/08
An Analytical Compendium of Institutional Frameworks for Energy Effi ciency Implementation 03/08 331/08
5176-LIST.pdf 211 5/19/10 1:14 PM
5176-LIST.pdf 212 5/19/10 1:14 PM
Energy Sector Management Assistance Program (ESMAP)
Purpose
The Energy Sector Management Assistance Program is a global knowledge and technical assistance
program administered by the World Bank and assists low-income, emerging and transition economies
to acquire know-how and increase institutional capability to secure clean, reliable, and affordable
energy services for sustainable economic development.
ESMAP’s work focuses on three global thematic energy challenges:
• Energy Security
• Poverty Reduction
• Climate Change
Governance and Operations
ESMAP is governed and funded by a Consultative Group (CG) composed of representatives of
Australia, Austria, Canada, Denmark, Finland, France, Germany, Iceland, Norway, Sweden, The
Netherlands, United Kingdom, and The World Bank Group. The ESMAP CG is chaired by a World
Bank Vice President and advised by a Technical Advisory Group of independent, international energy
experts who provide informed opinions to the CG about the purpose, strategic direction, and priori-
ties of ESMAP. The TAG also provides advice and suggestions to the CG on current and emerging
global issues in the energy sector likely to impact ESMAP’s client countries. ESMAP relies on a cadre
of engineers, energy planners, and economists from the World Bank, and from the energy and
development community at large, to conduct its activities.
Further Information
For further information or copies of project reports, please visit www.esmap.org. ESMAP can also be