HONG KONG INSTITUTE FOR MONETARY RESEARCH ® DOES THE CHINESE INTEREST RATE FOLLOW THE US INTEREST RATE? Yin-wong Cheung, Dickson Tam and Matthew S. Yiu HKIMR Working Paper No.19/2006 December 2006
Transcript
HONG KONG INSTITUTE FOR MONETARY RESEARCH
®
DOES THE CHINESE INTEREST RATE FOLLOW THE USINTEREST RATE?Yin-wong Cheung, Dickson Tam and Matthew S. Yiu
HKIMR Working Paper No.19/2006
December 2006
Working Paper No.1/ 2000
Hong Kong Institute for Monetary Research(a company incorporated with limited liability)
All rights reserved.Reproduction for educational and non-commercial purposes is permitted provided that the source is acknowledged.
The views expressed in this paper are those of the authors, and do not necessarily reflect those of the Hong Kong Institute forMonetary Research, its Council of Advisors, or the Board of Directors.
Does the Chinese Interest Rate Follow the US Interest Rate?*
Yin-wong Cheung
University of California, Santa Cruz
University of Hong Kong
Hong Kong Institute for Monetary Research
and
Dickson Tam
Hong Kong Institute for Monetary Research
and
Matthew S. Yiu
Hong Kong Institute for Monetary Research
December 2006
Abstract
One argument for floating the Chinese renminbi (RMB) is to insulate China’s monetary policy from the
US effect. However, we note that both theoretical considerations and empirical results do not offer a
definite answer on the link between exchange rate arrangement and policy dependence. We examine
the empirical relevance of the argument by analyzing the interactions between the Chinese and US
interest rates. Our empirical results, which appear robust to various assumptions of data persistence,
suggest that the US effect on the Chinese interest rate is quite weak. Apparently, even with its de facto
peg to the US dollar, China has alternative measures to retain its policy independence and de-link its
interest rates from the US rate. In other words, the argument for a flexible RMB to insulate China’s
monetary policy from the US effect is not substantiated by the observed interest rate interactions.
* The authors are grateful to Menzie Chinn, Mardi Dungey, and participants of the 2006 HKIMR conference on “InternationalFinancial Markets and the Macroeconomy” for their helpful comments and suggestions. Steven Chan provided excellentresearch assistance.
Hong Kong Institute for Monetary Research
1
1. Introduction
Building upon its successful economic story in the last two decades, China has entered the new millennium
with rapid export growth and continuing penetration into the global market. With its increasing influences,
China’s economic policy is under close scrutiny by the international community. One topic that has
attracted much attention is China’s exchange rate policy. Since 1994, China has adopted a de facto peg
to the US dollar. In the aftermath of the 1997 financial crisis, the fixed rate policy was praised for its role
in stabilizing the regional and world economy. In the recent years, however, the same de facto fixed
exchange rate policy has become the centre of a contentious controversy. Specifically, some countries,
among which the US is the most vocal one, accuse China of gaining unfair advantages by maintaining
an undervalued Renminbi (RMB) and, as a result, running a huge trade surplus and exacerbating global
imbalances, which can destabilize the global economic system.1
To resolve the global imbalance problem, China is urged to adopt a flexible exchange rate policy and
allow the RMB to appreciate. In fact, on July 21st, 2005 China re-valued its currency and announced the
policy of pegging to a basket of currencies. Even though the move was warmly, albeit cautiously,
welcomed, it does not soften the international demand for further RMB flexibility. Indeed, the behaviour
of the RMB after July 2005 is akin to a peg to the US dollar more than to a basket of diversified currencies.
There is no shortage of proposals in both the media and academia for China to reform its foreign
exchange market and policy stance.2 One argument offered by advocates of a flexible RMB is that it is
to China’s benefit to float its currency. It is based on the merits of exchange rate flexibility presented in
the long-standing debate of exchange rate regime choices.3 With a (de facto) fixed exchange rate,
China has to give up monetary policy independence and follow the policy set by the US, which is the
anchor currency country in order to maintain the pegged exchange rate. Despite its increasing integration
into the world economy, there is no apparent evidence that China and the US share common business
cycles. In the absence of similar cyclical behaviour, it is very costly for China to follow US monetary
policy.
On the other hand, a flexible currency will isolate China from external shocks and, thus, allow China to
pursue an independent monetary policy to address its own domestic economic issues. Thus, China
stands to gain policy autonomy and the associated economic benefits by improving its exchange rate
flexibility.
The relevance of the argument is, nonetheless, not beyond doubt. A natural question to ask is: Does
exchange rate flexibility allow China to pursue an independent monetary policy?
1 The estimated degree of RMB undervaluation varies with the model under consideration. Cheung, Chinn and Fujii (2005),however, point out that there is a high degree of uncertainty surrounding the estimated degree of undervaluation.
2 Some more recent examples are Eichengreen (2006), Glodstein (2004), Goodfriend and Prasad (2006), Roberts and Tyers(2003), and Williamson (2005). McKinnon (2005, 2006) and Mundell (2004) are among the few that favor RMB stability. McCallum(2004) and Schwartz (2005) represent yet another view on the issue: China, and not outside sovereignties, should determinethe complex issue of reforming its foreign exchange policy.
3 Friedman (1953) presents some classic arguments for exchange rate flexibility.
Working Paper No.19/2006
2
It is well known that the insulation property of a flexible exchange rate system can be imperfect.4 In an
dependence, which, in the current content, means that there is a one for one pass through of the US
interest rate to the Chinese domestic interest rate.5 The actual degree of pass through can be hampered
by capital controls and sterilization operations. The link between exchange rate regimes and interest
rate pass through is further complicated by the “fear of floating” phenomenon – a situation in which
countries adopt a de jure flexible system and, at the same time, restrict the variability of their exchange
rates and, thus, limit the effectiveness of exchange rate insulation property.6
Besides the “fear of floating”, there are other reasons that countries with floating rates behave like those
with exchange rates pegged to the US. For instance, countries with a substantial trade relationship with
the US may find it beneficial to follow the US lead. Further, countries can take US monetary policy as an
important input to their own policy making process if they perceive the US has a good gauge of the
economic conditions and an adept monetary policy decision process. The observed monetary policy
dependence can go beyond the extent implied by exchange rate arrangements.
The extant empirical evidence on the effect of fixing exchange rates on monetary policy dependence is
mixed. Some recent studies including Borensztein et al. (2001) and Shambaugh (2004) find that pegged
countries tend to follow their anchor currency country’s interest rates more than the non-pegged ones
and, thus, suggest that exchange rate flexibility enhances monetary policy independence. On the other
hand, Frankel (1999), Frankel et al. (2004), and Hausmann et al. (1999) find no substantial evidence of
exchange-rate-regime effects on monetary policy dependence – the interest rate pass through behaviour
is similar across countries with different exchange rate regime choices.7
Apparently, both theoretical and empirical results are ambivalent on the issue. There is not a definite
verdict that the prescription of RMB flexibility will give China an independent monetary policy.
Without the benefit of foresight, we turn our attention to a related question: Has China lost its policy
independence and is the Chinese interest rate following the US interest rate under the current de facto
pegged exchange rate arrangement? Apparently, this question has received less discussion in the debate
on RMB policy. If the current Chinese interest rate is not driven by the US rate and if the Chinese
economy is performing reasonably well, then abandoning the peg for policy independence may not be
a relevant argument. Even a causal observer will not rule out the possibility of imperfect interest rate
pass through when one takes into consideration the effects of capital restrictions (even though China’s
capital account is perceived porous), sterilization, and other possible policy measures.
4 See, for example, Corden (1985), Devereux and Engel (1999), Mussa (1979), and Salant (1977).
5 To be sure, interest rate interactions are one of the ways to infer monetary policy dependence. Linkages induced by a fixedexchange rate arrangement can also be gauged by, say, interactions between inflation (Cheung and Yuen, 2002; Ghosh et al.,1997; Quirk, 1994). Bergin and Jordà (2004), for example, use central bank issued policy rate targets to measure monetarypolicy interdependence.
6 See Calvo and Reinhart (2000) and Hausmann et al. (2001) for an explication of the “fear of floating” phenomenon. Dooley etal. (2003) assert the peg to the US dollar is part of the export-led development policy pursued by these economies.
7 Frankel et al. (2004) also reported that a floating regime offers “temporary monetary independence” in the sense that theinterest rate adjustment speed is lower under a floating regime than under a fixed regime.
Hong Kong Institute for Monetary Research
3
To shed some insights on China’s dependence on the US monetary policy, we follow, for example,
Frankel et al. (2004) and Shambaugh (2004) and infer policy dependence based on interest rate interactions
between these two countries.8 Specifically, we consider data on the Chinese one-month interbank
interest rates and US one-month Fed fund interest rates.
We anticipate the empirical study of interest rate interactions has to overcome the uncertainty about
data persistence. In general, interest rates are bounded and do not fit the description of a nonstationary
I(1) process. However, it is difficult to fix an empirical interest rate model that rejects the I(1) hypothesis.
To ensure that our inferences are robust to the assumption of data persistence, we employ different
empirical techniques that allow us to handle various possible scenarios. The empirical strategy will be
discussed in the subsequent sections.
2. Data Description
As mentioned earlier, one-month Chinese interbank interest rates and one-month US Fed fund interest
rates are used to infer the pattern of interest rate pass through.9 Arguably, there is little doubt that the
US Fed fund interest rate movements are market driven and reflect policy intentions. The Chinese
interest rate, one the other hand, may not be as well understood as the US one. Thus, we provide a brief
background description of the Chinese interbank market.
The interbank market is one component of the growing Chinese money market.10 In the early 1980s, it
was an informal market for township and village enterprises. In 1985, the market got official endorsement
and stated-owned specialized banks were allowed to participate in the lending and borrowing activities.
The major change came in January 1996. At that time, China revamped the interbank market and instituted
a unified interbank trading mechanism that responds to demand and supply conditions. Indeed, it is
perceived that the interbank market is an efficient segment of the Chinese money market and, say, the
one-month interbank rate is representative of other short-term interest rates and is an indicator of Chinese
monetary policy.11
8 Chinn and Frankel (1995) employ real interest rates to assess the impacts of US and Japanese policies on Pacific Rimeconomies.
9 The official rates set by the Fed and the People’s Bank of China are not used because these rates change only infrequentlyand, thus, are deemed not suitable for the statistical analysis adopted in the current study.
10 The other main components are the interbank bond market and the bond repo market. The description of the Chineseinterbank market is mainly drawn from Imam (2004), Li and Peng (2002), and Xie (2002).
11 The interbank lending rate ceiling was abolished. Foreign licensed banks were allowed to borrow RMB in the interbank marketafter May 1998. See Imam (2004), Li and Peng (2002), and Xie (2002) for a more detailed discussion.
Working Paper No.19/2006
4
To facilitate interpretation, we also examine the dependence of the Hong Kong one-month interbank
interest rate on the US rate. The choice of Hong Kong is driven by a few considerations. First, the
theoretical insulation property of the exchange rate arrangement can be illustrated quite clearly within
the framework of a small open economy without capital controls. The academic description of a small
open economy without capital controls, however, represents some stringent conditions in reality. Hong
Kong is a small open economy that is renowned for its laissez-faire policy, minimum government
intervention, and free capital mobility. Arguably, Hong Kong is one of the few economies that has attributes
very close to the theoretical description of a small open economy without capital controls. Thus, Hong
Kong is a good reference point in evaluating exchange rate regime effects.
Second, Hong Kong has a de facto fixed exchange rate against the US dollar since adopting a currency
board system in 1983. During the sample period under consideration, both Hong Kong and China follow
a similar de facto exchange rate arrangement.
Third, Hong Kong has significant linkages with China – at least, geographically and economically. The
close tie between these two economies helps compare the responses of their interest rates to the US
interest rate. In sum, these features make Hong Kong a good benchmark for evaluating the interest rate
interacts between China and the US.
In view of the development of the Chinese interbank market, we consider the sample period from February
1996 to April 2006. The monthly data were retrieved from Bloomberg L.P. and CEIC. Graphs of the one-
month and official discount rates are plotted in Figure 1 to Figure 3. Figure 4 contains the official rates
from the three economies. Two observations are apparent from these graphs. First, the three one-month
interest rates in general move around their respective official rates and track their movements quite well.
Thus, these market interest rates reflect the policy intentions and are suitable for studying interest rate
dependence among these economies.
Second, the Hong Kong and US official rates appear to move in tandem, as expected. During the
sample period, Hong Kong had a currency board arrangement. As a small open economy with almost
no capital controls, Hong Kong is expected to have its interest rates follow the interest rates of its
reserve currency – in this case the US dollar interest rates. While their official rates move in lockstep, the
Hong Kong and the US market interest rates diverged a few times during the 1997 Asian financial crisis
and in 1998 when the interest rate policy was used to defend the currency board arrangement. Around
2004, the Hong Kong interest rate moved away from the US interest rate for a different reason. During
that time, because of the expectations of its currency’s revaluation, Hong Kong experienced a large
influx of hot money that kept its interbank interest rates lower than the US rates.12
The Chinese and US interest rates, on the other hands, display no obvious similarities. Thus, despite
that China has a de facto peg, the Chinese interest rate does not vary along with the US one. Formal
statistical evidence on the dependence between these interest rate data is presented in the following
sections.
12 To be exact, the market expected an imminent RMB revaluation and the HK dollar will follow the RMB move.
Hong Kong Institute for Monetary Research
5
3. Preliminary Analyses
The augmented Dickey-Fuller (ADF) test is employed to assess the persistence of interest rate data. The
ADF test is based on the regression equation:
(1)
where is the generic notation of economy ’s interest rate at time for = China, Hong Kong, and the
US. is the differencing operation. Under the unit-root null hypothesis, .
Equation (1) includes both a constant and a time trend. The trend term is included to ensure the test
result does not depend on the value of (Evans and Savin, 1984). West (1987) also points out that the
ADF test is inconsistent if the process is stationary around a time trend and the trend term is not included.
The inclusion of an irrelevant trend term, on the other hand, will lower the power of the test. In fact, for
the interest rates under consideration, the trend term is only significant in a few instances. However, as
a safeguard against misleading inferences, we choose to keep the trend term in the regression and
accept a power loss. For completeness, we reported test results based on (1) with and without the trend
term.
The ADF test results from the whole sample and two non-overlapping subsamples (1996-2000 and
2000-2006) are presented in Table 1. The lag parameter was chosen to eliminate serial correlation in the
estimated residuals. The choice of the two subsamples allows us to examine whether interest rate
interactions before and after the crisis are similar.13 The results in Table 1 do not present unambiguous
evidence on interest rate persistence. While the two ADF tests do not offer strong evidence against the
unit root hypothesis for the entire sample, they give mixed results in the subsamples. Specifically, the
Hong Kong and US interest rate data reject the unit root hypothesis in the 1996-2000 subsample but
not in the second subsample. The results for the Chinese data are comparable to the other two economies
but the evidence of stationarity in the first subsample is weaker than the evidence for the other two
economies.
One can speculate that the interest rates follow a stationary process in the first subsample and a unit
root process in the second subsample period. The whole period results are driven by the data properties
of the 2000-2006 period. However, such an interpretation may not be correct. For instance, during the
first subsample, the extraordinary economic events including the crises may have masked the true
underlying interest rate dynamics.
The unit root test is notorious for its inability to offer a sharp inference to differentiate a unit root process
from a persistent but stationary one. Thus, instead of forcing a definite inference, we examine evidence
under both stationary and unit-root specifications for interest rate data. Such an approach will alleviate
the possibility that the empirical interest rate interactions are driven by the stationarity assumption.
13 We take both the 1997 and 1998 crises into consideration.
Working Paper No.19/2006
6
4. Interest Rate Dependence
The proper choice of a statistical technique to investigate interest rate interactions crucially depends on
the presence or absence of a unit root in the data. For instance, if the data contain unit roots, then a
cointegration rather than a vector autoregression setup should be used. Unfortunately, the unit root test
results do not provide an incisive inference. In view of the ambivalence, a few approaches are considered
to cover various possible scenarios. Thus, instead of betting on a specific technique, we contemplate
evidence derived from procedures that may provide the correct inferences.
4.1 Cointegration
First, we assume the interest rate data have a unit root and the cointegration framework is adopted to
investigate the empirical long-run and short-term interactions. Specifically, the Johansen approach,
which offers a unified and multivariate setting to test for the presence of cointegration is used to analyze
the interest rate data (Johansen, 1991).
Let be a 2x1 vector containing US and the Chinese (or US and Hong Kong) interest rate series. The
Johansen test for cointegration is based on the sample canonical correlations between and ,
where p is a lag parameter. To implement the test, two least squares regressions:
(2)
and
(3)
are estimated, where the ’s are constant vectors and the lag parameter p is chosen to eliminate serial
correlation in the estimated residuals. The sample canonical correlations between and , adjusting
for all intervening lags, are given by the eigenvalues, , of with respect to where
, i, j = 1,2. The trace and the maximum eigenvalue statistics are given by, respectively:
(4)
and
. (5)
The former statistic tests the hypothesis that there are at most cointegrating vectors and the latter one
tests the hypothesis of against the alternative hypothesis of cointegrating vectors. The eigenvectors
associated with and are sample estimates of the cointegrating vectors. The cointegration test
results are reported in Table 2.
Hong Kong Institute for Monetary Research
7
Quite surprising, there is very limited evidence of cointegration in these interest rate series. The null
hypothesis is marginally rejected in only one case – the Chinese and the US interest rates in the full
sample. For this case, the estimated cointegration vector is (1, 4.690) with the Chinese coefficient being
normalized to 1. The estimated vector implies that the two interest rates move in opposite directions in the
long run; a result that is not consistent with the notion that the Chinese interest rate follows the US rate.
Thus, we do not consider it as an evidence of the dependence of the Chinese interest rate on the US rate.
One possible explanation of the negative result is that the data are noisy and, thus, make it difficult to
reject the null hypothesis of no cointegration. One way to improve the test performance is to impose the
theoretical relationship on the data. Theoretically, under a fixed exchange rate arrangement, the
dominating economy should dictate the common interest rate movement. In the current context, it
means the interest rates in China and Hong Kong should equal the interest rates in the US, apart from,
say, a risk premium. Assuming that the risk premium is stationary, the three interest rate series should
move one to one in the long run. Thus, we impose the (1, -1) restriction and examine the stationarity of
interest rate differentials between the US interest rates and the other two interest rate series.
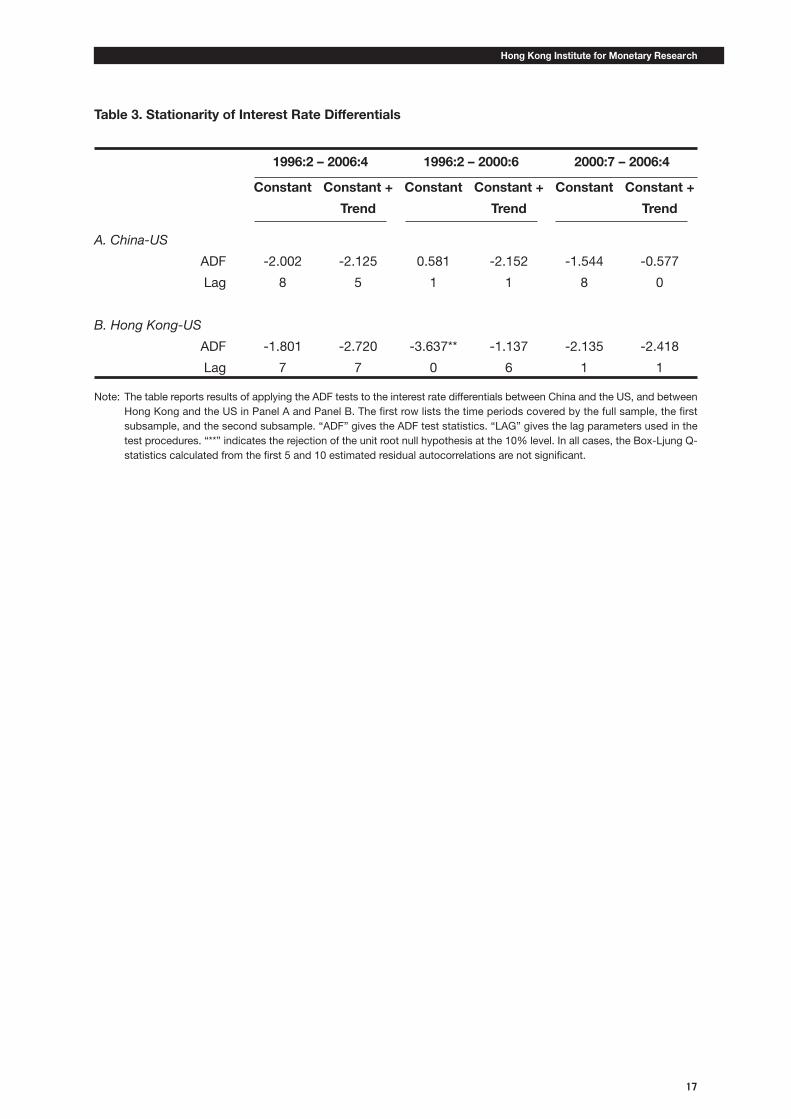
The results of testing for the stationarity of interest rate differentials are presented in Table 3. There is
only one case in which there is evidence of a stationary interest rate differential series. The ADF test
suggests that the Hong Kong and US interest rate differential is stationary between 1996 and 2000.
In sum, there is only very weak evidence of long-run interest rate interactions between China and the
US. There is a caveat: the validity of these results depends on whether the interest rate series are
stationary or follow a unit root process.
4.2 Vector Autoregression
In this subsection, we consider a few additional specifications for studying interest rate interactions.
Specifically, three variants of the vector autoregression (VAR) model are considered:
, (7)
, (8)
and
. (9)
The three equations have different implicit assumptions about interest rate dynamics. Equations (7) and
(8) implicitly assume the interest rate data are stationary around a constant and around a time trend,
respectively. Equation (9) accounts for the case in which the data are difference stationary but are not
cointegrated; see Shambaugh (2004).
The Wald-type causality test based on exclusion restrictions under the VAR framework is employed to
investigate interest rate interactions between the three economies. Four different null hypotheses are
Working Paper No.19/2006
8
considered. They are a) the US interest rate does not cause the Chinese interest rate, b) the Chinese
interest rate does not cause the US interest rate, c) the US interest rate does not cause the Hong Kong
interest rate, d) the Hong Kong interest rate does not cause the US interest rate. Given the de facto
exchange rate arrangements and the dominance of the US, one expects the test will reject the null
hypotheses (a) and (c) but not (b) and (d).
The causality test results are summarized in Table 4. For the China and US pair, the results vary across
the three VAR specifications and sample periods. The evidence of the US interest rate affecting the
Chinese interest rate, in general, is not strong. Instead, there are non-negligible signs that the US interest
rate is influenced by the Chinese interest rate – a result that is not expected from traditional
considerations.14
For the entire sample, the statistics strongly reject the hypothesis that the Chinese interest rate does not
Granger cause the US interest rate in all the three VAR models – these statistics have a p-value less than
1%. The significant China effect seems contradictory to the conventional argument. On the other hand,
the US effect on China is relatively weak – the hypothesis that the US interest rate does not cause the
Chinese interest rate is only rejected at the 8.8% level under specification (7), at the 9.2% level under
(8), and at the 11.2% level under (9). The most one can infer from these results is that the evidence
points to feedback between the two interest rates but China’s effect on the US is more significant that
the US effect on China.
For the subsample 1996 to 2000, there is no evidence that the US is causing the Chinese interest rate.
China, on the other hand, appears to have had a significant impact on the US interest rate under all the
three specifications, with the statistics having p-values of less than 1%. The results for the 2000-2006
subsample are mostly insignificant. The only significant case is found under specification (7) in which
the hypothesis that the US does not cause China’s interest rate is rejected at the 6.3% level. There is no
evidence that China influenced US interest rates during this period. The results in the first and second
subsamples are not consistent with the common belief that China is increasingly integrated with the
global economy and its influence on the world is growing in the new millennium.
The full sample results pertaining to the Hong Kong and US pair are largely in line with the US dominance
story. The statistics underscore the US influence on the Hong Kong interest rate. In all the three VAR
models, the hypothesis that the US interest rate does not cause the Hong Kong interest rate is soundly
rejected. Hong Kong, on the other hand, is found not to affect the US interest rate. The result is in
accordance with the conventional wisdom that the Hong Kong interest rate should follow the US one
because it is a small open economy with capital mobility and is pegged its currency to a large US
economy.
14 While we do not necessarily subscribe to it, there is a view that the US interest rate is affected by China’s policy. For instance,consider the “revived Bretton Woods system” interpretation (Dooley et al., 2003; 2005). China maintains a low currency valueto promote exports and, hence, economic growth. It invests its accumulated dollar surpluses in, say US treasuries and, keepsthe US interest rate at a low level.
Hong Kong Institute for Monetary Research
9
The two subsamples, however, give a different picture on the causal relationship between the Hong
Kong and the US interest rates. There is evidence of no causality in both directions in the first subsample
that covers 1996 to 2000 – the US does not affect Hong Kong and vice versa. The effect of the US on
Hong Kong interest rates shows up in the sample spanning 2000 to 2006. During that period, the
hypothesis that the US does not cause Hong Kong interest rates is rejected at the 2.4% level or lower.
Interestingly, Hong Kong is found to not affect the US at the 5% level but to affect the US at the 10%
level. Thus, the Hong Kong effect is detected in the second subsample but not in the whole sample.
Since the sample size is smaller in the second subsample, the results are likely to be driven by some
period-specific factors and not by the power argument.
Overall, the China and US interest rate interactions revealed by the VAR results are not easily explained
by conventional considerations. Specifically, the finding of the weak US effect on China and the significant
China effect on the US is not in line with the argument that China loses its monetary policy independence
under the de facto fixed exchange rate policy.
The Hong Kong and US results, on the other hand, are a little bit more comforting. They point to the big
economy effect on a small open economy Hong Kong. Nonetheless, it is still puzzling to observe the
Hong Kong effect on the US.
One observation is that, within each sample period, the causality results are relatively similar among the
three VAR specifications, which encompass several assumptions of interest rate dynamics. Thus, the
observed limited US effect on Chinese interest rates is not likely due to the model and the related
assumed data dynamics.
4.3 The PSS Bounds Test
The validity of the inferences presented in the previous two subsections depends on the stationarity
assumption – the data included in the model are assumed to have the same degree of integration.
Recently, Pesaran, Shin and Smith (2001) proposed a procedure to detect the dependence of one
variable on the others that is robust to the stationarity assumption. We call the test the PSS bounds test.
In the current context, the PSS bounds test for testing the dependence between Chinese and US
interest rates is based on the following autoregressive distributed lag model of order ( ):
, (10)
where and are, respectively, the Chinese and the US interest rates. Under the null hypothesis of
= = 0, there is no relationship between Chinese and US interest rates. As suggested by Pesaran,
Shin and Smith (2001), we use a flexible dynamic specification and do not restrict changes in Chinese
and US interest rates to have the same lag structure.
One important assumption underlying the test is that the Chinese level variable does not cause the
US level variable . Thus, the test implicitly imposes a conditional relationship between the two
variables. It, however, does not preclude the possibility that changes in ( ’s) are affected by
changes in ( ’s). The assumption may appear innocuous given the prominence of the US in
Working Paper No.19/2006
10
both the international financial market and the global economy. To shed some light on the assumption,
we will apply the PSS bounds test to an alternative specification later in this subsection.
Pesaran, Shin and Smith (2001) derive critical value bounds based on two sets of distribution functions
to cover cases in which the right-hand-side variables in (10) are individually trend or individually difference
stationary. Thus, the price for the robustness is the possibility of an inconclusive inference if the test
statistic falls within the bounds.15 For the Hong Kong and US interest rates, their interactions are
investigated with the Hong Kong data replacing the Chinese data in (10).
The PSS bounds test results for the Chinese data are presented in Table 5. To facilitate discussion,
estimates of (10) are also included. The lag parameters p and q are chosen to render insignificant serial
correlation in the estimated residuals. Only significant lagged differences are reported for brevity.
The F-statistics for the null hypothesis of = = 0 are listed in the last row of the Table. According to
the critical values tabulated in Pesaran, Shin and Smith (2001) the bounds test statistics are not significant
for the three samples under consideration. There is no evidence of the presence of a level relationship and
the US impact on the Chinese interest rate. It is noted that the test results based on a less stringent
assumption on data dynamics corroborate the cointegration results reported in the previous subsection.
Despite the absence of a level relationship, estimates of (10) show that changes in the Chinese interest
rates respond to variations in the US interest rates. The US effect is, however, only revealed in the full
sample but not in the two subsamples. Further, changes in the US rates have an overall negative effect
on the Chinese rates in the entire sample. The negativity result, again, does not lend strong support to
the contention that China’s policy follows the US policy.
The bounds test and the associated regression results for the Hong Kong specification are given in
Table 6. The adjusted R-squares in Table 6 range from 70% to 47%, which are higher than the range of
43% to 14% reported in Table 5. Apparently, the autoregressive distributed lag ( ) model (10) fits the
Hong Kong data better than the Chinese data. It is interesting to note that, in both cases, the second
subsample gives the lowest adjusted R-squares.
There are a few observations from Table 6. First, using the appropriate bounds test critical values, the F-
statistic rejects the hypothesis of = = 0 in the full sample and the first subsample. Second, the
and estimates are similar in magnitudes but different in their signs during the full sample and the
second subsample. Third, changes in the US interest rate have almost a one to one impact on changes
in the Hong Kong interest rate in the full sample and first subsample. Fourth, even the F-statistic does
not reject the null hypothesis, the second to fourth observations hold for the second subsample.
While the results are not uniformly confirmative, the observations listed above are indicative of the
presence of the US effect and the dependence of the Hong Kong interest rate on the US rate. Further,
in comparing results in Tables 5 and 6, we observe that the US effect on Hong Kong is more prominent
than on China.
15 The exact critical value can be derived with information about the stationarity of the explanatory variables. The situation issimilar to the use of Durbin-Watson statistic – the exact distribution of the statistic depends on information about the explanatoryvariables.
Hong Kong Institute for Monetary Research
11
Tables 7 and 8 give the bounds test and regression results pertaining to the specification
, (11)
where = China and Hong Kong. Similar to the remark made for (10), if we apply the PSS bounds test
to (11) to infer the level relationship between the US and, say, the Hong Kong interest rates, we implicitly
assume that the US interest rate does not cause the Hong Kong rate . Knowing that this may
not be a viable assumption, we do not literally interpret the statistics reported in the table but, rather,
treat them as preliminary results that are indicative of interest rate interactions.
One observation from both Tables 7 and 8 is that all the differences between Chinese and Hong Kong
interest rates are not significant and, thus, not reported. That is, the variations of the US interest rate
respond neither to the Chinese nor Hong Kong interest rate changes. While two bounds test statistics in
Table 7 and one statistic in Table 8 are significant, the lagged levels of the Chinese and Hong Kong
rates; and , do not appear significant. Even with the reservation about inference stated in the
previous graph, the two tables offer some heuristic evidence that the US interest rate is dependent of
the Chinese or Hong Kong interest rate.
5. Concluding Remarks
In this exercise, we examine one argument put forth in the recent debate on China’s exchange rate
policy. Specifically, we consider the assertion that a flexible RMB exchange rate is beneficial to China
because exchange rate flexibility offers policy independence and allows China to pursue its own monetary
policy to tackle domestic economic issues.
Our exercise does not predict whether a flexible RMB exchange rate will enhance China’s policy autonomy.
Instead, we investigate the degree of dependence under the existing de facto pegged exchange rate
arrangement via interest rate pass through between the two economies. The interaction between Hong
Kong and US interest rates is used as a benchmark for comparison. In general, the empirical evidence
of the US effect on the Chinese interest rate is quite weak while the US interest rate pass through is
quite strong for Hong Kong. Indeed, there are instances in which the statistical evidence is suggestive
of the pass through of Chinese interest rates to the US interest rate.
One feature of the current study is that interest rate interactions are examined under several possible
scenarios. The general inference of weak US effects on Chinese interest rates is drawn from a range of
models and techniques that allow for different assumptions of data persistence and from a few historical
periods. In other words, the result is not driven by a specific choice of model specification. The robustness
of the finding casts serious doubt on the relevance of the argument that the existing de facto exchange
rate arrangement ties China’s policy to US policy. Even with the current de facto fixed exchange rate
arrangement, there is no substantial evidence that the Chinese interest rate is driven by the US rate.
It is important to point out that the empirical evidence does not rule out the possible dependence of
Chinese policy on US policy. However, it indicates China has alternative measures to de-link its interest
Working Paper No.19/2006
12
rates from the US rate. The goal of China’s monetary policy is to “preserve the value of (its) currency and
promote economic growth”.16 China has a number of policy measures to manage its domestic economy.
They include interest rate adjustment, reserve requirement, and open market operations. Capital control
is the often cited policy that shields China from external financial disturbances. It is perceived that the
de jure capital control is much less effective than the de facto regulation. Nonetheless, the latter can be
proved important at the time of crisis in managing capital flows. Last, but not least, official guidelines
still are an important element of the conduit of monetary policy despite the recent reduction of direct
government intervention.
It is quite obvious that the Chinese authorities have been experimenting with these policy options to
manage its economy. There are signs that China has increased the reign of market mechanisms. For
instance, the changes in official interest rates that occurred in 2005 and 2006 are widely interpreted as
signs of assigning a bigger role for interest rates in macroeconomic management.
One indicator of China’s ability to manage its economy is its economic performance after 1994, the
year that the RMB adopted the de facto peg. In the post-1994 era – including the Asian financial crisis
period – China has enjoyed relatively stable inflation and strong economic growth. Apparently, China is
able to deploy various policy measures to keep its economy under control and avoid major fiascos with
the de facto peg in place. Nonetheless, it implies neither that there is no (substantial) cost in maintaining
the peg with the US dollar nor that macro management is free of troubles.
The point is, given the current economic reality, whether it is the right time for China to exit from the
current exchange rate system that has worked quite well in the last decade. Given China’s increasing
influence, a badly-timed exit from the pegged RMB policy may create adverse rippling effects in the
international community. Undeniably, China faces some very complex problems. It is not our objective
here to elaborate on various arguments for China to maintain the status quo of its exchange rate system.17
Instead, our exercise, at the risk of repeating ourselves, indicates that the argument for a flexible RMB
to insulate China’s monetary policy from the US effect is not substantiated by the observed interest rate
interactions.
Conceivably, there is antagonism towards the statistical evidence of the absence of China’s policy
dependence. Our intention is not to divert the discussion of RMB policy to a pure statistical analysis.
Instead, it is our intention to provide a reasonably robust empirical evidence to facilitate the discussion
of policy dependence or the absence of it. We recognize the possible disconnect between statistical
results and economic reality. Given the ambivalent theoretical and empirical results on the exchange
rate regime effect on policy dependence and our findings of weak US effects on China’s interest rates,
it seems prudential to be circumspect in asserting the benefit of policy independence from floating
RMB.
16 Dai (2002).
17 One practical view is to take full RMB convertibility as medium to long-term policy objective. Some commonly mentionedpreconditions for the RMB to exit from the peg include reforms in the financial sector and in the setting of monetary and policies.It is also perceived that some obstacles to liberalizing the exchange rate arrangement are the high level of non-performing loanin the banking industry, the lack of corporate governance, and rigidities in the labor market. In sum, there is substantial risk inliberalizing the RMB before China’s economy has established a sound financial sector and capital market and reduced impedimentsin the real sector.
Hong Kong Institute for Monetary Research
13
References
Bergin, Paul R. and Òscar Jordà (2004), “Measuring monetary policy interdependence,” Journal of
International Money and Finance, 23: 761-83.
Borensztein, Eduardo, Jeromin Zettelmeyer and Thomas Philippon (2001), “Monetary Independence in
Emerging Markets: Does the Exchange Rate Regime Make a Difference?” IMF Working Paper No.
01/1, Washington D.C.: International Monetary Fund.
Calvo, Guillermo and Carmen Reinhart (2002), “Fear of Floating,” Quarterly Journal of Economics, 117:
379-408.
Cheung, Yin-Wong and Jude Yuen (2002), “Effects of U.S. inflation on Hong Kong and Singapore,”
Journal of Comparative Economics, 30: 603-19.
Cheung, Yin-Wong, Menzie D. Chinn and Eiji Fujii (2005) “Why the Renminbi Might be Overvalued (But
Probably Isn’t),” manuscript, UCSC.
Cheung, Yin-Wong and Kon S. Lai (1995), “Lag Order and Critical Values of the Augmented Dickey-
Fuller Test,” Journal of Business & Economic Statistics, 13: 277-80.
Cheung, Yin-Wong and Kon S. Lai (1995), “Finite-Sample Sizes of Johansen’s Likelihood Ratio Tests for
Cointegration,” Oxford Bulletin of Economics and Statistics, 55: 313-28.
Chinn, Menzie and Jeffrey A. Frankel (1995) “Who Drives Real Interest Rates around the Pacific Rim:
The US or Japan?” Journal of International Money and Finance, 14: 801-21.
Corden, Max W. (1985), Inflation Exchange Rates and the World Economy, Oxford: Clarendon Press.
Dai, Xianglong (2004), “China’s Monetary Policy in the Coming Years,” Speech given at the Bank of
China Forum, March 16, 2002, Beijing.
Devereux, Michael B. and Charles Engel (1999), “Fixed vs. Floating Exchange Rates: How Price Setting
Affects the Optimal Choice of Exchange-Rate Regime,” NBER Working Paper No. 6867, Cambridge
MA: National Bureau of Economic Research.
Dooley, Michael, David Folkerts-Landau and Peter Garber (2003), “An Essay on the Revived Bretton
Woods System,” NBER Working Paper No. 9971, Cambridge MA: National Bureau of Economic
Research.
Dooley, Michael, David Folkerts-Landau and Peter Garber (2005), International Financial Stability: Asia,
Interest Rates, and the Dollar, Deutsche Bank Global Research.
Eichengreen, Barry (2006), “China’s Exchange Rate Regime: The Long and Short of It,” manuscript,
University of California Berkeley.
Working Paper No.19/2006
14
Evans, G.B.A. and Savin, N.E. (1984), “Testing for unit roots: 2,” Econometrica, 52: 1241-69.
Frankel, Jeffrey A. (1999), “No Single Currency Regime is Right for All Countries or at All Times,” NBER
Working Paper No. 7338, Cambridge MA: National Bureau of Economic Research.
Frankel, Jeffery A., Sergio L. Schmukler and Luis Serven (2004), “Global Transmission of Interest Rates:
Monetary Independence and Currency Regime,” Journal of International Money and Finance,
23: 701-34.
Friedman, Milton (1953), “The Case for Flexible Exchange Rates,” in Milton Friedman, eds., Essays in
Positive Economics, Chicago: University of Chicago Press. 157-203.
Ghosh, Atish R., Anne-Marie Gulde, Jonathan D. Ostry and Holger C. Wolf (1997), “Does the Nominal
Exchange Rate Regime Matter?” NBER Working Paper No. 5874, Cambridge MA: National Bureau
of Economic Research.
Goldstein, Morris (2004), “Adjusting China’s Exchange Rate Policies,” manuscript, Institute for International
Economcis.
Goodfriend, Marvin and Eswar Prasad (2006), “A Framework for Independent Monetary Policy in China,”
IMF Working Paper No. 06/11, Washington D.C.: International Monetary Fund.
Hausmann, Ricardo, Michael Gavin, Carmen Pages-Serra and Ernesto Stein (1999), “Financial Turmoil
and the Choice of Exchange Rate Regime,” Inter-American Development Bank, Research
Department Working Paper No. 400.
Hausmann, Ricardo, Ugo Panizza and Ernesto Stein (2001), “Why Do Countries Float the Way They
Float?” Journal of Development Economics, 66: 387-414.
Imam, Michael (2004), “The Chinese Interbank Markets: Cornerstone of Financial Liberalization,” China
& the World Economy, 12: 17-33.
Johansen, Soren (1991), “Estimation and hypothesis testing of cointegration vectors in Gaussian vector
Note: The table reports results of applying the ADF tests to the Chinese, Hong Kong, and the US interest rates in Panel A, PanelB, and Panel C. The first row lists the time periods covered by the full sample, the first subsample, and the secondsubsample. “ADF” gives the ADF test statistics. “LAG” gives the lag parameters used in the test procedures. “*” and “**”indicate the rejection of the unit root null hypothesis at the 5% and 10% level, respectively. The Cheung and Lai (1995) finitesample critical values are used. In all cases, the Box-Ljung Q-statistics calculated from the first 5 and 10 estimated residualautocorrelations are not significant.
Table 2. Cointegration Test Results
1996:2 – 2006:4 1996:2 – 2000:6 2000:7 – 2006:4
EIGENV TRACE EIGENV TRACE EIGENV TRACE
A. China/US
r=1 6.1668 6.1668 0.1763 0.1763 2.5143 2.5143
r=0 12.7248 18.8916 2.3018 2.4781 9.1555 11.6698
B. Hong Kong/US
r=1 2.2839 2.2839 0.0437 0.0437 4.1058 4.1058
r=0 9.4839 11.7679 8.9298 8.9736 6.5875 10.6932
Note: The results of testing for cointegration between the Chinese and the US and between the Hong Kong and the US interestrates are reported in Panel A and B. The first row lists the time periods covered by the full sample, the first subsample, andthe second subsample. Eigenvalue and trace statistics are given under the columns “EIGENV” and “TRACE.” “r=0”corresponds to the null hypothesis of no cointegration and “r=1” corresponds to the hypothesis of one cointegrationvector. The no-cointegration null is not rejected in all cases. The Cheung and Lai (1993) finite sample critical values areused. In all cases, the lag parameter used is selected using information criteria and the resulting Box-Ljung Q-statisticscalculated from the first 5 and 10 estimated residual autocorrelations are not significant.
Hong Kong Institute for Monetary Research
17
Table 3. Stationarity of Interest Rate Differentials
Note: The table reports results of applying the ADF tests to the interest rate differentials between China and the US, and betweenHong Kong and the US in Panel A and Panel B. The first row lists the time periods covered by the full sample, the firstsubsample, and the second subsample. “ADF” gives the ADF test statistics. “LAG” gives the lag parameters used in thetest procedures. “**” indicates the rejection of the unit root null hypothesis at the 10% level. In all cases, the Box-Ljung Q-statistics calculated from the first 5 and 10 estimated residual autocorrelations are not significant.
Working Paper No.19/2006
18
Table 4. Causality Test Results from Vector Autoregression Specifications
US does not China does not US does not HK does not
cause China cause US cause HK cause US
Lag Lag
A. 1996:2 – 2006:4
Model (7) 12.393 51.9567
24.781 7.026 8
(0.088) (0.000) (0.002) (0.534)
Model (8) 12.265 50.8627
27.822 6.534 8
(0.092) (0.000) (0.001) (0.588)
Model (9) 8.924 40.7415
6.773 6.118 6
(0.112) (0.000) (0.010) (0.410)
B. 1996:2 – 2000:6
Model (7) 0.177 19.7252
0.262 0.214 1
(0.915) (0.000) (0.609) (0.643)
Model (8) 9.662 33.5828
0.379 0.012 1
(0.290) (0.000) (0.538) (0.912)
Model (9) 0.144 17.8561
0.279 0.245 1
(0.704) (0.000) (0.597) (0.621)
C. 2000:7 – 2006:4
Model (7) 5.545 2.5022
13.327 4.702 2
(0.063) (0.286) (0.001) (0.095)
Model (8) 2.802 0.3102
7.470 5.454 2
(0.246) (0.856) (0.024) (0.065)
Model (9) 2.525 0.0341
9.180 3.343 1
(0.112) (0.854) (0.002) (0.068)
Note: The causality test statistics calculated from models (7), (8), and (9) are reported. The null hypotheses are listed in the firstrow. The lag parameters selected for the VAR models are given under column labeled “Lag.” Panels A, B, and C give resultsfrom the full sample, the first subsample and the second subsample, respectively. P-values are included in parenthesesunderneath the statistics.
Hong Kong Institute for Monetary Research
19
Table 5. Bounds Tests on the Dependence of the Chinese Interest Rates
2/1996 – 4/2006 2/1996 – 6/2000 7/2000 – 4/2006
Constant 0.107 0.279 0.216
(1.015) (0.147) (1.109)
-0.052* -0.018 -0.088
(-2.719) (-0.430) (-1.294)
-0.002 -0.087 0.001
(-0.062) (-0.263) (0.072)
-0.583* -0.659* -0.228*
(-6.574) (-4.194) (-2.055)
-0.184* -0.269 –
(-2.049) (-1.768)
0.143 – –
(1.828)
– – -0.119
(-1.727)
0.183* 0.460* –
(2.301) (2.557)
-0.440 – –
(-1.970)
Adjusted 0.395 0.425 0.144
F-statistic 5.110 0.114 0.846
Note: The PSS bounds test results with the change in the Chinese interest rate as the dependent variable are reported. The firstrow lists the time periods covered by the full sample, the first subsample, and the second subsample. The row labelled
“F-statistic” gives the statistics for testing the hypothesis that both the coefficients of and are zero (that is,
the hypothesis of = = 0). The upper bound of the 5% critical value is 5.73 for the three sample periods.
Working Paper No.19/2006
20
Table 6. Bounds Tests on the Dependence of the Hong Kong Interest Rates
2/1996 – 4/2006 2/1996 – 6/2000 7/2000 – 4/2006
Constant -0.188 – -0.110
(-1.874) (-1.776)
-0.265* -0.395* -0.121*
(-6.328) (-4.684) (-2.086)
0.298* 0.429* 0.136*
(5.304) (4.256) (2.282)
0.128* 0.210* –
(2.393) (2.282)
0.168* 0.231* –
(3.065) (2.486)
-0.251* – –
(-3.273)
– – -0.169*
(-2.013)
1.074* 1.078* 0.931*
(5.198) (2.129) (6.270)
0.792 0.809 0.471
F test 20.851 12.394 2.661
Note: The PSS bounds test results with the change in the Hong Kong interest rate as the dependent variable are reported. Thefirst row lists the time periods covered by the full sample, the first subsample, and the second subsample. The row labelled“F-statistic” gives the statistics for testing the hypothesis that both the coefficients of and are zero (that is,the hypothesis of = = 0). The upper bound of the 5% critical value is 5.73 for the three sample periods. Asignificant 1997 financial crisis dummy variable is included in the full sample and first subsample.
Hong Kong Institute for Monetary Research
21
Table 7. Bounds Tests on the Dependence of the US Interest Rates (on the Chinese Rates)
2/1996 – 4/2006 2/1996 – 6/2000 7/2000 – 4/2006
Constant 0.047 1.242* 0.185
(1.176) (3.293) (1.663)
0.004 -0.013 -0.027
(0.550) (-1.826) (-0.697)
-0.017 -0.205* -0.040*
(-1.522) (-2.894) (-3.830)
0.419* 0.310* 0.467*
(4.830) (2.601) (4.967)
– 0.387* –
(3.267)
0.208* 0.413* –
(2.500) (3.676)
– 0.253* 0.293*
(2.438) (3.103)
– 0.322* –
(3.471)
0.473* 1.410* 0.175*
(5.575) (10.178) (2.313)
-0.393* – –
(-4.376)
Adjusted 0.409 0.782 0.600
F-statistic 1.216 7.676 7.481
Note: The PSS bounds test results with the change in the US interest rate as the dependent variable are reported. The first rowlists the time periods covered by the full sample, the first subsample, and the second subsample. The row labelled “F-statistic” gives the statistics for testing the hypothesis that both the coefficients of and are zero (that is, thehypothesis of = = 0). The upper bound of the 5% critical value is 5.73 for the three sample periods.
Working Paper No.19/2006
22
Table 8. Bounds Tests on the Dependence of the US Interest Rates (on the Hong Kong Rates)
2/1996 – 4/2006 2/1996 – 6/2000 7/2000 – 4/2006
Constant 0.059 0.409 0.104*
(1.382) (1.156) (2.625)
0.007 -0.009 -0.013
(0.475) (-0.714) (-0.371)
-0.022 -0.061 -0.027
(-1.076) (-0.882) (-0.724)
0.425* 0.556* 0.476*
(4.895) (3.283) (5.107)
0.203* – –
(2.465)
– – 0.302*
(3.223)
0.471* 1.163* 0.173*
(5.567) (8.233) 2.242
-0.392* -0.957* –
(-4.336) (-4.177)
Adjusted 0.408 0.722 0.598
F-statistic 1.177 1.066 7.268
Note: The bounds test results with the change in the US interest rate as the dependent variable are reported. The first row lists thetime periods covered by the full sample, the first subsample, and the second subsample. The row labelled “F-statistic”gives the statistics for testing the hypothesis that both the coefficients of and are zero (that is, the hypothesisof = = 0). The upper bound of the 5% critical value is 5.73 for the three sample periods.
Hong Kong Institute for Monetary Research
23
Figure 1. The Chinese one-month interbank rate and official discount rate