Page 1
P 2 3 4 5 6 7 8 9 10 11 12 13
Species 15-30 31-45 46-60 61-75 76-90 91-105 106-120 121-135 136-150 above 150 Sr.
No
Division Type of forest
Khair 0.052 0.052 0.156 0.348 0.517 0.73 0.93 1.13 1.32 1.32 Nashik District Misc.
Haldu 0.075 0.075 0.148 0.269 0.45 0.683 1 1.372 1.75 1.75 Nashik District Misc.
Dhawada 0.906 0.906 1.333 1.705 2.126 2.917 3.131 3.4 3.9 3.9 Nashik District Misc.
Glyricidia 0.021 0.021 0.085 0.2 0.375 0.593 0.88 1.393 1.84 1.84 Nashik District Misc.
Sawar 0.021 0.021 0.085 0.2 0.375 0.593 0.88 1.393 1.84 1.84 Nashik District Misc.
Asana 0.045 0.045 0.134 0.248 0.476 0.552 0.9 1.205 1.495 1.495 Nashik District Misc.
Shisam 0.059 0.059 0.148 0.331 0.515 0.695 0.875 1.06 1.24 1.24 Nashik District Misc.
Tendu 0.053 0.053 0.195 0.33 0.469 0.615 0.75 0.89 1.035 1.035 Nashik District Misc.
Kakad 0.056 0.056 0.164 0.255 0.402 0.524 0.8 1.083 1.45 1.45 Nashik District Misc.
Lendia 0.076 0.076 0.183 0.325 0.52 0.786 1.075 1.375 1.665 1.665 Nashik District Misc.
Bondara 0.076 0.076 0.183 0.325 0.52 0.786 1.075 1.375 1.665 1.665 Nashik District Misc.
Mode 0.039 0.039 0.11 0.214 0.376 0.552 0.827 1.125 1.45 1.45 Nashik District Misc.
Mundi 0.057 0.057 0.11 0.207 0.421 0.572 0.825 1.175 1.675 1.675 Nashik District Misc.
Bibla 0.028 0.028 0.125 0.262 0.448 0.725 1.025 1.365 1.71 1.71 Nashik District Misc.
Teak 0.025 0.025 0.117 0.341 0.46 0.71 1.021 1.375 1.78 1.78 Nashik District Misc.
Behada 0.09 0.09 0.162 0.393 0.493 0.662 1.025 1.345 1.71 1.71 Nashik District Misc.
Saja 0.051 0.051 0.152 0.324 0.527 0.752 0.994 1.483 2.51 2.51 Nashik District Misc.
Kuda 0.052 0.052 0.12 0.211 0.324 0.469 0.725 1.07 1.675 1.675 Nashik District Misc.
Others 0.105 0.105 0.215 0.373 0.556 0.784 1.049 1.365 1.763 1.763 Nashik District Misc.
The Volume conversion factor for Dhawada Specie is high as compared to all other species. As per the instructions given by Forest Statistician, for Dhawada VCF of others are used
Volume in cum. for Girthclass in cms
Page 2
Working Circle : Afforestation W.C. Division :Hingoli Population area (ha): 10128.347
Period of Enumeration : 2013-14 Sample area (ha): 108.000
Working Plan by :- Shri V.J. Warvantkar, I.F.S. Intensity of sampling (%): 1.07
Volume
15U30
Volume
31U45
Volume
46U60
Volume
61U75
Volume
76U90
Volume
91U105
Volume
106U120
Volume
121U135
Volume
136U150
Volume
Above 150
Total
Lendia 0.049 0.013 0.002 0 0 0 0 0 0 0 0.064
Teak 0.041 0.036 0.021 0.019 0.021 0.013 0.019 0.012 0.016 0 0.198
Total 0.090 0.049 0.023 0.019 0.021 0.013 0.019 0.012 0.016 0.000 0.262
Dhawada 0.066 0.026 0.01 0.003 0 0 0 0 0 0 0.105
Hiwar 0.136 0.107 0.004 0 0 0.007 0 0 0 0 0.254
Karai 0 0.001 0 0 0 0 0 0 0 0 0.001
Khair 0.001 0 0 0 0 0 0 0 0 0 0.001
Moin 0.028 0.015 0.006 0.024 0.011 0 0 0 0.016 0.016 0.116
Salai 0.01 0 0.002 0 0 0 0 0 0 0 0.012
Total 0.241 0.149 0.022 0.027 0.011 0.007 0.000 0.000 0.016 0.016 0.489
Awala 0.035 0.002 0.002 0 0 0 0 0 0 0.016 0.055
Behada 0.002 0.003 0.001 0 0 0 0 0 0 0 0.006
Biba 0.002 0 0 0 0 0 0 0 0 0 0.002
Bor 0.002 0 0 0 0 0 0 0 0 0 0.002
Charoli 0.002 0.002 0 0 0 0 0 0 0 0 0.004
Moha 0.001 0 0.002 0.003 0 0 0 0 0 0.016 0.022
Neem 0.147 0.1 0.219 0.269 0.021 0.051 0.029 0.038 0 0.033 0.907
Palas 0.732 0.301 0.603 0.698 0.041 0.029 0.068 0.076 0 0 2.548
Sitafal 0.002 0 0 0 0 0 0 0 0 0 0.002
Tendu 0.083 0.009 0.007 0.003 0 0 0 0 0 0 0.102
Total 1.008 0.417 0.834 0.973 0.062 0.080 0.097 0.114 0.000 0.065 3.650
Group C :- Species of Minor Forest Produce
STATEMENT -V
Estimated growing stock : Volume in cum. Per Ha.
Group/
SpeciesGirth classwise classification in cms
Group A :- Species of General Utility
Group B :- Species of Special Utility
Page 3
Volume
15U30
Volume
31U45
Volume
46U60
Volume
61U75
Volume
76U90
Volume
91U105
Volume
106U120
Volume
121U135
Volume
136U150
Volume
Above 150
Total
Group/
SpeciesGirth classwise classification in cms
Anjan 0 0 0 0 0.463 0 0 1.643 0 0 2.106
Babhul 0.021 0 0 0 0 0 0 0 0 0 0.021
Bahala 0.063 0.002 0 0 0 0 0 0 0 0 0.065
Bartondi 0.023 0 0 0 0 0 0 0 0 0 0.023
Chinchora 0.003 0.002 0.002 0.01 0 0 0 0 0 0 0.017
Dhamoda 0.029 0 0 0 0 0 0 0 0 0 0.029
Dudhi 0.045 0.009 0.004 0.007 0.005 0 0 0 0 0 0.070
Glyricidia 0.043 0 0 0 0 0 0 0 0 0 0.043
Henkal 0.014 0.002 0 0 0 0 0 0 0 0 0.016
Lokhandi 0.025 0 0 0 0 0 0 0 0 0 0.025
Medsheng 0.021 0.002 0 0 0 0 0 0 0 0 0.023
Others 0.016 0.005 0.002 0.003 0.005 0.007 0 0 0 0.016 0.054
Total 0.303 0.022 0.008 0.020 0.473 0.007 0.000 1.643 0.000 0.016 2.492
Grand
Total1.642 0.637 0.887 1.039 0.567 0.107 0.116 1.769 0.032 0.097 6.893
Group D :- Other Species
Page 4
Working Circle : Afforestation W.C. Division :Hingoli Population area (ha): 10128.347
Period of Enumeration : 2013-14 Sample area (ha): 108.00
Working Plan by :- Shri V.J. Warvantkar, I.F.S. Intensity of sampling (%): 1.07
15U30 31U45 46U60 61U75 76U90 91U105 106U120 121U135 136U150 above150 Total
Lendia 69 19 1 0 0 0 0 0 0 0 89
Teak 176 156 19 6 5 2 2 1 1 0 368
Total 245 175 20 6 5 2 2 1 1 0 457
Dhawada 68 27 5 1 2 0 0 0 0 0 103
Hiwar 140 110 2 0 0 1 0 0 0 0 253
Karai 0 1 0 0 0 0 0 0 0 0 1
Khair 2 0 0 0 0 0 0 0 0 0 2
Moin 29 15 3 7 2 0 0 0 1 1 58
Salai 10 0 1 0 0 0 0 0 0 0 11
Total 249 153 11 8 4 1 0 0 1 1 428
Awala 36 2 1 0 0 0 0 0 0 1 40
Behada 2 4 1 0 0 0 0 0 0 0 7
Biba 2 0 0 0 0 0 0 0 0 0 2
Bor 2 0 0 0 0 0 0 0 0 0 2
Charoli 2 2 0 0 0 0 0 0 0 0 4
Moha 1 0 1 1 0 0 0 0 0 1 4
Neem 151 103 110 78 4 7 3 3 0 2 461
Palas 753 310 303 202 8 4 7 6 0 0 1593
Sitafal 2 0 0 0 0 0 0 0 0 0 2
Tendu 170 18 4 1 0 0 0 0 0 0 193
Total C 1121 439 420 282 12 11 10 9 0 4 2308
STATEMENT-IA
Sample Growing Stock: No. of sound trees in sample area
Group/
Species
Girth classwise classification in cms
Group C :- Species of Minor Forest Produce
Group A :- Species of General Utility
Group B :- Species of Special Utility
Page 5
15U30 31U45 46U60 61U75 76U90 91U105 106U120 121U135 136U150 above150 Total
Group/
Species
Girth classwise classification in cms
Anjan 0 0 0 0 90 0 0 130 0 0 220
Babhul 22 0 0 0 0 0 0 0 0 0 22
Bahala 65 2 0 0 0 0 0 0 0 0 67
Bartondi 24 0 0 0 0 0 0 0 0 0 24
Chinchora 3 2 1 3 0 0 0 0 0 0 9
Dhamoda 30 0 0 0 0 0 0 0 0 0 30
Dudhi 46 9 2 2 1 0 0 0 0 0 60
Glyricidia 222 0 0 0 0 0 0 0 0 0 222
Henkal 14 2 0 0 0 0 0 0 0 0 16
Lokhandi 26 0 0 0 0 0 0 0 0 0 26
Medsheng 22 2 0 0 0 0 0 0 0 0 24
Others 16 5 1 1 1 1 0 0 0 1 26
Total D 490 22 4 6 92 1 0 130 0 1 746
Grand Total 2105 789 455 302 113 15 12 140 2 6 3939
Group D :- Other Species
Page 6
94
Working Circle : Afforestation W.C. Division :Hingoli Population area (ha): 10128.347
Period of Enumeration : 2013-14 Sample area (ha): 108.000
Working Plan by :- Shri V.J. Warvantkar, I.F.S. Intensity of sampling (%): 1.07
15U30 31U45 46U60 61U75 76U90 91U105 106U120 121U135 136U150 above150 Total
Lendia 6471 1782 94 0 0 0 0 0 0 0 8347
Teak 16505 14630 1782 563 469 188 188 94 94 0 34513Total 22976 16412 1876 563 469 188 188 94 94 0 42860
Dhawada 6377 2532 469 94 188 0 0 0 0 0 9660
Hiwar 13129 10316 188 0 0 94 0 0 0 0 23727
Karai 0 94 0 0 0 0 0 0 0 0 94
Khair 188 0 0 0 0 0 0 0 0 0 188
Moin 2720 1407 281 656 188 0 0 0 94 94 5440
Salai 938 0 94 0 0 0 0 0 0 0 1032Total 23352 14349 1032 750 376 94 0 0 94 94 40141
Awala 3376 188 94 0 0 0 0 0 0 94 3752
Behada 188 375 94 0 0 0 0 0 0 0 657
Biba 188 0 0 0 0 0 0 0 0 0 188
Bor 188 0 0 0 0 0 0 0 0 0 188
Charoli 188 188 0 0 0 0 0 0 0 0 376
Moha 94 0 94 94 0 0 0 0 0 94 376
Neem 14161 9659 10316 7315 375 656 281 281 0 188 43232
Palas 70617 29072 28416 18944 750 375 656 563 0 0 149393
Sitafal 188 0 0 0 0 0 0 0 0 0 188
Tendu 15943 1688 375 94 0 0 0 0 0 0 18100Total C 105131 41170 39389 26447 1125 1031 937 844 0 376 216450
STATEMENT-I
Estimated Growing Stock: No. of sound trees in population area
Group/
Species
Girth classwise classification in cms
Group C :- Species of Minor Forest Produce
Group A :- Species of General Utility
Group B :- Species of Special Utility
Page 7
15U30 31U45 46U60 61U75 76U90 91U105 106U120 121U135 136U150 above150 Total
Group/
Species
Girth classwise classification in cms
Anjan 0 0 0 0 8440 0 0 12192 0 0 20632
Babhul 2063 0 0 0 0 0 0 0 0 0 2063
Bahala 6096 188 0 0 0 0 0 0 0 0 6284
Bartondi 2251 0 0 0 0 0 0 0 0 0 2251
Chinchora 281 188 94 281 0 0 0 0 0 0 844
Dhamoda 2813 0 0 0 0 0 0 0 0 0 2813
Dudhi 4314 844 188 188 94 0 0 0 0 0 5628
Glyricidia 20819 0 0 0 0 0 0 0 0 0 20819
Henkal 1313 188 0 0 0 0 0 0 0 0 1501
Lokhandi 2438 0 0 0 0 0 0 0 0 0 2438
Medsheng 2063 188 0 0 0 0 0 0 0 0 2251
Others 1500 469 94 94 94 94 0 0 0 94 2439
Total 45951 2065 376 563 8628 94 0 12192 0 94 69963
Grand Total 197410 73996 42673 28323 10598 1407 1125 13130 188 564 369414
Group D :- Other Species
Page 8
Working Circle : Afforestation W.C. Division :Hingoli Population area (ha): 10128.347
Period of Enumeration : 2013-14 Sample area (ha): 108.00
Working Plan by :- Shri V.J. Warvantkar, I.F.S. Intensity of sampling (%): 1.07
15U30 31U45 46U60 61U75 76U90 91U105 106U120 121U135 136U150 above150 Total
Lendia 0.639 0.176 0.009 0.000 0.000 0.000 0.000 0.000 0.000 0.000 0.824
Teak 1.630 1.444 0.176 0.056 0.046 0.019 0.019 0.009 0.009 0.000 3.408Total 2.269 1.620 0.185 0.056 0.046 0.019 0.019 0.009 0.009 0.000 4.232
Dhawada 0.630 0.250 0.046 0.009 0.019 0.000 0.000 0.000 0.000 0.000 0.954
Hiwar 1.296 1.019 0.019 0.000 0.000 0.009 0.000 0.000 0.000 0.000 2.343
Karai 0.000 0.009 0.000 0.000 0.000 0.000 0.000 0.000 0.000 0.000 0.009
Khair 0.019 0.000 0.000 0.000 0.000 0.000 0.000 0.000 0.000 0.000 0.019
Moin 0.269 0.139 0.028 0.065 0.019 0.000 0.000 0.000 0.009 0.009 0.538
Salai 0.093 0.000 0.009 0.000 0.000 0.000 0.000 0.000 0.000 0.000 0.102Total 2.307 1.417 0.102 0.074 0.038 0.009 0.000 0.000 0.009 0.009 3.965
Awala 0.333 0.019 0.009 0.000 0.000 0.000 0.000 0.000 0.000 0.009 0.370
Behada 0.019 0.037 0.009 0.000 0.000 0.000 0.000 0.000 0.000 0.000 0.065
Biba 0.019 0.000 0.000 0.000 0.000 0.000 0.000 0.000 0.000 0.000 0.019
Bor 0.019 0.000 0.000 0.000 0.000 0.000 0.000 0.000 0.000 0.000 0.019
Charoli 0.019 0.019 0.000 0.000 0.000 0.000 0.000 0.000 0.000 0.000 0.038
Moha 0.009 0.000 0.009 0.009 0.000 0.000 0.000 0.000 0.000 0.009 0.036
Neem 1.398 0.954 1.019 0.722 0.037 0.065 0.028 0.028 0.000 0.019 4.270
Palas 6.972 2.870 2.806 1.870 0.074 0.037 0.065 0.056 0.000 0.000 14.750
Sitafal 0.019 0.000 0.000 0.000 0.000 0.000 0.000 0.000 0.000 0.000 0.019
Tendu 1.574 0.167 0.037 0.009 0.000 0.000 0.000 0.000 0.000 0.000 1.787Total C 10.381 4.066 3.889 2.610 0.111 0.102 0.093 0.084 0.000 0.037 21.373
STATEMENT-II
Estimated Growing Stock: No. of sound trees per hectare
Group A :- Species of General Utility
Group/
Species
Girth classwise classification in cms
Group C :- Species of Minor Forest Produce
Group B :- Species of Special Utility
Page 9
15U30 31U45 46U60 61U75 76U90 91U105 106U120 121U135 136U150 above150 Total
Group/
Species
Girth classwise classification in cms
Anjan 0.000 0.000 0.000 0.000 0.833 0.000 0.000 1.204 0.000 0.000 2.037
Babhul 0.204 0.000 0.000 0.000 0.000 0.000 0.000 0.000 0.000 0.000 0.204
Bahala 0.602 0.019 0.000 0.000 0.000 0.000 0.000 0.000 0.000 0.000 0.621
Bartondi 0.222 0.000 0.000 0.000 0.000 0.000 0.000 0.000 0.000 0.000 0.222
Chinchora 0.028 0.019 0.009 0.028 0.000 0.000 0.000 0.000 0.000 0.000 0.084
Dhamoda 0.278 0.000 0.000 0.000 0.000 0.000 0.000 0.000 0.000 0.000 0.278
Dudhi 0.426 0.083 0.019 0.019 0.009 0.000 0.000 0.000 0.000 0.000 0.556
Glyricidia 2.056 0.000 0.000 0.000 0.000 0.000 0.000 0.000 0.000 0.000 2.056
Henkal 0.130 0.019 0.000 0.000 0.000 0.000 0.000 0.000 0.000 0.000 0.149
Lokhandi 0.241 0.000 0.000 0.000 0.000 0.000 0.000 0.000 0.000 0.000 0.241
Medsheng 0.204 0.019 0.000 0.000 0.000 0.000 0.000 0.000 0.000 0.000 0.223
Others 0.148 0.046 0.009 0.009 0.009 0.009 0.000 0.000 0.000 0.009 0.239
Total 4.539 0.205 0.037 0.056 0.851 0.009 0 1.204 0 0.009 6.91
Grand Total 19.496 7.308 4.213 2.796 1.046 0.139 0.112 1.297 0.018 0.055 36.480
Group D :- Other Species
Page 10
Working Circle : Afforestation W.C. Division :Hingoli Population area (ha): 10128.347
Period of Enumeration : 2013-14 Sample area (ha): 108.000
Working Plan by :- Shri V.J. Warvantkar, I.F.S. Intensity of sampling (%): 1.07
Girth classwise classification in cms15U30 31U45 46U60 61U75 76U90 91U105 106U120 121U135 136U150 above150 Total
Lendia 77.549 21.359 1.092 0.000 0.000 0.000 0.000 0.000 0.000 0.000 100
Teak 47.829 42.371 5.164 1.643 1.350 0.558 0.558 0.264 0.264 0.000 100Total 53.615 38.280 4.371 1.323 1.087 0.449 0.449 0.213 0.213 0.000 100
Dhawada 66.038 26.205 4.822 0.943 1.992 0.000 0.000 0.000 0.000 0.000 100
Hiwar 55.314 43.491 0.811 0.000 0.000 0.384 0.000 0.000 0.000 0.000 100
Karai 0.000 100.000 0.000 0.000 0.000 0.000 0.000 0.000 0.000 0.000 100
Khair 100.000 0.000 0.000 0.000 0.000 0.000 0.000 0.000 0.000 0.000 100
Moin 50.000 25.836 5.204 12.082 3.532 0.000 0.000 0.000 1.673 1.673 100
Salai 91.176 0.000 8.824 0.000 0.000 0.000 0.000 0.000 0.000 0.000 100Total 58.184 35.738 2.573 1.866 0.958 0.227 0.000 0.000 0.227 0.227 100
Awala 90.000 5.135 2.432 0.000 0.000 0.000 0.000 0.000 0.000 2.432 100
Behada 29.231 56.923 13.846 0.000 0.000 0.000 0.000 0.000 0.000 0.000 100
Biba 100.000 0.000 0.000 0.000 0.000 0.000 0.000 0.000 0.000 0.000 100
Bor 100.000 0.000 0.000 0.000 0.000 0.000 0.000 0.000 0.000 0.000 100
Charoli 50.000 50.000 0.000 0.000 0.000 0.000 0.000 0.000 0.000 0.000 100
Moha 25.000 0.000 25.000 25.000 0.000 0.000 0.000 0.000 0.000 25.000 100
Neem 32.740 22.342 23.864 16.909 0.867 1.522 0.656 0.656 0.000 0.445 100
Palas 47.268 19.458 19.024 12.678 0.502 0.251 0.441 0.380 0.000 0.000 100
Sitafal 100.000 0.000 0.000 0.000 0.000 0.000 0.000 0.000 0.000 0.000 100
Tendu 88.081 9.345 2.071 0.504 0.000 0.000 0.000 0.000 0.000 0.000 100Total C 48.571 19.024 18.196 12.212 0.519 0.477 0.435 0.393 0.000 0.173 100
STATEMENT-III
Percentage distribution of total stock of a species overall girth classes
Group A :- Species of General Utility
Group C :- Species of Minor Forest Produce
Group/
Species
Group B :- Species of Special Utility
Page 11
Girth classwise classification in cms15U30 31U45 46U60 61U75 76U90 91U105 106U120 121U135 136U150 above150 Total
Group/
Species
Anjan 0.000 0.000 0.000 0.000 40.893 0.000 0.000 59.107 0.000 0.000 100
Babhul 100.000 0.000 0.000 0.000 0.000 0.000 0.000 0.000 0.000 0.000 100
Bahala 96.940 3.060 0.000 0.000 0.000 0.000 0.000 0.000 0.000 0.000 100
Bartondi 100.000 0.000 0.000 0.000 0.000 0.000 0.000 0.000 0.000 0.000 100
Chinchora 33.333 22.619 10.714 33.333 0.000 0.000 0.000 0.000 0.000 0.000 100
Dhamoda 100.000 0.000 0.000 0.000 0.000 0.000 0.000 0.000 0.000 0.000 100
Dudhi 76.619 14.928 3.417 3.417 1.619 0.000 0.000 0.000 0.000 0.000 100
Glyricidia 100.000 0.000 0.000 0.000 0.000 0.000 0.000 0.000 0.000 0.000 100
Henkal 87.248 12.752 0.000 0.000 0.000 0.000 0.000 0.000 0.000 0.000 100
Lokhandi 100.000 0.000 0.000 0.000 0.000 0.000 0.000 0.000 0.000 0.000 100
Medsheng 91.480 8.520 0.000 0.000 0.000 0.000 0.000 0.000 0.000 0.000 100
Others 61.925 19.247 3.766 3.766 3.766 3.766 0.000 0.000 0.000 3.766 100
Total 65.687 2.967 0.535 0.810 12.315 0.130 0.000 17.424 0.000 0.130 100
Grand
Total53.443 20.033 11.549 7.664 2.867 0.381 0.307 3.555 0.049 0.151 100
Group D :- Other Species
Page 12
Working Circle : Afforestation W.C. Division :Hingoli Population area (ha): 10128.347
Period of Enumeration : 2013-14 Sample area (ha): 108.00
Working Plan by :- Shri V.J. Warvantkar, I.F.S. Intensity of sampling (%): 1.07
15U30 31U45 46U60 61U75 76U90 91U105 106U120 121U135 136U150 above150 Total
Lendia 3.278 2.408 0.214 0.000 0.000 0.000 0.000 0.000 0.000 0.000 2.259
Teak 8.361 19.759 4.178 2.003 4.398 13.669 16.964 0.694 50.000 0.000 9.342Total 11.639 22.167 4.392 2.003 4.398 13.669 16.964 0.694 50.000 0.000 11.601
Dhawada 3.231 3.421 1.092 0.322 1.816 0.000 0.000 0.000 0.000 0.000 2.615
Hiwar 6.648 13.944 0.451 0.000 0.000 6.475 0.000 0.000 0.000 0.000 6.423
Karai 0 0.123 0 0.000 0.000 0.000 0.000 0.000 0.000 0.000 0.025
Khair 0.097 0 0 0.000 0.000 0.000 0.000 0.000 0.000 0.000 0.052
Moin 1.38 1.902 0.665 2.325 1.816 0.000 0.000 0.000 50.000 16.364 1.475
Salai 0.477 0 0.214 0.000 0.000 0.000 0.000 0.000 0.000 0.000 0.280Total 11.833 19.39 2.422 2.647 3.632 6.475 0.000 0.000 50.000 16.364 10.870
Awala 1.708 0.26 0.214 0.000 0.000 0.000 0.000 0.000 0.000 16.364 1.014
Behada 0.097 0.506 0.214 0.000 0.000 0.000 0.000 0.000 0.000 0.000 0.178
Biba 0.097 0 0 0.000 0.000 0.000 0.000 0.000 0.000 0.000 0.052
Bor 0.097 0 0 0.000 0.000 0.000 0.000 0.000 0.000 0.000 0.052
Charoli 0.097 0.26 0 0.000 0.000 0.000 0.000 0.000 0.000 0.000 0.104
Moha 0.046 0 0.214 0.322 0.000 0.000 0.000 0.000 0.000 16.364 0.099
Neem 7.171 13.054 24.187 25.823 3.537 46.763 25.000 2.159 0.000 34.545 11.705
Palas 35.761 39.272 66.603 66.881 7.075 26.619 58.036 4.318 0.000 0.000 40.433
Sitafal 0.097 0 0 0.000 0.000 0.000 0.000 0.000 0.000 0.000 0.052
Tendu 8.073 2.285 0.878 0.322 0.000 0.000 0.000 0.000 0.000 0.000 4.899Total C 53.247 55.638 92.31 93.348 10.612 73.381 83.036 6.476 0.000 67.273 58.588
STATEMENT-IV
Percentage of total stock of a species in a girth class to the total stock in that particular girth class
Group A :- Species of General Utility
Group C :- Species of Minor Forest Produce
Group/
Species
Girth classwise classification in cms
Group B :- Species of Special Utility
Page 13
15U30 31U45 46U60 61U75 76U90 91U105 106U120 121U135 136U150 above150 Total
Group/
Species
Girth classwise classification in cms
Anjan 0 0 0 0.000 79.637 0.000 0.000 92.830 0.000 0.000 5.584
Babhul 1.046 0 0 0.000 0.000 0.000 0.000 0.000 0.000 0.000 0.559
Bahala 3.088 0.26 0 0.000 0.000 0.000 0.000 0.000 0.000 0.000 1.702
Bartondi 1.139 0 0 0.000 0.000 0.000 0.000 0.000 0.000 0.000 0.609
Chinchora 0.144 0.26 0.214 1.001 0.000 0.000 0.000 0.000 0.000 0.000 0.230
Dhamoda 1.426 0 0 0.000 0.000 0.000 0.000 0.000 0.000 0.000 0.762
Dudhi 2.185 1.136 0.451 0.680 0.860 0.000 0.000 0.000 0.000 0.000 1.524
Glyricidia 10.546 0 0 0.000 0.000 0.000 0.000 0.000 0.000 0.000 5.636
Henkal 0.667 0.26 0 0.000 0.000 0.000 0.000 0.000 0.000 0.000 0.408
Lokhandi 1.236 0 0 0.000 0.000 0.000 0.000 0.000 0.000 0.000 0.661
Medsheng 1.046 0.26 0 0.000 0.000 0.000 0.000 0.000 0.000 0.000 0.611
Others 0.759 0.629 0.214 0.322 0.860 6.475 0.000 0.000 0.000 16.364 0.655
Total 23.282 2.805 0.879 2.003 81.357 6.475 0 92.83 0 16.364 18.941
Grand Total 100 100 100 100 100 100 100 100 100 100 100
Group D :- Other Species
Page 14
Working Circle : New W.C. Division : Hingoli Population area (ha): 1404.136
Period of Enumeration : 2013-14 Sample area (ha): 15.840
Working Plan by :- Shri V.J. Warvantkar, I.F.S. Intensity of sampling (%): 1.13
Volume
15U30
Volume
31U45
Volume
46U60
Volume
61U75
Volume
76U90
Volume
91U105
Volume
106U120
Volume
121U135
Volume
136U150
Volume
Above 150
Total
Ain 0.04 0.007 0 0 0 0 0 0 0 0 0.047
Bibla 0.004 0 0.008 0 0 0 0 0 0 0 0.012
Lendia 0.067 0.01 0.035 0 0 0 0 0 0 0 0.112
Teak 0.096 0.038 0.059 0.107 0 0 0 0 0 0 0.300
Total 0.207 0.055 0.102 0.107 0.000 0.000 0.000 0.000 0.000 0.000 0.471
Dhawada 0.278 0.013 0.122 0 0 0 0 0 0 0 0.413
Hiwar 0.027 0.086 0 0 0 0 0 0 0 0 0.113
Kalamb 0.04 0.013 0 0 0 0 0 0 0 0 0.053
Moin 0.046 0.046 0.136 0.047 0 0 0 0 0 0 0.275
Salai 0 0 0 0 0 0.247 0 0 0 0 0.247
Total 0.391 0.158 0.258 0.047 0.000 0.247 0.000 0.000 0.000 0.000 1.101
Apta 0.007 0.007 0.014 0 0 0 0 0 0.000 0 0.028
Awala 0.007 0.007 0 0.047 0 0 0 0 0.000 0 0.061
Behada 0.017 0.023 0.031 0.025 0.031 0 0 0 0.000 0 0.127
Chandan 0.007 0 0 0 0 0 0 0 0.000 0 0.007
Charoli 0 0.02 0 0 0 0 0 0 0.000 0 0.020
Moha 0.099 0.013 0.081 0.047 0 0 0 0 0.000 0 0.240
Neem 0.146 0.113 0.081 0 0 0 0 0 0.000 0 0.340
Palas 0.225 0.086 0.109 0 0.035 0 0 0 0.000 0 0.455
Tendu 0.05 0.033 0.012 0 0 0 0 0 0.000 0 0.095
Total 0.558 0.302 0.328 0.119 0.066 0.000 0.000 0.000 0.000 0.000 1.373
Group C :- Species of Minor Forest Produce
STATEMENT -V
Estimated growing stock : Volume in cum. per Ha.
Group/
Species
Girth classwise classification in cms
Group A :- Species of General Utility
Group B :- Species of Special Utility
Page 15
Bahala 0.106 0.007 0 0 0 0 0 0 0 0 0.113
Bartondi 0.08 0 0 0 0 0 0 0 0 0 0.080
Chinchora 0.007 0.007 0 0 0.035 0.049 0 0 0 0 0.098
Dudhi 0.133 0.046 0.014 0 0 0 0 0 0 0 0.193
Lokhandi 0.099 0.033 0.014 0 0 0 0 0 0 0 0.146
Medshing 0.007 0 0 0 0 0 0 0 0 0 0.007
Nirmali 0.013 0 0 0.047 0 0 0 0 0 0 0.060
Padari 0 0.013 0 0 0 0 0 0 0 0 0.013
Rohan 0.027 0 0 0 0 0 0 0 0 0 0.027
Sadoda 0 0.007 0 0 0 0 0 0 0 0 0.007
Total 0.472 0.113 0.028 0.047 0.035 0.049 0.000 0.000 0.000 0.000 0.744
Grand Total 1.628 0.628 0.716 0.320 0.101 0.296 0.000 0.000 0.000 0.000 3.689
Group D :- Other Species
Page 16
Working Circle : New W.C. Division : Hingoli Population area (ha): 1404.136
Period of Enumeration : 2013-14 Sample area (ha): 15.840
Working Plan by :- Shri V.J. Warvantkar, I.F.S. Intensity of sampling (%): 1.13
15U30 31U45 46U60 61U75 76U90 91U105 106U120 121U135 136U150 above 150 Total
Ain 6 1 0 0 0 0 0 0 0 0 7
Bibla 2 0 1 0 0 0 0 0 0 0 3
Lendia 14 2 3 0 0 0 0 0 0 0 19
Teak 61 24 8 5 0 0 0 0 0 0 98
Total 83 27 12 5 0 0 0 0 0 0 127
Dhawada 42 2 9 0 0 0 0 0 0 0 53
Hiwar 4 13 0 0 0 0 0 0 0 0 17
Kalamb 6 2 0 0 0 0 0 0 0 0 8
Moin 7 7 10 2 0 0 0 0 0 0 26
Salai 0 0 0 0 0 5 0 0 0 0 5
Total 59 24 19 2 0 5 0 0 0 0 109
Apta 1 1 1 0 0 0 0 0 0 0 3
Awala 1 1 0 2 0 0 0 0 0 0 4
Behada 3 4 3 1 1 0 0 0 0 0 12
Chandan 1 0 0 0 0 0 0 0 0 0 1
Charoli 0 3 0 0 0 0 0 0 0 0 3
Moha 15 2 6 2 0 0 0 0 0 0 25
Neem 22 17 6 0 0 0 0 0 0 0 45
Palas 34 13 8 0 1 0 0 0 0 0 56
Tendu 15 10 1 0 0 0 0 0 0 0 26
Total 92 51 25 5 2 0 0 0 0 0 175
STATEMENT-IA
Sample Growing Stock: No. of sound trees in sample area
Group/
SpeciesGirth classwise classification in cms
Group C :- Species of Minor Forest Produce
Group A :- Species of General Utility
Group B :- Species of Special Utility
Page 17
Bahala 16 1 0 0 0 0 0 0 0 0 17
Bartondi 12 0 0 0 0 0 0 0 0 0 12
Chinchora 1 1 0 0 1 1 0 0 0 0 4
Dudhi 20 7 1 0 0 0 0 0 0 0 28
Lokhandi 15 5 1 0 0 0 0 0 0 0 21
Medshing 1 0 0 0 0 0 0 0 0 0 1
Nirmali 2 0 0 2 0 0 0 0 0 0 4
Padari 0 2 0 0 0 0 0 0 0 0 2
Rohan 4 0 0 0 0 0 0 0 0 0 4
Sadoda 0 1 0 0 0 0 0 0 0 0 1
Total 71 17 2 2 1 1 0 0 0 0 94
Grand
Total305 119 58 14 3 6 0 0 0 0 505
Group D :- Other Species
Page 18
88.645
Working Circle : New W.C. Division : Hingoli Population area (ha): 1404.136
Period of Enumeration : 2013-14 Sample area (ha): 15.840
Working Plan by :- Shri V.J. Warvantkar, I.F.S. Intensity of sampling (%): 1.13
15U30 31U45 46U60 61U75 76U90 91U105 106U120 121U135 136U150 above 150 Total
Ain 532 89 0 0 0 0 0 0 0 0 621
Bibla 177 0 89 0 0 0 0 0 0 0 266
Lendia 1241 177 266 0 0 0 0 0 0 0 1684
Teak 5407 2127 709 443 0 0 0 0 0 0 8686
Total 7357 2393 1064 443 0 0 0 0 0 0 11257
Dhawada 3723 177 798 0 0 0 0 0 0 0 4698
Hiwar 355 1152 0 0 0 0 0 0 0 0 1507
Kalamb 532 177 0 0 0 0 0 0 0 0 709
Moin 621 621 886 177 0 0 0 0 0 0 2305
Salai 0 0 0 0 0 443 0 0 0 0 443
Total 5231 2127 1684 177 0 443 0 0 0 0 9662
Apta 89 89 89 0 0 0 0 0 0 0 267
Awala 89 89 0 177 0 0 0 0 0 0 355
Behada 266 355 266 89 89 0 0 0 0 0 1065
Chandan 89 0 0 0 0 0 0 0 0 0 89
Charoli 0 266 0 0 0 0 0 0 0 0 266
Moha 1330 177 532 177 0 0 0 0 0 0 2216
Neem 1950 1507 532 0 0 0 0 0 0 0 3989
Palas 3014 1152 709 0 89 0 0 0 0 0 4964
Tendu 1330 886 89 0 0 0 0 0 0 0 2305
Total 8157 4521 2217 443 178 0 0 0 0 0 15516
STATEMENT-I
Estimated Growing Stock: No. of sound trees in population area
Group A :- Species of General Utility
Group/
SpeciesGirth classwise classification in cms
Group C :- Species of Minor Forest Produce
Group B :- Species of Special Utility
Page 19
Bahala 1418 89 0 0 0 0 0 0 0 0 1507
Bartondi 1064 0 0 0 0 0 0 0 0 0 1064
Chinchora 89 89 0 0 89 89 0 0 0 0 356
Dudhi 1773 621 89 0 0 0 0 0 0 0 2483
Lokhandi 1330 443 89 0 0 0 0 0 0 0 1862
Medshing 89 0 0 0 0 0 0 0 0 0 89
Nirmali 177 0 0 177 0 0 0 0 0 0 354
Padari 0 177 0 0 0 0 0 0 0 0 177
Rohan 355 0 0 0 0 0 0 0 0 0 355
Sadoda 0 89 0 0 0 0 0 0 0 0 89
Total 6295 1508 178 177 89 89 0 0 0 0 8336
Grand Total 27040 10549 5143 1240 267 532 0 0 0 0 44771
Group D :- Other Species
Page 20
Working Circle : New W.C. Division : Hingoli Population area (ha): 1404.136
Period of Enumeration : 2013-14 Sample area (ha): 15.840
Working Plan by :- Shri V.J. Warvantkar, I.F.S. Intensity of sampling (%): 1.13
15U30 31U45 46U60 61U75 76U90 91U105 106U120 121U135 136U150 above 150 Total
Ain 0.379 0.063 0.000 0.000 0.000 0.000 0.000 0.000 0.000 0.000 0.442
Bibla 0.126 0.000 0.063 0.000 0.000 0.000 0.000 0.000 0.000 0.000 0.189
Lendia 0.884 0.126 0.189 0.000 0.000 0.000 0.000 0.000 0.000 0.000 1.199
Teak 3.851 1.515 0.505 0.315 0.000 0.000 0.000 0.000 0.000 0.000 6.186
Total 5.240 1.704 0.757 0.315 0.000 0.000 0.000 0.000 0.000 0.000 8.016
Dhawada 2.651 0.126 0.568 0.000 0.000 0.000 0.000 0.000 0.000 0.000 3.345
Hiwar 0.253 0.820 0.000 0.000 0.000 0.000 0.000 0.000 0.000 0.000 1.073
Kalamb 0.379 0.126 0.000 0.000 0.000 0.000 0.000 0.000 0.000 0.000 0.505
Moin 0.442 0.442 0.631 0.126 0.000 0.000 0.000 0.000 0.000 0.000 1.641
Salai 0.000 0.000 0.000 0.000 0.000 0.315 0.000 0.000 0.000 0.000 0.315
Total 3.725 1.514 1.199 0.126 0.000 0.315 0.000 0.000 0.000 0.000 6.879
Apta 0.063 0.063 0.063 0.000 0.000 0.000 0.000 0.000 0.000 0.000 0.189
Awala 0.063 0.063 0.000 0.126 0.000 0.000 0.000 0.000 0.000 0.000 0.252
Behada 0.189 0.253 0.189 0.063 0.063 0.000 0.000 0.000 0.000 0.000 0.757
Chandan 0.063 0.000 0.000 0.000 0.000 0.000 0.000 0.000 0.000 0.000 0.063
Charoli 0.000 0.189 0.000 0.000 0.000 0.000 0.000 0.000 0.000 0.000 0.189
Moha 0.947 0.126 0.379 0.126 0.000 0.000 0.000 0.000 0.000 0.000 1.578
Neem 1.389 1.073 0.379 0.000 0.000 0.000 0.000 0.000 0.000 0.000 2.841
Palas 2.147 0.820 0.505 0.000 0.063 0.000 0.000 0.000 0.000 0.000 3.535
Tendu 0.947 0.631 0.063 0.000 0.000 0.000 0.000 0.000 0.000 0.000 1.641
Total 5.808 3.218 1.578 0.315 0.126 0.000 0.000 0.000 0.000 0.000 11.045
STATEMENT-II
Estimated Growing Stock: No. of sound trees per hectare
Group A :- Species of General Utility
Group/
SpeciesGirth classwise classification in cms
Group C :- Species of Minor Forest Produce
Group B :- Species of Special Utility
Page 21
Bahala 1.010 0.063 0.000 0.000 0.000 0.000 0.000 0.000 0.000 0.000 1.073
Bartondi 0.758 0.000 0.000 0.000 0.000 0.000 0.000 0.000 0.000 0.000 0.758
Chinchora 0.063 0.063 0.000 0.000 0.063 0.063 0.000 0.000 0.000 0.000 0.252
Dudhi 1.263 0.442 0.063 0.000 0.000 0.000 0.000 0.000 0.000 0.000 1.768
Lokhandi 0.947 0.315 0.063 0.000 0.000 0.000 0.000 0.000 0.000 0.000 1.325
Medshing 0.063 0.000 0.000 0.000 0.000 0.000 0.000 0.000 0.000 0.000 0.063
Nirmali 0.126 0.000 0.000 0.126 0.000 0.000 0.000 0.000 0.000 0.000 0.252
Padari 0.000 0.126 0.000 0.000 0.000 0.000 0.000 0.000 0.000 0.000 0.126
Rohan 0.253 0.000 0.000 0.000 0.000 0.000 0.000 0.000 0.000 0.000 0.253
Sadoda 0.000 0.063 0.000 0.000 0.000 0.000 0.000 0.000 0.000 0.000 0.063
Total 4.483 1.072 0.126 0.126 0.063 0.063 0.000 0.000 0.000 0.000 5.933
Grand
Total19.256 7.508 3.660 0.882 0.189 0.378 0.000 0.000 0.000 0.000 31.873
Group D :- Other Species
Page 24
Working Circle : New W.C. Division : Hingoli Population area (ha): 1404.136
Period of Enumeration : 2013-14 Sample area (ha): 15.840
Working Plan by :- Shri V.J. Warvantkar, I.F.S. Intensity of sampling (%): 1.13
15U30 31U45 46U60 61U75 76U90 91U105 106U120 121U135 136U150 above 150 Total
Ain 85.747 14.253 0.000 0.000 0.000 0.000 0.000 0.000 0.000 0.000 100
Bibla 66.667 0.000 33.333 0.000 0.000 0.000 0.000 0.000 0.000 0.000 100
Lendia 73.728 10.509 15.763 0.000 0.000 0.000 0.000 0.000 0.000 0.000 100
Teak 62.253 24.491 8.164 5.092 0.000 0.000 0.000 0.000 0.000 0.000 100
Total 65.369 21.257 9.444 3.930 0.000 0.000 0.000 0.000 0.000 0.000 100
Dhawada 79.253 3.767 16.981 0.000 0.000 0.000 0.000 0.000 0.000 0.000 100
Hiwar 23.579 76.421 0.000 0.000 0.000 0.000 0.000 0.000 0.000 0.000 100
Kalamb 75.050 24.950 0.000 0.000 0.000 0.000 0.000 0.000 0.000 0.000 100
Moin 26.935 26.935 38.452 7.678 0.000 0.000 0.000 0.000 0.000 0.000 100
Salai 0.000 0.000 0.000 0.000 0.000 100.000 0.000 0.000 0.000 0.000 100
Total 54.150 22.009 17.430 1.832 0.000 4.579 0.000 0.000 0.000 0.000 100
Apta 33.333 33.333 33.333 0.000 0.000 0.000 0.000 0.000 0.000 0.000 100
Awala 25.000 25.000 0.000 50.000 0.000 0.000 0.000 0.000 0.000 0.000 100
Behada 24.967 33.421 24.967 8.322 8.322 0.000 0.000 0.000 0.000 0.000 100
Chandan 100.000 0.000 0.000 0.000 0.000 0.000 0.000 0.000 0.000 0.000 100
Charoli 0.000 100.000 0.000 0.000 0.000 0.000 0.000 0.000 0.000 0.000 100
Moha 60.013 7.985 24.018 7.985 0.000 0.000 0.000 0.000 0.000 0.000 100
Neem 48.891 37.768 13.340 0.000 0.000 0.000 0.000 0.000 0.000 0.000 100
Palas 60.736 23.197 14.286 0.000 1.782 0.000 0.000 0.000 0.000 0.000 100
Tendu 57.709 38.452 3.839 0.000 0.000 0.000 0.000 0.000 0.000 0.000 100
Total 52.585 29.135 14.287 2.852 1.141 0.000 0.000 0.000 0.000 0.000 100
STATEMENT-III
Percentage distribution of total stock of a species overall girth classes
Group A :- Species of General Utility
Group C :- Species of Minor Forest Produce
Group/
SpeciesGirth classwise classification in cms
Group B :- Species of Special Utility
Page 25
Bahala 94.129 5.871 0.000 0.000 0.000 0.000 0.000 0.000 0.000 0.000 100
Bartondi 100.000 0.000 0.000 0.000 0.000 0.000 0.000 0.000 0.000 0.000 100
Chinchora 25.000 25.000 0.000 0.000 25.000 25.000 0.000 0.000 0.000 0.000 100
Dudhi 71.437 25.000 3.563 0.000 0.000 0.000 0.000 0.000 0.000 0.000 100
Lokhandi 71.472 23.774 4.755 0.000 0.000 0.000 0.000 0.000 0.000 0.000 100
Medshing 100.000 0.000 0.000 0.000 0.000 0.000 0.000 0.000 0.000 0.000 100
Nirmali 50.000 0.000 0.000 50.000 0.000 0.000 0.000 0.000 0.000 0.000 100
Padari 0.000 100.000 0.000 0.000 0.000 0.000 0.000 0.000 0.000 0.000 100
Rohan 100.000 0.000 0.000 0.000 0.000 0.000 0.000 0.000 0.000 0.000 100
Sadoda 0.000 100.000 0.000 0.000 0.000 0.000 0.000 0.000 0.000 0.000 100
Total 75.560 18.068 2.124 2.124 1.062 1.062 0.000 0.000 0.000 0.000 100
Grand
Total60.415 23.556 11.483 2.767 0.593 1.186 0.000 0.000 0.000 0.000 100
Group D :- Other Species
Page 26
Working Circle : New W.C. Division : Hingoli Population area (ha): 1404.136
Period of Enumeration : 2013-14 Sample area (ha): 15.840
Working Plan by :- Shri V.J. Warvantkar, I.F.S. Intensity of sampling (%): 1.13
15U30 31U45 46U60 61U75 76U90 91U105 106U120 121U135 136U150 above 150 Total
Ain 1.968 0.839 0 0.000 0.000 0.000 0.000 0.000 0.000 0.000 1.387
Bibla 0.654 0 1.721 0.000 0.000 0.000 0.000 0.000 0.000 0.000 0.593
Lendia 4.591 1.678 5.164 0.000 0.000 0.000 0.000 0.000 0.000 0.000 3.762
Teak 19.999 20.178 13.798 35.714 0.000 0.000 0.000 0.000 0.000 0.000 19.408
Total 27.212 22.695 20.683 35.714 0 0 0 0 0 0 25.15
Dhawada 13.767 1.678 15.519 0.000 0.000 0.000 0.000 0.000 0.000 0.000 10.495
Hiwar 1.314 10.922 0 0.000 0.000 0.000 0.000 0.000 0.000 0.000 3.366
Kalamb 1.968 1.678 0 0.000 0.000 0.000 0.000 0.000 0.000 0.000 1.584
Moin 2.295 5.887 17.24 14.286 0.000 0.000 0.000 0.000 0.000 0.000 5.149
Salai 0 0 0 0.000 0.000 83.333 0.000 0.000 0.000 0.000 0.988
Total 19.344 20.165 32.759 14.286 0 83.333 0 0 0 0 21.582
Apta 0.327 0.839 1.721 0.000 0.000 0.000 0.000 0.000 0.000 0.000 0.593
Awala 0.327 0.839 0 14.286 0.000 0.000 0.000 0.000 0.000 0.000 0.791
Behada 0.982 3.37 5.164 7.143 33.333 0.000 0.000 0.000 0.000 0.000 2.375
Chandan 0.327 0 0 0.000 0.000 0.000 0.000 0.000 0.000 0.000 0.198
Charoli 0 2.517 0 0.000 0.000 0.000 0.000 0.000 0.000 0.000 0.593
Moha 4.918 1.678 10.355 14.286 0.000 0.000 0.000 0.000 0.000 0.000 4.951
Neem 7.213 14.291 10.355 0.000 0.000 0.000 0.000 0.000 0.000 0.000 8.914
Palas 11.15 10.922 13.798 0.000 33.333 0.000 0.000 0.000 0.000 0.000 11.091
Tendu 4.918 8.404 1.721 0.000 0.000 0.000 0.000 0.000 0.000 0.000 5.149
Total 30.162 42.86 43.114 35.715 66.666 0 0 0 0 0 34.655
STATEMENT-IV
Percentage of total stock of a species in a girth class to the total stock in that particular girth class
Group A :- Species of General Utility
Group C :- Species of Minor Forest Produce
Group/
SpeciesGirth classwise classification in cms
Group B :- Species of Special Utility
Page 27
Bahala 5.245 0.839 0 0.000 0.000 0.000 0.000 0.000 0.000 0.000 3.366
Bartondi 3.936 0 0 0.000 0.000 0.000 0.000 0.000 0.000 0.000 2.378
Chinchora 0.327 0.839 0 0.000 33.333 16.667 0.000 0.000 0.000 0.000 0.791
Dudhi 6.559 5.887 1.721 0.000 0.000 0.000 0.000 0.000 0.000 0.000 5.547
Lokhandi 4.918 4.196 1.721 0.000 0.000 0.000 0.000 0.000 0.000 0.000 4.157
Medshing 0.327 0 0 0.000 0.000 0.000 0.000 0.000 0.000 0.000 0.198
Nirmali 0.654 0 0 14.286 0.000 0.000 0.000 0.000 0.000 0.000 0.791
Padari 0 1.678 0 0.000 0.000 0.000 0.000 0.000 0.000 0.000 0.395
Rohan 1.314 0 0 0.000 0.000 0.000 0.000 0.000 0.000 0.000 0.794
Sadoda 0 0.839 0 0.000 0.000 0.000 0.000 0.000 0.000 0.000 0.198
Total 23.28 14.278 3.442 14.286 33.333 16.667 0.000 0.000 0.000 0.000 18.615
Grand Total 100 100 100 100 100 100 0 0 0 0 100
Group D :- Other Species
Page 28
Working Circle : Improvement W.C. Division : Hingoli Population area (ha): 9374.669
Period of Enumeration : 2013-14 Sample area (ha): 99.000
Working Plan by :- Shri V.J.Warvantkar, I.F.S. Intensity of sampling (%): 1.06
Girth classwise classification in cms
Volume
15U30
Volume
31U45
Volume
46U60
Volume
61U75
Volume
76U90
Volume
91U105
Volume
106U120
Volume
121U135
Volume
136U150
Volume
Above 150
Total
Lendia 0.274 0.053 0.153 0.197 0.005 0 0 0 0 0 0.682
Teak 0.114 0.054 0.346 0.503 0.664 0 0 0 0.053 0 1.734
Total 0.388 0.107 0.499 0.700 0.669 0.000 0.000 0.000 0.053 0.000 2.416
Dhawada 0.276 0.109 0.143 0.426 0.011 0.016 0 0 0 0 0.981
Haldu 0.002 0 0 0 0 0 0 0 0 0 0.002
Hiwar 0.02 0.002 0.004 0 0.006 0 0 0 0 0 0.032
Moin 0.028 0.056 0.067 0.045 0.022 0.008 0.01 0 0.018 0 0.254
Salai 0.002 0.002 0.002 0.154 0 0.713 0 0 0 0 0.873
Kalamb 0.003 0 0.087 0.004 0 0 0 0 0 0 0.094
Kudai 0 0 0.002 0 0 0 0 0 0 0 0.002
Total 0.331 0.169 0.305 0.629 0.039 0.737 0.010 0.000 0.018 0.000 2.238
Amba 0 0.001 0 0 0 0 0 0 0 0 0.001
Awala 0.003 0.001 0 0 0 0 0 0 0 0 0.004
Behada 0.003 0.003 0.085 0.004 0.005 0 0 0 0 0 0.100
Bel 0.002 0 0 0 0 0 0 0 0 0 0.002
Biba 0.012 0.028 0.035 0 0 0 0 0 0 0 0.075
Bor 0.001 0.001 0 0 0 0 0 0 0 0 0.002
Charoli 0.012 0.009 0.002 0 0.006 0 0 0 0 0 0.029
Moha 0.042 0.036 0.158 0.237 0.006 0.641 0 1.654 0 0.018 2.792
Neem 0.187 0.055 0.126 0.011 0.039 0.024 0.01 1.751 0 0 2.203
STATEMENT -V
Estimated growing stock: Volume in cum. per Ha.
Group/
Species
Group A :- Species of General Utility
Group B :- Species of Special Utility
Group C :- Species of Minor Forest Produce
Page 29
Palas 0.679 0.327 0.604 0.422 0.078 0.095 0.074 0.068 0.018 0.018 2.383
Siras 0.001 0 0 0.004 0 0 0 0 0 0 0.005
Sitafal 0.007 0 0 0 0 0 0 0 0 0 0.007
Tendu 0.126 0.031 0.254 0.203 0.332 0 0.015 0.009 0 0 0.970
Total 1.075 0.492 1.264 0.881 0.466 0.760 0.099 3.482 0.018 0.036 8.573
Amaltas 0.016 0 0 0 0 0 0 0 0 0 0.016
Bahala 0.126 0.087 0.004 0.226 0.006 0.016 0 0 0 0 0.465
Bartondi 0.135 0.1 0.113 0 0.393 0 0 0 0 0 0.741
Bhutekas 0.023 0.001 0.109 0 0 0 0 0 0 0 0.133
Chinchora 0.046 0.032 0.093 0.493 1.19 0.72 0 0.014 0 0 2.588
Dudhi 0.207 0.077 0.335 0 0.393 0.024 0.021 0 0 0 1.057
Glyricidia 0.056 0.024 0 0 0 0 0 0 0 0 0.080
Gochadi 0.021 0 0 0 0 0 0 0 0 0 0.021
Lokhandi 0.013 0.005 0.004 0 0 0 0 0 0 0 0.022
Others 0.02 0.002 0.004 0.004 0.006 0.016 0 0 0.018 0 0.070
Sadoda 0.089 0.076 0.087 0 0 0 0 0 0 0 0.252
Subabhul 0.021 0 0 0 0 0 0 0 0 0 0.021
Total 0.773 0.404 0.749 0.723 1.988 0.776 0.021 0.014 0.018 0.000 5.466
Grand Total 2.567 1.172 2.817 2.933 3.162 2.273 0.130 3.496 0.107 0.036 18.693
Group D :- Other Species
Page 30
95
Working Circle : Improvement W.C. Division : Hingoli Population area (ha): 9374.669
Period of Enumeration : 2013-14 Sample area (ha): 99.000
Working Plan by :- Shri V.J.Warvantkar, I.F.S. Intensity of sampling (%): 1.06
15U30 31U45 46U60 61U75 76U90 91U105 106U120 121U135 136U150 Above 150 Total
Lendia 357 69 83 60 1 0 0 0 0 0 570
Teak 453 214 293 146 143 0 0 0 3 0 1252
Total 810 283 376 206 144 0 0 0 3 0 1822
Dhawada 260 103 66 113 2 2 0 0 0 0 546
Haldu 2 0 0 0 0 0 0 0 0 0 2
Hiwar 19 2 2 0 1 0 0 0 0 0 24
Moin 26 53 31 12 4 1 1 0 1 0 129
Salai 2 2 1 41 0 90 0 0 0 0 136
Kalamb 3 0 40 1 0 0 0 0 0 0 44
Kudai 0 0 1 0 0 0 0 0 0 0 1
Total 312 160 141 167 7 93 1 0 1 0 882
Amba 0 1 0 0 0 0 0 0 0 0 1
Awala 3 1 0 0 0 0 0 0 0 0 4
Behada 3 3 52 1 1 0 0 0 0 0 60
Bel 2 0 0 0 0 0 0 0 0 0 2
Biba 11 26 16 0 0 0 0 0 0 0 53
Bor 1 1 0 0 0 0 0 0 0 0 2
Charoli 11 8 1 0 1 0 0 0 0 0 21
Moha 40 34 73 63 1 81 0 120 0 1 413
Neem 176 52 58 3 7 3 1 127 0 0 427
STATEMENT-IA
Sample Growing Stock: No. of sound trees in sample area
Group A :- Species of General Utility
Group/
Species
Girth classwise classification in cms
Group B :- Species of Special Utility
Group C :- Species of Minor Forest Produce
Page 31
Palas 640 308 278 112 14 12 7 5 1 1 1378
Siras 1 0 0 1 0 0 0 0 0 0 2
Sitafal 7 0 0 0 0 0 0 0 0 0 7
Tendu 236 58 129 61 70 0 2 1 0 0 557
Total 1131 492 607 241 94 96 10 253 1 2 2927
Amaltas 15 0 0 0 0 0 0 0 0 0 15
Bahala 119 82 2 60 1 2 0 0 0 0 266
Bartondi 127 94 52 0 70 0 0 0 0 0 343
Bhutekas 22 1 50 0 0 0 0 0 0 0 73
Chinchora 43 30 43 131 212 91 0 1 0 0 551
Dudhi 195 73 154 0 70 3 2 0 0 0 497
Glyricidia 264 115 0 0 0 0 0 0 0 0 379
Gochadi 20 0 0 0 0 0 0 0 0 0 20
Lokhandi 12 5 2 0 0 0 0 0 0 0 19
Others 19 2 2 1 1 2 0 0 1 0 28
Sadoda 84 72 40 0 0 0 0 0 0 0 196
Subabhul 20 0 0 0 0 0 0 0 0 0 20
Total 940 474 345 192 354 98 2 1 1 0 2407
Grand
Total3193 1409 1469 806 599 287 13 254 6 2 8038
Group D :- Other Species
Page 32
Working Circle : Improvement W.C. Division : Hingoli Population area (ha): 9374.669
Period of Enumeration : 2013-14 Sample area (ha): 99.000
Working Plan by :- Shri V.J.Warvantkar, I.F.S. Intensity of sampling (%): 1.06
15U30 31U45 46U60 61U75 76U90 91U105 106U120 121U135 136U150 Above 150 Total
Group A :- Species of General Utility
Lendia 33806 6534 7860 5682 95 0 0 0 0 0 53977
Teak 42896 20265 27745 13825 13541 0 0 0 284 0 118556
Total 76702 26799 35605 19507 13636 0 0 0 284 0 172533
Group B :- Species of Special Utility
Dhawada 24620 9753 6250 10700 189 189 0 0 0 0 51701
Haldu 189 0 0 0 0 0 0 0 0 0 189
Hiwar 1799 189 189 0 95 0 0 0 0 0 2272
Moin 2462 5019 2936 1136 379 95 95 0 95 0 12217
Salai 189 189 95 3882 0 8522 0 0 0 0 12877
Kalamb 284 0 3788 95 0 0 0 0 0 0 4167
Kudai 0 0 95 0 0 0 0 0 0 0 95
Total 29543 15150 13353 15813 663 8806 95 0 95 0 83518
Group C :- Species of Minor Forest Produce
Amba 0 95 0 0 0 0 0 0 0 0 95
Awala 284 95 0 0 0 0 0 0 0 0 379
Behada 284 284 4924 95 95 0 0 0 0 0 5682
Bel 189 0 0 0 0 0 0 0 0 0 189
Biba 1042 2462 1515 0 0 0 0 0 0 0 5019
Bor 95 95 0 0 0 0 0 0 0 0 190
Charoli 1042 758 95 0 95 0 0 0 0 0 1990
Moha 3788 3220 6913 5966 95 7670 0 11363 0 95 39110
Neem 16666 4924 5492 284 663 284 95 12026 0 0 40434
STATEMENT-I
Estimated Growing Stock: No. of sound trees in population area
Group/
Species
Girth classwise classification in cms
Page 33
Palas 60604 29166 26325 10606 1326 1136 663 473 95 95 130489
Siras 95 0 0 95 0 0 0 0 0 0 190
Sitafal 663 0 0 0 0 0 0 0 0 0 663
Tendu 22348 5492 12216 5776 6629 0 189 95 0 0 52745
Total 107100 46591 57480 22822 8903 9090 947 23957 95 190 277175
Group D :- Other Species
Amaltas 1420 0 0 0 0 0 0 0 0 0 1420
Bahala 11269 7765 189 5682 95 189 0 0 0 0 25189
Bartondi 12026 8901 4924 0 6629 0 0 0 0 0 32480
Bhutekas 2083 95 4735 0 0 0 0 0 0 0 6913
Chinchora 4072 2841 4072 12405 20075 8617 0 95 0 0 52177
Dudhi 18465 6913 14583 0 6629 284 189 0 0 0 47063
Glyricidia 24999 10890 0 0 0 0 0 0 0 0 35889
Gochadi 1894 0 0 0 0 0 0 0 0 0 1894
Lokhandi 1136 473 189 0 0 0 0 0 0 0 1798
Others 1799 189 189 95 95 189 0 0 95 0 2651
Sadoda 7954 6818 3788 0 0 0 0 0 0 0 18560
Subabhul 1894 0 0 0 0 0 0 0 0 0 1894
Total 89011 44885 32669 18182 33523 9279 189 95 95 0 227928
Grand
Total302356 133425 139107 76324 56725 27175 1231 24052 569 190 761154
Page 34
Working Circle : Improvement W.C. Division : Hingoli Population area (ha): 9374.669
Period of Enumeration : 2013-14 Sample area (ha): 99.000
Working Plan by :- Shri V.J.Warvantkar, I.F.S. Intensity of sampling (%): 1.06
15U30 31U45 46U60 61U75 76U90 91U105 106U120 121U135 136U150 Above 150 Total
Group A :- Species of General Utility
Lendia 3.606 0.697 0.838 0.606 0.01 0 0 0 0 0 5.757
Teak 4.576 2.162 2.96 1.475 1.444 0 0 0 0.03 0 12.647
Total 8.182 2.859 3.798 2.081 1.454 0 0 0 0.03 0 18.404
Dhawada 2.626 1.040 0.667 1.141 0.020 0.020 0.000 0.000 0.000 0.000 5.514
Haldu 0.020 0.000 0.000 0.000 0.000 0.000 0.000 0.000 0.000 0.000 0.020
Hiwar 0.192 0.020 0.020 0.000 0.010 0.000 0.000 0.000 0.000 0.000 0.242
Moin 0.263 0.535 0.313 0.121 0.040 0.010 0.010 0.000 0.010 0.000 1.302
Salai 0.020 0.020 0.010 0.414 0.000 0.909 0.000 0.000 0.000 0.000 1.373
Kalamb 0.030 0.000 0.404 0.010 0.000 0.000 0.000 0.000 0.000 0.000 0.444
Kudai 0.000 0.000 0.010 0.000 0.000 0.000 0.000 0.000 0.000 0.000 0.010
Total 3.151 1.615 1.424 1.686 0.070 0.939 0.010 0.000 0.010 0.000 8.905
Amba 0.000 0.010 0.000 0.000 0.000 0.000 0.000 0.000 0.000 0.000 0.010
Awala 0.030 0.010 0.000 0.000 0.000 0.000 0.000 0.000 0.000 0.000 0.040
Behada 0.030 0.030 0.525 0.010 0.010 0.000 0.000 0.000 0.000 0.000 0.605
Bel 0.020 0.000 0.000 0.000 0.000 0.000 0.000 0.000 0.000 0.000 0.020
Biba 0.111 0.263 0.162 0.000 0.000 0.000 0.000 0.000 0.000 0.000 0.536
Bor 0.010 0.010 0.000 0.000 0.000 0.000 0.000 0.000 0.000 0.000 0.020
Charoli 0.111 0.081 0.010 0.000 0.010 0.000 0.000 0.000 0.000 0.000 0.212
Moha 0.404 0.343 0.737 0.636 0.010 0.818 0.000 1.212 0.000 0.010 4.170
Neem 1.778 0.525 0.586 0.030 0.071 0.030 0.010 1.283 0.000 0.000 4.313
STATEMENT-II
Estimated Growing Stock: No. of sound trees per hectare
Group/
Species
Girth classwise classification in cms
Group B :- Species of Special Utility
Group C :- Species of Minor Forest Produce
Page 35
Palas 6.465 3.111 2.808 1.131 0.141 0.121 0.071 0.050 0.010 0.010 13.918
Siras 0.010 0.000 0.000 0.010 0.000 0.000 0.000 0.000 0.000 0.000 0.020
Sitafal 0.071 0.000 0.000 0.000 0.000 0.000 0.000 0.000 0.000 0.000 0.071
Tendu 2.384 0.586 1.303 0.616 0.707 0.000 0.020 0.010 0.000 0.000 5.626
Total 11.424 4.969 6.131 2.433 0.949 0.969 0.101 2.555 0.010 0.020 29.561
Amaltas 0.151 0.000 0.000 0.000 0.000 0.000 0.000 0.000 0.000 0.000 0.151
Bahala 1.202 0.828 0.020 0.606 0.010 0.020 0.000 0.000 0.000 0.000 2.686
Bartondi 1.283 0.949 0.525 0.000 0.707 0.000 0.000 0.000 0.000 0.000 3.464
Bhutekas 0.222 0.010 0.505 0.000 0.000 0.000 0.000 0.000 0.000 0.000 0.737
Chinchora 0.434 0.303 0.434 1.323 2.141 0.919 0.000 0.010 0.000 0.000 5.564
Dudhi 1.970 0.737 1.556 0.000 0.707 0.030 0.020 0.000 0.000 0.000 5.020
Glyricidia 2.667 1.162 0.000 0.000 0.000 0.000 0.000 0.000 0.000 0.000 3.829
Gochadi 0.202 0.000 0.000 0.000 0.000 0.000 0.000 0.000 0.000 0.000 0.202
Lokhandi 0.121 0.050 0.020 0.000 0.000 0.000 0.000 0.000 0.000 0.000 0.191
Others 0.192 0.020 0.020 0.010 0.010 0.020 0.000 0.000 0.010 0.000 0.282
Sadoda 0.848 0.727 0.404 0.000 0.000 0.000 0.000 0.000 0.000 0.000 1.979
Subabhul 0.202 0.000 0.000 0.000 0.000 0.000 0.000 0.000 0.000 0.000 0.202
Total 9.494 4.786 3.484 1.939 3.575 0.989 0.020 0.010 0.010 0.000 24.307
Grand Total 32.251 14.229 14.837 8.139 6.048 2.897 0.131 2.565 0.060 0.020 81.177
Group D :- Other Species
Page 36
Working Circle : Improvement W.C. Division : Hingoli Population area (ha): 9374.669
Period of Enumeration : 2013-14 Sample area (ha): 99.000
Working Plan by :- Shri V.J.Warvantkar, I.F.S. Intensity of sampling (%): 1.06
15U30 31U45 46U60 61U75 76U90 91U105 106U120 121U135 136U150 Above 150 Total
Lendia 62.637 12.107 14.556 10.526 0.174 0 0 0 0 0 100
Teak 36.182 17.095 23.405 11.663 11.418 0 0 0 0.237 0 100
Total 44.458 15.535 20.637 11.307 7.900 0.000 0.000 0.000 0.163 0.000 100
Dhawada 47.624 18.861 12.096 20.693 0.363 0.363 0.000 0.000 0.000 0.000 100
Haldu 100.000 0.000 0.000 0.000 0.000 0.000 0.000 0.000 0.000 0.000 100
Hiwar 79.339 8.264 8.264 0.000 4.132 0.000 0.000 0.000 0.000 0.000 100
Moin 20.200 41.091 24.040 9.293 3.072 0.768 0.768 0.000 0.768 0.000 100
Salai 1.457 1.457 0.728 30.153 0.000 66.205 0.000 0.000 0.000 0.000 100
Kalamb 6.757 0.000 90.991 2.252 0.000 0.000 0.000 0.000 0.000 0.000 100
Kudai 0.000 0.000 100.000 0.000 0.000 0.000 0.000 0.000 0.000 0.000 100
Total 35.385 18.136 15.991 18.933 0.786 10.545 0.112 0.000 0.112 0.000 100
Amba 0.000 100.000 0.000 0.000 0.000 0.000 0.000 0.000 0.000 0.000 100
Awala 75.000 25.000 0.000 0.000 0.000 0.000 0.000 0.000 0.000 0.000 100
Behada 4.959 4.959 86.777 1.653 1.653 0.000 0.000 0.000 0.000 0.000 100
Bel 100.000 0.000 0.000 0.000 0.000 0.000 0.000 0.000 0.000 0.000 100
Biba 20.709 49.067 30.224 0.000 0.000 0.000 0.000 0.000 0.000 0.000 100
Bor 50.000 50.000 0.000 0.000 0.000 0.000 0.000 0.000 0.000 0.000 100
Charoli 52.358 38.208 4.717 0.000 4.717 0.000 0.000 0.000 0.000 0.000 100
Moha 9.688 8.225 17.674 15.252 0.240 19.616 0.000 29.065 0.000 0.240 100
Neem 41.224 12.173 13.587 0.696 1.646 0.696 0.232 29.747 0.000 0.000 100
STATEMENT-III
Percentage distribution of total stock of a species overall girth classes
Group A :- Species of General Utility
Group C :- Species of Minor Forest Produce
Group/
Species
Girth classwise classification in cms
Group B :- Species of Special Utility
Page 37
Palas 46.451 22.352 20.175 8.126 1.013 0.869 0.510 0.359 0.072 0.072 100
Siras 50.000 0.000 0.000 50.000 0.000 0.000 0.000 0.000 0.000 0.000 100
Sitafal 100.000 0.000 0.000 0.000 0.000 0.000 0.000 0.000 0.000 0.000 100
Tendu 42.375 10.416 23.160 10.949 12.567 0.000 0.355 0.178 0.000 0.000 100
Total 38.646 16.809 20.740 8.230 3.210 3.278 0.342 8.643 0.034 0.068 100
Amaltas 100.000 0.000 0.000 0.000 0.000 0.000 0.000 0.000 0.000 0.000 100
Bahala 44.751 30.827 0.745 22.561 0.372 0.745 0.000 0.000 0.000 0.000 100
Bartondi 37.038 27.396 15.156 0.000 20.410 0.000 0.000 0.000 0.000 0.000 100
Bhutekas 30.122 1.357 68.521 0.000 0.000 0.000 0.000 0.000 0.000 0.000 100
Chinchora 7.800 5.446 7.800 23.778 38.480 16.517 0.000 0.180 0.000 0.000 100
Dudhi 39.243 14.681 30.996 0.000 14.084 0.598 0.398 0.000 0.000 0.000 100
Glyricidia 69.653 30.347 0.000 0.000 0.000 0.000 0.000 0.000 0.000 0.000 100
Gochadi 100.000 0.000 0.000 0.000 0.000 0.000 0.000 0.000 0.000 0.000 100
Lokhandi 63.351 26.178 10.471 0.000 0.000 0.000 0.000 0.000 0.000 0.000 100
Others 68.085 7.092 7.092 3.546 3.546 7.092 0.000 0.000 3.546 0.000 100
Sadoda 42.850 36.736 20.414 0.000 0.000 0.000 0.000 0.000 0.000 0.000 100
Subabhul 100.000 0.000 0.000 0.000 0.000 0.000 0.000 0.000 0.000 0.000 100
Total 39.059 19.690 14.333 7.977 14.708 4.069 0.082 0.041 0.041 0.000 100
Grand
Total39.729 17.528 18.277 10.026 7.450 3.569 0.161 3.160 0.074 0.025 100
Group D :- Other Species
Page 38
Working Circle : Improvement W.C. Division : Hingoli Population area (ha): 9374.669
Period of Enumeration : 2013-14 Sample area (ha): 99.000
Working Plan by :- Shri V.J.Warvantkar, I.F.S. Intensity of sampling (%): 1.06
15U30 31U45 46U60 61U75 76U90 91U105 106U120 121U135 136U150 Above 150 Total
Lendia 11.181 4.898 5.648 7.446 0.165 0 0 0 0 0 7.092
Teak 14.189 15.194 19.95 18.123 23.876 0 0 0 50 0 15.58
Total 25.37 20.092 25.598 25.569 24.041 0 0 0 50 0 22.672
Dhawada 8.142 7.309 4.496 14.019 0.331 0.690 0.000 0.000 0.000 0.000 6.793
Haldu 0.062 0 0 0.000 0.000 0.000 0.000 0.000 0.000 0.000 0.025
Hiwar 0.595 0.141 0.135 0.000 0.165 0.000 0.000 0.000 0.000 0.000 0.298
Moin 0.815 3.76 2.11 1.487 0.661 0.345 7.634 0.000 16.667 0.000 1.604
Salai 0.062 0.141 0.067 5.087 0.000 31.377 0.000 0.000 0.000 0.000 1.691
Kalamb 0.093 0 2.723 0.123 0.000 0.000 0.000 0.000 0.000 0.000 0.547
Kudai 0 0 0.067 0.000 0.000 0.000 0.000 0.000 0.000 0.000 0.012
Total 9.769 11.351 9.598 20.716 1.157 32.412 7.634 0.000 16.667 0 10.97
Amba 0 0.07 0 0.000 0.000 0.000 0.000 0.000 0.000 0.000 0.012
Awala 0.093 0.07 0 0.000 0.000 0.000 0.000 0.000 0.000 0.000 0.049
Behada 0.093 0.211 3.538 0.123 0.165 0.000 0.000 0.000 0.000 0.000 0.745
Bel 0.062 0 0 0.000 0.000 0.000 0.000 0.000 0.000 0.000 0.025
Biba 0.344 1.848 1.092 0.000 0.000 0.000 0.000 0.000 0.000 0.000 0.660
Bor 0.031 0.07 0 0.000 0.000 0.000 0.000 0.000 0.000 0.000 0.025
Charoli 0.344 0.569 0.067 0.000 0.165 0.000 0.000 0.000 0.000 0.000 0.261
Moha 1.253 2.411 4.967 7.814 0.165 28.236 0.000 47.251 0.000 50.000 5.137
Neem 5.513 3.69 3.95 0.369 1.174 1.036 7.634 50.019 0.000 0.000 5.313
STATEMENT-IV
Percentage of total stock of a species in a girth class to the total stock in that particular girth class
Group A :- Species of General Utility
Group C :- Species of Minor Forest Produce
Group/
Species
Girth classwise classification in cms
Group B :- Species of Special Utility
Page 39
Palas 20.046 21.864 18.926 13.896 2.331 4.177 54.198 1.949 16.667 50.000 17.145
Siras 0.031 0 0 0.123 0.000 0.000 0.000 0.000 0.000 0.000 0.025
Sitafal 0.22 0 0 0.000 0.000 0.000 0.000 0.000 0.000 0.000 0.087
Tendu 7.392 4.118 8.782 7.568 11.690 0.000 15.267 0.390 0.000 0.000 6.931
Total 35.422 34.921 41.322 29.893 15.69 33.449 77.099 99.609 16.667 100 36.415
Amaltas 0.468 0 0 0.000 0.000 0.000 0.000 0.000 0.000 0.000 0.186
Bahala 3.727 5.819 0.135 7.446 0.165 0.690 0.000 0.000 0.000 0.000 3.309
Bartondi 3.978 6.669 3.538 0.000 11.690 0.000 0.000 0.000 0.000 0.000 4.267
Bhutekas 0.688 0.07 3.404 0.000 0.000 0.000 0.000 0.000 0.000 0.000 0.908
Chinchora 1.346 2.129 2.925 16.255 35.400 31.722 0.000 0.390 0.000 0.000 6.854
Dudhi 6.108 5.18 10.487 0.000 11.690 1.036 15.267 0.000 0.000 0.000 6.184
Glyricidia 8.27 8.166 0 0.000 0.000 0.000 0.000 0.000 0.000 0.000 4.717
Gochadi 0.626 0 0 0.000 0.000 0.000 0.000 0.000 0.000 0.000 0.249
Lokhandi 0.375 0.351 0.135 0.000 0.000 0.000 0.000 0.000 0.000 0.000 0.235
Others 0.595 0.141 0.135 0.123 0.165 0.690 0.000 0.000 16.667 0.000 0.347
Sadoda 2.629 5.109 2.723 0.000 0.000 0.000 0.000 0.000 0.000 0.000 2.438
Subabhul 0.626 0 0 0.000 0.000 0.000 0.000 0.000 0.000 0.000 0.249
Total 29.436 33.634 23.482 23.824 59.110 34.138 15.267 0.390 16.667 0.000 29.943
Grand Total 100 100 100 100 100 100 100 100 100 100 100
Group D :- Other Species
Page 40
Working Circle : Silvipasture W.C. Division : Hingoli Population area (ha): 3411.561Period of Enumeration : 2013-14 Sample area (ha): 42.840Working Plan by :- Shri V.J.Warvantkar, I.F.S. Intensity of sampling (%): 1.26
Girth classwise classification in cms
Volume
15U30
Volume
31U45
Volume
46U60
Volume
61U75
Volume
76U90
Volume
91U105
Volume
106U120
Volume
121U135
Volume
136U150
Volume
Above 150
Total
Lendia 0.633 0.122 0.355 0.455 0.012 0 0 0 0 0 1.577Teak 0.264 0.125 0.8 1.162 1.535 0 0 0 0.125 0 4.011Total 0.897 0.247 1.155 1.617 1.547 0.000 0.000 0.000 0.125 0.000 5.588
Dhawada 0.637 0.252 0.331 0.984 0.026 0.037 0 0 0 0 2.267Haldu 0.004 0 0 0 0 0 0 0 0 0 0.004Hiwar 0.047 0.005 0.01 0 0.013 0 0 0 0 0 0.075Moin 0.064 0.13 0.156 0.104 0.052 0.018 0.024 0 0.041 0 0.589Salai 0.005 0.005 0.005 0.357 0 1.647 0 0 0 0 2.019Kalamb 0.007 0 0.201 0.009 0 0 0 0 0 0 0.217Kudai 0 0 0.005 0 0 0 0 0 0 0 0.005Total 0.764 0.392 0.708 1.454 0.091 1.702 0.024 0.000 0.041 0.000 5.176
Amba 0 0.002 0 0 0 0 0 0 0 0 0.002Awala 0.007 0.002 0 0 0 0 0 0 0 0 0.009Behada 0.006 0.006 0.197 0.009 0.011 0 0 0 0 0 0.229Bel 0.005 0 0 0 0 0 0 0 0 0 0.005Biba 0.027 0.064 0.08 0 0 0 0 0 0 0 0.171Bor 0.002 0.002 0 0 0 0 0 0 0 0 0.004Charoli 0.027 0.02 0.005 0 0.013 0 0 0 0 0 0.065Moha 0.098 0.083 0.366 0.549 0.013 1.483 0 3.823 0 0.041 6.456Neem 0.431 0.127 0.291 0.026 0.091 0.055 0.024 4.047 0 0 5.092Palas 1.569 0.755 1.395 0.975 0.182 0.22 0.171 0.16 0.041 0.041 5.509Siras 0.002 0 0 0.009 0 0 0 0 0 0 0.011Sitafal 0.017 0 0 0 0 0 0 0 0 0 0.017Tendu 0.292 0.072 0.587 0.47 0.766 0 0.035 0.02 0 0 2.242Total 2.483 1.133 2.921 2.038 1.076 1.758 0.230 8.050 0.041 0.082 19.812
STATEMENT -V
Estimated growing stock: Volume in cum. per Ha.
Group/
Species
Group A :- Species of General Utility
Group B :- Species of Special Utility
Group C :- Species of Minor Forest Produce
Page 41
Amaltas 0.037 0 0 0 0 0 0 0 0 0 0.037Bahala 0.292 0.201 0.01 0.523 0.013 0.037 0 0 0 0 1.076Bartondi 0.311 0.23 0.261 0 0.909 0 0 0 0 0 1.711Bhutekas 0.054 0.002 0.251 0 0 0 0 0 0 0 0.307Chinchora 0.105 0.074 0.216 1.141 2.752 1.665 0 0.031 0 0 5.984Dudhi 0.478 0.179 0.773 0 0.909 0.055 0.049 0 0 0 2.443Glyricidia 0.129 0.056 0 0 0 0 0 0 0 0 0.185Gochadi 0.049 0 0 0 0 0 0 0 0 0 0.049Lokhandi 0.029 0.012 0.01 0 0 0 0 0 0 0 0.051Others 0.047 0.005 0.01 0.009 0.013 0.037 0 0 0.041 0 0.162Sadoda 0.206 0.177 0.201 0 0 0 0 0 0 0 0.584Subabhul 0.049 0 0 0 0 0 0 0 0 0 0.049Total 1.786 0.936 1.732 1.673 4.596 1.794 0.049 0.031 0.041 0.000 12.638
Grand
Total5.930 2.708 6.516 6.782 7.310 5.254 0.303 8.081 0.248 0.082 43.214
Group D :- Other Species
Page 42
Working Circle : Silvipasture W.C. Division : Hingoli Population area (ha): 3411.561Period of Enumeration : 2013-14 Sample area (ha): 42.840Working Plan by :- Shri V.J.Warvantkar, I.F.S. Intensity of sampling (%): 1.26
15U30 31U45 46U60 61U75 76U90 91U105 106U120 121U135 136U150 Above 150 Total
Lendia 357 69 83 60 1 0 0 0 0 0 570
Teak 453 214 293 146 143 0 0 0 3 0 1252
Total 810 283 376 206 144 0 0 0 3 0 1822
Dhawada 260 103 66 113 2 2 0 0 0 0 546Haldu 2 0 0 0 0 0 0 0 0 0 2Hiwar 19 2 2 0 1 0 0 0 0 0 24Moin 26 53 31 12 4 1 1 0 1 0 129Salai 2 2 1 41 0 90 0 0 0 0 136Kalamb 3 0 40 1 0 0 0 0 0 0 44Kudai 0 0 1 0 0 0 0 0 0 0 1Total 312 160 141 167 7 93 1 0 1 0 882
Amba 0 1 0 0 0 0 0 0 0 0 1Awala 3 1 0 0 0 0 0 0 0 0 4Behada 3 3 52 1 1 0 0 0 0 0 60Bel 2 0 0 0 0 0 0 0 0 0 2Biba 11 26 16 0 0 0 0 0 0 0 53Bor 1 1 0 0 0 0 0 0 0 0 2Charoli 11 8 1 0 1 0 0 0 0 0 21Moha 40 34 73 63 1 81 0 120 0 1 413Neem 176 52 58 3 7 3 1 127 0 0 427Palas 640 308 278 112 14 12 7 5 1 1 1378Siras 1 0 0 1 0 0 0 0 0 0 2Sitafal 7 0 0 0 0 0 0 0 0 0 7Tendu 236 58 129 61 70 0 2 1 0 0 557Total 1131 492 607 241 94 96 10 253 1 2 2927
STATEMENT-IA
Sample Growing Stock: No. of sound trees in sample area
Group A :- Species of General Utility
Group/
Species
Girth classwise classification in cms
Group B :- Species of Special Utility
Group C :- Species of Minor Forest Produce
Page 43
Amaltas 15 0 0 0 0 0 0 0 0 0 15Bahala 119 82 2 60 1 2 0 0 0 0 266Bartondi 127 94 52 0 70 0 0 0 0 0 343Bhutekas 22 1 50 0 0 0 0 0 0 0 73Chinchora 43 30 43 131 212 91 0 1 0 0 551Dudhi 195 73 154 0 70 3 2 0 0 0 497Glyricidia 264 115 0 0 0 0 0 0 0 0 379Gochadi 20 0 0 0 0 0 0 0 0 0 20Lokhandi 12 5 2 0 0 0 0 0 0 0 19Others 19 2 2 1 1 2 0 0 1 0 28Sadoda 84 72 40 0 0 0 0 0 0 0 196Subabhul 20 0 0 0 0 0 0 0 0 0 20Total 940 474 345 192 354 98 2 1 1 0 2407
Grand
Total3193 1409 1469 806 599 287 13 254 6 2 8038
Group D :- Other Species
Page 44
79.64
Working Circle : Silvipasture W.C. Division : Hingoli Population area (ha): 3411.561Period of Enumeration : 2013-14 Sample area (ha): 42.840Working Plan by :- Shri V.J.Warvantkar, I.F.S. Intensity of sampling (%): 1.26
15U30 31U45 46U60 61U75 76U90 91U105 106U12
0
121U13
5
136U15
0
Above 150 Total
Group A :- Species of General Utility
Lendia 28430 5495 6610 4778 80 0 0 0 0 0 45393
Teak 36075 17042 23333 11627 11388 0 0 0 239 0 99704
Total 64505 22537 29943 16405 11468 0 0 0 239 0 145097
Group B :- Species of Special Utility
Dhawada 20705 8202 5256 8999 159 159 0 0 0 0 43480Haldu 159 0 0 0 0 0 0 0 0 0 159Hiwar 1513 159 159 0 80 0 0 0 0 0 1911Moin 2071 4221 2469 956 319 80 80 0 80 0 10276Salai 159 159 80 3265 0 7167 0 0 0 0 10830Kalamb 239 0 3185 80 0 0 0 0 0 0 3504Kudai 0 0 80 0 0 0 0 0 0 0 80Total 24846 12741 11229 13300 558 7406 80 0 80 0 70240
Group C :- Species of Minor Forest Produce
Amba 0 80 0 0 0 0 0 0 0 0 80Awala 239 80 0 0 0 0 0 0 0 0 319Behada 239 239 4141 80 80 0 0 0 0 0 4779Bel 159 0 0 0 0 0 0 0 0 0 159Biba 876 2071 1274 0 0 0 0 0 0 0 4221Bor 80 80 0 0 0 0 0 0 0 0 160Charoli 876 637 80 0 80 0 0 0 0 0 1673Moha 3185 2708 5813 5017 80 6450 0 9556 0 80 32889Neem 14016 4141 4619 239 557 239 80 10114 0 0 34005Palas 50966 24528 22139 8919 1115 956 557 398 80 80 109738Siras 80 0 0 80 0 0 0 0 0 0 160Sitafal 557 0 0 0 0 0 0 0 0 0 557Tendu 18794 4619 10273 4858 5574 0 159 80 0 0 44357Total 90067 39183 48339 19193 7486 7645 796 20148 80 160 233097
STATEMENT-I
Estimated Growing Stock: No. of sound trees in population area
Group/
Species
Girth classwise classification in cms
Page 45
Group D :- Other Species
Amaltas 1195 0 0 0 0 0 0 0 0 0 1195Bahala 9477 6530 159 4778 80 159 0 0 0 0 21183Bartondi 10114 7486 4141 0 5574 0 0 0 0 0 27315Bhutekas 1752 80 3982 0 0 0 0 0 0 0 5814Chinchora 3424 2389 3424 10432 16883 7247 0 80 0 0 43879Dudhi 15529 5813 12264 0 5574 239 159 0 0 0 39578Glyricidia 21024 9158 0 0 0 0 0 0 0 0 30182Gochadi 1593 0 0 0 0 0 0 0 0 0 1593Lokhandi 956 398 159 0 0 0 0 0 0 0 1513Others 1513 159 159 80 80 159 0 0 80 0 2230Sadoda 6689 5734 3185 0 0 0 0 0 0 0 15608Subabhul 1593 0 0 0 0 0 0 0 0 0 1593Total 74859 37747 27473 15290 28191 7804 159 80 80 0 191683
Grand
Total254277 112208 116984 64188 47703 22855 1035 20228 479 160 640117
Page 46
Working Circle : Silvipasture W.C. Division : Hingoli Population area (ha): 3411.561Period of Enumeration : 2013-14 Sample area (ha): 42.840Working Plan by :- Shri V.J.Warvantkar, I.F.S. Intensity of sampling (%): 1.26
15U30 31U45 46U60 61U75 76U90 91U105 106U120 121U135 136U150 Above 150 Total
Group A :- Species of General Utility
Lendia 8.333 1.611 1.938 1.401 0.023 0 0 0 0 0 13.306
Teak 10.574 4.995 6.839 3.408 3.338 0 0 0 0.07 0 29.224
Total 18.907 6.606 8.777 4.809 3.361 0 0 0 0.07 0 42.530
Dhawada 6.069 2.404 1.541 2.638 0.047 0.047 0.000 0.000 0.000 0.000 12.746Haldu 0.047 0.000 0.000 0.000 0.000 0.000 0.000 0.000 0.000 0.000 0.047Hiwar 0.443 0.047 0.047 0.000 0.023 0.000 0.000 0.000 0.000 0.000 0.560Moin 0.607 1.237 0.724 0.280 0.094 0.023 0.023 0.000 0.023 0.000 3.011Salai 0.047 0.047 0.023 0.957 0.000 2.101 0.000 0.000 0.000 0.000 3.175Kalamb 0.070 0.000 0.934 0.023 0.000 0.000 0.000 0.000 0.000 0.000 1.027Kudai 0.000 0.000 0.023 0.000 0.000 0.000 0.000 0.000 0.000 0.000 0.023Total 7.283 3.735 3.292 3.898 0.164 2.171 0.023 0.000 0.023 0.000 20.589
Amba 0.000 0.023 0.000 0.000 0.000 0.000 0.000 0.000 0.000 0.000 0.023Awala 0.070 0.023 0.000 0.000 0.000 0.000 0.000 0.000 0.000 0.000 0.093Behada 0.070 0.070 1.214 0.023 0.023 0.000 0.000 0.000 0.000 0.000 1.400Bel 0.047 0.000 0.000 0.000 0.000 0.000 0.000 0.000 0.000 0.000 0.047Biba 0.257 0.607 0.373 0.000 0.000 0.000 0.000 0.000 0.000 0.000 1.237Bor 0.023 0.023 0.000 0.000 0.000 0.000 0.000 0.000 0.000 0.000 0.046Charoli 0.257 0.187 0.023 0.000 0.023 0.000 0.000 0.000 0.000 0.000 0.490Moha 0.934 0.794 1.704 1.471 0.023 1.891 0.000 2.801 0.000 0.023 9.641Neem 4.108 1.214 1.354 0.070 0.163 0.070 0.023 2.965 0.000 0.000 9.967Palas 14.939 7.190 6.489 2.614 0.327 0.280 0.163 0.117 0.023 0.023 32.165Siras 0.023 0.000 0.000 0.023 0.000 0.000 0.000 0.000 0.000 0.000 0.046Sitafal 0.163 0.000 0.000 0.000 0.000 0.000 0.000 0.000 0.000 0.000 0.163Tendu 5.509 1.354 3.011 1.424 1.634 0.000 0.047 0.023 0.000 0.000 13.002Total 26.400 11.485 14.168 5.625 2.193 2.241 0.233 5.906 0.023 0.046 68.320
STATEMENT-II
Estimated Growing Stock: No. of sound trees per hectare
Group/
Species
Girth classwise classification in cms
Group B :- Species of Special Utility
Group C :- Species of Minor Forest Produce
Page 47
Amaltas 0.350 0.000 0.000 0.000 0.000 0.000 0.000 0.000 0.000 0.000 0.350Bahala 2.778 1.914 0.047 1.401 0.023 0.047 0.000 0.000 0.000 0.000 6.210Bartondi 2.965 2.194 1.214 0.000 1.634 0.000 0.000 0.000 0.000 0.000 8.007Bhutekas 0.514 0.023 1.167 0.000 0.000 0.000 0.000 0.000 0.000 0.000 1.704Chinchora 1.004 0.700 1.004 3.058 4.949 2.124 0.000 0.023 0.000 0.000 12.862Dudhi 4.552 1.704 3.595 0.000 1.634 0.070 0.047 0.000 0.000 0.000 11.602Glyricidia 6.163 2.684 0.000 0.000 0.000 0.000 0.000 0.000 0.000 0.000 8.847Gochadi 0.467 0.000 0.000 0.000 0.000 0.000 0.000 0.000 0.000 0.000 0.467Lokhandi 0.280 0.117 0.047 0.000 0.000 0.000 0.000 0.000 0.000 0.000 0.444Others 0.443 0.047 0.047 0.023 0.023 0.047 0.000 0.000 0.023 0.000 0.653Sadoda 1.961 1.681 0.934 0.000 0.000 0.000 0.000 0.000 0.000 0.000 4.576Subabhul 0.467 0.000 0.000 0.000 0.000 0.000 0.000 0.000 0.000 0.000 0.467Total 21.944 11.064 8.055 4.482 8.263 2.288 0.047 0.023 0.023 0.000 56.189
Grand
Total74.534 32.890 34.292 18.814 13.981 6.700 0.303 5.929 0.139 0.046 187.628
Group D :- Other Species
Page 48
Working Circle : Silvipasture W.C. Division : Hingoli Population area (ha): 3411.561
Period of Enumeration : 2013-14 Sample area (ha): 42.840Working Plan by :- Shri V.J.Warvantkar, I.F.S. Intensity of sampling (%): 1.26
15U30 31U45 46U60 61U75 76U90 91U105 106U120 121U135 136U150 Above
150
Total
Lendia 62.626 12.107 14.565 10.529 0.173 0 0 0 0 0 100
Teak 36.183 17.092 23.402 11.662 11.422 0 0 0 0.24 0 100
Total 44.456 15.533 20.637 11.307 7.903 0.000 0.000 0.000 0.165 0.000 100
Dhawada 47.615 18.861 12.090 20.697 0.369 0.369 0.000 0.000 0.000 0.000 100Haldu 100.000 0.000 0.000 0.000 0.000 0.000 0.000 0.000 0.000 0.000 100Hiwar 79.107 8.393 8.393 0.000 4.107 0.000 0.000 0.000 0.000 0.000 100Moin 20.159 41.083 24.045 9.299 3.122 0.764 0.764 0.000 0.764 0.000 100Salai 1.480 1.480 0.724 30.142 0.000 66.173 0.000 0.000 0.000 0.000 100Kalamb 6.816 0.000 90.944 2.240 0.000 0.000 0.000 0.000 0.000 0.000 100Kudai 0.000 0.000 100.000 0.000 0.000 0.000 0.000 0.000 0.000 0.000 100Total 35.373 18.141 15.989 18.932 0.797 10.544 0.112 0.000 0.112 0.000 100
Amba 0.000 100.000 0.000 0.000 0.000 0.000 0.000 0.000 0.000 0.000 100Awala 75.269 24.731 0.000 0.000 0.000 0.000 0.000 0.000 0.000 0.000 100Behada 5.000 5.000 86.714 1.643 1.643 0.000 0.000 0.000 0.000 0.000 100Bel 100.000 0.000 0.000 0.000 0.000 0.000 0.000 0.000 0.000 0.000 100Biba 20.776 49.070 30.154 0.000 0.000 0.000 0.000 0.000 0.000 0.000 100Bor 50.000 50.000 0.000 0.000 0.000 0.000 0.000 0.000 0.000 0.000 100Charoli 52.449 38.163 4.694 0.000 4.694 0.000 0.000 0.000 0.000 0.000 100Moha 9.688 8.236 17.675 15.258 0.239 19.614 0.000 29.053 0.000 0.239 100Neem 41.216 12.180 13.585 0.702 1.635 0.702 0.231 29.748 0.000 0.000 100Palas 46.445 22.353 20.174 8.127 1.017 0.871 0.507 0.364 0.072 0.072 100Siras 50.000 0.000 0.000 50.000 0.000 0.000 0.000 0.000 0.000 0.000 100Sitafal 100.000 0.000 0.000 0.000 0.000 0.000 0.000 0.000 0.000 0.000 100Tendu 42.370 10.414 23.158 10.952 12.567 0.000 0.361 0.177 0.000 0.000 100Total 38.642 16.811 20.738 8.233 3.210 3.280 0.341 8.645 0.034 0.067 100
STATEMENT-III
Percentage distribution of total stock of a species overall girth classes
Group A :- Species of General Utility
Group C :- Species of Minor Forest Produce
Group/
Species
Girth classwise classification in cms
Group B :- Species of Special Utility
Page 49
Amaltas 100.000 0.000 0.000 0.000 0.000 0.000 0.000 0.000 0.000 0.000 100Bahala 44.734 30.821 0.757 22.560 0.370 0.757 0.000 0.000 0.000 0.000 100Bartondi 37.030 27.401 15.162 0.000 20.407 0.000 0.000 0.000 0.000 0.000 100Bhutekas 30.164 1.350 68.486 0.000 0.000 0.000 0.000 0.000 0.000 0.000 100Chinchora 7.806 5.442 7.806 23.775 38.478 16.514 0.000 0.179 0.000 0.000 100Dudhi 39.235 14.687 30.986 0.000 14.084 0.603 0.405 0.000 0.000 0.000 100Glyricidia 69.662 30.338 0.000 0.000 0.000 0.000 0.000 0.000 0.000 0.000 100Gochadi 100.000 0.000 0.000 0.000 0.000 0.000 0.000 0.000 0.000 0.000 100Lokhandi 63.063 26.351 10.586 0.000 0.000 0.000 0.000 0.000 0.000 0.000 100Others 67.841 7.198 7.198 3.522 3.522 7.198 0.000 0.000 3.522 0.000 100Sadoda 42.854 36.735 20.411 0.000 0.000 0.000 0.000 0.000 0.000 0.000 100Subabhul 100.000 0.000 0.000 0.000 0.000 0.000 0.000 0.000 0.000 0.000 100Total 39.054 19.691 14.336 7.977 14.706 4.072 0.084 0.041 0.041 0.000 100
Grand
Total39.724 17.529 18.277 10.027 7.451 3.571 0.161 3.160 0.074 0.025 100
Group D :- Other Species
Page 50
Working Circle : Silvipasture W.C. Division : Hingoli Population area (ha): 3411.561Period of Enumeration : 2013-14 Sample area (ha): 42.840Working Plan by :- Shri V.J.Warvantkar, I.F.S. Intensity of sampling (%): 1.26
15U30 31U45 46U60 61U75 76U90 91U105 106U120 121U135 136U150 Above 150 Total
Lendia 11.18 4.898 5.651 7.447 0.165 0 0 0 0 0 7.092
Teak 14.187 15.187 19.943 18.114 23.875 0 0 0 50.36 0 15.576
Total 25.367 20.085 25.594 25.561 24.04 0 0 0 50.36 0 22.668
Dhawada 8.143 7.309 4.494 14.021 0.336 0.701 0.000 0.000 0.000 0.000 6.793Haldu 0.063 0 0 0.000 0.000 0.000 0.000 0.000 0.000 0.000 0.025Hiwar 0.594 0.143 0.137 0.000 0.165 0.000 0.000 0.000 0.000 0.000 0.298Moin 0.814 3.761 2.111 1.488 0.672 0.343 7.591 0.000 16.547 0.000 1.605Salai 0.063 0.143 0.067 5.087 0.000 31.358 0.000 0.000 0.000 0.000 1.692Kalamb 0.094 0 2.724 0.122 0.000 0.000 0.000 0.000 0.000 0.000 0.547Kudai 0 0 0.067 0.000 0.000 0.000 0.000 0.000 0.000 0.000 0.012Total 9.771 11.356 9.6 20.718 1.173 32.402 7.591 0.000 16.547 0 10.972
Amba 0 0.07 0 0.000 0.000 0.000 0.000 0.000 0.000 0.000 0.012Awala 0.094 0.07 0 0.000 0.000 0.000 0.000 0.000 0.000 0.000 0.050Behada 0.094 0.213 3.54 0.122 0.165 0.000 0.000 0.000 0.000 0.000 0.746Bel 0.063 0 0 0.000 0.000 0.000 0.000 0.000 0.000 0.000 0.025Biba 0.345 1.846 1.088 0.000 0.000 0.000 0.000 0.000 0.000 0.000 0.659Bor 0.031 0.07 0 0.000 0.000 0.000 0.000 0.000 0.000 0.000 0.025Charoli 0.345 0.569 0.067 0.000 0.165 0.000 0.000 0.000 0.000 0.000 0.261Moha 1.253 2.414 4.969 7.819 0.165 28.224 0.000 47.242 0.000 50.000 5.138Neem 5.512 3.691 3.948 0.372 1.166 1.045 7.591 50.008 0.000 0.000 5.312Palas 20.043 21.861 18.923 13.894 2.339 4.179 53.795 1.973 16.547 50.000 17.143Siras 0.031 0 0 0.122 0.000 0.000 0.000 0.000 0.000 0.000 0.025Sitafal 0.219 0 0 0.000 0.000 0.000 0.000 0.000 0.000 0.000 0.087Tendu 7.391 4.117 8.78 7.569 11.687 0.000 15.512 0.388 0.000 0.000 6.930Total 35.421 34.921 41.315 29.898 15.687 33.448 76.898 99.611 16.547 100 36.413
STATEMENT-IV
Percentage of total stock of a species in a girth class to the total stock in that particular girth class
Group A :- Species of General Utility
Group C :- Species of Minor Forest Produce
Group/
Species
Girth classwise classification in cms
Group B :- Species of Special Utility
Page 51
Amaltas 0.47 0 0 0.000 0.000 0.000 0.000 0.000 0.000 0.000 0.187Bahala 3.727 5.819 0.137 7.447 0.165 0.701 0.000 0.000 0.000 0.000 3.310Bartondi 3.978 6.671 3.54 0.000 11.687 0.000 0.000 0.000 0.000 0.000 4.267Bhutekas 0.69 0.07 3.403 0.000 0.000 0.000 0.000 0.000 0.000 0.000 0.908Chinchora 1.347 2.128 2.928 16.254 35.398 31.701 0.000 0.388 0.000 0.000 6.855Dudhi 6.107 5.181 10.483 0.000 11.687 1.045 15.512 0.000 0.000 0.000 6.184Glyricidia 8.269 8.161 0 0.000 0.000 0.000 0.000 0.000 0.000 0.000 4.715Gochadi 0.627 0 0 0.000 0.000 0.000 0.000 0.000 0.000 0.000 0.249Lokhandi 0.376 0.356 0.137 0.000 0.000 0.000 0.000 0.000 0.000 0.000 0.237Others 0.594 0.143 0.137 0.122 0.165 0.701 0.000 0.000 16.547 0.000 0.348Sadoda 2.631 5.111 2.724 0.000 0.000 0.000 0.000 0.000 0.000 0.000 2.439Subabhul 0.627 0 0 0.000 0.000 0.000 0.000 0.000 0.000 0.000 0.249Total 29.443 33.640 23.489 23.823 59.102 34.148 15.512 0.388 16.547 0.000 29.948
Grand Total 100 100 100 100 100 100 100 100 100 100 100
Group D :- Other Species
Page 52
Working Circle : Encroachment Eviction & Rehabilitation W.C. Division : Hingoli Population area (ha): 3425.201Period of Enumeration : 2013-14 Sample area (ha): 39.600
Working Plan by :- Shri V.J.Warvantkar, I.F.S. Intensity of sampling (%): 1.16
Girth classwise classification in cms
Volume
15U30
Volume
31U45
Volume
46U60
Volume
61U75
Volume
76U90
Volume
91U105
Volume
106U120
Volume
121U135
Volume
136U150
Volume
Above 150
Total
Lendia 0.098 0.027 0.037 0.017 0 0 0 0 0 0 0.179
Teak 0.11 0.039 0.133 0.034 0 0 0 0 0 0 0.316
Total 0.208 0.066 0.170 0.051 0.000 0.000 0.000 0.000 0.000 0.000 0.495
Dhawada 0.085 0.085 0.033 0 0.028 0.02 0 0 0 0 0.251
Hiwar 0.011 0.005 0 0 0 0 0 0 0 0 0.016
Kudai 0.016 0.008 0 0 0.014 0 0 0 0 0 0.038
Moin 0.016 0.008 0.027 0.019 0 0.02 0.026 0 0 0 0.116
Khair 0.005 0.004 0 0 0 0 0 0 0 0 0.009
Total 0.133 0.110 0.060 0.019 0.042 0.040 0.026 0.000 0.000 0.000 0.430
Apta 0.003 0 0 0 0 0 0 0 0 0 0.003
Charoli 0 0.003 0.005 0 0 0 0 0 0 0 0.008
Moha 0 0.005 0 0 0 0.06 0 0 0 0 0.065
Neem 0.103 0.053 0.277 0.622 0 0 0 0 0 0 1.055
Palas 1.055 0.305 0.668 0.188 0 0 0 0 0 0 2.216
Tendu 0.128 0.009 0.005 0.008 0.012 0.015 0 0 0 0 0.177
Total 1.289 0.375 0.955 0.818 0.012 0.075 0.000 0.000 0.000 0.000 3.524
Amaltas 0.019 0.013 0 0 0 0 0 0 0 0 0.032
Babhul 0.008 0.011 0.016 0 0 0 0 0 0 0 0.035
Bahala 0.101 0.013 0 0 0 0 0 0 0 0 0.114
Bartondi 0.027 0.003 0.005 0 0 0 0 0 0 0 0.035
Dudhi 0.066 0.019 0.005 0 0.014 0 0 0.034 0 0 0.138
Glyricidia 0.031 0 0 0 0 0 0 0 0 0 0.031
Others 0.053 0.011 0.005 0 0.014 0.04 0 0 0 0 0.123
Total 0.305 0.070 0.031 0.000 0.028 0.040 0.000 0.034 0.000 0.000 0.508
Grand 1.935 0.621 1.216 0.888 0.082 0.155 0.026 0.034 0.000 0.000 4.957
Group D :- Other Species
STATEMENT -V
Estimated growing stock: Volume in cum. per Ha.
Group/
Species
Group A :- Species of General Utility
Group B :- Species of Special Utility
Group C :- Species of Minor Forest Produce
Page 53
Working Circle : Encroachment Eviction & Rehabilitation W.C.Division : Hingoli Population area (ha): 3425.201Period of Enumeration : 2013-14 Sample area (ha): 39.600Working Plan by :- Shri V.J.Warvantkar, I.F.S. Intensity of sampling (%): 1.16
15U30 31U45 46U60 61U75 76U90 91U105 106U120 121U135 136U150 Above 150 Total
Lendia 51 14 8 2 0 0 0 0 0 0 75
Teak 175 61 45 4 0 0 0 0 0 0 285
Total 226 75 53 6 0 0 0 0 0 0 360
Dhawada 32 32 6 0 2 1 0 0 0 0 73Hiwar 4 2 0 0 0 0 0 0 0 0 6Kudai 6 3 0 0 1 0 0 0 0 0 10Moin 6 3 5 2 0 1 1 0 0 0 18Khair 4 3 0 0 0 0 0 0 0 0 7Total 52 43 11 2 3 2 1 0 0 0 114
Apta 1 0 0 0 0 0 0 0 0 0 1Charoli 0 1 1 0 0 0 0 0 0 0 2Moha 0 2 0 0 0 3 0 0 0 0 5Neem 39 20 51 66 0 0 0 0 0 0 176Palas 398 115 123 20 0 0 0 0 0 0 656Tendu 96 7 1 1 1 1 0 0 0 0 107Total 534 145 176 87 1 4 0 0 0 0 947
Amaltas 7 5 0 0 0 0 0 0 0 0 12Babhul 3 4 3 0 0 0 0 0 0 0 10Bahala 38 5 0 0 0 0 0 0 0 0 43Bartondi 10 1 1 0 0 0 0 0 0 0 12Dudhi 25 7 1 0 1 0 0 1 0 0 35Glyricidia 58 0 0 0 0 0 0 0 0 0 58Others 20 4 1 0 1 2 0 0 0 0 28Total 161 26 6 0 2 2 0 1 0 0 198
Grand
Total973 289 246 95 6 8 1 1 0 0 1619
STATEMENT-IA
Sample Growing Stock: No. of sound trees in sample area
Group A :- Species of General Utility
Group/
Species
Girth classwise classification in cms
Group D :- Other Species
Group B :- Species of Special Utility
Group C :- Species of Minor Forest Produce
Page 54
Working Circle : Encroachment Eviction & Rehabilitation W.C. Division : Hingoli Population area (ha): 3425.201
Period of Enumeration : 2013-14 Sample area (ha): 39.600Working Plan by :- Shri V.J.Warvantkar, I.F.S. Intensity of sampling (%): 1.16
15U30 31U45 46U60 61U75 76U90 91U105 106U120 121U135 136U150 Above
150
Total
Group A :- Species of General Utility
Lendia 4411 1211 692 173 0 0 0 0 0 0 6487
Teak 15137 5276 3892 346 0 0 0 0 0 0 24651
Total 19548 6487 4584 519 0 0 0 0 0 0 31138
Group B :- Species of Special Utility
Dhawada 2768 2768 519 0 173 86 0 0 0 0 6314Hiwar 346 173 0 0 0 0 0 0 0 0 519Kudai 519 259 0 0 86 0 0 0 0 0 864Moin 519 259 432 173 0 86 86 0 0 0 1555Khair 346 259 0 0 0 0 0 0 0 0 605Total 4498 3718 951 173 259 172 86 0 0 0 9857
Group C :- Species of Minor Forest Produce
Apta 86 0 0 0 0 0 0 0 0 0 86Charoli 0 86 86 0 0 0 0 0 0 0 172Moha 0 173 0 0 0 259 0 0 0 0 432Neem 3373 1730 4411 5709 0 0 0 0 0 0 15223Palas 34425 9947 10639 1730 0 0 0 0 0 0 56741Tendu 8304 605 86 86 86 86 0 0 0 0 9253Total 46188 12541 15222 7525 86 345 0 0 0 0 81907
Group D :- Other Species
Amaltas 605 432 0 0 0 0 0 0 0 0 1037Babhul 259 346 259 0 0 0 0 0 0 0 864Bahala 3287 432 0 0 0 0 0 0 0 0 3719Bartondi 865 86 86 0 0 0 0 0 0 0 1037Dudhi 2162 605 86 0 86 0 0 86 0 0 3025Glyricidia 5017 0 0 0 0 0 0 0 0 0 5017Others 1730 346 86 0 86 173 0 0 0 0 2421Total 13925 2247 517 0 172 173 0 86 0 0 17120
Grand
Total84159 24993 21274 8217 517 690 86 86 0 0 140022
STATEMENT-I
Estimated Growing Stock: No. of sound trees in population area
Group/
Species
Girth classwise classification in cms
Page 55
Working Circle : Encroachment Eviction & Rehabilitation W.C. Division : Hingoli Population area (ha): 3425.201Period of Enumeration : 2013-14 Sample area (ha): 39.600Working Plan by :- Shri V.J.Warvantkar, I.F.S. Intensity of sampling (%): 1.16
15U30 31U45 46U60 61U75 76U90 91U105 106U120 121U135 136U150 Above 150 Total
Group A :- Species of General Utility
Lendia 1.288 0.354 0.202 0.051 0 0 0 0 0 0 1.895
Teak 4.419 1.54 1.136 0.101 0 0 0 0 0 0 7.196
Total 5.707 1.894 1.338 0.152 0 0 0 0 0 0 9.091
Dhawada 0.808 0.808 0.152 0.000 0.051 0.025 0.000 0.000 0.000 0.000 1.844Hiwar 0.101 0.051 0.000 0.000 0.000 0.000 0.000 0.000 0.000 0.000 0.152Kudai 0.152 0.076 0.000 0.000 0.025 0.000 0.000 0.000 0.000 0.000 0.253Moin 0.152 0.076 0.126 0.051 0.000 0.025 0.025 0.000 0.000 0.000 0.455Khair 0.101 0.076 0.000 0.000 0.000 0.000 0.000 0.000 0.000 0.000 0.177Total 1.314 1.087 0.278 0.051 0.076 0.050 0.025 0.000 0.000 0.000 2.881
Apta 0.025 0.000 0.000 0.000 0.000 0.000 0.000 0.000 0.000 0.000 0.025Charoli 0.000 0.025 0.025 0.000 0.000 0.000 0.000 0.000 0.000 0.000 0.050Moha 0.000 0.051 0.000 0.000 0.000 0.076 0.000 0.000 0.000 0.000 0.127Neem 0.985 0.505 1.288 1.667 0.000 0.000 0.000 0.000 0.000 0.000 4.445Palas 10.051 2.904 3.106 0.505 0.000 0.000 0.000 0.000 0.000 0.000 16.566Tendu 2.424 0.177 0.025 0.025 0.025 0.025 0.000 0.000 0.000 0.000 2.701Total 13.485 3.662 4.444 2.197 0.025 0.101 0.000 0.000 0.000 0.000 23.914
Amaltas 0.177 0.126 0.000 0.000 0.000 0.000 0.000 0.000 0.000 0.000 0.303Babhul 0.076 0.101 0.076 0.000 0.000 0.000 0.000 0.000 0.000 0.000 0.253Bahala 0.960 0.126 0.000 0.000 0.000 0.000 0.000 0.000 0.000 0.000 1.086Bartondi 0.253 0.025 0.025 0.000 0.000 0.000 0.000 0.000 0.000 0.000 0.303Dudhi 0.631 0.177 0.025 0.000 0.025 0.000 0.000 0.025 0.000 0.000 0.883Glyricidia 1.465 0.000 0.000 0.000 0.000 0.000 0.000 0.000 0.000 0.000 1.465Others 0.505 0.101 0.025 0.000 0.025 0.051 0.000 0.000 0.000 0.000 0.707Total 4.067 0.656 0.151 0.000 0.050 0.051 0.000 0.025 0.000 0.000 5.000
Grand
Total24.573 7.299 6.211 2.400 0.151 0.202 0.025 0.025 0.000 0.000 40.886
STATEMENT-II
Estimated Growing Stock: No. of sound trees per hectare
Group/
Species
Girth classwise classification in cms
Group D :- Other Species
Group B :- Species of Special Utility
Group C :- Species of Minor Forest Produce
Page 56
Working Circle : Encroachment Eviction & Rehabilitation W.C. Division : Hingoli Population area (ha): 3425.201
Period of Enumeration : 2013-14 Sample area (ha): 39.600Working Plan by :- Shri V.J.Warvantkar, I.F.S. Intensity of sampling (%): 1.16
15U30 31U45 46U60 61U75 76U90 91U105 106U120 121U135 136U150 Above 150 Total
Lendia 67.968 18.681 10.66 2.691 0 0 0 0 0 0 100
Teak 61.409 21.401 15.787 1.404 0 0 0 0 0 0 100
Total 62.776 20.834 14.718 1.672 0.000 0.000 0.000 0.000 0.000 0.000 100
Dhawada 43.818 43.818 8.243 0.000 2.766 1.356 0.000 0.000 0.000 0.000 100Hiwar 66.447 33.553 0.000 0.000 0.000 0.000 0.000 0.000 0.000 0.000 100Kudai 60.079 30.040 0.000 0.000 9.881 0.000 0.000 0.000 0.000 0.000 100Moin 33.407 16.703 27.692 11.209 0.000 5.495 5.495 0.000 0.000 0.000 100Khair 57.062 42.938 0.000 0.000 0.000 0.000 0.000 0.000 0.000 0.000 100Total 45.609 37.730 9.649 1.770 2.638 1.736 0.868 0.000 0.000 0.000 100
Apta 100.000 0.000 0.000 0.000 0.000 0.000 0.000 0.000 0.000 0.000 100Charoli 0.000 50.000 50.000 0.000 0.000 0.000 0.000 0.000 0.000 0.000 100Moha 0.000 40.157 0.000 0.000 0.000 59.843 0.000 0.000 0.000 0.000 100Neem 22.160 11.361 28.976 37.503 0.000 0.000 0.000 0.000 0.000 0.000 100Palas 60.672 17.530 18.749 3.048 0.000 0.000 0.000 0.000 0.000 0.000 100Tendu 89.745 6.553 0.926 0.926 0.926 0.926 0.000 0.000 0.000 0.000 100Total 56.390 15.313 18.583 9.187 0.105 0.422 0.000 0.000 0.000 0.000 100
Amaltas 58.416 41.584 0.000 0.000 0.000 0.000 0.000 0.000 0.000 0.000 100Babhul 30.040 39.921 30.040 0.000 0.000 0.000 0.000 0.000 0.000 0.000 100Bahala 88.398 11.602 0.000 0.000 0.000 0.000 0.000 0.000 0.000 0.000 100Bartondi 83.498 8.251 8.251 0.000 0.000 0.000 0.000 0.000 0.000 0.000 100Dudhi 71.461 20.045 2.831 0.000 2.831 0.000 0.000 2.831 0.000 0.000 100Glyricidia 100.000 0.000 0.000 0.000 0.000 0.000 0.000 0.000 0.000 0.000 100Others 71.429 14.286 3.536 0.000 3.536 7.214 0.000 0.000 0.000 0.000 100Total 81.340 13.120 3.020 0.000 1.000 1.020 0.000 0.500 0.000 0.000 100
Grand
Total60.101 17.852 15.191 5.870 0.369 0.494 0.061 0.061 0.000 0.000 100
STATEMENT-III
Percentage distribution of total stock of a species overall girth classes
Group A :- Species of General Utility
Group C :- Species of Minor Forest Produce
Group/
Species
Girth classwise classification in cms
Group D :- Other Species
Group B :- Species of Special Utility
Page 57
Working Circle : Encroachment Eviction & Rehabilitation W.C. Division : Hingoli Population area (ha): 3425.201Period of Enumeration : 2013-14 Sample area (ha): 39.600Working Plan by :- Shri V.J.Warvantkar, I.F.S. Intensity of sampling (%): 1.16
15U30 31U45 46U60 61U75 76U90 91U105 106U120 121U135 136U150 Above 150 Total
Lendia 5.242 4.85 3.252 2.125 0 0 0 0 0 0 4.635
Teak 17.983 21.099 18.29 4.208 0 0 0 0 0 0 17.6
Total 23.225 25.949 21.542 6.333 0 0 0 0 0 0 22.235
Dhawada 3.288 11.07 2.447 0.000 33.775 12.376 0.000 0.000 0.000 0.000 4.510Hiwar 0.411 0.699 0 0.000 0.000 0.000 0.000 0.000 0.000 0.000 0.372Kudai 0.619 1.041 0 0.000 16.556 0.000 0.000 0.000 0.000 0.000 0.619Moin 0.619 1.041 2.029 2.125 0.000 12.376 100.000 0.000 0.000 0.000 1.113Khair 0.411 1.041 0 0.000 0.000 0.000 0.000 0.000 0.000 0.000 0.433Total 5.348 14.892 4.476 2.125 50.331 24.752 100 0.000 0 0 7.047
Apta 0.102 0 0 0.000 0.000 0.000 0.000 0.000 0.000 0.000 0.061Charoli 0 0.343 0.403 0.000 0.000 0.000 0.000 0.000 0.000 0.000 0.122Moha 0 0.699 0 0.000 0.000 37.624 0.000 0.000 0.000 0.000 0.311Neem 4.008 6.919 20.737 69.458 0.000 0.000 0.000 0.000 0.000 0.000 10.872Palas 40.903 39.786 50.008 21.042 0.000 0.000 0.000 0.000 0.000 0.000 40.518Tendu 9.864 2.425 0.403 1.042 16.556 12.376 0.000 0.000 0.000 0.000 6.606Total 54.877 50.172 71.551 91.542 16.556 50 0 0 0 0 58.490
Amaltas 0.72 1.726 0 0.000 0.000 0.000 0.000 0.000 0.000 0.000 0.741Babhul 0.309 1.384 1.224 0.000 0.000 0.000 0.000 0.000 0.000 0.000 0.619Bahala 3.907 1.726 0 0.000 0.000 0.000 0.000 0.000 0.000 0.000 2.656Bartondi 1.03 0.343 0.403 0.000 0.000 0.000 0.000 0.000 0.000 0.000 0.741Dudhi 2.568 2.425 0.403 0.000 16.556 0.000 0.000 100.000 0.000 0.000 2.160Glyricidia 5.962 0 0 0.000 0.000 0.000 0.000 0.000 0.000 0.000 3.583Others 2.055 1.384 0.403 0.000 16.556 25.248 0.000 0.000 0.000 0.000 1.729Total 16.551 8.988 2.433 0.000 33.112 25.248 0.000 100.000 0.000 0.000 12.229
Grand
Total100 100 100 100 100 100 100 100 0 0 100
STATEMENT-IV
Percentage of total stock of a species in a girth class to the total stock in that particular girth class
Group A :- Species of General Utility
Group C :- Species of Minor Forest Produce
Group/
Species
Girth classwise classification in cms
Group D :- Other Species
Group B :- Species of Special Utility
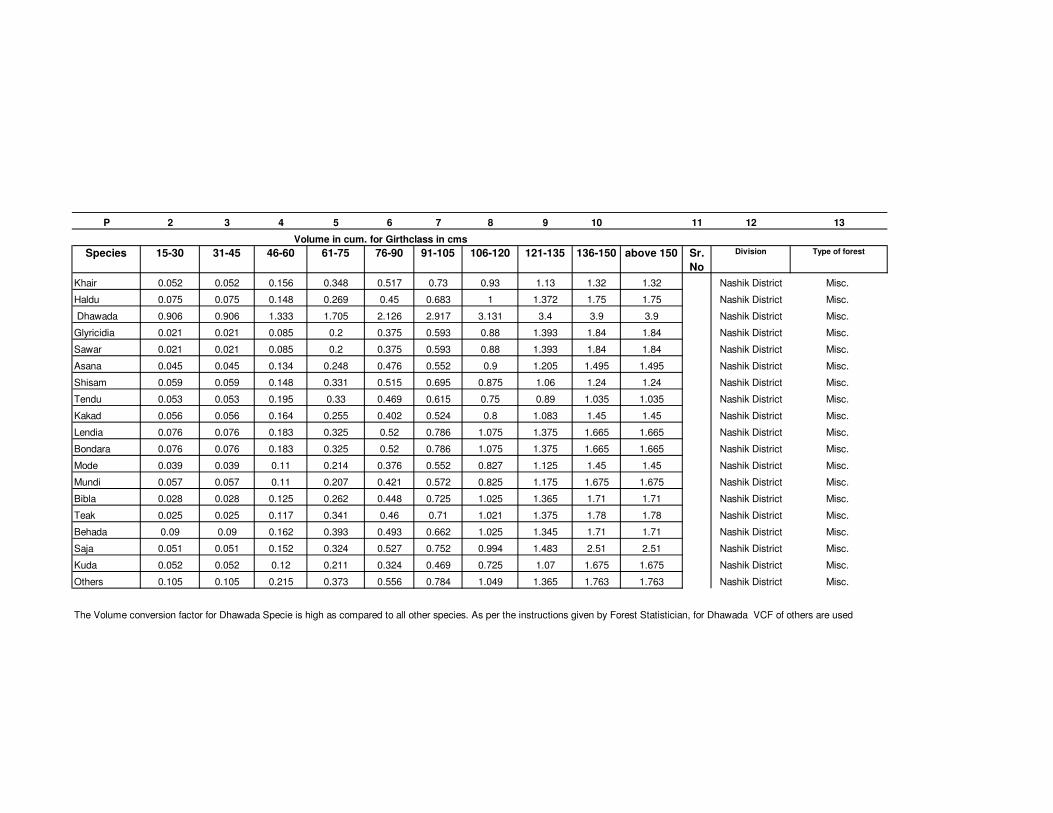


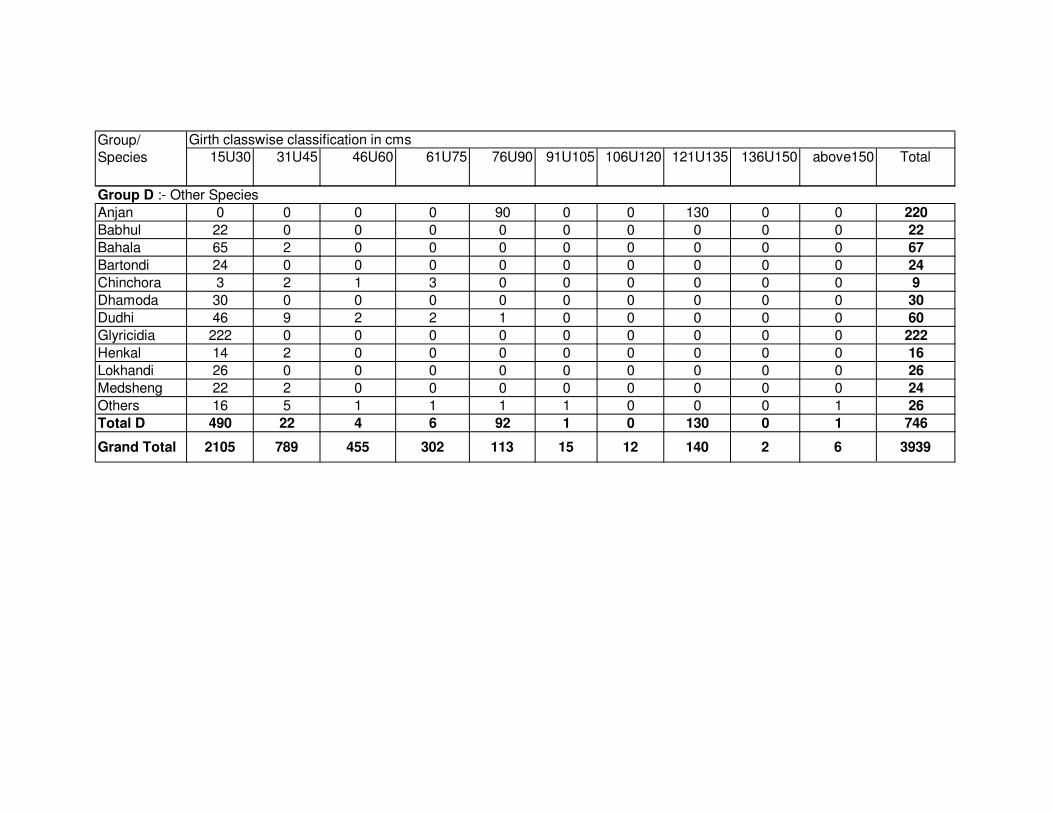


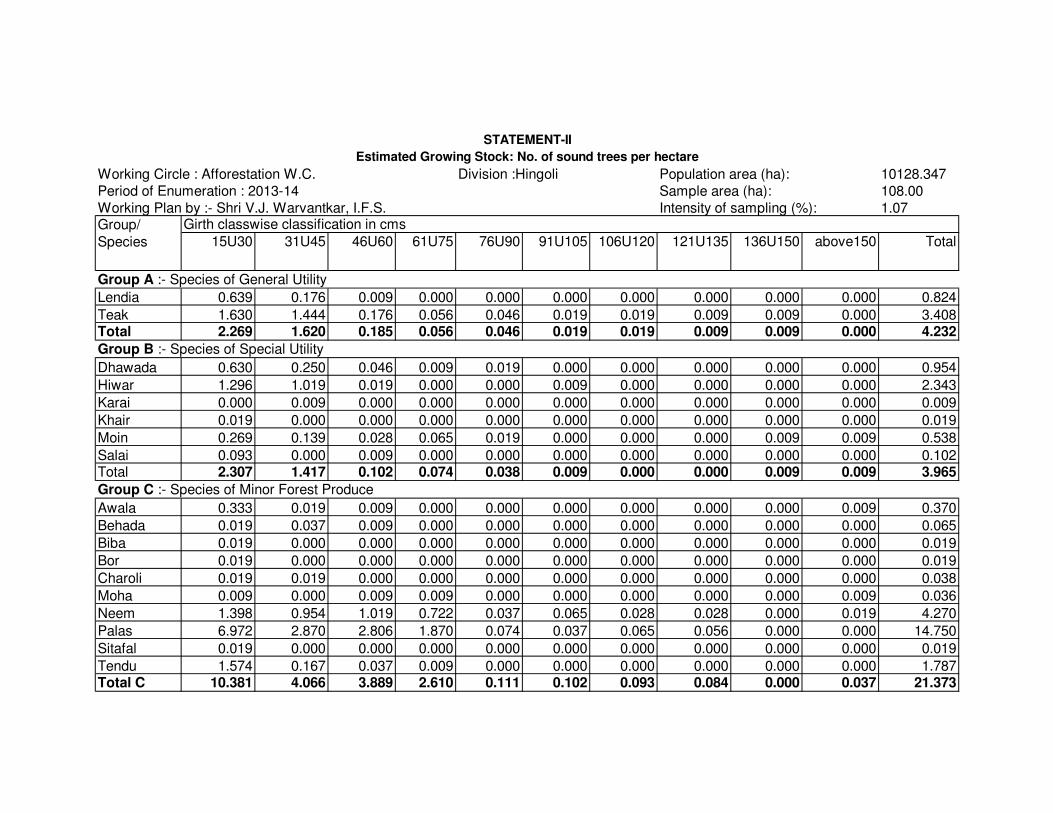
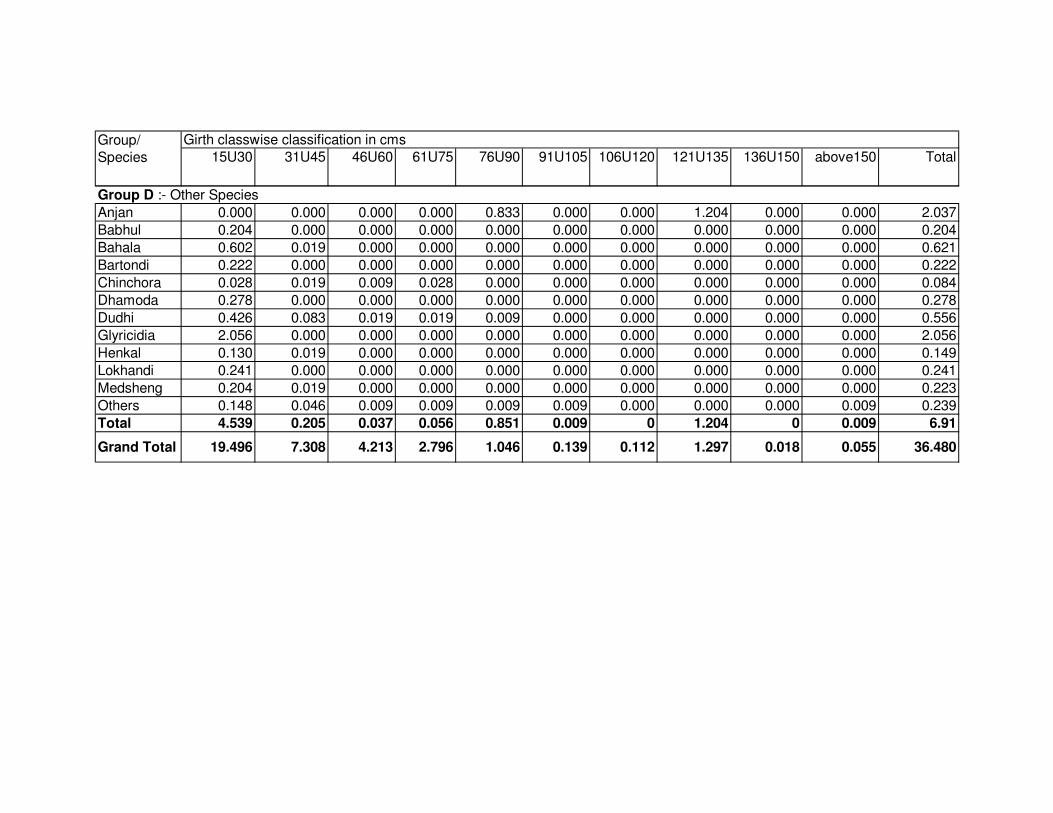
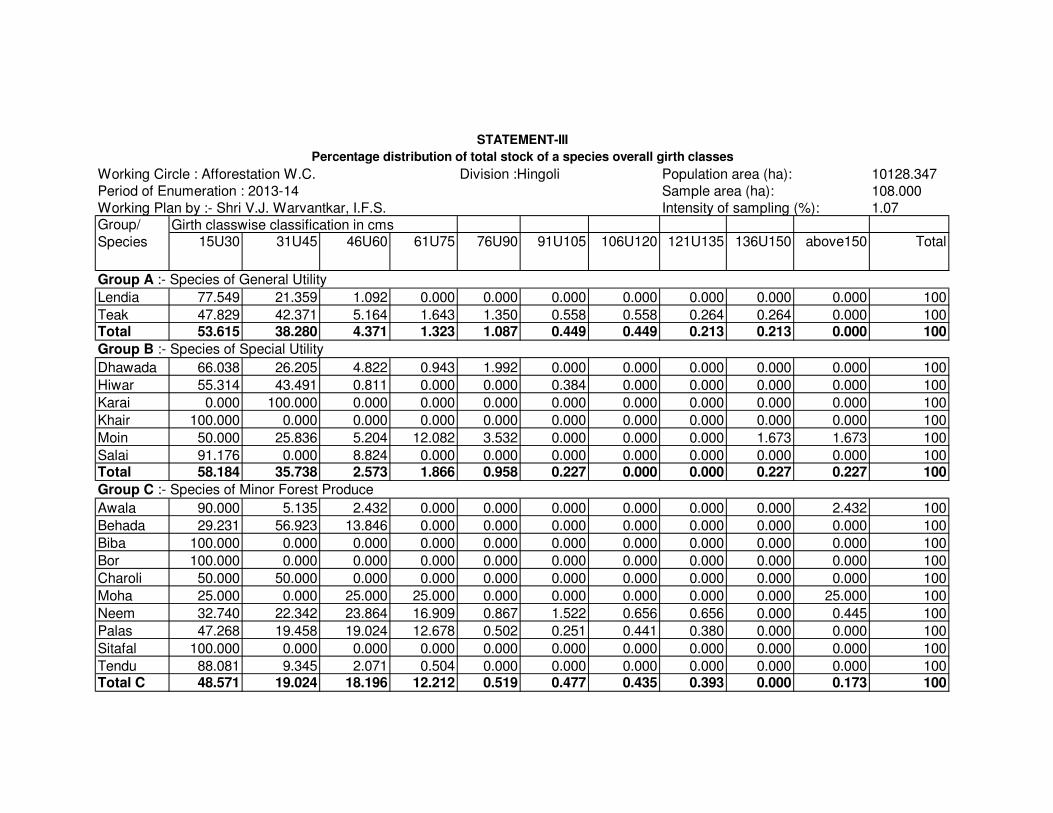
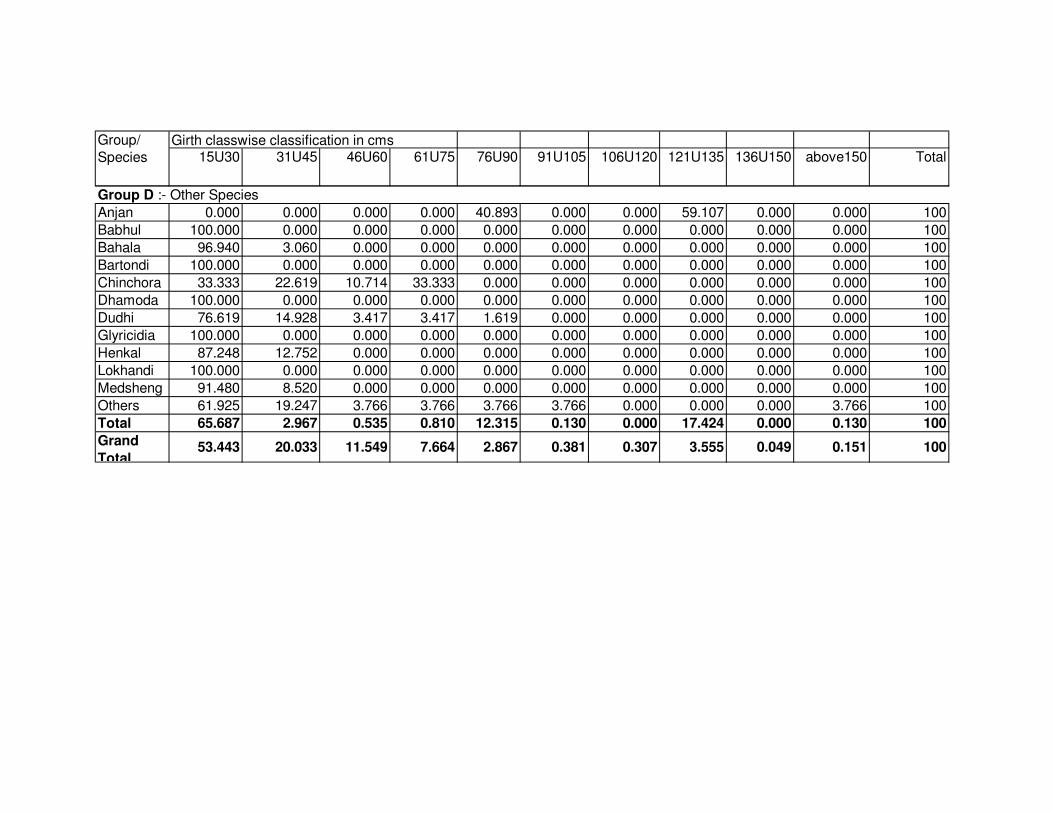
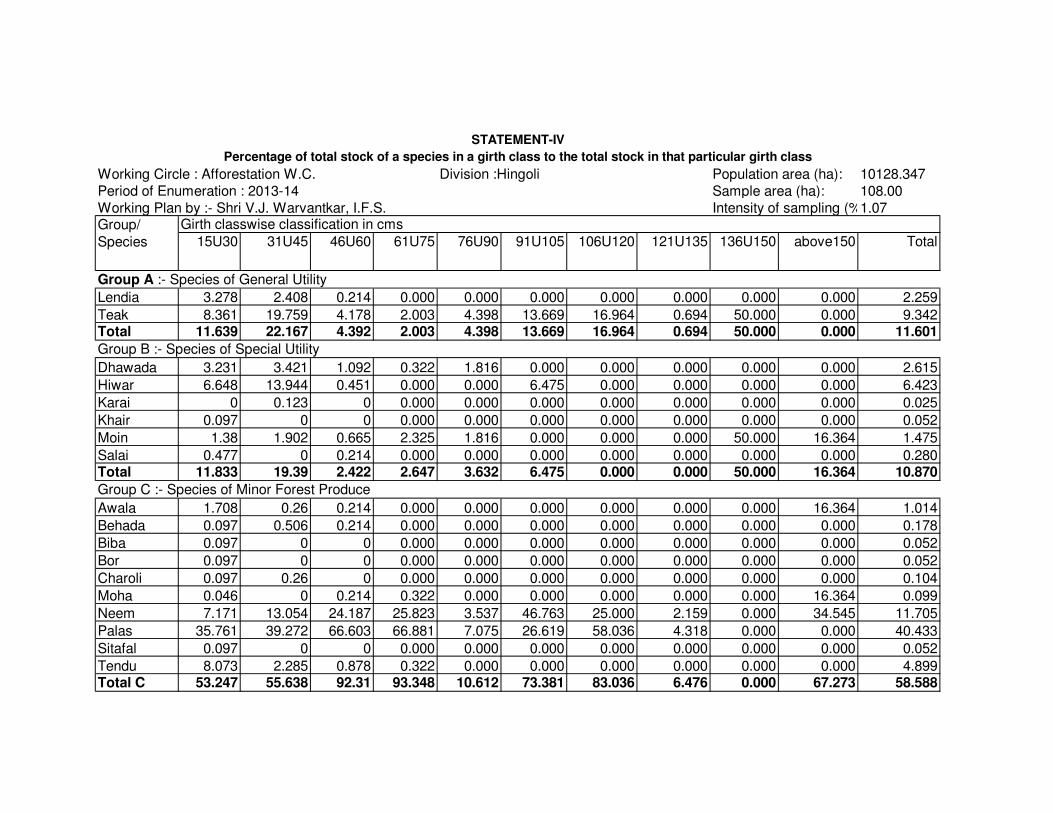

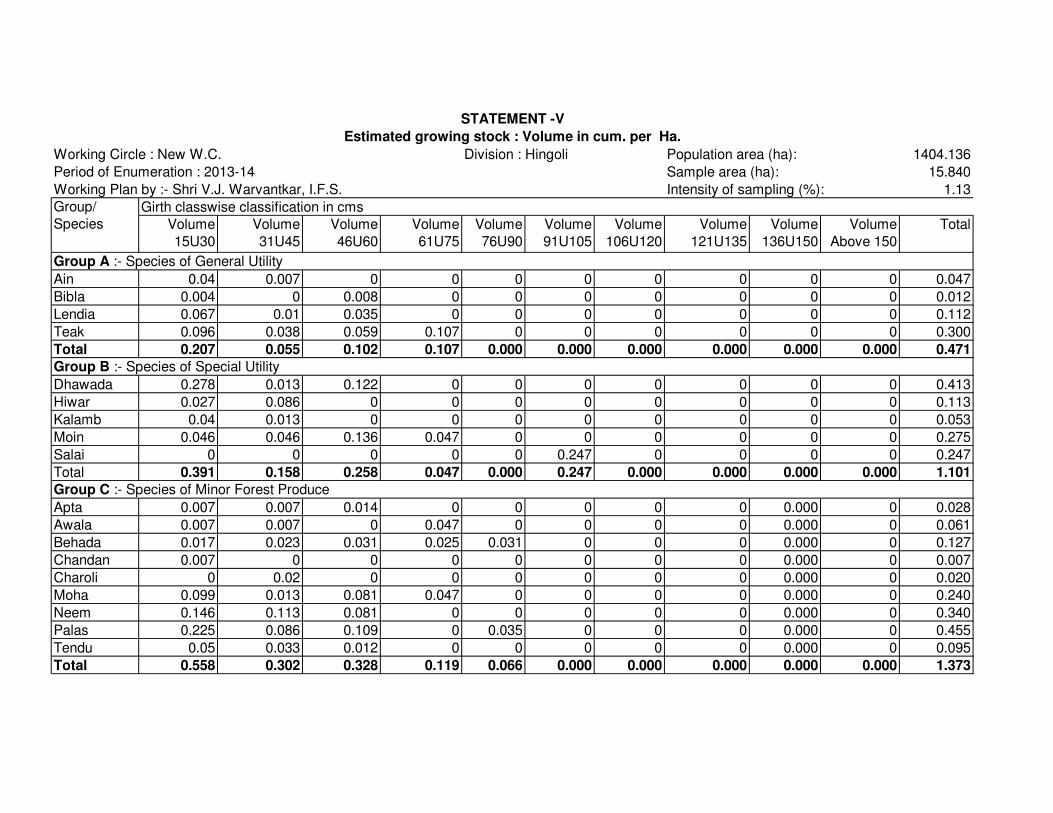
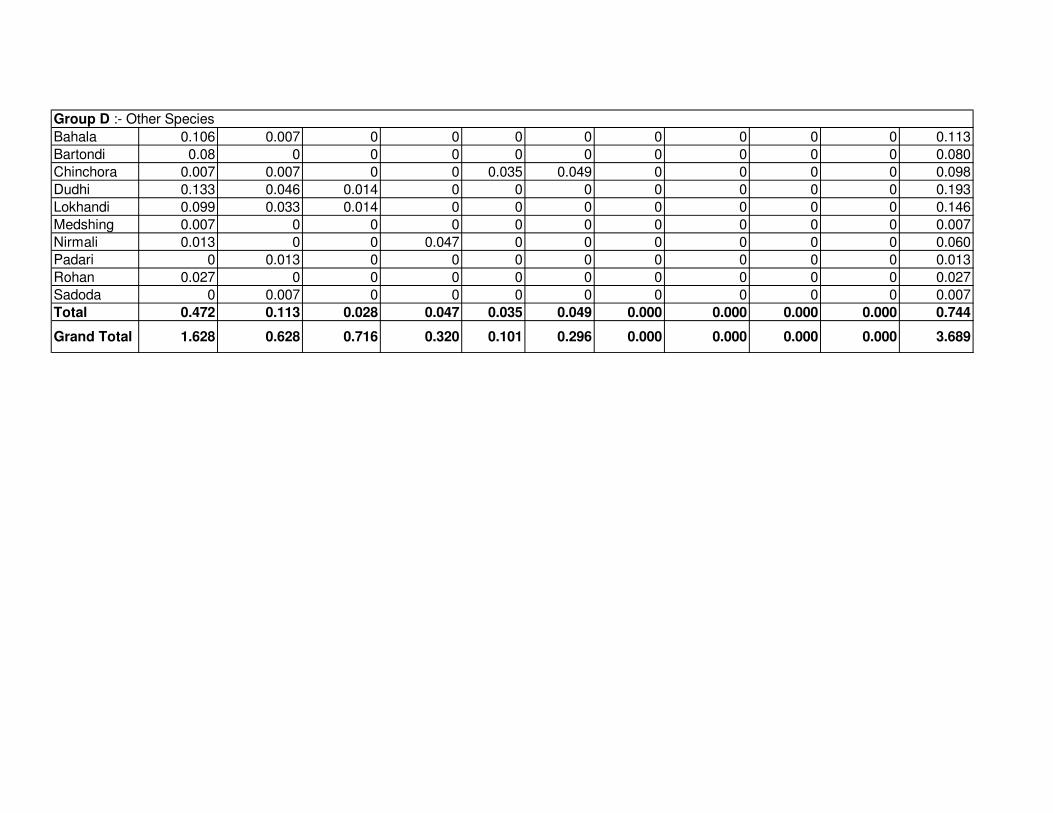
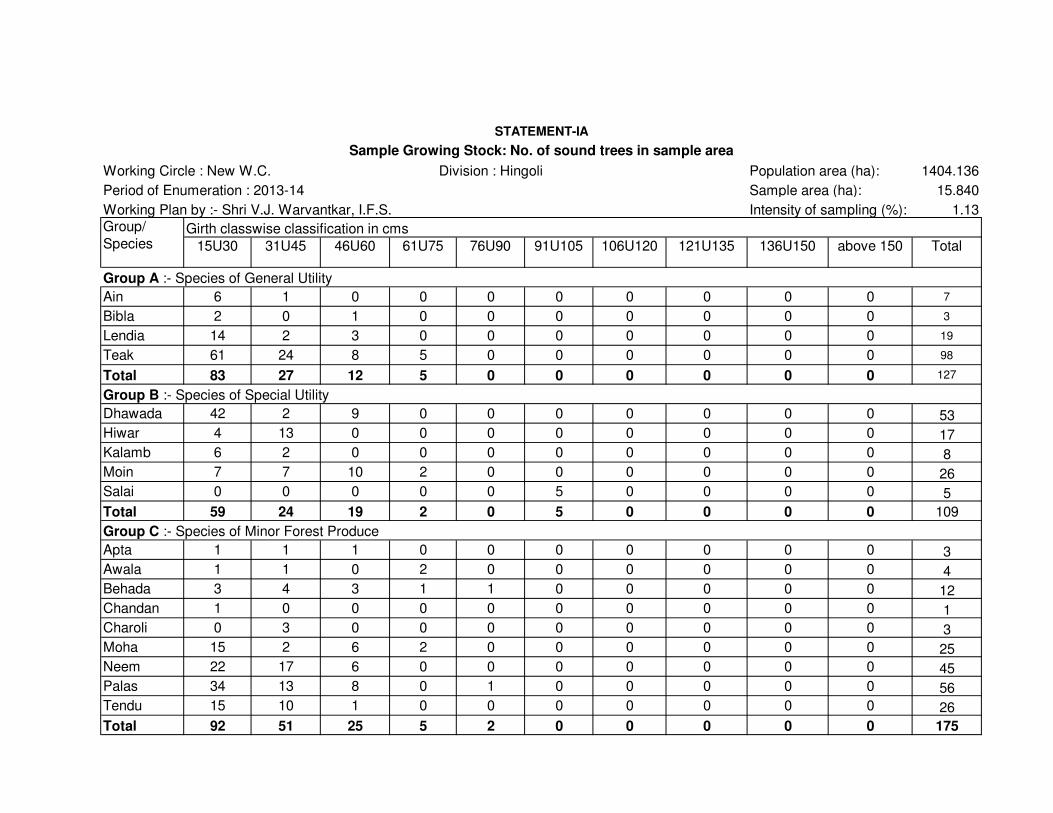

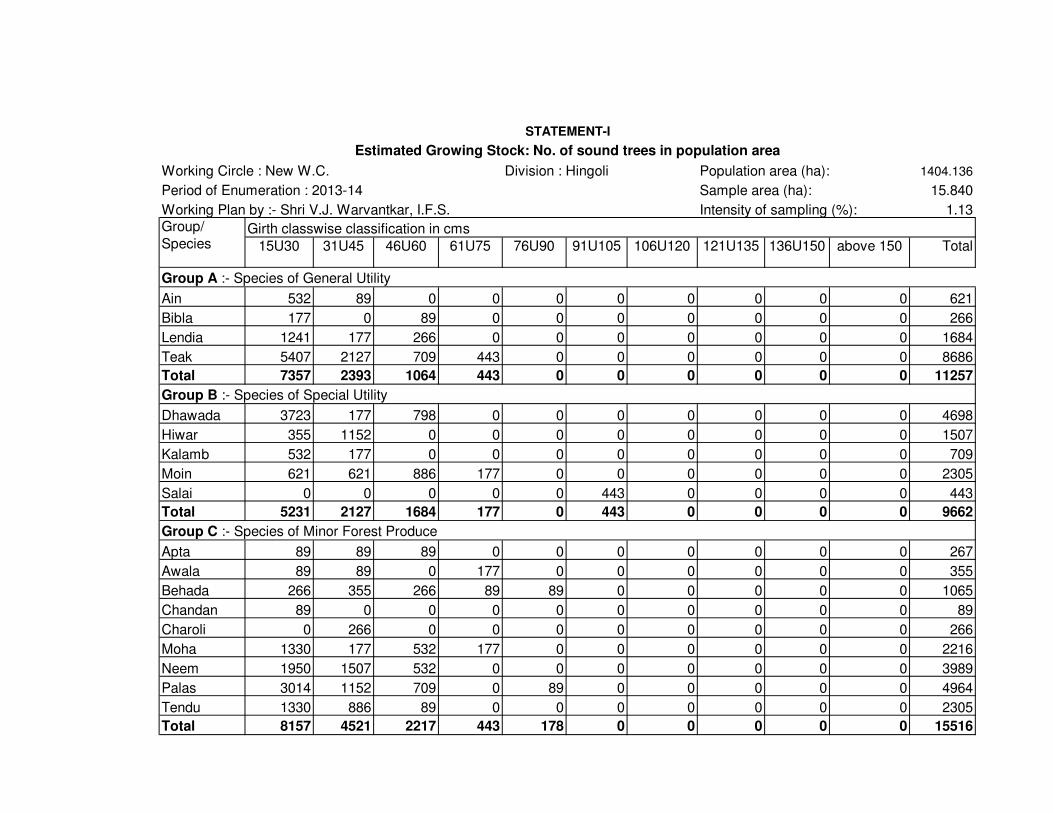
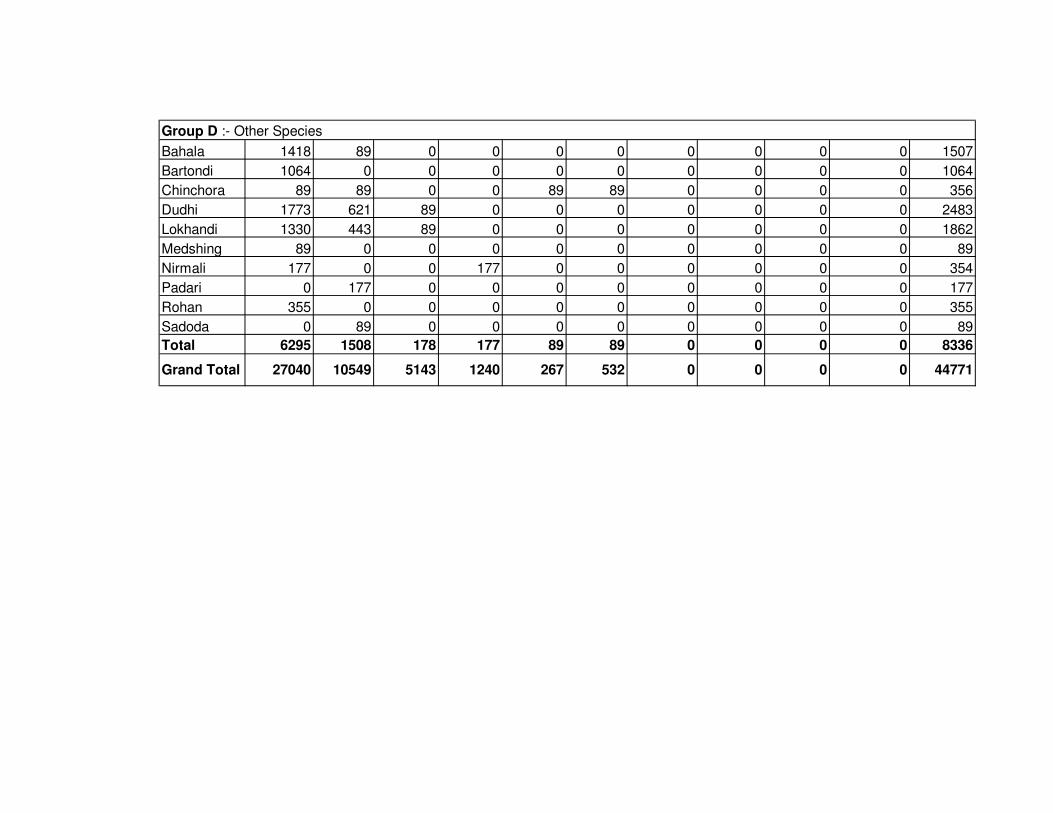
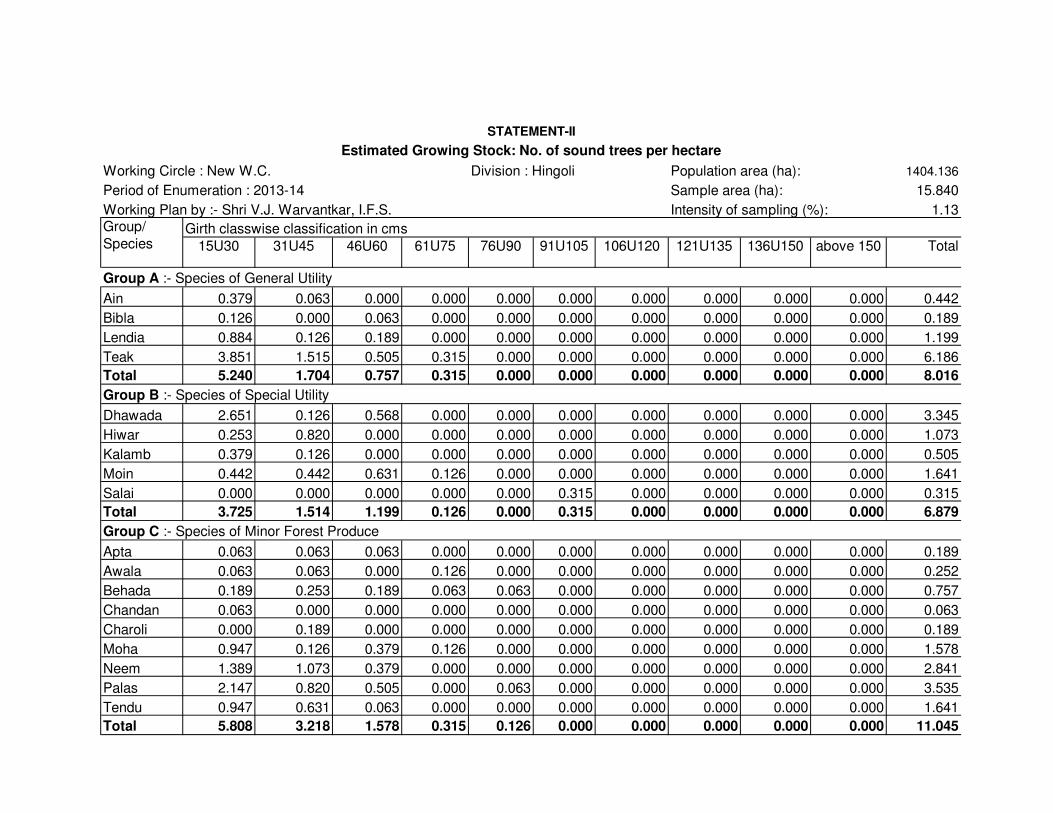
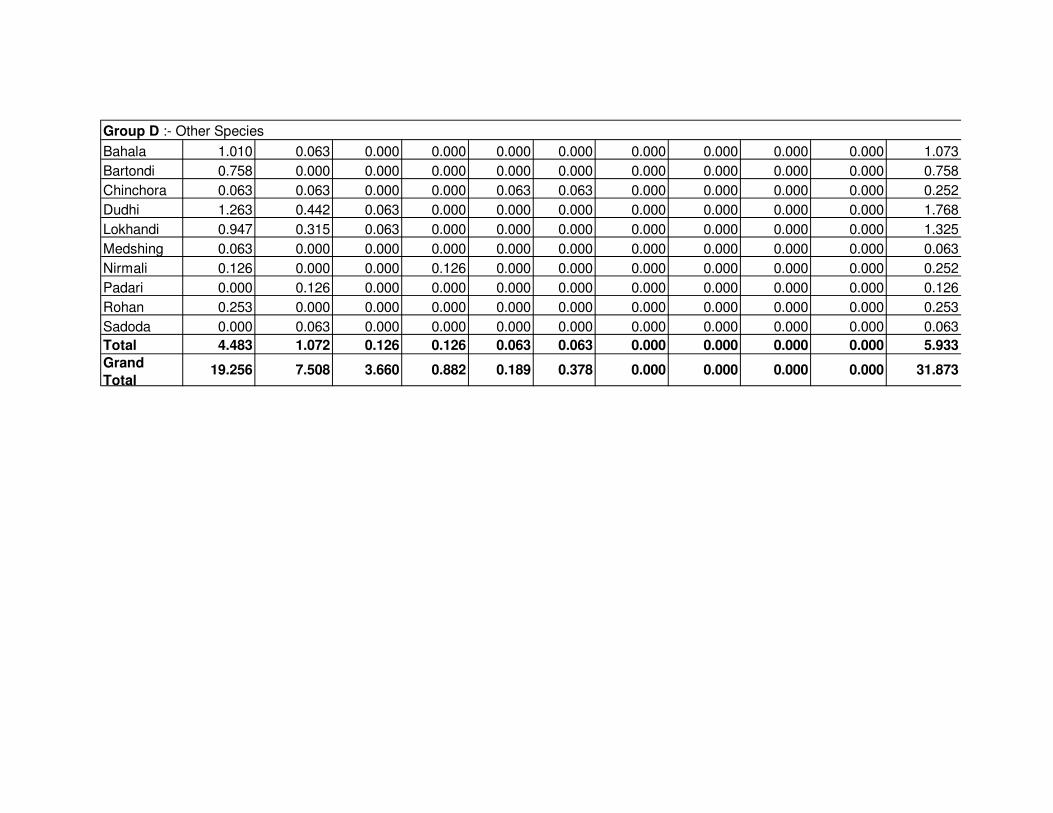


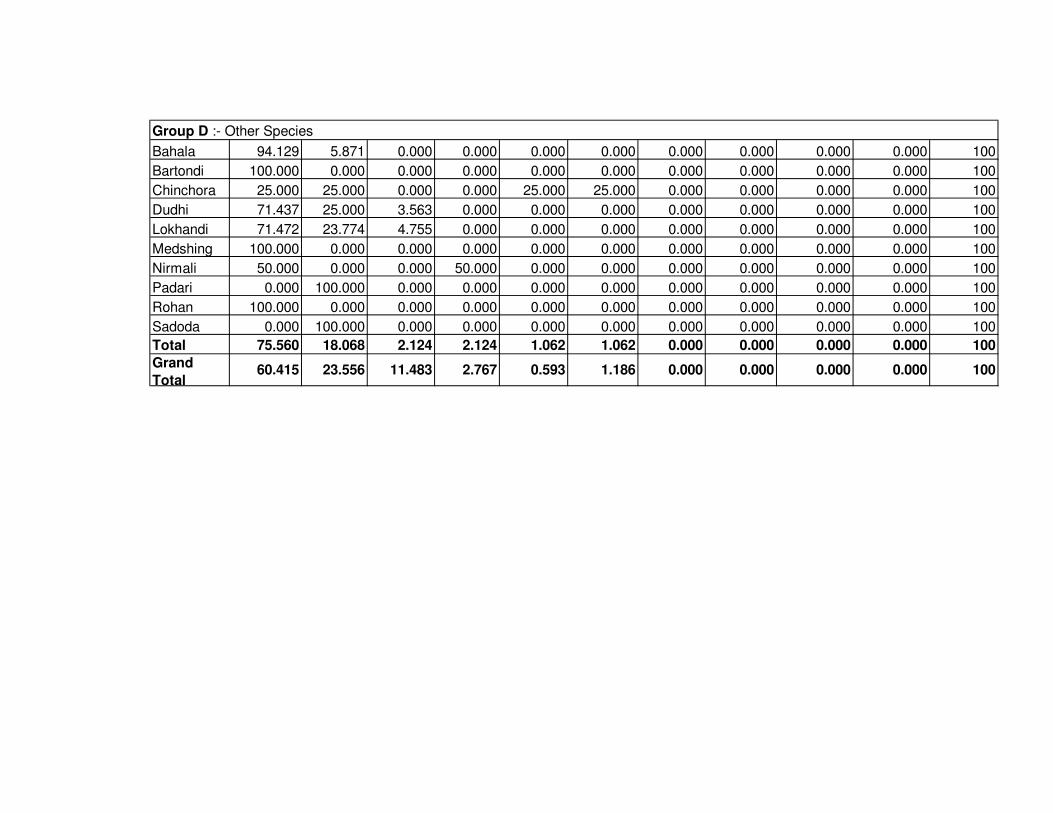

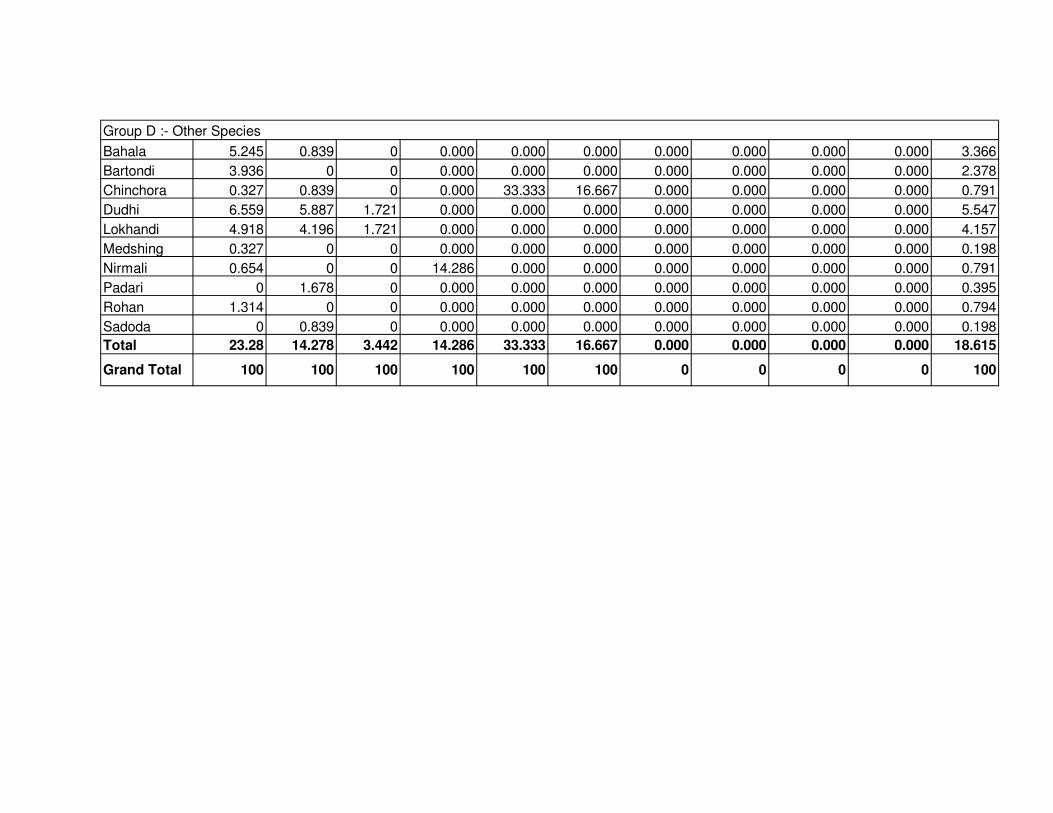
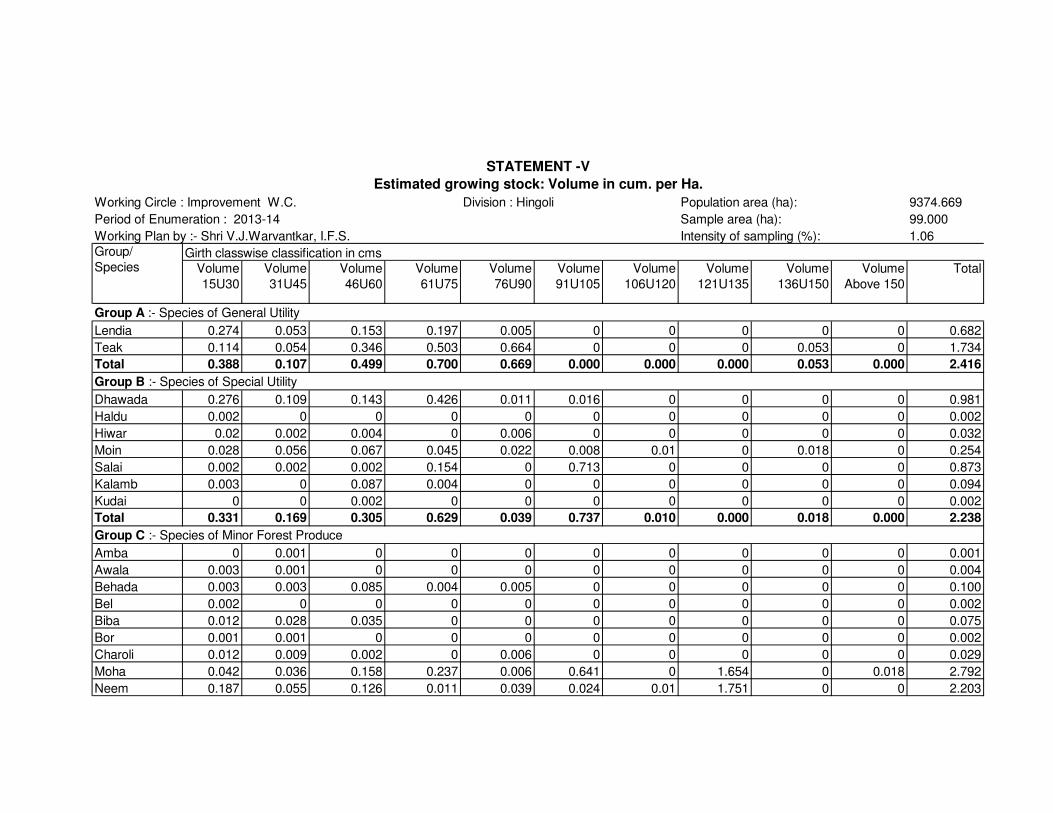
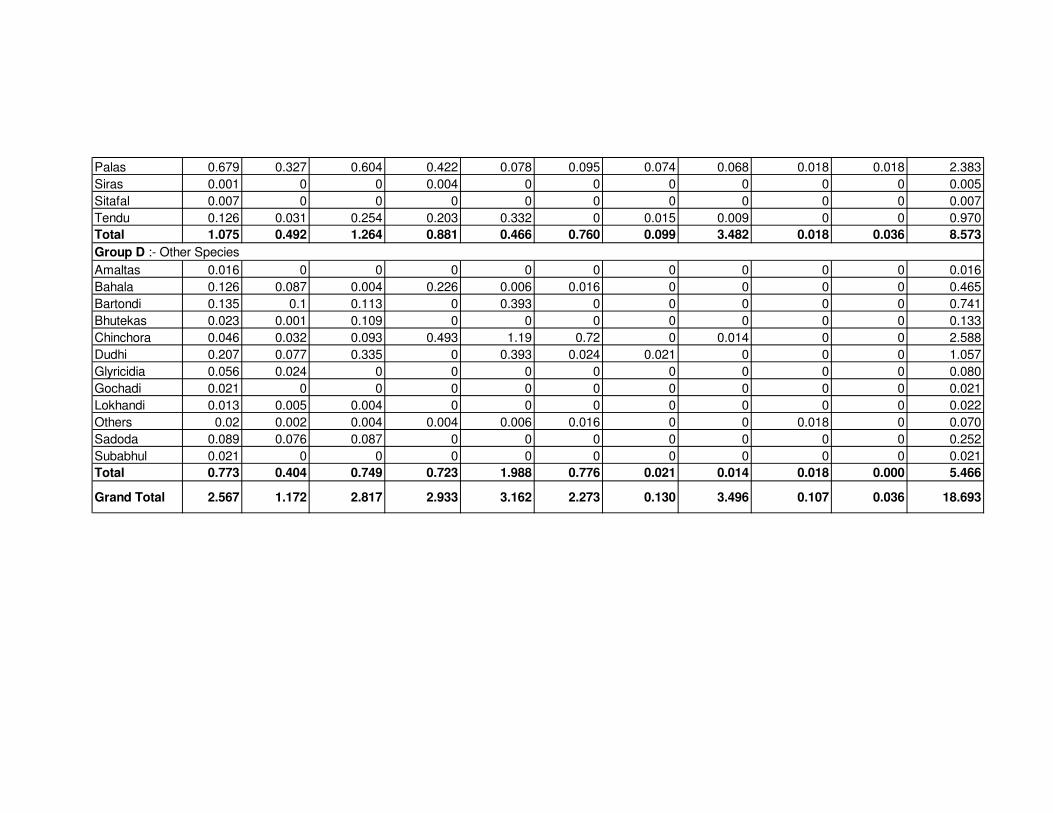
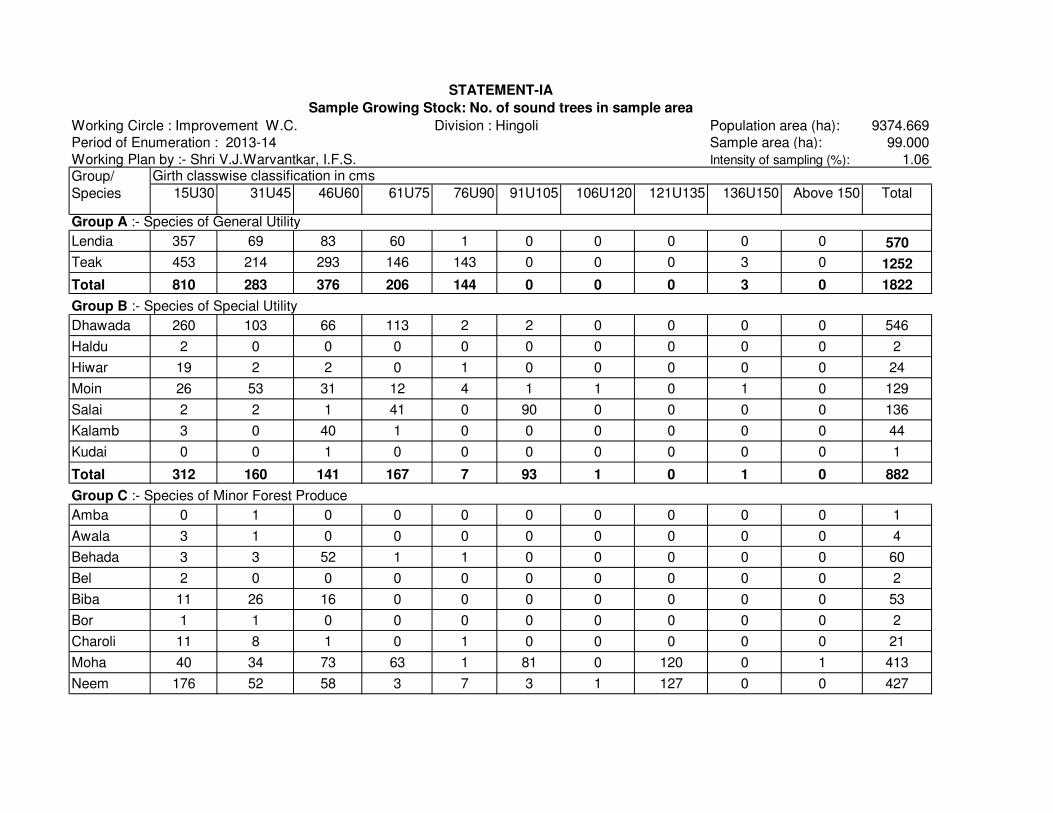
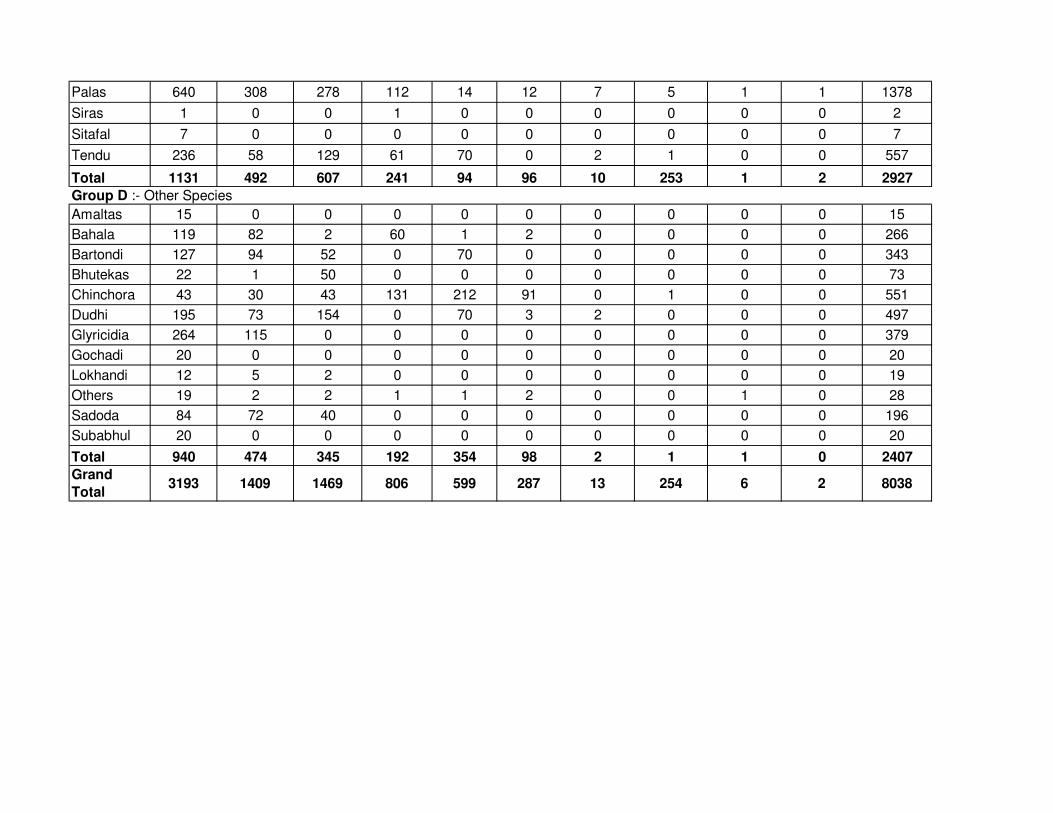
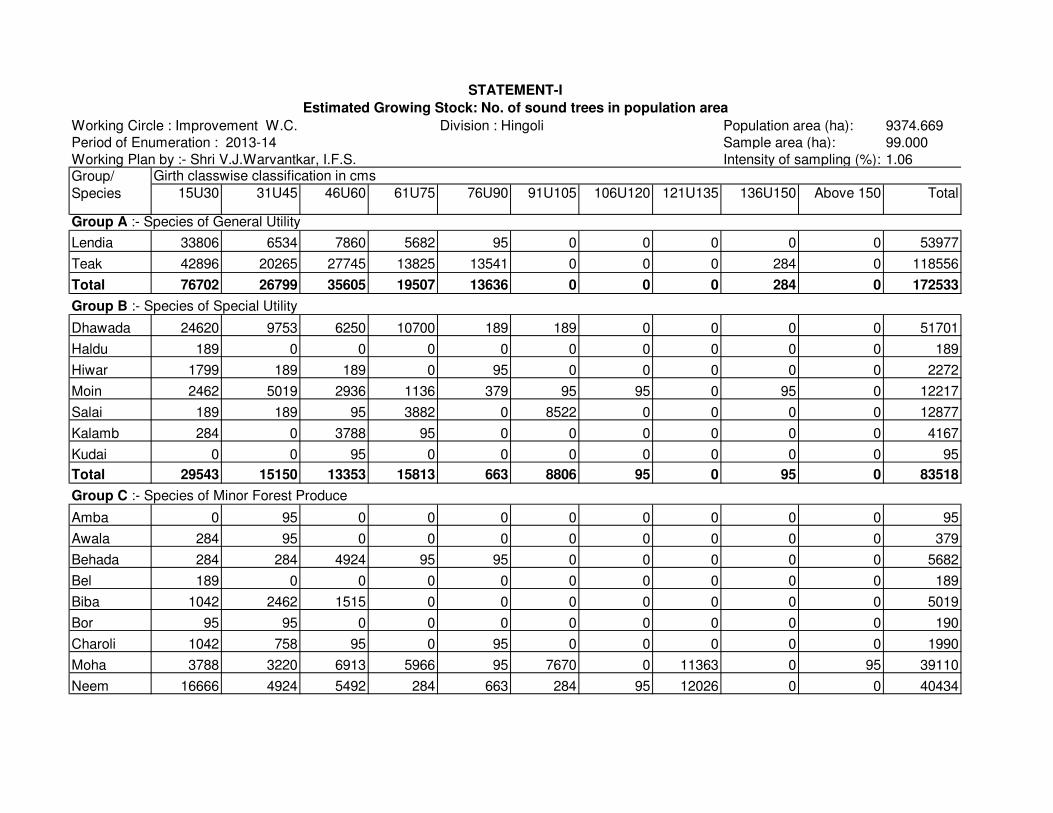

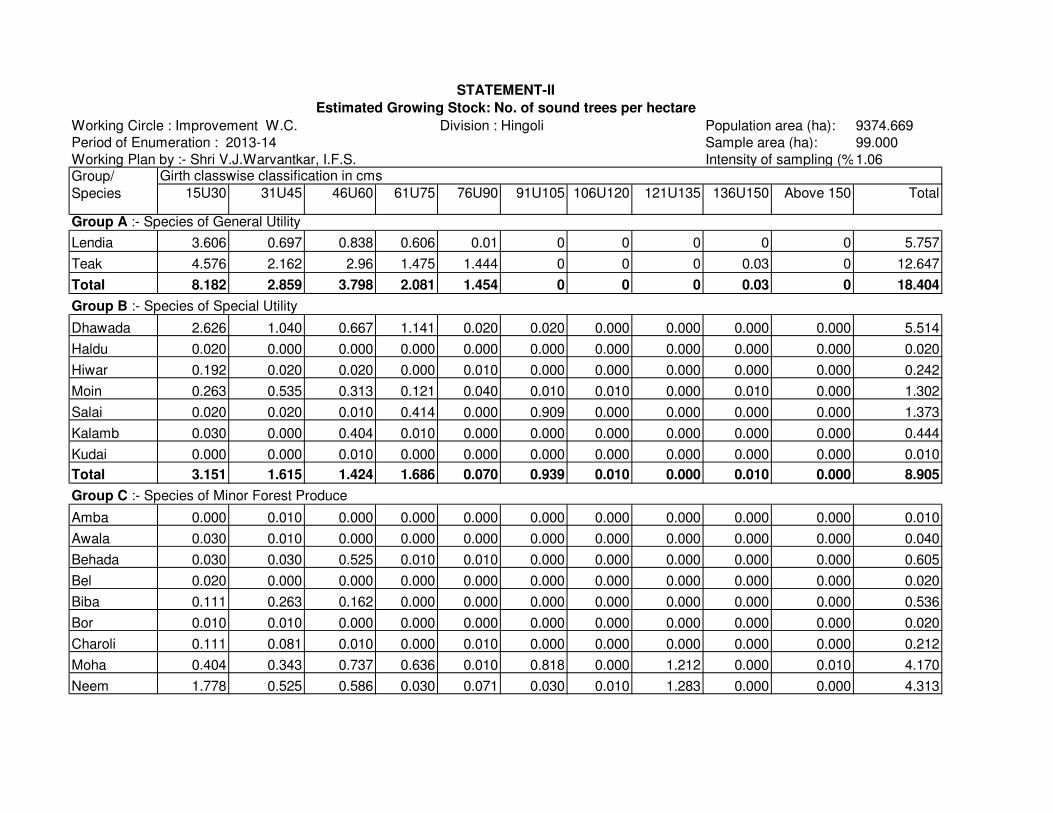
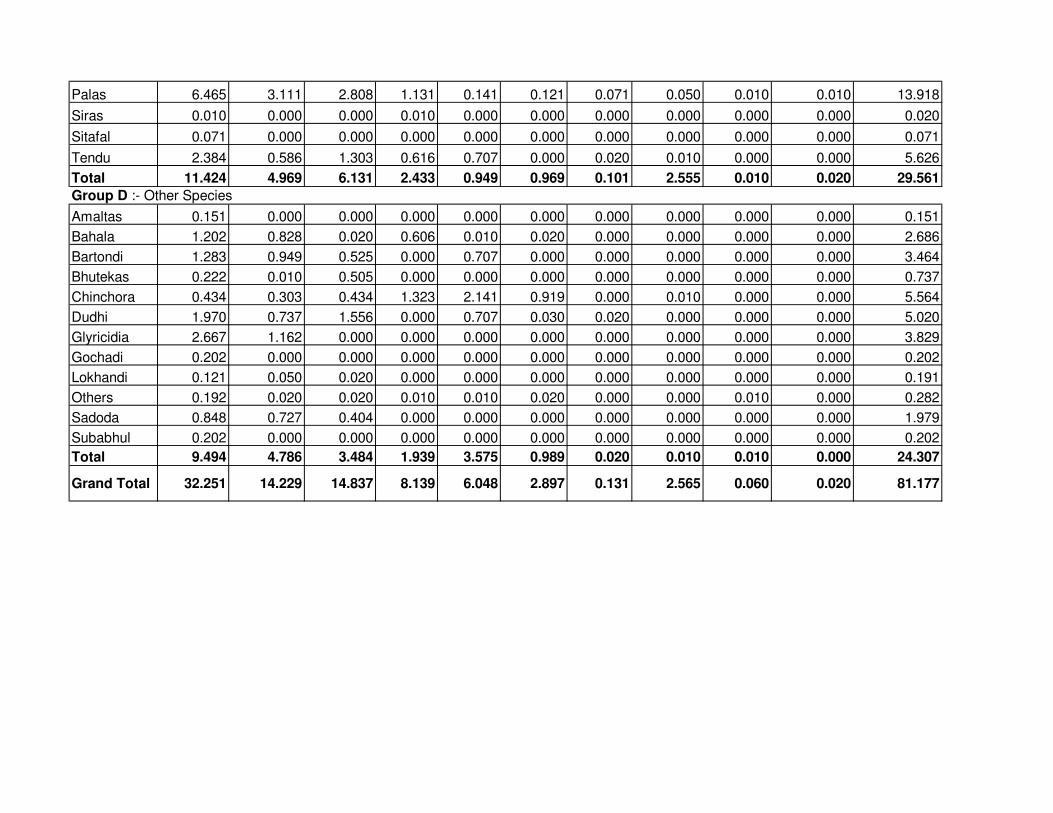
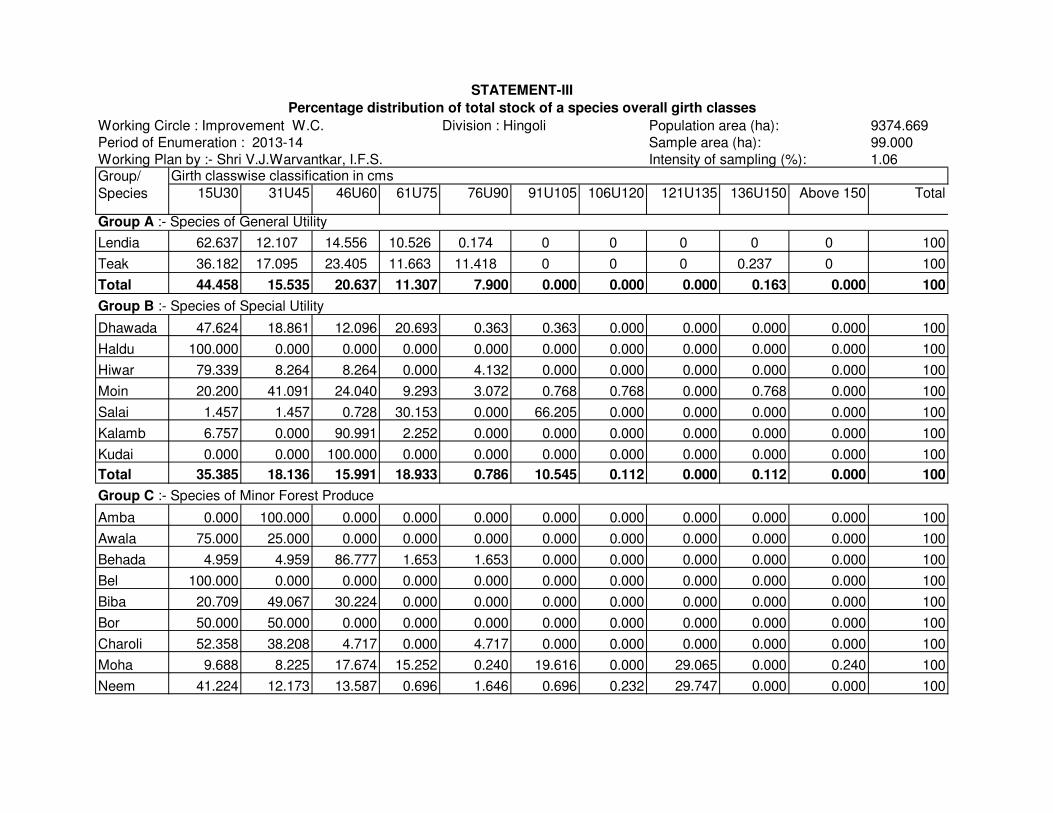
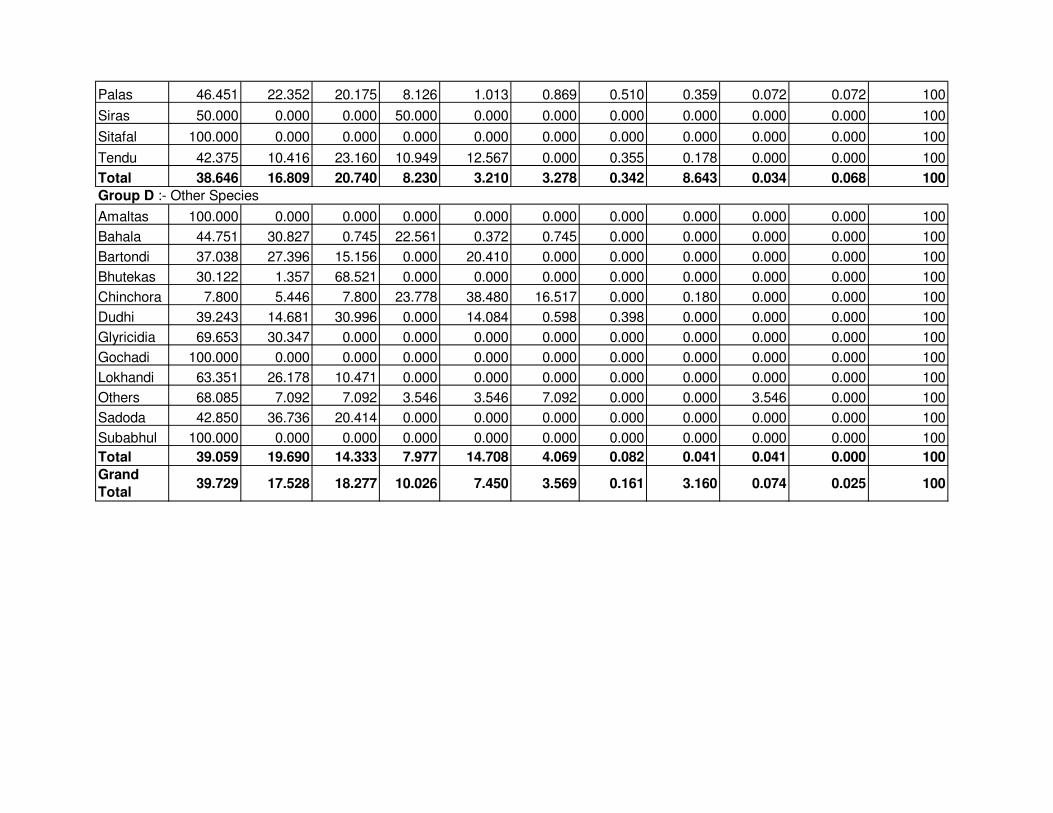

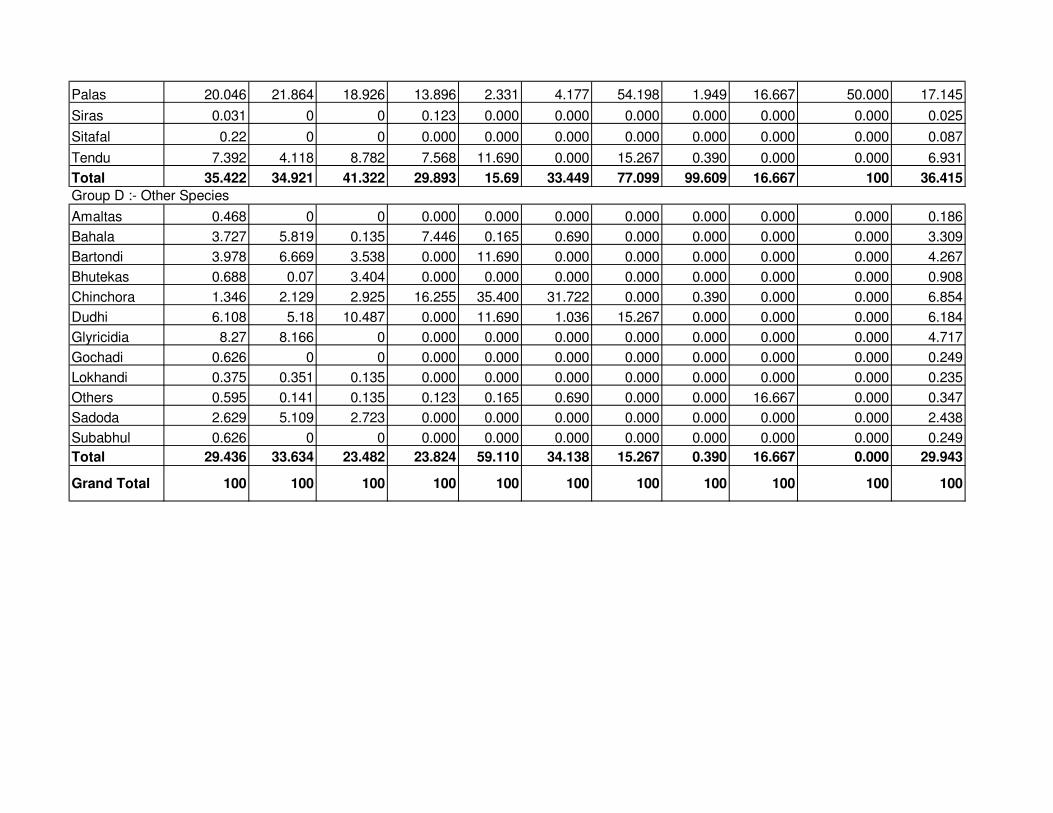
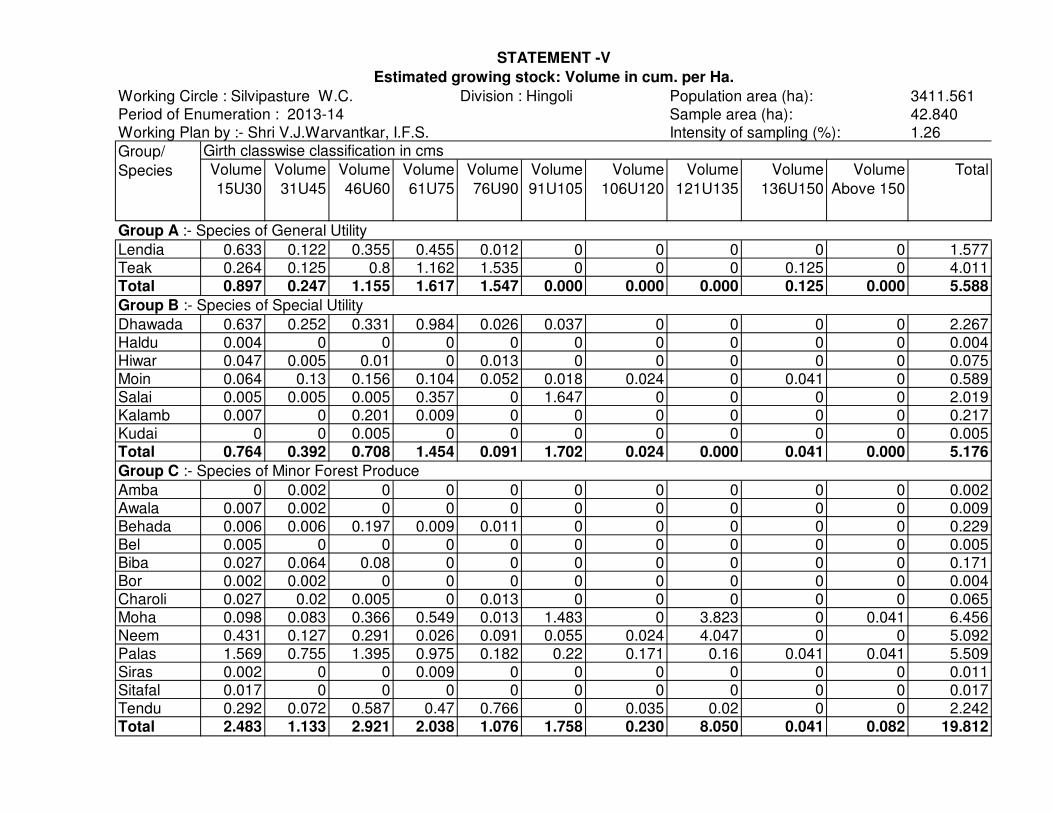
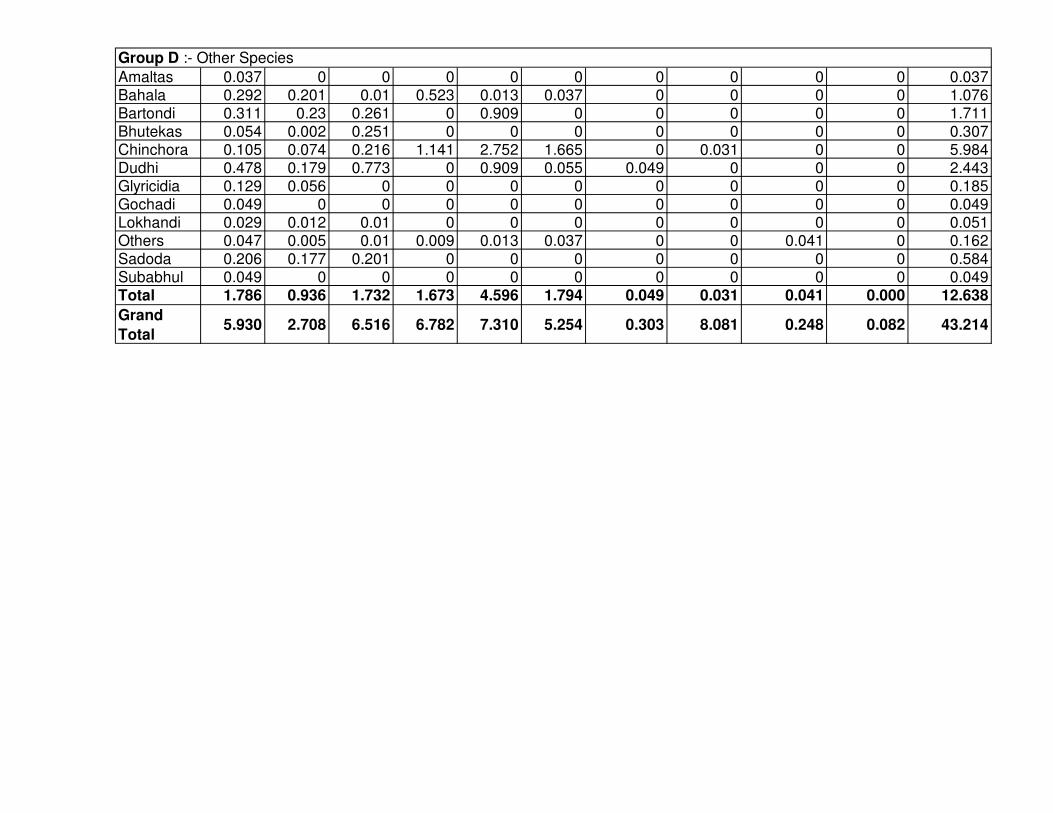

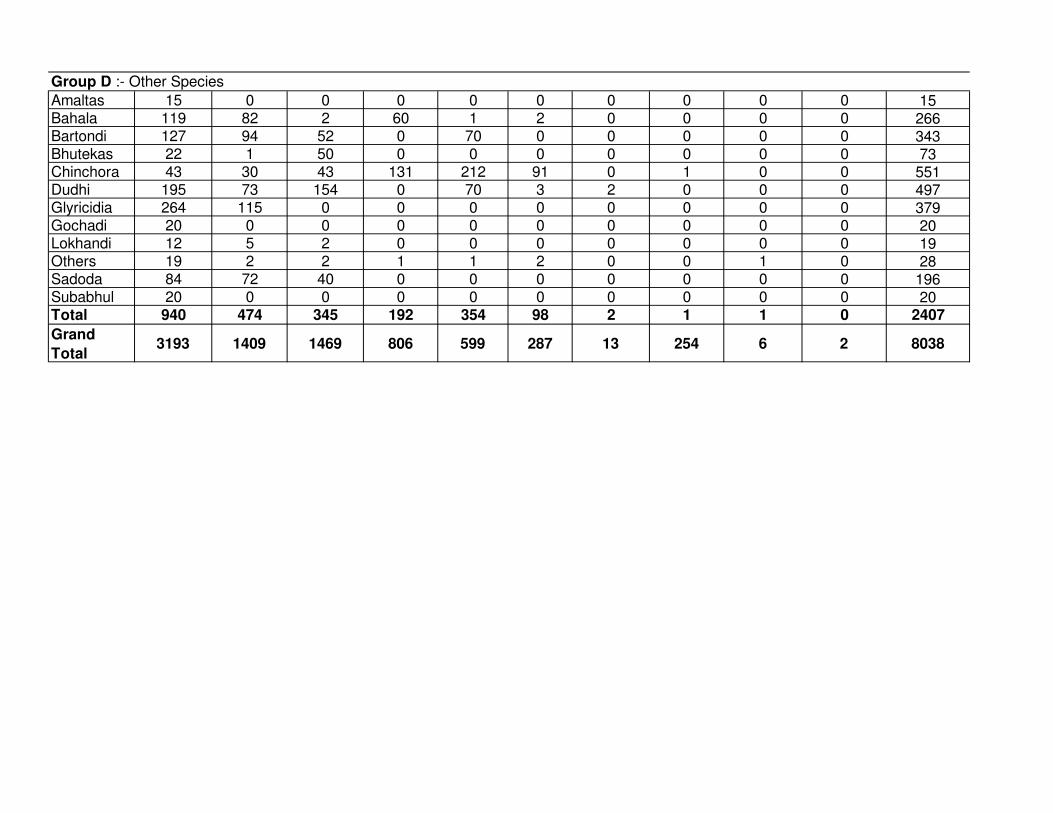
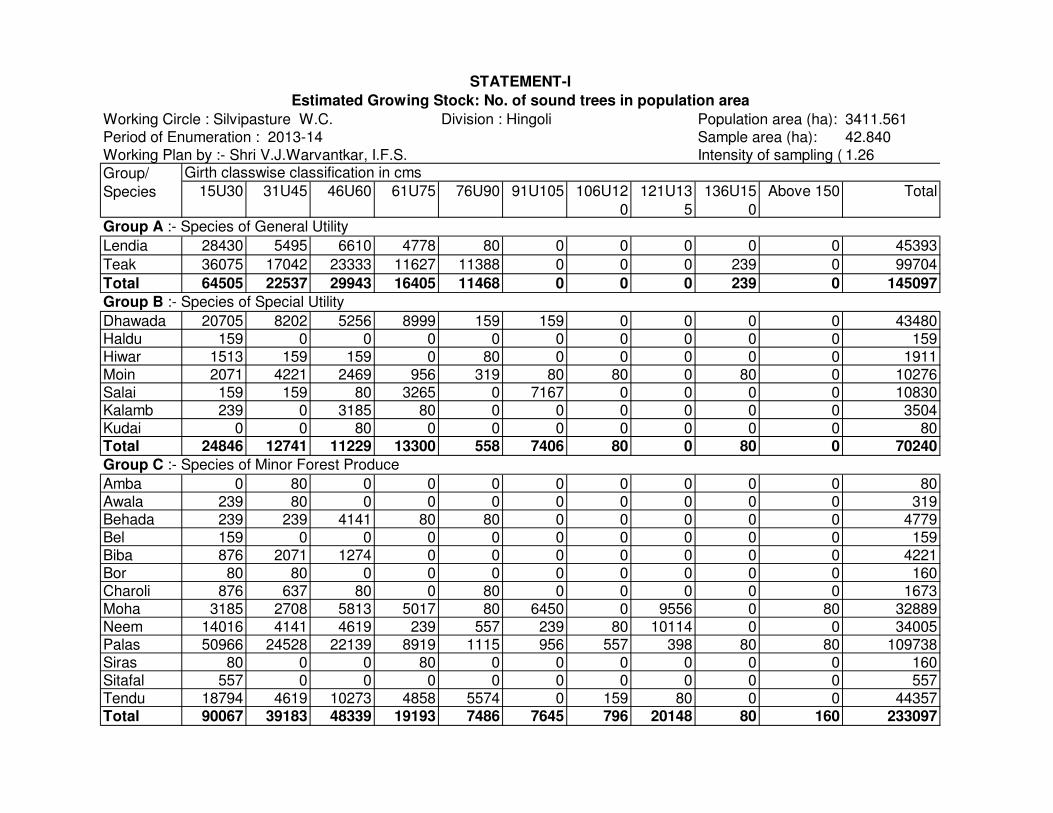

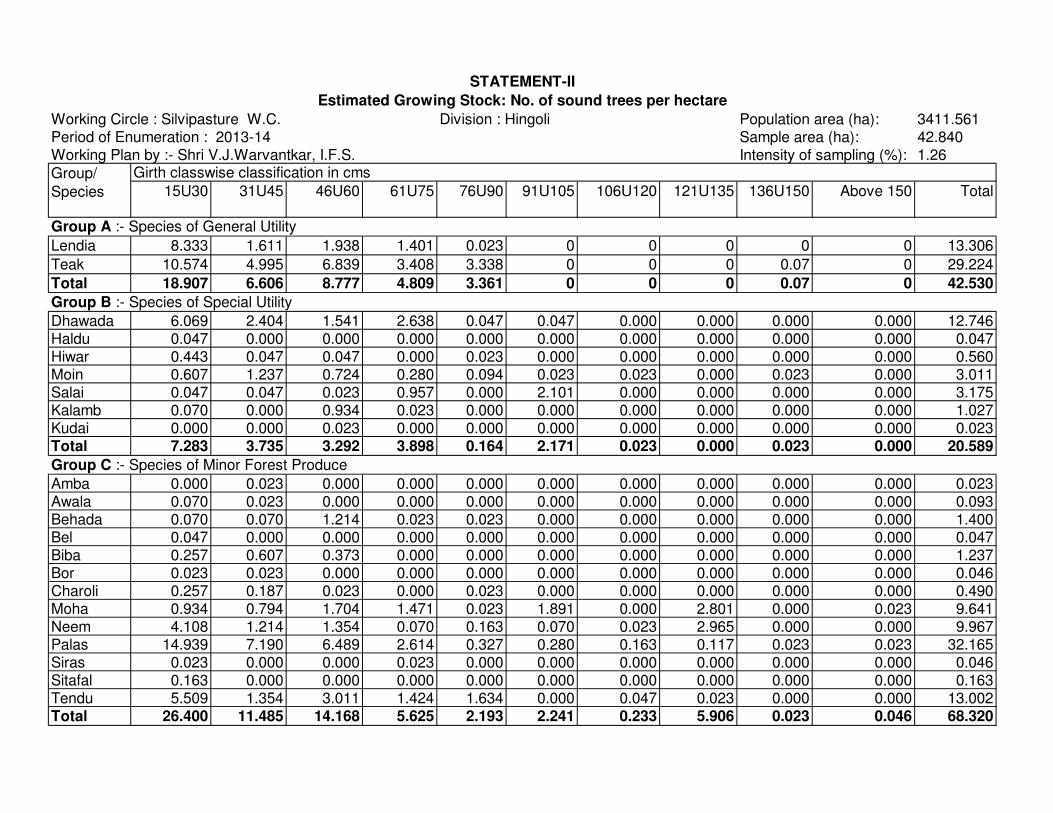
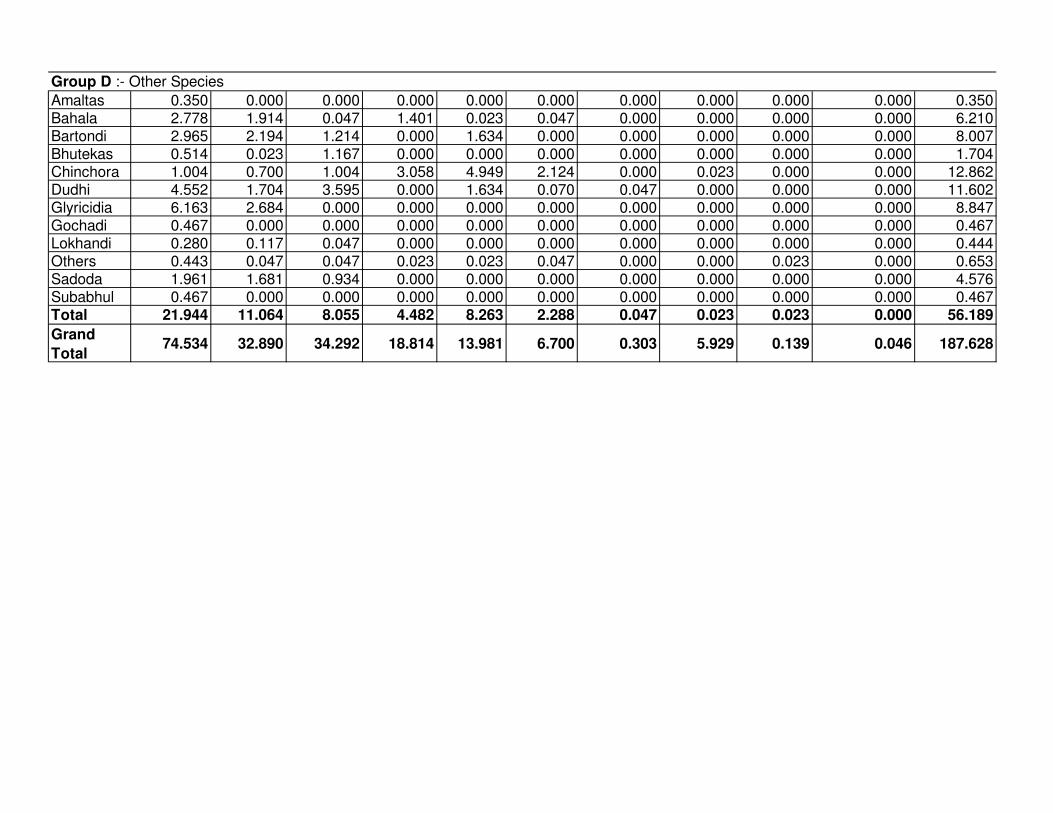
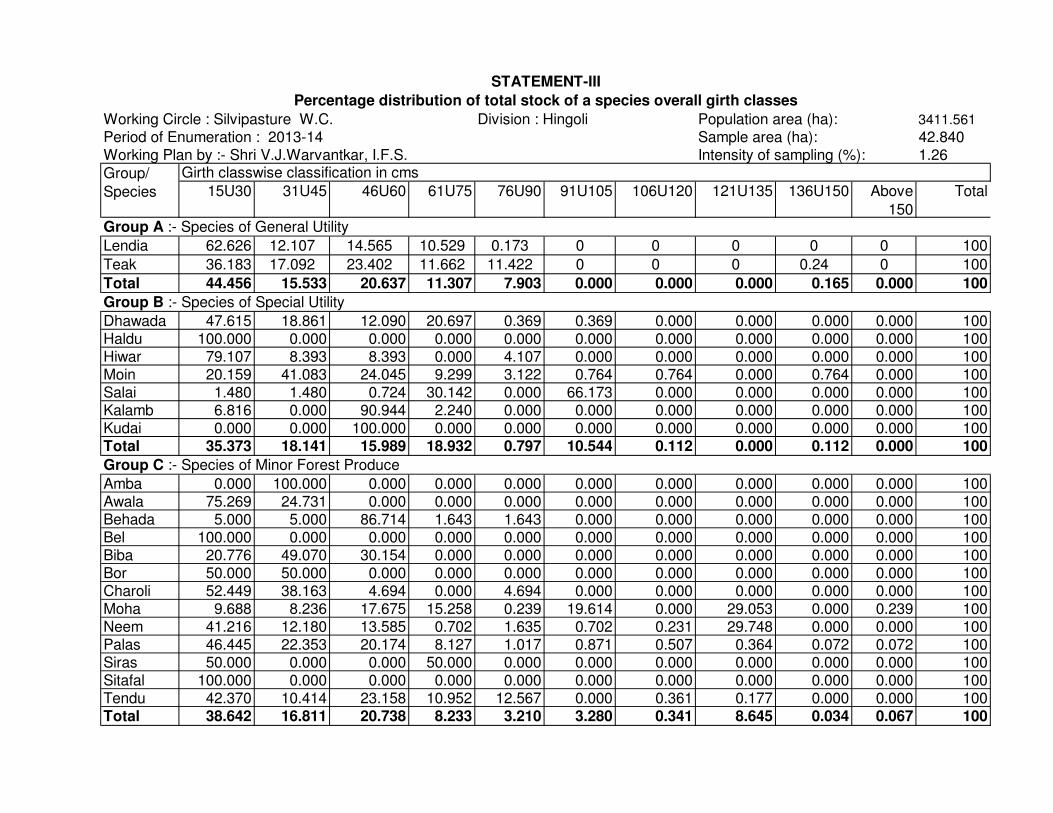
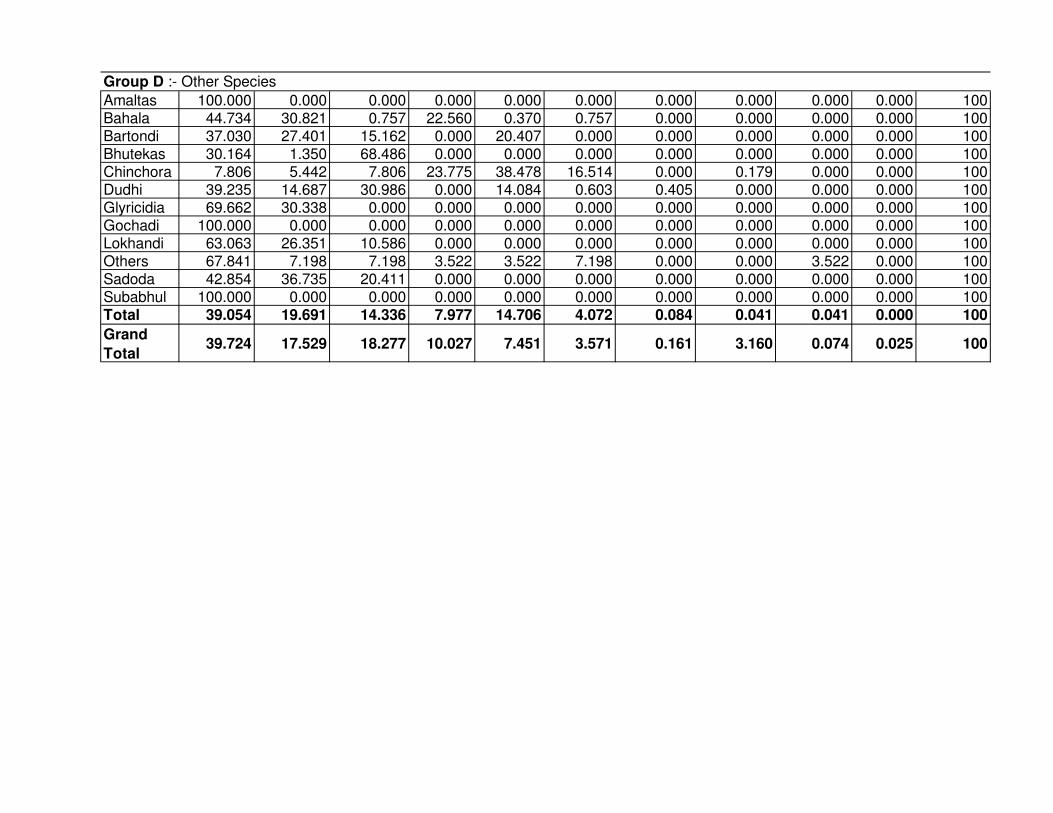
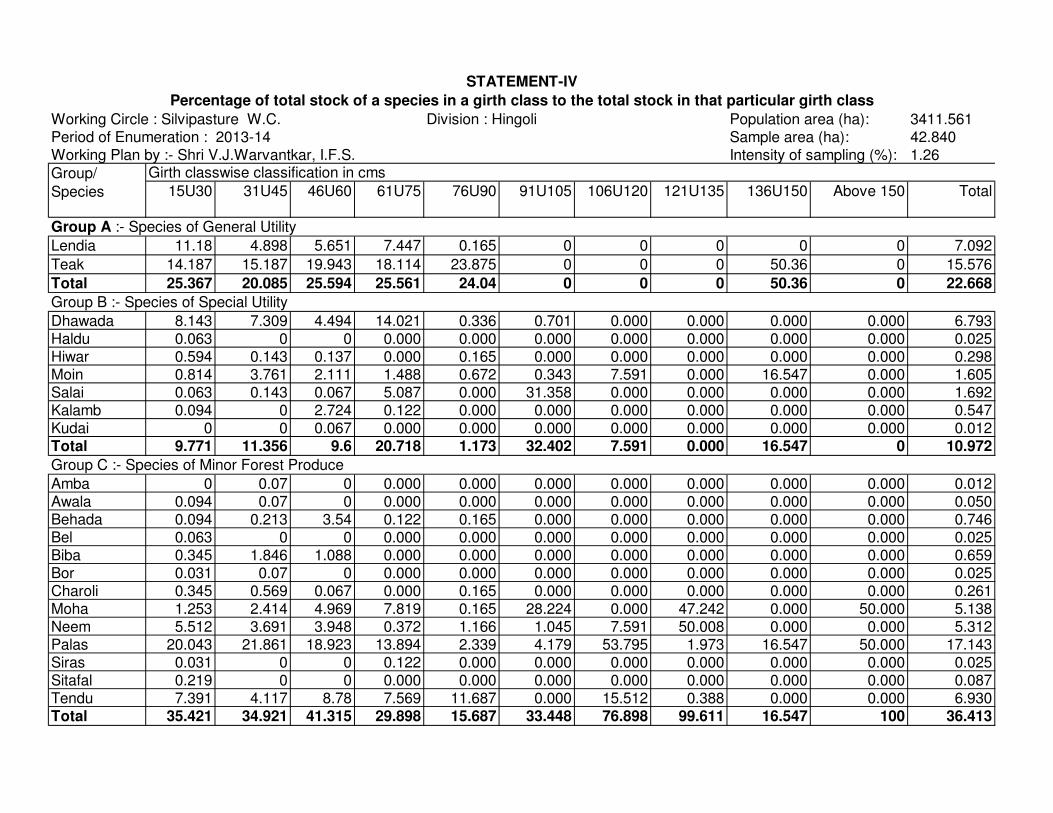
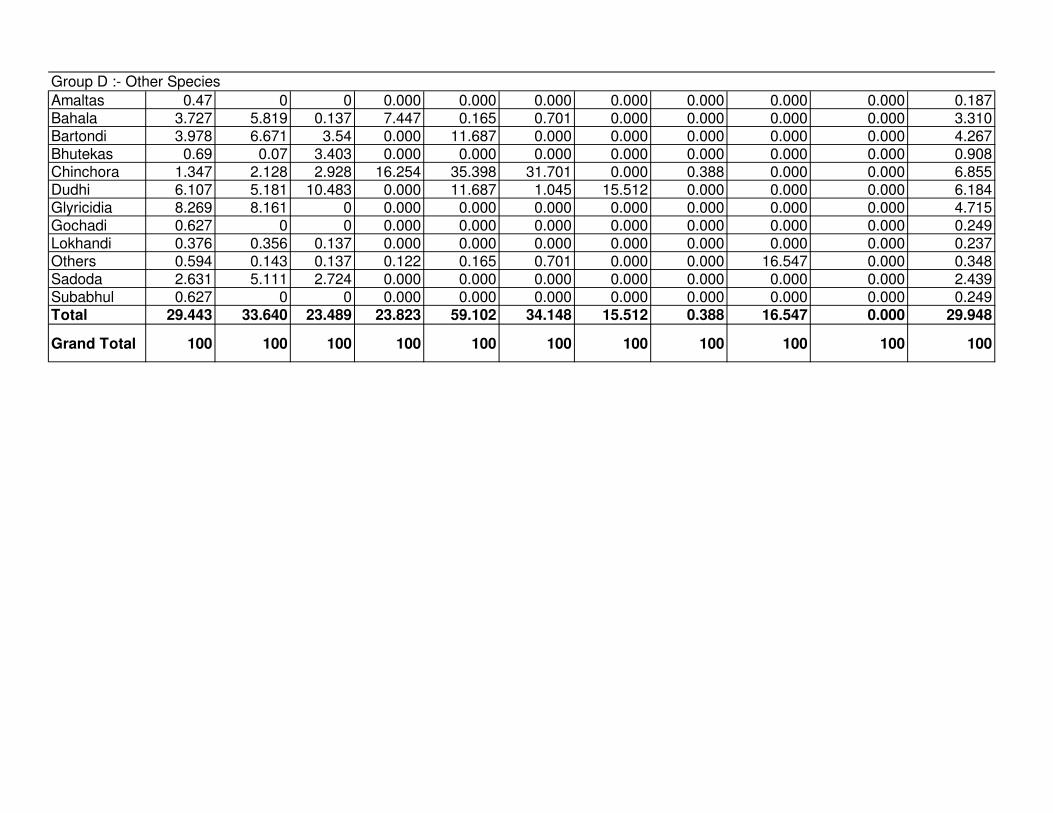

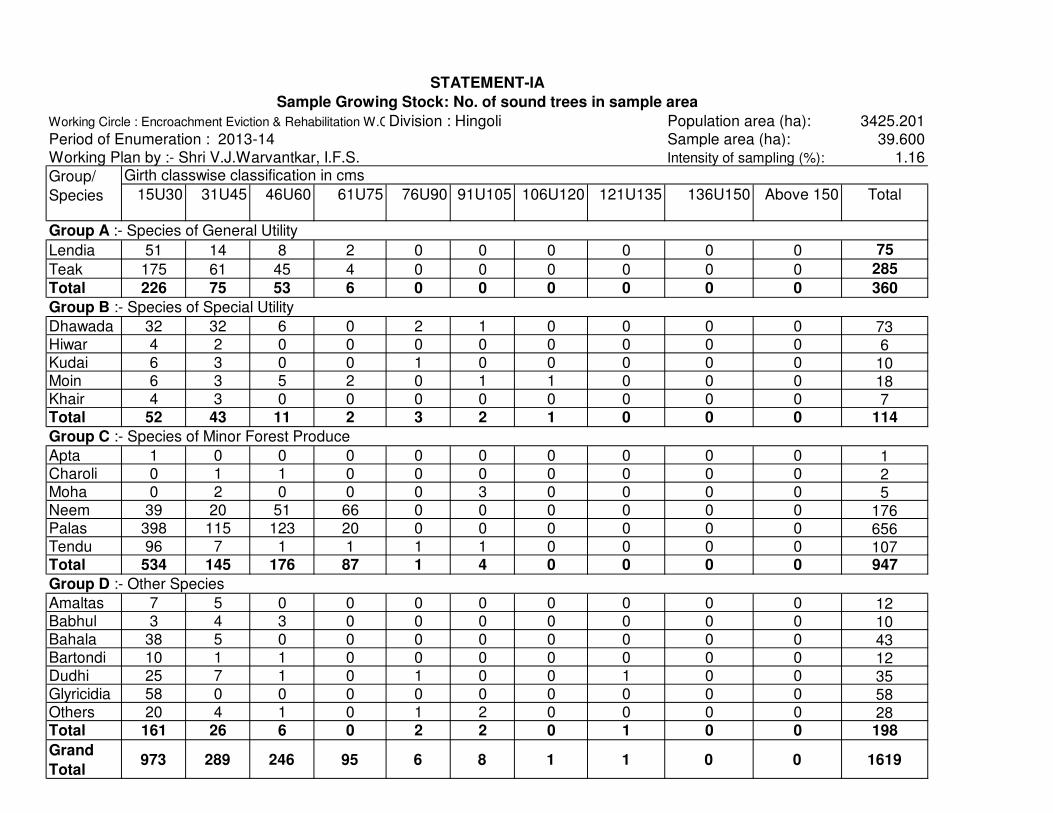
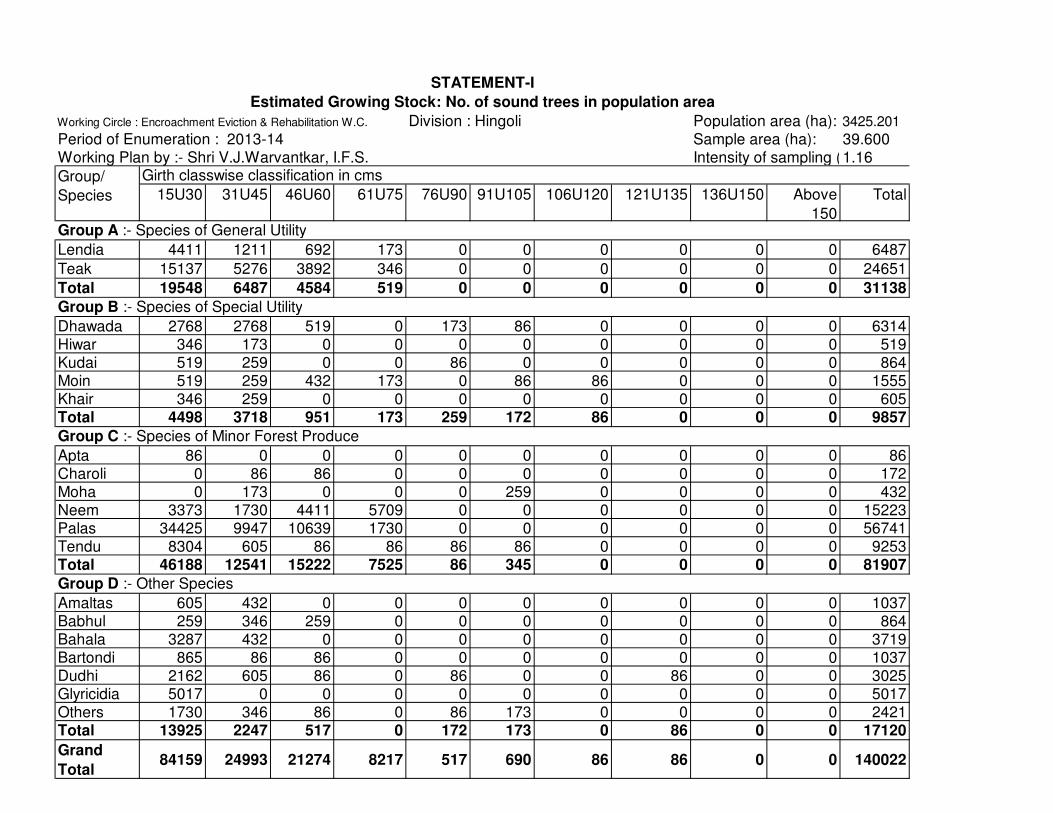
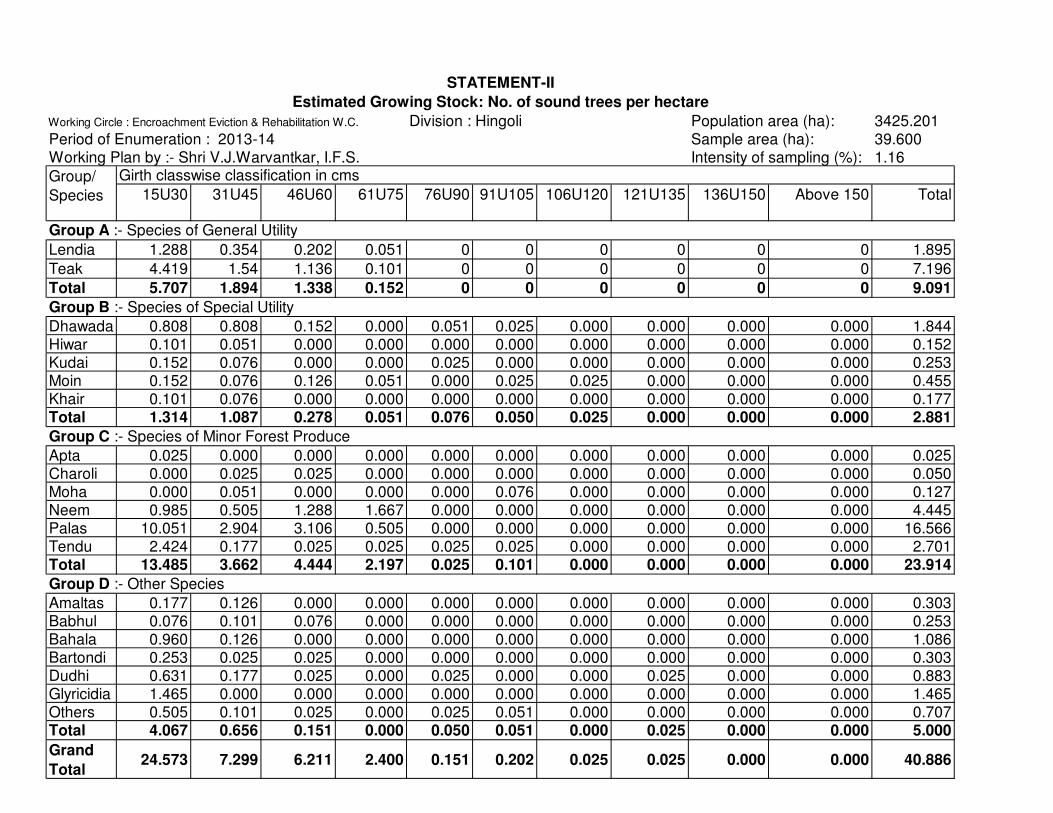
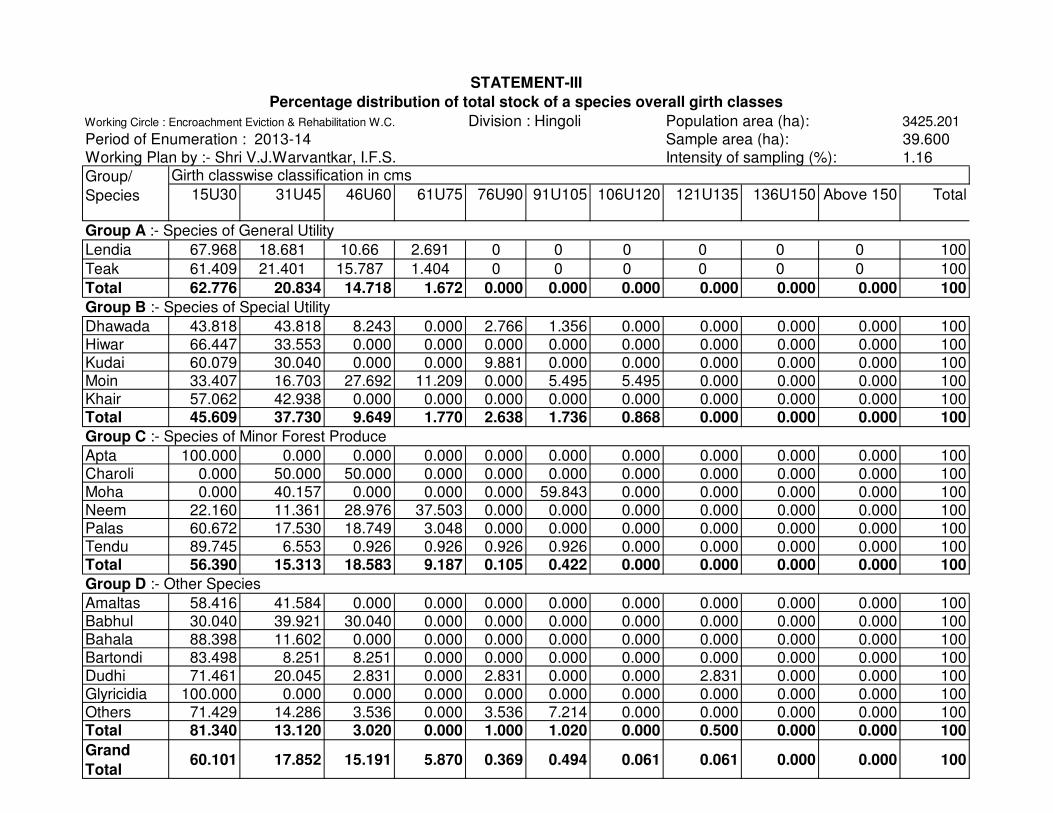
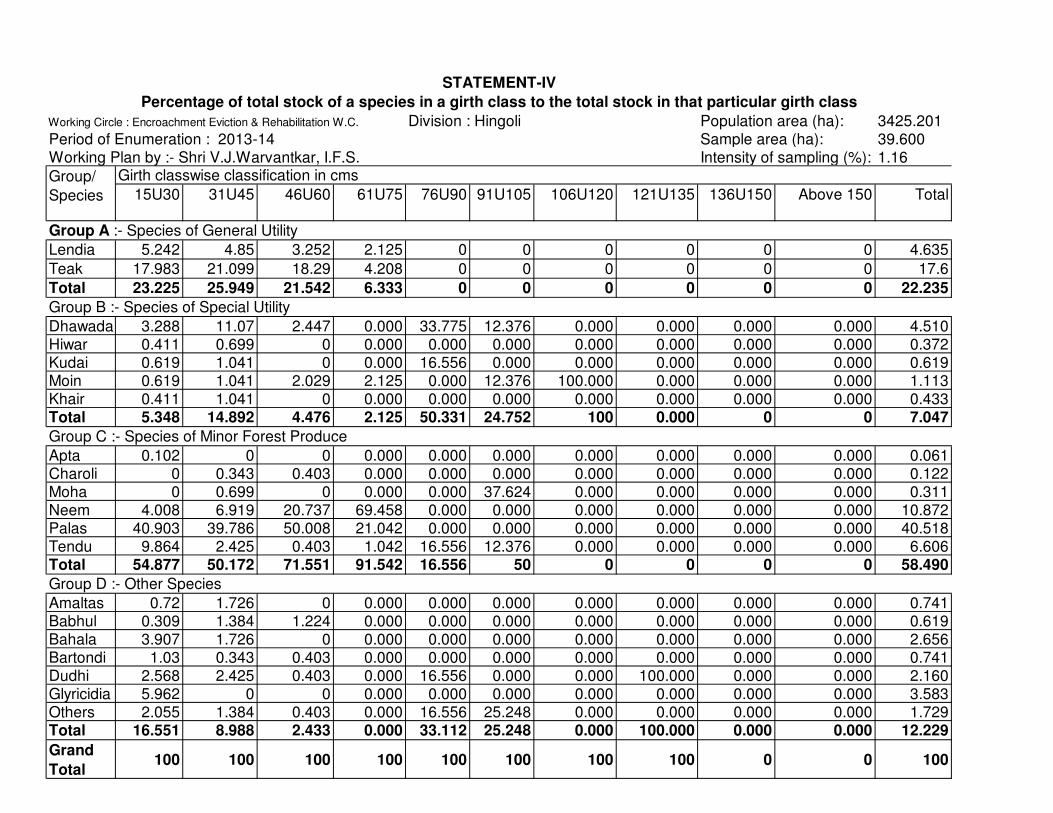


![On The Failure Of A Gas Foil Bearing: High Temperature ......failure (bearing seizure) while operating at a rotor speed of ... Bearing radial (assembly) clearance [mm] 0.076. 0.042:](https://static.documents.pub/doc/80x56/60e6f8086fbf910a2d6e333c/on-the-failure-of-a-gas-foil-bearing-high-temperature-failure-bearing.jpg)


