42


Contents
1 Introduction 11.1 Letter fromtheChair . . . . . . . . . . . . . . . . . . . . . . . . . . . . . . . . . . . . . . . . . . . . . . 1
1.2 Adjudicating theHonorCode . . . . . . . . . . . . . . . . . . . . . . . . . . . . . . . . . . . . . . . . . . 2
1.3 TheAssessment andDataManagementWorkingGroup . . . . . . . . . . . . . . . . . . . . . . . . . . . 4
1.4 Data Sets . . . . . . . . . . . . . . . . . . . . . . . . . . . . . . . . . . . . . . . . . . . . . . . . . . . . . 5
1.5 Methodology . . . . . . . . . . . . . . . . . . . . . . . . . . . . . . . . . . . . . . . . . . . . . . . . . . 5
2 Executive Summary 6
3 Dismissals: A Century of Annual Data (1919-2016) 8
4 All Sanction Types: ThreeDecades of DetailedData (1987-2016) 104.1 SystemChanges . . . . . . . . . . . . . . . . . . . . . . . . . . . . . . . . . . . . . . . . . . . . . . . . . 10
4.2 Demographics . . . . . . . . . . . . . . . . . . . . . . . . . . . . . . . . . . . . . . . . . . . . . . . . . . 12
4.2.1 Race . . . . . . . . . . . . . . . . . . . . . . . . . . . . . . . . . . . . . . . . . . . . . . . . . . . 12
4.2.2 Gender . . . . . . . . . . . . . . . . . . . . . . . . . . . . . . . . . . . . . . . . . . . . . . . . . 14
4.2.3 International Status . . . . . . . . . . . . . . . . . . . . . . . . . . . . . . . . . . . . . . . . . . 15
4.3 Key Findings&Discussion . . . . . . . . . . . . . . . . . . . . . . . . . . . . . . . . . . . . . . . . . . . . 16
5 All Reports &Outcomes: Six Years of Full Data (2012-2017) 185.1 Reporting . . . . . . . . . . . . . . . . . . . . . . . . . . . . . . . . . . . . . . . . . . . . . . . . . . . . 18
5.2 CasePaths andOutcomes . . . . . . . . . . . . . . . . . . . . . . . . . . . . . . . . . . . . . . . . . . . 20
5.3 Demographics . . . . . . . . . . . . . . . . . . . . . . . . . . . . . . . . . . . . . . . . . . . . . . . . . . 24
5.3.1 Race . . . . . . . . . . . . . . . . . . . . . . . . . . . . . . . . . . . . . . . . . . . . . . . . . . . 24
5.3.2 Gender . . . . . . . . . . . . . . . . . . . . . . . . . . . . . . . . . . . . . . . . . . . . . . . . . 26
5.3.3 International Status . . . . . . . . . . . . . . . . . . . . . . . . . . . . . . . . . . . . . . . . . . 27
5.3.4 Athlete Status . . . . . . . . . . . . . . . . . . . . . . . . . . . . . . . . . . . . . . . . . . . . . 28
5.3.5 Key Findings&Discussion . . . . . . . . . . . . . . . . . . . . . . . . . . . . . . . . . . . . . . . 29
6 The InformedRetraction: AData-Driven Review 316.1 Key Findings&Discussion . . . . . . . . . . . . . . . . . . . . . . . . . . . . . . . . . . . . . . . . . . . . 33
7 StatisticalModeling: Recent Sanctioning 347.1 Methods . . . . . . . . . . . . . . . . . . . . . . . . . . . . . . . . . . . . . . . . . . . . . . . . . . . . . 34
7.2 Results . . . . . . . . . . . . . . . . . . . . . . . . . . . . . . . . . . . . . . . . . . . . . . . . . . . . . . 34
7.3 Discussion . . . . . . . . . . . . . . . . . . . . . . . . . . . . . . . . . . . . . . . . . . . . . . . . . . . . 37
8 Conclusions and FutureDirections 398.1 Conclusions . . . . . . . . . . . . . . . . . . . . . . . . . . . . . . . . . . . . . . . . . . . . . . . . . . . 39
8.2 FutureDirections . . . . . . . . . . . . . . . . . . . . . . . . . . . . . . . . . . . . . . . . . . . . . . . . 39
Authors andAcknowledgments 40
i

1 INTRODUCTION
1.1 LETTER FROMTHECHAIR
To theCommunity ofTrust,
On behalf of the Honor Committee, thank you for engaging our Bicentennial Analysis. The data within this report
shouldnotbeviewed indispassionate isolationandshouldbeconsideredalongside thegreaterhistoryofourconstantly
evolving Honor System, University, and society. Too often, the Honor System’s available data has been guarded, a dis-
service to theUniversity seeking to improve itsmost revered tradition. With theBicentennial Report - ofwhich this data
analysis a significant part - we attempt to share the full story of the Honor System, with the spirit of transparency and
honesty that defines theCommunityofTrust.
Theconfidentialityofreportedstudents,andthosewhoreportthem, isofparamountimportancetotheHonorCom-
mittee. This Analysis avoids analyses which would compromise that confidentiality by, for example, providing multiple
demographic identifiers forspecificcases. Anypotentially identifyingcase informationprovidedwithin thisAnalysis, and
elsewhereintheReport,waspreviouslymadewidelyavailablethroughcontemporarypressreporting,public legalaction,
or other direct action by the involved parties. No personal information, aside from aggregated and de-identified case
data, has beendisclosed fromotherwise confidentialHonor files.
The number of reports received annually by theHonorCommittee is small relative to the number of students at the
University. Todrawconclusions fromanysingleyear’sdatawouldnot take intoaccount theannual variability in reporting
trends and case outcomes. In an effort tomitigate this formof statistical bias, and to further protect the confidentiality
of individual students, casedata hasoftenbeenaggregated across several years prior to analysis.
TheUniversityofVirginiausestheIntegratedPostsecondaryEducationDataSystem(IPEDS)categorizationsofrace,
as well as binary definitions of gender, when reporting data. The Honor Committee recognizes the limitations of these
definitions to reflect the full range of personal identity and currently collectsmore flexible, self-reported data from stu-
dents. The comparisonofHonorCommittee data toUVApopulation data, however, necessitates the useof IPEDS cate-
gorizations.
This Analysis draws distinctions and comparisons between the various case outcomes of reports received by the
HonorCommittee. The parameters of those decisions aremore thoroughly explainedwithin theAnalysis itself. The de-
cision to, for example, lump all sanction outcomes together (leaves of absence, dismissals, andwithdrawals) for certain
discussions reflects today’smulti-sanctionHonorSystem ... aSystemwhichretains thesingle sanctionofpermanentdis-
missal fromtheUniversity for guilty verdicts at hearings.
ThisAnalysis potentially lays to restmanymisconceptions about theHonorSystemwhile simultaneously identifying
new areas for improvement. These revelations were earned throughmeticulous examination of datamined fromdeep
within scores of archived cases. Aswith any data analysis of thismagnitude, therewere considerable challenges in com-
piling, analyzing, and interpreting data... data originally collected by dozens of different Honor Committees with almost
as many collection strategies. The Honor Committee’s Assessment and Data Management Working Group, chaired by
CharlotteMcClintock(College,2019),dedicatedhundredsofhours,overmanymonths, tobringthesetruthstotheCom-
munity. ToCharlotte - I offermydeepest gratitude for a jobexceedinglywell done.
Our greatest hope is that this Analysiswill lead to thoughtful, compassionate, informeddecisionmaking by all those
invested in the successof theHonorSystem. Honordemandsnothing less.
Most Sincerely,
Ory Streeter
Chair, UVAHonorCommittee (2018-19)
1
1.2 ADJUDICATINGTHEHONORCODE
Regulating student conduct at the University is delegated by the Board of Visitors to two student bodies: the University
JudiciaryCommittee(UJC)andtheHonorCommittee. TheUJCadjudicatesallegedviolationsofthe12StandardsofCon-
duct. TheHonorCommittee adjudicates alleged violationsof theHonorCode - casesof lying, cheating, and stealing.
All University of Virginia students pledge to never lie, cheat, or steal during their time as students. If a student vio-
lates theHonorCodebut is not yetunder suspicion, theymay file aConscientiousRetraction (CR).Once reported to the
Honor Committee, a studentmaymake an Informed Retraction (IR). If a student forgoes an IR, the case proceeds to an
Investigation Panel (I-Panel). The I-Panel determines which cases are sent to a hearing. If a student is found guilty at a
hearing, theyarepermanentlydismissed fromtheUniversity. Studentsmaypermanently Leave theUniversityAdmitting
Guilt (LAG) or request a hearing for Contributory Health Impairments (CHI) - previously termed “CMD” - at almost any
point prior to ahearing.
DEFINITIONS:
The following definitions are intended to improve understanding of Honor Committee case processing. For complete
andbindingdefinitions, please refer to theHonorCommitteeBy-laws.
• CR:ConscientiousRetraction. BeforetheyhavereasontobelievetheyareundersuspicionforanHonorOffense, a
studentmay take responsibility for their actions andmakeamendswith theaffectedparties. A complete andvalid
CRprotects a student frombeing foundguilty at a hearing.
• IR: InformedRetraction. A student is given the option to take responsibility for their actions andmake amends to
the community, andmay return to theUniversity after a two-semester leaveof absence.
• LAG: LeavingAdmittingGuilt. A studentmay choose to forgo a hearing and leave theUniversity admitting guilt of
the accusedHonor offense(s). Students who LAG forgo their right to a hearing and receive the same sanction as
studentswhoare foundguilty at a hearing - permanentdismissal fromtheUniversity.
• I-Panel: Investigation Panel. Apanel of three Committeemembers who review evidence compiled by the Investi-
gatorson the case todeterminewhether it ismore likely thannot that anHonoroffensehasoccurred.
• CMD: Contributory Mental Disorder If a student believes they have a condition which contributed to their com-
mission of anHonorOffense, theymay request a special hearing conducted by an independent panel of experts.
The CMD process was recently modified (Fall 2018) and a CMD was renamed a Contributory Health Impairment
(CHI).Wewill use the old CMDacronym to reflect the policies in place at the timemuchof the revieweddatawas
generated.
THEHONORCASEPROCESS
The Honor Committee consists of 27 elected student Representatives - five students from the College of Arts and Sci-
ences and two students fromeachof theUniversity’s remaining schools. TheHonorCommittee’s Executive Board is in-
ternally elected from within the Committee. The Honor Committee and its Executive Board maintain a pool of trained
Support Officers to facilitate case processing. The Committee Representatives and the Support Officers fulfill unique
roleswithin theHonorSystem. CaseprocessingbeginswhentheHonorSystemreceivesareport fromafacultymember,
student, or communitymember. Honor does not seek out cases, but rather depends onmembers of the community to
bringcases forward. Onceareporthasbeenmade, thestudent iscontactedbyaconfidential advisordesignatedtoguide
2

thestudent throughtheprocessandactasemotional support. Thereporterandanyadditionalprimarywitnessesare in-
terviewed. The reported student is then given the initial evidence. The student then has seven days to decide whether
theywould like tomake an InformedRetraction (IR). Passed in 2013, the IR allows students to take responsibility for their
actions,makeamends, andcomplete a two-semester leaveof absence fromtheUniversity before returning to theCom-
munity ofTrust.
If the student chooses not to make an Informed Retraction, the case proceeds to a full investigation. Two Support
Officers interview all relevant witnesses and gather evidence. The results of the investigation are compiled into an In-
vestigation Log (I-Log) and presented to a panel of threeCommittee Representatives (I-Panel) whodecidewhether it is
“more likely than not” that the student committed anHonor offense. Reports found to havemet that evidentiary stan-
dard lead to formal accusation of the reported student and those that do not are dropped. If the student is accused at
I-Panel, the studentmay elect to have a hearingwhere a panel of students will find the student guilty or not guilty of the
accused offense(s) based on three criteria: Act, Knowledge, and Significance. If the panel finds the student guilty, the
student is dismissed from theUniversity. Students have the right to appeal guilty verdicts to anAppeal ReviewCommit-
tee composed of Honor Committee Representatives. The studentmay Leave Admitting Guilt (LAG) at any point in the
process. Studentsmay also request a hearingonCHI - formerlyCMD - throughoutmostof the caseprocessing timeline.
3
1.3 THEASSESSMENTANDDATAMANAGEMENTWORKINGGROUP
TheAssessment andDataManagementWorkingGroup is taskedwith creating andmaintaining transparent, consistent,
and secure systems to storepertinentdemographic, publicopinion, and internal evaluationdata to informHonorpolicy
and dialogue so that Honor is accountable to itself and its goals and its members can make informed decisions on how
best to serve the students and theUniversity.
TheAssessment andDataManagementWorkingGroup is taskedwith:
(i) DeterminingandevaluatingwhichdemographiccasedataarenecessaryandappropriatetokeepsothattheHonor
Committee canunderstandhow identity shapes experiencewith theHonorSystem.
(ii) Developing andmaintaining clear security andconfidentiality protocols for demographic data storage so that ac-
cess to sensitivedata is secure andguidelines are easily understoodandconsistently followed.
(iii) Buildingoutdatamanagement infrastructure fordemographicdata, internalmetrics, andexternalmetrics incon-
junction with University records management so that future iterations of this committee can easily access data
and theworkof previous committees.
(iv) Conducting evaluations of public opinion and knowledge about Honor so that the Honor Committee can better
understand how students and faculty see the system and education resources can be better directed to address
possible gaps in knowledgewhere they exist.
(v) Developingguidelines forconsistentpublicopinionevaluationacross time(i.e. howoftenopiniondatawill becol-
lected, consistencyofmetrics, andquestions asked) so that progress across time is comparable andmeasurable.
(vi) Developingandimplementingguidelinesforconsistent internalevaluationofsupportofficersandcommitteemem-
bers so that ourwork is always professional, timely, competent, and compassionate, and so thatmistakes or gaps
in knowledge are corrected inorder to ensure that ourwork is always improving.
(vii) Producing an end-of-term report detailing the current state of affairs, guidelines for future work, and advice and
insightsforthenextcommitteesothat institutionalknowledgeisnot lost, andthenextcommitteecanbeginwhere
theprevious committee leavesoff.
4

1.4 DATASETS
Thedata used for this analysis comes fromthree categoriesof data:
DISMISSALS:ACenturyofAnnualData (1919-2016)wasdrawnfromlistsofdismissedstudentsandaggregate
totals put together by various committees through the years, discovered by the Honor Committee Chair. The data on
totals from 1919-1939 come from a list of all students dismissed from the University during that period which included
name, school of enrollment, and home state. This data set was recorded by committee, and is represented by the first
year of theCommittee termThe totals from 1946 to 1968 come froma similar list which includedonly names. The 1968-
1987data comes fromaggregatedescriptive statistics put togetherbydecadesby various committees. The 1987 to2016
totals come from the Students Facing Sanction (1987-2016) data set and the 2017 total is a subset of the All Reported
Students (2012-2017)which includesonly studentswho faced some typeof sanction. Prior to 2013, studentswereeither
dismissed from theUniversity or left admitting guilt, students after 2013were dismissed, left admitting guilt, or took the
InformedRetraction.
ALLSANCTIONTYPES:ThreeDecadesofDetailedData (1987-2016) is composedofcasestatus formscom-
pletedbyHonorSupportOfficersbasedonrecordsretainedpertainingtoeachcase,withhelp fromtheExecutiveSecre-
tary to theHonorCommitteeMaryWhite in retrieving demographic information from theStudent Information System
(SIS). During the summer of 2018, trained Honor Support Officers and Committee members collected information on
dates, proceduraldetails, andcaseoutcomes fromoldcase files andrecordedthe informationonnewcasestatus forms.
TheExecutiveSecretarytotheHonorCommitteethen lookedupeachstudentbasedonwhatever informationwasavail-
able, (frequently the student’s name, year, and school of enrollment) and recorded the student’s demographic informa-
tionbasedonwhatwas available onSIS. Recordsof studentswhowere foundnot guilty are immediately destroyed after
thehearing andarenot included in this data set. (n=571)
REPORTS: All Reports and Outcomes (2012-2016) from the Honor internal case management system (OCP)
retrieved by the Vice Chair for Investigations in the summer of 2018. When a case is reported and is created inOCP, the
Executive Secretary to the Honor Committee searches the Student Information System for the student’s race, gender,
international status, and athlete status and records the informationonOCP. This data set includes all students reported
to the system, including cases inwhich the studentwas foundnot guilty or facedno sanction. (n=276)
1.5 METHODOLOGY
Section Three through Section Five of this report will provide descriptive statistics on relevant dimensions of student
identity. SectionThreeprovides aggregate totals over 100yearsof the system. SectionFourwill look at historical trends
over thepast thirty-threeyearsusing theAll SanctionTypes (1987-2016)data set. SectionFivewill explore theAll Reports
&Outcomes (2012-2017) data set. Section Six gives a reviewof the effects of the InformedRetraction. Section Seven of
this reportwill use logistic regression to investigate the influence of various dimensions of identity on the probability of
facing a sanctionoutcome. A longerdiscussionofmethodologywill precede themodel results in SectionSeven.
5

2 EXECUTIVE SUMMARY
We hope this report fosters conversation about how students experience Honor at the University and begins an open
dialogue on howwe can all work towards a better system together. We also hope this reportwill shed light on a process
that is typicallyopaque formost students. This analysisuncoveredanumberof valuable insights, andwehope the recent
initiationofself-identifieddemographicdatacollectionandthecollectionofmore informationaboutreportersandtype
ofActwill enablemore analysis in the future.
KEY FINDINGS: DISMISSALS: A CENTURYOFANNUALTOTALS (1919-2017)
• Dismissal rate was highest from 1950 to 1970: Between 1950 and 1970, the dismissal rate hovered around
0.2%of enrolled students, thendeclined sharply in the 70s and80s, andwashigher in the 2000s.
• Between 1919-1939, more than 60 percent of dismissed students were from out-of-state: Residencywasa significant issue from1919 to 1939,withSouthern students lamenting that students fromtheNorthwerede-
grading the cultureofHonor at theUniversity.
KEY FINDINGS: ALL SANCTIONTYPES: THREEDECADESOFDETAILEDDATA (1987-2017)
• Cheating is themost commonly sanctioned offense: Since 2000,more than 65 percent of sanctioned stu-
dentswere reported for cheating.
• The number of sanctioned stealing offenses has declined: Sanctions for stealing have decreased from26
percentof all sanctionsbetween 1987 and 1989 to 2percentof all sanctions from2010 to 2016.
• The demographics of sanctioned students have changed: In the 1980s and 1990s, the percentageof sanc-
tionedstudentswhowereBlackwashigher thanthepercentageofBlackstudentsattendingUVAbut thisdisparity
decreasedovertime. ThepercentageofsanctionedstudentswhowereAsian increasedoverthesameperiod. The
percentage of sanctioned students from 2010-2016 who were international students increased relative to previ-
ous years.
KEY FINDINGS: ALL REPORTSANDOUTCOMES: SIX YEARSOF FULLDATA (2012-2017)
• Studentclassyearaffects thenumberof reports received: Thirdyearundergraduatesmadeupthehighest
proportionofreportsandfirstyearundergraduatesmadeupthe lowest. Thenumberofgraduatestudentreports
was similar to thenumberof first year undergraduate reports.
• Higher year students reported to the systemweremore likely to be sanctioned than lower year stu-dents, relative to the number of reports received for students of the same year: Relative to the num-
ber of reports received against students in the same year, higher year students were sanctionedmore frequently
than loweryearstudents. Higheryearstudentswerealsomore likely tomakean InformedRetraction. Accordingly,
graduate students are themost likely tobe sanctioned andmost likely tomake an InformedRetraction, relative to
thenumberof reportedgraduate students.
• Reported student demographics do not mirror UVA demographics: Therewere a substantial number of
reported caseswith unavailable race data. White studentswere under-represented in reports relative to theUni-
versity population. Asian students and Black students were over-represented in reports. International students
werealsoover-represented. Malestudentswereover-represented,andfemalestudentswereunder-represented.
6

KEY FINDINGS: THE INFORMEDRETRACTION: ADATADRIVENREVIEW
• A higher percentage of reported students were sanctioned after the passage of the IR: 2017 was the
first year in the study period inwhichmore students received some type of sanction [found guilty and dismissed,
left admitting guilt (LAG), or took a leaveof absence (IR)] thandidnot.
• Therewere fewer hearings per year after the passage of the IR:The InformedRetraction allows students
theoptionofadmittingguiltandtakingaone-year leaveofabsencefromtheUniversity. Thisoptionmaybeviewed
bystudentsasmorefavorableasopposedtofacingaHearing, resultinginanincreasednumberof IRsandareduced
numberofHearings.
KEY FINDINGS: STATISTICALMODELING: RECENTSANCTIONING
• Statistical modeling revealed the effects of certain case factors on case outcomes: The international
status of the reported student, the reported student class year, and the reporter type had statistically significant
effects on case outcome. International studentsweremore likely to be sanctioned relative to domestic students.
Students reported by faculty weremore likely to be sanctioned than students reported by students. Higher year
students (fourth years, graduate students) weremore likely to be sanctioned than first year students. Therewas
no statistically significant effect of race, gender, or athlete statusoncaseoutcome.
7
3 DISMISSALS: A CENTURYOFANNUALDATA (1919-2016)
As a reminder, this data comes from from lists of dismissed students and aggregate totals put together by various com-
mittees throughtheyears, discoveredbytheHonorCommitteeChair. Thedataontotals from1919-1939comefroma list
of all students dismissed from the University during that period which included name, school of enrollment, and home
state. This data setwas recordedby eachCommittee and is presentedusing the year inwhich eachCommittee termbe-
gan. The totals from 1946 to 1968 come from a similar list which included only names. The 1968-1987 data comes from
aggregate descriptive statistics put together by decades by variousCommittees. The 1987 to 2016 totals come from the
StudentsFacingSanction(1987-2016)datasetandthe2017totalcomesfromasubsetoftheAllReportedStudents(2012-
2017) including only students who faced some type of sanction. Students in years before 2013 were dismissed from the
Universityor leftadmittingguilt, studentsafter2013weredismissed, leftadmittingguilt,or tookthe InformedRetraction.
100 YEARSOFDISMISSALS
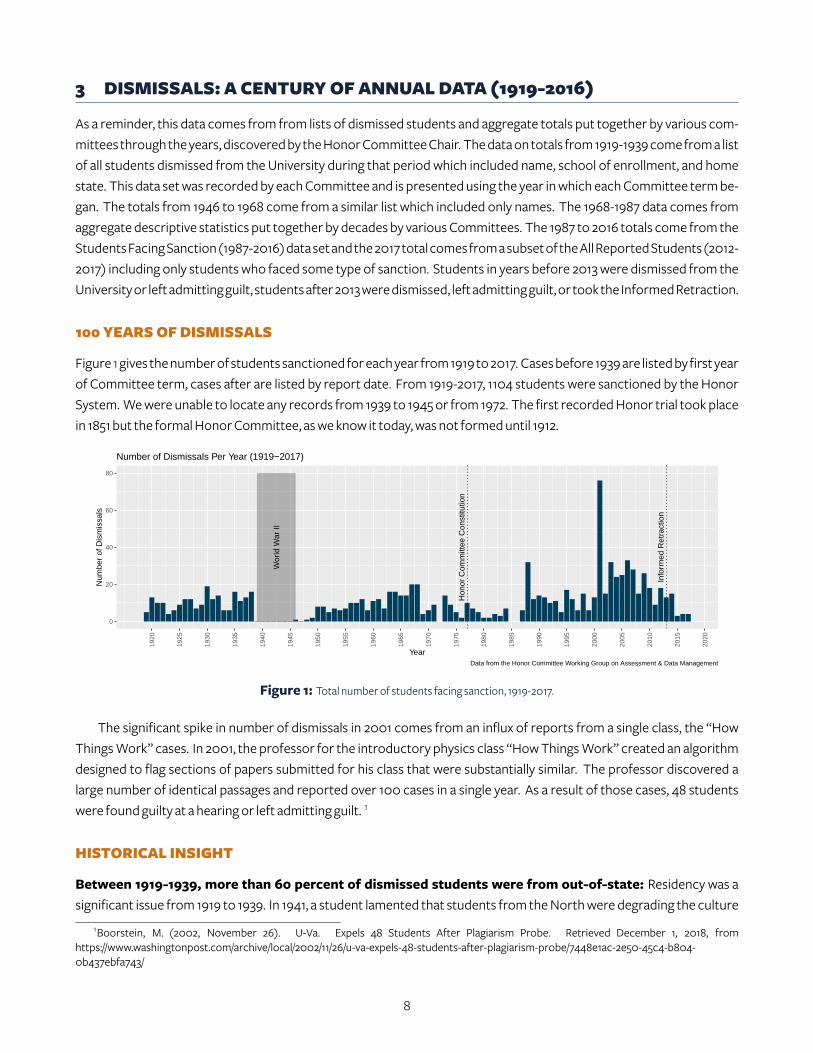
Figure 1gives thenumberofstudentssanctionedforeachyear from1919to2017. Casesbefore 1939are listedby first year
of Committee term, cases after are listed by report date. From 1919-2017, 1104 students were sanctioned by the Honor
System. Wewere unable to locate any records from 1939 to 1945 or from 1972. The first recordedHonor trial took place
in 1851 but the formalHonorCommittee, asweknow it today,wasnot formeduntil 1912.
Wor
ld W
ar II
Hon
or C
omm
ittee
Con
stitu
tion
Info
rmed
Ret
ract
ion
0
20
40
60
80
1920
1925
1930
1935
1940
1945
1950
1955
1960
1965
1970
1975
1980
1985
1990
1995
2000
2005
2010
2015
2020
Year
Num
ber
of D
ism
issa
ls
Number of Dismissals Per Year (1919−2017)
Data from the Honor Committee Working Group on Assessment & Data Management
Figure 1: Total numberof students facing sanction, 1919-2017.
The significant spike in number of dismissals in 2001 comes from an influx of reports from a single class, the “How
ThingsWork” cases. In 2001, the professor for the introductory physics class “HowThingsWork” created an algorithm
designed to flag sections of papers submitted for his class that were substantially similar. The professor discovered a
large number of identical passages and reported over 100 cases in a single year. As a result of those cases, 48 students
were foundguilty at a hearingor left admitting guilt. 1
HISTORICAL INSIGHT
Between 1919-1939, more than 60 percent of dismissed students were from out-of-state: Residency was a
significant issue from 1919 to 1939. In 1941, a student lamented that students from theNorthwere degrading the culture
1Boorstein, M. (2002, November 26). U-Va. Expels 48 Students After Plagiarism Probe. Retrieved December 1, 2018, fromhttps://www.washingtonpost.com/archive/local/2002/11/26/u-va-expels-48-students-after-plagiarism-probe/7448e1ac-2e50-45c4-b804-0b437ebfa743/
8

ofHonor at theUniversity, going so far as to call them ‘Northern scum’2. Figure 2 gives the proportion of dismissed stu-
dentswhowere in-state andout-of-state from1919 to 1939. From1919-1939, over6opercentofdismissed studentswere
fromout-of-state, with the proportion reaching above 90 percent for 1928 and 1931. Many of these students were from
Northern states,most frequentlyNewYork.
0%
25%
50%
75%
100%
1920 1925 1930 1935
Year
Per
cent
of D
ism
issa
ls
Residency Status
In−State
Out−of−State
In State vs. Out of State Dismissed Students as a % of Dismissed Students (1919−1939)
Data from the Honor Committee Working Group on Assessment & Data Management
Figure 2: In state vs. out of stateproportion, 1919-1939.
Dismissal rate was highest from 1950 to 1970: Figure 3 shows the dismissal rate per year (dimissals / enrolled
students). Between 1950 and 1970, the dismissal rate hovered around 0.2% of enrolled students. The data shows a sig-
nificantdrop indismissal rates from1970 to 1986, though it’s possibledata ismissingorwaspoorly recorded. The2000s
showan increase fromthe1990s. 2014 to2016haveasignificantly lowerdismissal ratebecauseof the introductionof the
InformedRetraction.
Hon
or C
omm
ittee
Con
stitu
tion
Info
rmed
Ret
ract
ion
0.000
0.001
0.002
0.003
0.004
1950
1955
1960
1965
1970
1975
1980
1985
1990
1995
2000
2005
2010
2015
2020
Year
Rat
e of
Dis
mis
sal
Rate of Dismissal: Number of Dismissals/University Enrollment (1948−2017)
Data from the Office of Institutional Assessment and the Honor Committee Working Group on Assessment & Data Management
Figure 3: Dismissal rates, 1947-2017.
2Barefoot, C. (n.d.). TheEvolutionofHonor. RetrievedDecember 1, 2018, fromhttp://uvamagazine.org/articles/the_evolution_of_honor
9

4 ALL SANCTIONTYPES: THREEDECADESOFDETAILEDDATA (1987-2016)
This sectionwill present30yearsofdataonstudentswhoreceivedsometypeof sanction, includingdismissals (students
found guilty at hearing), students who left admitting guilt (LAG), and students who took a leave of absence (IR). The IR
onlybecameanoptionafter 2013. This data set does not include studentswhowere foundnot guilty orwhosecaseswere dropped by the I-Panel.
This analysis was made possible through efforts of Honor Support Officers, Committee Members, and the Execu-
tive Secretary to the Honor Committee, Mary White. During the summer of 2018, trained Honor Support Officers and
Committeememberscollected informationondates,proceduraldetails, andcaseoutcomes fromoldcase filesandgen-
eratedupdatedcase status formswith theavailable information. TheExecutiveSecretary to theHonorCommittee then
looked up each student based onwhatever information was available, (frequently the student’s name, year, and school
of enrollment) and recorded the student’s demographic information based onwhatwas available on the Student Infor-
mationSystem(SIS).Recordsofstudentswhowere foundnotguiltyare immediatelydestroyedafter thehearingandare
not included in this data set. (n=571)
4.1 SYSTEMCHANGES
Figure4givestheaggregatenumberofstudentswhofacedsometypeofHonorsanctionineachyear. Allstudentscounted
before 2013 either left theUniversity admitting guilt orwere found guilty at a hearing anddismissed from theUniversity.
Where years are grouped together, the most recent six years will be separated into 2010-2013 and 2014-2016 to under-
stand the system before and after the Informed Retraction. For cases after 2013, students were found guilty and dis-
missed fromtheUniversity, left admitting guilt (LAG), or took a leaveof absence (IR).
IR P
asse
d
0
20
40
60
1987 1988 1989 1990 1991 1992 1993 1994 1995 1996 1997 1998 1999 2000 2001 2002 2003 2004 2005 2006 2007 2008 2009 2010 2011 2012 2013 2014 2015 2016
Year
Num
ber
of S
tude
nts
Faci
ng S
anct
ion
Number of Students Facing Sanction (1987−2016)
Data from the Honor Committee Working Group on Assessment & Data Management
Figure 4: Number of students facing sanction forHonor Code violations, 1987-2016. The spike in 2001 is the result of an influx of reports fromoneclass. The InformedRetraction (IR)waspassed in 2013. Totals prior to 2013 include students foundguilty anddismissed and studentswholeft admitting guilt (LAG). Totals after 2013 also include studentswho took a leaveof absence (IR).
Cheating is the most commonly sanctioned offense: Figure 5 gives the count of students facing sanction in
each era by offense type. Figure 6 shows the proportion of each offense type as a total of all students facing sanction in
each timeperiod. The period from2000-2004had amuchhigher proportion of students sanctioned for cheating (stu-
dent sanctioned for cheatingmade up 87 percent of all sanctions) due in part to the large number cheating reports re-
10

ceived from ‘HowThingsWork’. Still, recent years have seen a higher proportion of sanctioned cheating cases, relative
to the number of cheating reports, than in the past. The number of sanctioned cheating cases from 2005 to 2016 was
higher than from 1990 to 1999. Sanctions for cheating were also a larger proportion of all sanctions (67 percent from
2005-2016, compared to42percent from 1990-1999). Caseswhere studentswere sanctioned formultiple offenses typ-
ically had cheating asoneof theoffenses.
0
50
100
1987−1989 1990−1994 1995−1999 2000−2004 2005−2009 2010−2013 2014−2016Time Period
Num
ber
of S
tude
nt F
acin
g S
anct
ion
Offense Type Cheating Multiple Lying Stealing Unknown
Count of Each Offense Type (1987−2016)
Figure 5: Countof students sanctionedbyoffense type, 1987-2016. Cheating is themost commonly sanctionedoffense.
Stealinghasdecreasedasapercentageofsanctionedoffenses: From2000-2016,stealingcaseswereamuch
lower proportion of total cases for which students faced a sanction than they had been from 1987 to 1999. From 1987-
1989, stealingcaseswere26percentofall sanctions. From2010-2016, stealingcaseswereonly2percentofall sanctioned
offenses.
0%
25%
50%
75%
100%
1987−1989 1990−1994 1995−1999 2000−2004 2005−2009 2010−2013 2014−2016Time Period
Per
cent
of S
tude
nt F
acin
g S
anct
ion
Offense Type Cheating Multiple Lying Stealing Unknown
Offense Type as a % of All Sanctions (1987−2016)
Figure 6: Offense type as a%of all sanctions, 1987-2016. Cheating is themost commonly sanctioned offense. Stealing has decreased as a per-centageof sanctionoffenses.
11

4.2 DEMOGRAPHICS
Demographic information of sanctioned students was collected by the Executive Secretary to the Honor Committee,
who searched the Student Information System using the dismissed students name and recorded the student’s gender,
race, international status, student athlete status, and transfer student status,where available. All UVApopulationdemo-
graphic information comes from the Office of Institutional Assessment & Studies. Years are grouped together into 5-7
year time periods in order to look at historical trends clearly andminimize variance due to small sample sizes. Meaning-
ful conclusions could not be drawn for student athlete status or transfer student status because of significant unknown
proportions.
4.2.1 RACE
Racial demographics for this sectionarecategorizedby IntegratedPostsecondaryEducationDataSystem(IPEDS) stan-
dards in order tomaintain institutional consistency and compare reported student demographics to thedemographics
of the University. Our analysis in this section focuses primarily onWhite, Black or African American, and Asian or Asian
American race students. Studentsof a raceother thanWhite, Black, orAsianmakeupavery small percentageof theUni-
versity andof students reported to theHonor system; their racial identitymaybepotentially identifyinggiven their small
numbers, sotheyareaggregatedas“Other”. Figure7showsthedemographicmakeupof theUniversityat representative
points through thepast fewdecades.
0%
25%
50%
75%
100%
1991 1995 2000 2005 2010 2015
Year
Per
cent
of A
ll S
tude
nts Race
White
Black or African American
Asian or Asian American
Other
Non−Resident Alien
Unknown
UVA Student Racial Demographics (1991−2015)
Data from the UVA Office of Institutional Assessment , Studies
Figure 7: University population racedemographics, 1991-2018. TheUniversity has grownmorediverseover time.
The racial demographics of students dismissed from the University for violations of the Honor codehavechangedsubstantiallyoverthepastthreedecades: Figure8showsthedemographicbreakdownofdismissed
students by race in five year increments. Figure9gives the aggregate totals for each timeperiod.
Figure 7 gives the demographicmakeup of theUniversity for representative years over a similar period of time. The
BlackorAfricanAmericanstudentpopulationattheUniversitydecreasedfrom9percent in1991to6percent in2018. The
AsianorAsianAmerican studentsmadeup6percentofUniversity students in 1991 and 12percent in 2018.
From1987 to2009,BlackorAfrican-Americanstudents facedsanctionat a rate thatwas significantlydisproportion-
ate to their population at theUniversity. From 1987 to 1989, Black studentsmadeup41 percent of all students dismissed
fromtheUniversity (dismissal and leavingadmittingguiltwere theonlypossible sanctionsduringat this time). Compara-
tively, Black studentsmadeuponly 9percentofUniversity students in 1991, theearliest year forwhichdatawas available.
12

v
620.75
16.07 22.520.47 48.48 52.73
42 35.8537.5
18.7522.05
18.18 3.64
36 37.7430.36
46.2537.8
24.2432.73
163.77
16.07 12.519.69
7.58 3.641.891.52 7.27
0%
25%
50%
75%
100%
1987−1989 1990−1994 1995−1999 2000−2004 2005−2009 2010−2013 2014−2016Time Period
Per
cent
of S
tude
nts
Faci
ng S
anct
ion
Race White Black or African American Asian or Asian American Other Unknown
Sanctioned Student Race as a % of All Sanctioned Students (1987−2016)
Data from the Honor Committee Working Group on Assessment & Data Management
Figure 8: Students sanctioned by race, as a proportion of all students facing sanction, 1987-2016. The proportion of sanctioned students whowereBlack/African-American decreased. The proportion of sanctioned studentswhowereAsian/Asian-American increased. The proportionof sanctioned studentswhowereWhite/Caucasian remained relatively stable.
From2010 to2016, Black studentsmadeup 12percentof sanctioned students.
The proportion of sanctioned students who are Asian or Asian American has increased over the past thirty years.
Asian studentsmadeup6percent of students dismissed from theUniversity from 1987 to 1989, butmadeup 50percent
of students sanctioned from 2010 to 2016. Many of the Asian students in our data were international students, which
maycontribute to thesignificantdisproportionality. Figure9gives theaggregate totalsof students sanctionedby race in
order tounderstandhow thenumberof students sanctionedby racehas changed, in addition to theproportions.
0
20
40
60
1987−1989 1990−1994 1995−1999 2000−2004 2005−2009 2010−2013 2014−2016Time Period
Num
ber
of S
tude
nts
Faci
ng S
anct
ion
Race White Black or African American Asian or Asian American Other Unknown
Sanctioned Student Race Counts Relative to All Sanctioned Students (1987−2016)
Data from the Honor Committee Working Group on Assessment & Data Management
Figure 9: Aggregate totals of students by race, 1987-2016. Theremore sanctions in the 2000’s than in the 1990’s.
13

4.2.2 GENDER
Figure 10gives the gendermakeupofUniversity students from1991 to 2018.
40
45
50
55
60
1991 1995 2000 2005 2010 2015
Year
Per
cent
of A
ll S
tude
nts
Gender
Female
Male
UVA Student Gender Demographics (1991−2015)
Data from the UVA Office of Institutional Assessment & Studies
Figure 10: Gender demographics of theUniversity, 1991-2018. The proportion of fe-male students at theUniversity increased from1991 to 2010.
Moremalestudents thanfemalestu-dents were sanctioned for every timeperiod under study: Figure 11 shows stu-
dents sanctioned by gender during each time
period under study. The gender disparitywas
most significant from 1990 to 2000, where
70percentof students sanctionedweremale
and 30 percent were female. In compari-
son, in 1995, 51 percent of students were fe-
male and 49 percent were male. Male stu-
dents were over-represented by 20 percent-
age points within the population of sanc-
tioned students.
Thegenderdemographicsofrecentlysanctionedstudentsarebetterapproach-ingUniversitygenderdemographics:The
proportionof female students sanctionedhas increasedover the past 15 years as the proportionofmale students sanc-
tionedhasdecreased, and in themost recent timeperiod,male studentswereonlyover-representedamongsanctioned
students by 10percentagepoints.
42
30.19 28.57 3539.37 36.36 47.27
48
69.81 69.64 63.7559.06 62.12 49.09
0%
25%
50%
75%
100%
1987−1989 1990−1994 1995−1999 2000−2004 2005−2009 2010−2013 2014−2016Time Period
Per
cent
of S
tude
nts
Faci
ng S
anct
ion
Gender Female Unknown Male
Sanctioned Student Gender as a % of All Sanctioned Students (1987−2016)
Data from the Honor Committee Working Group on Assessment & Data Management
Figure 11: Students sanctioned by gender, as a proportion of all students facing sanction, 1987-2016. Male studentswere overrepresented as aproportionof all sanctionedstudents relative to theUniversitypopulation. However, the recentgenderdemographicsof sanctionedstudentsapproachUniversity genderdemographics.
14
4.2.3 INTERNATIONAL STATUS
The proportion of students with an unknown international status is larger in the earlier time periods, and therefore re-
sults are the least robust for theperiod from1987 to 2000.
0
5
10
15
1991 1995 2000 2005 2010 2015
Year
% o
f All
Stu
dent
s
International Students as a % of All UVA Students (1991−2015)
Data from the UVA Office of Institutional Assessment & Studies
Figure 12: International demographics of the University, 1991-2018. The proportionofUVAstudentswhoare international students doubledbetween 1991 and2015.
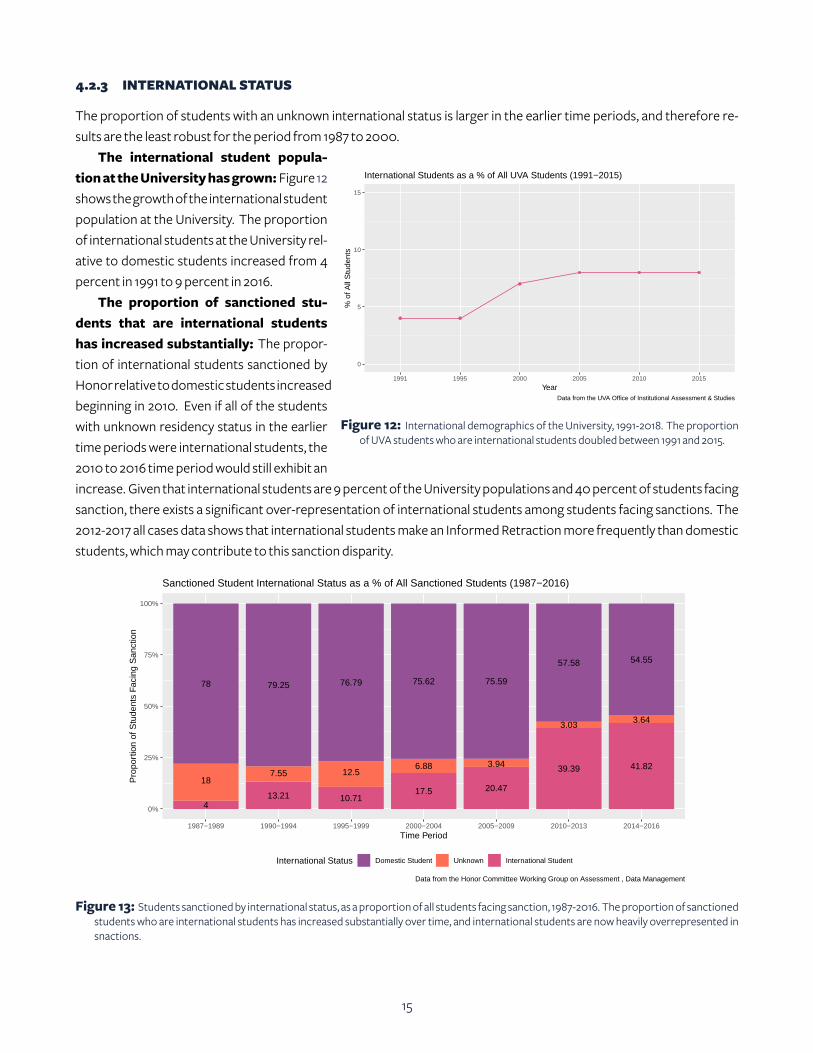
The international student popula-tionattheUniversityhasgrown: Figure12
showsthegrowthoftheinternationalstudent
population at the University. The proportion
of international students at theUniversity rel-
ative to domestic students increased from 4
percent in 1991 to9percent in 2016.
The proportion of sanctioned stu-dents that are international studentshas increased substantially: The propor-
tion of international students sanctioned by
Honorrelativetodomesticstudents increased
beginning in 2010. Even if all of the students
with unknown residency status in the earlier
timeperiodswere international students, the
2010 to2016 timeperiodwould still exhibit an
increase. Given that international studentsare9percentof theUniversitypopulationsand40percentof students facing
sanction, there exists a significant over-representation of international students among students facing sanctions. The
2012-2017 all cases data shows that international studentsmake an InformedRetractionmore frequently thandomestic
students,whichmay contribute to this sanctiondisparity.
78 79.25 76.79 75.62 75.59
57.58 54.55
187.55 12.5
6.88 3.94
3.033.64
413.21 10.71
17.5 20.47
39.39 41.82
0%
25%
50%
75%
100%
1987−1989 1990−1994 1995−1999 2000−2004 2005−2009 2010−2013 2014−2016Time Period
Pro
port
ion
of S
tude
nts
Faci
ng S
anct
ion
International Status Domestic Student Unknown International Student
Sanctioned Student International Status as a % of All Sanctioned Students (1987−2016)
Data from the Honor Committee Working Group on Assessment , Data Management
Figure 13: Students sanctionedby international status, as aproportionofall students facingsanction, 1987-2016. Theproportionof sanctionedstudentswho are international students has increased substantially over time, and international students are nowheavily overrepresented insnactions.
15

4.3 KEY FINDINGS&DISCUSSION
KEY FINDINGS: ALL SANCTIONTYPES: THREEDECADESOFDETAILEDDATA (1987-2016)
• Cheating is themost commonly sanctioned offense: Since 2000,more than 65 percent of sanctioned stu-
dentswere reported for cheating.
• The number of sanctioned stealing offenses has declined: Sanctions for stealing have decreased from26
percentof all sanctionsbetween 1987 and 1989 to 2percentof all sanctions from2010 to 2016.
• The demographics of sanctioned students have changed: In the 1980s and 1990s, the percentageof sanc-
tionedstudentswhowereBlackwashigher thanthepercentageofBlackstudentsattendingUVAbut thisdisparity
decreasedovertime. ThepercentageofsanctionedstudentswhowereAsian increasedoverthesameperiod. The
percentage of sanctioned students from 2010-2016 who were international students increased relative to previ-
ous years.
DISCUSSION
Offense Type: As theHonor Systemadapts to themindset of the students it represents, the typeof offenses reported
and sanctioned has adjusted. While lying, cheating, and stealing have always been the three tenets of what the Honor
System sets out to enforce, the proportion of the cases handled has changed drastically over time. Stealing was once a
major offense type heard by theHonor Committee. Cases such as the “CokeCase,” where a student allegedly stole sev-
eral cans of soda fromanopen vendingmachine, was found guilty at anHonor hearing, then nearly immediately had the
verdictnullifiedhadgreat influenceonwhat thestudents, and thereforeCommittee, saw fit toenforce. In addition,while
the University Judiciary Committee (UJC) pre-dates this data set, increased cooperation and more clear guidelines of
which Committee is responsible for what has seen stealing cases mostly being handled by UJC. Despite this, while lying
and stealing make up only a fraction of the cases handled by the Honor Committee, both remain important aspects of
the system.
Race: Amore robust discussion of the recent racial demographics, especially the over-representation of Asian and
AsianAmerican students, canbe found in thediscussion section for the six year data set onpage 28.
The racial demographics of students facing Honor sanction have change dramatically over the past three decades.
Black students made up 42 percent of all sanctioned students from 1987 to 1989, but only 3.54 of sanctioned students
from 2014-2016. We cannot explain this decline with any specific policy changewithin the system. We do not have data
on the racial demographics of reports during this timeperiod, sowe are unable to assesswhether the significant dispar-
ities observed are the result of a high number of reports of Black or African American students or whether the system
containedbiaseswhichmadeBlackorAfricanAmerican studentsmore likely to face some typeof sanction. Though the
dataon athlete status had significant unknownproportions,manyof theBlack students sanctioned in earlier yearswere
studentathletes,andsoacoordinatedefforttoprovidestudentsathleteswithmorecomprehensiveacademicresources
maycontribute to this observed trend.
It isalso important tonotethat therearesignificantunknownproportions inourracedata, reachingupto20percent
of sanctioned students in some time periods. This means the relative rates of racial disparity could be more significant
than they appear. We had hoped to be able to compute racial disproportionality indices (RDIs), comparing the number
of Black or African American students who faced a sanction as a percent of all sanctions to relative size of the Black or
African American population at the University. Unfortunately, we were unable to do so for two reasons: First, because
the University uses the IPEDS standards which categorize all international students as ‘Non-Resident Alien’, we would
onlybeable tocomputeRDIs fordomestic students. Giventhat international studentsaresucha largepercentageofour
16

data, especially in recent years, we felt this might misrepresent the true numbers. Second, because we have such large
percentages of unknowns, which could be distributed differently thanour observeddata, any RDIswe computedwould
have a significantmargin of error and could bemuch lower ormuch higher than the true number. The percentages we
report here are necessarily a floor; becauseunknowns are included in theproportions, eachproportion could behigher
thantheobservedvalue,butnonecouldbe lower,andthereforewefeltcomfortablereportingthepercentagesasabase-
line. AnyRDIs relative toabaselinecouldbehigheror lower thanthe truevalue, rendering themessentially anunfounded
guess.
Gender: From 1990-2013, female students were underrepresented among sanction andmale students were over-
represented, relative toUniversity demographics. Thegenderdemographicsof recently sanctioned students arebetter
approaching University gender demographics, with about equal gender representation in sanctions from 2014 to 2016,
thoughmale students are still slightly overrepresented among sanctions relative toUVA.Aswewill see later in the6 year
data, the overrepresentation ofmale students in reports and sanctions relative to their population is a remarkably con-
sistent trend over the six year period, potentially suggesting a consistent underlying cause or mechanism. This would
benefit from further research andconsideration tounderstand the interplayor gender and sanctionoutcomes.
International Status: 2010-2016sawasignificant increase insanctions for international students relative to2000-
2009; international studentsmade up 40 percent of all students who faced some type of sanction. As wewill see in the
next section, international students more frequently take the IR, which may explain some of the sanctions from 2014-
2016, but not the trend from 2010 to 2014. Honor’s Community Relations and Diversity Advisory Committee (CRDAC)
works closelywith the International StudiesOfficeoneducation andoutreach, but this issuewouldbenefit from further
study andadeeper understandofwhat is truly driving this trend.
17

5 ALL REPORTS&OUTCOMES: SIX YEARSOF FULLDATA (2012-2017)
Thissectionwill considersixyears(2012-2017)ofcaseprocessingdata fromreport tocaseoutcome. Thisdatasetwasre-
trieved from theHonor internal casemanagement systemby the Vice Chair for Investigations. The earlier years of data
(2012-2014) contained a significant number of unknowns across demographic fields, where the later years (2015-2017)
weremore complete. This data set does not contain information on theAct reported (Lying, Cheating, or Stealing), but
collectionefforts areunderway toenablea futureanalysis across typesofAct. For thecontextof this analysis, it is impor-
tant to note that the vastmajority of reportedHonor cases pertain to cases of cheating, see Figure 5) and so analysiswill
heavily focusonpotential significance for cheatingbehavior.
5.1 REPORTING
n = 42n = 38
n = 56n = 53
n = 48
n = 39
.
0
10
20
30
40
50
60
2012 2013 2014 2015 2016 2017
Year
Num
ber
of C
ases
Number of Reports by Year (2012−2017)
Data from the Honor Committee Working Group on Assessment & Data Management
Figure 14: Numberof students reported to theHonorSystem, 2012-2017
The Honor process begins when the system re-
ceivesareport. Honorcannotanddoesnotproac-
tively seek out cases; cases can only be initiated
through a report from faculty, students, or com-
munitymembers.
Reporting rates were low: Honor usually
receives between 40 and 60 reports per year. The
average for the study period was 46 reports. The
University’s total enrollment as of fall 2017 was
24,360 students3, which translates to a reporting
rate of 0.002 cases per enrolled student per year.
In comparison, a 2012 survey, 4.7 percent of stu-
dents admitted tohaving committed anHonorof-
fenseduring their timeat theUniversity.4
Most caseswere reportedbyprofessors:Anyperson (faculty, student, staff, communitymember) can report a student to theHonorSystem.
60.9%
17.9%
12.0%
2.6%5.8%
0.7%
.
0.0%
20.0%
40.0%
60.0%
Professor Student TA Administrator Other Unknown
Reporter Type
Per
cent
of C
ases
Reporter Type
Professor
Student
TA
Administrator
Other
Unknown
Percent of Reports by Reporter Type (2012−2017)
Data from the Honor Committee Working Group on Assessment & Data Management
Figure 15: Numberof reports by reporter type, 2012-2017.
3https://ias.virginia.edu/university-stats-facts/enrollment4http://honor.virginia.edu/sites/honor.virginia.edu/files/2012-Student-Survey.pdf
18

Figure15showsthenumberofreportsbyreportertype. Professorswerethemost frequentreporters(60percentof
reports), followedbystudentsat 18percentandteachingassistants(TAs)at 11percent. Dataondepartmentbreakdowns
has not been consistently collected by previous committees, but collection is beginning now in order to enable future
committeestobetterunderstandthedistributionofreportsbyreporterdepartment(wherethereporter isaprofessor).
Most reported students in the College of Arts and Sciences (CLAS) or the School of Engineering andApplied Science (SEAS):Figure 16gives thebreakdownof reported studentsby schoolof enrollment. Most reported
students (54 percent) in the College of Arts and Sciences, followed by 13 percent in the School of Engineering and Ap-
plied Science, andbetween 1 and 3 percent for all other schoolswith 19 percent of cases inwhich the student’s school of
enrollment is unknown5. No reports were received from the Darden School of Business or the School of Law between
2012 and 2017. The number of students reported by the other schools varies significantly by year because of their small
size relative toCLASandSEAS.
54.4%
13.5%
1.1% 1.8% 3.3% 1.5% 0.7% 1.5% 3.3%
19.0%
.
0.0%
20.0%
40.0%
CLAS SEAS ARCH BATTEN COMM CURRY MED NURSING SCPS Unknown
Year
Per
cent
of R
epor
ted
Cas
es
Percent of Reports by School of Enrollment of Reported Student (2012−2017)
Data from the Honor Committee Working Group on Assessment & Data Management
Figure 16: Numberof reports by school of enrollmentof the reported student, 2012-2017.
Reporting rates vary by school: Figure 17 shows the total numberof reportsover the six yearperiod as apropor-
tionof total school enrollment. TheFrankBattenSchool for Leadership&Public Policy has thehighest rateof reporting
relative to their size, where the Curry School for Education and the Medical School have the lowest rates of reporting
relative to their size.
n = 149n = 37
n = 3
n = 5
n = 9
n = 4 n = 2
n = 4
n = 9
0.000
0.005
0.010
0.015
0.020
CLAS SEAS ARCH BATTEN COMM CURRY MED NURSING SCPS
Year
Rep
ortin
g R
ate
(Rep
orts
/Enr
ollm
ent)
Rate of Reporting by School (2012−2017)
Data from the Honor Committee Working Group on Assessment & Data Management
Figure 17: Reporting rates by reported student school of enrollment, 2012-2017.
5Caseswithunknownschool of enrollment from2012 to 2014.
19

It is important to recognize that reporting rates do not necessarily reflect the true rates ofHonor offenses in any of
the given schools, given that offenses may go unreported for a variety of reasons. It is also important to note that the
rates for the small schools are extremely variable given the small numberof cases (givenby then aboveeachbar), so the
most robust conclusions canbedrawn fromtheCLASandSEAS rates.
First years reported least frequently, third years reported most frequently: Many within and outside of
Honorwonderwhether first year studentsmaybemore likely to cheatorbe reported toHonorgiven thewide varietyof
student backgrounds represented at theUniversity and thenovelty of theHonor code tomany students. Figure 18 gives
the trueproportions.
10.2%
19.3%
36.0%
17.1%
11.3%
6.2%
.
0.0%
10.0%
20.0%
30.0%
First Second Third Fourth Grad Unknown
Student Year at the University
Per
cent
of R
epor
ted
Cas
es
Reported Cases by Year of Reported Student (2012−2017)
Data from the Honor Committee Working Group on Assessment & Data Management
Figure 18: Reports by yearof reported student, 2012-2017.
Third year students make up the highest proportion of reported students, at around 36 percent. Second year stu-
dents follow at 19 percent, fourth year students at 17 percent, and first year students at 10 percent. Graduate students
were 11 percentof all cases, and about 6percentof cases have year unknown.
5.2 CASE PATHSANDOUTCOMES
Honor cases end in one of seven ways: the reported student makes an IR, the case is dropped by the I-Panel, the case
is dropped by the Executive Committee, student leaves admitting guilt (LAG), student found guilty at hearing, student
foundnot guilty at hearing, orwith thecase sent to theContributoryMentalDisorderprocess (CMD). IR,Guilty, andLAG
were considered sanctionoutcomeswhere the student either takes a leave of absence or leaves theUniversity. I-Panel
Drop, Administrative Drop6, and Not Guilty were considered no-sanction outcomes where the student does not face
anyconsequence for the report. TheContributoryMentalDisorderprocess (CMD)will notbeconsidered indiscussions
of sanction as the sanctioningpurview is outside the jurisdictionof theHonorCommittee.
6A case is considered Administrative Drop if it is dropped by the Executive Committee when the report is made in bad faith, the case has noevidence, or if the casewasdropped for aprocedural reason (i.e. student is no longer enrolled, no jurisdiction tohear the case, etc).
20
22.1%
5.4%
15.2%
9.8%
22.5%
18.1%
6.9%
.
0.0%
5.0%
10.0%
15.0%
20.0%
25.0%
IR LAG Guilty Administrative Drop I−Panel Drop Not Guilty CMD
Case Outcome
Per
cent
of A
ll C
ases
Case Outcome
IR
LAG
Guilty
Administrative Drop
I−Panel Drop
Not Guilty
CMD
Aggregated Case Outcomes as a % of All Cases (2012−2017)
Data from the Honor Committee Working Group on Assessment & Data Management
Figure 19: Aggregate case outcomes, 2012-2017. Guilty, IR, and LAG are Sanction outcomes, Not Guilty, I-Panel Drop, and Administrative DropareNo-Sanctionoutcomes.
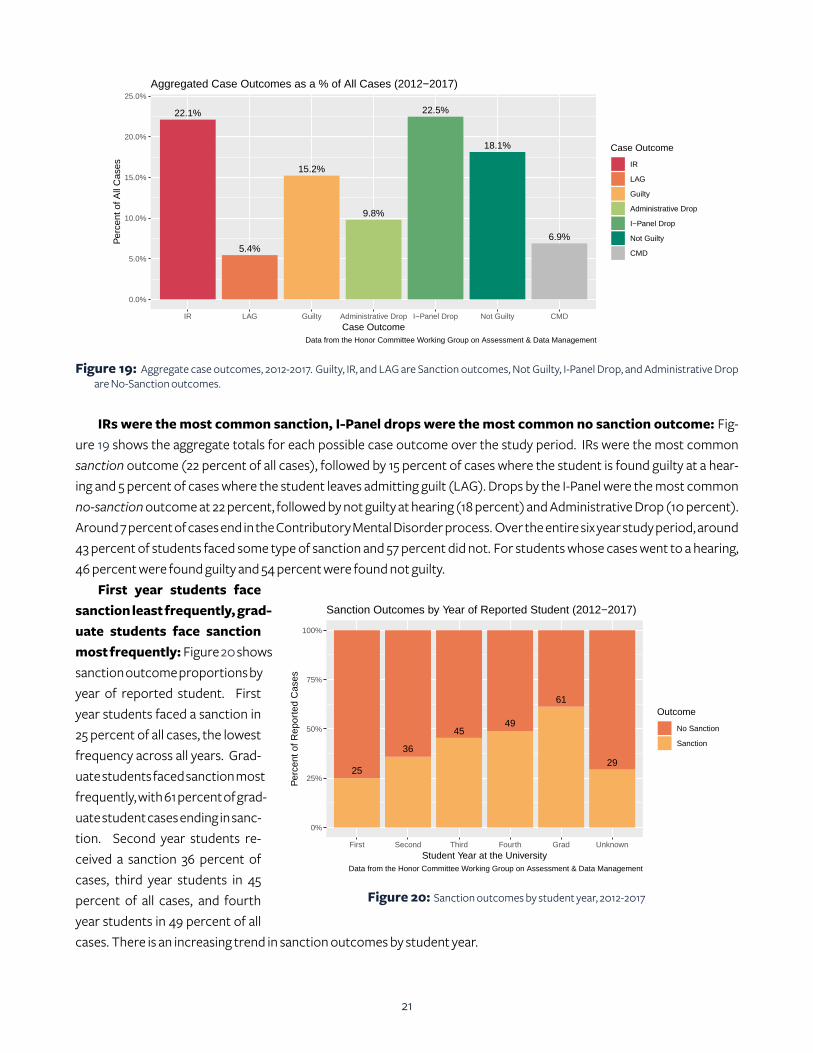
IRs were themost common sanction, I-Panel drops were themost common no sanction outcome: Fig-ure 19 shows the aggregate totals for each possible case outcome over the study period. IRs were the most common
sanction outcome (22 percent of all cases), followed by 15 percent of cases where the student is found guilty at a hear-
ing and 5 percent of caseswhere the student leaves admitting guilt (LAG). Drops by the I-Panel were themost common
no-sanctionoutcomeat 22percent, followedbynot guilty at hearing (18percent) andAdministrativeDrop (10percent).
Around7percentofcasesend intheContributoryMentalDisorderprocess. Overtheentiresixyearstudyperiod,around
43 percent of students faced some typeof sanction and 57 percent did not. For studentswhose caseswent to a hearing,
46percentwere foundguilty and 54percentwere foundnot guilty.
25
36
4549
61
29
0%
25%
50%
75%
100%
First Second Third Fourth Grad Unknown
Student Year at the University
Per
cent
of R
epor
ted
Cas
es
Outcome
No Sanction
Sanction
Sanction Outcomes by Year of Reported Student (2012−2017)
Data from the Honor Committee Working Group on Assessment & Data Management
Figure 20: Sanctionoutcomesby student year, 2012-2017
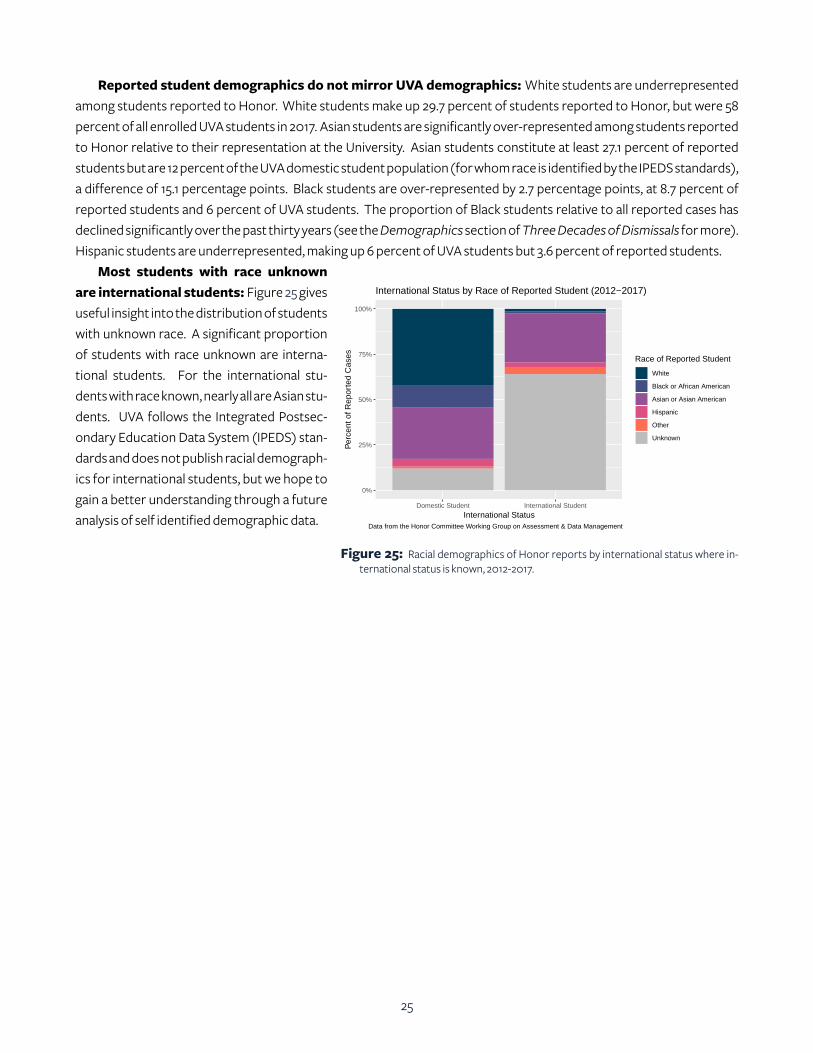
First year students facesanctionleastfrequently,grad-uate students face sanctionmostfrequently: Figure20shows
sanctionoutcomeproportionsby
year of reported student. First
year students faced a sanction in
25 percent of all cases, the lowest
frequency across all years. Grad-
uatestudentsfacedsanctionmost
frequently,with61percentofgrad-
uatestudentcasesendinginsanc-
tion. Second year students re-
ceived a sanction 36 percent of
cases, third year students in 45
percent of all cases, and fourth
year students in 49 percent of all
cases. There is an increasing trend in sanctionoutcomesby student year.
21

Figure 21 shedsmore light on this trend, showing each case outcomeby year of reported student as a proportion of
all caseoutcomes for studentsof that year.
n = 28 n = 53 n = 99 n = 47 n = 31 n = 17
0%
25%
50%
75%
100%
First Second Third Fourth Grad Unknown
Year
Per
cent
of R
epor
ted
Cas
es Case Outcome
IR
LAG
Guilty
Administrative Drop
I−Panel Drop
Not Guilty
CMD
Complete Case Outcomes by Year of Reported Student (2012−2017)
Data from the Honor Committee Working Group on Assessment & Data Management
Figure 21: Caseoutcomesby yearof reported student, 2012-2017.
Higher year students more likely to make an Informed Retraction, less likely to be found not guilty athearing: Figure 21 shows complete case outcomes by year of reported student and Table 1 shows the percent break-
downs. 11 percent of first year students choose tomake an InformedRetraction, compared to 28 percent of fourth year
students and 35percent of graduate students. Second year and third year students fall in themiddle at 17 percent and 22
percentmaking an InformedRetraction.
Table 1: CaseOutcomesbyYearof ReportedStudent, 2012-2017
First Second Third Fourth Grad UnknownIR 10.71 16.98 22.22 27.66 35.48 17.65
LAG 10.71 0.00 5.05 4.26 16.13 0.00Guilty 3.57 18.87 18.18 17.02 9.68 11.76
AdministrativeDrop 3.57 13.21 6.06 12.77 9.68 17.65I-PanelDrop 32.14 26.42 20.20 19.15 19.35 23.53
NotGuilty 35.71 15.09 18.18 19.15 9.68 11.76CMD 3.57 9.43 10.10 0.00 0.00 17.65
36 percent of first year students were found not guilty at a hearing, compared to 19 percent of fourth year students
and 10 percent of graduate students. Second and third years fall in between, at 26 and 20 percent found not guilty at
hearing, respectively.
22

0.4
0.5
0.6
2012 2013 2014 2015 2016 2017
Year
Pro
port
ion
of C
ases
Case Outcome
No Sanction
Sanction
Comparing Sanction Outcomes by Year (2012−2017)
Data from the Honor Committee Working Group on Assessment & Data Management
Figure 22: Percent of cases ending in sanction (LAG, IR, Guilty) compared to no-sanction by year, 2012-2017. 2017 was the first year in which more students facedsanction thanno-sanction.
More students received sanction af-ter IRwas passed: Thepercent of students
who received some type of sanction has con-
sistently increased over the past five years
beginning in 2013 with the passing of the In-
formedRetraction,suggestingthattheIRmay
ensure that more students face some sort of
sanction. Figure 22 shows that 2017 was the
first year under study inwhichmore students
faced a sanction (IR, Guilty, or LAG) than did
not facea sanction (I-PanelDrop,Administra-
tiveDrop,NotGuilty).
Not all reported cases were equallylikely toend insanction: Figure23givesthe
proportionof cases ending in sanction as compared tono sanctionby typeof reporter.
Students reported by professors faced a sanction outcome in 54 percent of cases and students reported by admin-
istrators faced sanctions in 57 percent of cases, compared to cases reported by students inwhich the reported student
faced a sanction in 12 percent of cases during the study period. Cases reported by teaching assistants (TAs) end in sanc-
tionat ratessimilar toprofessorsat42percentof reportedcases. Students reportedbyanyother individual (community
members, staff, alumni) faced sanction 5percentof the time.
n = 167 n = 49 n = 33 n = 7 n = 16
54
12
42
57
5
0%
25%
50%
75%
100%
Professor Student TA Administrator Other
Reporter Type
Per
cent
of C
ases
Case Outcome
No Sanction
Sanction
Sanction Outcomes by Reporter Type (2012−2017)
Data from the Honor Committee Working Group on Assessment & Data Management
Figure 23: Frequencyof sanctionoutcomesby reporter type,where reporter type is known, 2012-2017.
23

5.3 DEMOGRAPHICS
Demographic data from the period under study has substantial proportions of unknowns across demographic dimen-
sions. TheHonorSystemhassporadically trackedcasedemographics, andhas rarelykeptself-reporteddemographic in-
formation. Beginningwith the2018-2019Committee, all studentswill beaskedtocompleteaself-reporteddemographic
data form, andwehope that amore robust and complete analysis and reviewwill be complete in five to ten years once a
large enough sampleof caseswith self-reporteddemographic informationexists.
Theauthorswould like tonote that gender for thecontextof this reportwill relyprimarilyon themale-femalebinary
conception for identifying gender and race and ethnicity categories are based on the Integrated Postsecondary Educa-
tionData System(IPEDS) categorizations, for institutional consistency. TheHonorCommittee acknowledges the insuf-
ficiency of these definitions to capture the full range of identity. This analysis will consider race, gender, international
status, and athlete status.
5.3.1 RACE
Racedemographics for theUniversity come from theOffice of Institutional Assessment&Studies. Wherenot specified
otherwise, thenumbers are fromenrollment totals by race for the fall semester of 2017. Racial categorieswhichhad few
studentswere categorized together asOther in order toprotect the confidentiality of students forwhomrace could be
apotentially identifying factor given a small numberof studentwith that race at theUniversity.
Race demographics contain a substantial proportions of unknowns:More than60percent of cases in 2012
have no listed race. This may be due in part to the transition to a new internal case management system and partially
because racecomes fromdemographics listed in the student’s SIS accountandsomestudentsdonothavea raceoreth-
nicity listedonSIS.Most of the unknown values come from2012 and 2013. In 2012,more than 50percent of students did
nothavea race listedon the internal casemanagement system. Thismaybebecause the systemwasnewat the timeand
the informationwas not consistently recorded, or be a consequence ofwhatever informationwas listed on SIS. For this
reason, the race proportions listed are necessarily a floor for the true number, meaning they are theminimumpossible
value. It is important to recognize these proportions may not be accurate because the distribution of unknowns likely
does notmirror thedistributionof knownvalues by race (see Figure 25). Because there are such significant proportions
ofunknowns,wecannotdrawconclusionsabout relative size, given that theunknownproportioncouldchange the rela-
tionmetric between two racial groups.
29.7%
8.7%
27.2%
3.6%1.8%
29.0%.
0.0%
10.0%
20.0%
30.0%
White Black or African American Asian or Asian American Hispanic Other Unknown
Race of Reported Student
Per
cent
of A
ll R
epor
ted
Stu
dent
s
Aggregated Cases by Race of Reported Student (2012−2017)
Data from the Honor Committee Working Group on Assessment & Data Management
Figure 24: Racial demographics ofHonor reports, 2012-2017.
24
Reported student demographics do not mirror UVA demographics: White students are underrepresented
among students reported to Honor. White students make up 29.7 percent of students reported to Honor, but were 58
percentof all enrolledUVAstudents in2017. Asian students are significantlyover-representedamongstudents reported
to Honor relative to their representation at the University. Asian students constitute at least 27.1 percent of reported
studentsbutare12percentoftheUVAdomesticstudentpopulation(forwhomraceis identifiedbytheIPEDSstandards),
a difference of 15.1 percentage points. Black students are over-represented by 2.7 percentage points, at 8.7 percent of
reported students and 6 percent of UVA students. The proportion of Black students relative to all reported cases has
declinedsignificantlyover thepast thirtyyears (see theDemographics sectionofThreeDecadesofDismissals formore).
Hispanic students areunderrepresented,makingup6percentofUVAstudents but 3.6 percentof reported students.
0%
25%
50%
75%
100%
Domestic Student International Student
International Status
Per
cent
of R
epor
ted
Cas
es Race of Reported Student
White
Black or African American
Asian or Asian American
Hispanic
Other
Unknown
International Status by Race of Reported Student (2012−2017)
Data from the Honor Committee Working Group on Assessment & Data Management
Figure 25: Racial demographics of Honor reports by international status where in-ternational status is known, 2012-2017.
Most students with race unknownare international students: Figure25gives
useful insight intothedistributionofstudents
with unknown race. A significant proportion
of students with race unknown are interna-
tional students. For the international stu-
dentswithraceknown,nearlyallareAsianstu-
dents. UVA follows the Integrated Postsec-
ondary Education Data System (IPEDS) stan-
dardsanddoesnotpublishracialdemograph-
ics for international students, but we hope to
gain a better understanding through a future
analysis of self identifieddemographic data.
25

5.3.2 GENDER
Gender, for the context of this analysis, was considered usingmale-female categories for institutional comparison. The
2017-2018 Committee introduced self-identified demographic data forms which give students the option to specify a
genderother thanmaleor female if they sowish, and so future analyseswill bemoredetailed.
39.5%
5.4%
55.1%.
0.0%
20.0%
40.0%
Female Unknown Male
Gender of Reported Student
Per
cent
of R
epor
ted
Stu
dent
s
Aggregated Cases by Gender of Reported Student (2012−2017)
Data from the Honor Committee Working Group on Assessment & Data Management
Figure 26: GenderdemographicsofHonor reports, 2012-2017.
Male students over-represented rel-ative to UVA demographics, female stu-dents under-represented: UVA has a stu-
dent population that is 54.9 percent female
and 45.1 percent male7, yet female students
constitute 39.4 percent of students reported
toHonor andmale studentsmakeup55.1 per-
cent, with 5.4 percent unknown. Male stu-
dents are overrepresented by 10 percentage
points relative to their population at the Uni-
versity.
Gender trend is a consistent phe-nomenonover the six year studyperiod:Gender has been remarkably stable across
multiple years, as shown by Figure 27. This
likely indicates that thedisproportionate representationofmale students is not due to statistical chance.
54.76 57.89 53.57 56.6 54.17 53.85
38.1 36.84 39.29 39.62 41.67 41.03
0%
25%
50%
75%
100%
2012 2013 2014 2015 2016 2017
Year
Per
cent
of R
epor
ted
Cas
es
Gender
Female
Unknown
Male
Reported Students by Gender by Year (2012−2017)
Figure 27: Gender demographics of Honor reports, 2012-2017. Dotted line represents the proportion of male students in the UVA studentpopulation in 2017.
7https://admission.virginia.edu/admission/statistics
26

5.3.3 INTERNATIONAL STATUS
Basedonanecdotalexperiencewithcaseprocessing,manyinHonorhavebecomeconcernedthat internationalstudents
areover-represented among students reported toHonor. Figure 28 confirms that concern.
69.2%
2.5%
28.3%
.
0.0%
20.0%
40.0%
60.0%
Domestic Student Unknown International Student
International Status of Reported Student
Per
cent
of R
epor
ts
Aggregated Cases by International Status of Reported Student (2012−2017)
Data from the Honor Committee Working Group on Assessment & Data Management
Figure 28: International students as apercentof all reported students, 2012-2017.
Internationalstudentsareover-representedrelative to UVA demographics: Interna-
tionalstudentsare10percentofenrolledUVA
students8 butwere28percentof students re-
ported to the Honor System, making them
over-represented in reports.
Internationalstudentsendupinsanc-tion outcomes more frequently than inno-sanction outcomes: Looking at sanc-
tion outcomes, international students make
theIRorarefoundguiltyatahearingmorefre-
quently than domestic students. 32 percent
of international students make the informed
retraction,comparedto19percentofdomes-
tic students. 19 percent of international stu-
dents are foundguilty at a hearing, compared to 14percentof domestic students.
0%
25%
50%
75%
100%
Domestic Student International Student
Case Outcome
Per
cent
of R
epor
ted
Cas
es Case Outcome
IR
LAG
Guilty
Administrative Drop
I−Panel Drop
Not Guilty
CMD
Case Outcomes by International Status (2012−2017)
Data from the Honor Committee Working Group on Assessment & Data Management
Figure 29: International statusof reported studentsbycaseoutcomewhere international status isknown, 2012-2017. International students end in sanctionoutcomesmore frequently.
LAG rates are very similar for
internationalstudentsanddomes-
tic students. 6 percent of in-
ternational students leave admit-
ting guilt, compared to 5 percent
of domestic students. In look-
ing at no-sanction outcomes, 17
percent of international students
havetheircasedroppedatI-Panel,
compared to 24 percent of do-
mestic students. 4 percent of in-
ternational students have cases
that end in Administrative Drop,
compared to 11 percent of do-
mestic students. See Section Six
formoreoninternationalstudents
and the likelihood of sanction in
the results of a logistic regression
modeltounderstandtheeffectof
international status of likelihood
of sanction, after controlling for
race, gender, reporter type, stu-
dent year, and athlete status.
8EnrollmentData. Officeof Instituional Assessment Studies. Retrieved from: https://ias.virginia.edu/university-stats-facts/enrollment
27

5.3.4 ATHLETE STATUS
89.9%
2.5%7.6%
.
0.0%
25.0%
50.0%
75.0%
Not Student Athlete Unknown Student Athlete
Student Athlete Status of Reported Student
Per
cent
of R
epor
ted
Cas
es
Reports by Athlete Status of Reported Student (2012−2017)
Data from the Honor Committee Working Group on Assessment & Data Management
Figure 30: Aggregate totals of athlete statusof reported students, 2012-2017.
There are currently 854 student athletes at
theUniversity, constituting 3.4 percent of the
student body.9 Given that there were 21 stu-
dent athletes reported during the six year
study period, we cannot draw robust conclu-
sions about the intersection between athlete
status andother identities.
Studentathletesareover-representedrelative to UVA demographics: Student
athletes are 7.6 percent of students reported
to Honor, more than twice the proportion of
student athletes at the University. Because
the proportion of students athletes at the
University and reported to Honor is so low,
this number may be higher or lower than the
true value.
Student athletes face sanctions at the same rate as other students: Student athletes face sanction in 43
percent of cases, very similar to the proportion for students who are not student athletes (44 percent). There were no
significant differences in the types of outcomes within the sanction/no-sanction framework between student athletes
andnon-athlete students.
0%
25%
50%
75%
100%
Not Student Athlete Student Athlete
Student Athlete Status
Per
cent
of R
epor
ted
Cas
es
Reporter Type
Professor
Student
TA
Administrator
Other
Student Athlete Status of Reported Student by Reporter Type (2012−2017)
Data from the Honor Committee Working Group on Assessment & Data Management
Figure 31: Athletestatusof reportedstudentsbyreporter typewherereporter type isknown, 2012-2017.
Studentathletesareslightlymore likely to be reported byadministrators,professors, lesslikely to be reported by stu-dents: 71 percentof student ath-
letes are reported by professors,
compared to60percent of other
students. 5 percent of student
athletes are reported by admin-
istrators, compared to 2 percent
of other students. 18 percent
of non-athlete students are re-
ported by other students, com-
pared to 14 percent of student
athletes.
9Statistic provideddirectly by theUVAAthleticsDepartment in Januaryof 2019.
28
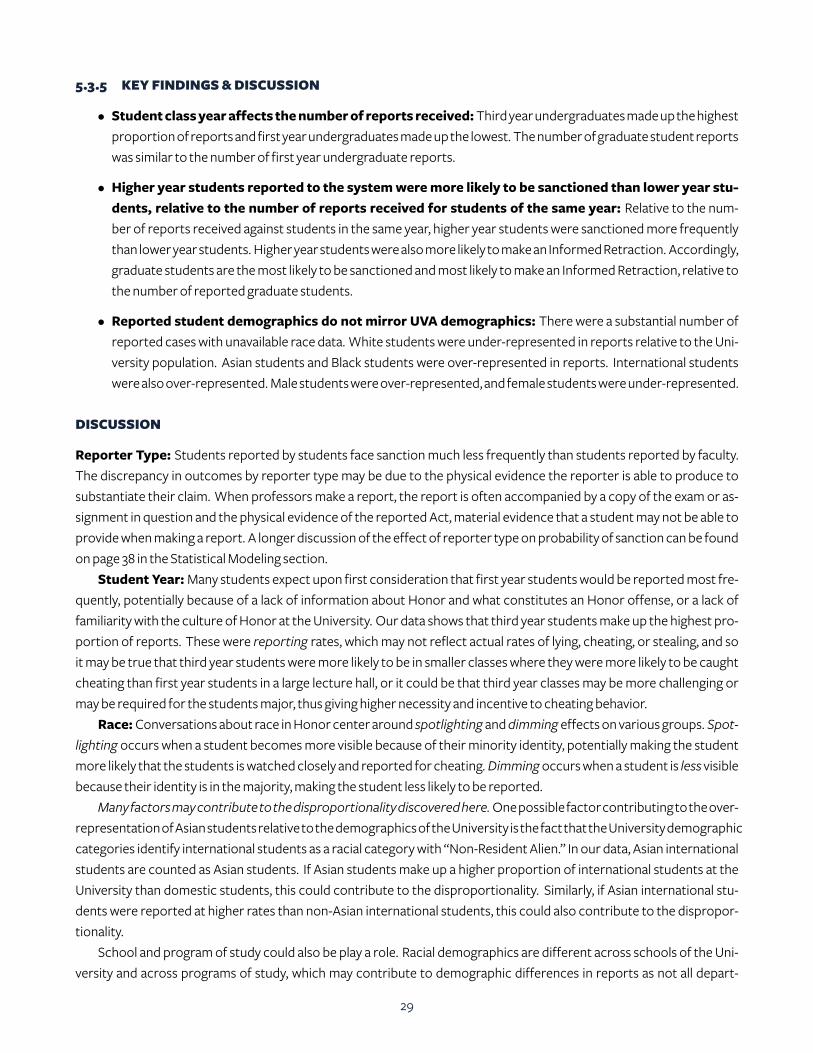
5.3.5 KEY FINDINGS&DISCUSSION
• Studentclassyearaffects thenumberof reports received: Thirdyearundergraduatesmadeupthehighest
proportionofreportsandfirstyearundergraduatesmadeupthe lowest. Thenumberofgraduatestudentreports
was similar to thenumberof first year undergraduate reports.
• Higher year students reported to the systemweremore likely to be sanctioned than lower year stu-dents, relative to the number of reports received for students of the same year: Relative to the num-
ber of reports received against students in the same year, higher year students were sanctionedmore frequently
than loweryearstudents. Higheryearstudentswerealsomore likely tomakean InformedRetraction. Accordingly,
graduate students are themost likely tobe sanctioned andmost likely tomake an InformedRetraction, relative to
thenumberof reportedgraduate students.
• Reported student demographics do not mirror UVA demographics: Therewere a substantial number of
reported caseswith unavailable race data. White studentswere under-represented in reports relative to theUni-
versity population. Asian students and Black students were over-represented in reports. International students
werealsoover-represented. Malestudentswereover-represented,andfemalestudentswereunder-represented.
DISCUSSION
Reporter Type: Students reported by students face sanctionmuch less frequently than students reported by faculty.
The discrepancy in outcomes by reporter type may be due to the physical evidence the reporter is able to produce to
substantiate their claim. When professorsmake a report, the report is often accompanied by a copy of the examor as-
signment in question and the physical evidenceof the reportedAct,material evidence that a studentmay not be able to
providewhenmaking a report. A longerdiscussionof theeffectof reporter typeonprobability of sanctioncanbe found
onpage 38 in theStatisticalModeling section.
Student Year:Many students expect upon first consideration that first year studentswould be reportedmost fre-
quently, potentially because of a lack of information about Honor and what constitutes an Honor offense, or a lack of
familiaritywith the culture ofHonor at theUniversity. Our data shows that third year studentsmake up the highest pro-
portion of reports. These were reporting rates, whichmay not reflect actual rates of lying, cheating, or stealing, and so
itmay be true that third year studentsweremore likely to be in smaller classeswhere theyweremore likely to be caught
cheating than first year students in a large lecture hall, or it could be that third year classes may be more challenging or
maybe required for the studentsmajor, thus givinghigher necessity and incentive to cheatingbehavior.
Race: Conversations about race inHonorcenter around spotlighting anddimming effectsonvariousgroups. Spot-
lighting occurs when a student becomesmore visible because of theirminority identity, potentiallymaking the student
more likely that the students iswatchedclosely and reported for cheating.Dimmingoccurswhena student is less visible
because their identity is in themajority,making the student less likely tobe reported.
Manyfactorsmaycontributetothedisproportionalitydiscoveredhere.Onepossiblefactorcontributingtotheover-
representationofAsianstudentsrelativetothedemographicsoftheUniversity isthefactthattheUniversitydemographic
categories identify international students as a racial categorywith “Non-Resident Alien.” In our data, Asian international
students are counted as Asian students. If Asian students make up a higher proportion of international students at the
University than domestic students, this could contribute to the disproportionality. Similarly, if Asian international stu-
dents were reported at higher rates than non-Asian international students, this could also contribute to the dispropor-
tionality.
School and programof study could also be play a role. Racial demographics are different across schools of the Uni-
versity and across programs of study, which may contribute to demographic differences in reports as not all depart-
29

ments and schools report at equal rates. Spotlighting anddimmingmay affectwhether students are reported. A theory
of spotlighting would suggest that minority students are over-reported to Honor. A theory of dimming would suggest
non-minority studentsareunder-reported toHonor. Wedidnot findanyevidence thatminority studentswere less likely
to face sanction than non-minority students (see Section Six for more), which suggests that minority students are not
being falsely reported toHonor.
We hoped to be able to analyze racial demographics by reporter type in order to understand whether the existing
disproportionality has a specific source or if it is a general problemacross all reporting sources. The high unknownpro-
portions and small population sizemake it difficult to draw any robust conclusions, but for professors and students, the
two reportersmaking upmost of reports, the population distribution is relatively similar. In future analyses, we hope to
be able to provide amore comprehensive analysis of racial demographics by reporter type in order tomore effectively
direct educational resources andoutreach to addressing any existingdisparity or disproportionality.
In future analyses with a smaller proportion of unknowns, we hope to compute racial disproportionality indices to
compare each category to their population at the University, but at this time, our ability to do so is limited by the large
proportion of unknownswhich could substantially differ from the knowndistribution and alter the relative ratios in sig-
nificantways. That being said,wecanconfidently say that eachpercent displayed is logically aminimumpossible value.
International Status: International students are substantially over-represented in reports relative to their pop-
ulation at the University, and more frequently end in sanction outcomes relative to domestic students. International
students make an Informed Retraction more frequently than domestic students, which may contribute to this dispro-
portionality. Ideally, we would hope to explore how international student status intersects with students race to more
whollyunderstandstudent identity. Wearecurrentlyunable todosobecauseUVAdoesnotpublish racialdemographics
for international students, and instead categorizes all international students together as “Non-ResidentAlien”. A longer
discussion of the effect of international status on the probability of sanction can be found on page 38 in the Statistical
Modeling section.
30

6 THE INFORMEDRETRACTION: ADATA-DRIVENREVIEW
IR P
asse
d
0
20
40
60
2012 2013 2014 2015 2016 2017
Year
Per
cent
of R
epor
ted
Cas
es (
%)
Pre−Hearing Outcome
Accuse
I−Panel Drop
IR
Comparing Standard IR & I−Panel Outcomes by Year (2012−2017)
Data from the Honor Committee Working Group on Assessment & Data Management
Figure 32: Percentof cases ending in IR compared tobeingdroppedat I-Panel or ac-cused at I-Panel, 2012-2017.
For over a century, the only possible sanc-
tion for a guilty student in the Honor pro-
cess was expulsion from the University. In
2013, 64 percent of students voted in favor of
the Informed Retraction, and the Committee
quicklypassedaccompanyingby-lawchanges
tobring thepolicy into effect.
The Informed Retraction now allows stu-
dents a chance to admit responsibility, make
amends, and be re-admitted to the Commu-
nity of Trust after a two-semester leave of ab-
sence. The InformedRetraction had immedi-
ate and significant impacts, and for the past
three years around 40 percent of reported
studentschosetomaketheIR.Someconsider
the InformedRetractiontobeasecondsanction, andtake it tomeantheHonorSystemisno longerasinglesanctionpro-
cess, but instead that the system is only single sanction at hearing.
The IRhas changed the systemsignificantly in a numberofways.
Fewer students are accused at I-Panel: Figure 32 shows the percent of caseswhich end in IR or I-Panel Drop, or
are accused at I-Panel. As theproportionof students taking the IRhas increased, accusations at I-Panel havedecreased.
IR P
asse
d
10
15
20
25
30
2012 2013 2014 2015 2016 2017
Year
Num
ber
of C
ases
Number of Hearings by Year (2012−2017)
Data from the Honor Committee Working Group on Assessment & Data Management
Figure 33: Numberof hearingsper year, 2012-2017.
Fewer hearings per year: Another ef-
fect of the Informed Retraction is seen in the
number of hearings per year (Figure 33). A
studentcanchoose tomakethe InformedRe-
traction during the 7-day period after they
have been given the IR letter after the initial
witness interviewandcannotchoose the IRat
anyother point in theprocess.
Before the IR, 25 to30casesperyearwere
sent to a hearing. In 2016 and 2017, less than
10 cases per year were sent to a hearing. This
is likely because of the number of students
choosing tomake an IR, but is also due in part
toan increasingpercentofcasesdroppedat I-
Panel relativetoadecreasingpercentofcases
where the student is foundnot guilty at a hearing (seeFigure 35on thenext page).
31

Fewer students LAGor are found guilty at hearing: Figure 34 shows thebreakdownof caseoutcomesby year.
After the introductionof the IR, LAGoutcomesandguilty verdicts at hearingsdecreasedandstudents choosing tomake
the IR increasedby around the sameamount.
n = 42 n = 38 n = 56 n = 53 n = 48 n = 39
0%
25%
50%
75%
100%
2012 2013 2014 2015 2016 2017
Year
Per
cent
of R
epor
ted
Cas
es Case Outcome
IR
LAG
Guilty
Administrative Drop
I−Panel Drop
Not Guilty
CMD
Complete Case Outcomes by Year (2012−2017)
Data from the Honor Committee Working Group on Assessment & Data Management
Figure 34: Aggregate caseoutcomesby year, 2012-2017.
Duringdiscussionsabout the InformedRetraction, concernedstudents frequently raise theconcern that the IRmay
be used as a plea bargain, that students who are not guilty may choose to make the IR because they fear expulsion at a
hearing. Because the proportion of sanction outcomes to no sanction outcomes has stayed relatively stable after the
introduction of the IR (Figure 34), it does not appear that students who would have otherwise been found not guilty at
hearingor had their casedroppedare choosing the IRoutof fear of expulsion at a hearing.
10.0%
20.0%
30.0%
2012 2013 2014 2015 2016 2017
Year
Per
cent
of R
epor
ted
Cas
es
outcome
I−Panel Drop
Not Guilty
I−Panel Drops Compared to Not Guilty Verdicts by Year (2012−2017)
Data from the Honor Committee Working Group on Assessment & Data Management
Figure 35: Percent of cases droppedby the Investigative Panel vs. cases inwhich thestudentwas foundnot guilty at hearing, 2012-2017.
More cases are dropped at I-Panel,less students are found not guilty athearing: Figure 35 shows the proportions of
total case outcomes made up by not guilty
verdicts and I-Panel drops. After the IR was
passed in 2013, the proportion of students
foundnot guilty at hearingdecreasedand the
proportion of reported cases being dropped
at I-Panel increased.
32

6.1 KEY FINDINGS&DISCUSSION
• A higher percentage of reported students were sanctioned after the passage of the IR: 2017 was the
first year in the study period inwhichmore students received some type of sanction [found guilty and dismissed,
left admitting guilt (LAG), or took a leaveof absence (IR)] thandidnot.
• Therewere fewer hearings per year after the passage of the IR:The InformedRetraction allows students
theoptionofadmittingguiltandtakingaone-year leaveofabsencefromtheUniversity. Thisoptionmaybeviewed
bystudentsasmorefavorableasopposedtofacingaHearing, resultinginanincreasednumberof IRsandareduced
numberofHearings.
DISCUSSION
Effect of the IR:As the proportion of students taking the IR has increased, accusations at I-Panel have decreased, sug-
gesting thatstudentswithenoughevidence in theircase topass the“more likely thannotstandard”at I-Panelandbesent
to hearing are choosing tomake IRs instead. After the introduction of the IR, LAGoutcomes and guilty verdicts at hear-
ings decreased and students choosing to make the IR increased by around the same amount, suggesting that students
whowouldhavepreviously been foundguilty at a hearingor left admitting guilt are nowchoosing the IR. After the IRwas
passed in 2013, the proportion of students found not guilty at hearing decreased and the proportion of reported cases
being dropped at I-Panel increased. I-Panelsmay bemore likely to drop caseswhichwould previously have been sent to
hearing based on a more cautious interpretation of the “more likely than not standard” potentially caused by a signifi-
cantdrop in thenumberofhearingsandaheightenedperception thathearingsweremoreserious than inpreviousyears
whenmost caseswere sent to ahearing.
33

7 STATISTICALMODELING: RECENTSANCTIONING
The authors would like to stress that these findings are not predictive of the probability of outcomes for any individual
student going through theHonor case process. Each case isweighed independently basedon the evidence in each indi-
vidual case and reported students shouldnotdependon theseprobabilities inweighingdecisions about their owncase.
7.1 METHODS
SanctionOutcomes: Inorder toassesswhethera reportedstudent’s race, gender, international status,or studentath-
lete status, year, or the type of reporter had a differential impact onwhether a student received a sanction, we ran a lo-
gistic regressionmodel using theglm command fromthestatspackage inR. Sevencaseswere removed fromthedata
set for thestatisticalmodelingbecausetheycontainedsignificantunknownsacrossmultiplevariables. Noneof thecases
removed had students who faced a sanction outcome. Guilty verdict at hearing, student leaving admitting guilty (LAG),
and Informed Retraction (IR) were considered sanction outcomes. Not Guilty verdict at hearing, I-Panel Drop, and Ad-
ministrativeDropwere considered tobeno sanctionoutcomes. Thedependent variable in this casewaswhetheror not
a student received sanction, and the independent variables were race, gender, athlete status, international status, stu-
dent year at the timeof report, and reporter type. P-values less than0.05were considered statistically significant.
Log-Likelihood Function:
ℓ(α, β1, β2, β3, β4, β5, β6) =N∑i=1
−yi(1−yi)− ln(1 + eyi∗) (1)
LinearModel:yi∗ = α+ β1x1 + β2x2 + β3x3 + β4x4 + β5x5 + β6x6 (2)
yi∗ =SanctionOutcome
x1 =Race
x2 =Gender
x3 = International Status
x4 =Athlete Status
x5 =StudentYear
x6 =ReportedType
7.2 RESULTS
Table 2 gives the results of the logit model of sanction outcomes. This model gives the effect of each factor relative to
reports, not relative to the demographics of theUniversity. Results are reported as averagemarginal effects, ameasure
of difference inpredictedprobability.
34

Table 2: AverageMarginal Effect fromLogitModel of SanctionOutcomes
Factor AverageMarginal Effect StandardError z p lower upper
International Student (vs. Domestic) 0.18 0.08 2.35 0.02* 0.03 0.34
TA (vs. Faculty) -0.07 0.10 -0.72 0.47 -0.26 0.12
Administrator (vs. Faculty) 0.02 0.21 0.11 0.91 -0.39 0.44
ReporterUnknown/Other (vs. Faculty) -0.43 0.08 -5.22 0.00 -0.60 -0.27
SecondYear (vs. First Year) 0.06 0.11 0.60 0.55 -0.14 0.27
ThirdYear (vs. First Year) 0.15 0.10 1.61 0.11 -0.03 0.34
FourthYear (vs. First Year) 0.27 0.11 2.42 0.02* 0.05 0.48
GraduateStudent (vs. First Year) 0.37 0.12 3.16 0.00* 0.14 0.60
YearUnknown (vs. First Year) 0.12 0.16 0.74 0.46 -0.20 0.44
African-American (vs. Caucasian) 0.04 0.11 0.40 0.69 -0.17 0.25
Asian (vs. Caucasian) 0.05 0.08 0.61 0.54 -0.11 0.20
Hispanic (vs. Caucasian) -0.04 0.16 -0.26 0.79 -0.35 0.27
OtherRace (vs. Caucasian) -0.34 0.11 -3.05 0.00* -0.56 -0.12
RaceUnknown (vs. Caucasian) -0.03 0.09 -0.34 0.74 -0.21 0.15
StudentReporter (vs. Faculty) -0.41 0.06 -6.65 0.00* -0.53 -0.29
StudentAthlete (vs. Not) 0.02 0.10 0.18 0.86 -0.18 0.22
Male (vs. Female) -0.01 0.06 -0.12 0.91 -0.12 0.11
UnknownGender (vs. Female) -0.10 0.16 -0.65 0.51 -0.41 0.21
Note: ∗p<0.05
35

0.3
0.4
0.5
0.6
0.7
Domestic Student International Student
International Status
Pro
babi
lity
of F
acin
g S
anct
ion
Probability of Facing Sanction by International Status (2012−2017)
Note: error bars are 95% credible intervals generated through 1000 draws of new coefficients from the posterior.
Figure 36: Predictedprobability of a reported student facing sanctionby international status, 2012-2017
International students more likely to face sanction: On average, international students were 18 percentage
pointsmore likely to face some sort of sanction outcome than domestic students, after controlling for gender, student
year, race, athlete status, and reporter type (p<0.01). Figure 36 gives the predicted probabilities of facing sanction by in-
ternational status,with error bars representing a95%credible interval.
0.00
0.25
0.50
0.75
Administrator Professor Student TA Unknown/Other
Reporter Type
Pro
babi
lity
of F
acin
g S
anct
ion
Probability of Facing Sanction by Reporter Type (2012−2017)
Note: error bars are 95% credible intervals generated through 1000 draws of new coefficients from the posterior.
Figure 37: Predictedprobability of a reported student facing sanctionby reporter type, 2012-2017
Students reported by studentsmuch less likely to face sanction: Studentswhowere reportedbyother stu-
dents, as compared tostudentswhowere reportedby facultymembers,wereonaverage41percentagepoints less likely
tofaceasanctionoutcomeaftercontrollingforgender, race,athletestatus, internationalstatus,andstudentyear(p<0.01).
36
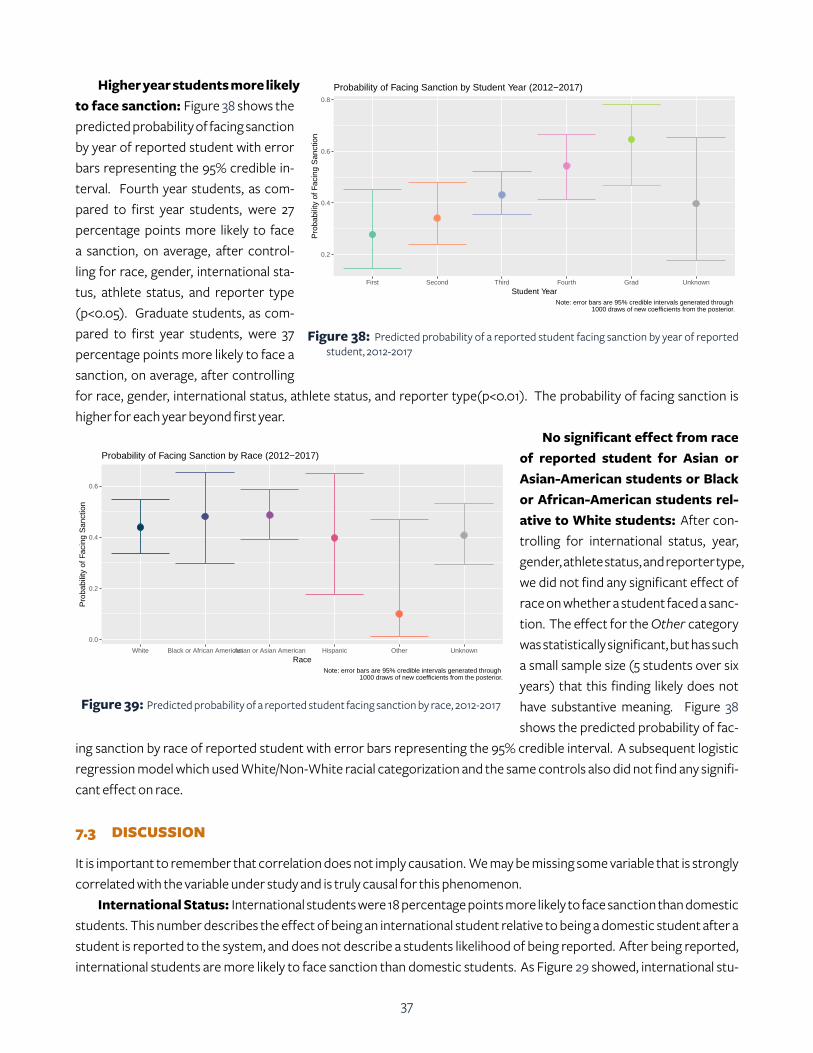
0.2
0.4
0.6
0.8
First Second Third Fourth Grad Unknown
Student Year
Pro
babi
lity
of F
acin
g S
anct
ion
Probability of Facing Sanction by Student Year (2012−2017)
Note: error bars are 95% credible intervals generated through 1000 draws of new coefficients from the posterior.
Figure 38: Predicted probability of a reported student facing sanction by year of reportedstudent, 2012-2017
Higheryearstudentsmorelikelyto face sanction: Figure 38 shows the
predictedprobabilityof facingsanction
by year of reported student with error
bars representing the 95% credible in-
terval. Fourth year students, as com-
pared to first year students, were 27
percentage points more likely to face
a sanction, on average, after control-
ling for race, gender, international sta-
tus, athlete status, and reporter type
(p<0.05). Graduate students, as com-
pared to first year students, were 37
percentage points more likely to face a
sanction, on average, after controlling
for race, gender, international status, athlete status, and reporter type(p<0.01). The probability of facing sanction is
higher for each year beyond first year.
0.0
0.2
0.4
0.6
White Black or African AmericanAsian or Asian American Hispanic Other Unknown
Race
Pro
babi
lity
of F
acin
g S
anct
ion
Probability of Facing Sanction by Race (2012−2017)
Note: error bars are 95% credible intervals generated through 1000 draws of new coefficients from the posterior.
Figure 39: Predictedprobability of a reported student facing sanctionby race, 2012-2017
No significant effect from raceof reported student for Asian orAsian-American students or Blackor African-American students rel-ative to White students: After con-
trolling for international status, year,
gender,athletestatus,andreportertype,
we did not find any significant effect of
raceonwhethera student facedasanc-
tion. The effect for theOther category
wasstatisticallysignificant,buthassuch
a small sample size (5 students over six
years) that this finding likely does not
have substantive meaning. Figure 38
shows the predicted probability of fac-
ing sanction by race of reported student with error bars representing the 95% credible interval. A subsequent logistic
regressionmodelwhich usedWhite/Non-White racial categorization and the samecontrols also did not find any signifi-
cant effect on race.
7.3 DISCUSSION
It is important to remember that correlationdoesnot imply causation. Wemaybemissing somevariable that is strongly
correlatedwith the variable under study and is truly causal for this phenomenon.
International Status: International studentswere18percentagepointsmore likely to facesanctionthandomestic
students. This numberdescribes the effect of being an international student relative tobeing adomestic student after a
student is reported to the system, and does not describe a students likelihood of being reported. After being reported,
international students aremore likely to face sanction than domestic students. As Figure 29 showed, international stu-
37

dentsmake the IRmore frequently thandomestic students. As the IR is considered tobe a sanction, thismay contribute
to thedisparity.
This effect could have any number of causes. Possibilities include the effect of the IR, understanding of the System
and of the offense, or bias in the student hearing panel. The true cause of this effect is unknown, but this finding should
begivenconsiderablediscussionandconsiderationby theHonorCommitteeandSupportOfficerPool inorder to serve
all students equally andunderstand thepotential for differential impact of the systembasedon student identity and cir-
cumstances.
Student Reporters: Students reported by other studentswere substantially less likely to face sanction by (41 per-
centage points). This is likely due to a difference in the type of evidence provided by student reporters, as compared to
faculty. Facultyreportersoradministratorreportersare likelytohavephysicalevidence(theassignmentorexaminques-
tion, Collab log-ins, etc.) to substantiate the report, where student reporters aremore likely to have seen or overheard
the commissionof anHonoroffensebut are less likely tohavephysical evidence.
This could also be indicative of the hearing panel’s level of confidence in the testimony of the reporter. Students
may be more likely to believe and rely on the testimony of a professor or administrator relative to a student. This the-
ory seems lessplausiblewhenconsidering thepredictedprobabilityof sanctionwhenthereporter is a teachingassistant
(TA). Teaching assistants are students, and inmanydepartments areundergraduate students, yet cases reportedbyTAs
are almost as likely to end in sanction as cases reported by professors. Therefore, if the reporter’s status as a student
has an effect, it is likely not due to their age or student status but rather their role relative to the reported student. TAs
haveacademicauthority inacourse,whereastudentdoesnot, andthismaygivethemmorecredibilitywithinHonorpro-
ceedings. Ultimately, the source of the effect cannot be determined, but should be a point of continued discussion and
consideration.
Student Year: Higher year students and graduate studentsweremore likely to face a sanction than lower year stu-
dents. This is an interesting and previously unexpected effect. As shown in Figure 21, higher year studentsmake the In-
formed Retraction more frequently, which may contribute to this effect. As the IR is voluntary, this means higher year
year students andgraduate students aremore likely toownup to andmake amends for the reportedoffense.
Figure21 also shows thathigher year studentare foundnotguilty athearing less frequently than loweryear students.
The three criteria of anHonoroffense areAct, Knowledge, andSignificance. KnowledgeandSignificancemayplay a role
in this student year effect. Student hearing panels may believe that first year students are less likely to be aware that a
givenActwas cheatingor that suchanActwouldbeconsidered significantwithin theUniversity community. In contrast,
panelsmaybelieve that higher year students andgraduate students should reasonably knowwhat constitutes appropri-
ate conduct. Higher year students may also be more likely to have an Act considered significant because of the impor-
tance of a class to a undergraduatemajor or the higher stakes in cases of work being potentially published for graduate
students.
Race: Theonly significant effecton racewas for studentsofOther raceas compared towhite students. This finding
likely does not have substantive significance because the number of students in theOther category was so small (5 stu-
dents ina six yearperiod). Therewerenoother statistically significanteffects fromtheraceof the reportedstudent. The
raceof a reported studentdidnothavean significant effectonwhether the reported student faceda sanctionordidnot
face a sanction. This finding is limited toonce a student is reported anddoes not speak towhether students of different
racial identities aremoreor less likely to be reported toHonorwhen they are suspectedof cheating. Thismodel specifi-
callyasks,whenweholdeverythingelseconstant: gender,athletestatus, year, reportertype, is thereanysignificanteffect
of raceon likelihoodof facing sanction after being reported? Our analysis suggests there is not.
StudentAthleteStatus:Wedidnot findanysignificanteffect for studentathletestatus,meaningstudentathletes
werenot significantlymoreor less likely to face sanction relative tonon-athlete students.
38

8 CONCLUSIONSANDFUTUREDIRECTIONS
8.1 CONCLUSIONS
Webelieve this report has uncovered a number of interesting and relevant findings which will informHonor policy and
community dialogue in the future.
The InformedRetractionwasaverysignificantchangetothesystemandhadsubstantial impactsoncaseprocessing.
Some students, faculty, and alumni were concerned that the IRwas a sign that the systemwas “going easy” on reported
students,butthedatashowsthatmorestudents facedsanctionafterthe IRwaspassed. FewerstudentsLAGorarefound
guilty at a hearing, andmore studentsmake amends andcomplete a two semester leave.
Theeffectof student yearon likelihoodof sanctionwasunexpectedandpreviously unknown, aswas the finding that
third years make up the largest proportion of reports. Student year clearly has an important role in how students con-
sider the implicationsofHonorandmore thought andconsideration shouldbegiven tohowtoaddress this andwhy this
occurs.
Our ability to draw robust andmeaningful conclusions about racewas limited by the data availablewhich had a sub-
stantial amount of unknowns. More of the unknowns came from international students for whom race was not identi-
fied. We hope collection of self-identified demographic datawill enablemore robust analyses in the future and a better
understandingof identitywithinthesystem. Thatbeingsaid, thedatawedohaveshowedAsianstudentand international
studentover-representation,which shouldbe consideredby theCommittee andby the community.
8.2 FUTUREDIRECTIONS
In future analyses, we hope to provide amore robust analysis of racial demographics oncewe have a large enough pop-
ulation of self-identified demographic data. We also hope to better describe reporting statistics by department (where
the reporter is aprofessor) inorder tounderstand thedistributionof reports across theUniversity andbetterdirect ed-
ucation and outreach resources to students and faculty. We also hope to showmore recent reporting statistics by type
of Act, with categorizations of cheating acts provided in order to understandwhat students are being reported for and
howreport type affects casepaths andoutcomes.
39
AUTHORSANDACKNOWLEDGMENTS
AUTHOR
CharlotteMcClintock, CLAS III
CONTRIBUTORS
AndrewMcCartney, CURRY
Caitlin Knowles, COMMIV
AdamHuckaby,GSAS
LucianMirra, SCPS
MariahTighe, SEAS II
AlexanderMaksiaev, CLAS I
ACKNOWLEDGEMENTS
The authors would like to thank all of the individuals who contributed to the work that made this report possible. The
authorswould like toexpressdeepestgratitude toHonorCommitteeChairOryStreeter for standingbehind thisproject
throughevery stepof thisprocessand for supporting the releaseofdemographicdata,ViceChair for InvestigationsPey-
tonSandroni for retrieving andcompilingdata, andProfessor JonKropko forproviding invaluablemethodological guid-
ance. The authorswould also like to thank all of theHonor support officerswho helped pull information fromcase files
andenter forms, andMs. MaryWhite for her tirelesswork in retrieving vital demographic information.
CONTACT
Pleasedirect all questions to theHonorAssessment andDataManagementWorkingGroup, [email protected].
40


