35
Hope Bay Project – September 2016 Building Canada’s Next Gold Mining District

Hope Bay Project – September 2016Building Canada’s Next Gold Mining District
This document contains “forward-looking information” within the meaning of applicable Canadian securities laws. Forward-looking information includes statements that use forward-looking terminology such as
“may”, “could”, “would”, “will”, “intend”, “plan”, “expect”, “budget”, “estimate”, “forecast”, “schedule”, “anticipate”, “bel ieve”, “continue”, “potential” or the negative or grammatical variation thereof or
other variations thereof or comparable terminology. Such forward-looking information includes, without limitation, statements with respect to Mineral Reserve and Mineral Resource estimates; targeting
additional Mineral Resources and expansion of deposits; the capital and operating cost estimates and the economic analyses (including cashflow projections) from the Hope Bay Technical Report; the
Company’s expectations, strategies and plans for the Hope Bay Project, including the Company’s planned exploration and development activities; the results of future exploration and drilling and estimated
completion dates for certain milestones; successfully adding or upgrading resources and successfully developing new deposits; the costs and timing of future exploration and development, including the timing
for completion and commissioning of the Gekko Plant; commencement of production at Doris in December 2016, at Madrid in 2020 and at Boston in 2022; that the Company will "bootstrap" the development of
Madrid and Boston; the timing and amount of future production at Doris, Madrid and Boston and the capacity of the Gekko Plant to process production; the timing, receipt and maintenance of approvals,
licences and permits from the federal government, from the Kitikmeot Inuit Association (“KIA”) and Nunavut Tunngavik Inc. (“NTI”) and from any other applicable government or regulator; future financial or
operating performance and condition of the Company and its business, operations and properties; the intended use of the net proceeds of the initial prospectus offering (“IPO”) and the Debt Facility (as more
fully described in the IPO Prospectus dated June 26, 2015); the adequacy of funds from the IPO and the Debt Facility to support completion of initial development of Doris and commence commercial
production; and any other statement that may predict, forecast, indicate or imply future plans, intentions, levels of activity, results, performance or achievements.
Forward-looking information is not a guarantee of future performance and is based upon a number of estimates and assumptions of management, in light of management’s experience and perception of
trends, current conditions and expected developments, as well as other factors that management believes to be relevant and reasonable in the circumstances, as of the date of this document including,
without limitation, assumptions about: favourable equity and debt capital markets; the ability to raise any necessary additional capital on reasonable terms to advance the development of the Hope Bay
Project and pursue planned exploration; future prices of gold and other metal prices; the timing and results of exploration and drilling programs; the accuracy of any Mineral Reserve and Mineral Resource
estimates; the geology of the Hope Bay Project being as described in the Hope Bay Technical Report; the metallurgical characteristics of the deposit being suitable for the Gekko Plant; the successful operation
of the Gekko Plant; production costs; the accuracy of budgeted exploration and development costs and expenditures, including to complete development of the infrastructure at the Hope Bay Project; the
price of other commodities such as fuel; future currency exchange rates and interest rates; operating conditions being favourable, including whereby the Company is able to operate in a safe, efficient and
effective manner; political and regulatory stability; the receipt of governmental and third party approvals, licences and permits on favourable terms; obtaining required renewals for existing approvals, licences
and permits and obtaining all other required approvals, licences and permits on favourable terms; sustained labour stability; stability in financial and capital goods markets; availability of equipment; positive
relations with the KIA and NTI and other local groups and the Company’s ability to meet its obligations under its property agreements with such groups; the Company’s ability to operate in the harsh northern
Canadian climate; and satisfying the terms and conditions of the Debt Facility. While the Company considers these assumptions to be reasonable, the assumptions are inherently subject to significant business,
social, economic, political, regulatory, competitive and other risks and uncertainties, contingencies and other factors that could cause actual actions, events, conditions, results, performance or achievements
to be materially different from those projected in the forward-looking information. Many assumptions are based on factors and events that are not within the control of the Company and there is no assurance
they will prove to be correct.
Furthermore, such forward-looking information involves a variety of known and unknown risks, uncertainties and other factors which may cause the actual plans, intentions, activities, results, performance or
achievements of the Company to be materially different from any future plans, intentions, activities, results, performance or achievements expressed or implied by such forward-looking information. Such risks
include, without limitation: general business, social, economic, political, regulatory and competitive uncertainties; differences in size, grade, continuity, geometry or location of mineralization from that predicted
by geological modelling and the subjective and interpretative nature of the geological modelling process; the speculative nature of mineral exploration and development, including the risk of diminishing
quantities or grades of mineralization and the inherent riskiness of Inferred Mineral Resources; a material decline in the price of gold; a failure to achieve commercial viability, despite an acceptable gold price,
or the presence of cost overruns which render the project uneconomic; geological, hydrological and climactic events which may adversely affect infrastructure, operations and development plans, and the
inability to effectively mitigate or predict with certainty the occurrence of such events; credit and liquidity risks associated with the Company’s financing activities, including constraints on the Company’s ability
to raise and expend funds as a result of operational and reporting covenants associated with the Debt Facility and the risk that the Company will be unable to service its indebtedness; delays in construction or
development of the Hope Bay Project resulting from delays in the performance of the obligations of the Company’s contractors and consultants, the receipt of governmental approvals and permits in a timely
manner or to complete and successfully operate mining and processing components; the Company’s failure to accurately model and budget future capital and operating costs associated with the
development and operation of the Hope Bay Project; difficulties with transportation and logistics relating to the delivery of essential equipment and supplies to the Hope Bay Project, including by way of airlift
and sealift, and the logistical challenges presented by the Hope Bay Project’s location in a remote Arctic environment; the failure to develop or supply adequate infrastructure to sustain the operation and
development of the Hope Bay Project, including the provision of reliable sources of electrical power, water, and transportation; adverse fluctuations in the market prices and availability of commodities and
equipment affecting the Company’s business and operations; the unavailability of specialized expertise in respect of operating in a remote, environmentally extreme and ecologically sensitive area in the
Kitikmeot region of Nunavut; the Company’s management being unable to successfully apply their skills and experience and attract and retain highly skilled personnel; the cyclical nature of the mining industry
and increasing prices and competition for resources and personnel during mining cycle peaks; the Company’s failure to maintain good working relationships with Inuit organizations; the Company’s failure to
comply with laws and regulations or other regulatory requirements; the Company’s failure to comply with existing approvals, l icences and permits, and Inuit agreements; the Company’s inability to renew
existing approvals, licences, permits and Inuit agreements or to obtain required new approvals, licences, permits and Inuit agreements on timelines required to support development plans; the Company’s
failure to comply with environmental regulations, the tendency of such regulations to become more strict over time, and the costs associated with maintaining and monitoring compliance with such regulations;
the adverse influence of third party stakeholders, including social and environmental non-governmental organizations; the adverse impact of competitive conditions in mineral exploration and the mining
business; the Company’s failure to maintain satisfactory labour relations and the risk of labour disruptions or changes in legislation relating to labour; the Company’s lack of operating history and no history of
earnings; the limits of insurance coverage and uninsurable risks; the adverse effect of currency fluctuations on the Company’s financial performance; difficulties associated with enforcing judgements against
directors residing outside of Canada; conflicts of interest; the significant control exercised by RCF and Newmont over the Company; the dilutive effect of future acquisitions or financing activities and the failure
of future acquisitions to deliver the benefits anticipated; the failure of the Company’s information technology systems or the security measures protecting such systems; the costs associated with legal
proceedings should the Company become the subject of litigation or regulatory proceedings; and costs associated with complying with public company regulatory reporting requirements.
Caution Regarding Forward-Looking
Information
2

Three Bluffs
Meadowbank
Meliadine
Cambridge Bay
Nunavut
Back River
Courageous Lake
Mary River
Izok Lake Lupin
Ulu
NWTYellowknife
Hope Bay
Exploration/Development
Operating Mine
Ekati Diavik
Snap Lake
Toronto
Hope Bay
Canada
U.S.
Hope Bay Location
MADRID
20 km
DORIS
Boston
80 km
3
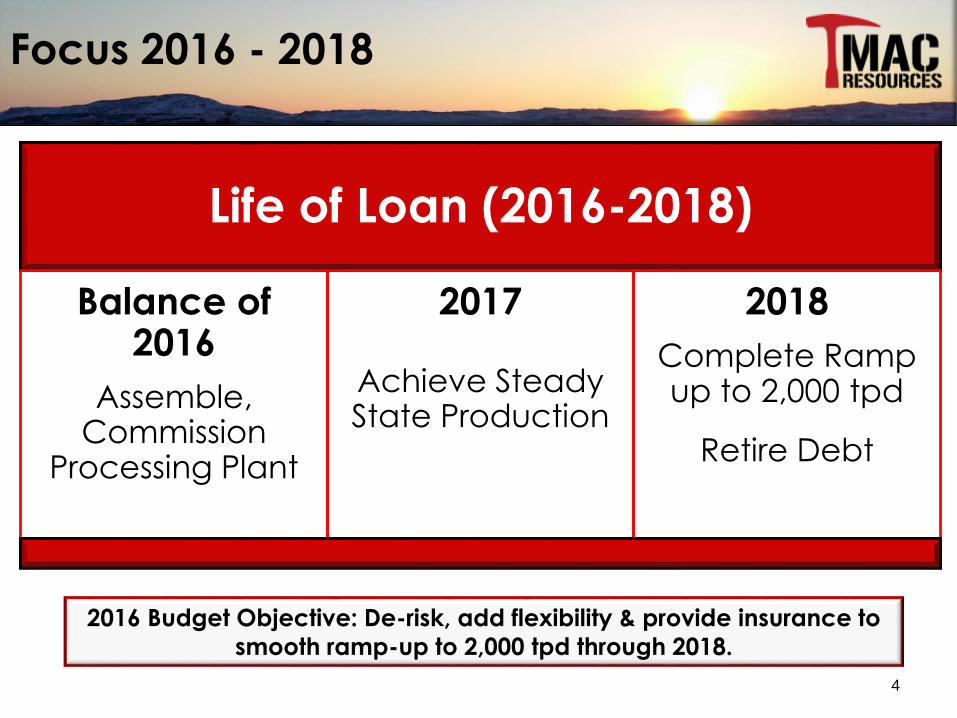
Focus 2016 - 2018
Life of Loan (2016-2018)
Balance of 2016
Assemble, Commission
Processing Plant
2017
Achieve Steady State Production
2018
Complete Ramp up to 2,000 tpd
Retire Debt
2016 Budget Objective: De-risk, add flexibility & provide insurance to
smooth ramp-up to 2,000 tpd through 2018.
4

Mine Operations Objectives - 2016
Objective As of June 30, 2016
Optimize Mine Design
5.6 km Pre-Production
Development
2.7 km
111,000 t Ore Stockpile @
15 g/t Gold
56,900 t Ore Stockpile @
13.9 g/t Gold
55,600 Gold Ounces in
Stockpile
25,400 Gold Ounces in
Stockpile
Develop Underground
Drill Bays
5

Doris North Mine Plan - 2016
6
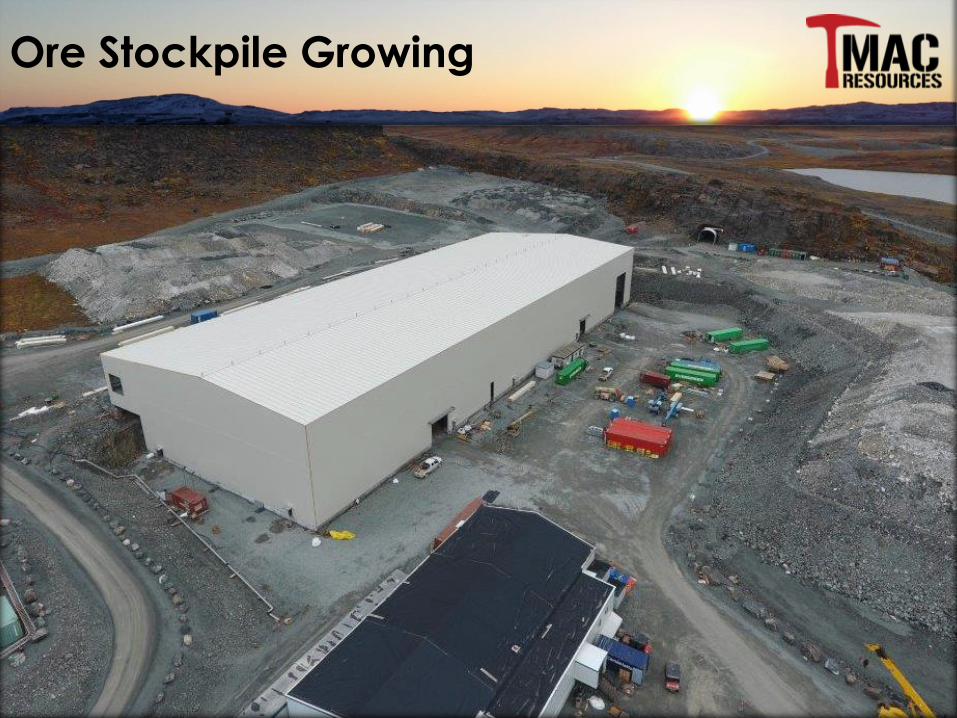
Ore Stockpile Growing
7

Processing Objectives - 2016
Processing Plant
Fabricate Components
Ship Components
Assemble Started
Commission Initiate Dec. 2016
Related Infrastructure
Construct Building
Tailings & Reclaim Systems On Going
Assay Lab Started
Water Systems
8

Process Plant: What It Will Look Like
Inside the Building
Ore Feed
9

Offload of Process Plant Components
10

Process Plant Components at Site
11

Process Plant Building
12
Process Plant
Building
Ore Pad
Portal
Commissioning
Ore
Waste
Pad

Concrete Slab
Process Plant Building
20 ton Crane
13

Placing Process Plant Components
14

Exploration/Geoscience
Doris North BTD Extension
TM50025 Visible Gold
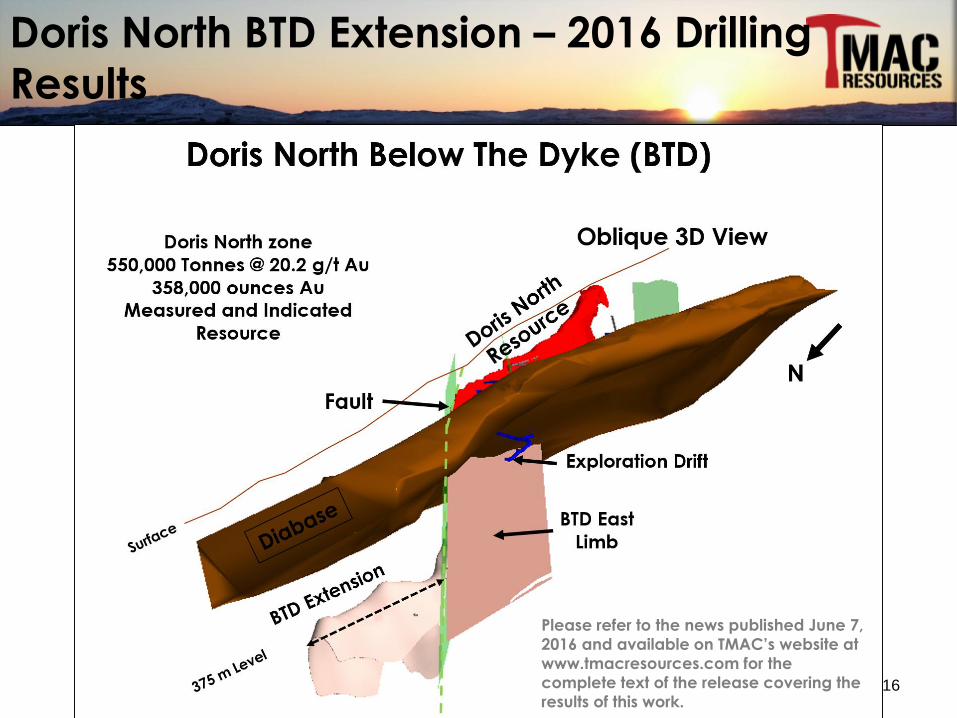
Doris North BTD Extension – 2016 Drilling
Results
Please refer to the news published June 7,
2016 and available on TMAC’s website at
www.tmacresources.com for the
complete text of the release covering the
results of this work. 16

Doris North BTD East Limb – TM500010
TM500010:
5.32 m (3.15 m true width) @ 57.04 g/t (50.64 g/t cut)
Including 2.42 m (1.43 m true width) @ 118.55 g/t (104.48 g/t cut)
NQ
Co
re
17

Doris North BTD Extension & East Limb Zones 2016 - 2017
Development Costs ($ millions)
Exploration & development 30.5
Equipment & site infrastructure costs
related to exploration & development14.5
General working capital, including diesel
fuel11.5
Total 56.5
Doris BTD 2016 Drill Results Prompt
Further Development
18

Doris North BTD 2016 Drill Results Prompt
Further Development
Please refer to the news published September 14, 2016 and available from TMAC’s website at www.tmacresources.com for the complete text of the release covering the results of this work.
19

Hope Bay 2015-2016 Expenditures
Hope Bay Project Path to
Production
Incurred to
June 30,
2016
Development Costs ($ million) ($ millions)
Direct 145 110
Indirect 20 13
Capitalized pre-production operating costs 54 33
Hope Bay Project development sub-total 219 156
Collateral for letters of credit 26 19
Corporate, exploration, permitting and
general expenditures related to the Hope Bay Project
89(1) 74
Total 334(2) 249
1 Includes $9 million from the Flow-Through Financing completed March 18, 2016.
2 Comprises $325 million of Path to Production and $9 million from the Flow-Through Financing. 20

• Execute on construction schedule & achieve
steady state production as quickly as possible
• Act on opportunities
• Optimize life of loan business performance
• Attract & retain talent
• Doris mine life extension
• Positive NAV driver
2016 Keys to Success
21

Appendix
22

Share Capital Structure & Major
Shareholders
Major Shareholders
Number of
Shares
Percentage
of Shares
Outstanding
Resource Capital Fund VI L.P. 25,649,274 30.9
Newmont Mining Corporation 24,201,978 29.2
Blackrock, Inc 8,666,847 10.4
Directors and Officers 4,630,901 5.6
Kitikmeot Inuit Association 1,133,333 1.4
As at August 31, 2016
Common Shares (Issued and Outstanding) 82,984,260
Share Incentive Options 3,709,989
Warrants – C$7.50 – five year 1,383,834
Restricted Shares 111,809
Fully Diluted Shares 88,189,892
23

Long Term Inuit Land and Benefit
Agreements Complete
• 20 year, belt-wide agreements:
• Surface Rights (Kitikmeot Inuit Association – KIA)
• Framework Agreement
• Inuit Impact Benefits Agreement (IIBA)
• Subsurface Rights (Nunavut Tunngavik Inc. – NTI)
• Mineral Exploration Agreement (MEA)
• Form of Production Lease (PL) 24
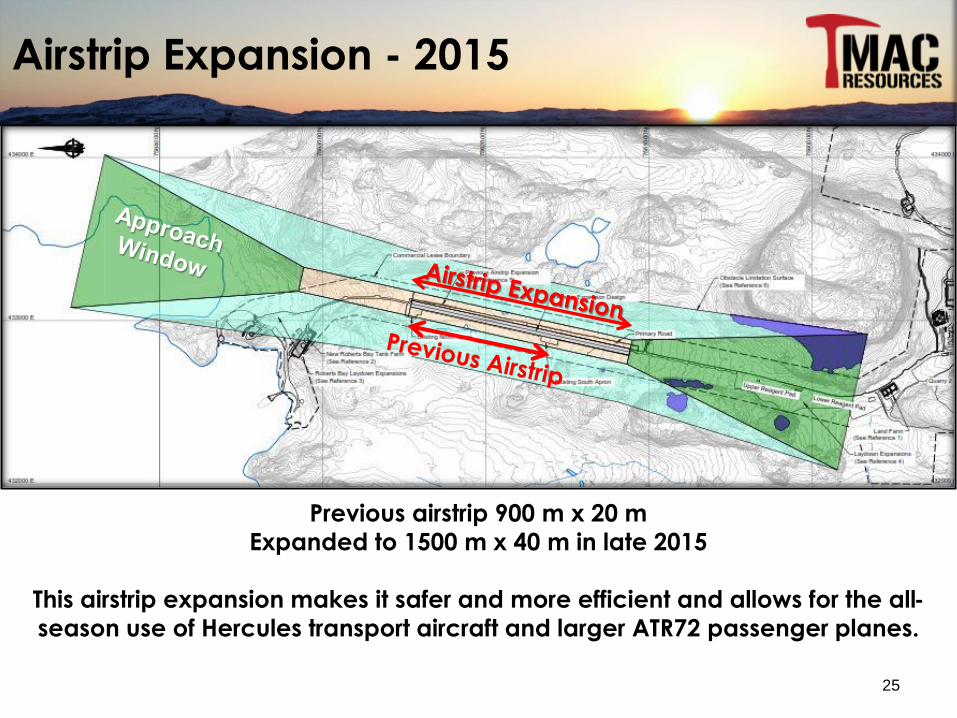
Airstrip Expansion - 2015
Previous airstrip 900 m x 20 m
Expanded to 1500 m x 40 m in late 2015
This airstrip expansion makes it safer and more efficient and allows for the all-
season use of Hercules transport aircraft and larger ATR72 passenger planes.
25

Sealift Routes
26
Zelada
BBC Elbe
Barge
Nordisle

Overview of Management &
Board of Directors
Terry MacGibbonDirector & Executive Chairman
Professional geologist with over 45 years of experience in the mining business, and as founder, Chairman, and CEO Terry and his team built FNX Mining from a junior company into a mid-tier, multi-billion dollar, diversified Canadian mining company which ultimately merged with Quadra Mining to form Quadra FNX in May 2010. Terry then acted as Chairman of Quadra FNX until its sale to KGHM Polska Miedź SA in 2012 for a transaction value of $3.5 billion. Prior to founding FNX Mining, Terry spent 30 years with Inco culminating with him being responsible for directing Inco's North American and worldwide exploration activities. Currently a director of Torex Gold Resources, INV Metals, and Malbex Resources.
Catharine FarrowDirector & Chief Executive Officer
Professional geoscientist with more than 20 years of mining industry experience, having acted in several senior roles with KGHM, QUX, and FNX between 2003 and 2013, most recently as COO of KGHM International Ltd. She is a member of the Board of Directors of Franco Nevada. Ms. Farrow is also an Adjunct Professor at Laurentian University and a member of several professional organizations.
Gordon MorrisonPresident & Chief Technology Officer
Has 44 years of experience in the mining industry. Mr. Morrison has built and led teams responsible for the discovery of 13 major polymetallic and precious metal deposits, six of which are producing mines, and four at the feasibility stage. Mr. Morrison is an acknowledged expert in the geology and exploration of the Sudbury Complex, as well as having worldwide experience in the exploration for copper, nickel and precious metals. Mr. Morrison was previously Chief Technology Officer of KGHM, held multiple executive roles with QUX and played an integral part in building FNX.
Leona AglukkaqDirector
Previously served as a Federal Cabinet Minister 2008 to 2015
Former international diplomat (Chair of the Arctic Council)
Andrew AdamsDirector, Independent
Currently director of Torex Gold and First Quantum
Previously CFO of Aber Diamond Corporation (now DominionDiamonds)
João CarrêloDirector, RCF Nominee, Independent
Previously Director and CEO of Eco Oro Minerals and EVP and COO of
Lundin Mining
Russ CranswickDirector, RCF Appointee
Senior partner, member of RCFInvestment Committee
Chairman of private company Coastal Ventures
Frank DavisDirector, Independent
Counsel with Bennett Jones LLP
Currently a director of Torex Goldamongst others
Randy EngelDirector, Newmont Appointee
Executive VP, Strategic Development of Newmont
David FaleyDirector, Newmont Appointee
Previously VP, Corporate Development of Newmont
John LydallLead Director, Independent
Previously served as a director of FNX Mining, Quadra FNX, BaffinlandIron Mines and Dundee Precious
Metals
Ronald GagelExecutive Vice President & Chief Financial Officer
Ron Gagel is a chartered professional accountant with more than 32 years of professional experience, the last 27 of which have been in the mining sector. In January 2013, he became the EVP and CFO of TMAC Resources. Mr. Gagel is a director of Adriana Resources, Dalradian and Stonegate Agricom. He has also been a director of other public companies including HudBay, Central Sun Mining and FNX. Mr. Gagel received his C.A. designation in 1981 with Coopers & Lybrand and holds a Bachelor of Commerce, (Hons.) Business Administration from the University of Windsor and a Bachelor of Science, (Hons.) Zoology from the University of Western Ontario.
27

Mine Life 20 Years
Tonnes Ore Mined / Processed 14.3 million
Average Grade (LOM) 7.6 g/t Au
Average Grade (First 5 Years) 9.4 g/t Au
Average Annual Gold Production (LOM) 160,000 oz
Average Annual Gold Production (First 5 Years) 183,000 oz
Total Recovered Gold 3.2 million oz
AISC (LOM) (1) US$785/oz
AISC (First 5 Years) (1) US$757/oz
After-Tax Payback Period 1.7 Years
Pre-Tax NPV5% C$848 million
Pre-Tax IRR 44%
After-Tax NPV5% C$626 million
After-Tax IRR 40%
Hope Bay 2015 PFS Summary(US$1,250/oz Gold)
Source: Hope Bay 2015 Pre-Feasibility Study1 All-in sustaining cost figures above include pre-production development capital for Boston and Madrid. Excluding the development capital would result in AISC of US$747/oz over life-of-mine and AISC of
US$625/oz over the first 5 years. US$ figures are based on an exchange rate of C$1.1765 = US$1.00. Per ounce figures based on 3.2 million ounces gold produced over the life-of-mine.28

Principal
AmountUS$120 million No gold hedging required
Interest Rate 8.75% per annumCompounded and payable quarterly. Until June 30,
2017 may pay cash or increase principal
Drawdowns Until December 31, 2016
Draws US$20 million minimum
First US$50M drawn February 10, 2016, Second US$35M drawn July 7, 2016. Certain conditions precedent waived for second draw. Balance of US$35M remains available.
Monthly
payments
1/22 of outstanding
at June 30, 2017
Beginning July 31, 2017
Ending Nov 30, 2018
Maturity Date Dec 31, 2018 Bullet payment
Lenders received
Fees Upfront fee - 1%No standby fee – 1% of US$120 million &1% of outstanding balance on 1st and 2nd anniversary of last drawdown
Warrants 1,900,000C$7.50 per share – five year to July 23, 2020
Acceleration if shares > C$15 for 20 trading days after July 23, 2016
Gold Calls 12,000US$1,140/oz, five years to July 23, 2020 - May satisfy gold calls exercised before Jun 30, 2017 in cash or by increase in principal
Debt Facility Summary
29

Who What How Calculated
Nunavut
Tunngavik Inc.NPI
• On Inuit-Owned Land (Doris and Madrid)
• 12% of production (limit deductions to 75% of
revenue (85% at Doris))
• Deductions never lost and are carried
forward.
Government of
CanadaNPI
• On Crown Land (Boston & Elu)
• Sum of graduated royalty rates from 0% to
14% of value of the output of the mine
• Maximum – 13% of the overall value of output
Kitikmeot Inuit
AssociationNSR • 1% on Hope Bay. Not Elu.
Newmont
Mining
Corporation
NSR • 1% on Hope Bay and Elu.
Royalties
30

Who What
Kitikmeot Inuit
Association
Commercial Lease Payment
($1.0 million per year + CPI)
Nunavut
Tunngavik Inc.
Production & Exploration Lease Payments
Start 2017
One time $8 million bonus payment (payable over eight
quarters, starting quarter after commercial production,
estimated to start in Q2 2017)
Indigenous and
Northern Affairs
Canada
Claim & Lease Payments
Property Taxes
(Relates to amount of infrastructure at Hope Bay)
Obligations
31
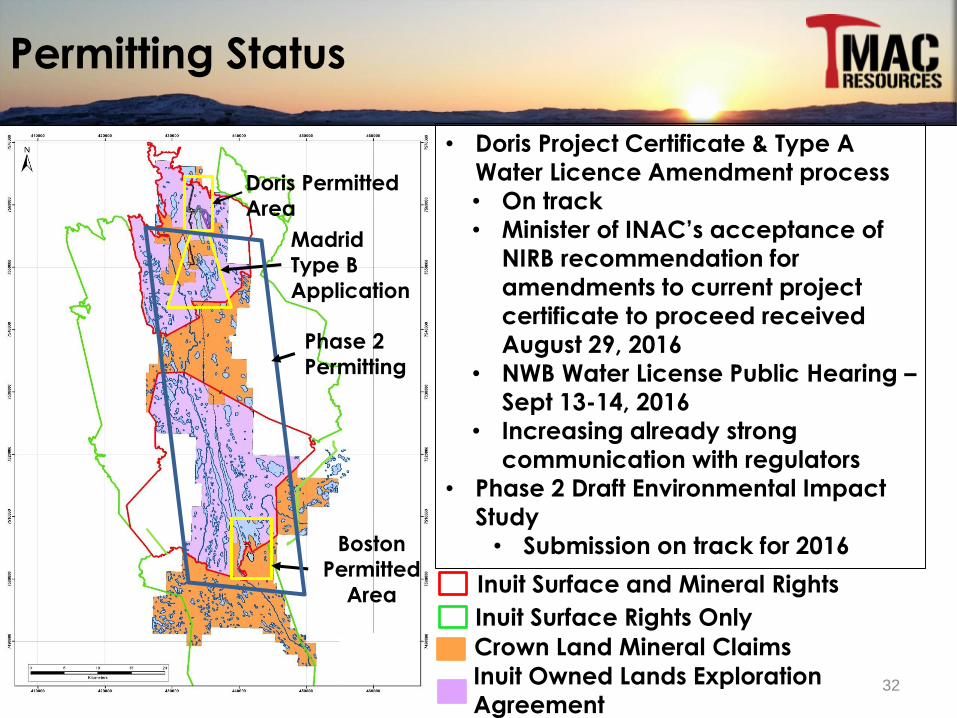
Permitting Status
Boston
Permitted
Area
Madrid
Type B
Application
Doris Permitted
Area
Phase 2
Permitting
Inuit Owned Lands Exploration
Agreement
Crown Land Mineral Claims
Inuit Surface and Mineral Rights
Inuit Surface Rights Only
• Doris Project Certificate & Type A
Water Licence Amendment process
• On track
• Minister of INAC’s acceptance of
NIRB recommendation for
amendments to current project
certificate to proceed received
August 29, 2016
• NWB Water License Public Hearing –
Sept 13-14, 2016
• Increasing already strong
communication with regulators
• Phase 2 Draft Environmental Impact
Study
• Submission on track for 2016
32

Category/Deposit Tonnes(t 000)
Grade(g/t Au)
Contained Au(oz 000)
Proven
Doris 650 13.4 281
Boston 657 8.5 180
Total Proven 1,306 11.0 461
Probable
Doris 1,694 8.0 438
Madrid North 7,882 6.6 1,676
Madrid South 626 11.5 230
Boston 2,687 8.1 703
Total Probable 12,888 7.4 3,046
Total P & P
Doris 2,343 9.5 719
Madrid North 7,882 6.6 1,676
Madrid South 626 11.5 230
Boston 3,343 8.2 883
Total P & P 14,194 7.7 3,507
1. See Information Regarding Scientific and Technical Information.
33
PFS Mineral Reserves1

Category/Deposit Tonnes
(t 000)
Grade
(g/t Au)
Contained Au
(oz 000)
Measured
Doris 443 21.7 309
Boston 608 10.3 201
Total Measured 1,051 15.1 510
Indicated
Doris 1,852 9.4 561
Madrid North 8,616 8.2 2,263
Madrid South 571 15.4 282
Boston 3,103 9.0 895
Total Indicated 14,142 8.8 4,001
Total M&I 15,193 9.2 4,511
Inferred
Doris 1,014 7.6 247
Madrid North 3,155 7.2 730
Madrid South 420 9.0 122
Boston 1,393 7.4 330
Total Inferred 5,982 7.4 1,429
1. See Information Regarding Scientific and Technical Information.
34
PFS Mineral Resources1

Information of a scientific or technical nature in respect of the Hope Bay Project is based upon the technical report for the Hope Bay Project dated May 28, 2015 entitled “Technical Report On The Hope Bay Project, Nunavut, Canada”, which has an effective date of March 31, 2015, prepared by Graham G. Clow, P.Eng., Normand L. Lecuyer, P.Eng., Sean Horan, P.Geo., and Holger Krutzelmann, P.Eng., all of Roscoe Postle Associates Inc., Derek Chubb, P.Eng., of ERM Consultants Canada Inc., Maritz Rykaart, Ph.D., P.Eng., of SRK Consulting (Canada) Inc., and Timothy Hughes, FAusIMM, of Gekko Systems Pty Ltd., who are independent “qualified persons” under National Instrument 43-101 –Standards of Disclosure for Mineral Projects (NI 43-101). Scientific and technical information contained in this document was reviewed and approved by Dave King, Vice President, Exploration of TMAC, a “qualified person” as defined by NI43-101.
Due to the uncertainty that may be attached to inferred mineral resource estimates, it cannot be assumed that all or any part of an inferred mineral resource estimate will be upgraded to an indicated or measured mineral resource estimate as a result of continued exploration. Confidence in an inferred mineral resource estimate is insufficient to allow meaningful application of the technical and economic parameters to enable an evaluation of economic viability sufficient for public disclosure, except in certain limited circumstances set out in NI 43-101. There is no assurance that mineral resources will be converted into mineral reserves. The mineral resource estimate includes inferred mineral resources that are considered too speculative geologically to have economic considerations applied to them that would enable them to be categorized as mineral reserves. There is also no certainty that these inferred mineral resources will be converted to the measured and indicated categories through further drilling, or into mineral reserves, once economic considerations are applied.
References to the preliminary economic assessment for the Hope Bay Project (the PEA) produced by TMAC are for purposes of illustrating the work undertaken by TMAC to upgrade its mineral resource estimates. The PEA is no longer a current estimate and only the Hope Bay Technical Report should be relied on.
See the final prospectus and the Hope Bay Technical Report, each filed on TMAC’s profile at www.sedar.com, for details of the data verification undertaken with respect to the scientific and technical information on the Hope Bay Technical Report and for additional details regarding the exploration information herein including locations, types, the QA/QC employed, and interpretations.
Notes to Mineral Resource Estimate
1. The Mineral Resource Estimate has an effective date of March 31, 2015.
2. The CIM Definition Standards were followed for Mineral Resources.
3. Mineral Resources are estimated at a cut-off grade of 4.5 g/t Au.
4. Mineral Resources are estimated using a long-term gold price of US$1,400 per ounce and a C$/US$ exchange rate of 1.12.
5. A minimum mining width of approximately 1.5 m was used.
6. A 50 m crown pillar allowance was applied to Mineral Resources located below lakes.
7. Measured and Indicated Mineral Resources are inclusive of Mineral Reserves.
8. Values may not add due to rounding.
Notes to Mineral Reserve Estimate
1. The Mineral Reserve Estimate has an effective date of March 31, 2015.
2. The CIM Definition Standards were followed for Mineral Reserves.
3. Mineral Reserves are estimated at a cut-off grade of 4.7 g/t Au for Longhole mining and 5 g/t Au for Drift and Fill mining.
4. Mineral Reserves are estimated using an average long-term gold price of US$1,250 per ounce and a US$/C$ exchange rate of 0.85.
5. A minimum mining width of 1.5 m for Longhole mining and 3 m for Drift and Fill mining was used.
6. Density was calculated using the geological block model density field.
7. Values may not add due to rounding.
Information Regarding Scientific and
Technical Information
35


