AES 109th CONVENTION, LOS ANGELES, 2000 SEPTEMBER 22-25 1 “HORN'S DIRECTIVITY RELATED TO THE PRESSURE DISTRIBUTION AT THEIR MOUTH” Mario Di Cola, Davide Doldi Politecnico di Milano Milano, Italy Phone: +39 339 3426631 e-mail: [email protected], [email protected]Abstract – Today’s studies about horns are actually based almost completely upon directivity control. In fact, while a good power response is finally recognized so important in professional loudspeaker systems engineering, the directivity behaviour of horns represents certainly a useful tool to get it. The directional properties of these devices are governed by the wavefront’s shape presented at the mouth. An analisys of the sound pressure’s magnitude and phase distribution across the horn’s mouth could certainly be helpful to understand how the wavefront is shaped there. Moreover, this could help to understand what happen in some particular circumstances. For example midrange beaming or high frequency mouth diffraction phenomena are two well known obstacles to overcome designing a broad band constant directivity horn. A method forwarded by us to perform such analisys will be shown through graphic illustrations. Presented will be even the results obtained performing measurements upon real devices and the correlation to the polar plots. 1. INTRODUCTION The directional properties of realworld horns and waveguides generally disagree from the theoretical behaviour or at least from the expected ones. Almost in all cases it depends on frequency. They get very close to the expectations at some frequencies and, they far away from those at some other. This clearly suggest that may be something unexpected happens depending on frequency. In fact, as largely agreed from al the theory rewievers about this topics, through a waveguide having a conical shaped profile the wavefront propagetes spherically shaped, straight to the mouth and to the external enviroment, and this wavefront must be everytime perpendicular to the wall surfaces of the waveguide. Generally speaking every time we would get constant directivity we should use an horn profile that is perpendicular to the wavefront we would let propagate [1]. The problem is that all the waveguides are finite in dimensions (with no exception!) and this is the most important cause of the disagreement with the theory. Almost every theory in fact, needs to consider as a starting point that the horn should be considered infinite.
Transcript
AES 109th CONVENTION, LOS ANGELES, 2000 SEPTEMBER 22-25 1
“HORN'S DIRECTIVITY RELATED TO THE PRESSURE DISTRIBUTION AT THEIR MOUTH”
Abstract – Today’s studies about horns are actually based almost completely upon directivity control. In fact, while a good power response is finally recognized so important in professional loudspeaker systems engineering, the directivity behaviour of horns represents certainly a useful tool to get it. The directional properties of these devices are governed by the wavefront’s shape presented at the mouth. An analisys of the sound pressure’s magnitude and phase distribution across the horn’s mouth could certainly be helpful to understand how the wavefront is shaped there. Moreover, this could help to understand what happen in some particular circumstances. For example midrange beaming or high frequency mouth diffraction phenomena are two well known obstacles to overcome designing a broad band constant directivity horn. A method forwarded by us to perform such analisys will be shown through graphic illustrations. Presented will be even the results obtained performing measurements upon real devices and the correlation to the polar plots. 1. INTRODUCTION The directional properties of realworld horns and waveguides generally disagree from the theoretical behaviour or at least from the expected ones. Almost in all cases it depends on frequency. They get very close to the expectations at some frequencies and, they far away from those at some other. This clearly suggest that may be something unexpected happens depending on frequency. In fact, as largely agreed from al the theory rewievers about this topics, through a waveguide having a conical shaped profile the wavefront propagetes spherically shaped, straight to the mouth and to the external enviroment, and this wavefront must be everytime perpendicular to the wall surfaces of the waveguide. Generally speaking every time we would get constant directivity we should use an horn profile that is perpendicular to the wavefront we would let propagate [1]. The problem is that all the waveguides are finite in dimensions (with no exception!) and this is the most important cause of the disagreement with the theory. Almost every theory in fact, needs to consider as a starting point that the horn should be considered infinite.
MARIO DI COLA, DAVIDE DOLDI HORN’S MOUTH AND DIRECTIVITY
AES 109th CONVENTION, LOS ANGELES, 2000 SEPTEMBER 22-25 2
For real world horns, their dimensions at very high frequencies may let the horn behave quite close as it is infinite, but other kind of problems arise anyway and this prevent the horn to act as the thory assert as well. The most important issues related to the obtaining of constant directivity beahaviour in real horns are mainly the midrange beaming and high frequencies diffraction effects. But maybe that we could highlight other kind of problems related to some beamwidht and directivity index discontinuities as well. In a previous work of ours [2] we showed with practical measurements what kind of improvement could be obtained shaping accurately the horn’s mouth in terms of high frequency diffraction effecs. But a mouth flaring that tends in the last part of the horn to augment the included angle shows its beneficial effect even in minimizing midrange narrowing phenomenon. 2. BACKGROUND In order to understand the origin of every unexpected behaviour we were talking about, we believe that the analysis we are going to show here could be very useful. In fact we found really helpful in horn design to take a look at what kind of distribution, at the horn’s mouth, the pressure assumes at various frequencies to understand why that horn behave in a particular way. Polar plots and other traditional tools as beamwidth or directivity index plots are absolutely fundamental, but their intrinsic nature shows “how” a device behave. We think that adding to those one more information that tell us something about “why” it behaves like that, could help us to have a more complete idea of the situation while studying an horn/waveguide. Don B. Keele in his famous work [3] about constant directivity CE horns showed the seriousness of the midrange beaming effect. He pointed out the fact that by flaring in an opportune way the final part of the horn this problem could be worked out and that the actual behaviour of the horn could be investigated by collecting amplitude measurements across the horn’s mouth. He explained as the mouth’s pressure distribution can give an indication of what is the effective size of the acoustic source. Related to horn’s mouth another very important work was made by E. Geddes [4], that gave an explanation of which phenomena are at the origin of mouth diffraction effects and showed even that known the velocity distribution at the horn’s mouth, the far field pressure can be calculated. 3. CONSTANT DIRECTIVITY IN HORNS AND WAVEGUIDES DESIGN As pointed out before, constant directivity performances on high frequency horns is a great deal of discussion and researching for almost every professional loudspeaker system’s engineer. But we even know that some obstacles need to be overcame to get constant directivity. In real world professional high power systems suited for sound reinforcement, compression drivers are usually employed. They are usually coupled to small format horns in order to get the most compact dimensions to the system.
MARIO DI COLA, DAVIDE DOLDI HORN’S MOUTH AND DIRECTIVITY
AES 109th CONVENTION, LOS ANGELES, 2000 SEPTEMBER 22-25 3
The fundamental issues related to constant directivity performances in such systems can be:
• The profile of the horn/waveguide: it should allow the horn to be theoretically a constant directivity device.
• Due to the finite dimensions of the horn/waveguide some modification of the theoretical profile should be used to minimize midrange beaming and high band diffraction effects.
• Understanding of which behaviour depends from which part of the horn [5]. • Driver–waveguide flare and shape matching [6] at the driver’s exit with a perfect suited
throat. • Driver exit diameter as a cause of very high frequency beaming. • Driver’s wavefront coherence due to the phase plug geometries. • Driver’s behaviour at high frequencies and particularly the exit’s coherence at the
break-up frequencies: effects due to the vibration resonances of the diaphragms [7]. So, each time we are involved designing an horn, particularly if it’s an high frequency horn, these are some very important issues we should think about, and their optimizing process is usually a very difficult matter. We found this analysis tool very useful to understand what should be worked out to improve directivity performances of any new horn, or invistigate the anomalies of existing designs.
4. MEASUREMENT METHOD The technique we used to perform such analysis could be considered very trivial, and …it is! We divided the mouth’s surface of any horn with a grid made of very very thin nylon thread. Each square element had the dimension of 1 cm (less that ½ inch). We took 3 averaged measurement in the center of each square element using a MLS measurement system. The microphone used is a ¼ inch one. The collection of measurement we got were used internally to a Matlab routine that uses measured pressure data to trace a coloured map representing the distribution of the acoustic pressure. Phase distribution can be represented as well. The portion of the mouth’s area really measured was one quarter. The maps traced are obtained by a double mirror symmetric copy of this quarter. An opportune window was applied at time data in order to include all the reflection that occur inside the horn, and excluding all the eventual external ones.
MARIO DI COLA, DAVIDE DOLDI HORN’S MOUTH AND DIRECTIVITY
AES 109th CONVENTION, LOS ANGELES, 2000 SEPTEMBER 22-25 4
5. MEASURED RESULTS DISCUSSION Midrange beaming problems Let’s start from a midrange beaming example. Our previous work about elliptical waveguide showed in the included measurement set a midrange beaming effect in the waveguide that had a straight conical end instead of be flared. In figures 1, 2 are represented D.I. and Beamwidth for the straight one. In pictures 3, 4 the same charts represent the behaviour of similar but flared waveguide.
Directivity Index dB
05
10152025303540
1k 1.6k 2.5k 4k 6.3k 10k 16k
Figure 1: Directivity Index for the conical ended waveguide
Beamwidth
0
30
60
90
120
1k 1.6k 2.5k 4k 6.3k 10k 16k
HorizontalVertical
Figure 2: Horizontal and Vertical Beamwidth for the conical ended waveguide
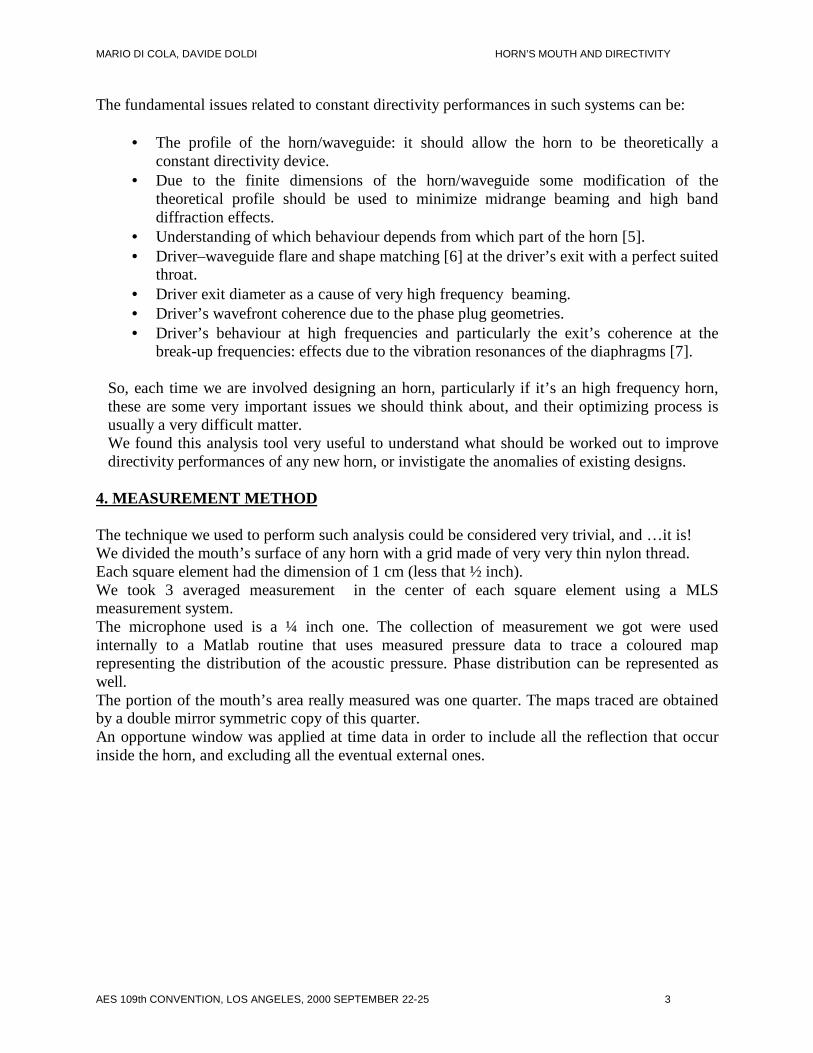
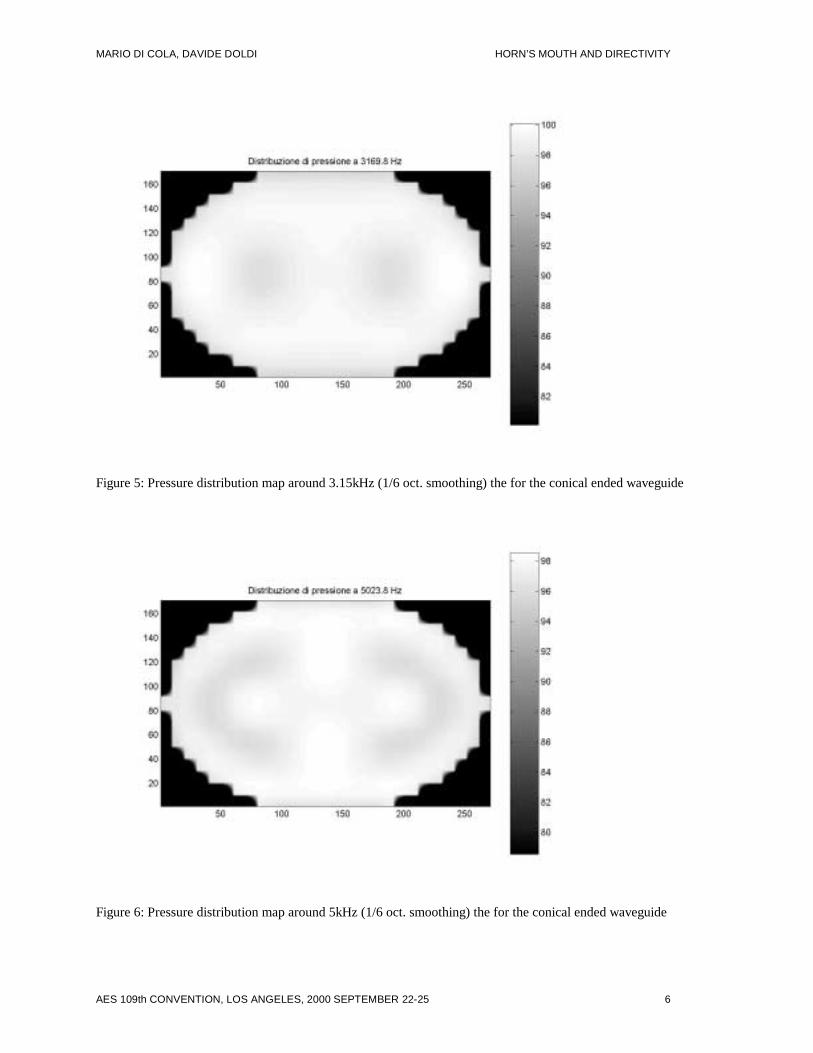
The pressure mapping at 2kHz, 2.5kHz and 3.15kHz (fig. 3,4,5) show what happen to the pressure distribution that influnce the performance on the horizontal plane. It’s clear that the pressure distribution assume the shape as a sort of dipole radiator that become more complicated at 3.15kHz. A similar phenomenon happens around 5kHz, 6.3kHz and 8kHz that influence the beaming in the vertical plane. (fig. 6,7,8)
MARIO DI COLA, DAVIDE DOLDI HORN’S MOUTH AND DIRECTIVITY
AES 109th CONVENTION, LOS ANGELES, 2000 SEPTEMBER 22-25 5
Figure 3: Pressure distribution map around 2kHz (1/6 oct. smoothing) the for the conical ended waveguide
Figure 4: Pressure distribution map around 2.5kHz (1/6 oct. smoothing) the for the conical ended waveguide
MARIO DI COLA, DAVIDE DOLDI HORN’S MOUTH AND DIRECTIVITY
AES 109th CONVENTION, LOS ANGELES, 2000 SEPTEMBER 22-25 6
Figure 5: Pressure distribution map around 3.15kHz (1/6 oct. smoothing) the for the conical ended waveguide
Figure 6: Pressure distribution map around 5kHz (1/6 oct. smoothing) the for the conical ended waveguide
MARIO DI COLA, DAVIDE DOLDI HORN’S MOUTH AND DIRECTIVITY
AES 109th CONVENTION, LOS ANGELES, 2000 SEPTEMBER 22-25 7
Figure 7: Pressure distribution map around 6.3kHz (1/6 oct. smoothing) the for the conical ended waveguide
Figure 8: Pressure distribution map around 8kHz (1/6 oct. smoothing) the for the conical ended waveguide
MARIO DI COLA, DAVIDE DOLDI HORN’S MOUTH AND DIRECTIVITY
AES 109th CONVENTION, LOS ANGELES, 2000 SEPTEMBER 22-25 8
In figures 9 and 10 are reported D.I. and Beamwidth for the waveguide having the mouth flared.
Directivity Index dB
0
5
10
15
20
25
30
1k 1.6k 2.5k 4k 6.3k 10k 16k
Figure 9: Directivity Index for the flared waveguide
Beamwidth
0
30
60
90
120
1k 1.6k 2.5k 4k 6.3k 10k 16k
HorizontalVertical
Figure 10: Horizontal and Vertical Beamwidth for the flared waveguide
The flared shape of the waveguide’s mouth helps to work out the problem of midrange beaming around the 2.5kHz region.
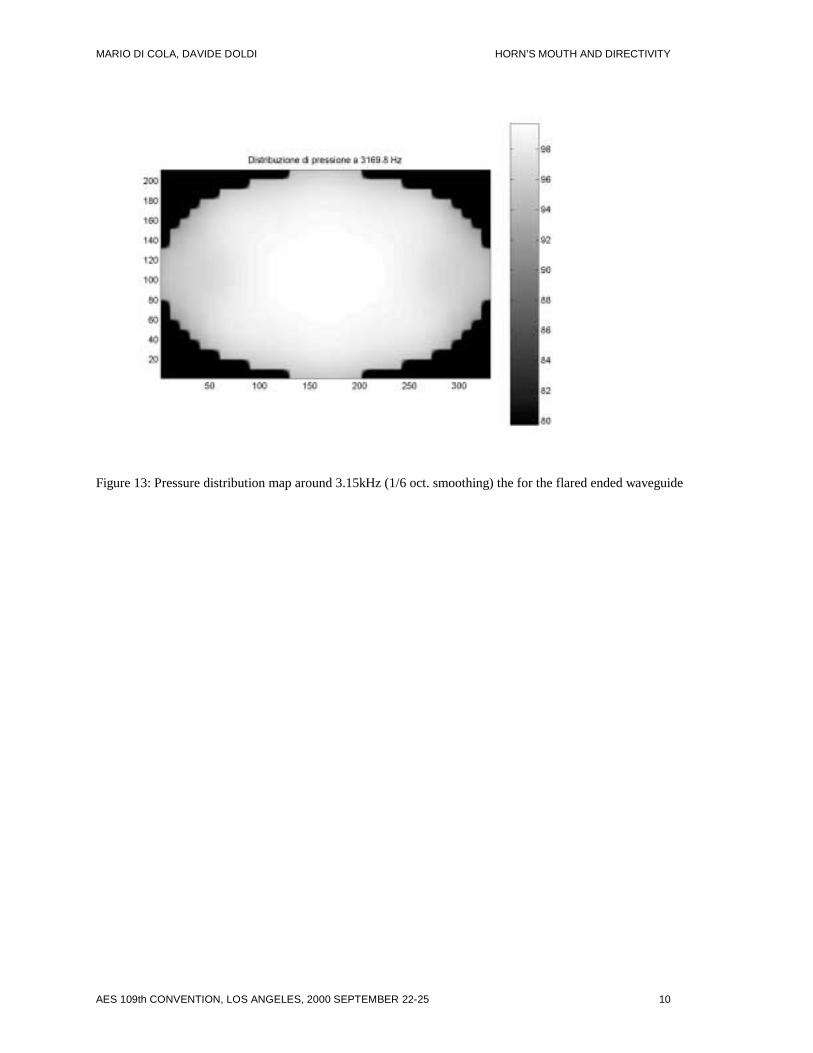
The successive figures 11, 12 and 13 show the pressure distribution at 2kHz, 2.5kHz and 3.15kHz for this modified waveguide.
MARIO DI COLA, DAVIDE DOLDI HORN’S MOUTH AND DIRECTIVITY
AES 109th CONVENTION, LOS ANGELES, 2000 SEPTEMBER 22-25 9
Figure 11: Pressure distribution map around 2kHz (1/6 oct. smoothing) the for the flared ended waveguide
Figure 12: Pressure distribution map around 2.5kHz (1/6 oct. smoothing) the for the flared ended waveguide
MARIO DI COLA, DAVIDE DOLDI HORN’S MOUTH AND DIRECTIVITY
AES 109th CONVENTION, LOS ANGELES, 2000 SEPTEMBER 22-25 10
Figure 13: Pressure distribution map around 3.15kHz (1/6 oct. smoothing) the for the flared ended waveguide
MARIO DI COLA, DAVIDE DOLDI HORN’S MOUTH AND DIRECTIVITY
AES 109th CONVENTION, LOS ANGELES, 2000 SEPTEMBER 22-25 11
High frequency directivity problems
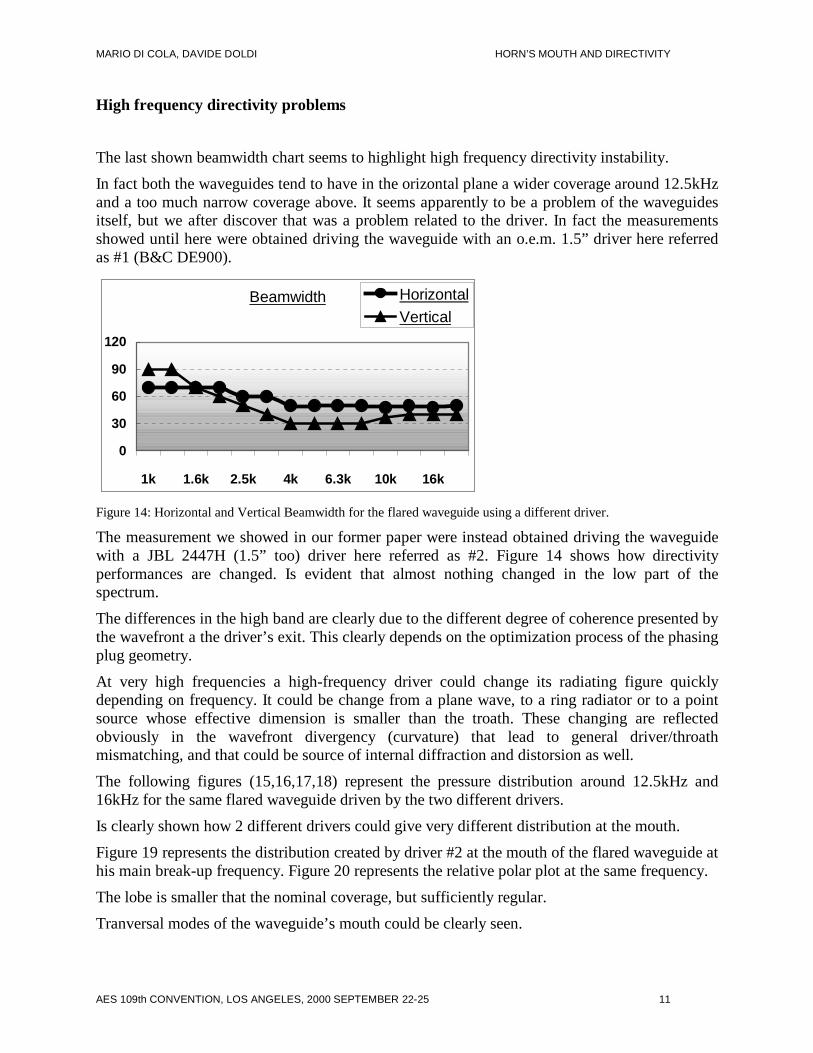
The last shown beamwidth chart seems to highlight high frequency directivity instability.
In fact both the waveguides tend to have in the orizontal plane a wider coverage around 12.5kHz and a too much narrow coverage above. It seems apparently to be a problem of the waveguides itself, but we after discover that was a problem related to the driver. In fact the measurements showed until here were obtained driving the waveguide with an o.e.m. 1.5” driver here referred as #1 (B&C DE900).
Beamwidth
0
30
60
90
120
1k 1.6k 2.5k 4k 6.3k 10k 16k
HorizontalVertical
Figure 14: Horizontal and Vertical Beamwidth for the flared waveguide using a different driver.
The measurement we showed in our former paper were instead obtained driving the waveguide with a JBL 2447H (1.5” too) driver here referred as #2. Figure 14 shows how directivity performances are changed. Is evident that almost nothing changed in the low part of the spectrum.
The differences in the high band are clearly due to the different degree of coherence presented by the wavefront a the driver’s exit. This clearly depends on the optimization process of the phasing plug geometry.
At very high frequencies a high-frequency driver could change its radiating figure quickly depending on frequency. It could be change from a plane wave, to a ring radiator or to a point source whose effective dimension is smaller than the troath. These changing are reflected obviously in the wavefront divergency (curvature) that lead to general driver/throath mismatching, and that could be source of internal diffraction and distorsion as well.
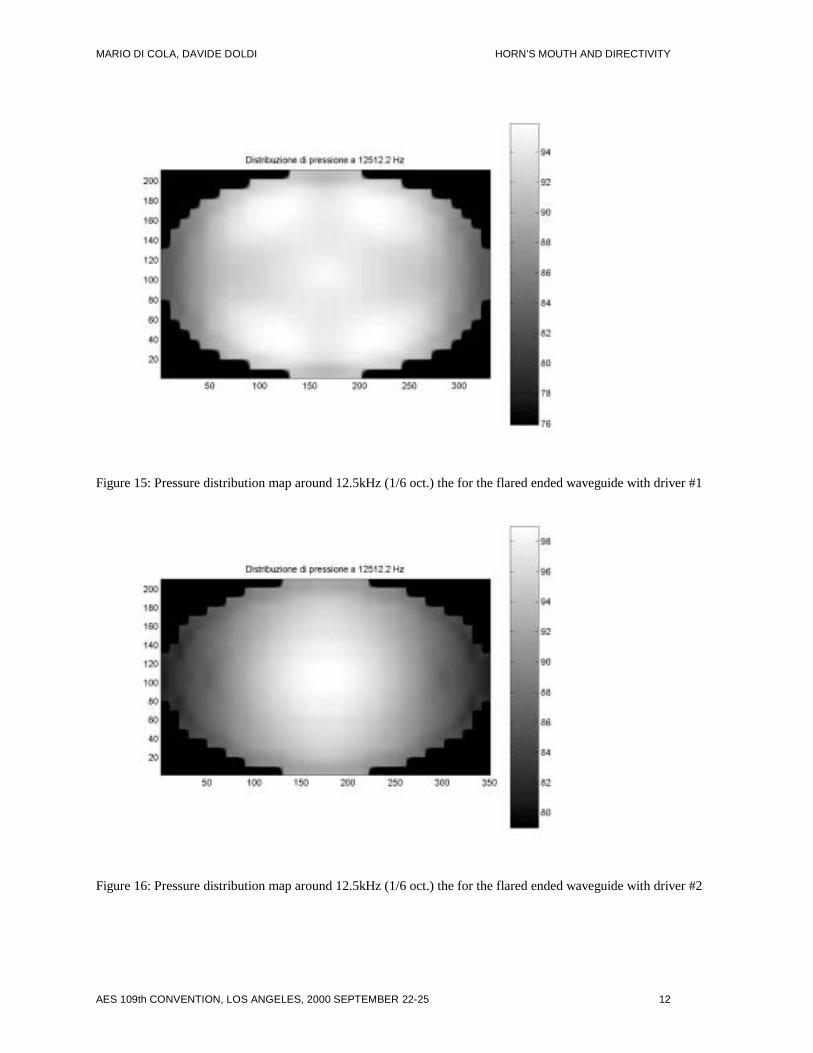
The following figures (15,16,17,18) represent the pressure distribution around 12.5kHz and 16kHz for the same flared waveguide driven by the two different drivers.
Is clearly shown how 2 different drivers could give very different distribution at the mouth.
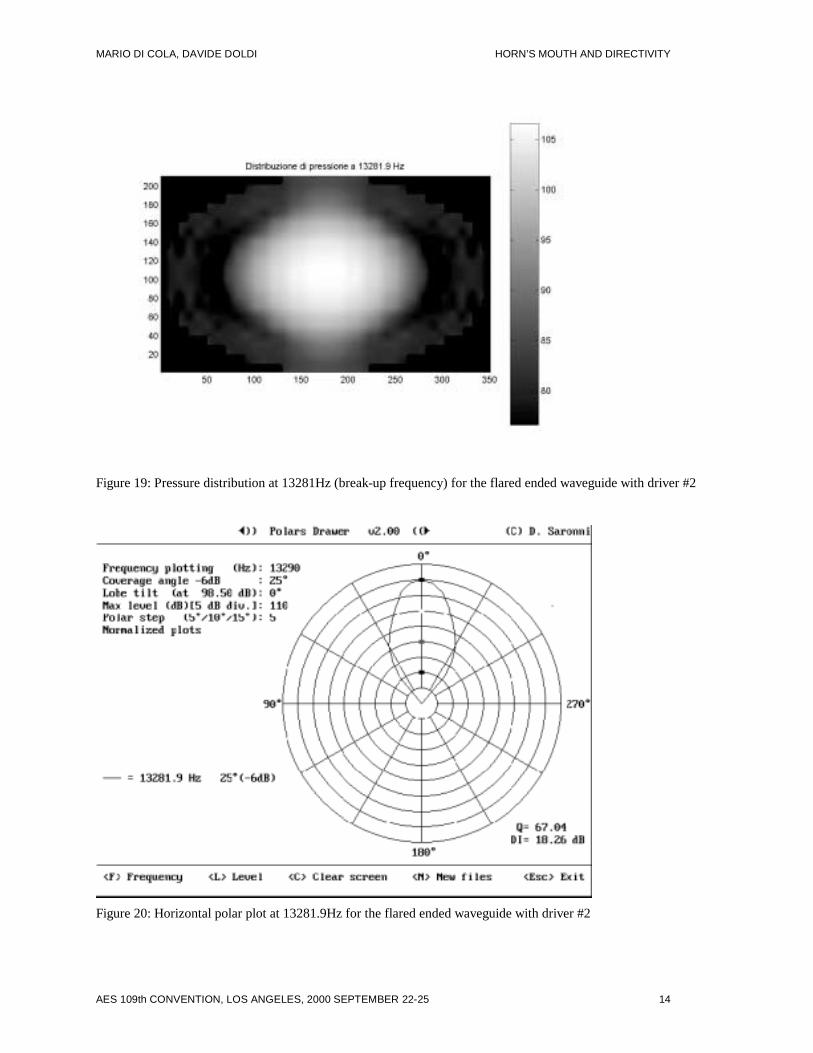
Figure 19 represents the distribution created by driver #2 at the mouth of the flared waveguide at his main break-up frequency. Figure 20 represents the relative polar plot at the same frequency.
The lobe is smaller that the nominal coverage, but sufficiently regular.
Tranversal modes of the waveguide’s mouth could be clearly seen.
MARIO DI COLA, DAVIDE DOLDI HORN’S MOUTH AND DIRECTIVITY
AES 109th CONVENTION, LOS ANGELES, 2000 SEPTEMBER 22-25 12
Figure 15: Pressure distribution map around 12.5kHz (1/6 oct.) the for the flared ended waveguide with driver #1
Figure 16: Pressure distribution map around 12.5kHz (1/6 oct.) the for the flared ended waveguide with driver #2
MARIO DI COLA, DAVIDE DOLDI HORN’S MOUTH AND DIRECTIVITY
AES 109th CONVENTION, LOS ANGELES, 2000 SEPTEMBER 22-25 13
Figure 17: Pressure distribution map around 16kHz (1/6 oct.) the for the flared ended waveguide with driver #1
Figure 18: Pressure distribution map around 16kHz (1/6 oct.) the for the flared ended waveguide with driver #2
MARIO DI COLA, DAVIDE DOLDI HORN’S MOUTH AND DIRECTIVITY
AES 109th CONVENTION, LOS ANGELES, 2000 SEPTEMBER 22-25 14
Figure 19: Pressure distribution at 13281Hz (break-up frequency) for the flared ended waveguide with driver #2
Figure 20: Horizontal polar plot at 13281.9Hz for the flared ended waveguide with driver #2
MARIO DI COLA, DAVIDE DOLDI HORN’S MOUTH AND DIRECTIVITY
AES 109th CONVENTION, LOS ANGELES, 2000 SEPTEMBER 22-25 15
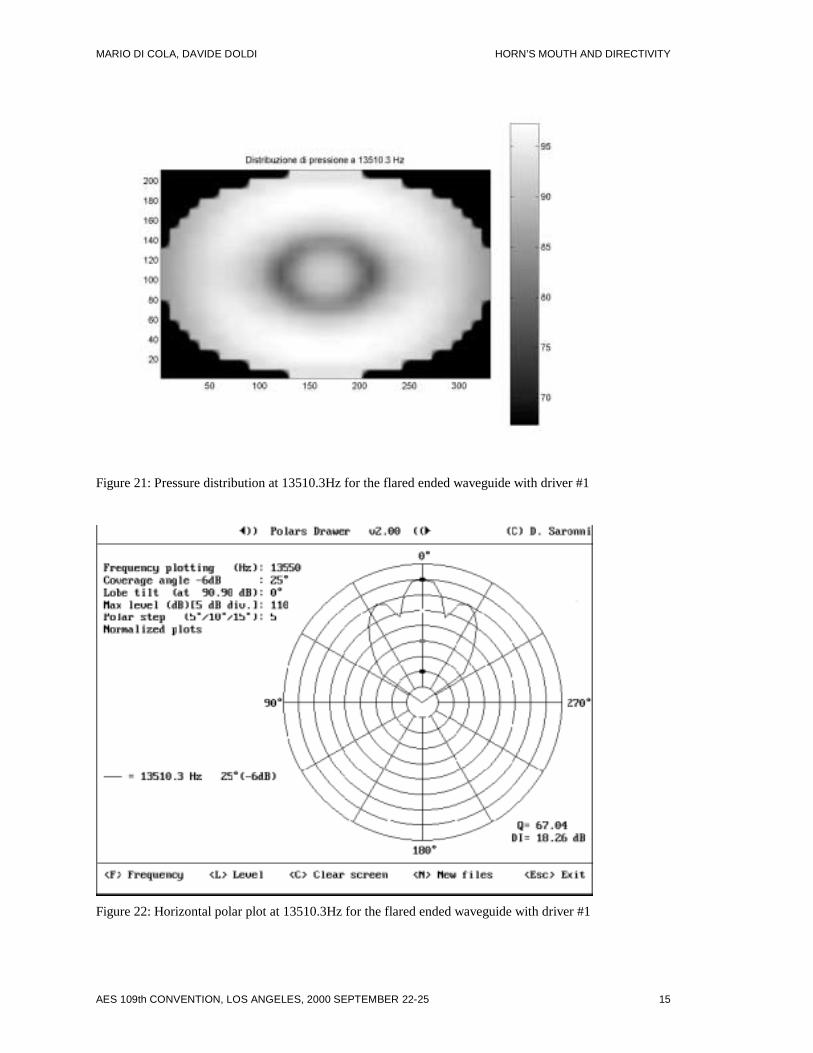
Figure 21: Pressure distribution at 13510.3Hz for the flared ended waveguide with driver #1
Figure 22: Horizontal polar plot at 13510.3Hz for the flared ended waveguide with driver #1
MARIO DI COLA, DAVIDE DOLDI HORN’S MOUTH AND DIRECTIVITY
AES 109th CONVENTION, LOS ANGELES, 2000 SEPTEMBER 22-25 16
Figure 23: Pressure distribution at 14966.2Hz (break-up frequency) for the flared ended waveguide with driver #1
Figure 24: Horizontal polar plot at 14966.2Hz (break-up frequency ) for the flared ended waveguide with driver #1
MARIO DI COLA, DAVIDE DOLDI HORN’S MOUTH AND DIRECTIVITY
AES 109th CONVENTION, LOS ANGELES, 2000 SEPTEMBER 22-25 17
Figure 25: Pressure distribution at 14966.2Hz for the flared ended waveguide with driver #2
Figure 26: Horizontal polar plot at 14966.2Hz for the flared ended waveguide with driver #2
MARIO DI COLA, DAVIDE DOLDI HORN’S MOUTH AND DIRECTIVITY
AES 109th CONVENTION, LOS ANGELES, 2000 SEPTEMBER 22-25 18
Figure 27: Pressure distribution at 16160.1Hz for the small format diffraction horn
Figure 28: Vertical polar plot at 16160.1Hz for the small format diffraction horn
MARIO DI COLA, DAVIDE DOLDI HORN’S MOUTH AND DIRECTIVITY
AES 109th CONVENTION, LOS ANGELES, 2000 SEPTEMBER 22-25 19
Figure 29: Pressure distribution at 11391.8Hz for the conical ended waveguide with driver #1
Figure 30: Horizontal polar plot at 11391.8Hz for the conical ended waveguide with driver #1
MARIO DI COLA, DAVIDE DOLDI HORN’S MOUTH AND DIRECTIVITY
AES 109th CONVENTION, LOS ANGELES, 2000 SEPTEMBER 22-25 20
In figure 21 is represented a strange distribution created by driver #1 before its main break-up frequency. The pressure distribution assumes the shape of a ring radiator with a small source in the center. “Fingering” polar plot type in figure 22 results from that distribution.
In figure 23 is shown the distribution created from driver #1 at its main break-up frequency.
Mouth’s transverse mode are clearly shown, but the fingering shape of the polar plot (figure 24) is not completely due to the waveguide.
In fact driving the waveguide with driver #2, distribution takes a very different shape and side lobes in the polar plot are consistently smoothed. (figures 25 and 26).
Figures 27 and 28 are related to a complete different type of horn.
It is a well known device (EV HP 64) that uses a diffraction slot at the throat. This slot is divided almost completely in 3 cells internally. The distribution represented in figure 27 is measured at 16160 Hz. The horns act around this frequency similarly to an array of multiple sources, showing severe fingering in the realtive polar plot.
The last couple, the figures 29 and 30 are related to the conical ended waveguide. The distribution is measured at a frequency where the diffraction phenomena are particular evident. In the distribution should be clear the mixed effect of several transverse propagation phenomena and the particular shaped distribution.
6.FURTHER DEVELOPMENTS
As well known, the directional propeties of a radiating objects like horns could be calculated when the velocity distribution of the air's sparticles at its mouth is known [4].
But considering the fact that we can more easier measure the pressure: the complex sound pressure distribution across the surface of the mouth.
We must be concerned at this point to understand if the measurement of the complex sound pressure distribution could represent some sort of indirect measurement of the particle's velocity.
The wave theory shows us that this quite true under some restrictions.
Strictly speaking the propagation of sound in air is a non-linear phenomenon. But we do no usually make use of the non-linear wave equation to study sound propagation.
In fact we combine together the state equation for fluids, the equation of continuity and the linear inviscid force equation to yeld a single approximated linear wave equation. In so doing, a very important fact results to be evident: the particles' velocity under some restricted condition could be considered curl-free.
This allow the definition of a function (phi) called velocity potential, making the velocity be equal to the gradient of the velocity potential. Because of this function in each point in the case of spherical waves for example is directly related to the complex value of the sound pressure, this means that the measurement of the complex pressure distribution may even indicate how the particle's velocity is distributed. The restrictions to the validity of this are the following:
MARIO DI COLA, DAVIDE DOLDI HORN’S MOUTH AND DIRECTIVITY
AES 109th CONVENTION, LOS ANGELES, 2000 SEPTEMBER 22-25 21
- the air must be considerated at the thermodynamic equilibrium
- the condensation ’s’ must be very very small, s<<1, that means that the sound pressure must be very small.
- this approximations are invalid in the points very close the the object’s boundary
[8].
7. CONCLUSIONS
The work showed here is clearly uncomplete and the measurements made contains some approximation due to our rudimentary measurement setup.
Anyway this helped us in the last times in horn design ant this is the reason we would present it in this paper. We hope to be able as soon as possible to improve every procedure used here in order to yeld more precision and to develop all the remaing part related to phase distribution and wavefront’s shape calculation.
Moreover any improvement of the precision of such method will be useful for us to apply a similar technique to study directly driver’s behaviour.
REFERENCES
[1] Gavin R. Putland, “Every One-Parameter Acoustic Field Obeys Webster’s Horn Equation”, J. Audio Eng. Soc., Vol. 41, No. 6, 1993 June.
[2] M. Di Cola, D. Doldi, M. Furlan, “A New Approach to Waveguides”, presented at 107th Convention of the Audio Engineering Society, New York, September 1999; preprint 5007.
[3] D. B. Keele, Jr., “What So Sacred about Exponential Horns”, presented at the 51st Convention of the Audio Engineering Society, May 1975; preprint 1038. Abstract: vol. 23, 1975 July/August.
[4] E. R. Geddes, “Sound Radiation from Acoustic Aperture”, J. Audio Eng. Soc., vol. 41, 1993 April.
[5] T. F. Johansen, “On the Directivity of Horn Loudspeaker”, J. Audio Eng. Soc., vol. 42 (1994 December).
[6] J. Eargle, W. Gelow, “Performance of Horn Systems: Low-Frequency Cut-off, Pattern Control, and Distorsion Trade-offs”, presented at 101st Convention of the Audio Engineering Society, Los Angeles, November 1996; preprint 4330.
[7] D. Bie, “Vibration Resonances of Titanium Loudspeaker Diaphram”, presented at 104th convention of the Audio Engineering Society, Amsterdam, May 1998; preprint 4642.
[8] L. E. Kinsler, A. R. Frey, A. B. Coppens, J. V. Sanders, Fundamentals of Acoustic, 3rd ed., Wiley, New York, 1982.