Fast flow microfluidics and single-molecule fluorescence for the rapid characterization of alpha-synuclein oligomers Authors: Mathew H. Horrocks 1† , Laura Tosatto 1,2† , Alexander J. Dear 1 , Gonzalo A. Garcia 1 , Marija Iljina 1 , Nunilo Cremades 1 , Mauro Dalla Serra 2 , Tuomas P. J. Knowles 1 , Christopher M. Dobson 1 , David Klenerman. 1 * Author Addresses: 1 Department of Chemistry, University of Cambridge, Lensfield Road, Cambridge CB2 1EW, UK. 2 Istituto di Biofisica, CNR, U.O. Trento, Italy *Correspondence to: [email protected]. † These authors contributed equally to this work. Abstract: Alpha-synuclein oligomers can be toxic to cells and may be responsible for cell death in Parkinson’s disease. Their typically low abundance and highly heterogeneous nature, however, make such species challenging to study using traditional biochemical techniques. By combining fast-flow microfluidics with single-molecule fluorescence, we
Transcript
Fast flow microfluidics and single-molecule
fluorescence for the rapid characterization of
alpha-synuclein oligomers
Authors: Mathew H. Horrocks1†, Laura Tosatto1,2†, Alexander J. Dear1, Gonzalo A.
Garcia1, Marija Iljina1, Nunilo Cremades1, Mauro Dalla Serra2, Tuomas P. J. Knowles1,
Christopher M. Dobson1, David Klenerman.1*
Author Addresses: 1Department of Chemistry, University of Cambridge, Lensfield
Alpha-synuclein oligomers can be toxic to cells and may be responsible for cell death
in Parkinson’s disease. Their typically low abundance and highly heterogeneous nature,
however, make such species challenging to study using traditional biochemical
techniques. By combining fast-flow microfluidics with single-molecule fluorescence, we
are able to rapidly follow the process by which oligomers of αS are formed, and to
characterize the species themselves. We have used the technique to show that populations
of oligomers with different FRET efficiencies have varying stabilities when diluted into
low ionic strength solutions. Interestingly, we have found that oligomers formed early in
the aggregation pathway have electrostatic repulsions that are shielded in the high ionic
strength buffer, and therefore dissociate when diluted into lower ionic strength solutions.
This property can be used to isolate different structural groups of αS oligomers and can
help to rationalize some aspects of αS amyloid fibril formation.
Introduction
Parkinson’s disease (PD) is the second most common neurodegenerative disease after
Alzheimer’s disease1, affecting more than 1% of the world’s population of those aged
over 65 years2. Clinically, the disorder is characterized by a loss of control of movement,
and the onset of resting tremors, muscle rigidity and bradykinesia. Additionally, there are
non-motor characteristics, such as cognitive impairment, depression, olfactory deficits,
psychosis, and sleep disturbance during the progression of the disease3.
Neuropathologically, PD is characterized by the progressive loss of dopaminergic
neurons within the substantia nigra pars compacta of the midbrain. One of the major
pathological hallmarks of PD is the presence of intra-neuronal proteinaceous cytoplasmic
inclusions, referred to as Lewy Bodies (LBs). The finding that amyloid fibrils of the
protein alpha-synuclein (αS) are a major component of LBs suggests that it is involved in
the etiology of the disease4. LBs are also found in other neurodegenerative disorders such
as Dementia with LBs, the LB variant of AD5 and Down’s Syndrome6. Duplication7 and
triplication8 of the chromosomal region surrounding the gene coding for αS, and a
number of point mutations8–13 lead to dominantly inherited PD, providing further
evidence for the link between the protein and the diseases.
The finding that purified recombinant αS forms fibrils resembling those found in LBs14
has led to speculation that aggregation plays a key role in the disease. When αS
aggregates in vitro, small soluble oligomers, which have been shown to be cytotoxic, are
generated15–17, and such species can, in some cases, progress directly into fibrillar
structures. Despite the evidence of their importance to the disease, the usually low
abundance and highly heterogeneous nature of the oligomeric species formed during the
aggregation reaction make them difficult to study using traditional biochemical
techniques. We have previously used single-molecule fluorescence techniques to
characterize the aggregation and behavior of amyloid oligomers of the SH3 domain of
PI3 kinase18, the amyloid-beta peptide19,20 and αS16. For the latter, we used single-
molecule Förster Resonance Energy Transfer (FRET) to show that αS initially forms
amorphous oligomers having a low FRET efficiency, which consequently undergo a
structural rearrangement to form proteinase-K resistant, cytotoxic oligomers, having a
higher FRET efficiency16.
The oligomers of αS generated during fibril formation typically only make up a small
fraction of the total protein concentration, and so single-molecule techniques are needed
to detect their presence and characterize their structures. The picomolar concentrations
required for single-molecule detection, however, mean that a significant time is needed to
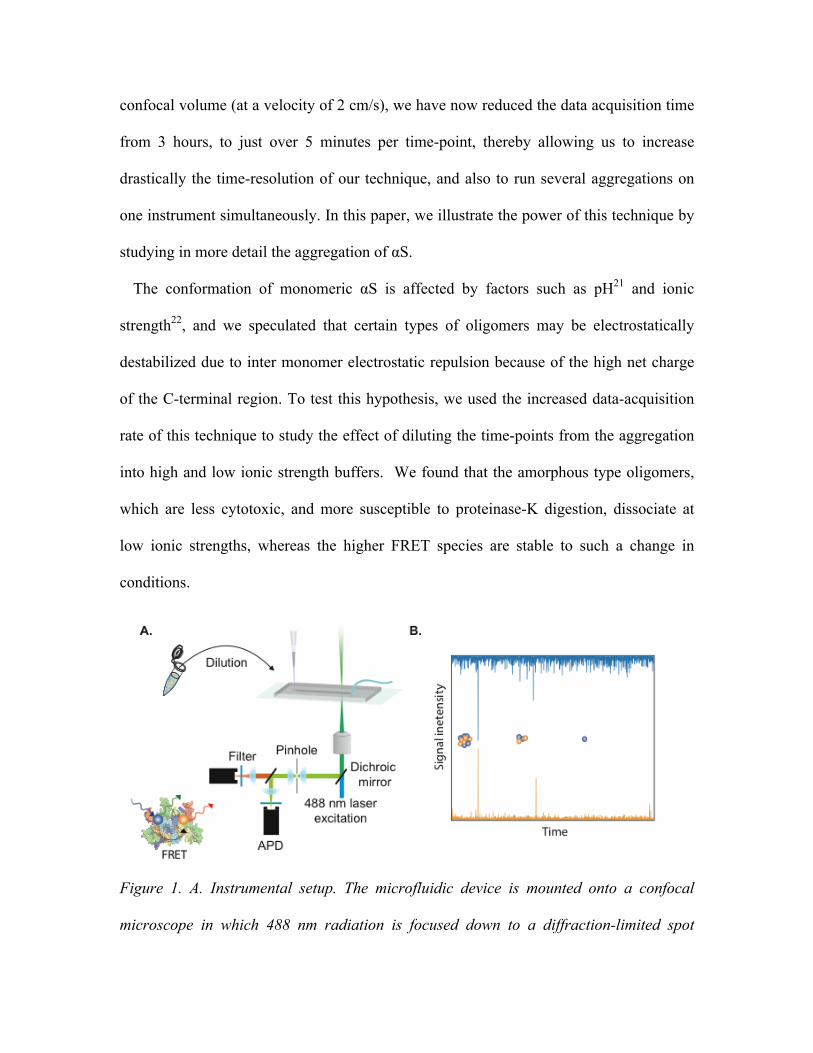
collect enough data to make useful conclusions. Through incorporating fast-flow
microfluidics (Figure 1) to rapidly pass the low concentration solutions through the
confocal volume (at a velocity of 2 cm/s), we have now reduced the data acquisition time
from 3 hours, to just over 5 minutes per time-point, thereby allowing us to increase
drastically the time-resolution of our technique, and also to run several aggregations on
one instrument simultaneously. In this paper, we illustrate the power of this technique by
studying in more detail the aggregation of αS.
The conformation of monomeric αS is affected by factors such as pH21 and ionic
strength22, and we speculated that certain types of oligomers may be electrostatically
destabilized due to inter monomer electrostatic repulsion because of the high net charge
of the C-terminal region. To test this hypothesis, we used the increased data-acquisition
rate of this technique to study the effect of diluting the time-points from the aggregation
into high and low ionic strength buffers. We found that the amorphous type oligomers,
which are less cytotoxic, and more susceptible to proteinase-K digestion, dissociate at
low ionic strengths, whereas the higher FRET species are stable to such a change in
conditions.
Figure 1. A. Instrumental setup. The microfluidic device is mounted onto a confocal
microscope in which 488 nm radiation is focused down to a diffraction-limited spot
within the 100 µm wide channel. Fluorescence from Alexa Fluor 488 (AF488) and Alexa
Fluor 594 (AF594) (excited indirectly via FRET) can then be collected, and separated
onto two separate Avalanche photodiode detectors (APDs). B. Example intensity traces.
Bursts of intensity arise when fluorescently labeled αS transits the confocal volume.
Oligomeric species have a burst in both the donor (blue trace) and acceptor (orange
trace) channel, allowing them to be separated from the majority of monomeric protein
(donor bursts only).
RESULTS AND DISCUSSION
Microfluidic device design
In order to determine whether an increase in the data acquisition rate for αS aggregation
samples could be achieved using fast-flow, a simple microfluidic device was designed
and made from PDMS. The device consists of a single channel, 100 µm in width, 25 µm
in height and 1 cm in length. The width and height were selected to prevent larger fibrils
blocking the device, and this is demonstrated by the constant monomer and oligomer
detection rate over the duration of the measurement, even at later time-points when fibrils
are present (Figure 2B and C.). The aggregation samples were diluted before being
loaded into a low-binding gel-loading tip, which was inserted into the entry port of the
device (Figure 2A.). Tubing connected to a syringe within a syringe pump was attached
to the exit port, allowing for accurate control of the flow-velocity by application of a
negative pressure. By withdrawing sample in this way, rather than infusing sample
directly from a syringe, the dead volume was minimal, and the exposure of the samples to
hydrophobic surfaces, such as the inside of plastic tubing, was minimized.
Figure 2. A. Device design. The microfluidic chip consists of a single-channel, 100 μm
in width, and 25 μm in height, red scale bar is 500 µm in length. A gel-loading tip
containing the analyst is added to the sample inlet, and the outlet is attached to a syringe
within a syringe pump to pull sample through the device. Zoom: Brightfield image of the
microfluidic device channel (scale bar is 100 µm in length). B. and C. Cumulative
frequency histogram of monomeric and oligomeric events, respectively, over a 400s
measurement of 280 pM aggregated αS. The histograms are fitted to a straight line
yielding R2 = 0.999 and R2 = 0.998 for monomeric, and oligomeric events, respectively.
This shows that the event detection rate remains constant over the measurement time.
Increase in data acquisition rate with fast flow microfluidics
Many steps in protein aggregation reactions are likely to take place on time-scales that
are shorter than the 3 h time points used in our previous study on the oligomers formed
during the aggregation of αS16. We sought to increase the time resolution by using fast
flow microfluidics. It has previously been shown that it is possible to increase the rate of
data acquisition in single-molecule confocal experiments by flowing the molecules
through the probe volume at high speeds (see Figure 1)23. There is, however, an upper
limit to the velocity at which molecules can flow through the confocal volume whilst still
enabling the collection of meaningful data. At higher speeds, there is an increase in the
rate at which fluorescent species transit the probe volume; in parallel, there is, however, a
decrease in the number of excitation-emission cycles of the fluorophores, reducing event
Sample inlet Outlet 1.2x10⁵
0.8
0.4
0.0Cum
ula
tive e
vents
3002001000
800
600
400
200
0
3002001000
Time (s)
A. B. C.
brightness. Thus, there is an optimum velocity at which the event rate is high, but the
brightness of the fluorescent bursts is not sufficiently low to make them undetectable.
With two-color excitation, the rate at which it is possible to flow and still get meaningful
data is higher than for the FRET experiments in which only one color is directly excited.
For the work presented here, only the donor dyes are directly excited, and the presence of
signal in the acceptor channel due to FRET is used to identify the oligomers in the
presence of an excess of monomers. The oligomers, however, typically have more than
one donor fluorophore present, and so it is possible to flow at higher velocities than those
used for detecting species with only one directly excited donor dye.
To determine the optimum flow velocity for our experiment, an aliquot of αS solution
was removed after incubation under aggregation conditions for 24 hours and diluted to
300 pM, before being flowed through a simple one-channel device mounted on the
single-molecule confocal instrument at a range of velocities. With increasing flow
velocity, it was necessary to increase the laser intensity, as under these conditions, the
molecules spend less time in the confocal volume. The optimum intensities were
determined previously23 by selecting those laser powers that gave the highest brightness
at each velocity, up to the maximum power achievable on our instrumental set-up. The
brightness of the bursts is also dependent on the flow velocity, and so it was necessary to
vary the thresholds (see Supporting Information for details of thresholding and data
analysis) in the donor and acceptor channels for each flow velocity. To achieve this in an
unbiased way, we have previously23 shown that the thresholds at each flow velocity can
be selected to give the maximum fraction of coincident fluorescent bursts in both
channels using a dual labeled DNA duplex as an example24. The flow velocities, time
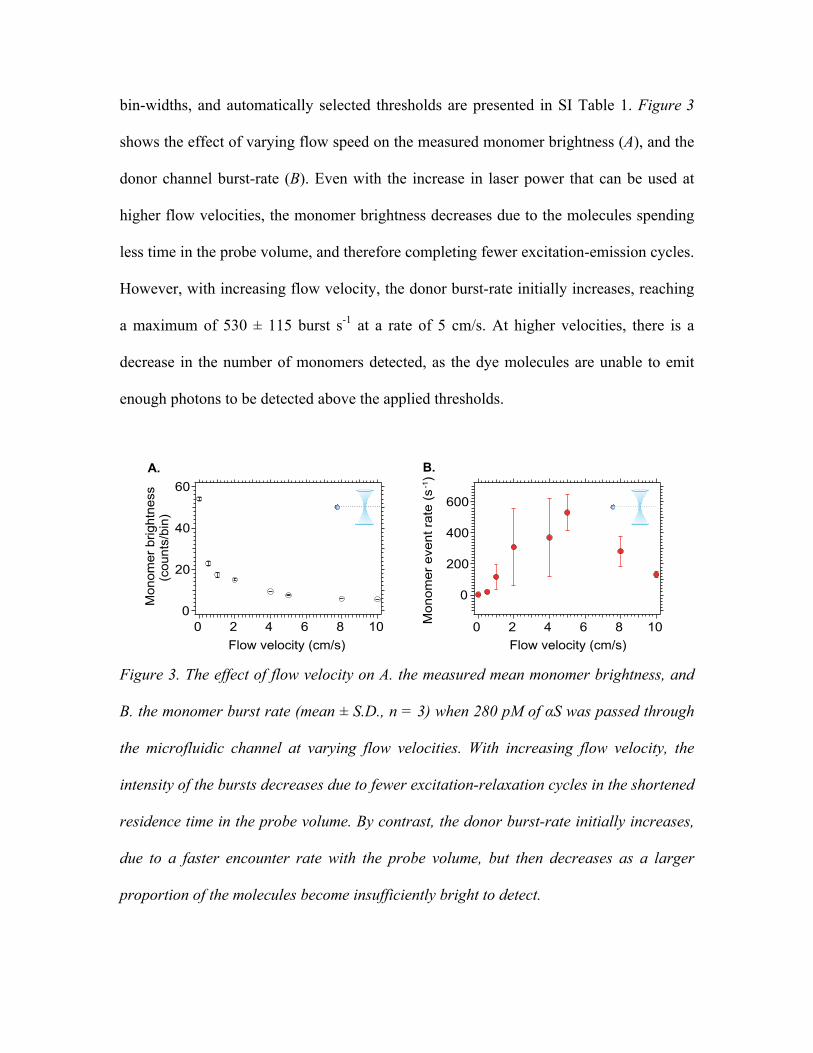
bin-widths, and automatically selected thresholds are presented in SI Table 1. Figure 3
shows the effect of varying flow speed on the measured monomer brightness (A), and the
donor channel burst-rate (B). Even with the increase in laser power that can be used at
higher flow velocities, the monomer brightness decreases due to the molecules spending
less time in the probe volume, and therefore completing fewer excitation-emission cycles.
However, with increasing flow velocity, the donor burst-rate initially increases, reaching
a maximum of 530 ± 115 burst s-1 at a rate of 5 cm/s. At higher velocities, there is a
decrease in the number of monomers detected, as the dye molecules are unable to emit
enough photons to be detected above the applied thresholds.
Figure 3. The effect of flow velocity on A. the measured mean monomer brightness, and
B. the monomer burst rate (mean ± S.D., n = 3) when 280 pM of αS was passed through
the microfluidic channel at varying flow velocities. With increasing flow velocity, the
intensity of the bursts decreases due to fewer excitation-relaxation cycles in the shortened
residence time in the probe volume. By contrast, the donor burst-rate initially increases,
due to a faster encounter rate with the probe volume, but then decreases as a larger
proportion of the molecules become insufficiently bright to detect.
60
40
20
0
Mon
omer
brig
htne
ss(c
ount
s/bi
n)
1086420Flow velocity (cm/s)
600
400
200
0
Mon
omer
eve
nt ra
te (s
-1)
1086420
A. B.
Flow velocity (cm/s)
As the oligomers are likely to contain more than one donor-labeled molecule, they are
brighter than the monomer alone, and have a greater probability of emitting sufficient
photons to be detected above the threshold level at higher flow velocities. Figure 4A
shows the number of oligomers detected as a function of the mean flow velocity. As with
the rate of monomer detection, there is an initial increase in the number of events
detected as the flow velocity increases, before a slight decrease at higher velocities.
The association quotient, Q (defined in the Supporting Information), indicates the
fraction of molecules that simultaneously exhibit bursts of fluorescence above the applied
thresholds in both detection channels. Figure 4B shows how Q varies as a function of
flow velocity for the oligomeric sample solution. Increasing the mean flow velocity from
0 to 0.5 cm s-1 leads to a slight increase in Q, as observed previously for dual-labeled
DNA duplexes23. At higher velocities, there is a decrease in the Q value, due to the
reduction in the brightness of the fluorophores, which are unable to complete sufficient
excitation-emission cycles within the probe volume. In performing experiments under
fast-flow, it is desirable that the flow velocity is high enough that many events are
detected, but not so high that the number of photons detected limits the quality of the
data. To take both of these factors into account in selecting the optimum flow velocity,
the product of the event rate and Q against the varying flow speed was determined, and is
plotted in Figure 4C. There is an increase in the product up to 2 cm/s, followed by a
plateau at higher velocities indicating that a mean flow velocity of 2 cm/s is ideal for
performing measurements of the oligomeric species under investigation here, since the
event rate is increased (events are detected ~150 times more frequently than under static
conditions), whilst the Q value is still reasonably high.
Figure 4 A. The effect of increasing flow velocity on the oligomer event rate when a
280pM sample of aggregated αS (starting monomer concentration) was passed through
the microfluidic channel at varying flow velocities. With increasing flow rate, the event
rate increases, making a plateau level after 2 cm/s, before decreasing slightly (mean ±
S.D., n = 3). B. The association quotient as a function of flow velocity (mean ± S.D., n =
3). There is a slight increase in the association quotient in changing the flow velocity
from 0 to 0.5 cm/s; however, it decreases at higher velocities due to the fluorophores
being less bright, and therefore less easily detectable. At higher velocities still (> 5 cm/s),
the association constant slightly increases; however, this is due to the significant
decrease in the monomer event rate (Figure 1B). C. The product of the association
quotient and event rate increases from 0 to 2 cm/s before plateauing (mean ± S.D., n =
3).
A further advantage of using microfluidic delivery to the confocal volume is that the
flow velocity of the individual species is independent of their diffusivity/size, as the
molecules are under laminar flow. In stationary measurements, relying on diffusion only,
larger species are able to occupy the probe volume for a prolonged period of time, which
16
12
8
4
0
Olig
om
er
eve
nt
rate
(s
-1)
1086420
0.5
0.4
0.3
0.2
0.1
0.0
-0.1
Q x
Eve
nt
rate
(s
-1)
1086420
0.12
0.08
0.04
0.00
Asso
cia
tio
n Q
uotie
nt
(Q)
1086420
Flow velocity (cm/s)
A. B. C.
Flow velocity (cm/s) Flow velocity (cm/s)
can lead to multiple counting of events. In addition, the path taken through the confocal
volume is more constant under flow (i.e. the molecules flow in one-dimension, rather
than traveling through via Brownian motion), meaning that the transit time remains
constant, and any intensity changes due to varying residence time are removed. Also,
since the flow is constant regardless of the species size, then species that are larger than
the confocal volume diameter, such as fibrils, will occupy a greater number of time-bins
than smaller species such as oligomers, as it takes a longer period of time for them to
transit fully the confocal volume. This effect allows for fibrillar species to be separated
from the smaller oligomeric events, which do not occupy multiple bins (see Supporting
Information).
Following the kinetics of an in vitro aggregation of αS
To determine the ability of the enhanced methodology to follow the in vitro formation
of αS oligomers, solutions of αS were incubated under conditions favoring aggregation,
and aliquots were taken and analysed at regular time intervals using single-molecule
fluorescence. As monomers become incorporated into oligomers and fibrils, their
numbers decrease, and this effect can be observed in Figure 4, which shows the number
of donor fluorescent bursts detected above the applied threshold within the 400 s
measurement time for the 50 hour time-course of the aggregation reaction.
Figure 5. The change in the number of donor bursts measured over time during the aggregation of αS in 150 mM tris buffer with 100 mM NaCl (mean ± S.D., n = 3). The donor burst rate decreases as monomers are incorporated into oligomers and fibrils, because their concentration in solution is lower.
For each event detected, the FRET efficiency and approximate size of the oligomer
giving rise to it can be determined (see Supporting Information for details), and then
binned into histograms (Figure 6A). As time progresses, the range of the sizes increases;
after six hours of incubation, there are few events attributable to an oligomer containing
more than 10 monomer units, whereas after 48 hours of incubation, a significant number
of events have larger sizes of up to 50 monomer units. This is expected as the oligomers
grow in size through monomer addition. It is also evident that there is a transition from
species with a low FRET efficiency to those with a high FRET efficiency as the
aggregation progresses. After six hours of incubation, 95.9% ± 6.2% (mean ± S.D., n = 3)
of the 3-‐150mers are within the lower FRET efficiency population, whereas at 48
hours, only 37.8% ± 4.2% (mean ± S.D., n=3) of them are within the lower FRET
population.
By generating FRET efficiency histograms from events corresponding to dimers, and
species greater in size than trimers, it is possible to observe a change in the FRET
efficiency more easily (Figure 6B). For the smaller apparently dimeric oligomers, only
one FRET population is observed, although this could be a mixture of the two
1.81.61.41.21.00.80.6
Don
or b
urst
s (1
05 )50403020100
Time (hours)
populations observed for larger species (it also has a FRET efficiency in between those of
the two populations of larger species), but since the events must have a greater number of
photons than the applied thresholds in both the donor and acceptor channel, events with
either very high or low FRET efficiencies and few emitted photons may not be detected,
and this may prevent the two peaks from being resolved for the smaller sized oligomers.
For the larger oligomers, two peaks can be clearly resolved and fitted to Gaussian
distributions. After integrating the fitted FRET histograms, the changes in the number of
oligomers within each population can be plotted (Figure 6C). All three populations show
an increase in the number of oligomers over time; for the low FRET form of the larger
oligomers (corresponding to the “type A” oligomers identified previously16), the increase
appears to occur rapidly after 2 hours of incubation, and continues at a high rate during
the first 10 hours. For the higher FRET larger species (corresponding to the “type B”
oligomers), the increase does not occur until after 8 hours of incubation, and then
continues at a steady rate for the rest of the time-period. This delay in their presence can
be attributed to the fact that they are formed from the conversion of type A oligomers.
The apparent dimers show a gradual increase throughout the time-course, as this
population is formed from a mixture of the low and high FRET species that cannot be
separated due to low photon counts.
In our previous study16, the single-molecule data were fit to a nucleation growth model
with a conformational conversion step, and we have used the same kinetic analysis here
to analyze the analogous data. The model assumes that primary nucleation results in the
creation of oligomers of type A from monomeric protein molecules, and that type A
oligomers can grow through monomer addition, or can convert into type B oligomers,
resulting in several parallel pathways for the formation of type B oligomers of a given
size (details of the early-time analytical and exact numerical solutions of the model are
presented in the Supporting Information). Only the first six time-points here are fit with
this model (Figure 6D.), since at later times, additional events, such as the formation of
large fibrillar species, the contribution of the reverse processes involving conversion of
type-B oligomers into type-A oligomers, and the dissociation of type-A oligomers,
become significant and result in under-fitting of the data.
This method of fitting generates two well-defined microscopic parameters; the primary
nucleation rate constant for oligomers of type A was found to be 1.05 × 10⁻⁷ s−1, and the
conversion rate constant from type A to type B oligomers as 2.02 × 10⁻⁵ s−1. These values
are similar to those determined previously16, suggesting that the information obtained
using single-molecule fluorescence and fast-flow microfluidics is fully consistent with
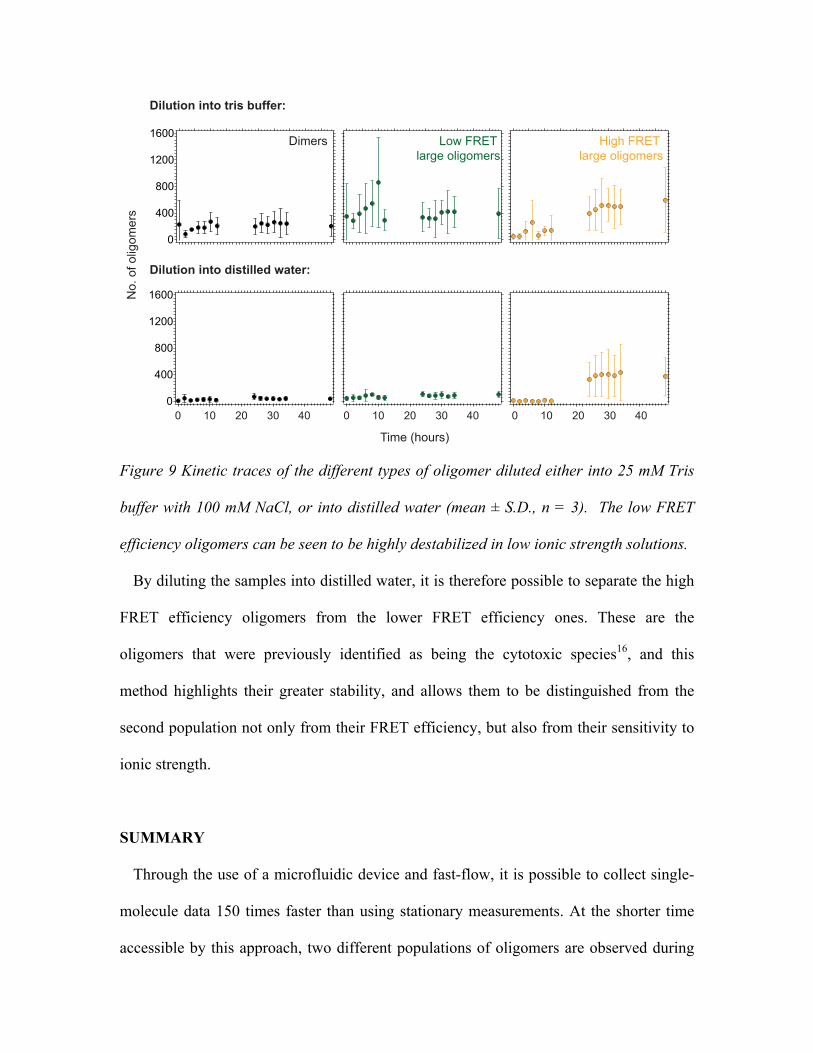
Figure 9 Kinetic traces of the different types of oligomer diluted either into 25 mM Tris
buffer with 100 mM NaCl, or into distilled water (mean ± S.D., n = 3). The low FRET
efficiency oligomers can be seen to be highly destabilized in low ionic strength solutions.
By diluting the samples into distilled water, it is therefore possible to separate the high
FRET efficiency oligomers from the lower FRET efficiency ones. These are the
oligomers that were previously identified as being the cytotoxic species16, and this
method highlights their greater stability, and allows them to be distinguished from the
second population not only from their FRET efficiency, but also from their sensitivity to
ionic strength.
SUMMARY
Through the use of a microfluidic device and fast-flow, it is possible to collect single-
molecule data 150 times faster than using stationary measurements. At the shorter time
accessible by this approach, two different populations of oligomers are observed during
1600
1200
800
400
0
1600
1200
800
400
0
0 10 20 30 40 0 10 20 30 40 0 10 20 30 40
Time (hours)
No. of oligom
ers
Dilution into tris buffer:
Dilution into distilled water:
Dimers Low FRET
large oligomers
High FRET
large oligomers
the aggregation, one exhibiting a lower FRET efficiency, and one resulting from the
conversion of these into more compact oligomers having a higher FRET efficiency. The
data generated using this method has been further analyzed by fitting it to a simple
kinetic model in which type A oligomers are first formed before being converted to type
B oligomers, both of which can grow in size via monomer addition. The kinetic
parameters determined from this fitting are analogous to those previously determined.
Overall, the developments have reduced the time required to analyze a dataset from three
hours to just over five minutes, allowing for greater time resolution, and also several
experiments to be run simultaneously on one instrument, since numerous samples can be
measured back-to-back within a short period of time.
The reduced time allows for further biophysical measurements to be made, and we
have shown that by diluting the oligomeric samples into distilled water, the earlier
formed lower FRET efficiency oligomers dissociate, possibly because of charge
repulsions destabilizing the oligomers being less shielded. This finding allows for the
isolation of the higher FRET efficiency, cytotoxic oligomeric species from a solution of
oligomers, simply by changing the ionic strength of the buffer. Our findings substantiate
the finding that there are two forms of oligomeric species generated when αS aggregates;
not only do they differ in FRET efficiency and susceptibility to proteinase-K digestion,
but they also behave differently when diluted into low ionic strength buffers.
Acknowledgements
M.H.H. and L.T. contributed equally to this work. M.H.H. thanks the Royal Society of
Chemistry (Analytical Chemistry Trust Fund) for his studentship. L.T. has been the
recipient of a grant PAT Post Doc Outgoing 2009 – 7th Framework Program Marie Curie
COFUND actions. A.J.D. is funded by the Schiff Foundation.
Supporting Information Available. Justification for choice of dyes, the
measurement parameters, details regarding the data analysis and modeling, and
individual oligomer FRET histograms at different ionic strengths are included here.
This material is available free of charge via the internet at http://pubs.acs.org
References
(1) Bertram, L.; Tanzi, R. E. J. Clin. Invest. 2005, 115 (6), 1449–1457. (2) Samii, A.; Nutt, J. G.; Ransom, B. R. Lancet 2004, 363 (9423), 1783–1793. (3) Jankovic, J. J. Neurol. Neurosurg. Psychiatry 2008, 79 (4), 368–376. (4) Spillantini, M. G.; Schmidt, M. L.; Lee, V. M.; Trojanowski, J. Q.; Jakes, R.;
Goedert, M. Nature 1997, 388 (6645), 839–840. (5) Noe, E.; Marder, K.; Bell, K. L.; Jacobs, D. M.; Manly, J. J.; Stern, Y. Mov.
Disord. Off. J. Mov. Disord. Soc. 2004, 19 (1), 60–67. (6) Lippa, C. F.; Schmidt, M. L.; Lee, V. M.; Trojanowski, J. Q. Ann. Neurol. 1999, 45
(3), 353–357. (7) Ahn, T.-B.; Kim, S. Y.; Kim, J. Y.; Park, S.-S.; Lee, D. S.; Min, H. J.; Kim, Y. K.;
Kim, S. E.; Kim, J.-M.; Kim, H.-J.; Cho, J.; Jeon, B. S. Neurology 2008, 70 (1), 43–49.
(8) Singleton, A. B.; Farrer, M.; Johnson, J.; Singleton, A.; Hague, S.; Kachergus, J.; Hulihan, M.; Peuralinna, T.; Dutra, A.; Nussbaum, R.; Lincoln, S.; Crawley, A.; Hanson, M.; Maraganore, D.; Adler, C.; Cookson, M. R.; Muenter, M.; Baptista, M.; Miller, D.; Blancato, J.; Hardy, J.; Gwinn-Hardy, K. Science 2003, 302 (5646), 841.
(9) Polymeropoulos, M. H.; Lavedan, C.; Leroy, E.; Ide, S. E.; Dehejia, A.; Dutra, A.; Pike, B.; Root, H.; Rubenstein, J.; Boyer, R.; Stenroos, E. S.; Chandrasekharappa, S.; Athanassiadou, A.; Papapetropoulos, T.; Johnson, W. G.; Lazzarini, A. M.; Duvoisin, R. C.; Di Iorio, G.; Golbe, L. I.; Nussbaum, R. L. Science 1997, 276 (5321), 2045–2047.
(10) Krüger, R.; Kuhn, W.; Müller, T.; Woitalla, D.; Graeber, M.; Kösel, S.; Przuntek, H.; Epplen, J. T.; Schöls, L.; Riess, O. Nat. Genet. 1998, 18 (2), 106–108.
(11) Zarranz, J. J.; Alegre, J.; Gómez-Esteban, J. C.; Lezcano, E.; Ros, R.; Ampuero, I.; Vidal, L.; Hoenicka, J.; Rodriguez, O.; Atarés, B.; Llorens, V.; Gomez Tortosa, E.; del Ser, T.; Muñoz, D. G.; de Yebenes, J. G. Ann. Neurol. 2004, 55 (2), 164–173.
(12) Ghosh, D.; Mondal, M.; Mohite, G. M.; Singh, P. K.; Ranjan, P.; Anoop, A.; Ghosh, S.; Jha, N. N.; Kumar, A.; Maji, S. K. Biochemistry (Mosc.) 2013, 52 (40), 6925–6927.
(13) Lesage, S.; Anheim, M.; Letournel, F.; Bousset, L.; Honoré, A.; Rozas, N.; Pieri, L.; Madiona, K.; Dürr, A.; Melki, R.; Verny, C.; Brice, A.; French Parkinson’s Disease Genetics Study Group. Ann. Neurol. 2013, 73 (4), 459–471.
(14) Conway, K. A.; Harper, J. D.; Lansbury, P. T. Biochemistry (Mosc.) 2000, 39 (10), 2552–2563.
(15) Winner, B.; Jappelli, R.; Maji, S. K.; Desplats, P. A.; Boyer, L.; Aigner, S.; Hetzer, C.; Loher, T.; Vilar, M.; Campioni, S.; Tzitzilonis, C.; Soragni, A.; Jessberger, S.; Mira, H.; Consiglio, A.; Pham, E.; Masliah, E.; Gage, F. H.; Riek, R. Proc. Natl. Acad. Sci. U. S. A. 2011, 108 (10), 4194–4199.
(16) Cremades, N.; Cohen, S. I. A.; Deas, E.; Abramov, A. Y.; Chen, A. Y.; Orte, A.; Sandal, M.; Clarke, R. W.; Dunne, P.; Aprile, F. A.; Bertoncini, C. W.; Wood, N. W.; Knowles, T. P. J.; Dobson, C. M.; Klenerman, D. Cell 2012, 149 (5), 1048–1059.
(17) Outeiro, T. F.; Putcha, P.; Tetzlaff, J. E.; Spoelgen, R.; Koker, M.; Carvalho, F.; Hyman, B. T.; McLean, P. J. PloS One 2008, 3 (4), e1867.
(18) Orte, A.; Birkett, N. R.; Clarke, R. W.; Devlin, G. L.; Dobson, C. M.; Klenerman, D. Proc. Natl. Acad. Sci. U. S. A. 2008, 105 (38), 14424–14429.
(19) Narayan, P.; Meehan, S.; Carver, J. A.; Wilson, M. R.; Dobson, C. M.; Klenerman, D. Biochemistry (Mosc.) 2012, 51 (46), 9270–9276.
(20) Narayan, P.; Holmström, K. M.; Kim, D.-H.; Whitcomb, D. J.; Wilson, M. R.; St. George-Hyslop, P.; Wood, N. W.; Dobson, C. M.; Cho, K.; Abramov, A. Y.; Klenerman, D. Biochemistry (Mosc.) 2014, 53 (15), 2442–2453.
(21) Uversky, V. N.; Li, J.; Fink, A. L. J. Biol. Chem. 2001, 276 (14), 10737–10744. (22) Uversky, V. N.; Li, J.; Fink, A. L. J. Biol. Chem. 2001, 276 (47), 44284–44296. (23) Horrocks, M. H.; Li, H.; Shim, J.-U.; Ranasinghe, R. T.; Clarke, R. W.; Huck, W.
T. S.; Abell, C.; Klenerman, D. Anal. Chem. 2012, 84 (1), 179–185. (24) Clarke, R. W.; Orte, A.; Klenerman, D. Anal. Chem. 2007, 79 (7), 2771–2777. (25) Munishkina, L. A.; Henriques, J.; Uversky, V. N.; Fink, A. L. Biochemistry
(Mosc.) 2004, 43 (11), 3289–3300. (26) Hoyer, W.; Antony, T.; Cherny, D.; Heim, G.; Jovin, T. M.; Subramaniam, V. J.
Mol. Biol. 2002, 322 (2), 383–393. (27) Dedmon, M. M.; Lindorff-Larsen, K.; Christodoulou, J.; Vendruscolo, M.;
Dobson, C. M. J. Am. Chem. Soc. 2005, 127 (2), 476–477.
MATERIALS AND METHODS
Protein expression and purification. BL21(DE3) Gold cells (Stratagene) were
transformed with the Cys mutant A90C. Starters were diluted into Overnight Express™
Instant TB Medium (Novagen) supplemented with 1% glycerol and left to grow for 16-18
h at 30°C. Following this, cells were harvested and the protein purified as previously
published16.
Device fabrication. Microfluidic channels were fabricated using standard soft-
lithography techniques into polydimethylsiloxane (PDMS; Dow Corning) with SU-8
photoresist on silicon masters, as described previously23. The channels were plasma-
bonded to glass coverslides (V.W.R., thickness = 1) to create sealed devices. The channel
height was 25 µm. Each device was inspected on a white-light microscope (Nikon Ti-U),
and only those without dust or aberrations were used.
Protein labeling. The Cys variant of wild-type αS was labeled as reported previously16.
Life Technologies Alexa Fluor 488 C5 maleimide (AF488) and Alexa Fluor 594 C5
maleimide (AF594) were used in these reactions. Labeled protein was isolated from
unreacted dye using the method reported in Cremades et al., 201216. The reaction yield
was checked by mass spectrometry for all reactions, and all labeling reactions with a
yield lower than 90% were discarded.
Single-molecule fluorescence measurements of aggregating αS. A 70 µM solution
made up of equimolar concentrations of AF488 and AF594 labeled αS was prepared in
25 mM Tris-HCl, pH 7.4, 100 mM NaCl. The buffer was freshly prepared before each
experiment, and passed through a 0.02 µm syringe filter (Anotop, Whatman) to remove
insoluble contaminants. The aggregation mixture was supplemented with 0.01% NaN3 to
prevent bacterial growth, and was then incubated at 37oC with orbital shaking at 200
r.p.m. (25 mm orbital diameter). Regular time-points were taken throughout the course of
the aggregation and were immediately diluted by a factor of 1:250,000 (in two stages)
before being loaded into a 200 µL gel-loading tip (Life technologies, Carlsbad, CA,
USA) attached to the inlet port of a microfluidic channel (25 µm in height, 100 µm in
width, 1 cm in length) mounted onto the single-molecule confocal microscope. The
confocal volume was focused 10 µm into the center of the channel, and the solution was
passed through the channel at an average velocity of 2 cm/s by applying a negative
pressure, which was generated using a syringe pump (Harvard apparatus, Holliston, MA,
USA) attached to the outlet port via Fine Bore Polyethylene Tubing (0.38 mm inner-
diameter, 1.09 mm outer-diameter; Smiths Medical International, Hythe, Kent, UK).
Before adding the gel-loading tip, and withdrawing the sample, the syringe, tubing and
microfluidic channel were first filled with buffer and any air-bubbles were purged from
the system. After the appearance of single-molecule bursts corresponding to labeled αs
passing through the confocal volume, the sample was measured for 400 s. There was no
noticeable decrease in the event-rate over the duration of the measurement, suggesting
that any surface absorbance does not affect the measurement.
Single-molecule instrumentation. A Gaussian laser beam at a wavelength of 488 nm
was first attenuated using neutral density filters, and passed through a spatial filter to
before being directed through the back-port of an inverted microscope (Nikon Ti-U). A
dichroic mirror (Di01-R405/488/594 Semrock) reflected the laser light through an oil-
immersion objective (Nikon CFI Plan Apochromat VC 60X Oil N2 NA 1.4, W.D 0.13
mm), which focuses it to a diffraction-limited confocal spot within the sample being
studied. The emitted fluorescence was collected by the same objective and passed
through the dichroic, before being focused by a tube lens within the microscope body
through a 50 µm pinhole (Thorlabs). A second dichroic (585DRLP Horiba) then separates
the fluorescence from the two different fluorophores; the longer wavelength passes
through the dichroic and was focused by a lens (Plano apo convex, focal length = 50 mm,
Thorlabs) through a band pass filter (FF01-629/53) onto the Avalanche Photodiode
(APD) detector. The shorter wavelength was reflected by the dichroic and is focused
through a second set of filters (535AF55 Horiba, 540LP Omega) onto the second APD.
Outputs from the two APDs are connected to a custom-programmed field-programmable
gate array, FPGA (Colexica), which counts the signals and combines them into time-bins,
which are selected according to the expected residence time of molecules traveling
through the confocal volume.
Stability in different ionic strength solutions. To determine the stability of different
samples of αS oligomers with respect to varying ionic strength, the solution of αS was
diluted by a factor of 1:250,000 into a 5 mM tris buffer (pH 7.4) containing a range of
NaCl concentrations (from 0 to 100 mM). The diluted sample was then immediately
analyzed on the single-molecule confocal instrument.