Page 1
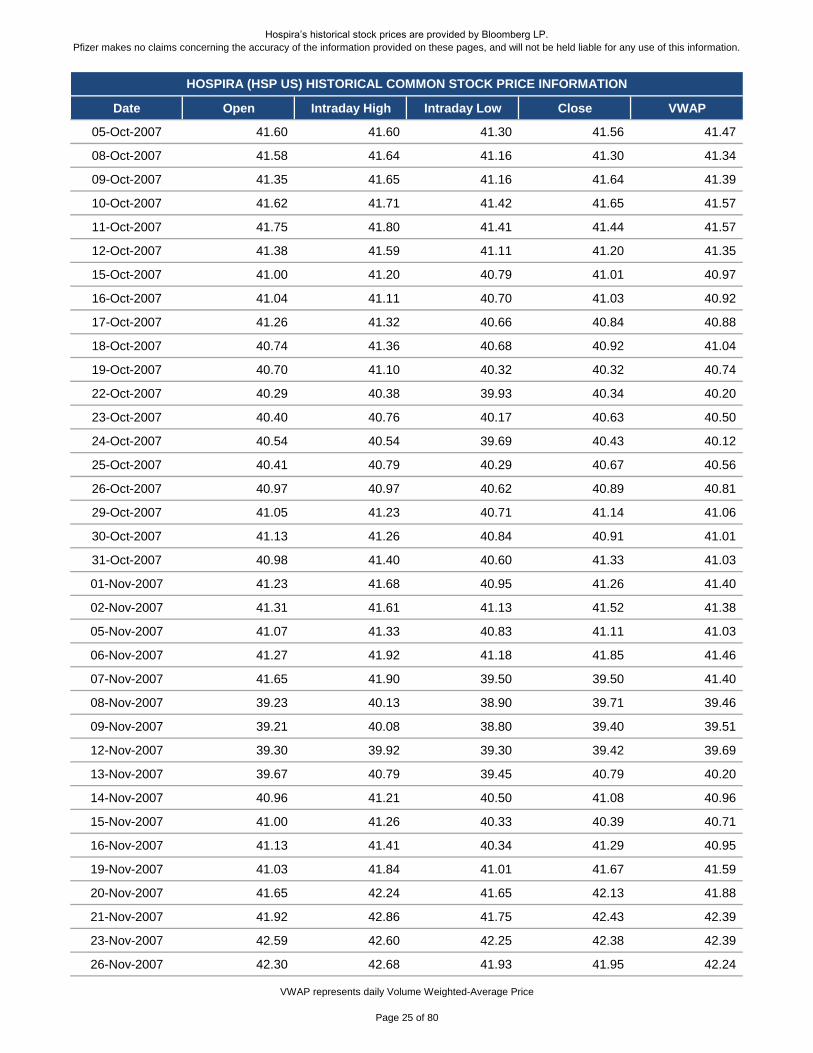
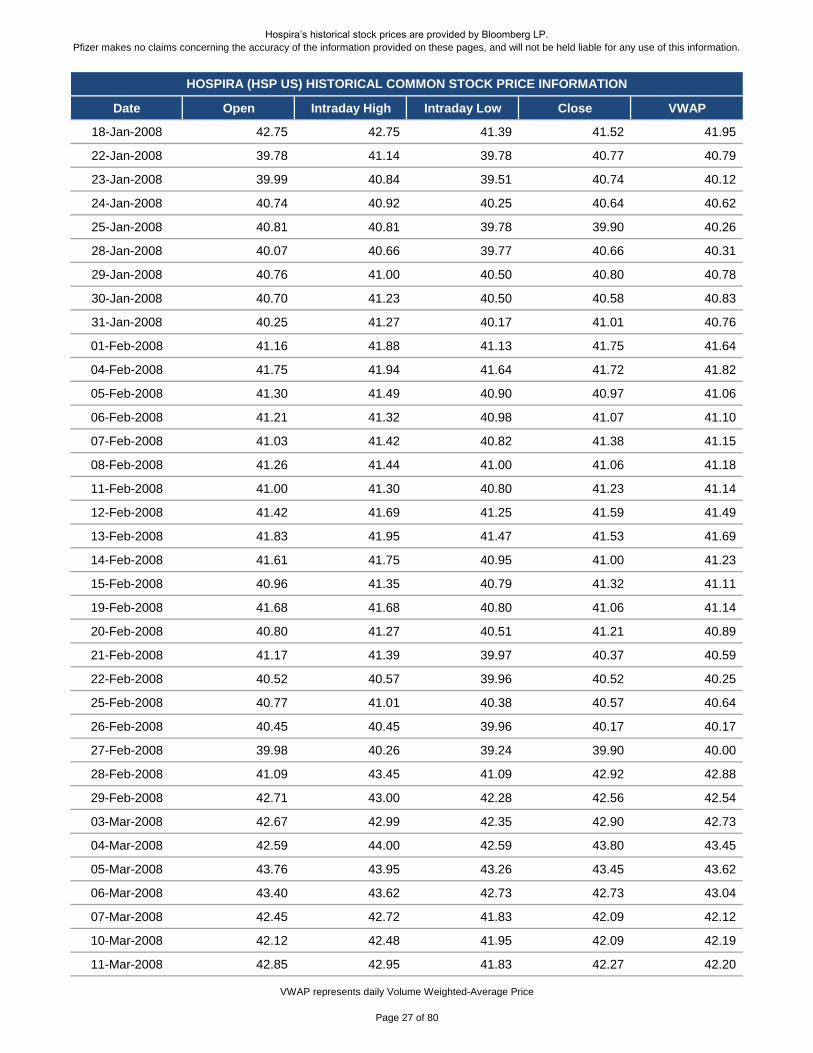
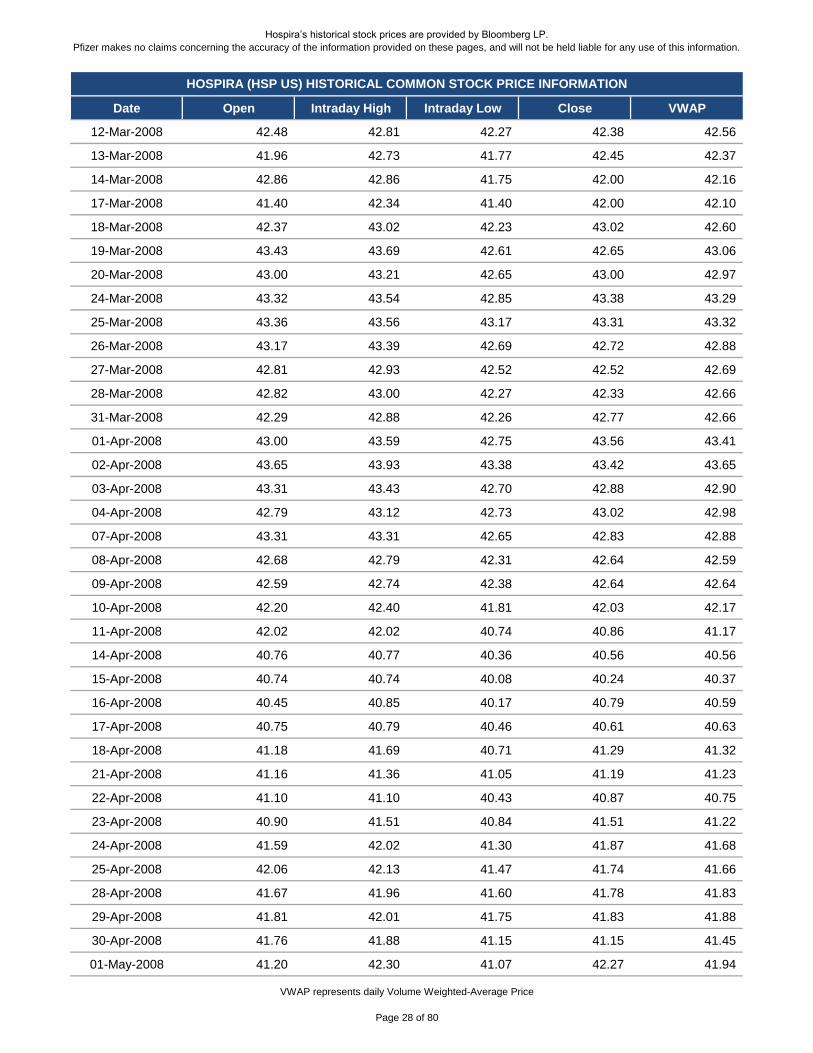
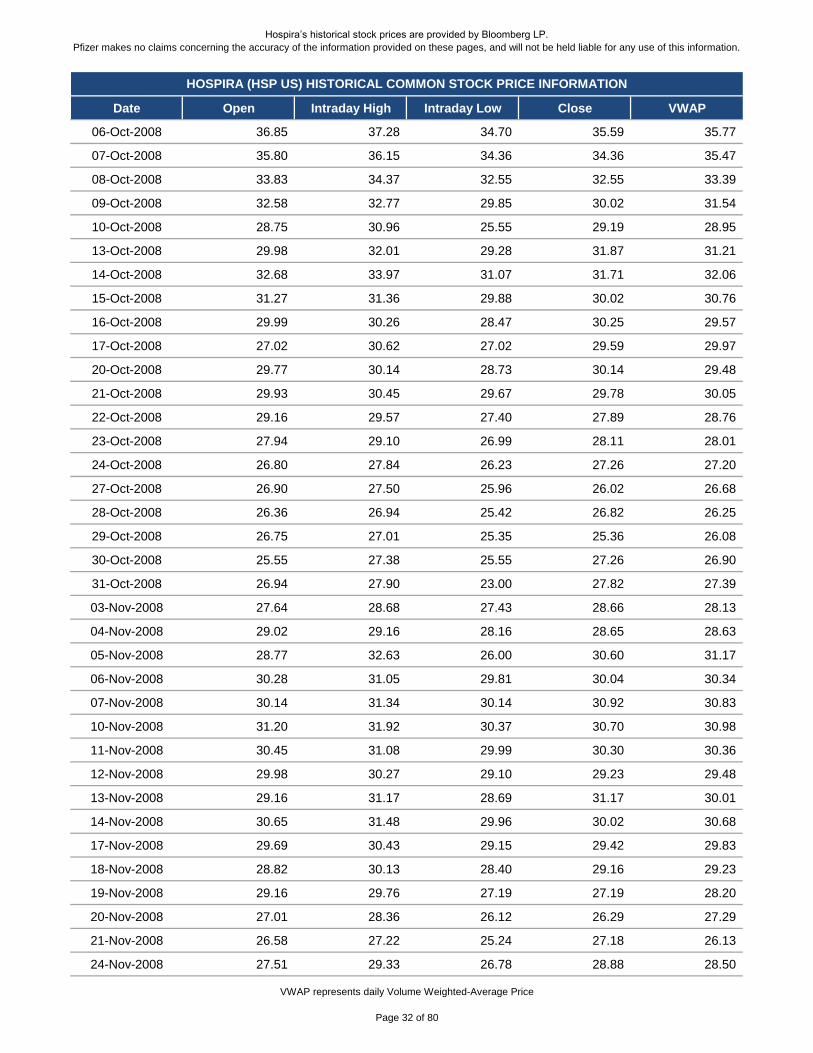
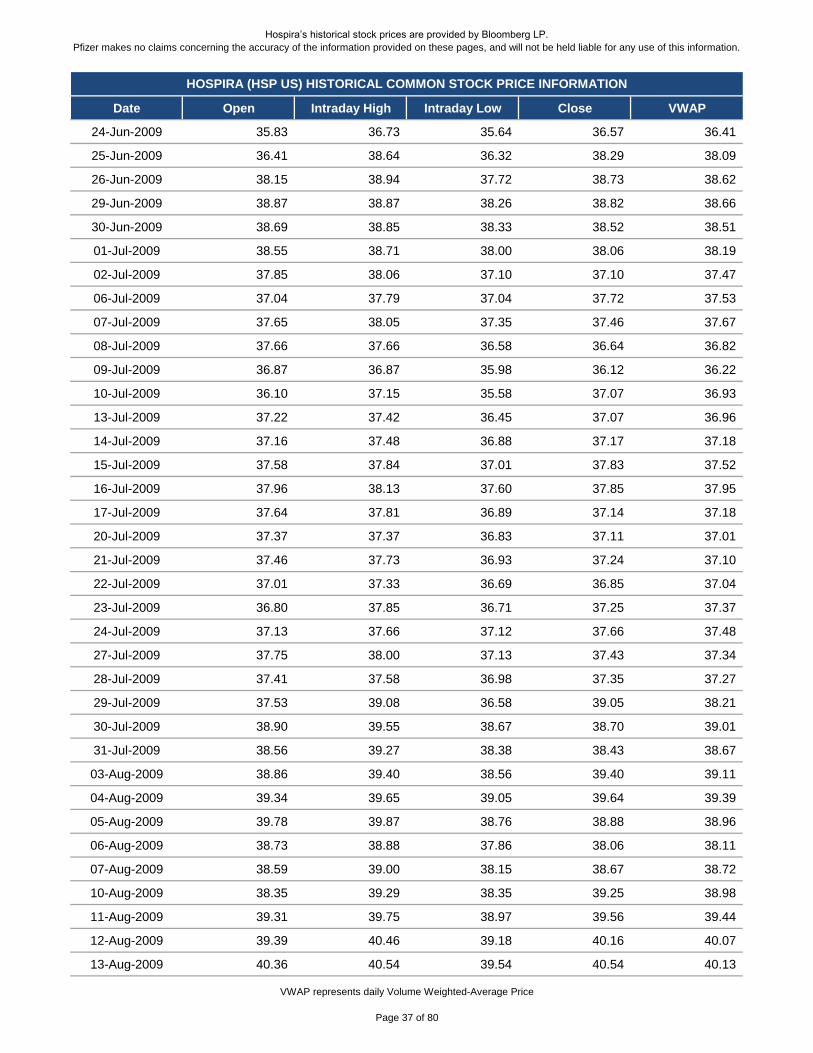
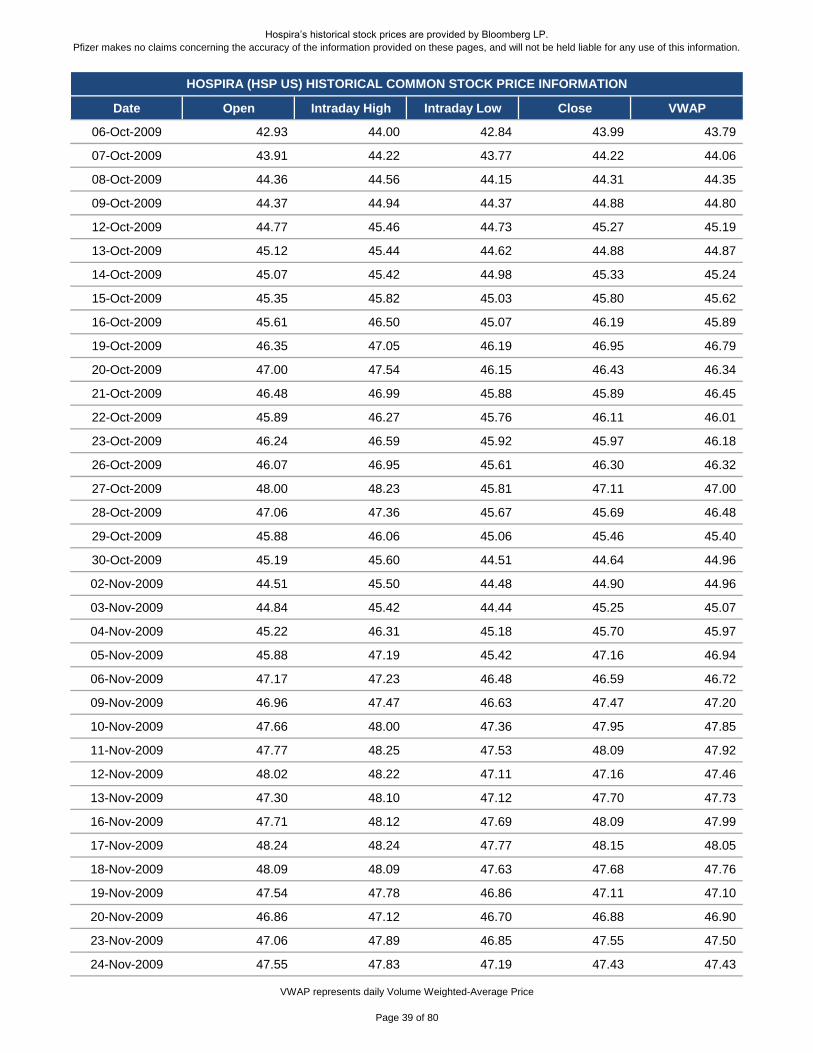
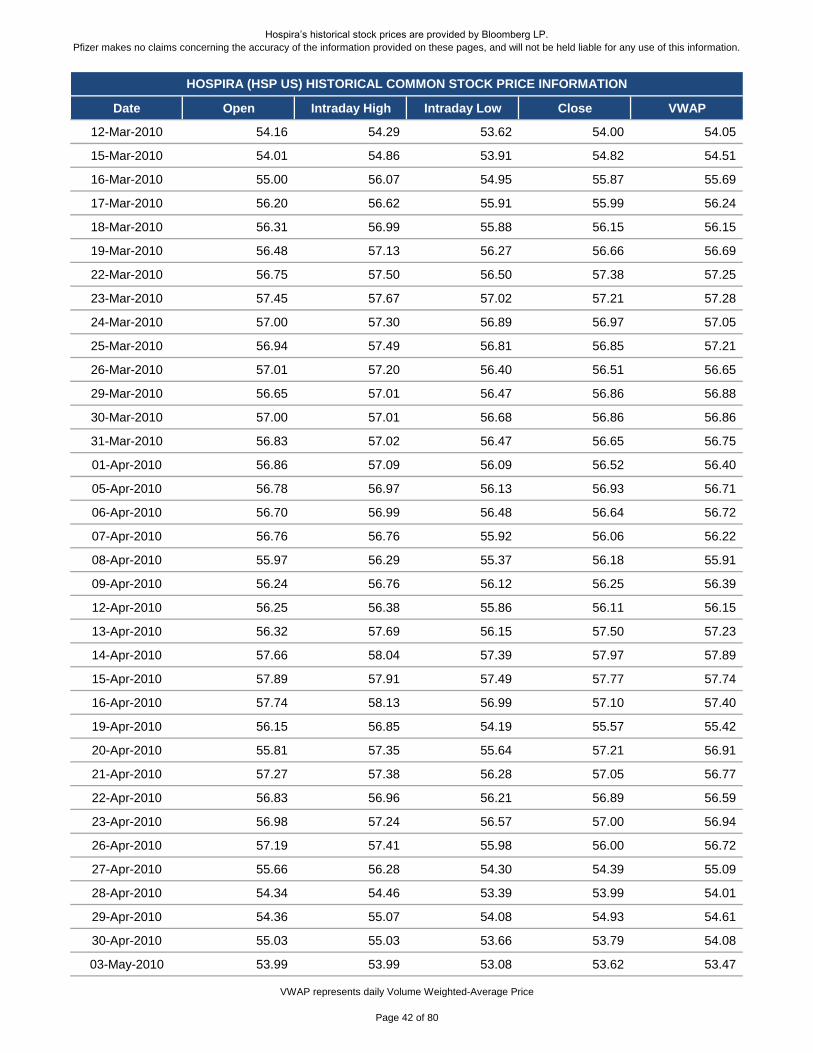
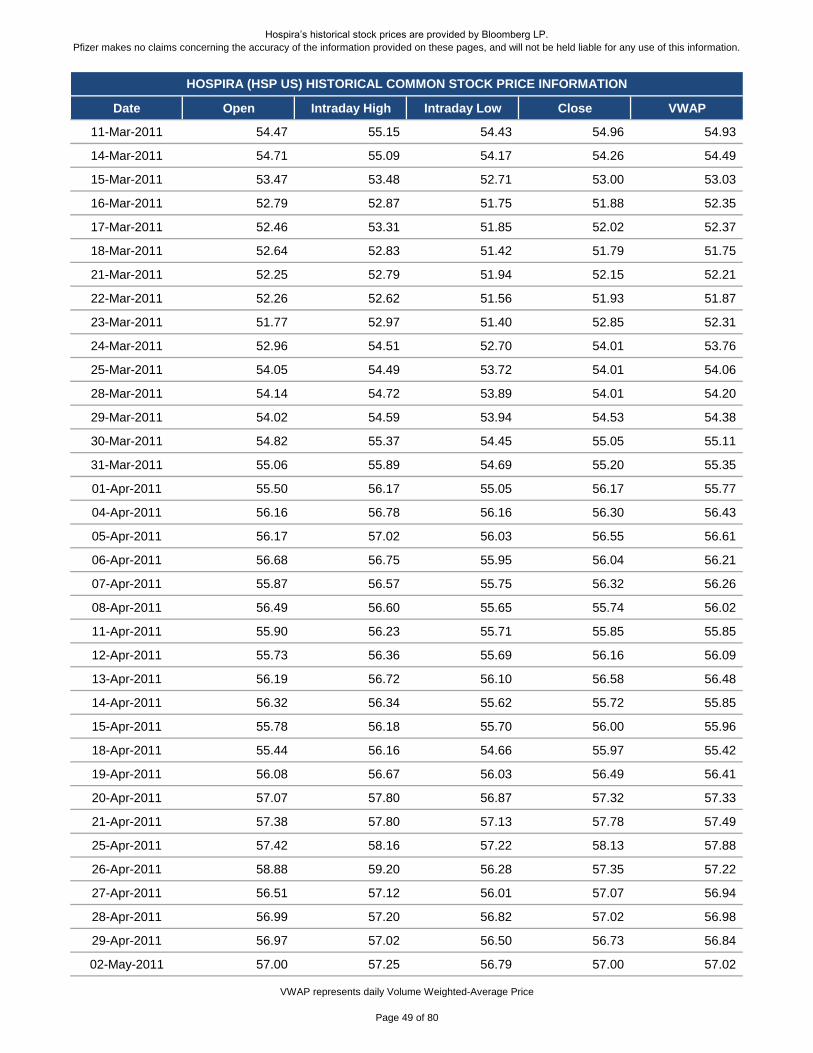
Hospira’s historical stock prices are provided by Bloomberg LP.
Pfizer makes no claims concerning the accuracy of the information provided on these pages, and will not be held liable for any use of this information.
Date Open Intraday High Intraday Low Close VWAP
30-Apr-2004 28.35 29.00 28.20 28.46 28.55
03-May-2004 28.50 28.70 26.80 27.04 27.21
04-May-2004 26.90 26.99 26.00 26.00 26.38
05-May-2004 26.05 26.69 26.00 26.35 26.34
06-May-2004 26.31 26.35 26.05 26.26 26.17
07-May-2004 26.10 26.79 26.07 26.66 26.56
10-May-2004 26.40 26.95 26.25 26.91 26.56
11-May-2004 26.90 27.40 26.79 26.86 27.06
12-May-2004 26.60 26.76 26.25 26.60 26.46
13-May-2004 26.48 26.55 26.28 26.40 26.39
14-May-2004 26.25 26.48 25.97 26.40 26.19
17-May-2004 26.10 26.85 26.05 26.58 26.58
18-May-2004 26.65 26.73 26.36 26.49 26.49
19-May-2004 26.45 26.70 26.36 26.50 26.51
20-May-2004 26.45 26.45 26.11 26.20 26.25
21-May-2004 26.20 26.33 25.60 25.65 26.13
24-May-2004 25.65 25.90 24.88 25.38 25.30
25-May-2004 25.15 25.75 25.06 25.44 25.32
26-May-2004 25.31 26.15 25.26 25.86 25.71
27-May-2004 25.85 26.19 25.62 25.98 25.79
28-May-2004 25.85 25.95 25.30 25.64 25.60
01-Jun-2004 25.54 25.69 25.33 25.55 25.49
02-Jun-2004 25.55 25.79 25.27 25.61 25.54
03-Jun-2004 25.52 25.78 25.44 25.70 25.57
04-Jun-2004 25.65 26.50 25.50 26.50 25.90
07-Jun-2004 26.63 27.23 26.42 27.15 26.82
08-Jun-2004 27.01 28.90 26.68 28.60 27.75
09-Jun-2004 28.50 29.28 27.96 27.96 28.66
10-Jun-2004 27.50 27.82 27.15 27.25 27.40
14-Jun-2004 26.60 26.91 26.50 26.81 26.68
15-Jun-2004 26.65 27.25 26.65 27.25 26.87
16-Jun-2004 27.25 27.75 27.00 27.74 27.50
17-Jun-2004 27.55 28.14 27.00 28.00 27.71
18-Jun-2004 27.85 28.15 27.78 28.13 28.01
21-Jun-2004 28.00 28.09 26.95 27.13 27.68
22-Jun-2004 27.10 27.28 26.92 27.10 27.08
HOSPIRA (HSP US) HISTORICAL COMMON STOCK PRICE INFORMATION
VWAP represents daily Volume Weighted-Average Price
Page 1 of 80
Page 2
Hospira’s historical stock prices are provided by Bloomberg LP.
Pfizer makes no claims concerning the accuracy of the information provided on these pages, and will not be held liable for any use of this information.
Date Open Intraday High Intraday Low Close VWAP
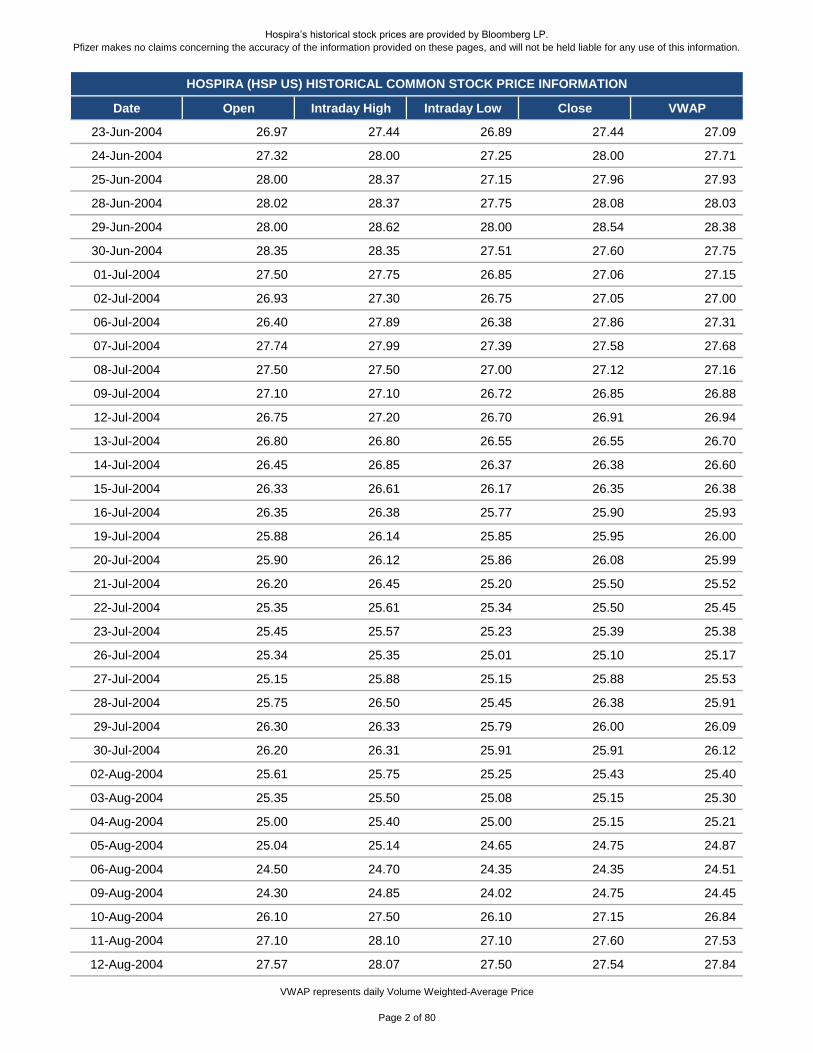
HOSPIRA (HSP US) HISTORICAL COMMON STOCK PRICE INFORMATION
23-Jun-2004 26.97 27.44 26.89 27.44 27.09
24-Jun-2004 27.32 28.00 27.25 28.00 27.71
25-Jun-2004 28.00 28.37 27.15 27.96 27.93
28-Jun-2004 28.02 28.37 27.75 28.08 28.03
29-Jun-2004 28.00 28.62 28.00 28.54 28.38
30-Jun-2004 28.35 28.35 27.51 27.60 27.75
01-Jul-2004 27.50 27.75 26.85 27.06 27.15
02-Jul-2004 26.93 27.30 26.75 27.05 27.00
06-Jul-2004 26.40 27.89 26.38 27.86 27.31
07-Jul-2004 27.74 27.99 27.39 27.58 27.68
08-Jul-2004 27.50 27.50 27.00 27.12 27.16
09-Jul-2004 27.10 27.10 26.72 26.85 26.88
12-Jul-2004 26.75 27.20 26.70 26.91 26.94
13-Jul-2004 26.80 26.80 26.55 26.55 26.70
14-Jul-2004 26.45 26.85 26.37 26.38 26.60
15-Jul-2004 26.33 26.61 26.17 26.35 26.38
16-Jul-2004 26.35 26.38 25.77 25.90 25.93
19-Jul-2004 25.88 26.14 25.85 25.95 26.00
20-Jul-2004 25.90 26.12 25.86 26.08 25.99
21-Jul-2004 26.20 26.45 25.20 25.50 25.52
22-Jul-2004 25.35 25.61 25.34 25.50 25.45
23-Jul-2004 25.45 25.57 25.23 25.39 25.38
26-Jul-2004 25.34 25.35 25.01 25.10 25.17
27-Jul-2004 25.15 25.88 25.15 25.88 25.53
28-Jul-2004 25.75 26.50 25.45 26.38 25.91
29-Jul-2004 26.30 26.33 25.79 26.00 26.09
30-Jul-2004 26.20 26.31 25.91 25.91 26.12
02-Aug-2004 25.61 25.75 25.25 25.43 25.40
03-Aug-2004 25.35 25.50 25.08 25.15 25.30
04-Aug-2004 25.00 25.40 25.00 25.15 25.21
05-Aug-2004 25.04 25.14 24.65 24.75 24.87
06-Aug-2004 24.50 24.70 24.35 24.35 24.51
09-Aug-2004 24.30 24.85 24.02 24.75 24.45
10-Aug-2004 26.10 27.50 26.10 27.15 26.84
11-Aug-2004 27.10 28.10 27.10 27.60 27.53
12-Aug-2004 27.57 28.07 27.50 27.54 27.84
VWAP represents daily Volume Weighted-Average Price
Page 2 of 80
Page 3
Hospira’s historical stock prices are provided by Bloomberg LP.
Pfizer makes no claims concerning the accuracy of the information provided on these pages, and will not be held liable for any use of this information.
Date Open Intraday High Intraday Low Close VWAP
HOSPIRA (HSP US) HISTORICAL COMMON STOCK PRICE INFORMATION
13-Aug-2004 27.51 28.03 27.50 27.91 27.78
16-Aug-2004 27.85 28.58 27.85 28.26 28.36
17-Aug-2004 28.33 28.81 28.03 28.10 28.31
18-Aug-2004 28.00 28.04 27.82 27.92 27.92
19-Aug-2004 27.92 28.07 27.75 27.80 27.88
20-Aug-2004 27.80 27.99 27.33 27.85 27.71
23-Aug-2004 27.83 28.14 27.54 27.60 27.87
24-Aug-2004 27.65 27.86 27.20 27.34 27.45
25-Aug-2004 27.31 27.68 27.30 27.52 27.52
26-Aug-2004 27.07 28.26 27.07 28.26 27.80
27-Aug-2004 28.20 28.54 28.05 28.23 28.27
30-Aug-2004 28.23 28.23 27.47 27.55 27.77
31-Aug-2004 27.30 27.80 27.26 27.70 27.57
01-Sep-2004 27.65 27.96 27.42 27.63 27.60
02-Sep-2004 27.55 27.70 27.35 27.59 27.54
03-Sep-2004 27.60 28.33 27.56 28.05 28.03
07-Sep-2004 28.10 29.14 28.10 28.95 28.82
08-Sep-2004 28.96 28.96 28.33 28.33 28.68
09-Sep-2004 28.40 29.10 28.18 28.90 28.82
10-Sep-2004 28.81 29.23 28.58 29.11 28.84
13-Sep-2004 29.06 29.72 28.79 28.80 29.15
14-Sep-2004 28.84 29.20 28.73 28.93 28.96
15-Sep-2004 28.95 29.49 28.90 29.21 29.26
16-Sep-2004 29.14 29.43 28.53 28.80 28.80
17-Sep-2004 29.00 29.45 28.79 29.41 29.12
20-Sep-2004 29.21 29.81 29.18 29.80 29.56
21-Sep-2004 29.75 30.30 29.67 30.12 30.03
22-Sep-2004 30.04 30.26 29.72 30.26 30.05
23-Sep-2004 29.90 30.48 29.87 30.45 30.18
24-Sep-2004 30.10 31.09 30.02 31.07 30.77
27-Sep-2004 31.10 31.15 30.24 30.34 30.49
28-Sep-2004 30.34 30.74 30.32 30.62 30.49
29-Sep-2004 30.62 30.91 30.62 30.85 30.76
30-Sep-2004 30.75 30.91 30.45 30.60 30.64
01-Oct-2004 30.44 30.78 30.28 30.55 30.63
04-Oct-2004 30.26 30.63 29.40 29.60 29.76
VWAP represents daily Volume Weighted-Average Price
Page 3 of 80
Page 4
Hospira’s historical stock prices are provided by Bloomberg LP.
Pfizer makes no claims concerning the accuracy of the information provided on these pages, and will not be held liable for any use of this information.
Date Open Intraday High Intraday Low Close VWAP
HOSPIRA (HSP US) HISTORICAL COMMON STOCK PRICE INFORMATION
05-Oct-2004 29.50 30.08 29.43 30.08 29.86
06-Oct-2004 29.99 30.19 29.80 29.96 29.93
07-Oct-2004 29.71 29.89 29.52 29.83 29.71
08-Oct-2004 29.60 29.66 28.90 29.34 29.28
11-Oct-2004 29.34 30.07 29.34 29.96 29.77
12-Oct-2004 29.70 30.12 29.65 30.05 29.90
13-Oct-2004 30.01 30.07 29.64 29.86 29.80
14-Oct-2004 29.76 30.06 29.74 29.98 29.93
15-Oct-2004 30.02 30.09 29.65 30.09 29.94
18-Oct-2004 29.60 30.48 29.50 30.39 30.06
19-Oct-2004 30.39 30.62 29.55 29.61 30.10
20-Oct-2004 29.40 30.27 29.30 30.25 29.79
21-Oct-2004 30.35 30.58 30.11 30.11 30.37
22-Oct-2004 29.90 30.43 29.70 29.81 29.94
25-Oct-2004 29.75 30.59 29.43 30.58 30.22
26-Oct-2004 30.50 31.70 30.50 31.70 31.12
27-Oct-2004 31.75 32.09 31.53 31.82 31.89
28-Oct-2004 31.70 31.97 31.30 31.92 31.71
29-Oct-2004 31.85 31.91 31.41 31.91 31.71
01-Nov-2004 32.04 32.05 31.65 31.69 31.87
02-Nov-2004 31.64 31.64 31.18 31.21 31.38
03-Nov-2004 31.60 32.41 31.59 32.35 32.10
04-Nov-2004 32.45 32.80 31.92 32.73 32.45
05-Nov-2004 32.25 32.64 31.66 32.11 32.08
08-Nov-2004 32.11 33.03 31.80 32.80 32.51
09-Nov-2004 33.00 34.32 30.43 30.97 32.17
10-Nov-2004 30.70 31.65 30.57 31.18 31.14
11-Nov-2004 31.35 31.76 31.29 31.56 31.50
12-Nov-2004 31.45 32.35 31.45 32.15 31.96
15-Nov-2004 31.85 32.25 31.65 31.81 31.96
16-Nov-2004 31.68 32.57 31.62 32.25 32.35
17-Nov-2004 32.10 32.63 31.95 31.99 32.22
18-Nov-2004 31.90 32.62 31.87 32.37 32.39
19-Nov-2004 32.38 32.38 32.06 32.16 32.19
22-Nov-2004 31.90 32.25 31.75 32.09 32.00
23-Nov-2004 32.09 32.23 31.48 31.75 31.69
VWAP represents daily Volume Weighted-Average Price
Page 4 of 80
Page 5
Hospira’s historical stock prices are provided by Bloomberg LP.
Pfizer makes no claims concerning the accuracy of the information provided on these pages, and will not be held liable for any use of this information.
Date Open Intraday High Intraday Low Close VWAP
HOSPIRA (HSP US) HISTORICAL COMMON STOCK PRICE INFORMATION
24-Nov-2004 31.78 32.24 31.78 32.00 32.09
26-Nov-2004 31.70 32.35 31.65 32.25 32.19
29-Nov-2004 32.25 32.45 31.85 32.00 32.08
30-Nov-2004 31.75 32.44 31.68 32.23 32.10
01-Dec-2004 32.30 32.40 32.02 32.24 32.23
02-Dec-2004 32.24 32.35 31.59 31.73 31.89
03-Dec-2004 31.66 32.56 31.66 32.54 32.23
06-Dec-2004 32.30 33.07 32.18 32.91 32.80
07-Dec-2004 32.91 33.20 32.32 32.47 32.70
08-Dec-2004 32.47 33.86 32.47 33.20 33.19
09-Dec-2004 32.65 34.05 32.42 33.91 33.36
10-Dec-2004 34.86 34.86 33.39 33.79 33.67
13-Dec-2004 33.65 33.93 33.34 33.45 33.50
14-Dec-2004 33.30 33.53 32.64 33.20 33.32
15-Dec-2004 33.20 33.59 32.82 33.57 33.25
16-Dec-2004 33.50 33.74 33.32 33.42 33.51
17-Dec-2004 33.00 33.36 32.92 32.92 33.02
20-Dec-2004 32.95 33.40 32.79 33.03 33.02
21-Dec-2004 32.80 32.90 32.75 32.90 32.80
22-Dec-2004 32.95 33.31 32.76 33.06 33.01
23-Dec-2004 33.12 33.35 33.00 33.16 33.19
27-Dec-2004 33.11 33.52 33.05 33.40 33.39
28-Dec-2004 33.30 33.45 33.10 33.36 33.34
29-Dec-2004 33.36 33.55 33.25 33.39 33.40
30-Dec-2004 33.39 33.66 33.35 33.55 33.53
31-Dec-2004 33.55 33.67 33.29 33.50 33.49
03-Jan-2005 33.30 33.31 32.97 33.08 33.09
04-Jan-2005 33.08 33.18 32.42 32.43 32.84
05-Jan-2005 32.20 32.24 31.49 31.51 31.85
06-Jan-2005 31.40 32.00 31.27 31.87 31.74
07-Jan-2005 32.20 32.63 32.06 32.62 32.38
10-Jan-2005 32.40 32.58 31.93 32.20 32.25
11-Jan-2005 32.00 32.49 31.81 31.90 32.00
12-Jan-2005 31.95 32.41 31.84 32.38 32.08
13-Jan-2005 32.20 32.50 32.05 32.23 32.25
14-Jan-2005 32.20 32.61 32.20 32.60 32.48
VWAP represents daily Volume Weighted-Average Price
Page 5 of 80
Page 6
Hospira’s historical stock prices are provided by Bloomberg LP.
Pfizer makes no claims concerning the accuracy of the information provided on these pages, and will not be held liable for any use of this information.
Date Open Intraday High Intraday Low Close VWAP
HOSPIRA (HSP US) HISTORICAL COMMON STOCK PRICE INFORMATION
18-Jan-2005 32.20 32.20 31.81 32.01 31.97
19-Jan-2005 31.90 32.30 31.60 31.68 31.79
20-Jan-2005 31.40 31.67 31.35 31.67 31.52
21-Jan-2005 31.57 31.57 30.62 31.18 31.17
24-Jan-2005 31.10 31.10 30.67 30.79 30.84
25-Jan-2005 31.00 31.24 30.50 30.85 30.93
26-Jan-2005 30.85 31.18 30.80 31.12 30.99
27-Jan-2005 31.12 31.51 31.10 31.43 31.32
28-Jan-2005 31.30 31.50 31.02 31.48 31.27
31-Jan-2005 29.75 29.75 28.60 28.89 29.13
01-Feb-2005 28.88 29.82 28.88 29.55 29.56
02-Feb-2005 29.70 29.85 29.38 29.55 29.54
03-Feb-2005 29.57 29.93 28.92 29.00 29.28
04-Feb-2005 29.07 29.38 28.64 28.70 28.88
07-Feb-2005 28.63 29.00 28.43 28.45 28.68
08-Feb-2005 29.02 29.02 28.47 28.51 28.68
09-Feb-2005 28.51 29.03 28.35 28.95 28.72
10-Feb-2005 29.15 29.20 28.55 28.65 28.79
11-Feb-2005 28.72 29.67 28.66 29.28 29.26
14-Feb-2005 29.35 29.43 29.11 29.30 29.28
15-Feb-2005 29.35 30.12 29.20 29.83 29.82
16-Feb-2005 29.83 30.04 29.36 29.85 29.86
17-Feb-2005 29.90 30.00 29.51 29.83 29.83
18-Feb-2005 29.84 29.90 29.40 29.70 29.70
22-Feb-2005 29.62 29.84 29.45 29.49 29.57
23-Feb-2005 29.57 30.00 29.49 29.80 29.83
24-Feb-2005 29.83 29.98 29.43 29.88 29.73
25-Feb-2005 29.75 30.20 29.66 30.06 30.01
28-Feb-2005 30.00 30.10 29.20 29.60 29.61
01-Mar-2005 29.45 30.30 29.20 29.85 30.03
02-Mar-2005 29.90 32.37 29.71 31.86 31.31
03-Mar-2005 31.55 31.73 31.02 31.15 31.34
04-Mar-2005 31.50 31.81 31.25 31.71 31.59
07-Mar-2005 31.67 31.86 31.50 31.73 31.70
08-Mar-2005 31.45 32.16 31.35 32.01 31.89
09-Mar-2005 31.90 32.20 31.49 32.05 31.92
VWAP represents daily Volume Weighted-Average Price
Page 6 of 80
Page 7
Hospira’s historical stock prices are provided by Bloomberg LP.
Pfizer makes no claims concerning the accuracy of the information provided on these pages, and will not be held liable for any use of this information.
Date Open Intraday High Intraday Low Close VWAP
HOSPIRA (HSP US) HISTORICAL COMMON STOCK PRICE INFORMATION
10-Mar-2005 31.90 32.06 31.67 32.06 31.95
11-Mar-2005 31.99 32.12 31.85 31.92 32.04
14-Mar-2005 31.76 32.19 31.62 32.16 31.85
15-Mar-2005 32.25 32.25 31.79 31.89 31.99
16-Mar-2005 31.55 31.99 30.94 31.20 31.22
17-Mar-2005 31.15 31.25 30.82 31.15 31.13
18-Mar-2005 30.93 31.10 30.64 31.06 30.92
21-Mar-2005 31.06 31.35 30.60 31.18 31.00
22-Mar-2005 30.86 31.17 30.63 30.78 30.94
23-Mar-2005 30.90 31.74 30.82 31.27 31.48
24-Mar-2005 31.26 31.52 31.05 31.28 31.33
28-Mar-2005 31.22 31.93 30.88 31.93 31.58
29-Mar-2005 31.75 32.65 31.31 32.39 32.26
30-Mar-2005 32.30 32.34 31.89 32.30 32.13
31-Mar-2005 32.10 32.30 31.95 32.27 32.19
01-Apr-2005 32.25 32.52 31.90 32.11 32.21
04-Apr-2005 32.07 32.17 31.67 31.92 32.02
05-Apr-2005 31.85 32.29 31.75 32.24 32.18
06-Apr-2005 32.20 32.68 32.10 32.47 32.52
07-Apr-2005 32.39 32.59 32.18 32.49 32.40
08-Apr-2005 32.40 32.60 32.22 32.36 32.39
11-Apr-2005 32.36 33.16 32.36 33.10 32.86
12-Apr-2005 33.00 33.40 32.79 33.34 33.17
13-Apr-2005 33.21 33.60 33.04 33.09 33.27
14-Apr-2005 33.00 33.30 32.68 33.03 33.07
15-Apr-2005 32.86 33.27 32.75 33.09 33.06
18-Apr-2005 33.42 33.50 32.64 33.00 32.98
19-Apr-2005 32.94 33.90 32.72 33.33 33.44
20-Apr-2005 33.35 33.91 33.18 33.35 33.63
21-Apr-2005 33.55 34.36 33.45 34.30 33.96
22-Apr-2005 34.05 34.15 33.44 33.70 33.89
25-Apr-2005 33.75 34.14 33.69 33.85 33.92
26-Apr-2005 33.75 34.50 33.75 33.80 34.11
27-Apr-2005 33.65 34.36 33.54 34.30 33.99
28-Apr-2005 34.05 34.05 32.95 32.97 33.48
29-Apr-2005 33.25 33.66 32.96 33.55 33.41
VWAP represents daily Volume Weighted-Average Price
Page 7 of 80
Page 8
Hospira’s historical stock prices are provided by Bloomberg LP.
Pfizer makes no claims concerning the accuracy of the information provided on these pages, and will not be held liable for any use of this information.
Date Open Intraday High Intraday Low Close VWAP
HOSPIRA (HSP US) HISTORICAL COMMON STOCK PRICE INFORMATION
02-May-2005 33.15 33.15 32.35 32.70 32.68
03-May-2005 32.65 32.91 32.39 32.59 32.61
04-May-2005 32.40 33.32 32.40 33.32 33.02
05-May-2005 33.22 33.50 32.89 33.08 33.23
06-May-2005 33.20 33.39 32.64 32.69 32.93
09-May-2005 32.57 32.68 32.26 32.68 32.47
10-May-2005 32.60 32.97 32.54 32.59 32.74
11-May-2005 32.59 33.35 32.40 33.20 32.76
12-May-2005 34.45 36.25 34.25 35.53 35.13
13-May-2005 35.30 35.84 34.32 34.69 35.00
16-May-2005 34.77 36.10 34.74 35.84 35.57
17-May-2005 35.70 36.12 35.65 35.73 35.86
18-May-2005 35.82 36.00 35.35 35.40 35.51
19-May-2005 35.40 35.80 35.29 35.80 35.60
20-May-2005 35.94 37.50 35.26 36.85 36.73
23-May-2005 36.58 37.25 36.45 37.08 36.99
24-May-2005 37.05 37.47 36.79 37.16 37.14
25-May-2005 37.21 37.45 36.92 37.25 37.23
26-May-2005 37.32 37.90 37.29 37.72 37.67
27-May-2005 37.73 37.95 37.60 37.75 37.79
31-May-2005 37.77 38.22 37.60 38.08 38.00
01-Jun-2005 37.90 38.80 37.90 38.49 38.45
02-Jun-2005 38.49 39.39 38.35 39.10 38.85
03-Jun-2005 39.10 39.50 38.93 39.10 39.17
06-Jun-2005 38.90 39.25 38.69 39.17 38.99
07-Jun-2005 39.00 39.66 38.95 39.02 39.22
08-Jun-2005 38.60 39.12 37.30 37.93 37.98
09-Jun-2005 37.81 38.61 37.75 38.60 38.21
10-Jun-2005 38.55 39.00 38.32 38.82 38.85
13-Jun-2005 38.72 39.64 38.56 39.26 39.28
14-Jun-2005 39.14 39.21 38.78 38.99 39.01
15-Jun-2005 39.09 39.09 38.40 38.68 38.66
16-Jun-2005 38.92 39.00 38.55 38.91 38.82
17-Jun-2005 39.05 39.65 38.68 38.77 38.98
20-Jun-2005 38.70 38.98 38.10 38.25 38.40
21-Jun-2005 38.25 38.25 37.90 38.11 38.05
VWAP represents daily Volume Weighted-Average Price
Page 8 of 80
Page 9
Hospira’s historical stock prices are provided by Bloomberg LP.
Pfizer makes no claims concerning the accuracy of the information provided on these pages, and will not be held liable for any use of this information.
Date Open Intraday High Intraday Low Close VWAP
HOSPIRA (HSP US) HISTORICAL COMMON STOCK PRICE INFORMATION
22-Jun-2005 38.31 38.80 38.10 38.72 38.49
23-Jun-2005 38.60 38.81 38.11 38.35 38.42
24-Jun-2005 38.30 38.88 38.26 38.80 38.71
27-Jun-2005 38.77 39.36 38.55 38.76 38.88
28-Jun-2005 38.73 39.83 38.60 39.61 39.36
29-Jun-2005 39.50 39.70 39.11 39.19 39.37
30-Jun-2005 39.25 39.48 38.85 39.00 39.03
01-Jul-2005 39.09 39.21 38.62 38.70 38.81
05-Jul-2005 38.70 39.05 38.45 38.80 38.85
06-Jul-2005 38.78 38.78 38.08 38.34 38.35
07-Jul-2005 38.09 38.42 37.85 38.37 38.11
08-Jul-2005 38.49 39.06 38.03 38.97 38.73
11-Jul-2005 39.00 39.04 38.61 38.95 38.88
12-Jul-2005 38.90 38.93 38.57 38.63 38.71
13-Jul-2005 38.50 38.84 38.41 38.78 38.65
14-Jul-2005 38.98 39.30 38.82 38.99 39.00
15-Jul-2005 38.99 39.00 38.43 38.94 38.79
18-Jul-2005 38.70 38.80 38.35 38.40 38.53
19-Jul-2005 38.47 39.25 38.16 39.19 38.94
20-Jul-2005 39.00 39.14 38.72 39.14 38.95
21-Jul-2005 38.97 39.65 38.77 39.32 39.40
22-Jul-2005 39.35 39.39 38.57 39.07 38.86
25-Jul-2005 39.00 39.00 37.40 38.38 38.14
26-Jul-2005 38.34 38.41 37.95 37.97 38.22
27-Jul-2005 37.97 38.11 37.76 38.00 37.97
28-Jul-2005 37.88 38.06 37.49 37.69 37.73
29-Jul-2005 37.73 38.39 37.40 38.25 38.04
01-Aug-2005 38.25 39.22 38.18 38.91 38.74
02-Aug-2005 38.92 39.40 38.60 38.72 38.93
03-Aug-2005 38.80 38.95 38.52 38.65 38.68
04-Aug-2005 38.50 38.50 38.05 38.25 38.22
05-Aug-2005 38.15 38.44 38.13 38.25 38.26
08-Aug-2005 38.35 38.44 37.46 37.52 37.77
09-Aug-2005 37.52 37.80 37.22 37.35 37.47
10-Aug-2005 37.50 37.86 36.95 37.80 37.61
11-Aug-2005 39.10 39.90 38.20 38.65 38.92
VWAP represents daily Volume Weighted-Average Price
Page 9 of 80
Page 10
Hospira’s historical stock prices are provided by Bloomberg LP.
Pfizer makes no claims concerning the accuracy of the information provided on these pages, and will not be held liable for any use of this information.
Date Open Intraday High Intraday Low Close VWAP
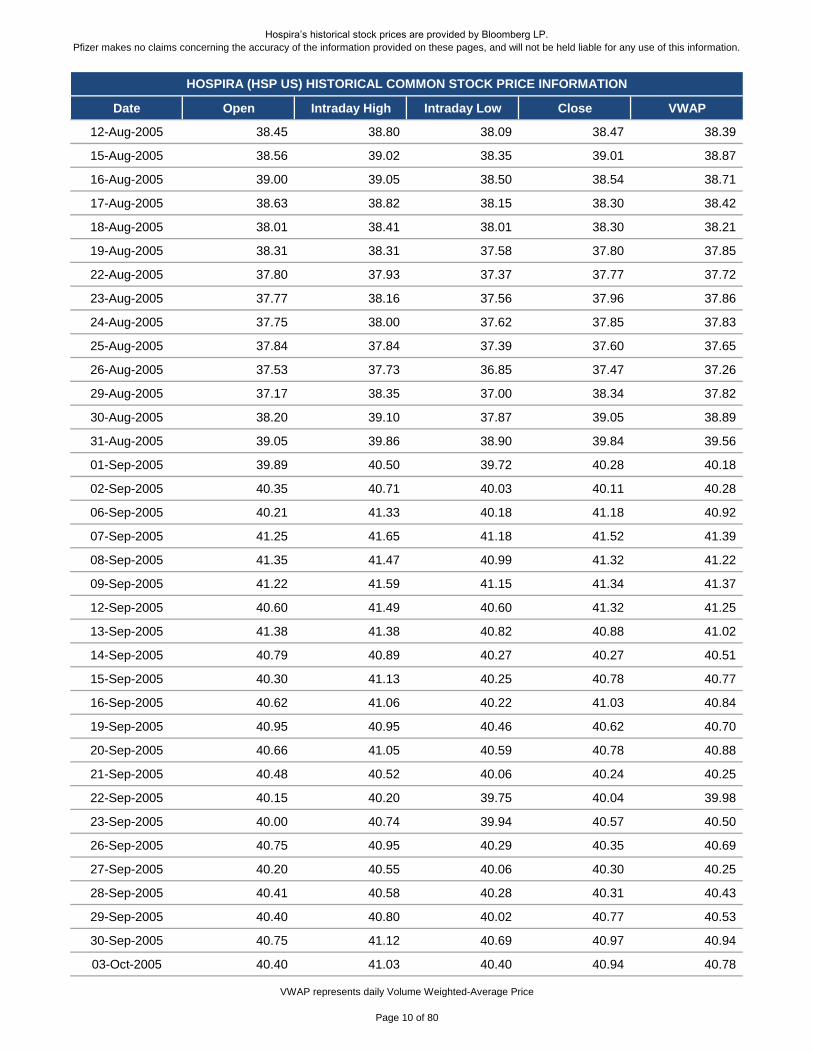
HOSPIRA (HSP US) HISTORICAL COMMON STOCK PRICE INFORMATION
12-Aug-2005 38.45 38.80 38.09 38.47 38.39
15-Aug-2005 38.56 39.02 38.35 39.01 38.87
16-Aug-2005 39.00 39.05 38.50 38.54 38.71
17-Aug-2005 38.63 38.82 38.15 38.30 38.42
18-Aug-2005 38.01 38.41 38.01 38.30 38.21
19-Aug-2005 38.31 38.31 37.58 37.80 37.85
22-Aug-2005 37.80 37.93 37.37 37.77 37.72
23-Aug-2005 37.77 38.16 37.56 37.96 37.86
24-Aug-2005 37.75 38.00 37.62 37.85 37.83
25-Aug-2005 37.84 37.84 37.39 37.60 37.65
26-Aug-2005 37.53 37.73 36.85 37.47 37.26
29-Aug-2005 37.17 38.35 37.00 38.34 37.82
30-Aug-2005 38.20 39.10 37.87 39.05 38.89
31-Aug-2005 39.05 39.86 38.90 39.84 39.56
01-Sep-2005 39.89 40.50 39.72 40.28 40.18
02-Sep-2005 40.35 40.71 40.03 40.11 40.28
06-Sep-2005 40.21 41.33 40.18 41.18 40.92
07-Sep-2005 41.25 41.65 41.18 41.52 41.39
08-Sep-2005 41.35 41.47 40.99 41.32 41.22
09-Sep-2005 41.22 41.59 41.15 41.34 41.37
12-Sep-2005 40.60 41.49 40.60 41.32 41.25
13-Sep-2005 41.38 41.38 40.82 40.88 41.02
14-Sep-2005 40.79 40.89 40.27 40.27 40.51
15-Sep-2005 40.30 41.13 40.25 40.78 40.77
16-Sep-2005 40.62 41.06 40.22 41.03 40.84
19-Sep-2005 40.95 40.95 40.46 40.62 40.70
20-Sep-2005 40.66 41.05 40.59 40.78 40.88
21-Sep-2005 40.48 40.52 40.06 40.24 40.25
22-Sep-2005 40.15 40.20 39.75 40.04 39.98
23-Sep-2005 40.00 40.74 39.94 40.57 40.50
26-Sep-2005 40.75 40.95 40.29 40.35 40.69
27-Sep-2005 40.20 40.55 40.06 40.30 40.25
28-Sep-2005 40.41 40.58 40.28 40.31 40.43
29-Sep-2005 40.40 40.80 40.02 40.77 40.53
30-Sep-2005 40.75 41.12 40.69 40.97 40.94
03-Oct-2005 40.40 41.03 40.40 40.94 40.78
VWAP represents daily Volume Weighted-Average Price
Page 10 of 80
Page 11
Hospira’s historical stock prices are provided by Bloomberg LP.
Pfizer makes no claims concerning the accuracy of the information provided on these pages, and will not be held liable for any use of this information.
Date Open Intraday High Intraday Low Close VWAP
HOSPIRA (HSP US) HISTORICAL COMMON STOCK PRICE INFORMATION
04-Oct-2005 40.91 41.40 40.60 41.18 41.11
05-Oct-2005 41.09 41.13 40.31 40.31 40.74
06-Oct-2005 40.32 40.51 39.57 39.77 40.01
07-Oct-2005 39.94 39.97 39.56 39.81 39.81
10-Oct-2005 40.04 40.14 39.17 39.25 39.58
11-Oct-2005 39.30 39.53 38.56 38.59 38.90
12-Oct-2005 38.45 38.87 38.23 38.27 38.41
13-Oct-2005 38.30 38.79 37.90 38.01 38.28
14-Oct-2005 38.20 38.72 37.55 38.56 38.39
17-Oct-2005 38.58 38.66 37.95 38.47 38.31
18-Oct-2005 38.46 38.48 38.12 38.40 38.34
19-Oct-2005 38.20 38.60 38.12 38.59 38.40
20-Oct-2005 38.59 38.73 37.88 38.06 38.31
21-Oct-2005 38.24 38.80 37.66 38.30 38.33
24-Oct-2005 38.44 39.51 38.15 39.29 39.13
25-Oct-2005 39.19 39.50 38.87 39.24 39.20
26-Oct-2005 39.10 40.34 39.07 39.95 39.98
27-Oct-2005 39.80 39.94 39.07 39.28 39.41
28-Oct-2005 39.50 39.94 39.27 39.64 39.53
31-Oct-2005 39.64 40.32 39.60 39.85 40.07
01-Nov-2005 39.86 41.00 39.73 40.45 40.51
02-Nov-2005 40.34 40.86 40.27 40.76 40.67
03-Nov-2005 40.95 41.16 40.66 41.11 40.95
04-Nov-2005 41.06 41.17 40.65 41.11 40.94
07-Nov-2005 41.11 41.84 41.00 41.25 41.42
08-Nov-2005 41.25 41.30 40.41 41.00 40.91
09-Nov-2005 41.22 41.41 40.80 41.00 41.13
10-Nov-2005 42.40 45.10 42.38 44.88 44.21
11-Nov-2005 43.00 44.13 43.00 43.74 43.70
14-Nov-2005 43.74 44.49 43.52 44.17 44.13
15-Nov-2005 44.26 44.67 43.99 44.01 44.27
16-Nov-2005 44.26 44.26 43.63 43.99 43.97
17-Nov-2005 43.96 44.11 43.55 43.99 43.87
18-Nov-2005 44.00 44.59 43.49 44.47 44.21
21-Nov-2005 44.10 44.72 44.10 44.60 44.48
22-Nov-2005 44.35 44.93 44.25 44.85 44.67
VWAP represents daily Volume Weighted-Average Price
Page 11 of 80
Page 12
Hospira’s historical stock prices are provided by Bloomberg LP.
Pfizer makes no claims concerning the accuracy of the information provided on these pages, and will not be held liable for any use of this information.
Date Open Intraday High Intraday Low Close VWAP
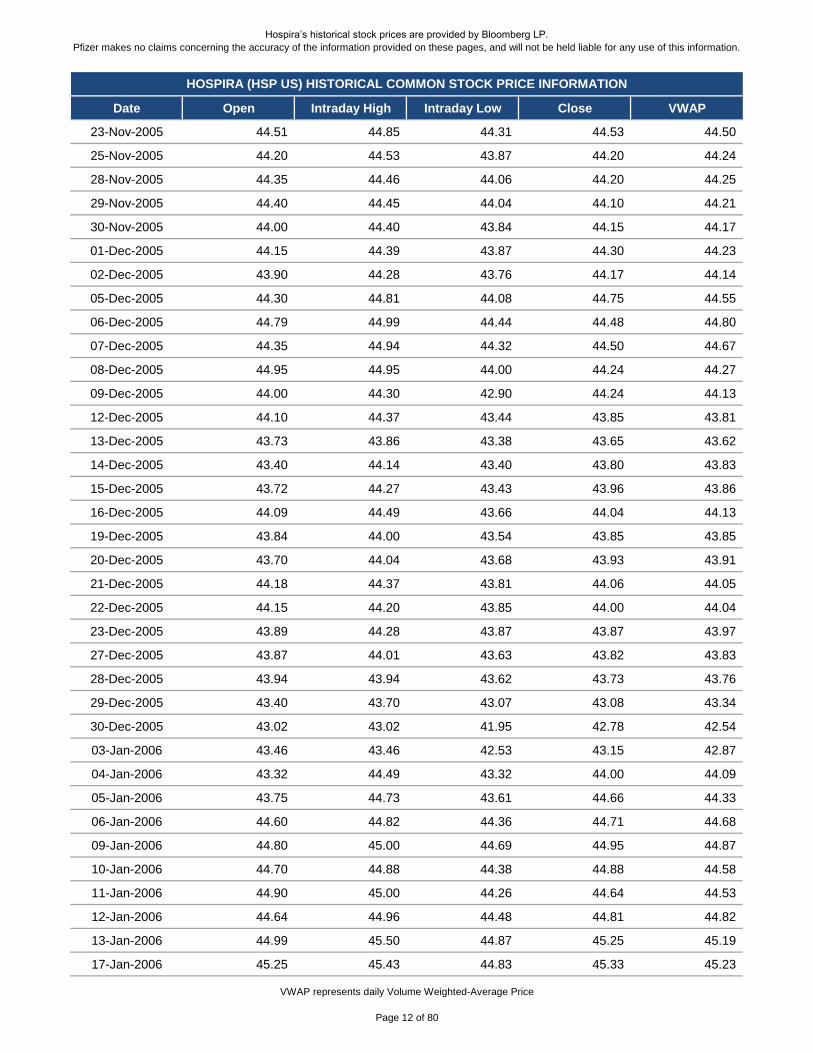
HOSPIRA (HSP US) HISTORICAL COMMON STOCK PRICE INFORMATION
23-Nov-2005 44.51 44.85 44.31 44.53 44.50
25-Nov-2005 44.20 44.53 43.87 44.20 44.24
28-Nov-2005 44.35 44.46 44.06 44.20 44.25
29-Nov-2005 44.40 44.45 44.04 44.10 44.21
30-Nov-2005 44.00 44.40 43.84 44.15 44.17
01-Dec-2005 44.15 44.39 43.87 44.30 44.23
02-Dec-2005 43.90 44.28 43.76 44.17 44.14
05-Dec-2005 44.30 44.81 44.08 44.75 44.55
06-Dec-2005 44.79 44.99 44.44 44.48 44.80
07-Dec-2005 44.35 44.94 44.32 44.50 44.67
08-Dec-2005 44.95 44.95 44.00 44.24 44.27
09-Dec-2005 44.00 44.30 42.90 44.24 44.13
12-Dec-2005 44.10 44.37 43.44 43.85 43.81
13-Dec-2005 43.73 43.86 43.38 43.65 43.62
14-Dec-2005 43.40 44.14 43.40 43.80 43.83
15-Dec-2005 43.72 44.27 43.43 43.96 43.86
16-Dec-2005 44.09 44.49 43.66 44.04 44.13
19-Dec-2005 43.84 44.00 43.54 43.85 43.85
20-Dec-2005 43.70 44.04 43.68 43.93 43.91
21-Dec-2005 44.18 44.37 43.81 44.06 44.05
22-Dec-2005 44.15 44.20 43.85 44.00 44.04
23-Dec-2005 43.89 44.28 43.87 43.87 43.97
27-Dec-2005 43.87 44.01 43.63 43.82 43.83
28-Dec-2005 43.94 43.94 43.62 43.73 43.76
29-Dec-2005 43.40 43.70 43.07 43.08 43.34
30-Dec-2005 43.02 43.02 41.95 42.78 42.54
03-Jan-2006 43.46 43.46 42.53 43.15 42.87
04-Jan-2006 43.32 44.49 43.32 44.00 44.09
05-Jan-2006 43.75 44.73 43.61 44.66 44.33
06-Jan-2006 44.60 44.82 44.36 44.71 44.68
09-Jan-2006 44.80 45.00 44.69 44.95 44.87
10-Jan-2006 44.70 44.88 44.38 44.88 44.58
11-Jan-2006 44.90 45.00 44.26 44.64 44.53
12-Jan-2006 44.64 44.96 44.48 44.81 44.82
13-Jan-2006 44.99 45.50 44.87 45.25 45.19
17-Jan-2006 45.25 45.43 44.83 45.33 45.23
VWAP represents daily Volume Weighted-Average Price
Page 12 of 80
Page 13
Hospira’s historical stock prices are provided by Bloomberg LP.
Pfizer makes no claims concerning the accuracy of the information provided on these pages, and will not be held liable for any use of this information.
Date Open Intraday High Intraday Low Close VWAP
HOSPIRA (HSP US) HISTORICAL COMMON STOCK PRICE INFORMATION
18-Jan-2006 45.05 45.44 44.55 45.25 44.93
19-Jan-2006 45.16 45.56 45.08 45.40 45.37
20-Jan-2006 45.40 45.57 44.65 44.65 44.89
23-Jan-2006 44.54 45.57 44.54 45.49 45.34
24-Jan-2006 45.50 45.63 44.75 44.84 44.99
25-Jan-2006 44.90 44.92 43.39 43.80 43.83
26-Jan-2006 44.05 44.62 43.95 44.35 44.29
27-Jan-2006 44.34 45.42 44.34 45.06 45.09
30-Jan-2006 45.20 45.21 44.93 45.03 45.04
31-Jan-2006 44.65 45.14 44.47 44.75 44.82
01-Feb-2006 44.90 46.13 44.44 45.93 45.29
02-Feb-2006 45.93 46.25 45.55 45.73 45.83
03-Feb-2006 45.30 46.02 45.04 45.60 45.65
06-Feb-2006 45.10 45.72 45.09 45.65 45.38
07-Feb-2006 45.50 45.68 45.24 45.58 45.48
08-Feb-2006 45.58 46.10 45.00 46.05 45.88
09-Feb-2006 45.92 46.19 45.50 45.75 45.86
10-Feb-2006 45.63 45.82 45.15 45.56 45.51
13-Feb-2006 45.15 45.40 45.06 45.26 45.23
14-Feb-2006 45.25 46.06 45.05 45.99 45.77
15-Feb-2006 45.75 46.72 45.30 46.72 46.34
16-Feb-2006 46.74 46.87 46.22 46.40 46.55
17-Feb-2006 46.20 47.18 46.19 46.93 46.65
21-Feb-2006 46.79 47.34 46.63 47.15 47.05
22-Feb-2006 47.10 47.50 47.01 47.25 47.27
23-Feb-2006 47.05 47.99 47.00 47.63 47.58
24-Feb-2006 47.63 47.67 47.00 47.00 47.34
27-Feb-2006 47.20 47.42 46.70 47.04 47.03
28-Feb-2006 41.01 41.99 38.50 39.70 39.85
01-Mar-2006 38.82 40.09 38.40 39.10 39.07
02-Mar-2006 39.10 40.31 38.62 40.23 39.56
03-Mar-2006 40.23 41.06 40.00 40.51 40.51
06-Mar-2006 40.38 40.96 39.87 39.97 40.50
07-Mar-2006 39.97 40.44 39.41 39.70 39.93
08-Mar-2006 39.72 41.11 39.68 41.02 40.49
09-Mar-2006 40.88 41.12 40.42 40.42 40.67
VWAP represents daily Volume Weighted-Average Price
Page 13 of 80
Page 14
Hospira’s historical stock prices are provided by Bloomberg LP.
Pfizer makes no claims concerning the accuracy of the information provided on these pages, and will not be held liable for any use of this information.
Date Open Intraday High Intraday Low Close VWAP
HOSPIRA (HSP US) HISTORICAL COMMON STOCK PRICE INFORMATION
10-Mar-2006 40.32 41.16 40.20 40.90 40.86
13-Mar-2006 40.88 41.40 40.88 40.98 41.13
14-Mar-2006 40.93 41.60 40.70 41.33 41.18
15-Mar-2006 41.45 41.80 41.27 41.80 41.50
16-Mar-2006 41.78 42.08 41.15 41.34 41.47
17-Mar-2006 41.19 41.67 41.19 41.67 41.51
20-Mar-2006 41.67 41.70 40.60 40.70 40.93
21-Mar-2006 40.95 41.05 39.78 39.87 40.35
22-Mar-2006 39.87 41.22 39.70 41.20 40.61
23-Mar-2006 40.72 41.17 40.35 40.50 40.63
24-Mar-2006 39.50 40.48 39.24 39.99 40.08
27-Mar-2006 40.00 40.00 39.32 39.45 39.57
28-Mar-2006 39.30 39.61 38.74 39.10 39.11
29-Mar-2006 39.20 39.95 39.14 39.55 39.68
30-Mar-2006 39.60 39.98 39.33 39.33 39.52
31-Mar-2006 39.45 39.62 39.33 39.46 39.47
03-Apr-2006 39.21 39.42 38.34 38.42 38.91
04-Apr-2006 38.34 38.54 37.54 38.36 38.06
05-Apr-2006 38.39 38.40 37.84 37.89 37.98
06-Apr-2006 37.82 37.88 37.21 37.50 37.46
07-Apr-2006 37.53 37.76 36.92 37.00 37.14
10-Apr-2006 37.05 37.41 36.69 37.34 37.12
11-Apr-2006 37.30 37.50 36.77 37.10 37.14
12-Apr-2006 37.10 37.21 36.90 36.97 37.09
13-Apr-2006 36.90 37.21 36.33 36.95 36.97
17-Apr-2006 36.96 37.05 36.75 36.94 36.91
18-Apr-2006 36.97 37.78 36.80 37.62 37.31
19-Apr-2006 37.90 38.62 37.65 38.60 38.20
20-Apr-2006 38.56 39.11 38.24 39.11 38.90
21-Apr-2006 39.20 39.40 38.69 38.76 39.13
24-Apr-2006 38.73 39.27 38.51 39.20 39.02
25-Apr-2006 39.04 39.07 38.38 38.60 38.74
26-Apr-2006 38.60 38.93 38.11 38.36 38.55
27-Apr-2006 38.36 39.13 38.15 38.69 38.73
28-Apr-2006 38.60 38.96 38.36 38.55 38.62
01-May-2006 38.70 39.13 38.20 38.65 38.68
VWAP represents daily Volume Weighted-Average Price
Page 14 of 80
Page 15
Hospira’s historical stock prices are provided by Bloomberg LP.
Pfizer makes no claims concerning the accuracy of the information provided on these pages, and will not be held liable for any use of this information.
Date Open Intraday High Intraday Low Close VWAP
HOSPIRA (HSP US) HISTORICAL COMMON STOCK PRICE INFORMATION
02-May-2006 38.80 39.01 38.44 38.55 38.67
03-May-2006 38.42 38.56 37.92 38.23 38.17
04-May-2006 38.20 38.40 37.71 38.01 38.01
05-May-2006 38.20 38.34 38.01 38.32 38.21
08-May-2006 38.10 38.88 38.06 38.72 38.47
09-May-2006 41.10 43.80 41.10 42.03 42.38
10-May-2006 41.60 42.20 41.18 41.78 41.79
11-May-2006 41.37 41.82 40.50 41.10 41.18
12-May-2006 40.80 41.40 40.70 40.90 41.07
15-May-2006 40.58 41.91 40.50 41.32 41.42
16-May-2006 41.28 42.35 41.17 42.13 41.88
17-May-2006 41.75 42.18 41.61 41.82 41.99
18-May-2006 41.71 42.10 41.30 41.61 41.80
19-May-2006 41.71 42.30 41.60 42.19 42.01
22-May-2006 41.85 42.55 41.65 42.02 42.02
23-May-2006 42.08 42.35 41.73 41.98 41.91
24-May-2006 41.98 43.50 41.98 43.05 43.01
25-May-2006 43.10 43.25 42.75 43.21 43.11
26-May-2006 43.49 43.74 43.24 43.63 43.53
30-May-2006 43.35 43.47 42.60 43.25 43.25
31-May-2006 43.45 44.96 43.27 44.81 44.37
01-Jun-2006 44.99 45.25 44.74 45.13 44.99
02-Jun-2006 44.90 45.04 44.33 44.88 44.70
05-Jun-2006 44.71 45.13 44.05 44.06 44.57
06-Jun-2006 44.27 44.53 43.54 43.84 43.94
07-Jun-2006 44.01 44.06 43.63 43.68 43.90
08-Jun-2006 43.70 43.90 43.00 43.14 43.27
09-Jun-2006 43.30 43.85 43.01 43.12 43.42
12-Jun-2006 43.20 43.22 42.44 42.47 42.91
13-Jun-2006 42.15 42.96 41.70 41.77 42.27
14-Jun-2006 41.64 42.64 41.63 42.64 42.14
15-Jun-2006 42.62 43.73 42.44 43.59 43.12
16-Jun-2006 43.44 43.92 42.95 42.95 43.29
19-Jun-2006 43.20 43.20 42.17 42.60 42.55
20-Jun-2006 42.78 43.00 42.40 42.41 42.61
21-Jun-2006 42.50 43.02 42.35 42.48 42.59
VWAP represents daily Volume Weighted-Average Price
Page 15 of 80
Page 16
Hospira’s historical stock prices are provided by Bloomberg LP.
Pfizer makes no claims concerning the accuracy of the information provided on these pages, and will not be held liable for any use of this information.
Date Open Intraday High Intraday Low Close VWAP
HOSPIRA (HSP US) HISTORICAL COMMON STOCK PRICE INFORMATION
22-Jun-2006 42.48 42.54 41.91 42.45 42.19
23-Jun-2006 41.50 43.06 41.45 42.81 42.33
26-Jun-2006 42.86 43.19 42.22 42.39 42.68
27-Jun-2006 42.30 42.35 41.64 41.70 41.90
28-Jun-2006 41.77 41.97 41.01 41.27 41.32
29-Jun-2006 41.75 42.99 41.67 42.90 42.42
30-Jun-2006 42.78 43.17 42.55 42.94 42.92
03-Jul-2006 43.15 43.65 42.85 43.56 43.34
05-Jul-2006 43.62 43.95 43.14 43.18 43.48
06-Jul-2006 43.18 43.19 42.53 43.05 42.92
07-Jul-2006 43.05 43.10 42.24 42.24 42.65
10-Jul-2006 42.56 42.62 42.05 42.10 42.29
11-Jul-2006 42.20 42.54 41.68 42.54 42.05
12-Jul-2006 42.45 43.03 42.42 42.62 42.72
13-Jul-2006 42.55 42.80 42.23 42.37 42.46
14-Jul-2006 42.16 42.54 41.75 41.85 42.03
17-Jul-2006 41.86 42.13 41.51 41.89 41.95
18-Jul-2006 41.93 42.40 41.57 42.32 41.84
19-Jul-2006 42.60 43.64 42.41 43.03 43.11
20-Jul-2006 42.99 43.18 42.53 42.85 42.92
21-Jul-2006 42.99 42.99 41.95 41.95 42.48
24-Jul-2006 42.10 42.96 42.10 42.69 42.65
25-Jul-2006 42.70 43.96 42.70 43.85 43.40
26-Jul-2006 43.75 44.00 43.34 43.88 43.82
27-Jul-2006 43.84 43.90 42.98 43.09 43.41
28-Jul-2006 43.25 43.87 43.25 43.84 43.68
31-Jul-2006 43.84 43.88 43.26 43.69 43.63
01-Aug-2006 43.65 43.66 42.87 42.97 43.19
02-Aug-2006 43.00 43.57 43.00 43.24 43.30
03-Aug-2006 43.25 43.90 43.11 43.56 43.57
04-Aug-2006 43.80 44.30 43.62 43.71 43.99
07-Aug-2006 43.43 43.43 42.40 42.63 42.70
08-Aug-2006 42.71 43.10 42.10 42.80 42.57
09-Aug-2006 37.11 37.24 33.98 35.25 35.69
10-Aug-2006 35.56 35.59 34.00 34.55 34.87
11-Aug-2006 34.51 34.68 33.98 34.35 34.31
VWAP represents daily Volume Weighted-Average Price
Page 16 of 80
Page 17
Hospira’s historical stock prices are provided by Bloomberg LP.
Pfizer makes no claims concerning the accuracy of the information provided on these pages, and will not be held liable for any use of this information.
Date Open Intraday High Intraday Low Close VWAP
HOSPIRA (HSP US) HISTORICAL COMMON STOCK PRICE INFORMATION
14-Aug-2006 33.75 35.66 33.75 35.48 35.24
15-Aug-2006 35.50 35.62 34.79 34.80 35.10
16-Aug-2006 35.15 35.93 35.00 35.69 35.42
17-Aug-2006 35.37 37.19 35.37 37.14 36.78
18-Aug-2006 37.05 37.05 36.23 36.65 36.58
21-Aug-2006 36.65 36.70 36.26 36.66 36.47
22-Aug-2006 36.45 36.45 35.83 36.01 36.12
23-Aug-2006 35.90 36.17 35.67 35.77 35.85
24-Aug-2006 35.85 35.95 35.56 35.73 35.74
25-Aug-2006 35.74 36.40 35.67 36.28 36.08
28-Aug-2006 36.50 37.55 36.30 37.50 37.26
29-Aug-2006 37.50 37.90 36.98 37.83 37.40
30-Aug-2006 37.80 37.80 36.95 36.98 37.31
31-Aug-2006 36.92 37.10 36.63 36.63 36.81
01-Sep-2006 36.92 37.05 36.79 36.90 36.93
05-Sep-2006 36.81 36.93 36.15 36.67 36.47
06-Sep-2006 36.50 36.61 35.82 36.03 36.12
07-Sep-2006 35.75 36.00 35.39 35.46 35.59
08-Sep-2006 35.60 36.06 35.24 36.03 35.61
11-Sep-2006 36.05 36.32 35.66 35.95 35.93
12-Sep-2006 35.96 36.30 35.64 36.23 36.04
13-Sep-2006 36.24 36.24 35.78 35.88 36.03
14-Sep-2006 35.89 36.57 35.81 36.54 36.13
15-Sep-2006 36.71 37.15 36.68 37.06 36.99
18-Sep-2006 37.06 37.25 36.87 37.16 37.05
19-Sep-2006 37.12 37.18 36.51 36.86 36.78
20-Sep-2006 37.20 37.88 37.10 37.55 37.52
21-Sep-2006 38.50 39.45 38.21 39.20 38.80
22-Sep-2006 39.05 39.05 38.39 38.72 38.62
25-Sep-2006 38.65 38.67 37.50 37.96 37.91
26-Sep-2006 38.00 38.05 37.39 37.50 37.64
27-Sep-2006 37.50 37.68 37.20 37.36 37.41
28-Sep-2006 37.26 37.87 37.25 37.87 37.63
29-Sep-2006 37.80 38.60 37.66 38.27 38.20
02-Oct-2006 38.20 38.30 37.51 37.90 37.95
03-Oct-2006 37.75 37.80 37.26 37.31 37.43
VWAP represents daily Volume Weighted-Average Price
Page 17 of 80
Page 18
Hospira’s historical stock prices are provided by Bloomberg LP.
Pfizer makes no claims concerning the accuracy of the information provided on these pages, and will not be held liable for any use of this information.
Date Open Intraday High Intraday Low Close VWAP
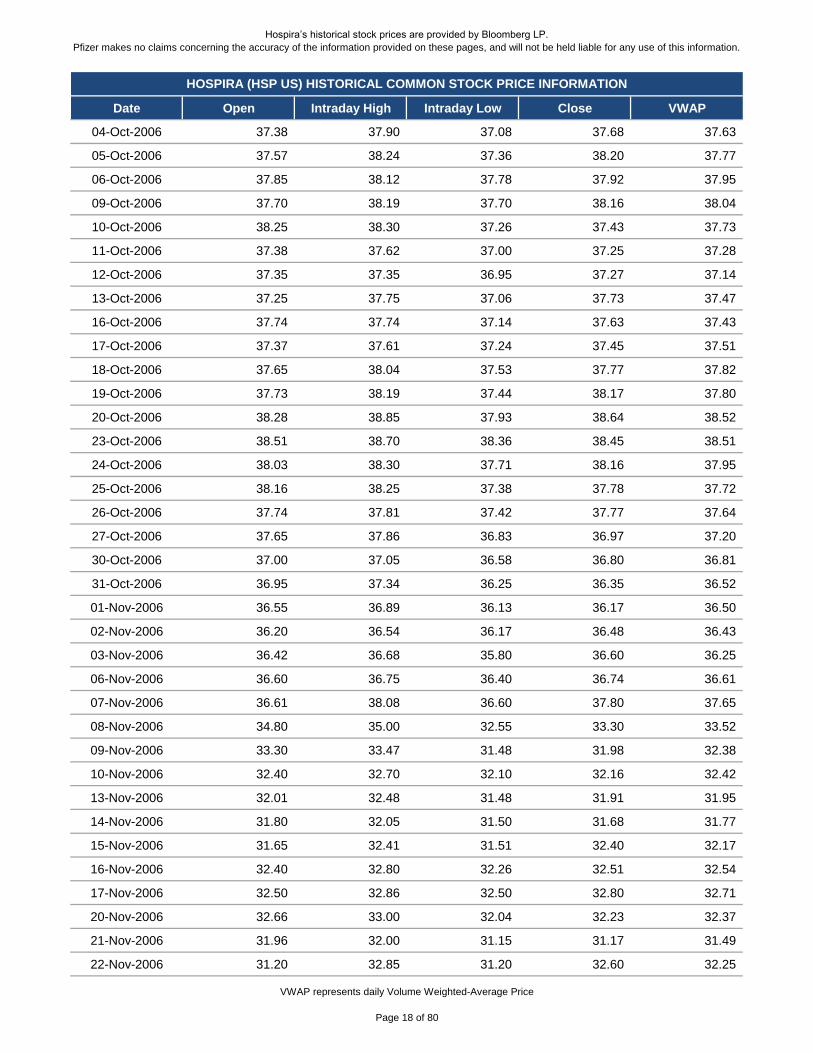
HOSPIRA (HSP US) HISTORICAL COMMON STOCK PRICE INFORMATION
04-Oct-2006 37.38 37.90 37.08 37.68 37.63
05-Oct-2006 37.57 38.24 37.36 38.20 37.77
06-Oct-2006 37.85 38.12 37.78 37.92 37.95
09-Oct-2006 37.70 38.19 37.70 38.16 38.04
10-Oct-2006 38.25 38.30 37.26 37.43 37.73
11-Oct-2006 37.38 37.62 37.00 37.25 37.28
12-Oct-2006 37.35 37.35 36.95 37.27 37.14
13-Oct-2006 37.25 37.75 37.06 37.73 37.47
16-Oct-2006 37.74 37.74 37.14 37.63 37.43
17-Oct-2006 37.37 37.61 37.24 37.45 37.51
18-Oct-2006 37.65 38.04 37.53 37.77 37.82
19-Oct-2006 37.73 38.19 37.44 38.17 37.80
20-Oct-2006 38.28 38.85 37.93 38.64 38.52
23-Oct-2006 38.51 38.70 38.36 38.45 38.51
24-Oct-2006 38.03 38.30 37.71 38.16 37.95
25-Oct-2006 38.16 38.25 37.38 37.78 37.72
26-Oct-2006 37.74 37.81 37.42 37.77 37.64
27-Oct-2006 37.65 37.86 36.83 36.97 37.20
30-Oct-2006 37.00 37.05 36.58 36.80 36.81
31-Oct-2006 36.95 37.34 36.25 36.35 36.52
01-Nov-2006 36.55 36.89 36.13 36.17 36.50
02-Nov-2006 36.20 36.54 36.17 36.48 36.43
03-Nov-2006 36.42 36.68 35.80 36.60 36.25
06-Nov-2006 36.60 36.75 36.40 36.74 36.61
07-Nov-2006 36.61 38.08 36.60 37.80 37.65
08-Nov-2006 34.80 35.00 32.55 33.30 33.52
09-Nov-2006 33.30 33.47 31.48 31.98 32.38
10-Nov-2006 32.40 32.70 32.10 32.16 32.42
13-Nov-2006 32.01 32.48 31.48 31.91 31.95
14-Nov-2006 31.80 32.05 31.50 31.68 31.77
15-Nov-2006 31.65 32.41 31.51 32.40 32.17
16-Nov-2006 32.40 32.80 32.26 32.51 32.54
17-Nov-2006 32.50 32.86 32.50 32.80 32.71
20-Nov-2006 32.66 33.00 32.04 32.23 32.37
21-Nov-2006 31.96 32.00 31.15 31.17 31.49
22-Nov-2006 31.20 32.85 31.20 32.60 32.25
VWAP represents daily Volume Weighted-Average Price
Page 18 of 80
Page 19
Hospira’s historical stock prices are provided by Bloomberg LP.
Pfizer makes no claims concerning the accuracy of the information provided on these pages, and will not be held liable for any use of this information.
Date Open Intraday High Intraday Low Close VWAP
HOSPIRA (HSP US) HISTORICAL COMMON STOCK PRICE INFORMATION
24-Nov-2006 32.61 32.61 32.02 32.45 32.26
27-Nov-2006 32.29 32.54 32.14 32.32 32.33
28-Nov-2006 32.46 32.54 32.15 32.40 32.41
29-Nov-2006 32.45 33.05 32.45 32.98 32.74
30-Nov-2006 33.19 33.19 32.54 32.80 32.79
01-Dec-2006 32.95 33.00 32.58 32.94 32.78
04-Dec-2006 33.07 33.85 33.00 33.83 33.69
05-Dec-2006 33.95 34.47 33.85 34.40 34.18
06-Dec-2006 34.35 34.65 34.08 34.22 34.32
07-Dec-2006 34.23 34.50 34.16 34.20 34.31
08-Dec-2006 34.11 34.76 34.10 34.47 34.49
11-Dec-2006 34.45 34.51 34.20 34.30 34.35
12-Dec-2006 34.30 34.33 33.84 34.04 34.01
13-Dec-2006 34.06 34.14 33.75 33.83 33.90
14-Dec-2006 33.75 34.29 33.75 34.20 34.20
15-Dec-2006 34.20 34.25 33.93 34.22 34.13
18-Dec-2006 34.20 34.25 33.85 33.86 33.94
19-Dec-2006 33.76 33.94 33.43 33.54 33.57
20-Dec-2006 33.54 33.84 33.54 33.75 33.70
21-Dec-2006 33.69 34.03 33.68 33.80 33.81
22-Dec-2006 33.65 33.80 33.53 33.69 33.62
26-Dec-2006 33.69 33.90 33.56 33.71 33.77
27-Dec-2006 33.85 34.00 33.47 33.50 33.61
28-Dec-2006 33.50 33.72 33.38 33.61 33.57
29-Dec-2006 33.53 33.75 33.50 33.58 33.65
03-Jan-2007 33.75 34.10 33.66 33.85 33.95
04-Jan-2007 33.88 34.00 33.68 33.96 33.88
05-Jan-2007 33.80 34.00 33.70 33.85 33.86
08-Jan-2007 33.79 34.07 33.60 33.97 33.91
09-Jan-2007 34.70 34.99 34.41 34.70 34.72
10-Jan-2007 34.50 34.80 34.48 34.63 34.64
11-Jan-2007 34.75 34.84 34.58 34.74 34.74
12-Jan-2007 34.64 34.96 34.58 34.65 34.75
16-Jan-2007 34.65 34.86 34.40 34.55 34.56
17-Jan-2007 34.60 34.95 34.43 34.85 34.73
18-Jan-2007 34.99 35.20 34.70 34.94 34.92
VWAP represents daily Volume Weighted-Average Price
Page 19 of 80
Page 20
Hospira’s historical stock prices are provided by Bloomberg LP.
Pfizer makes no claims concerning the accuracy of the information provided on these pages, and will not be held liable for any use of this information.
Date Open Intraday High Intraday Low Close VWAP
HOSPIRA (HSP US) HISTORICAL COMMON STOCK PRICE INFORMATION
19-Jan-2007 35.10 35.30 35.00 35.00 35.08
22-Jan-2007 35.60 35.92 35.50 35.76 35.72
23-Jan-2007 35.76 35.90 35.65 35.77 35.77
24-Jan-2007 35.76 35.98 35.67 35.92 35.84
25-Jan-2007 35.89 36.40 35.85 36.31 36.22
26-Jan-2007 36.31 37.13 36.10 36.73 36.69
29-Jan-2007 36.74 36.93 36.49 36.62 36.64
30-Jan-2007 36.62 36.75 36.57 36.66 36.65
31-Jan-2007 36.65 36.89 36.51 36.78 36.69
01-Feb-2007 36.75 37.00 36.69 36.85 36.84
02-Feb-2007 36.90 37.33 36.87 37.11 37.14
05-Feb-2007 36.93 37.35 36.83 37.25 37.10
06-Feb-2007 37.25 37.27 37.09 37.27 37.17
07-Feb-2007 37.27 37.33 37.09 37.11 37.15
08-Feb-2007 37.12 37.27 36.80 37.00 37.05
09-Feb-2007 37.05 37.20 36.74 36.82 36.95
12-Feb-2007 36.70 36.87 36.25 36.42 36.44
13-Feb-2007 36.47 36.93 36.30 36.93 36.78
14-Feb-2007 36.94 37.09 36.90 37.02 37.00
15-Feb-2007 37.00 37.09 36.90 37.03 37.01
16-Feb-2007 36.85 37.03 36.72 37.00 36.92
20-Feb-2007 36.85 37.35 36.70 37.34 37.17
21-Feb-2007 37.34 37.48 37.07 37.45 37.31
22-Feb-2007 37.55 37.65 37.28 37.56 37.45
23-Feb-2007 37.56 37.59 37.13 37.22 37.22
26-Feb-2007 37.24 37.34 36.98 37.02 37.14
27-Feb-2007 36.78 36.95 35.30 35.90 36.29
28-Feb-2007 38.50 40.66 38.22 38.31 39.05
01-Mar-2007 38.28 39.27 37.80 39.22 39.00
02-Mar-2007 39.01 39.78 38.90 39.08 39.24
05-Mar-2007 38.70 39.49 38.60 38.83 39.05
06-Mar-2007 38.96 39.45 38.80 38.95 38.95
07-Mar-2007 38.95 39.92 38.75 39.90 39.55
08-Mar-2007 39.99 40.25 39.84 40.21 40.05
09-Mar-2007 40.50 40.55 39.90 40.02 40.08
12-Mar-2007 40.02 40.49 39.81 39.92 40.01
VWAP represents daily Volume Weighted-Average Price
Page 20 of 80
Page 21
Hospira’s historical stock prices are provided by Bloomberg LP.
Pfizer makes no claims concerning the accuracy of the information provided on these pages, and will not be held liable for any use of this information.
Date Open Intraday High Intraday Low Close VWAP
HOSPIRA (HSP US) HISTORICAL COMMON STOCK PRICE INFORMATION
13-Mar-2007 39.80 39.81 39.28 39.28 39.55
14-Mar-2007 39.28 39.50 39.00 39.40 39.28
15-Mar-2007 39.48 39.79 39.41 39.54 39.60
16-Mar-2007 39.25 39.49 39.05 39.09 39.22
19-Mar-2007 39.25 39.59 38.97 39.40 39.38
20-Mar-2007 39.40 39.50 39.17 39.26 39.34
21-Mar-2007 39.40 40.24 39.21 40.06 39.65
22-Mar-2007 40.03 40.20 39.60 39.70 39.80
23-Mar-2007 39.70 39.93 39.60 39.74 39.72
26-Mar-2007 39.56 39.86 39.23 39.61 39.51
27-Mar-2007 39.50 39.60 39.24 39.42 39.46
28-Mar-2007 39.43 40.70 39.30 40.56 40.22
29-Mar-2007 40.74 40.96 40.40 40.62 40.62
30-Mar-2007 40.61 40.96 40.60 40.90 40.86
02-Apr-2007 40.89 40.98 40.51 40.95 40.81
03-Apr-2007 40.99 41.12 40.85 41.09 41.01
04-Apr-2007 40.97 41.24 40.81 40.86 40.95
05-Apr-2007 40.86 40.99 40.60 40.93 40.90
09-Apr-2007 40.83 41.00 40.61 40.72 40.78
10-Apr-2007 40.65 40.90 40.55 40.69 40.71
11-Apr-2007 40.50 40.70 40.24 40.49 40.46
12-Apr-2007 40.30 40.99 40.25 40.80 40.74
13-Apr-2007 40.75 41.33 40.56 41.21 41.13
16-Apr-2007 41.29 41.82 41.27 41.59 41.57
17-Apr-2007 41.56 41.88 41.41 41.73 41.73
18-Apr-2007 41.60 41.60 41.15 41.40 41.37
19-Apr-2007 41.25 41.49 41.10 41.46 41.37
20-Apr-2007 41.80 41.93 41.32 41.57 41.58
23-Apr-2007 41.58 42.00 41.58 41.88 41.86
24-Apr-2007 41.89 41.89 41.13 41.21 41.32
25-Apr-2007 41.30 41.50 40.95 41.18 41.16
26-Apr-2007 41.18 41.50 40.88 41.04 41.12
27-Apr-2007 40.40 41.20 40.40 41.06 41.05
30-Apr-2007 41.07 41.18 40.55 40.55 40.86
01-May-2007 40.40 40.88 40.36 40.80 40.68
02-May-2007 40.89 41.50 40.71 41.48 41.25
VWAP represents daily Volume Weighted-Average Price
Page 21 of 80
Page 22
Hospira’s historical stock prices are provided by Bloomberg LP.
Pfizer makes no claims concerning the accuracy of the information provided on these pages, and will not be held liable for any use of this information.
Date Open Intraday High Intraday Low Close VWAP
HOSPIRA (HSP US) HISTORICAL COMMON STOCK PRICE INFORMATION
03-May-2007 41.47 41.67 41.15 41.22 41.33
04-May-2007 41.35 41.38 40.88 40.98 41.00
07-May-2007 40.99 41.63 40.99 41.19 41.32
08-May-2007 41.19 41.20 40.55 40.83 40.77
09-May-2007 41.00 43.00 40.80 41.84 41.83
10-May-2007 41.84 41.84 41.16 41.16 41.41
11-May-2007 41.16 41.19 40.03 40.40 40.31
14-May-2007 40.40 40.80 39.86 39.99 40.15
15-May-2007 39.93 40.20 39.73 39.98 40.04
16-May-2007 39.99 40.02 39.58 39.80 39.80
17-May-2007 39.65 39.85 39.44 39.59 39.61
18-May-2007 39.60 39.83 39.21 39.74 39.64
21-May-2007 39.65 39.73 39.19 39.41 39.39
22-May-2007 39.42 39.48 39.10 39.16 39.26
23-May-2007 39.17 39.45 39.00 39.10 39.21
24-May-2007 38.84 38.99 38.45 38.58 38.67
25-May-2007 38.76 39.07 38.60 38.87 38.91
29-May-2007 38.87 39.10 38.65 38.95 38.92
30-May-2007 38.76 39.10 38.66 39.06 38.95
31-May-2007 39.10 39.90 39.03 39.84 39.50
01-Jun-2007 40.20 40.96 40.00 40.70 40.63
04-Jun-2007 40.51 40.69 40.26 40.54 40.50
05-Jun-2007 40.47 40.47 39.71 39.74 39.85
06-Jun-2007 39.60 39.61 39.34 39.36 39.41
07-Jun-2007 39.37 39.57 38.81 38.81 39.13
08-Jun-2007 38.82 39.47 38.64 39.46 39.16
11-Jun-2007 39.54 39.58 38.96 39.00 39.17
12-Jun-2007 38.95 38.96 38.66 38.85 38.80
13-Jun-2007 38.80 39.31 38.70 39.31 39.05
14-Jun-2007 39.32 39.54 39.12 39.38 39.36
15-Jun-2007 39.57 39.63 39.22 39.33 39.44
18-Jun-2007 39.48 39.48 39.20 39.30 39.33
19-Jun-2007 39.20 39.30 39.01 39.15 39.16
20-Jun-2007 39.09 39.28 38.82 38.86 39.01
21-Jun-2007 38.80 39.14 38.61 39.01 38.91
22-Jun-2007 38.90 39.00 38.60 38.67 38.77
VWAP represents daily Volume Weighted-Average Price
Page 22 of 80
Page 23
Hospira’s historical stock prices are provided by Bloomberg LP.
Pfizer makes no claims concerning the accuracy of the information provided on these pages, and will not be held liable for any use of this information.
Date Open Intraday High Intraday Low Close VWAP
HOSPIRA (HSP US) HISTORICAL COMMON STOCK PRICE INFORMATION
25-Jun-2007 38.67 38.80 38.30 38.32 38.54
26-Jun-2007 38.37 38.71 38.35 38.51 38.57
27-Jun-2007 38.35 38.59 38.30 38.58 38.48
28-Jun-2007 38.50 38.97 38.42 38.83 38.77
29-Jun-2007 39.10 39.34 38.64 39.04 38.93
02-Jul-2007 39.20 39.28 38.91 38.98 39.01
03-Jul-2007 38.99 39.50 38.99 39.50 39.30
05-Jul-2007 39.57 40.32 39.40 40.04 40.03
06-Jul-2007 40.02 40.69 39.96 40.65 40.43
09-Jul-2007 40.65 40.70 40.30 40.36 40.43
10-Jul-2007 40.32 40.34 39.72 39.81 39.91
11-Jul-2007 40.00 40.19 39.90 40.15 40.04
12-Jul-2007 40.15 40.78 40.10 40.78 40.42
13-Jul-2007 40.78 40.81 40.41 40.75 40.63
16-Jul-2007 40.76 41.23 40.65 40.83 40.96
17-Jul-2007 40.75 40.75 40.40 40.54 40.52
18-Jul-2007 40.50 40.54 40.32 40.47 40.39
19-Jul-2007 40.60 40.72 40.45 40.55 40.55
20-Jul-2007 40.55 40.67 40.32 40.36 40.50
23-Jul-2007 40.60 40.60 40.27 40.30 40.35
24-Jul-2007 40.18 40.34 40.09 40.13 40.23
25-Jul-2007 40.25 40.43 39.98 40.37 40.17
26-Jul-2007 40.06 40.17 39.34 39.47 39.77
27-Jul-2007 39.30 39.58 38.57 38.57 39.09
30-Jul-2007 38.50 38.86 38.42 38.84 38.68
31-Jul-2007 38.96 39.00 38.62 38.67 38.83
01-Aug-2007 38.65 39.47 38.64 39.43 39.01
02-Aug-2007 37.94 39.54 37.93 39.39 39.36
03-Aug-2007 39.50 39.86 39.00 39.00 39.37
06-Aug-2007 39.20 39.30 38.87 39.25 39.13
07-Aug-2007 39.09 39.19 38.61 39.01 38.92
08-Aug-2007 41.15 41.15 38.85 38.97 39.06
09-Aug-2007 38.79 39.28 38.05 38.15 38.59
10-Aug-2007 38.00 38.67 37.81 38.54 38.06
13-Aug-2007 38.55 39.07 38.40 38.63 38.69
14-Aug-2007 38.56 38.80 38.43 38.54 38.68
VWAP represents daily Volume Weighted-Average Price
Page 23 of 80
Page 24
Hospira’s historical stock prices are provided by Bloomberg LP.
Pfizer makes no claims concerning the accuracy of the information provided on these pages, and will not be held liable for any use of this information.
Date Open Intraday High Intraday Low Close VWAP
HOSPIRA (HSP US) HISTORICAL COMMON STOCK PRICE INFORMATION
15-Aug-2007 38.50 38.65 38.31 38.44 38.51
16-Aug-2007 38.15 38.38 36.88 37.61 37.57
17-Aug-2007 38.34 38.37 37.31 37.80 37.68
20-Aug-2007 37.76 37.86 37.59 37.66 37.70
21-Aug-2007 37.65 38.09 37.57 37.89 37.76
22-Aug-2007 38.03 38.10 37.67 37.99 37.79
23-Aug-2007 38.12 38.43 37.94 38.16 38.20
24-Aug-2007 38.23 38.66 38.16 38.63 38.43
27-Aug-2007 38.57 38.65 38.25 38.25 38.47
28-Aug-2007 38.05 38.32 37.96 37.96 38.15
29-Aug-2007 38.03 38.44 37.89 38.42 38.12
30-Aug-2007 38.15 38.49 38.15 38.29 38.32
31-Aug-2007 38.58 38.72 38.19 38.65 38.52
04-Sep-2007 38.80 38.92 38.50 38.92 38.77
05-Sep-2007 38.70 38.77 38.60 38.71 38.67
06-Sep-2007 38.69 39.00 38.69 38.98 38.94
07-Sep-2007 38.70 39.00 38.64 38.71 38.78
10-Sep-2007 38.75 39.25 38.70 39.04 38.92
11-Sep-2007 39.20 39.20 38.89 39.06 39.04
12-Sep-2007 38.90 39.27 38.80 39.07 39.08
13-Sep-2007 39.25 39.41 39.14 39.32 39.27
14-Sep-2007 39.15 39.38 38.95 39.31 39.16
17-Sep-2007 39.25 39.30 38.99 39.03 39.06
18-Sep-2007 39.10 39.71 39.01 39.61 39.41
19-Sep-2007 39.68 40.47 39.55 40.47 40.05
20-Sep-2007 40.47 40.73 40.27 40.28 40.48
21-Sep-2007 40.67 41.07 40.28 40.79 40.81
24-Sep-2007 40.88 40.88 40.47 40.70 40.60
25-Sep-2007 40.59 40.90 40.52 40.85 40.73
26-Sep-2007 40.95 41.38 40.89 41.28 41.26
27-Sep-2007 41.28 41.45 41.10 41.39 41.27
28-Sep-2007 41.43 41.50 41.27 41.45 41.40
01-Oct-2007 41.60 41.80 41.50 41.69 41.69
02-Oct-2007 41.71 41.79 41.18 41.54 41.43
03-Oct-2007 41.30 41.50 41.16 41.34 41.30
04-Oct-2007 41.39 41.61 41.30 41.44 41.46
VWAP represents daily Volume Weighted-Average Price
Page 24 of 80
Page 25
Hospira’s historical stock prices are provided by Bloomberg LP.
Pfizer makes no claims concerning the accuracy of the information provided on these pages, and will not be held liable for any use of this information.
Date Open Intraday High Intraday Low Close VWAP
HOSPIRA (HSP US) HISTORICAL COMMON STOCK PRICE INFORMATION
05-Oct-2007 41.60 41.60 41.30 41.56 41.47
08-Oct-2007 41.58 41.64 41.16 41.30 41.34
09-Oct-2007 41.35 41.65 41.16 41.64 41.39
10-Oct-2007 41.62 41.71 41.42 41.65 41.57
11-Oct-2007 41.75 41.80 41.41 41.44 41.57
12-Oct-2007 41.38 41.59 41.11 41.20 41.35
15-Oct-2007 41.00 41.20 40.79 41.01 40.97
16-Oct-2007 41.04 41.11 40.70 41.03 40.92
17-Oct-2007 41.26 41.32 40.66 40.84 40.88
18-Oct-2007 40.74 41.36 40.68 40.92 41.04
19-Oct-2007 40.70 41.10 40.32 40.32 40.74
22-Oct-2007 40.29 40.38 39.93 40.34 40.20
23-Oct-2007 40.40 40.76 40.17 40.63 40.50
24-Oct-2007 40.54 40.54 39.69 40.43 40.12
25-Oct-2007 40.41 40.79 40.29 40.67 40.56
26-Oct-2007 40.97 40.97 40.62 40.89 40.81
29-Oct-2007 41.05 41.23 40.71 41.14 41.06
30-Oct-2007 41.13 41.26 40.84 40.91 41.01
31-Oct-2007 40.98 41.40 40.60 41.33 41.03
01-Nov-2007 41.23 41.68 40.95 41.26 41.40
02-Nov-2007 41.31 41.61 41.13 41.52 41.38
05-Nov-2007 41.07 41.33 40.83 41.11 41.03
06-Nov-2007 41.27 41.92 41.18 41.85 41.46
07-Nov-2007 41.65 41.90 39.50 39.50 41.40
08-Nov-2007 39.23 40.13 38.90 39.71 39.46
09-Nov-2007 39.21 40.08 38.80 39.40 39.51
12-Nov-2007 39.30 39.92 39.30 39.42 39.69
13-Nov-2007 39.67 40.79 39.45 40.79 40.20
14-Nov-2007 40.96 41.21 40.50 41.08 40.96
15-Nov-2007 41.00 41.26 40.33 40.39 40.71
16-Nov-2007 41.13 41.41 40.34 41.29 40.95
19-Nov-2007 41.03 41.84 41.01 41.67 41.59
20-Nov-2007 41.65 42.24 41.65 42.13 41.88
21-Nov-2007 41.92 42.86 41.75 42.43 42.39
23-Nov-2007 42.59 42.60 42.25 42.38 42.39
26-Nov-2007 42.30 42.68 41.93 41.95 42.24
VWAP represents daily Volume Weighted-Average Price
Page 25 of 80
Page 26
Hospira’s historical stock prices are provided by Bloomberg LP.
Pfizer makes no claims concerning the accuracy of the information provided on these pages, and will not be held liable for any use of this information.
Date Open Intraday High Intraday Low Close VWAP
HOSPIRA (HSP US) HISTORICAL COMMON STOCK PRICE INFORMATION
27-Nov-2007 42.08 42.77 41.91 42.66 42.29
28-Nov-2007 42.88 43.00 42.45 43.00 42.80
29-Nov-2007 42.78 43.00 42.65 42.94 42.88
30-Nov-2007 43.32 43.53 42.93 43.30 43.20
03-Dec-2007 43.55 43.55 42.33 42.48 42.57
04-Dec-2007 42.40 43.29 42.40 43.03 43.06
05-Dec-2007 43.32 43.40 42.86 43.16 43.08
06-Dec-2007 43.14 43.42 42.95 43.38 43.23
07-Dec-2007 43.37 44.14 43.37 43.93 43.58
10-Dec-2007 43.96 43.99 43.31 43.51 43.63
11-Dec-2007 43.49 43.57 42.64 42.79 42.96
12-Dec-2007 43.29 44.15 43.05 44.09 43.89
13-Dec-2007 43.96 44.51 43.84 44.51 44.19
14-Dec-2007 44.12 44.64 44.06 44.06 44.29
17-Dec-2007 43.82 44.13 42.73 42.73 43.19
18-Dec-2007 42.95 43.33 42.71 43.20 43.05
19-Dec-2007 43.37 43.37 42.76 42.81 43.00
20-Dec-2007 43.04 43.17 42.78 43.01 42.94
21-Dec-2007 43.39 43.60 42.87 42.95 43.18
24-Dec-2007 43.27 43.39 43.01 43.18 43.21
26-Dec-2007 43.17 43.50 43.08 43.48 43.33
27-Dec-2007 43.43 43.50 43.11 43.17 43.28
28-Dec-2007 43.20 43.60 43.08 43.29 43.36
31-Dec-2007 43.19 43.29 42.61 42.64 42.77
02-Jan-2008 42.38 42.92 41.86 41.97 42.20
03-Jan-2008 42.00 42.14 41.65 41.72 41.84
04-Jan-2008 41.45 41.58 40.73 40.73 41.23
07-Jan-2008 40.74 40.89 40.36 40.74 40.62
08-Jan-2008 40.88 41.10 40.57 40.72 40.84
09-Jan-2008 40.45 42.72 40.41 42.48 41.90
10-Jan-2008 42.12 42.26 41.84 42.00 42.05
11-Jan-2008 41.68 42.98 41.67 42.87 42.63
14-Jan-2008 43.06 43.06 42.39 42.47 42.59
15-Jan-2008 42.05 42.45 41.67 41.86 41.97
16-Jan-2008 41.90 42.43 41.80 42.16 42.12
17-Jan-2008 42.20 42.93 42.18 42.47 42.66
VWAP represents daily Volume Weighted-Average Price
Page 26 of 80
Page 27
Hospira’s historical stock prices are provided by Bloomberg LP.
Pfizer makes no claims concerning the accuracy of the information provided on these pages, and will not be held liable for any use of this information.
Date Open Intraday High Intraday Low Close VWAP
HOSPIRA (HSP US) HISTORICAL COMMON STOCK PRICE INFORMATION
18-Jan-2008 42.75 42.75 41.39 41.52 41.95
22-Jan-2008 39.78 41.14 39.78 40.77 40.79
23-Jan-2008 39.99 40.84 39.51 40.74 40.12
24-Jan-2008 40.74 40.92 40.25 40.64 40.62
25-Jan-2008 40.81 40.81 39.78 39.90 40.26
28-Jan-2008 40.07 40.66 39.77 40.66 40.31
29-Jan-2008 40.76 41.00 40.50 40.80 40.78
30-Jan-2008 40.70 41.23 40.50 40.58 40.83
31-Jan-2008 40.25 41.27 40.17 41.01 40.76
01-Feb-2008 41.16 41.88 41.13 41.75 41.64
04-Feb-2008 41.75 41.94 41.64 41.72 41.82
05-Feb-2008 41.30 41.49 40.90 40.97 41.06
06-Feb-2008 41.21 41.32 40.98 41.07 41.10
07-Feb-2008 41.03 41.42 40.82 41.38 41.15
08-Feb-2008 41.26 41.44 41.00 41.06 41.18
11-Feb-2008 41.00 41.30 40.80 41.23 41.14
12-Feb-2008 41.42 41.69 41.25 41.59 41.49
13-Feb-2008 41.83 41.95 41.47 41.53 41.69
14-Feb-2008 41.61 41.75 40.95 41.00 41.23
15-Feb-2008 40.96 41.35 40.79 41.32 41.11
19-Feb-2008 41.68 41.68 40.80 41.06 41.14
20-Feb-2008 40.80 41.27 40.51 41.21 40.89
21-Feb-2008 41.17 41.39 39.97 40.37 40.59
22-Feb-2008 40.52 40.57 39.96 40.52 40.25
25-Feb-2008 40.77 41.01 40.38 40.57 40.64
26-Feb-2008 40.45 40.45 39.96 40.17 40.17
27-Feb-2008 39.98 40.26 39.24 39.90 40.00
28-Feb-2008 41.09 43.45 41.09 42.92 42.88
29-Feb-2008 42.71 43.00 42.28 42.56 42.54
03-Mar-2008 42.67 42.99 42.35 42.90 42.73
04-Mar-2008 42.59 44.00 42.59 43.80 43.45
05-Mar-2008 43.76 43.95 43.26 43.45 43.62
06-Mar-2008 43.40 43.62 42.73 42.73 43.04
07-Mar-2008 42.45 42.72 41.83 42.09 42.12
10-Mar-2008 42.12 42.48 41.95 42.09 42.19
11-Mar-2008 42.85 42.95 41.83 42.27 42.20
VWAP represents daily Volume Weighted-Average Price
Page 27 of 80
Page 28
Hospira’s historical stock prices are provided by Bloomberg LP.
Pfizer makes no claims concerning the accuracy of the information provided on these pages, and will not be held liable for any use of this information.
Date Open Intraday High Intraday Low Close VWAP
HOSPIRA (HSP US) HISTORICAL COMMON STOCK PRICE INFORMATION
12-Mar-2008 42.48 42.81 42.27 42.38 42.56
13-Mar-2008 41.96 42.73 41.77 42.45 42.37
14-Mar-2008 42.86 42.86 41.75 42.00 42.16
17-Mar-2008 41.40 42.34 41.40 42.00 42.10
18-Mar-2008 42.37 43.02 42.23 43.02 42.60
19-Mar-2008 43.43 43.69 42.61 42.65 43.06
20-Mar-2008 43.00 43.21 42.65 43.00 42.97
24-Mar-2008 43.32 43.54 42.85 43.38 43.29
25-Mar-2008 43.36 43.56 43.17 43.31 43.32
26-Mar-2008 43.17 43.39 42.69 42.72 42.88
27-Mar-2008 42.81 42.93 42.52 42.52 42.69
28-Mar-2008 42.82 43.00 42.27 42.33 42.66
31-Mar-2008 42.29 42.88 42.26 42.77 42.66
01-Apr-2008 43.00 43.59 42.75 43.56 43.41
02-Apr-2008 43.65 43.93 43.38 43.42 43.65
03-Apr-2008 43.31 43.43 42.70 42.88 42.90
04-Apr-2008 42.79 43.12 42.73 43.02 42.98
07-Apr-2008 43.31 43.31 42.65 42.83 42.88
08-Apr-2008 42.68 42.79 42.31 42.64 42.59
09-Apr-2008 42.59 42.74 42.38 42.64 42.64
10-Apr-2008 42.20 42.40 41.81 42.03 42.17
11-Apr-2008 42.02 42.02 40.74 40.86 41.17
14-Apr-2008 40.76 40.77 40.36 40.56 40.56
15-Apr-2008 40.74 40.74 40.08 40.24 40.37
16-Apr-2008 40.45 40.85 40.17 40.79 40.59
17-Apr-2008 40.75 40.79 40.46 40.61 40.63
18-Apr-2008 41.18 41.69 40.71 41.29 41.32
21-Apr-2008 41.16 41.36 41.05 41.19 41.23
22-Apr-2008 41.10 41.10 40.43 40.87 40.75
23-Apr-2008 40.90 41.51 40.84 41.51 41.22
24-Apr-2008 41.59 42.02 41.30 41.87 41.68
25-Apr-2008 42.06 42.13 41.47 41.74 41.66
28-Apr-2008 41.67 41.96 41.60 41.78 41.83
29-Apr-2008 41.81 42.01 41.75 41.83 41.88
30-Apr-2008 41.76 41.88 41.15 41.15 41.45
01-May-2008 41.20 42.30 41.07 42.27 41.94
VWAP represents daily Volume Weighted-Average Price
Page 28 of 80
Page 29
Hospira’s historical stock prices are provided by Bloomberg LP.
Pfizer makes no claims concerning the accuracy of the information provided on these pages, and will not be held liable for any use of this information.
Date Open Intraday High Intraday Low Close VWAP
HOSPIRA (HSP US) HISTORICAL COMMON STOCK PRICE INFORMATION
02-May-2008 42.55 42.55 41.88 41.98 42.16
05-May-2008 41.71 42.16 41.43 42.03 41.94
06-May-2008 41.74 42.16 41.55 42.16 41.79
07-May-2008 42.22 42.27 40.31 40.40 40.82
08-May-2008 40.50 41.12 40.10 40.75 40.84
09-May-2008 40.75 41.20 40.66 40.99 40.91
12-May-2008 40.80 40.94 40.67 40.90 40.77
13-May-2008 40.85 41.25 40.77 40.97 40.99
14-May-2008 41.07 41.15 40.33 40.48 40.63
15-May-2008 40.34 40.50 39.89 40.22 40.14
16-May-2008 40.00 40.32 39.34 39.96 39.74
19-May-2008 39.87 40.05 39.64 39.80 39.85
20-May-2008 39.75 40.11 39.56 39.86 39.84
21-May-2008 39.84 40.16 39.36 39.44 39.71
22-May-2008 39.42 40.03 39.30 39.91 39.80
23-May-2008 39.81 39.99 39.47 39.73 39.74
27-May-2008 39.85 40.26 39.73 40.25 40.07
28-May-2008 40.26 40.70 40.15 40.61 40.50
29-May-2008 40.61 41.57 40.61 41.36 41.37
30-May-2008 41.26 42.01 41.23 41.94 41.77
02-Jun-2008 41.80 41.84 41.30 41.44 41.46
03-Jun-2008 41.50 41.93 41.47 41.86 41.77
04-Jun-2008 41.75 42.33 41.64 42.29 42.09
05-Jun-2008 42.36 42.70 42.09 42.67 42.42
06-Jun-2008 42.49 42.49 41.74 41.74 41.99
09-Jun-2008 41.88 42.00 41.43 41.81 41.63
10-Jun-2008 41.65 41.84 41.41 41.74 41.62
11-Jun-2008 41.58 41.79 41.14 41.25 41.42
12-Jun-2008 41.47 41.53 41.03 41.24 41.22
13-Jun-2008 41.27 41.55 41.07 41.31 41.30
16-Jun-2008 41.02 41.11 40.54 40.80 40.78
17-Jun-2008 40.95 41.00 40.68 40.72 40.83
18-Jun-2008 40.58 40.62 39.79 39.95 40.24
19-Jun-2008 39.76 40.33 39.76 39.98 40.07
20-Jun-2008 39.77 40.05 39.60 39.96 39.82
23-Jun-2008 40.18 40.20 39.76 39.92 39.89
VWAP represents daily Volume Weighted-Average Price
Page 29 of 80
Page 30
Hospira’s historical stock prices are provided by Bloomberg LP.
Pfizer makes no claims concerning the accuracy of the information provided on these pages, and will not be held liable for any use of this information.
Date Open Intraday High Intraday Low Close VWAP
HOSPIRA (HSP US) HISTORICAL COMMON STOCK PRICE INFORMATION
24-Jun-2008 39.85 40.06 39.65 39.67 39.86
25-Jun-2008 39.84 39.96 39.61 39.81 39.80
26-Jun-2008 39.47 40.00 39.28 39.61 39.73
27-Jun-2008 39.51 39.94 39.20 39.32 39.45
30-Jun-2008 39.24 40.32 39.13 40.11 40.01
01-Jul-2008 39.72 40.21 39.55 40.21 39.95
02-Jul-2008 40.12 40.48 40.11 40.30 40.35
03-Jul-2008 40.50 40.50 38.25 38.62 38.89
07-Jul-2008 38.82 39.37 38.55 39.08 39.07
08-Jul-2008 38.93 39.64 38.93 39.36 39.40
09-Jul-2008 39.49 39.70 38.93 38.99 39.39
10-Jul-2008 39.03 39.37 38.60 39.02 38.91
11-Jul-2008 39.49 39.49 38.69 38.84 38.95
14-Jul-2008 38.93 39.20 38.67 38.82 38.93
15-Jul-2008 38.61 39.18 38.58 38.99 38.98
16-Jul-2008 38.95 39.45 38.41 38.62 38.82
17-Jul-2008 38.70 38.79 37.93 38.70 38.44
18-Jul-2008 38.61 38.85 37.99 38.24 38.36
21-Jul-2008 38.32 38.32 37.42 37.51 37.72
22-Jul-2008 37.35 38.27 37.27 38.20 37.96
23-Jul-2008 38.17 38.22 37.72 38.05 37.94
24-Jul-2008 37.99 38.29 37.84 37.97 38.00
25-Jul-2008 38.11 38.48 37.97 38.30 38.21
28-Jul-2008 38.11 38.30 37.76 37.88 37.97
29-Jul-2008 37.75 38.21 37.75 37.90 38.00
30-Jul-2008 37.83 38.45 37.50 37.78 37.85
31-Jul-2008 37.68 38.25 37.50 38.16 38.06
01-Aug-2008 38.11 38.24 36.96 36.96 37.32
04-Aug-2008 37.01 38.01 36.99 37.77 37.38
05-Aug-2008 38.02 39.75 37.46 39.75 37.83
06-Aug-2008 37.17 38.95 37.13 38.32 38.41
07-Aug-2008 38.16 38.61 37.70 38.08 38.27
08-Aug-2008 37.96 38.84 37.96 38.82 38.56
11-Aug-2008 38.67 39.02 37.80 38.99 38.72
12-Aug-2008 38.64 39.81 38.62 39.69 39.52
13-Aug-2008 39.77 40.05 39.32 39.99 39.81
VWAP represents daily Volume Weighted-Average Price
Page 30 of 80
Page 31
Hospira’s historical stock prices are provided by Bloomberg LP.
Pfizer makes no claims concerning the accuracy of the information provided on these pages, and will not be held liable for any use of this information.
Date Open Intraday High Intraday Low Close VWAP
HOSPIRA (HSP US) HISTORICAL COMMON STOCK PRICE INFORMATION
14-Aug-2008 39.87 39.95 39.30 39.42 39.59
15-Aug-2008 39.57 39.85 39.05 39.64 39.53
18-Aug-2008 39.83 39.97 39.04 39.21 39.39
19-Aug-2008 39.13 39.36 38.74 38.89 38.91
20-Aug-2008 38.89 38.89 38.01 38.29 38.31
21-Aug-2008 38.21 38.89 38.06 38.68 38.56
22-Aug-2008 38.71 39.11 38.56 39.06 38.98
25-Aug-2008 38.88 38.95 38.66 38.74 38.79
26-Aug-2008 38.68 39.22 38.55 39.13 39.05
27-Aug-2008 39.24 39.51 39.13 39.37 39.33
28-Aug-2008 39.39 40.30 39.39 40.29 40.04
29-Aug-2008 40.18 40.54 40.05 40.36 40.39
02-Sep-2008 40.61 41.22 39.80 39.80 40.29
03-Sep-2008 39.91 40.29 39.80 40.25 40.13
04-Sep-2008 40.01 40.18 39.29 39.44 39.68
05-Sep-2008 39.33 39.33 38.60 39.01 38.87
08-Sep-2008 39.55 39.90 39.28 39.74 39.64
09-Sep-2008 39.69 40.10 39.32 39.38 39.73
10-Sep-2008 39.64 39.74 39.36 39.46 39.53
11-Sep-2008 39.14 39.40 39.03 39.29 39.24
12-Sep-2008 39.11 39.56 38.89 39.56 39.35
15-Sep-2008 38.90 39.84 38.65 39.46 39.55
16-Sep-2008 39.53 39.77 37.50 39.60 39.53
17-Sep-2008 39.14 39.68 38.58 38.58 39.32
18-Sep-2008 38.84 40.46 38.10 39.46 38.99
19-Sep-2008 40.59 40.59 38.12 38.50 38.92
22-Sep-2008 38.29 38.38 37.32 37.32 37.84
23-Sep-2008 37.38 38.47 37.33 37.67 37.94
24-Sep-2008 37.61 38.75 37.45 38.63 38.37
25-Sep-2008 38.78 39.45 38.51 39.27 39.22
26-Sep-2008 39.06 39.68 39.02 39.26 39.36
29-Sep-2008 39.21 39.43 37.60 38.55 38.68
30-Sep-2008 39.25 39.49 37.70 38.20 38.16
01-Oct-2008 38.08 38.45 37.75 38.34 38.12
02-Oct-2008 38.34 38.85 37.48 37.55 38.09
03-Oct-2008 38.00 38.00 37.26 37.29 37.73
VWAP represents daily Volume Weighted-Average Price
Page 31 of 80
Page 32
Hospira’s historical stock prices are provided by Bloomberg LP.
Pfizer makes no claims concerning the accuracy of the information provided on these pages, and will not be held liable for any use of this information.
Date Open Intraday High Intraday Low Close VWAP
HOSPIRA (HSP US) HISTORICAL COMMON STOCK PRICE INFORMATION
06-Oct-2008 36.85 37.28 34.70 35.59 35.77
07-Oct-2008 35.80 36.15 34.36 34.36 35.47
08-Oct-2008 33.83 34.37 32.55 32.55 33.39
09-Oct-2008 32.58 32.77 29.85 30.02 31.54
10-Oct-2008 28.75 30.96 25.55 29.19 28.95
13-Oct-2008 29.98 32.01 29.28 31.87 31.21
14-Oct-2008 32.68 33.97 31.07 31.71 32.06
15-Oct-2008 31.27 31.36 29.88 30.02 30.76
16-Oct-2008 29.99 30.26 28.47 30.25 29.57
17-Oct-2008 27.02 30.62 27.02 29.59 29.97
20-Oct-2008 29.77 30.14 28.73 30.14 29.48
21-Oct-2008 29.93 30.45 29.67 29.78 30.05
22-Oct-2008 29.16 29.57 27.40 27.89 28.76
23-Oct-2008 27.94 29.10 26.99 28.11 28.01
24-Oct-2008 26.80 27.84 26.23 27.26 27.20
27-Oct-2008 26.90 27.50 25.96 26.02 26.68
28-Oct-2008 26.36 26.94 25.42 26.82 26.25
29-Oct-2008 26.75 27.01 25.35 25.36 26.08
30-Oct-2008 25.55 27.38 25.55 27.26 26.90
31-Oct-2008 26.94 27.90 23.00 27.82 27.39
03-Nov-2008 27.64 28.68 27.43 28.66 28.13
04-Nov-2008 29.02 29.16 28.16 28.65 28.63
05-Nov-2008 28.77 32.63 26.00 30.60 31.17
06-Nov-2008 30.28 31.05 29.81 30.04 30.34
07-Nov-2008 30.14 31.34 30.14 30.92 30.83
10-Nov-2008 31.20 31.92 30.37 30.70 30.98
11-Nov-2008 30.45 31.08 29.99 30.30 30.36
12-Nov-2008 29.98 30.27 29.10 29.23 29.48
13-Nov-2008 29.16 31.17 28.69 31.17 30.01
14-Nov-2008 30.65 31.48 29.96 30.02 30.68
17-Nov-2008 29.69 30.43 29.15 29.42 29.83
18-Nov-2008 28.82 30.13 28.40 29.16 29.23
19-Nov-2008 29.16 29.76 27.19 27.19 28.20
20-Nov-2008 27.01 28.36 26.12 26.29 27.29
21-Nov-2008 26.58 27.22 25.24 27.18 26.13
24-Nov-2008 27.51 29.33 26.78 28.88 28.50
VWAP represents daily Volume Weighted-Average Price
Page 32 of 80
Page 33
Hospira’s historical stock prices are provided by Bloomberg LP.
Pfizer makes no claims concerning the accuracy of the information provided on these pages, and will not be held liable for any use of this information.
Date Open Intraday High Intraday Low Close VWAP
HOSPIRA (HSP US) HISTORICAL COMMON STOCK PRICE INFORMATION
25-Nov-2008 29.05 29.48 28.36 28.93 28.86
26-Nov-2008 28.35 29.19 27.99 29.12 28.95
28-Nov-2008 29.06 30.03 28.96 30.03 29.71
01-Dec-2008 29.68 29.90 28.11 28.11 28.80
02-Dec-2008 28.78 28.78 27.78 28.62 28.24
03-Dec-2008 28.03 29.09 27.83 29.00 28.48
04-Dec-2008 28.59 28.91 26.97 27.34 27.80
05-Dec-2008 26.97 27.68 26.22 27.53 27.05
08-Dec-2008 28.10 28.84 27.88 28.67 28.48
09-Dec-2008 28.46 28.67 27.81 28.06 28.28
10-Dec-2008 28.18 28.58 27.73 28.03 28.09
11-Dec-2008 27.82 28.24 27.38 27.62 27.82
12-Dec-2008 26.97 27.14 26.50 26.82 26.80
15-Dec-2008 26.88 27.12 26.27 26.56 26.64
16-Dec-2008 26.65 27.86 26.42 27.84 27.30
17-Dec-2008 27.57 28.28 27.33 27.81 27.87
18-Dec-2008 27.97 28.56 26.42 26.71 27.31
19-Dec-2008 26.91 27.65 25.82 26.05 26.51
22-Dec-2008 26.20 26.35 25.70 26.16 25.97
23-Dec-2008 26.20 26.38 25.58 25.68 25.91
24-Dec-2008 25.70 26.02 25.50 25.88 25.85
26-Dec-2008 25.99 26.06 25.73 25.94 25.90
29-Dec-2008 25.84 25.94 25.69 25.88 25.80
30-Dec-2008 25.97 26.32 25.68 26.32 26.11
31-Dec-2008 26.43 26.93 26.17 26.82 26.74
02-Jan-2009 26.79 27.56 26.58 27.47 27.24
05-Jan-2009 27.31 27.34 26.72 26.97 26.91
06-Jan-2009 27.15 27.36 26.83 27.03 27.01
07-Jan-2009 26.75 27.19 26.44 26.84 26.90
08-Jan-2009 26.83 26.83 25.73 26.07 26.02
09-Jan-2009 26.06 26.25 25.30 26.02 25.90
12-Jan-2009 26.02 26.10 25.66 25.83 25.86
13-Jan-2009 25.82 26.04 25.34 25.51 25.61
14-Jan-2009 25.12 25.23 24.40 24.61 24.69
15-Jan-2009 24.59 25.09 24.01 25.02 24.55
16-Jan-2009 25.38 27.14 25.38 27.04 26.47
VWAP represents daily Volume Weighted-Average Price
Page 33 of 80
Page 34
Hospira’s historical stock prices are provided by Bloomberg LP.
Pfizer makes no claims concerning the accuracy of the information provided on these pages, and will not be held liable for any use of this information.
Date Open Intraday High Intraday Low Close VWAP
HOSPIRA (HSP US) HISTORICAL COMMON STOCK PRICE INFORMATION
20-Jan-2009 25.97 26.18 24.69 24.75 25.15
21-Jan-2009 24.94 25.13 23.89 24.62 24.32
22-Jan-2009 24.31 24.73 23.86 24.43 24.35
23-Jan-2009 24.08 24.38 23.54 24.02 24.06
26-Jan-2009 24.31 24.60 23.50 23.73 23.86
27-Jan-2009 23.98 24.69 23.93 24.61 24.48
28-Jan-2009 24.77 25.83 24.68 25.48 25.40
29-Jan-2009 25.25 25.71 25.24 25.30 25.44
30-Jan-2009 25.11 25.37 24.71 24.90 24.98
02-Feb-2009 24.45 25.36 24.45 25.16 25.12
03-Feb-2009 25.02 25.70 24.87 25.57 25.38
04-Feb-2009 25.65 26.54 25.39 25.84 26.01
05-Feb-2009 25.57 25.97 25.37 25.80 25.75
06-Feb-2009 25.75 26.45 25.61 26.38 26.15
09-Feb-2009 26.26 26.40 25.71 25.96 25.94
10-Feb-2009 25.81 26.18 25.08 25.18 25.40
11-Feb-2009 25.53 25.57 25.19 25.42 25.38
12-Feb-2009 25.16 26.35 24.88 26.26 25.75
13-Feb-2009 26.23 26.82 25.84 26.36 26.47
17-Feb-2009 24.66 26.36 24.62 25.25 25.61
18-Feb-2009 25.35 25.63 25.02 25.55 25.33
19-Feb-2009 25.49 26.05 25.46 25.79 25.73
20-Feb-2009 25.50 25.83 25.21 25.58 25.53
23-Feb-2009 25.74 25.86 24.84 25.00 25.11
24-Feb-2009 25.00 25.49 24.78 25.33 25.18
25-Feb-2009 25.25 25.29 24.46 24.82 24.87
26-Feb-2009 24.76 25.09 24.00 24.01 24.42
27-Feb-2009 23.75 23.84 23.13 23.20 23.46
02-Mar-2009 22.81 22.83 21.83 21.89 22.16
03-Mar-2009 22.09 22.67 21.89 22.37 22.32
04-Mar-2009 21.86 23.32 21.86 23.01 22.90
05-Mar-2009 22.64 22.69 21.61 21.82 21.90
06-Mar-2009 22.17 22.38 21.69 22.21 22.00
09-Mar-2009 21.74 22.18 21.21 21.38 21.60
10-Mar-2009 21.51 22.37 21.48 22.36 22.15
11-Mar-2009 22.36 23.44 22.36 22.91 22.99
VWAP represents daily Volume Weighted-Average Price
Page 34 of 80
Page 35
Hospira’s historical stock prices are provided by Bloomberg LP.
Pfizer makes no claims concerning the accuracy of the information provided on these pages, and will not be held liable for any use of this information.
Date Open Intraday High Intraday Low Close VWAP
HOSPIRA (HSP US) HISTORICAL COMMON STOCK PRICE INFORMATION
12-Mar-2009 22.99 23.91 22.68 23.90 23.58
13-Mar-2009 24.08 24.71 23.74 24.57 24.43
16-Mar-2009 24.88 25.47 24.72 24.80 25.09
17-Mar-2009 24.77 25.30 24.59 25.29 25.00
18-Mar-2009 25.18 26.06 25.09 25.64 25.57
19-Mar-2009 25.83 25.89 24.86 25.23 25.18
20-Mar-2009 25.29 25.94 24.89 25.10 25.31
23-Mar-2009 25.49 26.33 25.11 26.33 25.90
24-Mar-2009 26.25 28.86 25.99 28.28 28.07
25-Mar-2009 28.88 30.46 28.68 29.86 29.57
26-Mar-2009 29.95 30.66 29.60 30.64 30.20
27-Mar-2009 30.27 31.11 30.00 30.83 30.74
30-Mar-2009 30.24 30.55 29.73 30.50 30.29
31-Mar-2009 30.50 31.40 30.43 30.86 30.94
01-Apr-2009 30.35 30.70 29.96 30.61 30.45
02-Apr-2009 31.19 32.00 31.02 31.48 31.64
03-Apr-2009 31.61 31.78 30.22 30.44 30.64
06-Apr-2009 30.51 30.87 30.20 30.65 30.49
07-Apr-2009 30.28 31.35 29.86 30.94 30.98
08-Apr-2009 30.94 31.50 30.82 31.43 31.30
09-Apr-2009 32.39 32.39 31.76 32.15 32.02
13-Apr-2009 31.87 32.58 31.75 32.42 32.19
14-Apr-2009 32.20 32.63 31.99 32.33 32.43
15-Apr-2009 32.32 32.32 31.03 31.40 31.46
16-Apr-2009 31.56 31.90 31.23 31.64 31.53
17-Apr-2009 31.64 33.02 31.64 32.91 32.51
20-Apr-2009 32.56 32.86 31.80 31.94 32.12
21-Apr-2009 31.64 32.00 31.30 31.83 31.65
22-Apr-2009 31.53 32.23 31.36 31.81 31.92
23-Apr-2009 31.65 31.70 30.52 30.95 30.95
24-Apr-2009 31.16 31.91 31.10 31.60 31.60
27-Apr-2009 31.42 31.70 30.97 31.34 31.39
28-Apr-2009 31.51 33.88 31.51 32.99 32.93
29-Apr-2009 33.00 33.08 32.42 32.78 32.64
30-Apr-2009 32.97 33.06 32.61 32.87 32.83
01-May-2009 32.82 32.82 31.61 32.29 32.06
VWAP represents daily Volume Weighted-Average Price
Page 35 of 80
Page 36
Hospira’s historical stock prices are provided by Bloomberg LP.
Pfizer makes no claims concerning the accuracy of the information provided on these pages, and will not be held liable for any use of this information.
Date Open Intraday High Intraday Low Close VWAP
HOSPIRA (HSP US) HISTORICAL COMMON STOCK PRICE INFORMATION
04-May-2009 32.60 32.60 31.78 32.36 32.25
05-May-2009 32.21 32.60 31.90 32.59 32.43
06-May-2009 32.78 33.13 32.32 32.65 32.56
07-May-2009 32.94 33.48 32.55 33.41 33.24
08-May-2009 33.65 34.09 33.54 33.92 33.83
11-May-2009 33.62 33.86 33.23 33.70 33.61
12-May-2009 33.78 34.11 33.55 33.92 33.87
13-May-2009 33.50 33.75 33.27 33.36 33.46
14-May-2009 33.07 33.50 32.79 32.84 33.02
15-May-2009 32.83 33.09 32.36 33.04 32.89
18-May-2009 33.30 33.74 33.06 33.70 33.41
19-May-2009 33.63 33.99 33.51 33.55 33.65
20-May-2009 33.79 33.97 33.45 33.51 33.71
21-May-2009 33.04 33.25 32.59 32.87 32.82
22-May-2009 32.93 33.21 32.63 32.79 32.97
26-May-2009 32.46 34.24 32.16 34.18 33.77
27-May-2009 34.20 34.39 33.91 33.95 34.18
28-May-2009 34.10 34.24 33.35 33.72 33.69
29-May-2009 33.84 34.51 33.60 34.50 34.19
01-Jun-2009 34.94 35.14 34.66 35.04 35.01
02-Jun-2009 35.07 36.52 34.90 36.40 36.17
03-Jun-2009 36.22 36.43 35.75 35.97 35.93
04-Jun-2009 36.23 36.23 35.22 35.46 35.50
05-Jun-2009 35.83 35.94 34.79 35.09 35.21
08-Jun-2009 34.97 35.17 34.17 34.54 34.44
09-Jun-2009 34.71 34.82 34.21 34.32 34.39
10-Jun-2009 34.54 34.85 34.02 34.28 34.35
11-Jun-2009 34.25 35.33 34.25 34.91 34.94
12-Jun-2009 34.88 35.31 34.45 34.97 35.02
15-Jun-2009 34.73 34.83 34.00 34.16 34.22
16-Jun-2009 34.30 34.45 33.58 33.64 33.86
17-Jun-2009 33.66 33.88 33.40 33.69 33.72
18-Jun-2009 33.69 34.59 33.69 34.52 34.42
19-Jun-2009 35.68 36.85 34.90 36.53 36.29
22-Jun-2009 36.45 36.47 35.40 36.01 35.89
23-Jun-2009 36.15 36.20 35.57 35.70 35.79
VWAP represents daily Volume Weighted-Average Price
Page 36 of 80
Page 37
Hospira’s historical stock prices are provided by Bloomberg LP.
Pfizer makes no claims concerning the accuracy of the information provided on these pages, and will not be held liable for any use of this information.
Date Open Intraday High Intraday Low Close VWAP
HOSPIRA (HSP US) HISTORICAL COMMON STOCK PRICE INFORMATION
24-Jun-2009 35.83 36.73 35.64 36.57 36.41
25-Jun-2009 36.41 38.64 36.32 38.29 38.09
26-Jun-2009 38.15 38.94 37.72 38.73 38.62
29-Jun-2009 38.87 38.87 38.26 38.82 38.66
30-Jun-2009 38.69 38.85 38.33 38.52 38.51
01-Jul-2009 38.55 38.71 38.00 38.06 38.19
02-Jul-2009 37.85 38.06 37.10 37.10 37.47
06-Jul-2009 37.04 37.79 37.04 37.72 37.53
07-Jul-2009 37.65 38.05 37.35 37.46 37.67
08-Jul-2009 37.66 37.66 36.58 36.64 36.82
09-Jul-2009 36.87 36.87 35.98 36.12 36.22
10-Jul-2009 36.10 37.15 35.58 37.07 36.93
13-Jul-2009 37.22 37.42 36.45 37.07 36.96
14-Jul-2009 37.16 37.48 36.88 37.17 37.18
15-Jul-2009 37.58 37.84 37.01 37.83 37.52
16-Jul-2009 37.96 38.13 37.60 37.85 37.95
17-Jul-2009 37.64 37.81 36.89 37.14 37.18
20-Jul-2009 37.37 37.37 36.83 37.11 37.01
21-Jul-2009 37.46 37.73 36.93 37.24 37.10
22-Jul-2009 37.01 37.33 36.69 36.85 37.04
23-Jul-2009 36.80 37.85 36.71 37.25 37.37
24-Jul-2009 37.13 37.66 37.12 37.66 37.48
27-Jul-2009 37.75 38.00 37.13 37.43 37.34
28-Jul-2009 37.41 37.58 36.98 37.35 37.27
29-Jul-2009 37.53 39.08 36.58 39.05 38.21
30-Jul-2009 38.90 39.55 38.67 38.70 39.01
31-Jul-2009 38.56 39.27 38.38 38.43 38.67
03-Aug-2009 38.86 39.40 38.56 39.40 39.11
04-Aug-2009 39.34 39.65 39.05 39.64 39.39
05-Aug-2009 39.78 39.87 38.76 38.88 38.96
06-Aug-2009 38.73 38.88 37.86 38.06 38.11
07-Aug-2009 38.59 39.00 38.15 38.67 38.72
10-Aug-2009 38.35 39.29 38.35 39.25 38.98
11-Aug-2009 39.31 39.75 38.97 39.56 39.44
12-Aug-2009 39.39 40.46 39.18 40.16 40.07
13-Aug-2009 40.36 40.54 39.54 40.54 40.13
VWAP represents daily Volume Weighted-Average Price
Page 37 of 80
Page 38
Hospira’s historical stock prices are provided by Bloomberg LP.
Pfizer makes no claims concerning the accuracy of the information provided on these pages, and will not be held liable for any use of this information.
Date Open Intraday High Intraday Low Close VWAP
HOSPIRA (HSP US) HISTORICAL COMMON STOCK PRICE INFORMATION
14-Aug-2009 40.58 40.98 39.94 40.09 40.10
17-Aug-2009 39.22 39.52 38.96 39.21 39.18
18-Aug-2009 39.20 39.28 38.47 38.86 38.91
19-Aug-2009 38.61 39.83 38.61 39.75 39.53
20-Aug-2009 39.97 40.17 39.48 40.00 40.00
21-Aug-2009 40.29 40.49 39.90 40.32 40.31
24-Aug-2009 40.50 40.55 40.00 40.13 40.21
25-Aug-2009 40.09 40.50 40.05 40.24 40.27
26-Aug-2009 39.96 40.27 39.72 40.03 39.98
27-Aug-2009 40.00 40.21 39.70 40.15 40.06
28-Aug-2009 40.27 40.27 39.38 39.55 39.61
31-Aug-2009 39.40 39.66 38.94 39.09 39.18
01-Sep-2009 39.36 39.57 38.76 39.15 39.18
02-Sep-2009 39.26 39.33 38.82 39.08 39.12
03-Sep-2009 39.15 39.43 38.74 39.28 39.18
04-Sep-2009 39.39 39.64 39.13 39.60 39.39
08-Sep-2009 39.63 39.80 38.91 39.22 39.27
09-Sep-2009 39.34 39.84 39.27 39.67 39.63
10-Sep-2009 39.78 40.64 39.55 40.64 40.20
11-Sep-2009 40.94 40.97 40.40 40.82 40.71
14-Sep-2009 40.82 41.14 40.57 41.07 40.95
15-Sep-2009 40.95 41.65 40.60 41.57 41.29
16-Sep-2009 41.52 42.19 41.00 42.18 41.80
17-Sep-2009 42.24 44.72 42.10 43.60 43.39
18-Sep-2009 43.52 43.83 42.74 43.12 43.28
21-Sep-2009 42.94 43.98 42.91 43.63 43.59
22-Sep-2009 44.50 44.69 43.63 43.74 43.83
23-Sep-2009 43.90 44.49 43.60 44.00 44.06
24-Sep-2009 44.08 44.97 44.04 44.37 44.39
25-Sep-2009 44.37 44.75 44.05 44.34 44.33
28-Sep-2009 44.44 45.00 44.14 44.87 44.83
29-Sep-2009 44.72 45.08 44.18 44.82 44.76
30-Sep-2009 44.66 44.73 43.62 44.60 44.27
01-Oct-2009 44.31 44.53 43.30 43.34 43.66
02-Oct-2009 43.12 43.45 42.95 43.25 43.25
05-Oct-2009 43.12 43.79 42.81 43.79 43.52
VWAP represents daily Volume Weighted-Average Price
Page 38 of 80
Page 39
Hospira’s historical stock prices are provided by Bloomberg LP.
Pfizer makes no claims concerning the accuracy of the information provided on these pages, and will not be held liable for any use of this information.
Date Open Intraday High Intraday Low Close VWAP
HOSPIRA (HSP US) HISTORICAL COMMON STOCK PRICE INFORMATION
06-Oct-2009 42.93 44.00 42.84 43.99 43.79
07-Oct-2009 43.91 44.22 43.77 44.22 44.06
08-Oct-2009 44.36 44.56 44.15 44.31 44.35
09-Oct-2009 44.37 44.94 44.37 44.88 44.80
12-Oct-2009 44.77 45.46 44.73 45.27 45.19
13-Oct-2009 45.12 45.44 44.62 44.88 44.87
14-Oct-2009 45.07 45.42 44.98 45.33 45.24
15-Oct-2009 45.35 45.82 45.03 45.80 45.62
16-Oct-2009 45.61 46.50 45.07 46.19 45.89
19-Oct-2009 46.35 47.05 46.19 46.95 46.79
20-Oct-2009 47.00 47.54 46.15 46.43 46.34
21-Oct-2009 46.48 46.99 45.88 45.89 46.45
22-Oct-2009 45.89 46.27 45.76 46.11 46.01
23-Oct-2009 46.24 46.59 45.92 45.97 46.18
26-Oct-2009 46.07 46.95 45.61 46.30 46.32
27-Oct-2009 48.00 48.23 45.81 47.11 47.00
28-Oct-2009 47.06 47.36 45.67 45.69 46.48
29-Oct-2009 45.88 46.06 45.06 45.46 45.40
30-Oct-2009 45.19 45.60 44.51 44.64 44.96
02-Nov-2009 44.51 45.50 44.48 44.90 44.96
03-Nov-2009 44.84 45.42 44.44 45.25 45.07
04-Nov-2009 45.22 46.31 45.18 45.70 45.97
05-Nov-2009 45.88 47.19 45.42 47.16 46.94
06-Nov-2009 47.17 47.23 46.48 46.59 46.72
09-Nov-2009 46.96 47.47 46.63 47.47 47.20
10-Nov-2009 47.66 48.00 47.36 47.95 47.85
11-Nov-2009 47.77 48.25 47.53 48.09 47.92
12-Nov-2009 48.02 48.22 47.11 47.16 47.46
13-Nov-2009 47.30 48.10 47.12 47.70 47.73
16-Nov-2009 47.71 48.12 47.69 48.09 47.99
17-Nov-2009 48.24 48.24 47.77 48.15 48.05
18-Nov-2009 48.09 48.09 47.63 47.68 47.76
19-Nov-2009 47.54 47.78 46.86 47.11 47.10
20-Nov-2009 46.86 47.12 46.70 46.88 46.90
23-Nov-2009 47.06 47.89 46.85 47.55 47.50
24-Nov-2009 47.55 47.83 47.19 47.43 47.43
VWAP represents daily Volume Weighted-Average Price
Page 39 of 80
Page 40
Hospira’s historical stock prices are provided by Bloomberg LP.
Pfizer makes no claims concerning the accuracy of the information provided on these pages, and will not be held liable for any use of this information.
Date Open Intraday High Intraday Low Close VWAP
HOSPIRA (HSP US) HISTORICAL COMMON STOCK PRICE INFORMATION
25-Nov-2009 47.46 47.79 47.10 47.71 47.66
27-Nov-2009 46.43 47.41 46.01 47.05 47.05
30-Nov-2009 47.03 47.09 46.57 46.95 46.91
01-Dec-2009 47.45 48.05 47.24 47.90 47.86
02-Dec-2009 47.98 48.65 47.85 48.61 48.45
03-Dec-2009 48.61 48.84 47.76 47.87 48.48
04-Dec-2009 48.33 48.61 47.62 48.12 48.05
07-Dec-2009 48.05 48.44 47.83 47.86 47.96
08-Dec-2009 47.75 48.00 47.26 47.84 47.72
09-Dec-2009 47.72 47.88 47.08 47.58 47.41
10-Dec-2009 47.83 48.31 47.83 48.06 48.13
11-Dec-2009 48.11 48.12 47.36 47.51 47.75
14-Dec-2009 47.79 49.00 47.77 48.97 48.62
15-Dec-2009 48.94 49.88 48.80 49.47 49.52
16-Dec-2009 49.59 49.90 48.61 48.87 49.18
17-Dec-2009 48.82 48.82 47.61 47.81 47.95
18-Dec-2009 48.03 48.28 47.41 47.59 47.75
21-Dec-2009 47.90 48.65 47.87 48.30 48.35
22-Dec-2009 48.23 49.43 48.13 49.43 48.96
23-Dec-2009 49.37 50.24 49.29 50.16 49.96
24-Dec-2009 50.17 50.25 50.05 50.19 50.16
28-Dec-2009 50.06 50.68 50.06 50.58 50.46
29-Dec-2009 50.57 51.32 50.46 51.10 51.03
30-Dec-2009 50.91 51.22 50.90 51.11 51.08
31-Dec-2009 51.13 51.40 50.89 51.00 51.13
04-Jan-2010 51.47 51.47 50.57 50.92 50.89
05-Jan-2010 50.92 51.06 50.48 50.99 50.94
06-Jan-2010 51.03 51.03 50.36 50.46 50.56
07-Jan-2010 50.75 51.33 50.43 51.11 50.98
08-Jan-2010 51.14 51.45 50.85 51.41 51.20
11-Jan-2010 51.28 52.44 51.19 52.31 52.10
12-Jan-2010 52.17 52.45 51.88 52.11 52.15
13-Jan-2010 52.11 52.44 51.76 51.93 51.97
14-Jan-2010 52.07 52.30 51.92 52.26 52.13
15-Jan-2010 52.16 52.20 51.24 51.29 51.56
19-Jan-2010 51.26 51.93 51.26 51.48 51.63
VWAP represents daily Volume Weighted-Average Price
Page 40 of 80
Page 41
Hospira’s historical stock prices are provided by Bloomberg LP.
Pfizer makes no claims concerning the accuracy of the information provided on these pages, and will not be held liable for any use of this information.
Date Open Intraday High Intraday Low Close VWAP
HOSPIRA (HSP US) HISTORICAL COMMON STOCK PRICE INFORMATION
20-Jan-2010 51.52 51.54 50.76 51.48 51.23
21-Jan-2010 51.42 51.88 50.81 51.23 51.21
22-Jan-2010 51.10 51.53 50.43 50.48 51.09
25-Jan-2010 50.89 51.61 50.49 51.20 51.18
26-Jan-2010 51.27 51.38 50.81 51.15 51.12
27-Jan-2010 51.12 51.34 50.62 51.24 51.02
28-Jan-2010 51.25 51.52 50.71 50.96 51.10
29-Jan-2010 51.01 51.21 50.64 50.64 50.93
01-Feb-2010 50.87 50.98 50.24 50.61 50.51
02-Feb-2010 50.60 51.50 50.47 51.50 51.25
03-Feb-2010 51.40 52.79 51.27 51.81 52.23
04-Feb-2010 51.04 51.89 49.05 49.05 50.20
05-Feb-2010 48.94 49.13 47.48 48.56 48.26
08-Feb-2010 48.48 49.18 47.90 48.76 48.69
09-Feb-2010 49.17 50.13 48.99 49.42 49.45
10-Feb-2010 49.13 50.31 49.08 49.55 49.76
11-Feb-2010 49.46 50.15 49.12 50.09 49.86
12-Feb-2010 49.64 50.07 49.29 49.95 49.79
16-Feb-2010 50.16 50.90 49.84 50.90 50.58
17-Feb-2010 51.08 51.71 50.90 51.69 51.53
18-Feb-2010 51.67 51.85 51.36 51.81 51.62
19-Feb-2010 51.58 52.07 51.31 51.80 51.83
22-Feb-2010 51.67 51.92 51.13 51.63 51.53
23-Feb-2010 51.48 51.70 50.71 50.90 50.96
24-Feb-2010 51.22 51.68 50.91 51.68 51.44
25-Feb-2010 51.28 52.13 51.00 52.11 51.73
26-Feb-2010 52.08 52.68 52.03 52.33 52.37
01-Mar-2010 52.41 53.49 52.23 53.42 53.23
02-Mar-2010 53.53 54.21 53.52 53.84 53.93
03-Mar-2010 53.89 54.25 53.67 53.68 53.91
04-Mar-2010 53.80 53.98 53.60 53.83 53.74
05-Mar-2010 53.43 53.95 52.79 53.91 53.61
08-Mar-2010 53.58 53.70 53.00 53.14 53.36
09-Mar-2010 52.94 53.61 52.74 53.53 53.35
10-Mar-2010 53.49 54.44 53.24 54.21 54.08
11-Mar-2010 54.02 54.29 53.76 54.19 54.04
VWAP represents daily Volume Weighted-Average Price
Page 41 of 80
Page 42
Hospira’s historical stock prices are provided by Bloomberg LP.
Pfizer makes no claims concerning the accuracy of the information provided on these pages, and will not be held liable for any use of this information.
Date Open Intraday High Intraday Low Close VWAP
HOSPIRA (HSP US) HISTORICAL COMMON STOCK PRICE INFORMATION
12-Mar-2010 54.16 54.29 53.62 54.00 54.05
15-Mar-2010 54.01 54.86 53.91 54.82 54.51
16-Mar-2010 55.00 56.07 54.95 55.87 55.69
17-Mar-2010 56.20 56.62 55.91 55.99 56.24
18-Mar-2010 56.31 56.99 55.88 56.15 56.15
19-Mar-2010 56.48 57.13 56.27 56.66 56.69
22-Mar-2010 56.75 57.50 56.50 57.38 57.25
23-Mar-2010 57.45 57.67 57.02 57.21 57.28
24-Mar-2010 57.00 57.30 56.89 56.97 57.05
25-Mar-2010 56.94 57.49 56.81 56.85 57.21
26-Mar-2010 57.01 57.20 56.40 56.51 56.65
29-Mar-2010 56.65 57.01 56.47 56.86 56.88
30-Mar-2010 57.00 57.01 56.68 56.86 56.86
31-Mar-2010 56.83 57.02 56.47 56.65 56.75
01-Apr-2010 56.86 57.09 56.09 56.52 56.40
05-Apr-2010 56.78 56.97 56.13 56.93 56.71
06-Apr-2010 56.70 56.99 56.48 56.64 56.72
07-Apr-2010 56.76 56.76 55.92 56.06 56.22
08-Apr-2010 55.97 56.29 55.37 56.18 55.91
09-Apr-2010 56.24 56.76 56.12 56.25 56.39
12-Apr-2010 56.25 56.38 55.86 56.11 56.15
13-Apr-2010 56.32 57.69 56.15 57.50 57.23
14-Apr-2010 57.66 58.04 57.39 57.97 57.89
15-Apr-2010 57.89 57.91 57.49 57.77 57.74
16-Apr-2010 57.74 58.13 56.99 57.10 57.40
19-Apr-2010 56.15 56.85 54.19 55.57 55.42
20-Apr-2010 55.81 57.35 55.64 57.21 56.91
21-Apr-2010 57.27 57.38 56.28 57.05 56.77
22-Apr-2010 56.83 56.96 56.21 56.89 56.59
23-Apr-2010 56.98 57.24 56.57 57.00 56.94
26-Apr-2010 57.19 57.41 55.98 56.00 56.72
27-Apr-2010 55.66 56.28 54.30 54.39 55.09
28-Apr-2010 54.34 54.46 53.39 53.99 54.01
29-Apr-2010 54.36 55.07 54.08 54.93 54.61
30-Apr-2010 55.03 55.03 53.66 53.79 54.08
03-May-2010 53.99 53.99 53.08 53.62 53.47
VWAP represents daily Volume Weighted-Average Price
Page 42 of 80
Page 43
Hospira’s historical stock prices are provided by Bloomberg LP.
Pfizer makes no claims concerning the accuracy of the information provided on these pages, and will not be held liable for any use of this information.
Date Open Intraday High Intraday Low Close VWAP
HOSPIRA (HSP US) HISTORICAL COMMON STOCK PRICE INFORMATION
04-May-2010 54.33 55.91 54.33 55.59 55.47
05-May-2010 55.61 55.75 54.86 54.98 55.15
06-May-2010 54.98 55.21 50.64 53.37 53.83
07-May-2010 53.52 53.52 51.43 52.10 52.30
10-May-2010 54.01 54.48 53.24 53.89 53.71
11-May-2010 53.43 54.06 53.15 53.48 53.68
12-May-2010 53.53 53.53 53.14 53.36 53.36
13-May-2010 53.15 53.44 52.98 53.00 53.23
14-May-2010 52.67 52.84 51.65 52.11 51.99
17-May-2010 52.00 52.95 51.89 52.87 52.55
18-May-2010 53.06 53.55 52.64 52.71 52.96
19-May-2010 52.66 53.08 51.82 52.23 52.31
20-May-2010 51.33 51.74 50.14 50.14 50.69
21-May-2010 49.71 50.66 49.13 50.65 50.15
24-May-2010 50.22 51.39 50.21 50.77 51.00
25-May-2010 49.73 50.28 48.69 50.25 49.63
26-May-2010 50.39 51.66 50.28 50.53 51.11
27-May-2010 51.22 52.12 51.06 52.08 51.57
28-May-2010 52.16 52.63 51.91 52.06 52.29
01-Jun-2010 51.45 51.74 50.59 50.64 51.37
02-Jun-2010 50.93 51.87 50.63 51.87 51.37
03-Jun-2010 52.17 52.45 51.90 52.34 52.25
04-Jun-2010 51.56 51.82 50.66 50.83 51.28
07-Jun-2010 51.15 51.17 50.06 50.11 50.57
08-Jun-2010 50.08 50.42 49.71 50.36 50.11
09-Jun-2010 50.67 51.70 50.67 51.28 51.36
10-Jun-2010 51.93 52.91 51.89 52.87 52.50
11-Jun-2010 52.47 53.81 52.42 53.77 53.36
14-Jun-2010 54.00 54.53 53.79 53.91 54.08
15-Jun-2010 53.97 55.69 53.97 55.66 54.97
16-Jun-2010 55.46 55.89 54.89 55.78 55.67
17-Jun-2010 56.23 56.25 55.34 56.18 55.90
18-Jun-2010 55.99 56.50 55.96 56.39 56.30
21-Jun-2010 56.74 57.00 56.37 56.65 56.82
22-Jun-2010 56.58 57.08 55.26 55.42 56.58
23-Jun-2010 55.55 56.68 55.23 56.50 56.10
VWAP represents daily Volume Weighted-Average Price
Page 43 of 80
Page 44
Hospira’s historical stock prices are provided by Bloomberg LP.
Pfizer makes no claims concerning the accuracy of the information provided on these pages, and will not be held liable for any use of this information.
Date Open Intraday High Intraday Low Close VWAP
HOSPIRA (HSP US) HISTORICAL COMMON STOCK PRICE INFORMATION
24-Jun-2010 55.93 57.72 55.93 57.16 57.30
25-Jun-2010 57.25 57.66 56.90 57.60 57.30
28-Jun-2010 57.45 57.98 57.23 57.72 57.72
29-Jun-2010 57.29 57.98 56.79 57.24 57.25
30-Jun-2010 57.08 57.98 57.04 57.45 57.62
01-Jul-2010 57.15 57.89 56.48 57.16 57.05
02-Jul-2010 57.25 58.00 56.75 57.12 57.26
06-Jul-2010 57.63 58.35 57.40 58.11 57.91
07-Jul-2010 58.05 58.90 57.60 58.82 58.11
08-Jul-2010 59.00 59.39 57.85 58.64 58.43
09-Jul-2010 58.74 58.92 57.84 58.17 58.17
12-Jul-2010 58.04 58.54 57.86 58.23 58.30
13-Jul-2010 58.69 59.19 58.69 58.90 58.97
14-Jul-2010 58.67 59.75 58.60 59.75 59.45
15-Jul-2010 59.09 59.28 58.15 58.69 58.71
16-Jul-2010 58.42 58.83 57.30 57.32 57.80
19-Jul-2010 57.31 57.99 56.91 57.78 57.59
20-Jul-2010 57.42 57.54 56.83 57.46 57.15
21-Jul-2010 57.81 57.89 56.21 56.54 56.86
22-Jul-2010 56.90 58.29 56.90 57.57 57.75
23-Jul-2010 57.53 57.87 57.08 57.20 57.41
26-Jul-2010 57.57 58.49 57.08 58.00 58.05
27-Jul-2010 58.33 58.45 56.70 56.81 57.45
28-Jul-2010 55.39 55.39 51.30 52.72 52.68
29-Jul-2010 52.80 52.80 50.52 51.64 51.20
30-Jul-2010 51.24 52.20 51.00 52.10 51.88
02-Aug-2010 52.58 53.23 52.58 52.99 52.98
03-Aug-2010 52.99 53.24 52.12 52.44 52.65
04-Aug-2010 52.49 52.72 51.28 51.50 51.64
05-Aug-2010 51.12 52.03 50.95 51.98 51.62
06-Aug-2010 51.64 51.93 50.62 51.83 51.39
09-Aug-2010 51.90 51.93 51.43 51.80 51.70
10-Aug-2010 51.35 51.98 50.95 51.64 51.56
11-Aug-2010 50.90 50.90 50.21 50.26 50.40
12-Aug-2010 50.03 52.46 50.00 51.71 51.64
13-Aug-2010 51.52 53.11 51.41 52.47 52.50
VWAP represents daily Volume Weighted-Average Price
Page 44 of 80
Page 45
Hospira’s historical stock prices are provided by Bloomberg LP.
Pfizer makes no claims concerning the accuracy of the information provided on these pages, and will not be held liable for any use of this information.
Date Open Intraday High Intraday Low Close VWAP
HOSPIRA (HSP US) HISTORICAL COMMON STOCK PRICE INFORMATION
16-Aug-2010 52.19 52.44 51.50 52.43 52.25
17-Aug-2010 52.91 53.61 52.25 53.46 53.27
18-Aug-2010 53.46 53.60 53.00 53.06 53.16
19-Aug-2010 52.80 52.89 51.44 52.15 51.95
20-Aug-2010 51.66 52.18 50.54 51.32 51.06
23-Aug-2010 51.71 52.21 51.28 51.78 51.95
24-Aug-2010 51.29 51.38 50.46 51.11 51.11
25-Aug-2010 51.07 51.90 50.93 51.72 51.49
26-Aug-2010 51.93 52.25 50.93 50.97 51.31
27-Aug-2010 51.13 51.81 50.75 51.77 51.48
30-Aug-2010 51.58 51.91 51.22 51.28 51.38
31-Aug-2010 50.90 51.97 50.87 51.36 51.51
01-Sep-2010 52.38 53.02 52.12 52.86 52.77
02-Sep-2010 52.79 54.06 52.79 54.06 53.66
03-Sep-2010 54.42 54.78 53.91 54.30 54.30
07-Sep-2010 53.98 54.59 53.41 53.90 54.13
08-Sep-2010 54.02 54.40 53.83 53.98 54.17
09-Sep-2010 54.40 54.91 54.19 54.38 54.49
10-Sep-2010 54.39 55.00 54.32 54.65 54.76
13-Sep-2010 55.02 55.02 54.56 54.62 54.72
14-Sep-2010 54.42 55.10 54.40 54.58 54.83
15-Sep-2010 54.59 55.58 54.53 55.45 55.29
16-Sep-2010 55.41 55.91 54.73 55.71 55.51
17-Sep-2010 56.00 56.00 55.50 55.68 55.77
20-Sep-2010 55.61 56.37 55.51 56.26 55.93
21-Sep-2010 56.23 56.27 55.01 55.67 55.71
22-Sep-2010 55.61 55.82 55.13 55.29 55.42
23-Sep-2010 54.60 55.89 54.60 55.04 55.37
24-Sep-2010 55.58 55.62 54.98 55.23 55.23
27-Sep-2010 55.17 58.25 54.80 57.10 56.94
28-Sep-2010 56.90 58.15 56.25 57.82 57.56
29-Sep-2010 57.88 58.25 57.24 57.58 57.49
30-Sep-2010 57.69 57.97 56.53 57.01 57.23
01-Oct-2010 57.16 57.19 55.68 56.39 56.27
04-Oct-2010 56.21 56.50 55.74 56.27 56.05
05-Oct-2010 56.79 56.98 56.29 56.87 56.70
VWAP represents daily Volume Weighted-Average Price
Page 45 of 80
Page 46
Hospira’s historical stock prices are provided by Bloomberg LP.
Pfizer makes no claims concerning the accuracy of the information provided on these pages, and will not be held liable for any use of this information.
Date Open Intraday High Intraday Low Close VWAP
HOSPIRA (HSP US) HISTORICAL COMMON STOCK PRICE INFORMATION
06-Oct-2010 56.90 56.90 56.17 56.48 56.40
07-Oct-2010 56.52 56.82 56.17 56.46 56.50
08-Oct-2010 56.61 56.74 56.30 56.46 56.46
11-Oct-2010 56.37 56.72 56.31 56.67 56.55
12-Oct-2010 56.48 57.08 56.15 57.02 56.57
13-Oct-2010 57.08 57.52 57.00 57.40 57.28
14-Oct-2010 57.40 58.18 57.25 57.92 57.90
15-Oct-2010 58.33 58.56 57.87 58.31 58.20
18-Oct-2010 58.38 58.42 58.00 58.42 58.26
19-Oct-2010 57.98 58.20 57.30 57.77 57.65
20-Oct-2010 57.91 58.60 57.76 58.01 58.06
21-Oct-2010 58.10 59.63 57.87 59.45 58.97
22-Oct-2010 59.45 59.60 58.85 59.39 59.36
25-Oct-2010 59.51 59.89 58.45 58.53 59.02
26-Oct-2010 58.17 59.50 56.29 58.66 58.73
27-Oct-2010 58.45 59.22 58.00 59.10 58.67
28-Oct-2010 59.78 59.78 58.86 58.89 59.07
29-Oct-2010 58.66 59.61 58.55 59.48 59.18
01-Nov-2010 59.46 60.15 59.18 59.55 59.62
02-Nov-2010 59.67 60.40 59.42 59.65 59.85
03-Nov-2010 59.68 59.70 59.02 59.48 59.38
04-Nov-2010 59.90 60.49 59.44 59.59 59.74
05-Nov-2010 59.79 59.81 59.29 59.54 59.47
08-Nov-2010 59.01 59.50 58.97 59.11 59.10
09-Nov-2010 59.04 59.57 58.90 59.27 59.28
10-Nov-2010 59.17 59.52 58.38 59.37 59.09
11-Nov-2010 59.15 59.30 58.96 59.13 59.12
12-Nov-2010 58.79 58.88 57.99 58.10 58.31
15-Nov-2010 58.05 58.59 57.96 58.03 58.20
16-Nov-2010 57.80 58.13 57.18 57.32 57.53
17-Nov-2010 57.23 57.69 56.80 56.91 57.15
18-Nov-2010 57.40 57.77 57.03 57.27 57.42
19-Nov-2010 57.38 57.95 57.17 57.70 57.61
22-Nov-2010 57.55 57.69 56.99 57.40 57.41
23-Nov-2010 56.95 57.17 56.50 56.52 56.76
24-Nov-2010 56.80 57.45 56.80 57.21 57.18
VWAP represents daily Volume Weighted-Average Price
Page 46 of 80
Page 47
Hospira’s historical stock prices are provided by Bloomberg LP.
Pfizer makes no claims concerning the accuracy of the information provided on these pages, and will not be held liable for any use of this information.
Date Open Intraday High Intraday Low Close VWAP
HOSPIRA (HSP US) HISTORICAL COMMON STOCK PRICE INFORMATION
26-Nov-2010 56.91 57.05 56.50 56.65 56.78
29-Nov-2010 56.45 56.51 55.51 56.31 56.12
30-Nov-2010 55.83 56.45 55.59 56.26 56.16
01-Dec-2010 56.84 56.91 56.05 56.15 56.43
02-Dec-2010 56.08 56.85 55.98 56.54 56.59
03-Dec-2010 56.50 56.94 56.12 56.86 56.69
06-Dec-2010 56.74 56.77 55.52 55.61 55.86
07-Dec-2010 55.84 55.90 54.23 55.09 55.03
08-Dec-2010 55.11 55.33 54.58 54.83 54.91
09-Dec-2010 55.35 56.16 55.27 56.14 55.85
10-Dec-2010 56.12 56.57 55.91 56.27 56.32
13-Dec-2010 56.30 56.30 55.15 56.02 55.70
14-Dec-2010 56.01 56.85 55.83 56.62 56.56
15-Dec-2010 56.64 57.22 56.35 56.37 56.79
16-Dec-2010 56.13 57.29 56.01 57.29 56.83
17-Dec-2010 57.20 57.49 56.53 57.44 57.15
20-Dec-2010 57.21 57.49 56.86 57.30 57.19
21-Dec-2010 57.32 57.32 56.75 56.77 56.95
22-Dec-2010 56.70 57.20 56.43 56.72 56.69
23-Dec-2010 56.50 56.77 56.06 56.62 56.62
27-Dec-2010 56.50 56.78 56.21 56.55 56.57
28-Dec-2010 56.60 56.69 55.92 55.98 56.07
29-Dec-2010 55.98 56.10 55.30 55.50 55.56
30-Dec-2010 55.45 55.91 55.38 55.76 55.73
31-Dec-2010 55.59 55.76 55.14 55.69 55.59
03-Jan-2011 55.75 56.00 54.81 55.02 55.23
04-Jan-2011 55.52 55.77 54.72 54.91 55.24
05-Jan-2011 54.68 54.91 54.44 54.57 54.69
06-Jan-2011 54.51 54.87 54.35 54.72 54.67
07-Jan-2011 54.66 55.36 54.66 55.19 55.13
10-Jan-2011 54.89 55.66 54.54 55.65 55.36
11-Jan-2011 55.68 55.72 55.14 55.38 55.36
12-Jan-2011 55.65 56.30 55.17 56.23 55.93
13-Jan-2011 56.13 56.35 55.81 56.20 56.08
14-Jan-2011 56.16 56.30 55.99 56.29 56.16
18-Jan-2011 56.24 57.26 56.20 56.80 56.77
VWAP represents daily Volume Weighted-Average Price
Page 47 of 80
Page 48
Hospira’s historical stock prices are provided by Bloomberg LP.
Pfizer makes no claims concerning the accuracy of the information provided on these pages, and will not be held liable for any use of this information.
Date Open Intraday High Intraday Low Close VWAP
HOSPIRA (HSP US) HISTORICAL COMMON STOCK PRICE INFORMATION
19-Jan-2011 56.58 56.66 55.98 56.35 56.30
20-Jan-2011 56.16 56.33 55.43 55.65 55.68
21-Jan-2011 56.05 56.05 55.16 55.24 55.39
24-Jan-2011 55.16 55.44 54.94 55.29 55.15
25-Jan-2011 55.06 55.64 54.89 55.60 55.30
26-Jan-2011 55.72 56.31 55.24 56.25 55.92
27-Jan-2011 55.89 56.10 55.47 55.69 55.72
28-Jan-2011 55.57 55.77 54.23 54.60 54.62
31-Jan-2011 54.73 55.50 54.73 55.23 55.20
01-Feb-2011 55.14 55.68 54.63 55.05 55.13
02-Feb-2011 50.08 55.05 49.51 51.05 50.75
03-Feb-2011 51.11 52.32 50.68 51.97 51.54
04-Feb-2011 51.92 52.38 51.15 52.35 51.95
07-Feb-2011 52.31 53.73 52.20 52.64 52.93
08-Feb-2011 52.55 52.74 52.18 52.48 52.47
09-Feb-2011 52.27 53.60 52.20 53.38 53.15
10-Feb-2011 53.22 53.81 53.09 53.25 53.47
11-Feb-2011 53.04 54.45 52.93 54.26 54.04
14-Feb-2011 54.36 54.82 53.95 54.06 54.15
15-Feb-2011 54.03 55.19 53.88 54.93 54.71
16-Feb-2011 54.94 55.08 54.64 54.95 54.79
17-Feb-2011 54.94 55.34 54.19 54.54 54.78
18-Feb-2011 54.43 55.11 54.26 54.61 54.60
22-Feb-2011 54.28 54.34 52.89 53.18 53.33
23-Feb-2011 53.08 53.37 52.31 52.77 52.76
24-Feb-2011 52.81 53.07 52.15 52.46 52.49
25-Feb-2011 52.71 53.34 52.39 53.31 52.95
28-Feb-2011 53.40 53.48 52.62 52.85 52.92
01-Mar-2011 53.05 53.31 51.88 51.98 52.21
02-Mar-2011 52.00 53.15 51.99 53.00 52.82
03-Mar-2011 53.33 54.07 53.16 54.03 53.73
04-Mar-2011 53.96 54.24 53.63 54.14 53.92
07-Mar-2011 53.94 54.14 53.06 53.32 53.49
08-Mar-2011 53.50 54.79 53.37 53.63 53.88
09-Mar-2011 53.66 56.00 53.55 54.57 54.83
10-Mar-2011 54.26 55.51 53.92 54.93 54.95
VWAP represents daily Volume Weighted-Average Price
Page 48 of 80
Page 49
Hospira’s historical stock prices are provided by Bloomberg LP.
Pfizer makes no claims concerning the accuracy of the information provided on these pages, and will not be held liable for any use of this information.
Date Open Intraday High Intraday Low Close VWAP
HOSPIRA (HSP US) HISTORICAL COMMON STOCK PRICE INFORMATION
11-Mar-2011 54.47 55.15 54.43 54.96 54.93
14-Mar-2011 54.71 55.09 54.17 54.26 54.49
15-Mar-2011 53.47 53.48 52.71 53.00 53.03
16-Mar-2011 52.79 52.87 51.75 51.88 52.35
17-Mar-2011 52.46 53.31 51.85 52.02 52.37
18-Mar-2011 52.64 52.83 51.42 51.79 51.75
21-Mar-2011 52.25 52.79 51.94 52.15 52.21
22-Mar-2011 52.26 52.62 51.56 51.93 51.87
23-Mar-2011 51.77 52.97 51.40 52.85 52.31
24-Mar-2011 52.96 54.51 52.70 54.01 53.76
25-Mar-2011 54.05 54.49 53.72 54.01 54.06
28-Mar-2011 54.14 54.72 53.89 54.01 54.20
29-Mar-2011 54.02 54.59 53.94 54.53 54.38
30-Mar-2011 54.82 55.37 54.45 55.05 55.11
31-Mar-2011 55.06 55.89 54.69 55.20 55.35
01-Apr-2011 55.50 56.17 55.05 56.17 55.77
04-Apr-2011 56.16 56.78 56.16 56.30 56.43
05-Apr-2011 56.17 57.02 56.03 56.55 56.61
06-Apr-2011 56.68 56.75 55.95 56.04 56.21
07-Apr-2011 55.87 56.57 55.75 56.32 56.26
08-Apr-2011 56.49 56.60 55.65 55.74 56.02
11-Apr-2011 55.90 56.23 55.71 55.85 55.85
12-Apr-2011 55.73 56.36 55.69 56.16 56.09
13-Apr-2011 56.19 56.72 56.10 56.58 56.48
14-Apr-2011 56.32 56.34 55.62 55.72 55.85
15-Apr-2011 55.78 56.18 55.70 56.00 55.96
18-Apr-2011 55.44 56.16 54.66 55.97 55.42
19-Apr-2011 56.08 56.67 56.03 56.49 56.41
20-Apr-2011 57.07 57.80 56.87 57.32 57.33
21-Apr-2011 57.38 57.80 57.13 57.78 57.49
25-Apr-2011 57.42 58.16 57.22 58.13 57.88
26-Apr-2011 58.88 59.20 56.28 57.35 57.22
27-Apr-2011 56.51 57.12 56.01 57.07 56.94
28-Apr-2011 56.99 57.20 56.82 57.02 56.98
29-Apr-2011 56.97 57.02 56.50 56.73 56.84
02-May-2011 57.00 57.25 56.79 57.00 57.02
VWAP represents daily Volume Weighted-Average Price
Page 49 of 80
Page 50
Hospira’s historical stock prices are provided by Bloomberg LP.
Pfizer makes no claims concerning the accuracy of the information provided on these pages, and will not be held liable for any use of this information.
Date Open Intraday High Intraday Low Close VWAP
HOSPIRA (HSP US) HISTORICAL COMMON STOCK PRICE INFORMATION
03-May-2011 56.85 57.19 56.61 56.92 56.94
04-May-2011 56.45 56.62 55.41 55.86 55.88
05-May-2011 55.51 56.43 55.51 55.93 56.00
06-May-2011 56.53 56.74 56.24 56.50 56.48
09-May-2011 56.46 56.88 56.13 56.77 56.53
10-May-2011 56.90 57.13 56.29 56.94 56.70
11-May-2011 56.38 56.54 55.74 55.94 56.08
12-May-2011 55.94 56.43 55.74 56.18 56.17
13-May-2011 56.23 56.57 55.42 55.49 55.71
16-May-2011 55.46 55.61 54.90 54.97 55.22
17-May-2011 54.96 54.96 54.26 54.58 54.51
18-May-2011 54.50 55.42 54.33 55.08 55.07
19-May-2011 55.17 55.32 54.44 54.54 54.65
20-May-2011 54.59 55.25 54.33 55.04 54.97
23-May-2011 54.54 54.67 53.90 53.98 54.10
24-May-2011 54.07 54.49 53.74 54.06 53.93
25-May-2011 53.86 54.43 53.86 54.21 54.20
26-May-2011 54.17 54.74 54.04 54.66 54.52
27-May-2011 54.81 55.09 54.73 55.02 54.99
31-May-2011 55.53 55.61 55.00 55.29 55.19
01-Jun-2011 55.26 55.75 54.83 54.89 55.12
02-Jun-2011 54.89 54.89 54.13 54.30 54.44
03-Jun-2011 53.75 54.02 53.66 53.90 53.89
06-Jun-2011 53.81 53.91 53.62 53.90 53.82
07-Jun-2011 54.05 54.44 53.80 54.25 54.22
08-Jun-2011 54.07 54.07 53.53 53.74 53.64
09-Jun-2011 53.83 54.77 53.70 54.69 54.52
10-Jun-2011 54.50 54.61 53.99 54.03 54.31
13-Jun-2011 54.13 54.44 53.98 54.11 54.16
14-Jun-2011 54.42 54.63 54.07 54.14 54.26
15-Jun-2011 53.56 54.13 53.42 53.81 53.83
16-Jun-2011 53.72 54.21 53.70 54.14 54.03
17-Jun-2011 54.44 54.84 53.86 54.12 54.14
20-Jun-2011 54.04 54.97 54.04 54.84 54.72
21-Jun-2011 54.98 55.61 54.84 55.50 55.45
22-Jun-2011 55.25 55.50 55.01 55.21 55.19
VWAP represents daily Volume Weighted-Average Price
Page 50 of 80
Page 51
Hospira’s historical stock prices are provided by Bloomberg LP.
Pfizer makes no claims concerning the accuracy of the information provided on these pages, and will not be held liable for any use of this information.
Date Open Intraday High Intraday Low Close VWAP
HOSPIRA (HSP US) HISTORICAL COMMON STOCK PRICE INFORMATION
23-Jun-2011 54.83 55.34 54.34 55.19 54.79
24-Jun-2011 55.19 55.19 54.46 54.76 54.70
27-Jun-2011 54.88 56.03 54.72 55.43 55.52
28-Jun-2011 55.48 56.32 55.46 56.24 56.04
29-Jun-2011 56.39 56.43 55.92 56.27 56.16
30-Jun-2011 56.43 57.00 56.31 56.66 56.73
01-Jul-2011 56.86 57.12 54.75 55.67 55.66
05-Jul-2011 55.45 55.45 53.52 54.13 54.22
06-Jul-2011 54.14 54.25 53.84 53.96 53.96
07-Jul-2011 54.21 54.38 54.06 54.22 54.17
08-Jul-2011 53.85 53.91 53.30 53.69 53.56
11-Jul-2011 53.24 53.91 52.94 53.07 53.13
12-Jul-2011 52.92 53.70 52.92 53.12 53.29
13-Jul-2011 53.26 53.85 52.93 52.97 53.36
14-Jul-2011 53.29 53.30 52.58 52.68 52.85
15-Jul-2011 52.82 53.47 52.12 53.46 52.99
18-Jul-2011 53.14 53.15 52.36 52.71 52.65
19-Jul-2011 52.94 53.34 52.83 53.30 53.11
20-Jul-2011 53.26 53.27 52.38 52.58 52.59
21-Jul-2011 52.93 53.92 52.75 53.61 53.58
22-Jul-2011 53.57 53.78 52.82 52.85 53.01
25-Jul-2011 52.55 52.73 52.16 52.55 52.51
26-Jul-2011 52.68 52.77 52.04 52.10 52.27
27-Jul-2011 52.03 53.33 50.53 52.40 52.30
28-Jul-2011 52.29 52.56 51.50 51.59 51.85
29-Jul-2011 51.36 51.53 50.91 51.12 51.28
01-Aug-2011 51.43 51.43 49.37 49.68 49.78
02-Aug-2011 49.51 49.67 47.77 47.82 48.24
03-Aug-2011 47.70 49.09 47.39 48.69 48.38
04-Aug-2011 48.14 48.64 47.06 47.10 48.01
05-Aug-2011 47.49 48.70 46.40 47.58 47.59
08-Aug-2011 46.66 47.27 44.40 44.40 45.53
09-Aug-2011 44.77 45.39 43.19 45.33 44.63
10-Aug-2011 44.74 44.78 42.67 42.80 43.57
11-Aug-2011 42.95 45.06 42.83 44.56 44.04
12-Aug-2011 44.90 45.09 44.23 44.67 44.65
VWAP represents daily Volume Weighted-Average Price
Page 51 of 80
Page 52
Hospira’s historical stock prices are provided by Bloomberg LP.
Pfizer makes no claims concerning the accuracy of the information provided on these pages, and will not be held liable for any use of this information.
Date Open Intraday High Intraday Low Close VWAP
HOSPIRA (HSP US) HISTORICAL COMMON STOCK PRICE INFORMATION
15-Aug-2011 45.11 45.41 44.73 45.37 45.13
16-Aug-2011 44.96 45.02 44.25 44.53 44.58
17-Aug-2011 45.84 46.53 44.68 44.84 45.19
18-Aug-2011 43.70 43.98 42.52 42.93 42.89
19-Aug-2011 42.44 43.52 42.34 42.68 42.81
22-Aug-2011 43.48 43.77 42.76 42.85 43.17
23-Aug-2011 43.03 44.55 42.83 44.55 44.00
24-Aug-2011 44.41 44.86 43.77 44.75 44.41
25-Aug-2011 44.88 45.18 43.33 43.84 43.79
26-Aug-2011 43.62 44.80 42.68 44.50 44.16
29-Aug-2011 44.87 45.78 44.74 45.76 45.45
30-Aug-2011 45.70 46.15 45.24 45.96 45.80
31-Aug-2011 46.07 46.54 45.77 46.20 46.19
01-Sep-2011 46.15 47.12 46.15 46.29 46.50
02-Sep-2011 45.32 45.73 44.46 44.61 44.99
06-Sep-2011 43.26 44.29 43.20 44.23 43.91
07-Sep-2011 44.52 46.29 44.31 45.61 45.60
08-Sep-2011 44.69 44.91 42.97 43.32 43.87
09-Sep-2011 42.79 42.90 41.05 41.23 41.67
12-Sep-2011 40.90 40.93 40.08 40.59 40.41
13-Sep-2011 40.16 40.56 39.37 39.51 39.82
14-Sep-2011 39.76 40.07 39.10 39.65 39.65
15-Sep-2011 40.02 40.10 39.23 39.53 39.69
16-Sep-2011 39.87 40.17 39.22 39.45 39.58
19-Sep-2011 38.93 39.47 38.27 38.50 38.71
20-Sep-2011 38.56 38.91 37.81 37.86 38.19
21-Sep-2011 37.91 38.04 36.10 36.14 37.01
22-Sep-2011 35.32 35.86 34.36 34.44 35.09
23-Sep-2011 34.48 37.45 34.18 37.41 36.56
26-Sep-2011 37.56 37.74 36.50 37.26 37.03
27-Sep-2011 38.04 39.30 37.83 38.41 38.63
28-Sep-2011 38.30 38.44 37.58 37.64 37.87
29-Sep-2011 38.20 38.20 36.99 37.67 37.66
30-Sep-2011 37.33 37.63 36.98 37.00 37.20
03-Oct-2011 36.70 36.70 35.74 35.76 36.02
04-Oct-2011 35.23 36.76 34.85 36.72 36.02
VWAP represents daily Volume Weighted-Average Price
Page 52 of 80
Page 53
Hospira’s historical stock prices are provided by Bloomberg LP.
Pfizer makes no claims concerning the accuracy of the information provided on these pages, and will not be held liable for any use of this information.
Date Open Intraday High Intraday Low Close VWAP
HOSPIRA (HSP US) HISTORICAL COMMON STOCK PRICE INFORMATION
05-Oct-2011 36.54 37.22 36.23 37.19 36.96
06-Oct-2011 37.07 38.00 36.83 37.75 37.62
07-Oct-2011 37.92 38.24 37.19 37.26 37.65
10-Oct-2011 38.13 38.80 37.95 38.60 38.48
11-Oct-2011 38.30 38.94 38.22 38.40 38.51
12-Oct-2011 38.71 39.30 38.54 38.76 38.95
13-Oct-2011 38.51 38.51 37.87 38.02 38.08
14-Oct-2011 38.32 38.59 37.71 38.07 38.00
17-Oct-2011 37.81 38.00 37.27 37.36 37.58
18-Oct-2011 30.52 30.74 29.03 29.51 29.86
19-Oct-2011 29.40 30.38 28.91 29.64 29.56
20-Oct-2011 29.60 29.71 28.04 28.67 28.69
21-Oct-2011 28.95 29.50 28.77 29.39 29.20
24-Oct-2011 29.40 30.65 29.40 30.65 30.36
25-Oct-2011 30.33 30.89 30.05 30.32 30.44
26-Oct-2011 30.72 30.72 29.01 29.97 29.60
27-Oct-2011 31.29 32.23 30.27 31.18 30.95
28-Oct-2011 31.05 31.85 30.84 31.71 31.53
31-Oct-2011 31.36 31.84 31.20 31.45 31.56
01-Nov-2011 30.58 31.56 30.40 30.92 31.05
02-Nov-2011 31.50 31.92 31.05 31.46 31.50
03-Nov-2011 31.56 32.20 31.40 31.94 31.90
04-Nov-2011 31.74 31.90 31.03 31.31 31.28
07-Nov-2011 31.17 32.17 30.90 31.98 31.53
08-Nov-2011 32.19 33.05 32.06 32.95 32.52
09-Nov-2011 32.16 32.42 31.28 31.41 31.74
10-Nov-2011 31.77 32.29 31.38 31.63 31.77
11-Nov-2011 31.96 32.49 31.96 32.39 32.31
14-Nov-2011 32.21 32.42 31.16 31.20 31.53
15-Nov-2011 31.21 31.66 30.64 31.26 31.27
16-Nov-2011 31.00 31.72 30.88 30.98 31.20
17-Nov-2011 31.10 31.22 30.46 30.87 30.75
18-Nov-2011 31.10 31.20 30.78 30.90 30.98
21-Nov-2011 30.48 30.96 29.88 30.77 30.74
22-Nov-2011 30.79 31.00 30.51 30.57 30.73
23-Nov-2011 30.32 30.61 30.14 30.18 30.33
VWAP represents daily Volume Weighted-Average Price
Page 53 of 80
Page 54
Hospira’s historical stock prices are provided by Bloomberg LP.
Pfizer makes no claims concerning the accuracy of the information provided on these pages, and will not be held liable for any use of this information.
Date Open Intraday High Intraday Low Close VWAP
HOSPIRA (HSP US) HISTORICAL COMMON STOCK PRICE INFORMATION
25-Nov-2011 29.99 30.51 29.99 30.07 30.22
28-Nov-2011 30.85 31.52 30.70 30.98 31.07
29-Nov-2011 30.65 30.73 26.92 28.17 28.82
30-Nov-2011 28.06 29.16 27.57 28.19 28.08
01-Dec-2011 28.11 28.63 28.11 28.29 28.42
02-Dec-2011 28.92 29.22 27.31 27.64 27.86
05-Dec-2011 28.11 28.26 27.68 27.92 27.96
06-Dec-2011 27.99 28.41 27.92 28.14 28.15
07-Dec-2011 27.92 28.15 27.57 27.86 27.85
08-Dec-2011 27.77 28.05 27.24 27.29 27.56
09-Dec-2011 27.42 28.31 27.40 28.07 28.10
12-Dec-2011 28.03 28.09 27.62 27.92 27.81
13-Dec-2011 28.10 28.27 27.93 28.07 28.14
14-Dec-2011 27.95 28.21 27.81 28.21 28.04
15-Dec-2011 28.21 28.99 28.10 28.84 28.77
16-Dec-2011 29.09 29.36 28.71 28.92 29.00
19-Dec-2011 28.61 29.20 28.28 28.64 28.90
20-Dec-2011 29.06 29.52 28.94 29.20 29.21
21-Dec-2011 29.12 29.35 28.85 29.28 29.06
22-Dec-2011 29.37 30.52 29.30 30.45 30.29
23-Dec-2011 30.54 31.17 30.48 30.92 30.81
27-Dec-2011 30.88 30.99 30.50 30.54 30.69
28-Dec-2011 30.55 30.68 30.01 30.16 30.20
29-Dec-2011 30.13 30.66 29.92 30.62 30.35
30-Dec-2011 30.51 30.63 30.25 30.37 30.40
03-Jan-2012 30.89 31.52 30.86 31.36 31.26
04-Jan-2012 31.07 31.50 31.00 31.34 31.30
05-Jan-2012 31.07 31.19 30.66 30.90 30.94
06-Jan-2012 30.83 30.98 30.04 30.31 30.33
09-Jan-2012 30.36 30.48 29.80 30.14 30.12
10-Jan-2012 30.21 30.72 29.51 30.35 30.19
11-Jan-2012 30.35 31.98 30.04 31.81 31.41
12-Jan-2012 31.89 32.38 31.31 32.28 31.96
13-Jan-2012 32.08 32.14 30.79 31.51 31.25
17-Jan-2012 31.99 32.66 31.98 32.15 32.14
18-Jan-2012 32.12 33.00 32.03 32.99 32.65
VWAP represents daily Volume Weighted-Average Price
Page 54 of 80
Page 55
Hospira’s historical stock prices are provided by Bloomberg LP.
Pfizer makes no claims concerning the accuracy of the information provided on these pages, and will not be held liable for any use of this information.
Date Open Intraday High Intraday Low Close VWAP
HOSPIRA (HSP US) HISTORICAL COMMON STOCK PRICE INFORMATION
19-Jan-2012 33.05 34.99 32.97 33.93 34.15
20-Jan-2012 33.99 34.24 33.63 34.20 34.02
23-Jan-2012 34.18 34.37 33.87 34.07 34.15
24-Jan-2012 33.95 34.25 33.76 34.04 34.03
25-Jan-2012 34.00 35.68 34.00 35.52 34.97
26-Jan-2012 35.59 35.85 34.93 35.00 35.26
27-Jan-2012 34.82 35.54 34.78 35.23 35.28
30-Jan-2012 34.82 35.12 34.27 34.69 34.70
31-Jan-2012 34.95 35.14 34.28 34.46 34.54
01-Feb-2012 34.63 34.84 34.30 34.50 34.56
02-Feb-2012 34.33 34.76 34.23 34.64 34.60
03-Feb-2012 34.90 35.28 34.74 35.25 35.11
06-Feb-2012 35.14 35.47 35.07 35.47 35.30
07-Feb-2012 35.30 35.49 34.90 35.27 35.18
08-Feb-2012 35.27 35.55 34.42 34.75 34.87
09-Feb-2012 34.70 34.76 33.71 34.11 34.04
10-Feb-2012 33.81 34.08 33.65 33.79 33.87
13-Feb-2012 34.01 34.53 33.76 34.22 34.11
14-Feb-2012 34.39 37.70 34.31 36.30 36.58
15-Feb-2012 36.39 36.82 36.20 36.39 36.50
16-Feb-2012 36.44 37.99 36.28 37.92 37.44
17-Feb-2012 37.74 37.87 36.93 37.15 37.19
21-Feb-2012 37.14 37.44 36.69 36.88 36.97
22-Feb-2012 36.81 36.98 36.18 36.27 36.36
23-Feb-2012 36.33 36.50 35.95 36.36 36.25
24-Feb-2012 36.36 36.46 35.88 36.16 36.12
27-Feb-2012 35.99 36.46 35.60 36.36 36.19
28-Feb-2012 36.42 36.67 35.96 36.42 36.37
29-Feb-2012 36.39 36.57 35.58 35.62 35.96
01-Mar-2012 35.66 35.92 34.80 35.51 35.31
02-Mar-2012 35.51 35.67 34.94 34.96 35.19
05-Mar-2012 34.87 35.24 34.32 34.52 34.53
06-Mar-2012 34.16 34.32 33.78 33.94 33.96
07-Mar-2012 33.93 34.53 33.86 34.44 34.33
08-Mar-2012 34.67 35.46 34.56 35.26 35.20
09-Mar-2012 35.62 36.00 35.18 35.94 35.84
VWAP represents daily Volume Weighted-Average Price
Page 55 of 80
Page 56
Hospira’s historical stock prices are provided by Bloomberg LP.
Pfizer makes no claims concerning the accuracy of the information provided on these pages, and will not be held liable for any use of this information.
Date Open Intraday High Intraday Low Close VWAP
HOSPIRA (HSP US) HISTORICAL COMMON STOCK PRICE INFORMATION
12-Mar-2012 35.96 35.96 35.47 35.59 35.66
13-Mar-2012 35.74 36.71 35.62 36.69 36.30
14-Mar-2012 36.64 36.96 36.50 36.81 36.70
15-Mar-2012 36.84 36.94 36.61 36.81 36.78
16-Mar-2012 36.76 37.36 36.75 37.13 37.02
19-Mar-2012 37.01 37.59 37.00 37.36 37.36
20-Mar-2012 37.16 37.65 37.09 37.33 37.38
21-Mar-2012 37.34 37.44 36.37 37.04 36.87
22-Mar-2012 36.79 37.54 36.45 37.02 37.16
23-Mar-2012 37.00 37.21 36.60 36.70 36.77
26-Mar-2012 37.00 38.07 37.00 38.02 37.77
27-Mar-2012 38.13 38.49 37.94 38.14 38.14
28-Mar-2012 38.07 38.36 37.53 37.82 37.85
29-Mar-2012 37.50 37.71 36.82 37.67 37.41
30-Mar-2012 37.82 38.00 37.24 37.39 37.54
02-Apr-2012 37.27 37.76 37.10 37.60 37.50
03-Apr-2012 37.60 37.70 36.60 36.82 36.94
04-Apr-2012 36.48 36.57 35.93 36.01 36.09
05-Apr-2012 35.80 36.55 35.80 36.15 36.17
09-Apr-2012 35.40 35.51 34.81 35.15 35.18
10-Apr-2012 35.05 35.05 34.45 34.72 34.77
11-Apr-2012 35.07 35.31 34.91 35.04 35.08
12-Apr-2012 35.06 35.36 34.97 35.20 35.24
13-Apr-2012 35.06 35.07 34.40 34.46 34.61
16-Apr-2012 34.58 34.64 34.10 34.45 34.37
17-Apr-2012 34.55 35.21 34.52 34.99 35.00
18-Apr-2012 34.79 35.15 34.49 34.83 34.81
19-Apr-2012 34.82 34.91 34.13 34.39 34.39
20-Apr-2012 34.45 34.54 34.25 34.43 34.46
23-Apr-2012 34.06 34.19 33.83 34.11 34.03
24-Apr-2012 34.12 34.54 34.11 34.54 34.45
25-Apr-2012 34.77 35.09 34.69 35.02 34.97
26-Apr-2012 34.95 35.19 34.86 35.12 35.08
27-Apr-2012 35.16 35.76 35.16 35.42 35.45
30-Apr-2012 35.30 35.45 35.10 35.12 35.20
01-May-2012 35.03 35.68 34.35 35.50 35.10
VWAP represents daily Volume Weighted-Average Price
Page 56 of 80
Page 57
Hospira’s historical stock prices are provided by Bloomberg LP.
Pfizer makes no claims concerning the accuracy of the information provided on these pages, and will not be held liable for any use of this information.
Date Open Intraday High Intraday Low Close VWAP
HOSPIRA (HSP US) HISTORICAL COMMON STOCK PRICE INFORMATION
02-May-2012 35.40 35.80 35.20 35.57 35.54
03-May-2012 35.53 35.57 34.36 34.41 34.79
04-May-2012 34.22 34.30 33.55 33.88 33.81
07-May-2012 33.89 34.19 33.62 34.15 34.01
08-May-2012 33.82 34.13 33.53 34.10 33.85
09-May-2012 33.62 34.11 33.26 33.90 33.86
10-May-2012 34.17 34.28 33.70 33.77 33.90
11-May-2012 33.57 33.66 33.33 33.34 33.49
14-May-2012 32.95 33.12 32.54 32.74 32.87
15-May-2012 32.69 33.00 32.34 32.71 32.68
16-May-2012 32.94 33.26 32.79 32.85 32.95
17-May-2012 32.88 33.11 32.56 32.56 32.84
18-May-2012 32.65 32.71 31.73 31.87 32.16
21-May-2012 32.04 32.73 31.91 32.65 32.48
22-May-2012 32.73 33.12 32.56 32.77 32.83
23-May-2012 32.44 32.50 31.45 31.93 31.82
24-May-2012 31.81 32.00 31.40 31.98 31.72
25-May-2012 32.23 32.56 31.94 32.38 32.31
29-May-2012 32.63 33.13 32.36 32.60 32.68
30-May-2012 32.23 32.26 31.76 31.92 31.93
31-May-2012 31.92 31.94 31.17 31.26 31.35
01-Jun-2012 30.81 31.56 30.81 31.36 31.28
04-Jun-2012 31.43 32.03 31.40 32.00 31.90
05-Jun-2012 31.96 32.34 31.82 32.11 32.10
06-Jun-2012 32.35 32.58 32.18 32.47 32.40
07-Jun-2012 32.81 32.98 32.28 32.36 32.53
08-Jun-2012 32.27 32.82 32.06 32.79 32.66
11-Jun-2012 33.03 33.19 32.39 32.41 32.71
12-Jun-2012 32.45 32.45 31.85 32.31 32.17
13-Jun-2012 32.20 32.61 32.07 32.20 32.29
14-Jun-2012 32.24 32.52 32.09 32.36 32.33
15-Jun-2012 32.59 33.69 32.47 33.63 33.24
18-Jun-2012 33.44 33.88 33.44 33.72 33.77
19-Jun-2012 33.95 34.50 33.71 34.40 34.21
20-Jun-2012 34.34 34.50 34.06 34.49 34.35
21-Jun-2012 34.48 34.52 33.33 33.58 33.82
VWAP represents daily Volume Weighted-Average Price
Page 57 of 80
Page 58
Hospira’s historical stock prices are provided by Bloomberg LP.
Pfizer makes no claims concerning the accuracy of the information provided on these pages, and will not be held liable for any use of this information.
Date Open Intraday High Intraday Low Close VWAP
HOSPIRA (HSP US) HISTORICAL COMMON STOCK PRICE INFORMATION
22-Jun-2012 33.68 34.20 33.24 34.02 33.99
25-Jun-2012 33.59 33.66 33.11 33.12 33.33
26-Jun-2012 33.22 33.32 32.88 33.23 33.13
27-Jun-2012 33.15 33.95 33.15 33.86 33.68
28-Jun-2012 33.63 34.26 33.59 34.14 33.89
29-Jun-2012 34.93 35.25 34.72 34.98 34.97
02-Jul-2012 34.95 35.11 34.45 34.94 34.84
03-Jul-2012 34.84 34.93 34.65 34.75 34.78
05-Jul-2012 34.63 34.83 34.39 34.49 34.63
06-Jul-2012 34.14 34.53 33.79 33.98 33.97
09-Jul-2012 34.28 34.28 33.83 34.04 34.02
10-Jul-2012 34.25 34.67 33.92 34.13 34.09
11-Jul-2012 34.11 34.74 34.11 34.62 34.54
12-Jul-2012 34.36 34.48 34.03 34.30 34.30
13-Jul-2012 34.36 35.00 34.02 34.11 34.29
16-Jul-2012 33.98 34.07 33.68 33.80 33.81
17-Jul-2012 33.86 34.52 33.68 34.52 34.21
18-Jul-2012 34.32 36.28 34.26 36.17 35.75
19-Jul-2012 36.15 36.70 36.06 36.64 36.46
20-Jul-2012 36.39 36.40 35.36 35.45 35.66
23-Jul-2012 35.01 35.01 34.12 34.35 34.35
24-Jul-2012 34.31 34.48 33.36 33.65 33.64
25-Jul-2012 33.78 34.17 33.63 34.02 34.02
26-Jul-2012 34.57 34.78 34.28 34.50 34.52
27-Jul-2012 34.80 35.20 34.56 35.08 34.91
30-Jul-2012 35.08 35.17 34.39 34.88 34.80
31-Jul-2012 34.84 35.03 34.56 34.75 34.78
01-Aug-2012 34.81 37.78 33.83 36.39 36.65
02-Aug-2012 35.93 36.03 34.67 35.28 35.22
03-Aug-2012 35.69 35.75 34.45 34.59 34.81
06-Aug-2012 34.60 34.76 34.20 34.60 34.46
07-Aug-2012 34.65 34.98 34.62 34.80 34.82
08-Aug-2012 34.71 34.77 34.49 34.59 34.62
09-Aug-2012 34.39 34.79 33.99 34.35 34.44
10-Aug-2012 34.15 34.58 33.96 34.15 34.24
13-Aug-2012 34.02 34.16 33.50 33.74 33.75
VWAP represents daily Volume Weighted-Average Price
Page 58 of 80
Page 59
Hospira’s historical stock prices are provided by Bloomberg LP.
Pfizer makes no claims concerning the accuracy of the information provided on these pages, and will not be held liable for any use of this information.
Date Open Intraday High Intraday Low Close VWAP
HOSPIRA (HSP US) HISTORICAL COMMON STOCK PRICE INFORMATION
14-Aug-2012 33.86 34.07 33.74 33.82 33.92
15-Aug-2012 33.84 34.01 33.69 33.88 33.86
16-Aug-2012 33.91 34.21 33.71 33.85 33.94
17-Aug-2012 33.95 34.24 33.89 33.99 34.02
20-Aug-2012 33.94 34.21 33.81 34.11 34.04
21-Aug-2012 34.16 34.55 33.95 34.05 34.14
22-Aug-2012 33.86 34.03 33.67 33.81 33.81
23-Aug-2012 33.74 33.89 33.30 33.36 33.48
24-Aug-2012 33.27 33.95 33.27 33.74 33.61
27-Aug-2012 33.76 34.09 33.55 33.81 33.87
28-Aug-2012 33.64 34.02 33.23 33.36 33.52
29-Aug-2012 33.28 33.85 33.01 33.60 33.49
30-Aug-2012 33.36 33.66 33.10 33.52 33.44
31-Aug-2012 33.73 34.00 33.46 33.58 33.66
04-Sep-2012 33.56 34.06 33.35 33.99 33.79
05-Sep-2012 33.91 34.47 33.31 34.03 34.05
06-Sep-2012 34.11 34.87 34.09 34.42 34.54
07-Sep-2012 34.44 35.00 34.35 34.97 34.73
10-Sep-2012 34.79 35.00 33.92 34.17 34.44
11-Sep-2012 34.19 34.37 33.84 34.29 34.19
12-Sep-2012 34.24 34.70 34.24 34.37 34.47
13-Sep-2012 34.42 35.21 34.25 34.92 34.81
14-Sep-2012 34.78 35.18 34.41 34.67 34.70
17-Sep-2012 34.68 34.80 34.32 34.71 34.63
18-Sep-2012 34.76 35.31 34.69 35.30 35.10
19-Sep-2012 35.37 35.43 35.05 35.11 35.15
20-Sep-2012 35.05 35.41 34.99 35.00 35.13
21-Sep-2012 35.15 35.18 34.61 34.63 34.81
24-Sep-2012 34.54 34.65 34.10 34.24 34.26
25-Sep-2012 34.34 34.36 34.01 34.15 34.23
26-Sep-2012 34.05 34.25 33.38 33.43 33.78
27-Sep-2012 33.29 33.48 33.09 33.19 33.23
28-Sep-2012 33.07 33.11 32.27 32.82 32.66
01-Oct-2012 32.99 33.18 32.43 32.83 32.77
02-Oct-2012 32.87 33.66 32.85 33.65 33.46
03-Oct-2012 33.74 34.10 33.44 33.80 33.80
VWAP represents daily Volume Weighted-Average Price
Page 59 of 80
Page 60
Hospira’s historical stock prices are provided by Bloomberg LP.
Pfizer makes no claims concerning the accuracy of the information provided on these pages, and will not be held liable for any use of this information.
Date Open Intraday High Intraday Low Close VWAP
HOSPIRA (HSP US) HISTORICAL COMMON STOCK PRICE INFORMATION
04-Oct-2012 33.88 34.01 33.37 33.50 33.55
05-Oct-2012 33.63 33.66 33.30 33.34 33.38
08-Oct-2012 33.16 33.56 33.16 33.37 33.42
09-Oct-2012 33.20 33.43 32.71 32.71 32.92
10-Oct-2012 32.75 32.82 32.45 32.55 32.62
11-Oct-2012 32.82 32.93 32.61 32.61 32.74
12-Oct-2012 32.68 32.93 32.23 32.27 32.43
15-Oct-2012 32.31 32.49 32.10 32.26 32.21
16-Oct-2012 32.45 32.62 32.24 32.41 32.47
17-Oct-2012 32.52 32.78 32.31 32.62 32.52
18-Oct-2012 32.62 32.62 32.07 32.09 32.23
19-Oct-2012 32.00 32.14 31.29 31.31 31.60
22-Oct-2012 31.27 31.63 31.07 31.40 31.35
23-Oct-2012 30.96 31.06 30.53 30.54 30.70
24-Oct-2012 30.61 31.00 30.42 30.79 30.74
25-Oct-2012 30.96 31.38 30.95 31.16 31.11
26-Oct-2012 31.18 31.39 30.76 30.96 30.97
31-Oct-2012 30.93 30.93 30.52 30.69 30.70
01-Nov-2012 30.91 31.22 30.82 30.98 31.08
02-Nov-2012 31.23 31.24 30.44 30.45 30.74
05-Nov-2012 30.27 30.83 30.20 30.50 30.56
06-Nov-2012 30.41 30.82 30.41 30.56 30.60
07-Nov-2012 30.33 32.55 30.03 31.37 31.48
08-Nov-2012 31.24 31.37 29.58 29.93 30.12
09-Nov-2012 29.86 30.14 29.62 29.95 29.98
12-Nov-2012 30.00 30.13 29.88 29.89 30.02
13-Nov-2012 29.70 29.89 29.50 29.60 29.68
14-Nov-2012 29.09 29.87 29.09 29.29 29.49
15-Nov-2012 29.26 29.34 28.80 28.89 28.95
16-Nov-2012 28.82 29.00 28.62 28.97 28.84
19-Nov-2012 29.22 29.60 29.20 29.58 29.48
20-Nov-2012 29.43 29.83 29.27 29.36 29.48
21-Nov-2012 29.32 29.42 29.19 29.24 29.27
23-Nov-2012 29.36 29.44 29.26 29.42 29.37
26-Nov-2012 29.30 29.36 28.99 29.10 29.11
27-Nov-2012 29.04 29.39 28.91 29.20 29.16
VWAP represents daily Volume Weighted-Average Price
Page 60 of 80
Page 61
Hospira’s historical stock prices are provided by Bloomberg LP.
Pfizer makes no claims concerning the accuracy of the information provided on these pages, and will not be held liable for any use of this information.
Date Open Intraday High Intraday Low Close VWAP
HOSPIRA (HSP US) HISTORICAL COMMON STOCK PRICE INFORMATION
28-Nov-2012 29.09 29.67 28.88 29.65 29.28
29-Nov-2012 29.69 29.93 29.54 29.82 29.76
30-Nov-2012 29.82 29.94 29.74 29.80 29.82
03-Dec-2012 29.96 30.23 29.71 30.18 30.04
04-Dec-2012 30.24 30.96 30.15 30.94 30.74
05-Dec-2012 30.91 31.22 30.74 31.02 31.03
06-Dec-2012 31.03 31.31 30.96 31.29 31.19
07-Dec-2012 31.32 31.60 31.10 31.55 31.43
10-Dec-2012 31.51 32.09 31.45 32.03 31.95
11-Dec-2012 31.54 32.06 31.38 32.04 31.81
12-Dec-2012 32.11 32.29 31.70 31.80 31.97
13-Dec-2012 31.79 32.02 31.69 31.75 31.84
14-Dec-2012 31.67 32.02 31.66 31.84 31.85
17-Dec-2012 31.84 32.08 31.77 31.89 31.88
18-Dec-2012 31.98 32.16 31.80 32.13 32.06
19-Dec-2012 32.19 32.19 31.89 32.06 32.07
20-Dec-2012 32.06 32.37 31.97 32.30 32.26
21-Dec-2012 32.22 32.46 31.74 32.12 32.15
24-Dec-2012 32.08 32.28 31.80 31.96 32.01
26-Dec-2012 31.96 31.99 31.27 31.33 31.47
27-Dec-2012 31.34 31.34 30.77 31.16 31.05
28-Dec-2012 31.05 31.13 30.66 30.69 30.84
31-Dec-2012 30.62 31.24 30.30 31.24 30.92
02-Jan-2013 31.73 31.79 31.42 31.78 31.57
03-Jan-2013 31.75 32.41 31.73 32.26 32.19
04-Jan-2013 32.35 32.55 32.06 32.37 32.33
07-Jan-2013 32.17 32.61 32.16 32.52 32.44
08-Jan-2013 32.48 32.56 32.15 32.36 32.31
09-Jan-2013 32.39 34.35 32.34 34.07 33.33
10-Jan-2013 34.16 34.30 33.84 34.05 33.97
11-Jan-2013 34.15 34.19 33.95 34.13 34.04
14-Jan-2013 34.07 34.41 33.86 34.36 34.21
15-Jan-2013 34.22 34.87 34.22 34.74 34.70
16-Jan-2013 34.63 35.40 34.55 34.94 35.02
17-Jan-2013 35.04 35.18 34.83 34.87 35.00
18-Jan-2013 34.97 34.97 34.51 34.91 34.84
VWAP represents daily Volume Weighted-Average Price
Page 61 of 80
Page 62
Hospira’s historical stock prices are provided by Bloomberg LP.
Pfizer makes no claims concerning the accuracy of the information provided on these pages, and will not be held liable for any use of this information.
Date Open Intraday High Intraday Low Close VWAP
HOSPIRA (HSP US) HISTORICAL COMMON STOCK PRICE INFORMATION
22-Jan-2013 34.75 36.01 34.75 35.99 35.60
23-Jan-2013 35.88 36.00 35.20 35.21 35.52
24-Jan-2013 35.38 35.55 34.90 35.00 35.16
25-Jan-2013 35.15 35.19 34.98 35.10 35.08
28-Jan-2013 35.01 35.10 34.03 34.40 34.46
29-Jan-2013 34.31 34.51 34.21 34.39 34.35
30-Jan-2013 34.44 34.77 34.29 34.34 34.48
31-Jan-2013 34.22 34.34 34.02 34.12 34.17
01-Feb-2013 34.31 34.76 34.19 34.55 34.58
04-Feb-2013 34.45 34.70 34.09 34.14 34.30
05-Feb-2013 34.35 34.55 34.17 34.19 34.28
06-Feb-2013 34.16 34.52 34.08 34.37 34.28
07-Feb-2013 34.38 34.54 33.96 34.24 34.21
08-Feb-2013 34.22 34.65 34.12 34.50 34.48
11-Feb-2013 35.50 35.65 34.93 35.32 35.27
12-Feb-2013 35.41 35.77 34.43 34.95 35.15
13-Feb-2013 34.90 36.86 31.93 32.65 33.34
14-Feb-2013 29.72 31.12 29.51 30.05 30.14
15-Feb-2013 29.94 29.98 28.71 29.13 29.21
19-Feb-2013 29.26 30.18 29.14 30.06 29.87
20-Feb-2013 30.05 30.14 29.79 29.91 29.93
21-Feb-2013 29.67 29.90 29.50 29.72 29.70
22-Feb-2013 29.69 29.95 29.41 29.73 29.67
25-Feb-2013 29.76 30.01 29.11 29.11 29.49
26-Feb-2013 29.17 29.38 28.85 28.96 28.99
27-Feb-2013 28.89 29.10 28.79 29.02 28.91
28-Feb-2013 29.11 29.89 29.11 29.43 29.52
01-Mar-2013 29.23 29.72 29.19 29.45 29.44
04-Mar-2013 29.38 29.86 29.37 29.77 29.68
05-Mar-2013 29.21 29.72 29.07 29.18 29.35
06-Mar-2013 29.25 29.76 29.15 29.74 29.44
07-Mar-2013 29.79 30.00 29.44 29.66 29.72
08-Mar-2013 30.02 30.48 29.63 30.11 29.92
11-Mar-2013 30.05 30.62 29.79 30.59 30.38
12-Mar-2013 30.71 31.02 30.54 31.00 30.80
13-Mar-2013 30.96 30.96 30.59 30.75 30.75
VWAP represents daily Volume Weighted-Average Price
Page 62 of 80
Page 63
Hospira’s historical stock prices are provided by Bloomberg LP.
Pfizer makes no claims concerning the accuracy of the information provided on these pages, and will not be held liable for any use of this information.
Date Open Intraday High Intraday Low Close VWAP
HOSPIRA (HSP US) HISTORICAL COMMON STOCK PRICE INFORMATION
14-Mar-2013 30.83 31.93 30.81 31.74 31.59
15-Mar-2013 31.86 32.52 31.68 32.25 32.17
18-Mar-2013 32.00 32.04 31.39 31.58 31.68
19-Mar-2013 31.66 31.88 31.48 31.80 31.69
20-Mar-2013 31.95 32.69 31.95 32.67 32.46
21-Mar-2013 32.45 32.88 32.42 32.71 32.63
22-Mar-2013 32.69 32.80 32.43 32.62 32.58
25-Mar-2013 32.66 32.79 32.31 32.58 32.56
26-Mar-2013 32.71 32.95 32.49 32.66 32.67
27-Mar-2013 32.44 32.66 31.99 32.62 32.37
28-Mar-2013 32.57 32.88 32.30 32.83 32.63
01-Apr-2013 32.75 32.80 31.91 32.00 32.21
02-Apr-2013 32.25 32.36 31.49 31.73 31.75
03-Apr-2013 31.59 31.62 30.82 30.91 31.14
04-Apr-2013 30.97 31.20 30.58 30.59 30.78
05-Apr-2013 30.36 30.88 30.19 30.65 30.60
08-Apr-2013 30.66 30.82 30.43 30.57 30.53
09-Apr-2013 30.67 30.91 30.59 30.59 30.71
10-Apr-2013 30.54 30.86 30.47 30.83 30.72
11-Apr-2013 30.82 31.75 30.80 31.65 31.58
12-Apr-2013 31.51 31.65 31.34 31.61 31.51
15-Apr-2013 31.55 31.82 31.23 31.32 31.46
16-Apr-2013 31.46 31.62 31.13 31.57 31.42
17-Apr-2013 31.43 31.45 30.98 31.29 31.18
18-Apr-2013 31.23 31.45 31.02 31.16 31.16
19-Apr-2013 31.26 31.45 30.86 31.19 31.18
22-Apr-2013 31.27 31.36 30.95 30.99 31.07
23-Apr-2013 31.00 31.80 31.00 31.61 31.46
24-Apr-2013 31.65 31.84 31.45 31.72 31.73
25-Apr-2013 31.79 33.90 31.70 32.93 33.03
26-Apr-2013 32.83 32.92 32.26 32.66 32.57
29-Apr-2013 32.60 33.50 32.40 33.42 33.17
30-Apr-2013 33.44 33.44 32.88 33.12 33.09
01-May-2013 33.00 33.12 32.00 32.10 32.34
02-May-2013 31.02 32.05 30.96 31.96 31.74
03-May-2013 32.18 33.38 32.18 33.02 33.01
VWAP represents daily Volume Weighted-Average Price
Page 63 of 80
Page 64
Hospira’s historical stock prices are provided by Bloomberg LP.
Pfizer makes no claims concerning the accuracy of the information provided on these pages, and will not be held liable for any use of this information.
Date Open Intraday High Intraday Low Close VWAP
HOSPIRA (HSP US) HISTORICAL COMMON STOCK PRICE INFORMATION
06-May-2013 32.94 33.01 32.46 32.66 32.73
07-May-2013 32.76 32.87 32.42 32.81 32.71
08-May-2013 32.77 33.63 32.73 33.60 33.30
09-May-2013 33.52 34.82 33.52 34.55 34.36
10-May-2013 34.52 34.75 34.42 34.62 34.62
13-May-2013 34.67 34.70 34.19 34.23 34.38
14-May-2013 34.19 34.46 34.02 34.25 34.29
15-May-2013 34.25 34.51 34.00 34.43 34.24
16-May-2013 34.29 36.02 34.29 35.72 35.58
17-May-2013 35.96 36.20 35.45 35.74 35.77
20-May-2013 35.73 36.22 35.54 36.03 35.96
21-May-2013 36.01 36.23 35.86 35.92 36.03
22-May-2013 36.00 36.40 35.14 35.40 35.64
23-May-2013 35.12 35.32 34.93 35.18 35.16
24-May-2013 34.97 35.32 34.72 35.08 35.00
28-May-2013 35.35 35.83 35.23 35.30 35.48
29-May-2013 35.09 35.09 34.20 34.69 34.59
30-May-2013 34.64 35.24 34.32 35.07 34.96
31-May-2013 34.92 35.33 34.68 34.68 34.93
03-Jun-2013 34.79 35.31 34.46 35.29 34.94
04-Jun-2013 35.23 35.54 34.18 34.45 34.66
05-Jun-2013 34.36 35.19 34.16 34.49 34.69
06-Jun-2013 34.55 35.03 34.29 35.03 34.78
07-Jun-2013 35.17 36.17 35.17 35.83 35.81
10-Jun-2013 35.91 36.41 35.56 36.39 36.09
11-Jun-2013 36.02 36.31 35.68 36.08 36.10
12-Jun-2013 36.23 36.35 34.61 35.25 35.46
13-Jun-2013 35.15 36.56 34.84 36.46 35.98
14-Jun-2013 36.49 36.70 36.17 36.24 36.34
17-Jun-2013 36.55 36.73 36.07 36.42 36.44
18-Jun-2013 36.46 36.60 36.15 36.59 36.46
19-Jun-2013 36.62 36.62 35.82 35.84 36.24
20-Jun-2013 35.56 35.60 34.31 34.50 34.71
21-Jun-2013 34.76 35.25 34.52 34.79 34.83
24-Jun-2013 34.53 34.93 34.09 34.57 34.53
25-Jun-2013 34.91 35.04 34.46 34.69 34.69
VWAP represents daily Volume Weighted-Average Price
Page 64 of 80
Page 65
Hospira’s historical stock prices are provided by Bloomberg LP.
Pfizer makes no claims concerning the accuracy of the information provided on these pages, and will not be held liable for any use of this information.
Date Open Intraday High Intraday Low Close VWAP
HOSPIRA (HSP US) HISTORICAL COMMON STOCK PRICE INFORMATION
26-Jun-2013 34.99 35.67 34.87 35.27 35.27
27-Jun-2013 35.54 36.49 35.50 36.15 36.17
28-Jun-2013 36.19 38.70 36.02 38.31 38.10
01-Jul-2013 38.27 39.38 38.06 39.06 38.86
02-Jul-2013 38.98 39.23 38.33 38.61 38.63
03-Jul-2013 38.40 38.81 38.13 38.45 38.58
05-Jul-2013 38.85 39.00 38.24 38.98 38.71
08-Jul-2013 39.02 39.09 38.44 38.47 38.71
09-Jul-2013 38.79 39.48 38.50 39.44 39.06
10-Jul-2013 39.41 39.54 38.95 39.40 39.38
11-Jul-2013 39.89 39.95 39.36 39.61 39.56
12-Jul-2013 39.64 39.83 39.39 39.68 39.59
15-Jul-2013 39.67 39.80 39.45 39.56 39.63
16-Jul-2013 39.62 39.72 39.10 39.23 39.26
17-Jul-2013 39.28 39.71 39.16 39.45 39.48
18-Jul-2013 39.52 39.75 39.36 39.42 39.45
19-Jul-2013 39.39 39.82 39.31 39.78 39.62
22-Jul-2013 39.79 40.00 39.71 39.79 39.82
23-Jul-2013 39.85 39.93 39.40 39.49 39.61
24-Jul-2013 39.72 39.93 39.41 39.52 39.61
25-Jul-2013 39.35 39.92 39.24 39.83 39.73
26-Jul-2013 39.59 39.93 39.33 39.91 39.73
29-Jul-2013 39.70 39.90 39.25 39.30 39.44
30-Jul-2013 39.48 39.88 39.30 39.70 39.73
31-Jul-2013 39.90 41.35 39.31 40.70 40.70
01-Aug-2013 41.05 42.60 41.01 42.03 42.07
02-Aug-2013 41.71 42.11 41.58 41.61 41.76
05-Aug-2013 41.39 41.77 41.39 41.50 41.54
06-Aug-2013 41.40 41.64 40.98 41.17 41.24
07-Aug-2013 41.07 41.44 40.74 40.85 40.94
08-Aug-2013 41.04 41.30 40.80 41.26 41.11
09-Aug-2013 41.25 41.37 41.12 41.23 41.27
12-Aug-2013 40.97 41.57 40.80 41.54 41.40
13-Aug-2013 41.64 41.70 41.04 41.20 41.20
14-Aug-2013 40.93 41.00 40.26 40.27 40.50
15-Aug-2013 39.99 40.65 39.80 40.48 40.39
VWAP represents daily Volume Weighted-Average Price
Page 65 of 80
Page 66
Hospira’s historical stock prices are provided by Bloomberg LP.
Pfizer makes no claims concerning the accuracy of the information provided on these pages, and will not be held liable for any use of this information.
Date Open Intraday High Intraday Low Close VWAP
HOSPIRA (HSP US) HISTORICAL COMMON STOCK PRICE INFORMATION
16-Aug-2013 40.40 40.48 39.82 40.20 40.20
19-Aug-2013 40.11 40.37 39.96 40.00 40.05
20-Aug-2013 40.01 40.53 39.87 39.87 40.11
21-Aug-2013 39.74 39.89 39.30 39.49 39.59
22-Aug-2013 39.62 40.30 39.57 40.18 40.05
23-Aug-2013 40.23 40.36 40.03 40.30 40.23
26-Aug-2013 40.29 40.55 40.07 40.29 40.34
27-Aug-2013 39.94 40.14 39.10 39.15 39.34
28-Aug-2013 39.18 39.42 38.96 39.06 39.16
29-Aug-2013 38.99 39.45 38.91 39.26 39.31
30-Aug-2013 39.26 39.35 38.80 39.03 39.01
03-Sep-2013 39.44 39.68 38.15 38.53 38.52
04-Sep-2013 38.53 38.74 38.19 38.68 38.49
05-Sep-2013 38.60 39.14 38.60 38.99 38.96
06-Sep-2013 39.04 39.18 38.44 38.88 38.85
09-Sep-2013 38.92 39.29 38.82 39.18 39.08
10-Sep-2013 39.24 40.16 39.24 39.80 39.89
11-Sep-2013 39.80 39.95 39.26 39.46 39.50
12-Sep-2013 39.41 39.81 39.24 39.46 39.53
13-Sep-2013 39.64 39.67 39.27 39.62 39.58
16-Sep-2013 40.00 40.60 39.87 40.26 40.28
17-Sep-2013 40.39 40.56 40.21 40.36 40.34
18-Sep-2013 40.29 41.01 40.10 40.92 40.66
19-Sep-2013 41.00 41.57 40.95 41.07 41.17
20-Sep-2013 41.08 41.43 41.06 41.17 41.19
23-Sep-2013 40.99 41.09 40.37 40.71 40.66
24-Sep-2013 40.63 40.76 40.20 40.22 40.42
25-Sep-2013 40.19 40.39 39.11 39.15 39.28
26-Sep-2013 39.31 39.59 39.03 39.16 39.21
27-Sep-2013 39.04 39.22 38.62 38.90 38.88
30-Sep-2013 38.67 39.26 38.45 39.22 39.05
01-Oct-2013 39.24 39.70 39.15 39.67 39.53
02-Oct-2013 39.39 39.52 39.23 39.42 39.36
03-Oct-2013 39.24 39.44 38.29 38.62 38.65
04-Oct-2013 38.60 39.59 38.58 39.54 39.32
07-Oct-2013 39.22 39.44 38.97 39.10 39.21
VWAP represents daily Volume Weighted-Average Price
Page 66 of 80
Page 67
Hospira’s historical stock prices are provided by Bloomberg LP.
Pfizer makes no claims concerning the accuracy of the information provided on these pages, and will not be held liable for any use of this information.
Date Open Intraday High Intraday Low Close VWAP
HOSPIRA (HSP US) HISTORICAL COMMON STOCK PRICE INFORMATION
08-Oct-2013 39.10 39.45 38.63 38.65 38.96
09-Oct-2013 38.71 39.25 38.34 38.99 38.87
10-Oct-2013 39.38 40.10 39.16 40.07 39.93
11-Oct-2013 39.99 40.79 39.92 40.78 40.56
14-Oct-2013 40.50 41.27 40.34 41.20 40.95
15-Oct-2013 41.00 41.48 40.91 40.91 41.14
16-Oct-2013 41.23 41.74 41.03 41.54 41.52
17-Oct-2013 41.47 41.89 41.40 41.79 41.72
18-Oct-2013 41.95 42.15 41.17 41.62 41.58
21-Oct-2013 41.54 41.78 41.39 41.65 41.56
22-Oct-2013 41.73 41.99 41.35 41.60 41.64
23-Oct-2013 41.36 41.55 41.20 41.30 41.30
24-Oct-2013 41.35 41.74 40.89 41.16 41.23
25-Oct-2013 41.07 41.48 40.60 41.37 41.13
28-Oct-2013 41.33 41.39 41.18 41.27 41.27
29-Oct-2013 41.48 41.51 40.82 41.10 40.97
30-Oct-2013 41.20 41.20 40.24 40.43 40.53
31-Oct-2013 40.49 40.87 39.99 40.52 40.47
01-Nov-2013 40.61 40.80 40.10 40.21 40.30
04-Nov-2013 40.26 40.48 40.11 40.21 40.23
05-Nov-2013 40.10 40.24 39.60 40.00 39.98
06-Nov-2013 42.15 42.50 39.02 40.76 40.55
07-Nov-2013 40.70 40.88 39.13 39.21 39.56
08-Nov-2013 39.10 39.32 38.59 38.89 38.81
11-Nov-2013 38.87 38.99 38.30 38.53 38.53
12-Nov-2013 38.42 38.76 38.11 38.74 38.57
13-Nov-2013 38.50 39.37 38.25 39.33 39.02
14-Nov-2013 39.38 39.50 39.24 39.43 39.43
15-Nov-2013 39.43 39.54 39.36 39.50 39.48
18-Nov-2013 39.50 39.50 38.95 39.00 39.21
19-Nov-2013 38.92 39.00 38.52 38.59 38.69
20-Nov-2013 38.74 39.08 38.47 38.72 38.81
21-Nov-2013 39.03 39.12 38.72 38.96 38.94
22-Nov-2013 38.96 39.35 38.74 39.21 39.16
25-Nov-2013 39.35 39.48 39.05 39.08 39.19
26-Nov-2013 39.17 39.50 39.05 39.16 39.29
VWAP represents daily Volume Weighted-Average Price
Page 67 of 80
Page 68
Hospira’s historical stock prices are provided by Bloomberg LP.
Pfizer makes no claims concerning the accuracy of the information provided on these pages, and will not be held liable for any use of this information.
Date Open Intraday High Intraday Low Close VWAP
HOSPIRA (HSP US) HISTORICAL COMMON STOCK PRICE INFORMATION
27-Nov-2013 39.26 39.54 39.24 39.43 39.47
29-Nov-2013 39.46 39.61 39.31 39.31 39.45
02-Dec-2013 39.31 40.33 39.31 40.09 40.06
03-Dec-2013 40.06 40.27 39.63 39.83 39.89
04-Dec-2013 39.51 40.33 39.47 40.21 39.88
05-Dec-2013 39.85 42.43 39.85 41.00 41.40
06-Dec-2013 41.46 41.75 41.32 41.57 41.56
09-Dec-2013 41.67 42.50 41.65 42.19 42.13
10-Dec-2013 42.10 42.18 41.40 41.49 41.60
11-Dec-2013 41.50 41.50 40.25 40.51 40.59
12-Dec-2013 40.54 40.56 40.13 40.25 40.35
13-Dec-2013 40.29 40.41 39.67 39.88 39.93
16-Dec-2013 40.03 40.35 39.84 40.10 40.05
17-Dec-2013 40.04 40.18 39.45 40.05 39.89
18-Dec-2013 40.05 41.26 39.90 41.25 40.84
19-Dec-2013 41.15 41.32 40.89 41.05 41.04
20-Dec-2013 40.97 41.46 40.87 41.27 41.21
23-Dec-2013 41.31 41.31 40.91 41.11 41.12
24-Dec-2013 41.22 41.39 41.09 41.29 41.30
26-Dec-2013 41.43 41.43 41.14 41.23 41.23
27-Dec-2013 41.20 41.44 41.08 41.21 41.25
30-Dec-2013 41.13 41.45 41.05 41.27 41.26
31-Dec-2013 41.43 41.51 41.02 41.28 41.30
02-Jan-2014 41.26 41.26 40.89 41.03 41.06
03-Jan-2014 41.03 41.31 41.02 41.22 41.25
06-Jan-2014 41.31 41.40 40.93 40.98 41.06
07-Jan-2014 40.67 41.32 40.61 41.07 41.15
08-Jan-2014 41.13 41.45 41.03 41.29 41.24
09-Jan-2014 41.40 42.02 41.35 41.95 41.81
10-Jan-2014 42.10 42.37 41.83 42.18 42.10
13-Jan-2014 42.02 42.39 41.59 41.69 41.99
14-Jan-2014 41.78 43.00 41.75 43.00 42.67
15-Jan-2014 42.98 42.98 42.50 42.55 42.69
16-Jan-2014 42.57 43.20 42.32 43.15 42.94
17-Jan-2014 43.20 43.27 42.48 42.75 42.92
21-Jan-2014 43.13 43.79 42.90 43.78 43.44
VWAP represents daily Volume Weighted-Average Price
Page 68 of 80
Page 69
Hospira’s historical stock prices are provided by Bloomberg LP.
Pfizer makes no claims concerning the accuracy of the information provided on these pages, and will not be held liable for any use of this information.
Date Open Intraday High Intraday Low Close VWAP
HOSPIRA (HSP US) HISTORICAL COMMON STOCK PRICE INFORMATION
22-Jan-2014 43.85 44.96 43.83 44.95 44.60
23-Jan-2014 44.55 45.24 44.26 45.00 44.85
24-Jan-2014 44.69 44.99 44.42 44.57 44.65
27-Jan-2014 44.49 44.71 43.86 44.12 44.28
28-Jan-2014 44.08 44.36 43.66 44.21 44.01
29-Jan-2014 43.91 44.50 43.54 43.95 43.93
30-Jan-2014 44.33 44.47 43.58 43.70 43.72
31-Jan-2014 43.31 44.16 43.06 44.01 43.84
03-Feb-2014 44.00 44.16 42.34 42.47 42.90
04-Feb-2014 42.66 42.90 42.11 42.48 42.55
05-Feb-2014 42.48 42.84 42.03 42.60 42.58
06-Feb-2014 42.75 42.96 42.21 42.48 42.46
07-Feb-2014 42.60 43.03 42.53 42.89 42.76
10-Feb-2014 42.81 44.74 42.81 44.62 44.01
11-Feb-2014 44.55 44.62 44.03 44.26 44.35
12-Feb-2014 44.14 45.23 42.88 44.41 44.53
13-Feb-2014 44.14 44.35 43.35 44.11 43.92
14-Feb-2014 44.09 44.29 43.38 43.55 43.66
18-Feb-2014 43.74 44.05 43.69 43.88 43.88
19-Feb-2014 43.88 44.09 43.59 43.78 43.85
20-Feb-2014 43.88 44.09 43.67 43.98 43.97
21-Feb-2014 43.90 43.90 41.86 42.27 42.28
24-Feb-2014 42.33 42.74 42.16 42.50 42.52
25-Feb-2014 42.51 43.00 42.28 42.70 42.62
26-Feb-2014 42.74 43.00 42.40 42.99 42.75
27-Feb-2014 42.99 43.34 42.76 43.09 43.06
28-Feb-2014 43.18 43.86 42.89 43.28 43.42
03-Mar-2014 42.69 42.81 42.07 42.36 42.43
04-Mar-2014 42.71 43.32 42.66 42.99 43.01
05-Mar-2014 42.80 42.83 42.30 42.65 42.65
06-Mar-2014 42.85 43.54 42.70 43.53 43.34
07-Mar-2014 43.61 43.70 42.98 43.35 43.31
10-Mar-2014 43.25 43.50 42.98 43.31 43.27
11-Mar-2014 43.34 44.00 42.01 42.68 43.01
12-Mar-2014 42.52 42.91 42.20 42.88 42.70
13-Mar-2014 42.96 43.12 42.08 42.15 42.45
VWAP represents daily Volume Weighted-Average Price
Page 69 of 80
Page 70
Hospira’s historical stock prices are provided by Bloomberg LP.
Pfizer makes no claims concerning the accuracy of the information provided on these pages, and will not be held liable for any use of this information.
Date Open Intraday High Intraday Low Close VWAP
HOSPIRA (HSP US) HISTORICAL COMMON STOCK PRICE INFORMATION
14-Mar-2014 42.09 42.65 41.99 42.10 42.31
17-Mar-2014 42.23 43.19 42.23 42.78 42.84
18-Mar-2014 42.80 43.20 42.37 42.95 42.85
19-Mar-2014 42.92 43.14 42.41 42.74 42.83
20-Mar-2014 42.60 42.80 42.26 42.75 42.67
21-Mar-2014 42.92 43.02 42.02 42.33 42.42
24-Mar-2014 42.29 42.41 41.00 41.46 41.41
25-Mar-2014 41.68 42.07 41.19 41.47 41.56
26-Mar-2014 41.62 41.82 40.89 40.89 41.19
27-Mar-2014 40.87 42.13 40.41 42.08 41.59
28-Mar-2014 42.25 43.19 42.19 42.59 42.72
31-Mar-2014 42.75 43.47 42.54 43.25 43.19
01-Apr-2014 43.27 44.28 43.02 44.27 43.99
02-Apr-2014 44.30 44.61 43.84 44.19 44.09
03-Apr-2014 44.16 44.69 43.70 44.55 44.43
04-Apr-2014 44.74 44.78 43.26 43.38 43.77
07-Apr-2014 43.27 43.66 42.60 43.01 42.99
08-Apr-2014 42.93 43.57 42.48 43.52 43.24
09-Apr-2014 43.63 44.36 43.27 44.21 43.95
10-Apr-2014 44.11 44.18 42.61 42.72 42.98
11-Apr-2014 42.52 42.60 42.01 42.14 42.24
14-Apr-2014 42.42 43.66 42.24 42.93 43.04
15-Apr-2014 43.09 43.51 42.16 43.43 42.92
16-Apr-2014 43.42 43.60 42.79 43.00 42.98
17-Apr-2014 42.85 43.22 42.51 42.84 42.84
21-Apr-2014 42.74 43.22 42.45 43.17 42.99
22-Apr-2014 43.25 43.85 43.21 43.71 43.67
23-Apr-2014 43.58 43.81 43.34 43.76 43.63
24-Apr-2014 43.89 43.99 43.23 43.96 43.76
25-Apr-2014 43.88 43.97 43.12 43.31 43.39
28-Apr-2014 43.62 44.27 43.38 44.20 43.93
29-Apr-2014 44.23 45.96 44.01 45.46 45.23
30-Apr-2014 46.40 46.96 44.60 45.80 45.67
01-May-2014 45.73 46.02 44.48 45.57 45.40
02-May-2014 45.60 46.27 45.33 46.20 45.99
05-May-2014 45.89 46.95 45.69 46.92 46.46
VWAP represents daily Volume Weighted-Average Price
Page 70 of 80
Page 71
Hospira’s historical stock prices are provided by Bloomberg LP.
Pfizer makes no claims concerning the accuracy of the information provided on these pages, and will not be held liable for any use of this information.
Date Open Intraday High Intraday Low Close VWAP
HOSPIRA (HSP US) HISTORICAL COMMON STOCK PRICE INFORMATION
06-May-2014 46.73 46.82 46.17 46.38 46.43
07-May-2014 46.47 47.77 46.43 47.72 47.17
08-May-2014 47.52 47.87 46.98 47.18 47.31
09-May-2014 47.30 47.56 46.86 47.50 47.28
12-May-2014 47.75 48.18 47.59 48.05 47.96
13-May-2014 48.13 48.25 47.80 47.92 47.99
14-May-2014 47.77 48.06 47.30 47.63 47.75
15-May-2014 47.49 47.87 46.75 47.29 47.18
16-May-2014 47.28 48.32 47.19 48.12 47.84
19-May-2014 47.89 48.27 47.70 48.07 48.00
20-May-2014 48.00 48.09 47.29 47.56 47.61
21-May-2014 47.68 48.17 47.62 48.09 48.01
22-May-2014 48.12 48.23 47.78 48.00 48.08
23-May-2014 48.00 48.17 47.82 47.98 48.01
27-May-2014 48.17 48.42 47.91 47.96 48.06
28-May-2014 47.99 48.39 47.72 48.28 48.19
29-May-2014 48.45 48.62 48.09 48.61 48.45
30-May-2014 48.52 49.25 48.43 49.17 48.99
02-Jun-2014 49.17 49.24 48.93 49.14 49.11
03-Jun-2014 49.05 49.19 48.71 48.86 48.90
04-Jun-2014 48.77 49.20 48.47 49.08 48.99
05-Jun-2014 49.20 50.08 48.92 50.03 49.84
06-Jun-2014 50.10 50.99 49.85 50.78 50.58
09-Jun-2014 50.66 51.12 50.47 51.00 50.99
10-Jun-2014 51.00 52.09 50.82 52.02 51.62
11-Jun-2014 51.82 52.86 51.80 52.05 52.22
12-Jun-2014 51.85 51.85 50.84 50.98 51.07
13-Jun-2014 50.96 51.05 50.39 50.80 50.64
16-Jun-2014 50.74 51.06 50.56 51.01 50.91
17-Jun-2014 50.95 51.33 50.84 50.88 50.98
18-Jun-2014 50.75 51.52 50.51 51.50 51.15
19-Jun-2014 51.62 52.02 51.34 52.00 51.82
20-Jun-2014 52.20 52.45 52.00 52.41 52.26
23-Jun-2014 52.28 52.50 51.96 52.12 52.08
24-Jun-2014 52.06 52.46 51.89 51.90 52.12
25-Jun-2014 51.97 52.30 51.78 51.81 51.91
VWAP represents daily Volume Weighted-Average Price
Page 71 of 80
Page 72
Hospira’s historical stock prices are provided by Bloomberg LP.
Pfizer makes no claims concerning the accuracy of the information provided on these pages, and will not be held liable for any use of this information.
Date Open Intraday High Intraday Low Close VWAP
HOSPIRA (HSP US) HISTORICAL COMMON STOCK PRICE INFORMATION
26-Jun-2014 51.94 52.22 51.63 51.75 51.79
27-Jun-2014 51.66 51.78 50.74 50.88 50.98
30-Jun-2014 50.85 51.42 50.78 51.37 51.20
01-Jul-2014 51.72 53.16 51.72 52.86 52.65
02-Jul-2014 52.62 52.71 52.42 52.64 52.57
03-Jul-2014 52.73 52.88 52.18 52.49 52.43
07-Jul-2014 52.35 52.35 51.50 51.74 51.78
08-Jul-2014 51.73 51.73 50.95 51.38 51.27
09-Jul-2014 51.54 51.74 51.17 51.51 51.40
10-Jul-2014 51.02 51.14 50.64 51.06 50.94
11-Jul-2014 51.10 51.20 50.49 50.82 50.77
14-Jul-2014 51.25 51.41 50.56 51.20 51.09
15-Jul-2014 51.52 51.73 50.67 50.75 50.99
16-Jul-2014 50.94 50.94 50.34 50.54 50.55
17-Jul-2014 50.28 50.50 49.47 49.59 49.96
18-Jul-2014 49.77 50.27 49.70 50.15 50.10
21-Jul-2014 49.88 50.63 49.74 50.47 50.28
22-Jul-2014 50.82 51.14 50.64 50.78 50.81
23-Jul-2014 50.71 51.10 50.27 50.66 50.61
24-Jul-2014 50.67 51.92 50.63 51.82 51.51
25-Jul-2014 51.67 51.99 51.34 51.72 51.77
28-Jul-2014 52.53 54.24 51.74 51.84 52.89
29-Jul-2014 51.84 52.06 51.36 51.90 51.79
30-Jul-2014 52.78 56.48 52.78 56.21 55.41
31-Jul-2014 55.98 56.78 55.14 55.47 55.80
01-Aug-2014 55.40 56.08 54.36 54.64 54.82
04-Aug-2014 54.69 55.25 54.13 55.11 54.62
05-Aug-2014 55.04 56.05 54.79 55.16 55.34
06-Aug-2014 54.70 55.71 54.58 55.19 55.29
07-Aug-2014 54.52 55.23 53.38 53.62 53.96
08-Aug-2014 53.66 54.41 53.16 54.38 54.07
11-Aug-2014 54.71 54.73 54.26 54.57 54.56
12-Aug-2014 54.50 54.89 54.18 54.54 54.63
13-Aug-2014 54.88 55.24 54.56 55.16 55.04
14-Aug-2014 55.30 55.74 54.96 55.71 55.36
15-Aug-2014 55.74 56.00 54.63 55.02 55.12
VWAP represents daily Volume Weighted-Average Price
Page 72 of 80
Page 73
Hospira’s historical stock prices are provided by Bloomberg LP.
Pfizer makes no claims concerning the accuracy of the information provided on these pages, and will not be held liable for any use of this information.
Date Open Intraday High Intraday Low Close VWAP
HOSPIRA (HSP US) HISTORICAL COMMON STOCK PRICE INFORMATION
18-Aug-2014 55.51 55.78 55.33 55.48 55.50
19-Aug-2014 55.48 55.50 53.72 53.92 54.19
20-Aug-2014 54.01 55.30 53.76 54.91 54.75
21-Aug-2014 54.86 55.11 54.68 54.74 54.81
22-Aug-2014 54.65 54.83 54.29 54.60 54.55
25-Aug-2014 54.86 54.97 54.53 54.60 54.71
26-Aug-2014 54.54 54.65 53.88 54.04 54.17
27-Aug-2014 54.10 54.32 53.95 54.24 54.16
28-Aug-2014 54.12 54.29 53.72 54.22 54.14
29-Aug-2014 54.22 54.22 53.50 53.74 53.83
02-Sep-2014 53.89 54.25 53.79 54.22 54.13
03-Sep-2014 54.42 54.47 52.73 53.85 53.78
04-Sep-2014 53.88 54.11 53.36 53.43 53.71
05-Sep-2014 53.50 53.98 53.16 53.90 53.82
08-Sep-2014 53.70 53.84 52.47 52.72 52.80
09-Sep-2014 52.87 53.19 52.54 53.01 52.95
10-Sep-2014 53.20 53.25 52.83 53.15 53.03
11-Sep-2014 53.03 53.24 52.81 52.99 52.96
12-Sep-2014 53.00 53.07 52.51 52.63 52.70
15-Sep-2014 52.75 52.98 52.54 52.79 52.77
16-Sep-2014 52.77 53.26 52.57 53.25 53.02
17-Sep-2014 53.25 53.73 53.21 53.44 53.48
18-Sep-2014 53.54 53.71 53.26 53.51 53.53
19-Sep-2014 53.88 54.09 53.61 53.85 53.86
22-Sep-2014 53.62 53.82 52.42 52.46 52.69
23-Sep-2014 52.04 52.37 51.42 52.14 52.15
24-Sep-2014 52.22 53.09 51.86 53.04 52.74
25-Sep-2014 52.97 53.11 52.03 52.03 52.32
26-Sep-2014 52.10 52.33 51.82 52.21 52.15
29-Sep-2014 51.71 52.82 51.54 52.75 52.51
30-Sep-2014 52.67 52.83 51.78 52.03 52.19
01-Oct-2014 52.03 52.09 51.30 51.78 51.83
02-Oct-2014 51.54 51.93 50.90 51.32 51.45
03-Oct-2014 51.62 52.71 51.42 52.44 52.26
06-Oct-2014 52.67 52.93 52.31 52.32 52.52
07-Oct-2014 52.16 52.43 51.02 51.04 51.64
VWAP represents daily Volume Weighted-Average Price
Page 73 of 80
Page 74
Hospira’s historical stock prices are provided by Bloomberg LP.
Pfizer makes no claims concerning the accuracy of the information provided on these pages, and will not be held liable for any use of this information.
Date Open Intraday High Intraday Low Close VWAP
HOSPIRA (HSP US) HISTORICAL COMMON STOCK PRICE INFORMATION
08-Oct-2014 51.02 52.48 50.94 52.46 51.78
09-Oct-2014 52.45 52.45 51.02 51.03 51.43
10-Oct-2014 51.26 51.85 50.15 50.17 50.84
13-Oct-2014 50.18 50.27 48.29 48.35 48.97
14-Oct-2014 48.49 49.13 48.19 48.31 48.61
15-Oct-2014 47.92 48.48 46.56 48.12 47.54
16-Oct-2014 47.44 49.88 47.32 49.67 48.94
17-Oct-2014 50.04 50.40 49.29 50.07 49.90
20-Oct-2014 49.91 50.40 49.60 49.87 49.86
21-Oct-2014 50.24 50.92 49.93 50.88 50.33
22-Oct-2014 51.00 51.17 50.04 50.08 50.66
23-Oct-2014 50.54 52.04 50.54 51.45 51.30
24-Oct-2014 51.42 52.26 51.42 52.25 52.02
27-Oct-2014 52.22 52.33 51.55 51.73 51.85
28-Oct-2014 51.89 52.30 51.55 52.30 52.02
29-Oct-2014 52.24 52.72 51.60 52.07 52.16
30-Oct-2014 51.74 54.85 51.45 54.24 53.63
31-Oct-2014 54.96 55.10 53.31 53.70 53.84
03-Nov-2014 53.50 53.79 52.94 53.02 53.20
04-Nov-2014 53.02 53.36 52.30 53.28 52.89
05-Nov-2014 53.47 53.88 52.66 53.10 53.02
06-Nov-2014 55.61 58.00 55.00 56.64 56.65
07-Nov-2014 57.50 57.57 56.03 56.32 56.54
10-Nov-2014 56.17 56.95 55.88 55.98 56.13
11-Nov-2014 56.05 57.49 55.81 57.31 56.72
12-Nov-2014 57.27 58.24 56.91 58.09 57.94
13-Nov-2014 58.25 58.25 57.65 58.09 57.98
14-Nov-2014 58.18 58.31 57.46 58.28 58.11
17-Nov-2014 58.06 58.60 57.57 58.40 58.31
18-Nov-2014 58.41 59.78 58.13 59.72 59.50
19-Nov-2014 59.49 59.49 58.34 58.81 58.79
20-Nov-2014 58.21 59.03 58.18 58.53 58.54
21-Nov-2014 59.11 59.56 58.67 58.82 59.09
24-Nov-2014 59.00 60.32 58.82 60.30 59.72
25-Nov-2014 60.46 60.46 59.87 60.08 60.03
26-Nov-2014 60.27 60.78 60.04 60.29 60.33
VWAP represents daily Volume Weighted-Average Price
Page 74 of 80
Page 75
Hospira’s historical stock prices are provided by Bloomberg LP.
Pfizer makes no claims concerning the accuracy of the information provided on these pages, and will not be held liable for any use of this information.
Date Open Intraday High Intraday Low Close VWAP
HOSPIRA (HSP US) HISTORICAL COMMON STOCK PRICE INFORMATION
28-Nov-2014 60.34 60.74 59.55 59.64 59.97
01-Dec-2014 59.40 60.18 59.18 59.94 59.78
02-Dec-2014 60.13 60.80 59.83 60.77 60.44
03-Dec-2014 60.54 60.83 59.61 59.74 60.16
04-Dec-2014 59.56 60.07 59.07 59.26 59.50
05-Dec-2014 59.31 60.27 59.06 60.10 60.01
08-Dec-2014 60.00 60.29 59.60 60.12 60.08
09-Dec-2014 60.14 61.30 59.81 60.36 60.23
10-Dec-2014 60.09 60.56 59.25 59.39 59.72
11-Dec-2014 59.72 63.08 59.44 62.08 62.25
12-Dec-2014 62.14 62.31 60.30 60.33 61.35
15-Dec-2014 60.50 61.61 60.31 60.34 60.89
16-Dec-2014 59.99 60.67 58.79 58.82 59.69
17-Dec-2014 58.97 60.91 58.95 60.25 60.27
18-Dec-2014 61.21 62.54 60.74 62.44 61.97
19-Dec-2014 62.74 63.14 62.09 62.66 62.63
22-Dec-2014 62.53 62.93 61.96 62.84 62.56
23-Dec-2014 62.97 63.00 61.63 62.67 62.54
24-Dec-2014 62.76 62.93 62.43 62.60 62.71
26-Dec-2014 62.83 62.94 62.33 62.44 62.53
29-Dec-2014 62.22 62.52 62.10 62.24 62.28
30-Dec-2014 62.55 63.36 62.05 62.56 62.83
31-Dec-2014 62.61 62.76 61.20 61.25 61.82
02-Jan-2015 61.38 62.57 61.05 61.87 61.75
05-Jan-2015 61.67 62.00 60.67 60.96 61.23
06-Jan-2015 60.94 61.70 60.53 60.63 60.99
07-Jan-2015 61.07 61.60 60.85 61.12 61.22
08-Jan-2015 61.58 62.37 61.37 61.70 61.82
09-Jan-2015 62.00 62.30 61.60 61.64 61.89
12-Jan-2015 61.80 62.16 61.40 61.55 61.62
13-Jan-2015 62.45 62.86 60.93 61.76 61.89
14-Jan-2015 61.03 62.05 60.77 61.80 61.60
15-Jan-2015 61.97 62.14 61.29 61.52 61.76
16-Jan-2015 61.32 63.29 61.00 63.22 62.34
20-Jan-2015 63.30 63.97 62.65 63.67 63.45
21-Jan-2015 63.34 64.20 63.08 63.93 63.85
VWAP represents daily Volume Weighted-Average Price
Page 75 of 80
Page 76
Hospira’s historical stock prices are provided by Bloomberg LP.
Pfizer makes no claims concerning the accuracy of the information provided on these pages, and will not be held liable for any use of this information.
Date Open Intraday High Intraday Low Close VWAP
HOSPIRA (HSP US) HISTORICAL COMMON STOCK PRICE INFORMATION
22-Jan-2015 64.31 64.76 63.31 64.74 64.30
23-Jan-2015 64.67 65.58 64.55 65.39 65.21
26-Jan-2015 65.09 66.56 64.24 66.50 65.70
27-Jan-2015 65.86 66.24 65.46 65.49 65.82
28-Jan-2015 65.95 66.08 64.58 64.65 65.28
29-Jan-2015 64.48 64.83 63.43 64.78 64.12
30-Jan-2015 64.07 64.60 63.35 63.43 63.82
02-Feb-2015 63.84 63.96 62.17 63.40 63.06
03-Feb-2015 63.49 63.79 62.82 63.70 63.31
04-Feb-2015 63.44 65.00 63.23 64.80 64.60
05-Feb-2015 87.43 87.77 87.39 87.64 87.56
06-Feb-2015 87.55 87.65 87.43 87.43 87.53
09-Feb-2015 87.43 87.50 87.35 87.39 87.42
10-Feb-2015 87.50 87.54 87.38 87.38 87.44
11-Feb-2015 87.45 87.49 87.33 87.33 87.39
12-Feb-2015 87.40 87.48 87.34 87.35 87.40
13-Feb-2015 87.34 87.44 87.31 87.35 87.37
17-Feb-2015 87.37 87.50 87.35 87.50 87.40
18-Feb-2015 87.42 87.50 87.37 87.40 87.41
19-Feb-2015 87.34 87.55 87.34 87.44 87.44
20-Feb-2015 87.40 87.58 87.39 87.54 87.44
23-Feb-2015 87.46 87.50 87.43 87.50 87.47
24-Feb-2015 87.46 87.50 87.44 87.48 87.47
25-Feb-2015 87.52 87.54 87.46 87.49 87.50
26-Feb-2015 87.49 87.55 87.45 87.54 87.47
27-Feb-2015 87.49 87.55 87.47 87.54 87.51
02-Mar-2015 87.54 87.70 87.48 87.67 87.57
03-Mar-2015 87.56 87.77 87.55 87.71 87.71
04-Mar-2015 87.69 87.97 87.64 87.95 87.78
05-Mar-2015 87.95 88.04 87.84 87.85 87.87
06-Mar-2015 87.85 87.93 87.79 87.90 87.86
09-Mar-2015 87.85 87.94 87.65 87.71 87.81
10-Mar-2015 87.70 87.74 87.60 87.62 87.68
11-Mar-2015 87.70 87.72 87.53 87.60 87.65
12-Mar-2015 87.67 87.69 87.53 87.60 87.60
13-Mar-2015 87.63 87.71 87.48 87.56 87.57
VWAP represents daily Volume Weighted-Average Price
Page 76 of 80
Page 77
Hospira’s historical stock prices are provided by Bloomberg LP.
Pfizer makes no claims concerning the accuracy of the information provided on these pages, and will not be held liable for any use of this information.
Date Open Intraday High Intraday Low Close VWAP
HOSPIRA (HSP US) HISTORICAL COMMON STOCK PRICE INFORMATION
16-Mar-2015 87.52 87.68 87.52 87.66 87.64
17-Mar-2015 87.59 87.69 87.58 87.63 87.64
18-Mar-2015 87.61 87.80 87.59 87.72 87.68
19-Mar-2015 87.72 87.77 87.65 87.70 87.69
20-Mar-2015 87.77 87.87 87.63 87.64 87.70
23-Mar-2015 87.68 87.98 87.67 87.88 87.88
24-Mar-2015 87.83 88.09 87.82 88.00 87.92
25-Mar-2015 87.99 88.05 87.75 87.75 87.85
26-Mar-2015 87.76 87.94 87.68 87.85 87.78
27-Mar-2015 87.89 87.94 87.76 87.88 87.87
30-Mar-2015 87.89 87.97 87.72 87.72 87.85
31-Mar-2015 87.74 87.91 87.72 87.84 87.81
01-Apr-2015 87.81 88.15 87.80 88.11 87.95
02-Apr-2015 88.06 88.10 87.81 87.82 87.93
06-Apr-2015 87.86 88.07 87.85 87.89 87.91
07-Apr-2015 87.90 88.03 86.45 87.75 87.64
08-Apr-2015 87.75 87.89 87.66 87.76 87.79
09-Apr-2015 87.75 87.91 87.63 87.65 87.73
10-Apr-2015 87.69 87.90 87.66 87.75 87.75
13-Apr-2015 87.70 87.79 87.64 87.64 87.72
14-Apr-2015 87.66 87.76 87.65 87.68 87.69
15-Apr-2015 87.76 87.80 87.61 87.69 87.71
16-Apr-2015 87.67 87.74 87.66 87.67 87.70
17-Apr-2015 87.63 87.70 87.46 87.46 87.55
20-Apr-2015 87.66 87.87 87.53 87.84 87.68
21-Apr-2015 87.85 87.89 87.72 87.76 87.79
22-Apr-2015 87.76 87.85 87.70 87.80 87.78
23-Apr-2015 87.79 87.83 87.64 87.66 87.72
24-Apr-2015 87.65 87.74 87.47 87.61 87.62
27-Apr-2015 87.63 87.67 87.24 87.24 87.45
28-Apr-2015 87.40 87.47 87.18 87.26 87.34
29-Apr-2015 87.28 87.39 87.28 87.29 87.34
30-Apr-2015 87.28 87.34 87.26 87.29 87.30
01-May-2015 87.34 87.35 87.27 87.29 87.29
04-May-2015 87.33 87.76 87.28 87.73 87.49
05-May-2015 87.60 87.73 87.51 87.71 87.65
VWAP represents daily Volume Weighted-Average Price
Page 77 of 80
Page 78
Hospira’s historical stock prices are provided by Bloomberg LP.
Pfizer makes no claims concerning the accuracy of the information provided on these pages, and will not be held liable for any use of this information.
Date Open Intraday High Intraday Low Close VWAP
HOSPIRA (HSP US) HISTORICAL COMMON STOCK PRICE INFORMATION
06-May-2015 87.75 87.77 87.58 87.69 87.69
07-May-2015 87.70 87.76 87.56 87.75 87.69
08-May-2015 87.75 87.98 87.68 87.94 87.83
11-May-2015 87.93 88.00 87.85 87.96 87.94
12-May-2015 87.74 88.13 87.74 88.06 87.99
13-May-2015 88.02 88.34 87.97 88.10 88.10
14-May-2015 88.07 88.24 87.99 88.18 88.15
15-May-2015 88.16 88.28 88.09 88.10 88.22
18-May-2015 88.16 88.25 88.13 88.25 88.19
19-May-2015 88.25 88.25 88.15 88.21 88.20
20-May-2015 88.21 88.37 88.03 88.13 88.20
21-May-2015 88.14 88.35 88.08 88.31 88.22
22-May-2015 88.19 88.45 88.16 88.27 88.31
26-May-2015 88.30 88.36 88.26 88.34 88.30
27-May-2015 88.36 88.50 88.30 88.40 88.42
28-May-2015 88.39 88.54 88.30 88.44 88.40
29-May-2015 88.56 88.57 88.25 88.42 88.39
01-Jun-2015 88.53 88.68 88.39 88.42 88.54
02-Jun-2015 88.52 88.56 88.39 88.50 88.43
03-Jun-2015 88.45 88.58 88.40 88.45 88.45
04-Jun-2015 88.42 88.49 88.36 88.37 88.40
05-Jun-2015 88.38 88.44 88.19 88.41 88.35
08-Jun-2015 88.38 88.49 88.26 88.26 88.37
09-Jun-2015 88.33 88.42 88.24 88.26 88.30
10-Jun-2015 88.29 88.51 88.26 88.44 88.41
11-Jun-2015 88.45 88.57 88.29 88.29 88.41
12-Jun-2015 88.29 88.40 88.20 88.23 88.30
15-Jun-2015 88.26 88.75 88.20 88.58 88.49
16-Jun-2015 88.35 88.74 88.35 88.72 88.62
17-Jun-2015 88.74 88.85 88.57 88.59 88.71
18-Jun-2015 88.70 88.80 88.53 88.71 88.66
19-Jun-2015 88.72 88.87 88.17 88.32 88.52
22-Jun-2015 88.52 88.74 88.47 88.70 88.66
23-Jun-2015 88.69 88.73 88.48 88.57 88.64
24-Jun-2015 88.60 88.61 88.47 88.47 88.53
25-Jun-2015 88.52 88.71 88.52 88.69 88.62
VWAP represents daily Volume Weighted-Average Price
Page 78 of 80
Page 79
Hospira’s historical stock prices are provided by Bloomberg LP.
Pfizer makes no claims concerning the accuracy of the information provided on these pages, and will not be held liable for any use of this information.
Date Open Intraday High Intraday Low Close VWAP
HOSPIRA (HSP US) HISTORICAL COMMON STOCK PRICE INFORMATION
26-Jun-2015 88.68 88.81 88.59 88.81 88.75
29-Jun-2015 88.71 88.80 88.61 88.69 88.68
30-Jun-2015 88.70 88.76 88.63 88.71 88.70
01-Jul-2015 88.75 88.94 88.68 88.89 88.83
02-Jul-2015 88.82 88.99 88.82 88.95 88.92
06-Jul-2015 88.89 89.00 88.84 89.00 88.96
07-Jul-2015 88.97 89.24 88.95 89.20 89.06
08-Jul-2015 89.09 89.25 89.08 89.10 89.14
09-Jul-2015 89.22 89.25 89.10 89.13 89.15
10-Jul-2015 89.15 89.19 89.12 89.15 89.16
13-Jul-2015 89.18 89.20 89.11 89.16 89.15
14-Jul-2015 89.13 89.43 89.13 89.35 89.28
15-Jul-2015 89.33 89.35 89.27 89.35 89.32
16-Jul-2015 89.39 89.44 89.15 89.23 89.27
17-Jul-2015 89.18 89.35 89.16 89.30 89.27
20-Jul-2015 89.29 89.36 89.27 89.34 89.33
21-Jul-2015 89.35 89.38 89.23 89.34 89.31
22-Jul-2015 89.35 89.37 89.17 89.20 89.28
23-Jul-2015 89.26 89.31 89.08 89.26 89.22
24-Jul-2015 89.20 89.34 89.13 89.25 89.23
27-Jul-2015 89.25 89.40 89.20 89.35 89.31
28-Jul-2015 89.36 89.36 89.20 89.23 89.25
29-Jul-2015 89.24 89.42 89.20 89.42 89.30
30-Jul-2015 89.37 89.46 89.32 89.40 89.37
31-Jul-2015 89.42 89.68 89.32 89.45 89.39
03-Aug-2015 89.45 89.55 89.36 89.53 89.42
04-Aug-2015 89.52 89.66 89.44 89.60 89.55
05-Aug-2015 89.60 89.66 89.51 89.63 89.59
06-Aug-2015 89.65 89.66 89.52 89.58 89.58
07-Aug-2015 89.57 89.60 89.51 89.54 89.56
10-Aug-2015 89.57 89.58 89.50 89.51 89.52
11-Aug-2015 89.50 89.59 89.48 89.53 89.52
12-Aug-2015 89.51 89.59 89.49 89.54 89.54
13-Aug-2015 89.54 89.65 89.52 89.62 89.58
14-Aug-2015 89.66 89.75 89.65 89.68 89.69
17-Aug-2015 89.79 89.82 89.69 89.80 89.76
VWAP represents daily Volume Weighted-Average Price
Page 79 of 80
Page 80
Hospira’s historical stock prices are provided by Bloomberg LP.
Pfizer makes no claims concerning the accuracy of the information provided on these pages, and will not be held liable for any use of this information.
Date Open Intraday High Intraday Low Close VWAP
HOSPIRA (HSP US) HISTORICAL COMMON STOCK PRICE INFORMATION
18-Aug-2015 89.80 90.63 89.75 89.77 89.78
19-Aug-2015 89.80 89.80 89.70 89.70 89.76
20-Aug-2015 89.72 89.77 89.63 89.63 89.69
21-Aug-2015 89.63 89.72 89.50 89.51 89.60
24-Aug-2015 89.84 89.88 89.77 89.85 89.83
25-Aug-2015 89.86 89.97 89.82 89.83 89.88
26-Aug-2015 89.90 89.90 89.83 89.84 89.86
27-Aug-2015 89.88 89.95 89.86 89.92 89.91
28-Aug-2015 89.96 89.96 89.91 89.93 89.93
31-Aug-2015 89.97 89.97 89.94 89.97 89.96
01-Sep-2015 89.97 89.97 89.95 89.96 89.96
02-Sep-2015 89.96 89.98 89.95 89.95 89.95
VWAP represents daily Volume Weighted-Average Price
Page 80 of 80