575 Madison Avenue, Suite 1006, New York, NY, USA, 10022-2511 T 1.877.796.3600 F 1.866.484.2600 [email protected] www.iperceptions.com Hospitality Industry Report Q1 2009 1 January – 31 March 2009
Transcript
575 Madison Avenue, Suite 1006, New York, NY, USA, 10022-2511T 1.877.796.3600 F 1.866.484.2600
Major structural shifts are underway in the hospitality industry. According to a recent study conducted by Merrill Lynch, online bookings as a share of total reservations increased from 30% in 2006 to 40% in 2008. The same study projects that 45% of hotel bookings will be made online by the year 2010.1 As Q1 2009 iPerceptions Hospitality Industry Report demonstrates, booking is the leading preoccupation of hotel website visitors. In this way, hospitality websites face a basket of challenges not dissimilar to main-line e-commerce sites: optimizing the transactional experience for visitors who are onsite to book and ensuring that researchers and rate shoppers are efficiently shepherded down the booking funnel.
At the same time as the web is morphing the traditional relationship between hotel and patron, eco-nomic jitters pose a systemic challenge to the industry. Industry analysts expect a measurable slowdown in travel this year, as both business and leisure consumers forego travel plans to save money. Snapshot data shows that year-over-year industry occupancy rates fell 12.3% in the calendar week March 22 to March 28.2 Looking ahead, those who do travel will no doubt change their booking habits – specifically, they will wait until the last minute to book in order to obtain the best prices, combing through the online brokerage sites to shave valuable dollars off room rates. Cost sensitivity is already having a negative impact on hospitality website satisfaction scores. In Q1 2009, the two weakest attributes in the sector—Bottom Line and Starting Point—pertained directly to price and perceived sense of value.
When we slice the hospitality website visitor base by primary intent, we find some disquieting task com-pletion data, which elucidates the high-level trends being written about by analysts in the field. Only 51% of bookers were capable of completing their tasks. While some of the reasons underpinning this low rate might have been outside the purview of the web experience, significant numbers of bookers reported problems with site navigation, the booking flow, and insufficient hotel/room information, all of which fall squarely on the plate of interactive marketers and website developers.
To counteract this, hotel websites will need to focus on better engaging and persuading visitors at incipi-ent stages of the booking cycle. As the data shows, one in two visitors were onsite for the first time and thus not acclimated to site navigation, architecture, and functionality. Hotel websites struggled to effectively cater to this segment, as evidenced by their collective iPerceptions Satisfaction Index score of 6.85, starkly lower than the score of 7.51 posted by the most frequent visitors. To boost their efficiency in a troubled economic climate, hotel websites will need to focus on delivering simpler, more intuitive site navigation, a streamlined booking process, and more robust content, supplemented with better pictures and more lifelike virtual tours.
Data contained in the Hospitality Industry Report represents aggregated information obtained from 30 webValidator™ studies deployed on the web sites of leading hospitality brands. This industry specific database collected data from 137,357 visitors. Additionally, the data is supplemented with results from hundreds of hospitality websites running the free 4Q survey.
Sources:1. HVS Web Strategies, “Marketing Online – tapping into current trends,” April 6, 2009. 2. STR (Smith Travel Research), Apr. 3, 2009.
4Quarterly Report (Q1 2009): Hospitality Industry
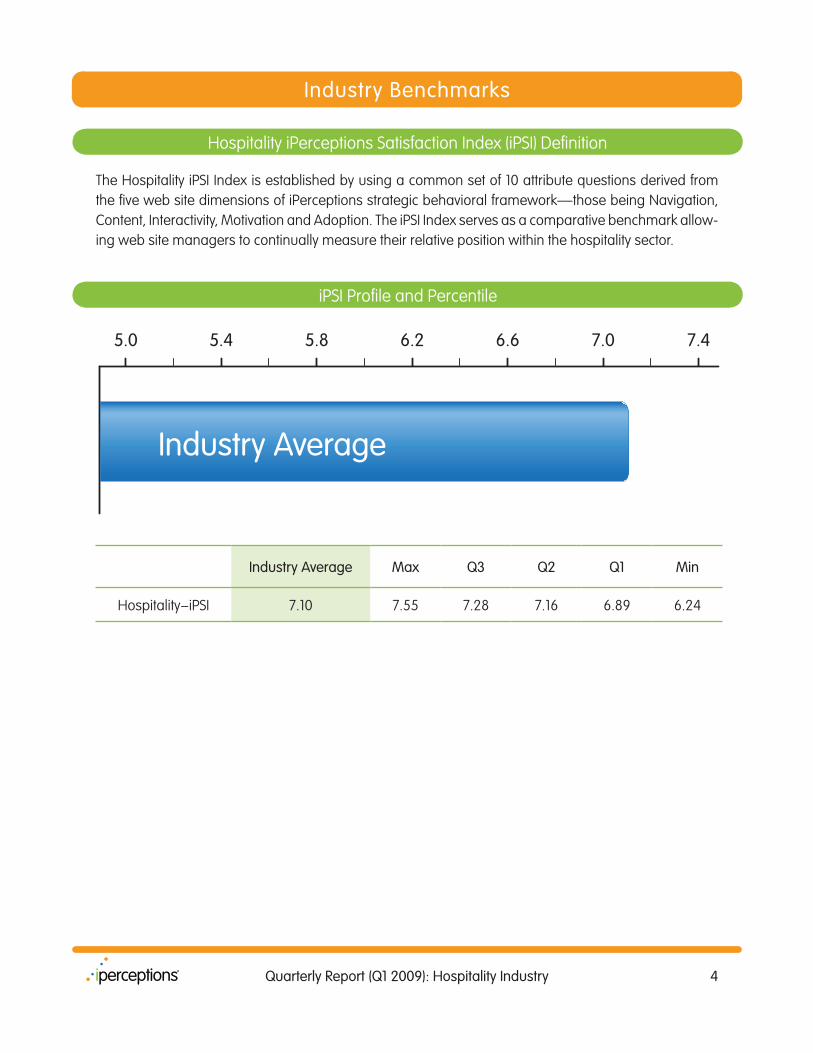
The Hospitality iPSI Index is established by using a common set of 10 attribute questions derived from the five web site dimensions of iPerceptions strategic behavioral framework — those being Navigation, Content, Interactivity, Motivation and Adoption. The iPSI Index serves as a comparative benchmark allow-ing web site managers to continually measure their relative position within the hospitality sector.
Industry Benchmarks
5.0 5.4 5.8 6.2 6.6 7.0 7.4
Industry Average
Industry Average Max Q3 Q2 Q1 Min
Hospitality – iPSI 7.10 7.55 7.28 7.16 6.89 6.24
iPSI Profile and Percentile
Hospitality iPerceptions Satisfaction Index (iPSI) Definition
5Quarterly Report (Q1 2009): Hospitality Industry
Industry Benchmarks
5.2
5.6
6.0
6.4
6.8
7.2
7.6
ReturnResponsiveRelevancyEaseof Use
DiscoveryConvenienceContactsBreadthBottomLine
StartingPoint
Attribute Industry Average Max Q3 Q2 Q1 Min
Bottom Line 6.69 7.07 6.94 6.78 6.61 5.73
Breadth 7.23 7.71 7.43 7.24 7.10 6.36
Contacts 7.03 7.42 7.19 7.11 6.88 6.27
Convenience 7.23 7.74 7.46 7.27 7.02 6.36
Discovery 7.21 7.57 7.40 7.25 7.05 6.20
Ease of Use 7.33 7.76 7.50 7.38 7.21 6.38
Relevancy 7.31 7.71 7.43 7.24 7.10 6.36
Responsive 7.00 7.39 7.19 7.06 6.81 6.14
Return 7.16 7.77 7.35 7.18 6.93 6.34
Starting Point 6.76 7.66 7.15 6.92 6.35 5.72
Hospitality iPSI — Attribute Comparison
6Quarterly Report (Q1 2009): Hospitality Industry
User Group Comparisons
0% 10% 20% 30% 40%
Look for HotelInformation
Research andCompare Rates
View or Cancela Reservation
Make Reservation
Other
Purpose of Visit Industry Average Max Q3 Q2 Q1 Min
Make a Reservation 7.24 7.64 7.47 7.34 7.11 6.23
View or Cancel a Reservation 7.24 7.83 7.51 7.39 6.99 6.37
Research and Compare Rates 6.97 7.34 7.14 7.00 6.83 6.41
Look for Hotel Information 7.04 7.43 7.27 7.12 6.84 6.08
Other 6.78 7.54 7.16 6.81 6.38 5.93
Purpose of Visit Industry Average
Make a Reservation 33.0%
View or Cancel a Reservation 3.2%
Research and Compare Rates 22.3%
Look for Hotel Information 29.5%
Other 12.0%
Purpose of Visit
7Quarterly Report (Q1 2009): Hospitality Industry
User Group Comparisons
0% 20% 40% 60% 80%
Leisure Traveler
Business Traveler
Other
Context of Visit Industry Average Max Q3 Q2 Q1 Min
Business Traveler 7.08 7.51 7.35 7.12 6.85 6.22
Leisure Traveler 7.13 7.59 7.31 7.16 6.98 6.25
Other 6.88 7.40 7.11 6.93 6.63 6.18
Context of Visit Industry Average
Business Traveler 21.3%
Leisure Traveler 70.3%
Other 17.2%
Context of Visit
8Quarterly Report (Q1 2009): Hospitality Industry
User Group Comparisons
0% 10% 20% 40% 50%
2–5 times
First time
More than 5 times
30%
Frequency of Visit Industry Average Max Q3 Q2 Q1 Min
First time 6.85 7.42 6.98 6.92 6.71 6.04
2–5 times 7.22 7.75 7.40 7.28 7.10 6.36
More than 5 times 7.51 8.12 7.76 7.64 7.25 6.70
Frequency of Visit Industry Average
First time 47.4%
2–5 times 37.7%
More than 5 times 15.0%
Frequency of Visit
9Quarterly Report (Q1 2009): Hospitality Industry
Individual Attribute Comparisons
Verbatim Attribute Questions
Based on your best online experience, how would you rate www.website.com as a site that…
Dimension Attribute Industry Average
AdoptionStarting Point …you use whenever you plan a trip or event?
Return …encourages you to return?
ContentBreadth …covers the range of information you need?
Relevancy …has content that is relevant to the purpose of your visit?
InteractivityContacts …enables you to identify and contact the right people?
Responsive …is truly interested in responding to your needs?
MotivationBottom Line …can save you money on room rates?
Convenience …is the most convenient way to choose your hotel accomodations?
NavigationDiscovery …enables you to find what you’re looking for?
Ease of Use …is easy for you to navigate?
10Quarterly Report (Q1 2009): Hospitality Industry
4Q Survey Hospitality Data
0% 10% 20% 30% 40%
Link sent by a friend
Bookmark/Favourites
Link on another website
Search engine
Typed in URL
Email link
Clicked on advertisement
Link on a blog, forum or social network
Other
Path to Site Percentage Shares Task Completion
Search engine 32% 71%
Typed in URL 17% 68%
Link on another website 13% 73%
Email link 11% 53%
Bookmark/Favourites 6% 64%
Clicked on advertisement 5% 51%
Link sent by a friend 3% 66%
Link on a blog, forum or social network 2% 50%
Other 9% 60%
Path to Site
40% 50% 60% 70% 80%
Email link
Bookmark/Favourites
Typed in URL
Link on another website
Search engine
Link sent by a friend
Other
Clicked on advertisement
Link on a blog, forum or social network
Path to Site (percentage share)
Task Completion by ‘Path to Site’
11Quarterly Report (Q1 2009): Hospitality Industry
4Q Survey Hospitality Data
30% 40% 50% 60% 70%
Other
Make aReservation
Research andCompare Rates
Look for HotelInformation
Purpose of Visit Task Completion
Look for Hotel Information 69%
Research and Compare Rates 69%
Make a Reservation 51%
Other 69%
Task Completion by Purpose of Visit
(re-mapped 4Q Survey Purposes of Visit to webValidator typology)
12Quarterly Report (Q1 2009): Hospitality Industry