Safely Reduce Hospitalizations Tracking Tool Overview and Instructions December 15, 2016 This material was prepared by Telligen, National Nursing Home Quality Improvement Campaign Special Innovation Project contractor, under contract with the Centers for Medicare & Medicaid Services (CMS), an agency of the U.S. Department of Health and Human Services. The contents presented do not necessarily reflect CMS policy. 11SOW-CO- NNHQIC- 10/16-013 QUICK LINKS Sheet-specific Instructions Topics Welcome Instructions Common Qs & As DropDownLists Census Admissions TransferLog ProcessTracking ItemSummaries Customized Reports Monthly Website Data Entry Introduction to the Excel Tracking Tools Maximize Your Screen Making the Most of Your Admissions Sheet Making the Most of Your Transfer Log About the Outcomes Contact the Campaign HelpDesk Welcome to the NNHQI Campaign’s Safely Reduce Hospitalizations Tracking Tool! This tool is an Excel workbook that you can use to support your quality improvement project using data on your acute hospital admissions, readmissions, and transfers. You will enter information for all residents discharged from an acute care hospital, and for all residents transferred to the hospital for any reason. Entering these items will produce monthly summary statistics that will allow you to track your outcomes and progress over time. There are also options to record additional information that will help you examine your care processes to discover what is working well and where there are opportunities for improvement. You will be able to identify some areas of improvement by recording items such as specific hospitals you receive residents from and transfer to, doctors requesting transfers, days of week and time of day that transfers occur, and whether structured communication tools were used to receive and send information about your resident during transfers to or from your community. Please contact the Campaign Help Desk if you have any questions or would like support getting started with this tool. Thank you for participating in this important project! National Nursing Home Quality Improvement Campaign Help Desk [email protected]
Transcript
Safely Reduce Hospitalizations Tracking Tool
Overview and Instructions December 15, 2016
This material was prepared by Telligen, National Nursing Home Quality Improvement
Campaign Special Innovation Project contractor, under contract with the Centers for
Medicare & Medicaid Services (CMS), an agency of the U.S. Department of Health and
Human Services. The contents presented do not necessarily reflect CMS policy. 11SOW-CO-
NNHQIC- 10/16-013
QUICK LINKS
Sheet-specific Instructions Topics
Welcome Instructions Common Qs & As DropDownLists Census Admissions TransferLog ProcessTracking ItemSummaries Customized Reports Monthly Website Data Entry
Introduction to the Excel Tracking Tools Maximize Your Screen Making the Most of Your Admissions Sheet Making the Most of Your Transfer Log About the Outcomes Contact the Campaign HelpDesk
Welcome to the NNHQI Campaign’s Safely Reduce Hospitalizations Tracking Tool!
This tool is an Excel workbook that you can use to support your quality improvement project using data on your acute hospital admissions, readmissions, and transfers. You will enter information for all residents discharged from an acute care hospital, and for all residents
transferred to the hospital for any reason. Entering these items will produce monthly summary statistics
that will allow you to track your outcomes and progress over time.
There are also options to record additional information that will help you examine your care processes
to discover what is working well and where there are opportunities for improvement. You will be able to
identify some areas of improvement by recording items such as specific hospitals you receive residents
from and transfer to, doctors requesting transfers, days of week and time of day that transfers occur,
and whether structured communication tools were used to receive and send information about your
resident during transfers to or from your community.
Please contact the Campaign Help Desk if you have any questions or would like support getting started
with this tool.
Thank you for participating in this important project!
National Nursing Home Quality Improvement Campaign Help Desk
INSTRUCTIONS [QuickLinks] You may wish to print these instructions for easy reference as you access the Safely Reduce
Hospitalizations Tracking Tool.
Open the Safely Reduce Hospitalizations Tracking Tool from the website. Save the file to a location on your computer.
Excel vocabulary: The file named ‘SafelyReduceHospitalizationsTrackingTool’ is an Excel workbook. Within the workbook are worksheets. Worksheets are accessed by clicking the tabs that appear at the bottom of your Excel window.
Click on the named tabs at the bottom of the window to move
between worksheets (use this method to access the monthly
summaries).
Or click the hyperlinked name in the directory (monthly tabs
are not hyperlinked from the directory).
Sometimes there are so many worksheets in
your workbook that you can’t see them all.
Use the scroll bar on the LEFT side of the
window to see all tabs.
Note: If you can’t see the tabs at the bottom of the Excel
window, make sure your window is maximized.
If that doesn’t work, or you can’t see the upper right
corner, double click the title bar.
3 | P a g e
Welcome [QuickLinks] This page gives you an overview of the tool. Note the version number and date – occasionally
updates are posted to the website. You may access the website by clicking the website address on this page. The table of
contents indicates that there are 2 informational worksheets (Welcome, Common Qs&As); The “Instructions” hyperlink
will take you to the document you are reading now. There are 4 data entry worksheets (DropDownLists, Census,
AdmittedwithRecentDischarge, and TransferLog). Following these worksheets are your reports. The ProcessTracking tab
will produce graphs for any processes you’ve chosen to track. ItemSummaries gives you frequencies and charts for other
fields you have completed. Two tabs offer the option of creating customized reports for specific hospitals or health
plans. The monthly summary sheets contain your calculated rates of hospital transfers – including all admissions and 30-
day readmissions.
Click on the named tabs to move
between worksheets.
2 information sheets
4 data entry worksheets
2 sheets of Graphs tracking your
processes & 2 sets of
customizable reports
Website address. Click
here to go to the
Campaign homepage.
Monthly outcome
summaries for website
entry.
4 | P a g e
Instructions [QuickLinks] This tab links to a copy of the instructions you are reading now, so they are handy at all times.
Common Qs&As [QuickLinks] This sheet contains brief information about the goal, the data collection needed for this
workbook, as well as some more advanced Tips and Tricks for using the tool. There are also sections on Troubleshooting
and About Data for Website Entry. Hyperlinks at the top of the page make it easy to jump to topics of interest.
DropDownLists [QuickLinks] On this sheet, you will make a list of the hospitals from which you receive residents, a list of the
doctors who request transfers, and list of your residents. You may copy and paste these lists from another source.
Please see the Tips and Tricks section in the Common Qs&As tab for detailed instructions on how to do this. You may
also return to these lists and add additional names as needed. Tips and Tricks also includes instructions for sorting your
lists.
The lists you create on this tab will appear as drop down lists for you to select from as you complete the
AdmittedwithRecentDischarge and TransferLog worksheets.
First, go to the ‘DropDownLists’ sheet by clicking on that tab at the bottom of your window.
Then: (1) Read on-page instructions; (2) Enter the names of hospitals from which you receive admissions and to
which you transfer; (3) List clinicians who order transfers to the hospital from
your community; (4) List your residents.
IMPORTANT: Complete your dropdown lists before continuing. It is essential that names are exactly the same
every time they appear in the workbook for calculations to be correct. You may add to your lists at any time.
Sort frequently and check for duplicates. Each name should appear only one time on THIS list.
First: Read Instructions. Then, enter lists:
1. hospitals 2. clinicians 3. residents 4. health plans
Notice the combination letter and number codes that appear next to each name. These codes will follow the names throughout the workbook, no matter what order the names are listed in other sheets. They may be used to de-identify this workbook for sharing. Detailed instructions are provided in Common Qs&As.
Look! Click here for instructions on copying and pasting your lists from another source.
Important: Keep your list of residents SORTED. Each name should appear only once. Check frequently for variations of the same name.
5 | P a g e
Entering Your Census [QuickLinks]
Your monthly census is the denominator for your transfer rates (transfers resulting in admission, in emergency
department only, or observation stay).
Your census should be entered separately for post-acute type care and chronic long term type care. If you do not have
average daily census by stay-type, you may enter your census from the 15th day of the month.
Enter your ADC (or mid-month
census) by stay-type here.
No data entry here.
This information is provided so you can
see the resident days per month
calculation.
For more information about resident days,
see About the Outcomes in this document.
6 | P a g e
AdmittedwithRecentDischarge [QuickLinks] Enter information for any resident who is admitted to your home directly from
a hospital OR who has been discharged from a hospital within 30 days of the date they are admitted to your home.
You will be entering admissions as they occur, through the end of the year. (You will start a new workbook each
January.)
a. IMPORTANT: Required fields (marked with a red asterisk*) must be complete in order to calculate your readmissions rates.
b. INCLUDE: All residents who were discharged from an ACUTE CARE HOSPITAL or ACUTE PSYCHIATRIC HOSPITAL.
c. Go to the AdmittedwithRecentDischarge sheet by clicking on that tab at the bottom of your window. d. Begin with reading the on-page instructions e. Check that ‘Today’s Date: ___’ shows the correct date (see screenshot below – Today’s Date is at the top of
the screen). This field is reading the date from your computer. Residents admitted within 30 days of today’s date are highlighted based on that date.
f. Place your cursor over the first box (cell) in the column ‘Resident Name,’ row 1. You may either select your resident’s name from the drop down menu (recommended), or type the name. If you choose to type the name, please note that a resident’s name must appear identically in the Admitted sheet and the TransferLog for the tool to function properly.
g. Important note about deleting information: In Excel, if you want to remove an entry you have made, it is always best to follow these steps: highlight the cell or cells you would like to empty, right click, and choose ‘clear contents’ from the list. If you simply want to edit what you have in the cell, double click the cell, and you may edit your entry.
h. The Tab key will move you across the row so that you can enter the resident’s information.
7 | P a g e
AdmittedwithRecentDischarge, cont.
Tips for maximizing your screen space are provided in the next section.
You will enter all admissions to your community DISCHARGED WITHIN 30 DAYS of
ADMISSION to your home on this worksheet through the calendar year. This is required
to calculate your readmission rates.
*Required fields are marked with an asterisk.
Enter the resident’s name
here. Tab across the row
to complete other
information.
You will enter all admissions with recent discharge from the hospital on this
worksheet through the calendar year. Monthly summaries are produced in the
worksheets with the month names (for example, ‘March’).
Check today’s date. It is important that this is correct.
Use the horizontal scroll bar to
move back and forth across your
sheet.
8 | P a g e
AdmittedwithRecentDischarge, cont.
Data entry requirements:
a. Sometimes the same resident will be admitted multiple times. In this case, the name should be entered exactly
the same each time. However, if you have two residents with the same name, use middle initials, a number, or
some other indicator so the tool knows that these are two different people. If you attempt to enter an identical
name on the DropDownList sheet, you will be warned that you have a duplicate.
b. The Hospital Discharge Date field requires a date. There are several ways to enter the date, but it should always
appear MM/DD/YY.
c. If the resident has not been discharged from the hospital within 30 days of being admitted to your community,
DO NOT enter the event on the AdmittedWithRecentDischarge sheet.
Highlighting -- Several things happen as you record admissions:
a. Residents are highlighted yellow for the first 90 days following the date of their discharge from the hospital.
b. When you return to this sheet after you have entered transfers in your transfer log, rows for residents who were
readmitted to a hospital within 30 days of discharge from a hospital will be highlighted pink. Rows for residents
who were readmitted to a hospital within 90 days of discharge from a hospital will be highlighted green.
Getting the most from your Admissions information: [QuickLinks]
a. Because this sheet includes real-time information letting you know who is in the window for a 30- or 90-day
readmission, it is most useful when you enter admissions to your community as they happen.
b. A table at the far right of the data entry area will tally the total admissions from hospitals to your community by
month/year, and another tallying dates of hospital discharge. You may use these tables to check the accuracy of
your entries. Importantly, the monthly number of discharges from the hospital as shown here is the
denominator for your 30-day readmission rate. The monthly number of admissions to your community following
a hospital discharge as shown here is the denominator for your 90-day readmission rate.
Tables on the far RIGHT of your sheet
sums your admissions with recent hospital
discharge by month.
Use these tables to verify that your data
entry is correct.
The monthly number of admissions to
your community following a hospital
discharge as shown here is the
denominator for your 90-day readmission
rate.
9 | P a g e
The monthly number of discharges from
the hospital as shown here is the
denominator for your 30-day readmission
rate.
10 | P a g e
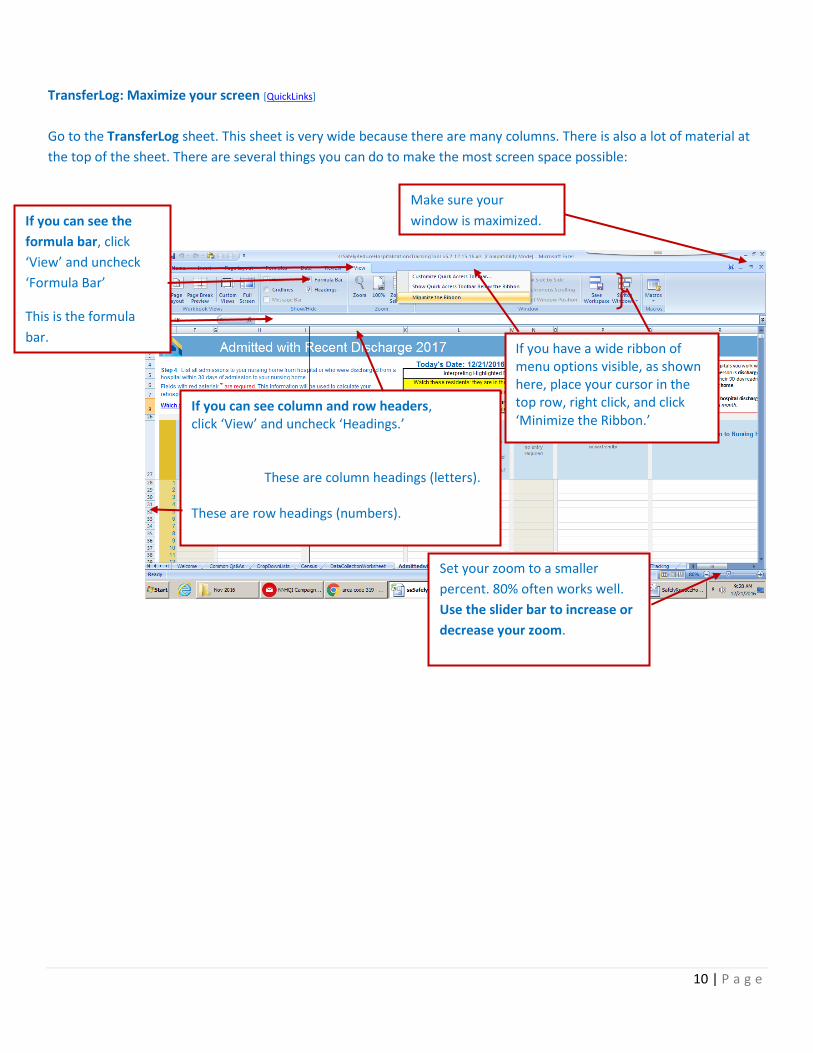
TransferLog: Maximize your screen [QuickLinks]
Go to the TransferLog sheet. This sheet is very wide because there are many columns. There is also a lot of material at
the top of the sheet. There are several things you can do to make the most screen space possible:
If you can see the
formula bar, click
‘View’ and uncheck
‘Formula Bar’
This is the formula
bar.
Make sure your
window is maximized.
If you can see column and row headers, click ‘View’ and uncheck ‘Headings.’ These are column headings (letters). These are row headings (numbers).
If you have a wide ribbon of menu options visible, as shown here, place your cursor in the top row, right click, and click ‘Minimize the Ribbon.’
Set your zoom to a smaller
percent. 80% often works well.
Use the slider bar to increase or
decrease your zoom.
11 | P a g e
TransferLog, cont.
Instructions read: Complete the details for each resident who was transferred from your community to an acute hospital in the grid below.
Enter information for each resident transfer as it
occurs.
*Columns marked with a red asterisk are required
for calculating key outcomes.
Other information is optional but may support
your root cause analysis and improving your care
processes related to transfers.
These black lines indicate that there are
frozen panes. This allows you to scroll to
the far right and still see the resident’s
name. It allows you to scroll far down in
the list and still see the column headers.
Codes to de-identify the
workbook.
Click on the ‘How to Use’
hyperlink at the top of the
column for instructions.
Residents who are readmitted to the hospital within 30 days of most
recent hospital discharge are highlighted pink.
Residents who are readmitted to the hospital within 90 days of most
recent nursing home admission (following a hospital discharge) are
highlighted green.
NOTE: Readmissions include only unplanned transfers that result in an
inpatient admission.
12 | P a g e
TransferLog, cont.
Functionality: This sheet has features and functions similar to the AdmittedwithRecentDischarge sheet. Resident transfers that occur within 30 days of discharge to your community and 90 days from admission to your community from the hospital will be highlighted for easy identification (see above).
Getting the most from your Transfer Log: [QuickLinks]
a. This sheet is most useful when you enter transfers to hospital as they happen. Transfer information on this
sheet is also used to indicate on your AdmittedwithRecentDischarge tab which residents were readmitted.
Timely analysis of events will support a rapid cycle quality improvement process.
b. Optional columns allow you to track a variety of information. These items may point to system or process
factors that might need further investigation.
c. A number of column headers include hyperlinks. Click on these links to learn more about the topic, and to
access related tools and resources.
d. If you would like to investigate whether there are patterns in such things as the time of day transfers occur,
the doctor ordering transfers, or to examine how frequently you are employing structured communication
tools, you may want to sort (group) your transfers accordingly. Instructions on how to do this are provided in
the ‘Common Qs&As’ tab. Note: Always make a second copy when you want to sort.
e. Importantly, you will want to complete the final step (described in the next section), and enter your summary
information on the NNHQI Campaign website. The website will provide you with trend data to monitor your
progress over time. Graphs may be downloaded for easy sharing with your staff, leadership, and
stakeholders.
Hyperlinks at the top of some columns give
you easy access to additional information
and link you to resources, example forms,
etc.
What does this mean?
That’s a common question! Click
on the hyperlink for more
information.
13 | P a g e
ProcessTracking [QuickLinks]
The ProcessTracking sheet will produce tables and graphs for any of the process measures you have recorded. No input
is needed on this sheet, but you may print the sheet as a whole, or copy the graphs into another program, such as
PowerPoint, to share with your stakeholders.
You may copy just the graphs by
clicking once on a graph to select
it, and then right click and choose
‘copy.’
To print just a graph: click a graph
once to select it. Then, when you
select ‘Print’ from the menu, the
‘Print what’ option ‘Selected
graph’ will be chosen.
14 | P a g e
ItemSummaries [QuickLinks]
Tallies of additional items you have recorded are provided here. These allow you to look for patterns in timing and
characteristics of admissions and transfers.
Note: Sometimes the graphs on these two
sheets (and logos on all sheets) may
appear out-of-place or mis-sized. Please
don’t try to move or resize them. Simply
use your zoom bar to zoom in and out, and
they will snap into place.
15 | P a g e
Customized Reports [QuickLinks]
Customize your report by selecting a specific
hospital (or other source of admissions) or health
plan from the dropdown list.
To select a specific health plan, the hospital list
must be set to “All Sources.”
As with the Process Tracking and ItemSummaries
sheets, you may print the entire page with tables,
or print graphs separately. The graphs may also
be selected and copied to other documents, such
as Word or PowerPoint, to share with your
stakeholders.
Note that the utility area on the left of the sheet
(where you select hospital or health plan) does
not print with your report. The page banner will
update automatically to reflect your selection.
16 | P a g e
Monthly Summary Sheets: Data for Website Entry [QuickLinks]
a. No data entry is required on these sheets.
b. These sheets provide monthly summaries of your transfers. Correct calculations require that you complete your
Transfer Log for 30/90 days past the last day of the month. These dates are calculated for you (see screenshot
below).
c. At that time, you may enter data from this sheet on the Campaign Website and access real-time trend graphs of
your progress over time. Data submission also fulfills participation requirements for the Campaign. This step will
take just a few minutes. Instructions are provided on this sheet.
No data entry is required on
this page. The dates on this
page, including the calculation
for the 30-day window for
readmissions and 90-day
window for readmissions, are
produced automatically.
This worksheet is set to print
on a single page for an easy
monthly snapshot.
Entering the data on the
Campaign website fulfills
‘participation’ requirements
AND gives you access to real-
time trend graphs and other
displays.
17 | P a g e
Monthly Summary Sheets, cont.
About the Outcomes [QuickLinks]
Denominator for Admission and Transfer Rates: Hospitalization rates are often expressed in terms of 1,000 resident days. The Campaign has chosen to use this same metric so that you may compare your rates to those reported elsewhere. Each day a resident spends in your community contributes one resident day for the month. To calculate the total resident days in a month, we multiply the average daily census (ADC) you supply in the Census tab by the number of days in the month. To create the denominator for your transfer rates, the number of resident days (your ADC multiplied by the number of days in the month) is divided by 1000. This creates a useful metric: For example, a community with an ADC of 100 will have 3000 resident days in a 30-day month. If that community had 9 admissions during the month, the hospitalization rate would be 3 per 1000 resident days, or 3 admissions every 10 days.
30-day Readmission Rate: Residents with a hospital discharge date within the calendar month form the denominator for 30-day readmission rate. Among those residents, any who then had an unplanned transfer to hospital resulting in an INPATIENT ADMISSION within 30 days of the date of discharge are counted as readmissions (numerator). 90-day Readmission Rate: Residents with admission to your nursing home date within the calendar month (when the resident was discharged from an inpatient stay within 30-days prior to the admission to your home) form the denominator for 90-day readmission rate. Among those residents, any who then had an unplanned transfer to hospital resulting in an INPATIENT ADMISSION within 90 days of the date of admission to your home are counted as readmissions (numerator).
Hospital Admission Rate: When you record the outcome of a transfer as being either 'Admission, inpatient,' or 'Admission, uncertain,' it will be counted in the Hospital Admission rate.
Transfer rates are calculated separately based on Type of Care at Time of Transfer to Hospital
Readmission rates are calculated separately based on Status at Time of Admission