Hospitals and the generic versus brand-name prescription decision in the outpatient sector by Gerald J. PRUCKNER Thomas SCHOBER Working Paper No. 1611 November 2016 DEPARTMENT OF ECONOMICS S JOHANNES KEPLER UNIVERSITY OF F LINZ Z Johannes Kepler University of Linz Department of Economics Altenberger Strasse 69 A-4040 Linz - Auhof, Austria www.econ.jku.at [email protected]
aJohannes Kepler University of LinzbChristian Doppler Laboratory for Aging, Health, and the Labor Market
November 16, 2016
Abstract
Healthcare payers try to reduce costs by promoting the use of cheaper genericdrugs. We show strong interrelations in drug prescriptions between the inpatient andoutpatient sectors by using a large administrative dataset from Austria. Patientswith prior hospital visits have a significantly lower probability of receiving a genericdrug in the outpatient sector. The size of the effect depends on both the patientand doctor characteristics, which could be related to the differences in hospitaltreatment and heterogeneity in the physicians’ adherence to hospital choices. Ourresults suggest that hospital decisions create spillover costs in healthcare systemswith separate funding for inpatient and outpatient care.
†Corresponding author: Gerald J. Pruckner, Johannes Kepler University of Linz, Departmentof Economics, Altenberger Straße 69, A-4040 Linz, Austria; ph.: +43 (0)732 2468 7777; email: [email protected]. We would like to thank the participants of the 2015 Annual Meeting of the HealthEconomics Committee (Verein für Socialpolitik) in Greifswald (Germany), the Empirical Economics Re-search Seminar at the University of Innsbruck (Austria), the 2015 Annual Conference of the InternationalHealth Economics Association in Milano (Italy), and the 2016 Annual Meeting of the Austrian EconomicAssociation in Bratislava (Slovak Republic) for their helpful comments. The usual disclaimer applies. Wegratefully acknowledge financial support from the Austrian Federal Ministry of Science, Research, andEconomic Affairs (bmwfw) and the National Foundation of Research, Technology, and Development.
1 Introduction
Medical drug expenditures make up a substantial proportion of the total healthcare costs
in developed countries. As population aging poses challenges to sustainable health fi-
nancing, healthcare payers try to reduce costs by promoting the use of cheaper generic
drugs. While the majority of medical drugs are consumed in the outpatient sector, hospi-
tals have a substantial impact on overall drug use because the drug choices after hospital
discharge often follow the hospital decisions. In this paper, we study whether and to what
extent hospitals influence the decisions in the outpatient sector to prescribe generic versus
brand-name drugs.
In 2012 (or the latest year for which data are available), the Organization for Eco-
nomic Co-operation and Development (OECD) countries spent on average 17 % of their
healthcare expenditures on pharmaceuticals (OECD, 2013), making it the third biggest
spending component after inpatient and outpatient care. Even if one observes a slight
decline in percentage after 2009, medical drug consumption has shown strong dynamics in
the past. Since 2000, the average spending on pharmaceuticals has risen by almost 50 % in
real terms (OECD, 2011, 2015). The diffusion of new drugs and the aging population have
been identified as the major contributors to the increased pharmaceutical expenditure.
Competition from generic drugs in the pharmaceutical market is obviously a desirable
policy objective of countries to reduce their medication costs. The consumption of non-
branded drug varieties containing the same active ingredients of branded drugs typically
brings substantial savings to pharmaceutical buyers. In the United States, for example,
the first generic competitor typically offers a 20 to 30 % lower price than its branded
counterpart. Subsequent entrants may provide discounts of up to 80 % or even more.
Similar price drops have been found in the European countries as well (OECD, 2009).
For Austria, Heinze et al. (2015) show that health insurance providers could save 18% (72
millione of 401 millione) of prescription costs for antihypertensive, lipid-lowering, and
hypoglycemic medicines through same-ingredient generic substitution. Thus, promoting
the use of generics has been an important measure in OECD countries to reduce their
pharmaceutical spending in recent years.
A growing body of the literature has examined the choice between generic and brand-
name drugs. Several studies have found the doctors’ and patients’ preferences important,
with a strong brand loyalty or state dependence in the choice of drugs (e.g., Coscelli, 2000;
Hellerstein, 1998). Additional empirical evidence suggests that economic incentives also
play a role. Lundin (2000) shows that doctors take into account the costs of their patients.
Patients who incur high out-of-pocket costs are less likely to prefer brand-name drugs
compared to those who get most of their costs reimbursed. Furthermore, Liu et al. (2009)
and Iizuka (2012) find that for physicians who prescribe and dispense drugs, their profit
incentives affect their prescription behavior. In many countries, pharmacists are allowed
2
to substitute prescribed medicines with cheaper equivalent alternatives. Furthermore,
Brekke et al. (2013) show that the pharmacies’ product margins on branded versus generic
drugs have a strong effect on the generic market share.
To our knowledge, the role of hospitals in this context has not been studied. Moreover,
hospitals have not been given high priority in policies meant to increase the market share
of generics. As regards generic drug consumption, hospitals represent a market segment
on its own and influence the type of drugs the patients receive in the outpatient sector after
hospital discharge. First, a patient may ask for the same well-tolerated medication that
he or she received during inpatient treatment and/or as discharge prescription. Second,
in many healthcare systems, patients receive a discharge letter or discharge summary
containing information about diagnoses and inpatient treatment and recommending the
physician who should continue the patient’s therapy, further treatment, and medication
after hospital discharge. On average, these doctors are expected to follow the hospital
doctors’ recommendations in terms of suggested medication.
Recognizing this, pharmaceutical companies have stepped up their marketing activities
in hospitals through rebates and free-of-charge dissemination of (brand-name) drugs in an
attempt to promote subsequent prescriptions by outpatient care physicians (Ford, 2012;
Gallini et al., 2013; Vogler et al., 2013). Empirical evidence suggests that the interaction
between the inpatient and outpatient sector is relevant. Prosser et al. (2003) interviewed
107 General Practitioners (GPs) in the United Kingdom on why they prescribed newly
approved drugs. The pharmaceutical representative was the reason most cited, followed
by hospital consultants and the observation of hospital prescribing. Similarly, Gallini et al.
(2013) find that university hospitals have a significant influence on the pharmaceutical
consumption in surrounding communities.
Using a large administrative dataset of patient, doctor, and hospital information based
on more than 15 million prescriptions in Austria, we find a strong hospital impact on the
generic versus brand-name drug choice. Patients previously hospitalized have a signifi-
cantly lower probability of receiving a generic drug in the outpatient sector, with the level
of effect depending on both patient and doctor characteristics such as age and income of
patients, whether the outpatient care physician holds a contract with a health insurance
fund, and whether he or she runs a primary care pharmacy.1
The remainder of the paper is organized as follows. Section 2 presents our research
design, including the institutional setting of our empirical analysis, a short description of
the data, and the estimation strategy. Our estimation results are presented in Section 3;
Section 4 discusses our results and concludes the paper.
1Outpatient care physicians are GPs or medical specialists who run their own medical practice outsidea hospital.
3
2 Research design
2.1 Institutional setting
In Austria, the Bismarck-type healthcare system provides universal access to services for
the whole population. With very few exceptions (e.g., a small daily allowance in hos-
pital), the mandatory health insurance covers all expenses for medical care, including
visits to GPs and specialists in the outpatient care sector, inpatient treatment in hos-
pitals, and prescription medicines. Nine provincial health insurance funds (in German,
“Gebietskrankenkassen”) are responsible for the health insurance of all private employees
and their dependents, representing approximately 75 % of the population.2 Expenses of
the outpatient sector are funded by wage-related social security contributions of employ-
ers and employees, whereas hospitalization expenses are co-financed by social security
contributions and general tax revenues from different federal programs.
Different modes of financing exist to fund the expenses for medical drugs in the in-
patient and outpatient sectors. The costs of medical drugs administered during hospi-
talization are covered by a diagnosis-related group (DRG)-based remuneration scheme.
According to this scheme, hospitals are reimbursed their inpatient care costs in case-based
lump sums depending on the individual services provided and groups of diagnoses. This
reimbursement scheme includes the costs of inpatient medication. In contrast, health
insurance funds reimburse the cost of every medical drug prescribed by outpatient care
physicians. The reimbursement of these expenses is made directly to the dispensing
pharmacy holding a contract with the health insurance fund. However, patients pay a
prescription charge per medical drug to the pharmacy. In other words, patients are re-
quested to pay either this prescription charge or the full price of the drug if it is below this
deductible charge.3 As regards pharmaceutical prescriptions, the interface between the
inpatient and outpatient sector is of particular importance. Patients treated in a hospi-
tal often receive a discharge prescription that is redeemed in a contracted pharmacy and
therefore reimbursed by the health insurance fund. Unlike in other countries, pharmacists
in Austria are not authorized to substitute generic drugs for branded medication.
Austria applies a positive list of medical drugs that can be reimbursed in the outpa-
tient sector. This list is called the Reimbursement Code (in German, Erstattungskodex).
Depending on the degree of automaticity in the reimbursement of medical drug expenses
by the health insurance funds, the Reimbursement Code lists the expenses under three
2 Furthermore, 16 social insurance institutions offer mandatory health insurance for certain occu-pational groups (farmers, civil servants, self-employed) and employees of particular (large) companies.Affiliation to an institution is determined by place of residence and occupation and therefore cannot befreely chosen.
3 The current prescription fee (2016) is 5.70e. Low-income patients with a net monthly income below882.78e (or below 1,015.20e if they can prove that the above average healthcare expenditure is due tochronic disease) are exempted from this charge.
4
different sections. The “green box” includes the drugs that are readily reimbursed. Doc-
tors can prescribe these drugs without any formal approval by the health insurance funds.
The prescription of drugs in the “yellow box” requires formal authorization by a chief
physician of the health insurance fund. These drugs usually have an added therapeu-
tic value and are not (yet) in the green box because of security concerns (e.g., long-run
clinical studies are not available) or their high prices. Finally, the “red box” of the Reim-
bursement Code includes the drugs for which there is no reimbursement policy. This last
group of medicines are subjected to health technology assessment (HTA) for a cost-benefit
evaluation and are subsequently authorized or not on that basis (ISPOR, 2009).
According to the OECD, the Austrian healthcare system provides high-quality medicines
and easily accessible services, but at very high costs (Gönenc et al., 2011). The system is
shown to operate predominantly on a supply-driven basis and does not have clear mech-
anisms to optimize the spending on a cost-benefit or cost-effectiveness basis. As regards
the cost of medication, the report criticizes that relatively few generic products are au-
thorized for prescription, and even though physicians are required to prescribe the most
economical drugs available, pharmacists are not asked to convert the prescriptions to their
cheapest equivalent.
2.2 Data
For our empirical analysis, we use the administrative register dataset provided by the Up-
per Austrian Health Insurance Fund. This dataset covers all the private sector employees
(and their dependents) in the Upper Austria province. The data include detailed individ-
ual information on medical attendance and medication in the outpatient sector. For each
single drug prescription, we observe the patient’s characteristics such as sex and age, an
identifier for the prescribing physician, the prescription date, the Anatomical Therapeutic
Chemical (ATC) classification system code, and whether it is a brand-name or generic
drug. Moreover, the register contains inpatient sector information such as the number and
length of the patient’s hospital stays and his or her admission diagnosis according to the
ICD-10 (International Statistical Classification of Diseases and Related Health Problems)
classification system advocated by the WHO. Additional information on patient’s income
can be obtained from the income tax data provided by the Austrian ministry of finance.
Our empirical analysis covers the time period from 2008 to 2012, and we confine
the sample to the active ingredients for which both brand and generic alternatives are
available. The drugs included in the yellow and red box of the Reimbursement Code are
excluded.4 The discharge prescriptions of a hospital doctor following inpatient treatment
are included in the sample. One important data restriction needs to be noted. Since we
4Given that the prescription of drugs in the yellow box requires the formal authorization of a chiefphysician, health insurance funds can reject reimbursement on an individual level irrespective of previoushospital stay.
5
rely on the health insurance fund’s reimbursement of medication expenses for prescription
data, we do not observe the prescribed drugs that are priced below the prescription
charges. These drugs are paid by the patients themselves and hence not recorded in the
health insurance fund register. We consider 15.9 million prescriptions for approximately
1 million patients for our sample. The sample includes 3,025 physicians prescribing 199
active ingredients; 60.1 % of the prescribed drugs are generic.
2.3 Empirical strategy
The unit of observation in the first part of our empirical analysis is the individual out-
patient prescription. We model the choice between the generic and brand-name versions
of a drug. We group the observed prescriptions by medical therapy, defined as consecu-
tive prescription of the same active ingredient, and analyze whether prior hospitalization
affects the drug choice. A therapy starts with the first prescription of a certain active
ingredient (brand-name or generic) by an outpatient care physician provided the active
ingredient was not prescribed earlier within one year. The therapy ends as soon as we
notice that this ingredient has not been prescribed for more than one year. If the time
period between two consecutive prescriptions is longer than one year, a new therapy is
initiated. For the first prescription of a therapy, we estimate the following equation:5
The dependent variable is a dummy for whether the outpatient prescription gpt of pa-
tient p and therapy t was a generic (g = 1) or brand-name (g = 0) drug. The explanatory
variable of interest hpt indicates whether the therapy was initiated in hospital (h=1) or
not (h=0). The set of control variables includes fixed effects for the patient (ζp) as well as
for the active ingredient (ςi(p,t)), doctor (ρd(p,t)), and month (δm(p,t)) of the corresponding
prescription. The error term is denoted by νpt.
We define three alternative specifications for the hospital dummy. In its simplest
form, h indicates whether the patient visited a hospital within three months prior to the
therapy or not.6 The second specification indicates that the previous hospitalization was
not necessarily related to the subsequent medication therapy. In other words, the previous
hospital stay could have nothing to do with the subsequent pharmacotherapy. Therefore,
as an alternative, we consider only hospital stays with an ICD-10 classification code that
is related to the ATC code of the active ingredient. For any outpatient prescription
with a given ATC code, the indicator variable “hospital stay with matched diagnosis” is
1 when there is a preceding hospital stay with a corresponding ICD-10 diagnosis, and
5Alternatively, we include all consecutive prescriptions of a therapy.6In a robustness check, we show how sensitive the results are when the number of months for a previous
hospital stay is increased to six.
6
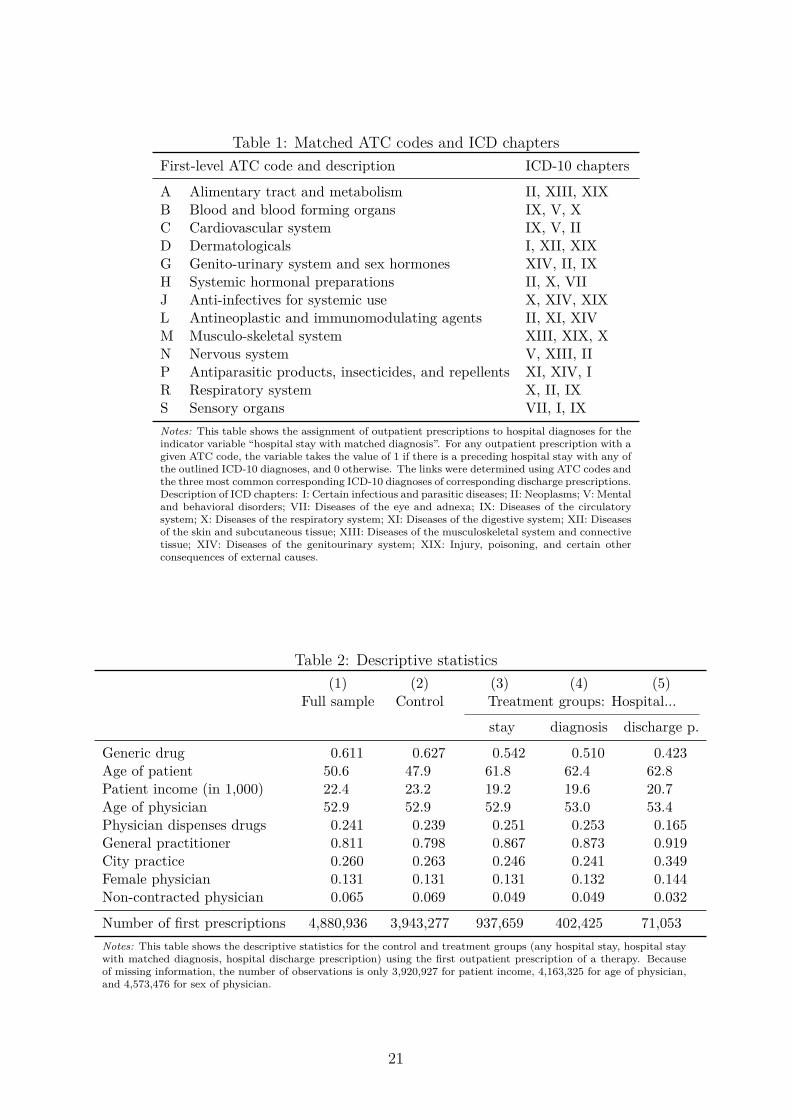
zero otherwise. Table 1 describes the assignment of an outpatient prescription to the
corresponding hospital diagnoses for generation of the indicator variable. We assign each
first-level ATC code the three most common corresponding ICD-10 diagnoses on the basis
of discharge prescriptions. For example, a drug prescription for the active ingredient A
(alimentary tract and metabolism) is assigned to ICD-10 chapters II (neoplasms), XIII
(diseases of the musculoskeletal system and connective tissue), and XIX (injury, poisoning,
and certain other consequences of external causes).
The third variant is based on the fact that we observe the discharge prescriptions for
a subsample of hospital patients. In this specification, we consider only the hospital stays
following which the patients received a drug prescription issued by a hospital doctor, cor-
responding to continued medical therapy in the outpatient sector.7
Identification of hospital effect. A crucial question of empirical strategy is whether to
identify a hospital effect or rather reflect on (unobservable) patient characteristics. The
selection of patients into hospitals may potentially invalidate the comparison of hospital-
ized patients with those who did not stay in hospital. One might argue that hospitalized
patients and those not treated in hospitals receive different medicines or choose different
(types of) outpatient care physicians. Both objections are met as we control for active in-
gredient and doctor fixed effects in Equation (1). Another objection is that hospitalization
indicates bad health and therefore one might consider hospitalized patients sicker than
those receiving only outpatient treatment. In fact, although we control for patient fixed
effects, which cover the time-invariant components of an individual’s health stock such as
genes or general health consciousness, (sudden) health shocks are the most frequent cause
for hospitalization.
Table 4 shows the difference between hospitalized patients (column (2)) and their
non-hospitalized counterparts (column (1)). The most striking difference is with regard
to patients’ age. Hospitalized patients are on average almost 14 years older than patients
not treated in hospitals within three months prior to the first outpatient drug prescription.
The strong presumption that hospitalized patients are sicker is based on the fact that the
aggregate outpatient expenditure among this group is considerably higher. In the year
of starting drug therapy, hospitalized patients spend on average 40 % more on medical
attendance than non-hospitalized patients (783.0e versus 549.9e). The difference in
expenditure for medical drugs is even larger. Given their mean of 1,320.7e, hospitalized
patients spend 2.7 times more than their non-hospitalized counterparts for medication
in the same year. The higher outpatient healthcare service expenditure of hospitalized
patients may be indicative of their worsening health condition and/or simply the fact
that this group of patients are on average 14 years older than their non-hospitalized
counterparts.
The fact that hospitalized patients are ceteris paribus sicker than their non-hospitalized
7Our data do not contain information on the complete inpatient drug therapy.
7
counterparts should not impact the likelihood of their receiving a generic or brand-name
prescription as long as the primary care physicians believe in the bioequivalence of the
two drug types. Otherwise, they may favor sicker patients by prescribing brand-name
drugs, which would then explain the significant hospital effect.8
Effect heterogeneity. To analyze the effect heterogeneity of hospital impact, we first
estimate equation (1) for different subsamples according to doctor and patient character-
istics. In particular, we run separate regressions for split samples along the dimensions
of patients’ age and income, doctors’ age, and whether the physician runs a primary care
pharmacy. Two different channels could explain the effect heterogeneity for patients: (i)
the different treatment of groups of patients in the hospital translating into the outpatient
sector, and (ii) the outpatient physicians’ adherence to hospital choices may depend on
the doctors’ and patients’ characteristics. In a subsequent empirical analysis, we cover
both channels. Equation (2) addresses the hospital treatment of the different groups of
patients.
ghpt = γ0 + γ1Ypt + χi(p,t) + τm(p,t) + ǫpt (2)
The dependent dummy variable ghpt indicates whether the hospital discharge prescrip-
tion of patient p and therapy t is a generic (when the dummy is equal to 1) or brand-name
drug. The coefficient of interest, γ1, measures the impact of patient characteristics Ypt
(age and income) on the hospital prescription decision. We further control for active in-
gredient and month fixed effects, χi(p,t) and τm(p,t), respectively, and ǫpt reflects the error
term.
Finally, we address the outpatient care physicians’ adherence to hospital choices for
the sample of patients, whose discharge prescriptions we observe, and analyze whether the
physicians deviate from the hospital’s choice of medication by estimating Equation (3):
The dependent dummy variable apt is equal to 1 if the outpatient prescription is of the
same type—generic or brand-name—as the discharge prescription from the hospital, and
zero otherwise. Xd(p,t) and Ypt represent respectively the characteristics of the doctors and
patients. λi(p,t) and σm(p,t) denote respectively the fixed effects for the active ingredient
and month. µpt denotes the error term. Following this specification, we examine whether
certain characteristics such as the patient’s age and income, the doctor’s age, or whether
the doctor sells drugs in his or her private pharmacy influence the correspondence of
medication a patient receives in the outpatient sector and as discharge prescription.
Descriptives. Table 2 includes descriptive statistics of the dependent and explanatory
8Evidence for the belief among patients and physicians that generic drugs are less effective can befound in Kjoenniksen et al. (2006), Shrank et al. (2009), and Shrank et al. (2011).
8
variables for the full estimation sample (column (1)), the control group (column (2)),
and the three different treatment groups (columns (3)–(5)). While the treatment groups
vary according to the above-mentioned hospital dummy formulation, the control group
always includes patients with no hospitalization within three months prior to the first
outpatient drug prescription. Depending on our specification of hospital influence, the
share of outpatient prescription potentially affected by prior hospital visits lies between
1.5 % and 19.2 % (for number of observations, see the table). Approximately 13 % of drugs
are prescribed by female physicians, more than 80 % by GPs, 24 % by physicians with a
primary care pharmacy, and 6.5 % by physicians who do not hold a contract with a health
insurance fund.
Figure 1 gives the histogram for the distribution of number of days between a hospital
discharge prescription and the first corresponding drug prescription (of the same active
ingredient) in the outpatient sector for all patients in our sample who received a discharge
prescription at the end of their hospital stay. The graphical representation clearly indi-
cates that the majority of first drug prescriptions by outpatient care physicians after a
previous hospital stay occur shortly after hospital discharge. The median of the time
interval is 25 days, and the 75th percentile comes to only 52 days. Therefore, in our main
specification, the hospital dummy is equal to 1 if a previous hospital stay ended within
three months prior to the first outpatient prescription. This implies that hospitalization
that ended before three months prior to the first outpatient drug prescription are coded
as zero. We argue that hospital stays dated very far back may no longer influence the
outpatient physicians’ prescription behavior.9
Finally, Table 3 provides insight into how representative the subgroup of patients re-
ceiving a discharge prescription can be for all hospital patients. Both groups are of similar
age, and are also very comparable in terms of gender participation. The outpatient ex-
penditure for medical attendance for both groups is very similar, and those who receive
a discharge prescription on average spend 128.1e per year more for medical drugs. The
distribution of admission diagnoses may reveal minor differences, but both groups of pa-
tients show very similar disease patterns. For example, the three most frequent diagnoses
for both groups are neoplasms, diseases of the circulatory system, and diseases of the
musculoskeletal system.
3 Results
First, we examine the influence of previous hospital stays on outpatient prescription be-
havior based on three different hospital variables (Section 3.1) and study the effect hetero-
geneity in terms of patient and doctor characteristics (Section 3.2). Second, we consider
the impact of the patients’ socio-economic characteristics on hospital prescription behav-
9We show below that the empirical results are not sensitive to variation in the length of this period.
9
ior and analyze to what extent doctors adhere to the discharge prescriptions issued to
patients after a previous hospital stay (Section 3.3).
3.1 Hospitalization effect on outpatient prescriptions
First prescription. Our estimation of the effect of previous hospitalization on the first
outpatient prescription for a particular drug therapy (equation (1)) is summarized in
Table 5. The dependent variable is a binary indicator for a generic versus brand-name
prescription. The table includes the results for three different hospital stay specifications.
The dummy variable “Hospital stay” is equal to 1 if the patient was hospitalized within
a period of three months prior to the first outpatient prescription. The indicator variable
“Hospital stay with matched diagnosis” refers to the same time frame. However, the
dummy is equal to 1 only if the ICD-10 classification code of hospital stay corresponds
to the ATC code of the active ingredient for the particular drug prescription. The third
variant “Hospital discharge prescription” refers to the subsample of hospital stay within
the same three months for which we observe a corresponding discharge prescription. Col-
umn (1) of Table 5 depicts the sample mean for the three different hospital variables,
and columns (2)–(4) give the results for different sets of control variables (fixed effects for
month, active ingredient, doctor, and patient).
The coefficients show a highly significant and negative hospitalization impact on the
probability of a generic drug prescription by physicians in the outpatient sector for the
three different definitions of hospital influence and different sets of control variables. Con-
sidering the “naive” hospital dummy definition and the specification controlling for all
possible fixed effects, a patient’s previous hospitalization reduces the probability of a sub-
sequent generic drug prescription in the outpatient sector by 6.3 percentage points, which
corresponds to 10.3 % of the share of generic drugs.
These negative impacts increase to -8.7 and -23.6 percentage points respectively for
the two other hospital dummy variables. This is the first indication that the prescription
behavior of hospitals generates quantitatively relevant spillovers in the outpatient sector.
In line with a priori expectations, the effect increases with a closer connection between
hospital stay and drug prescription. Obviously, our naive hospital dummy also includes
hospital stays that have no direct link with a subsequent drug prescription. A patient may
have spent two days in hospital because of a broken leg and received antihypertensive drugs
from his or her family doctor two months later. Hospital stays with matched diagnoses
identify a closer connection between hospitalization and the active ingredient of a follow-
up prescription such that the hospital impact increases quantitatively. However, even in
this second specification, we cannot directly control for treatment and medication during
hospitalization. In the third specification “Hospital discharge prescription”, we include
only the hospital stay of patients who received a corresponding discharge prescription at
10
the end of hospitalization. While we do not have information on hospital medication in
these cases either, we certainly know that these patients leave the hospital with a specific
prescription that is redeemed in a local pharmacy. This is the most explicit indicator that
the medical therapy of a patient starts in hospital. This specification reveals the strongest
impact on the doctors’ prescription behavior.
The results in Table 6 are not sensitive to the time period chosen to measure hospital
stays. We rely on the simple “Hospital stay” dummy and estimate equation (1) with vary-
ing time periods. The first row of the coefficients replicates the main results presented
in Table 5. The second row shows the impact of hospitalization on outpatient prescrip-
tion decisions when the hospital stays are measured within six instead of three months.
The quantitative and qualitative results remain basically unchanged. The significantly
negative influence of hospitalization on the probability of receiving a generic follow-up
drug prescription decreases from 6.3 to 4.8 percentage points. A third variation in the
time frame is presented in the last row of the coefficients. In an alternative three-month
specification (II), we try to sharpen the distinction between “treated” (previous hospital
stay) and “untreated” (no previous hospital stay) patients. The hospital dummy is again
coded as 1 if the patient had a previous hospital stay within three months prior to the
first outpatient drug prescription, and zero otherwise. However, we exclude the patients
who had a hospital stay within four to six months before the prescription. Again, as
compared to the baseline version, the negative coefficient remains almost unchanged (-6.5
percentage points). Given these results and the fact that the majority of first prescriptions
are issued in the first few weeks after hospitalization, we are confident that the period of
three months for the identification of hospital stay is appropriate.
All prescriptions. The estimation results based on all prescriptions of a therapy, and
not just the first prescriptions, are depicted in Table 7. As earlier, the coefficients of
interest are highly significant and the quantitative results are very similar to the results
considering the first prescriptions only. Depending on the chosen specification, the impact
of hospitals on the outpatient care physicians’ decisions to prescribe a generic drug runs
from -5.7 to -18.2 percentage points. Again, the lowest effect results from the naive hospi-
tal dummy specification, whereas the specification including only patients with discharge
prescriptions provides the strongest negative impact on outpatient prescription behav-
ior. On average, the coefficients for the whole sample of prescriptions are quantitatively
slightly smaller than those for first prescriptions only. This could be because even if the
outpatient care physicians’ decision to prescribe a generic drug at the start of medical
therapy is negatively affected by prior hospitalization, this influence levels off over time.
The propensity to prescribe generic drugs in follow-up medication increases the further
the hospital stay dates back.
11
3.2 Effect heterogeneity
Table 8 gives separate regressions for a series of subsamples, splitting the data according
to the physician’s and patient’s characteristics. We display the results for the specification
using discharge prescriptions and estimate the hospital impact on first prescriptions. As
regards the doctors, we distinguish between older and younger physicians (beyond or
below 50 years old), male and female doctors, doctors in urban and rural areas, general
practitioners and medical specialists, contracted and non-contracted (private) physicians,
and finally physicians running and not running a primary care pharmacy. With regard to
patients, we differentiate between older and younger patients (beyond or below 50 years
old) and between high- and low-income patients.10
The coefficients reveal interesting heterogeneity in terms of both quality and quantity.
At the physician level, we find significantly different effects for sex and age, but doctors
practicing in urban and rural areas react similarly (their 95 % confidence intervals overlap).
The hospital effect is 2.0 percentage points stronger for males than for females and 1.7
percentage points stronger for younger than for older physicians.
The hospital impact for medical specialists (-18.8 percentage points) is smaller than
that for GPs (-23.6 percentage points). Medical specialists are probably more self-
conscious in their prescription behavior and less influenced by hospitals than their GP
counterparts. However, the question whether the informal hierarchies between doctors
working in the inpatient and outpatient sectors play a role in the physicians’ prescription
behavior cannot be answered unequivocally in this sort of quantitative analysis. An inter-
esting result in this line of argument is revealed by the coefficients for the GPs who run
and do not run their own primary care pharmacy. The negative and significant hospital
dummy coefficient for physicians dispensing drugs from their attached apothecary is lower
than that for physicians without a pharmacy (17.6 versus 24.7 percentage points). Even if
we do not have information on the profit margins of the generic and brand-name drugs sold
in doctor-run pharmacies, the fact that these GPs are very familiar with pharmaceuticals
in general may at least help explain this phenomenon.
Finally, we find a large difference between the hospitalization impacts of contracted
and non-contracted (private) doctors.11 The impact of hospitalization on outpatient pre-
scription behavior is -14.6 percentage points for the subgroup of non-contracted physicians
and runs up to -23.7 percentage points for contracted doctors. This finding suggests that
non-contracted physicians in particular make self-determined decisions and therefore the
10High-income patients have an income above the median income of their birth-year cohort in therespective calendar year.
11Contracted outpatient physicians hold a direct contract with the (regional) mandatory health in-surance fund. These doctors’ services are reimbursed by the health insurance funds in accordance witha predefined catalogue of medical services and attached fees. Patients visiting a non-contracted doctor(in German, Wahlarzt) pay their medical attendance fees themselves. They can subsequently submit arequest for reimbursement of treatment costs to their health fund. The insurance fund covers up to 80 %of the fees that they would have paid to their contracted physicians for the same medical service.
12
hospital impact is lower. On the other hand, a mean of 0.35 for the proportion of generic
drugs in the total prescriptions (see Table 8, column (1)) for this group of doctors indi-
cates that non-contracted physicians generally prescribe a lower share of generic drugs.
Given that these doctors have no direct contractual relationship with a health insurance
fund, they may be generally less motivated or pressurized to prescribe cheaper generic
drugs.12. The lower impact of the hospital dummy for non-contracted doctors may there-
fore simply reflect their similarity with hospitals (patients receive brands irrespective of
previous hospital stays).
With regard to patients, the results show that both the income and age of patients
matter for the hospital impact on the propensity to receive a generic or brand-name drug.
A previous hospital stay reduces the likelihood of a generic follow-up prescription by 22.7
percentage points for the oldest patients (beyond 70 years old) and by 24.8 percentage
points for the youngest patients (below 40 years old). The negative impact for patients in
the lowest decile of the income distribution amounts to 21.6 percentage points. The figure
increases to -25.4 percentage points for the highest income decile. The result of negative
hospital impact increasing with a patient’s income and decreasing with his/her age can be
explained in two ways. First, the different age and income groups of patients are treated
differently during hospitalization. Second, if at least some doctors are not convinced
that generic drugs with the same active ingredient are (bio-) equivalent to brand-name
drugs, the doctors may follow the hospital’s recommendation more closely and prescribe
the brand-name versions for the younger and high-income patients. Similarly, a stronger
socio-economic background of patients (income) could help them carry through the brand-
name prescription of the hospital. In the next step, we address these two channels, that
is, the treatment of different groups of patients in hospitals, and the outpatient care
physicians’ adherence to hospital choices.
3.3 Hospital treatment and outpatient physicians’ adherence
Equation (2) reveals the impact of patient characteristics on the probability of receiving a
generic discharge prescription at the end of hospitalization. Columns (1) and (2) of Table 9
depict the results for this regression. When we control for month, active ingredient, and
hospital fixed effects, we find a significant and negative impact for young and high-income
patients. The propensity to leave the hospital with a generic discharge prescription is
0.9 percentage points lower if the patient is below 40 years of age (as compared to the
middle age group). The likelihood of a generic discharge prescription is 0.7 percentage
points lower for high-income patients (beyond the 90th percentile) and 0.5 percentage
12Contracted doctors are regularly reminded by the health insurance funds of the fact that they mayhave caused substantial (above-average) medication costs. Furthermore, there are guidelines for theeconomic prescription of pharmaceuticals, where contracted physicians are formally prompted to prescribethe most cost-effective product when several therapy options are available (ISPOR, 2009)
13
points higher for low-income patients than for the middle income group. The effects are
statistically significant, but their quantitative impact is moderate. The results support our
previous finding of the largest negative hospital effect for the youngest group of patients
and for those with the highest net income.
For comparison reasons, columns (3) and (4) of Table 9 include equivalent estimations
for all outpatient prescriptions of those with no previous hospital stay. In contrast to
hospital medication, the propensity of old patients to receive a generic prescription in the
outpatient sector is 1.7 percentage points lower than for the youngest patients and 1.9
percentage points higher than for the middle age group. Moreover, high-income patients
are 1.8 percentage points less likely to receive a generic prescription from their outpatient
care physician than their middle income counterparts. Patients in the lowest income group
are also less likely to receive a generic prescription, but the quantitative effect is minor.
Overall, the results indicate a significant impact of patients’ socio-economic characteristics
on inpatient and outpatient prescription behavior.
Our final set of estimation results includes an analysis of whether doctors deviate
from the hospital choice in their prescription behavior. From the subsample of patients
who received a discharge prescription after hospitalization, we estimate equation (3) and
analyze whether the characteristics of patients and doctors influence the physician’s ad-
herence to the hospital choice (see Table 10). The dependent variable in column (1) is a
binary indicator equal to 1 if the first follow-up prescription of a doctor in the outpatient
sector and the hospital discharge prescription coincide; that is, both prescriptions contain
either a generic drug or a brand-name drug.
At the patient level, adherence to the hospital’s medication decision is significantly
weaker for the youngest patients (-1.5 percentage points) and stronger for high-income
patients (2.1 percentage points). As regards physician characteristics, we find a weaker
adherence for female physicians (-1.3 percentage points) and the physicians who practice
in one of the three largest cities of Upper Austria, Linz, Wels, and Steyr (-1.7 percentage
points); the physician’s age does not have an impact. The adherence of GPs is 2.3
percentage points higher than that of medical specialists.
The point estimates for two other physician characteristics reveal large and interesting
effects. Physicians running a primary care pharmacy follow the hospital recommendations
to a lesser extent. The effect is highly significant and quantitatively important, with an
estimated coefficient of -6.4 percentage points. This result is in line with the above-
mentioned interpretation that these doctors have a broad pharmacological knowledge and
a good overview of medication alternatives, implying that they may be more often willing
to deviate from the hospital choice.
Non-contracted doctors have a 13.1 percentage point higher adherence to the discharge
prescription than the physicians holding a contract with a health insurance fund. As
already mentioned, non-contracted doctors may be less pressurized to prescribe generic
14
drugs. They have a strong preference for brand-name drugs and more often seem to follow
the hospitals in prescribing the more expensive original drugs. Furthermore, many non-
contracted outpatient care physicians are directly affiliated to a hospital. It is common
for hospital doctors in Austria to run a private part-time ordination in the outpatient
sector. The particularly close relationship of this group of doctors with hospitals may
also explain their high degree of adherence to previous inpatient medication decisions.
For further insight, we split the sample into patients leaving hospital with a generic
discharge prescription (column (3)) and those leaving with a brand-name prescription
(column (2)), and analyze the physicians’ adherence to the two categories separately. We
see that non-contracted private physicians have a 24.6 percentage point higher adherence
to hospital brand-name prescriptions than contracted doctors. On the contrary, the cor-
responding coefficient for adherence to generic prescriptions is negative and significant
at the 10 % level (-12.9 percentage points). This group of doctors generally does not
follow the prescription choices of hospitals but rather indicates a strong preference for
brand-name pharmaceuticals. In contrast, columns (2) and (3) of the table reveal that
the negative impact on adherence of physicians who run their own primary care pharmacy
can be observed for both drug categories. In other words, the results do not indicate a
clear preference of these physicians for either type of medication but rather express their
pharmaceutical competence and willingness to deviate from the prescription behavior of
hospital doctors. Another argument is that primary care pharmacies tend to have less
variety of drugs in their stock and therefore the prescription behavior of doctors is less
influenced by hospitals.
A separate analysis of the prescription adherence for two drug categories also helps
explain the stronger hospital impact for high-income and young patients. As mentioned
above, these patients receive less generic drugs during hospitalization (according to their
discharge prescriptions). The tendency toward brand-name drugs is reinforced by the pre-
scription behavior of primary care physicians. As column (2) shows, physicians follow the
prescription of brand-name drugs for high-income patients more closely (3.2 percentage
points), but we do not observe any reinforcing or weakening effect for generic hospital
prescriptions for this group of patients. As regards the youngest patients, we find no
significant effect on the physicians’ adherence to brand-name prescriptions. However, the
significantly negative coefficient of -2.0 percentage points for adherence to generic hos-
pital prescriptions also generates a reinforcing effect for brand-name prescriptions in the
outpatient sector for these patients. Our results support the hypothesis that inpatient
and outpatient doctors treat higher socio-economic groups differently, be it due to their
belief that generic drugs are not (bio-) equivalent or for some other reason.
15
4 Discussion and conclusions
We find a strong influence of hospitalization or hospital drug use on the prescription
behavior and drug consumption in primary healthcare. Patients with previous hospital
stay have a significantly lower propensity to receive a generic drug in their first follow-
up prescription compared to those with no prior hospital stay. The quantitative effects
run from -6.8 percentage points (based on a simple hospital dummy) to -20.3 percentage
points (based on the subsample of hospital stays with a discharge prescription).
The strong hospitalization impact on the decision of outpatient doctors to prescribe
generic or brand-name drugs indicates that physicians are not in general convinced of
the (bio-) equivalence of the two types of medication. Moreover, deviating from hospital
choices could be costly. Because outpatient doctors have to put some effort to convince
their patients on an alternative medication, physicians generally prefer to follow the hos-
pital prescription. These results support the hypothesis that pharma companies have
succeeded in their marketing efforts to promote brand-name drugs in the hospital sector.
The beneficial provision of drugs in hospitals or even the free-of-charge distribution of
drugs reduces the costs of hospitals. However, as our analysis shows, any such conduct
increases the expenditure of outpatients and puts a substantial strain on the budgets of
health insurance funds. If the provision of inpatient and outpatient healthcare service is
operated separately for each group without any transfer payment, the whole procedure
would not be incentive compatible, and most likely not cost minimizing.13
Our empirical analysis also reveals heterogeneous results for the different patient
groups and doctor characteristics. The negative hospital effect on generic drug prescrip-
tion in the outpatient sector is stronger for young and high-income patients. As for physi-
cians, our estimations reveal a substantial influence of supply-determined circumstances.
The hospital effect is lower for the physicians running their own pharmacy and for the
non-contracted outpatient physicians. However, while the doctors with pharmacies tend
to deviate from hospital medication decisions irrespective of drug type (brand-name or
generic), non-contracted doctors seem to have a strong preference for brand-name drugs.
The finding that doctor characteristics play an important role both qualitatively and
quantitatively is another evidence that well-developed (Bismarckian) healthcare systems
are supply-side driven to a large extent. We hypothesize that the different behavior of
primary care physicians may have to do with the hierarchy in doctor groups. One could
argue that medical specialists (as compared to GPs) and the doctors running a pharmacy
(as compared to physicians who do not sell medical drugs) command higher pharmaco-
logical competence, and hence are more self-confident in their prescription behavior and
follow their hospital colleagues to a lesser extent.
13A serious analysis of the overall cost consequences would require an empirical comparison of the costdecreases and increases in the inpatient and outpatient sector. Since we cannot observe the prices andquantities for hospital medication, this analysis is not possible.
16
The lesson to be learnt from a health policy perspective is to closely examine the
imperfections at the interface between the inpatient and outpatient sector. These two
levels of healthcare service provision are in general interconnected, either directly in sys-
tems where one single authority is responsible for the service provision at both levels, or
indirectly via spillovers in systems with only superficially separated inpatient and outpa-
tient sectors. Distinct funding systems generate inefficiencies and misallocation of services
between outpatient care physicians and hospitals. This analysis reveals that the system
creates extra costs with regard to the funding of medication.
This analysis also illustrates a dilemma of health insurance funds. In principle, health
insurance funds discourage the prescription of brand-name drugs in the outpatient sec-
tor through their reimbursement policy and require their contracted doctors to prescribe
generic drugs whenever available. However, this policy has not been successfully im-
plemented for several reasons. First, the negotiation process between social insurance
institutions and pharmaceutical companies on the admission of drugs to the reimburse-
ment scheme is complex. For example, the acceptance of an individual drug often means
the implicit acceptance of some other drugs (of the same company), by which it is almost
impossible for the health insurance funds to exclude single brand-name products from re-
imbursement without any negative repercussion. The final list of drugs that automatically
qualify for reimbursement (included in the green box) requires compromises; that is, not
all drugs in the green box are the cheapest ones. Second, all the outpatient practitioners
and specialists in Austria are self-employed. Thus, to some extent, the health insurance
funds must accept the doctors’ medical choices even if their choices lead to higher costs.
In a second-best world, where the role of health insurance funds is limited to their
imposition of cheaper generic drugs, regulating the pharmaceutical industry’s marketing
activities in public hospitals through the prohibition of no-cost distribution, or even the
attempt to promote the use of generic drugs in these hospitals, could be cost saving.
A better documentation of the quantities and prices of drugs used in hospitals is an
important prerequisite to improve transparency and to better evaluate the implications
of regulatory measures.
17
References
Brekke, Kurt R, Tor Helge Holmås and Odd Rune Straume (2013), ‘Margins and mar-ket shares: pharmacy incentives for generic substitution’, European Economic Review
61, 116–131.
Coscelli, Andrea (2000), ‘The importance of doctors’ and patients’ preferences in theprescription decision’, Journal of Industrial Economics 48(3), 349–369.
Ford, Gregory (2012), ‘Don’t underestimate the importance of hospital prescriptions’,PM360 (March 2012), 26–27.
Gallini, Adeline, Renaud Legal and Florence Taboulet (2013), ‘The influence of druguse in university hospitals on the pharmaceutical consumption in their surroundingcommunities’, British Journal of Clinical Pharmacology 75(4), 1142–1148.
Gönenc, Rauf, Maria M Hofmarcher and Andreas Wörgötter (2011), Reforming Austria’shighly regarded but costly health system, OECD Economics Department Working Pa-pers 895, OECD, France.
Heinze, Georg, Milan Hronsky, Berthold Reichardt, Christoph Baumgärtel, Marcus Müll-ner, Anna Bucsics and Wolfgang C Winkelmayer (2015), ‘Potential savings in prescrip-tion drug costs for hypertension, hyperlipidemia, and diabetes mellitus by equivalentdrug substitution in austria: a nationwide cohort study’, Applied Health Economics and
Health Policy 13(2), 193–205.
Hellerstein, Judith K (1998), ‘The importance of the physician in the generic versus trade-name prescription decision.’, The Rand Journal of Economics 29(1), 108.
Iizuka, Toshiaki (2012), ‘Physician agency and adoption of generic pharmaceuticals’, The
Kjoenniksen, Inge, Morten Lindbaek and Anne Gerd Granas (2006), ‘Patients’ attitudestowards and experiences of generic drug substitution in norway’, Pharmacy World and
Science 28(5), 284–289.
Liu, Ya-Ming, Yea-Huei Kao Yang and Chee-Ruey Hsieh (2009), ‘Financial incentives andphysicians’ prescription decisions on the choice between brand-name and generic drugs:evidence from taiwan’, Journal of Health Economics 28(2), 341–349.
Lundin, Douglas (2000), ‘Moral hazard in physician prescription behavior’, Journal of
Prosser, Helen, Solomon Almond and Tom Walley (2003), ‘Influences on GPs’ decision toprescribe new drugs - the importance of who says what’, Family Practice 20(1), 61–68.
Shrank, William H, Emily R Cox, Michael A Fischer, Jyotsna Mehta and Niteesh KChoudhry (2009), ‘Patients’ perceptions of generic medications’, Health Affairs
28(2), 546–556.
Shrank, William H, Joshua N Liberman, Michael A Fischer, Charmaine Girdish, Troyen ABrennan and Niteesh K Choudhry (2011), ‘Physician perceptions about generic drugs’,Annals of Pharmacotherapy 45(1), 31–38.
Vogler, Sabine, Nina Zimmermann, Christine Leopold, Claudia Habl and Jan Mazag(2013), ‘Discounts and rebates granted for medicines for hospital use in five europeancountries’, The Open Pharmacoeconomics & Health Economics Journal 5, 1–10.
Figure 1: Time between discharge prescription and first outpatient prescription
0
.01
.02
.03
Density
0 30 60 90 120 150 180 210 240
Days after hospital discharge
20
Table 1: Matched ATC codes and ICD chapters
First-level ATC code and description ICD-10 chapters
A Alimentary tract and metabolism II, XIII, XIXB Blood and blood forming organs IX, V, XC Cardiovascular system IX, V, IID Dermatologicals I, XII, XIXG Genito-urinary system and sex hormones XIV, II, IXH Systemic hormonal preparations II, X, VIIJ Anti-infectives for systemic use X, XIV, XIXL Antineoplastic and immunomodulating agents II, XI, XIVM Musculo-skeletal system XIII, XIX, XN Nervous system V, XIII, IIP Antiparasitic products, insecticides, and repellents XI, XIV, IR Respiratory system X, II, IXS Sensory organs VII, I, IX
Notes: This table shows the assignment of outpatient prescriptions to hospital diagnoses for theindicator variable “hospital stay with matched diagnosis”. For any outpatient prescription with agiven ATC code, the variable takes the value of 1 if there is a preceding hospital stay with any ofthe outlined ICD-10 diagnoses, and 0 otherwise. The links were determined using ATC codes andthe three most common corresponding ICD-10 diagnoses of corresponding discharge prescriptions.Description of ICD chapters: I: Certain infectious and parasitic diseases; II: Neoplasms; V: Mentaland behavioral disorders; VII: Diseases of the eye and adnexa; IX: Diseases of the circulatorysystem; X: Diseases of the respiratory system; XI: Diseases of the digestive system; XII: Diseasesof the skin and subcutaneous tissue; XIII: Diseases of the musculoskeletal system and connectivetissue; XIV: Diseases of the genitourinary system; XIX: Injury, poisoning, and certain otherconsequences of external causes.
Table 2: Descriptive statistics
(1) (2) (3) (4) (5)Full sample Control Treatment groups: Hospital...
stay diagnosis discharge p.
Generic drug 0.611 0.627 0.542 0.510 0.423Age of patient 50.6 47.9 61.8 62.4 62.8Patient income (in 1,000) 22.4 23.2 19.2 19.6 20.7Age of physician 52.9 52.9 52.9 53.0 53.4Physician dispenses drugs 0.241 0.239 0.251 0.253 0.165General practitioner 0.811 0.798 0.867 0.873 0.919City practice 0.260 0.263 0.246 0.241 0.349Female physician 0.131 0.131 0.131 0.132 0.144Non-contracted physician 0.065 0.069 0.049 0.049 0.032
Number of first prescriptions 4,880,936 3,943,277 937,659 402,425 71,053
Notes: This table shows the descriptive statistics for the control and treatment groups (any hospital stay, hospital staywith matched diagnosis, hospital discharge prescription) using the first outpatient prescription of a therapy. Becauseof missing information, the number of observations is only 3,920,927 for patient income, 4,163,325 for age of physician,and 4,573,476 for sex of physician.
21
Table 3: Comparison of hospital patients with and without a discharge prescription
(1) (2) (3)Discharge prescription?
No Yes Diff.
Patient characteristics
Age 53.7 53.2 0.4Female share 0.55 0.52 0.03
Outpatient expenditure in year of hospital stay
Medical attendance 624.2 636.5 −12.3Medication 1214.3 1342.3 −128.1
Hospital diagnoses
Neoplasms 14.21 13.12 1.10Diseases of the circulatory system 10.97 12.18 −1.20Diseases of the musculoskeletal system andconnective tissue 9.47 13.25 −3.79Injury, poisoning, and certain other consequences ofexternal causes 9.38 11.79 −2.41Diseases of the digestive system 8.01 7.00 1.01Diseases of the eye and adnexa 7.44 1.08 6.36Diseases of the genitourinary system 5.83 7.28 −1.44Mental and behavioral disorders 5.72 6.92 −1.20Diseases of the respiratory system 5.05 9.97 −4.92Symptoms, signs, and abnormal clinical andlaboratory findings 4.95 3.34 1.61Pregnancy, childbirth, and the puerperium 4.64 1.44 3.19Diseases of the nervous system 4.38 2.65 1.73Certain infectious and parasitic diseases 2.22 2.94 −0.72Endocrine, nutritional, and metabolic diseases 2.35 1.40 0.95Diseases of the skin and subcutaneous tissue 1.44 1.85 −0.41Diseases of the ear and mastoid process 1.18 2.35 −1.18Factors influencing health status and contact withhealth services 0.86 0.26 0.60Diseases of the blood and blood-forming organs 0.75 0.58 0.17Congenital malformations, deformations, andchromosomal abnormalities 0.74 0.55 0.19Certain conditions originating in the perinatalperiod 0.41 0.05 0.36Codes for special purposes 0.00 0.00 0.00
N 1,669,425 213,431
Notes: This table shows the characteristics of patients in hospitals who receive a discharge prescription (column (2))and patients who do not receive a discharge prescription (column (1)).
22
Table 4: Comparison of patients with and without a previous hospital stay
Medical attendance 549.9 783.0 −233.1Medication 487.2 1320.7 −833.5
Outpatient expenditure in previous year
Medical attendance 477.8 650.6 −172.8Medication 430.7 1004.4 −573.7
N 3, 943, 277 937, 659
Notes: This table shows the characteristics of patients with a previous hospital stay (column (2)) andwithout a previous hospital stay (column (1)) within three months before the first outpatient prescription.
Table 5: Hospitalization effect on first outpatient prescription
(1) (2) (3)
Hospital stay −0.082∗∗∗ −0.080∗∗∗ −0.063∗∗∗
(0.001) (0.001) (0.001)
Hospital stay with matched diagnosis −0.110∗∗∗ −0.106∗∗∗ −0.087∗∗∗
(0.002) (0.002) (0.002)Controlling for fixed effects:
Time X X X
Active ingredient X X X
Physician X X
Patient X
Notes: This table summarizes the hospital effect on the first outpatient medical therapy prescription. Thedependent variable is a binary indicator for generic versus brand-name choice. Each entry represents theresults from a separate regression with different explanatory variables of interest indicated on the left-handside and controlling for different levels of fixed effects indicated at the bottom of the table. The number ofobservations is 4,880,936 for hospital stay regressions, 4,345,702 for hospital stay with matched diagnosis, and4,014,330 for hospital discharge prescriptions. Robust standard errors are in parentheses; ∗ p < 0.1, ∗∗ p < 0.05,∗∗∗ p < 0.01.
23
Table 6: Hospitalization effect on first outpatient prescription – varying time window
(1) (2) (3)
Hospital stay in past 3 months −0.082∗∗∗ −0.080∗∗∗ −0.063∗∗∗
(0.001) (0.001) (0.001)
Hospital stay in past 6 months −0.065∗∗∗ −0.064∗∗∗ −0.048∗∗∗
(0.000) (0.000) (0.001)
Hospital stay in past 3 months (spec. II) −0.084∗∗∗ −0.082∗∗∗ −0.065∗∗∗
(0.001) (0.001) (0.001)Controlling for fixed effects:
Time X X X
Active ingredient X X X
Physician X X
Patient X
Notes: This table summarizes the hospital effect on the first outpatient medical therapy prescription with varyingtime windows. The dependent variable is a binary indicator for generic versus brand-name choice. Each entryrepresents the results from a separate regression with different explanatory variables of interest indicated on theleft-hand side and controlling for different levels of fixed effects indicated at the bottom of the table. The numberof observations is 4,880,936 for hospital stay in the past three or six months, and 4,557,815 for hospital stay in thepast three months (spec. II), where we exclude patients with hospital stays within four to six months prior to theoutpatient prescription. Robust standard errors are in parentheses; ∗ p < 0.1, ∗∗ p < 0.05, ∗∗∗ p < 0.01.
Table 7: Hospitalization effect on all outpatient prescriptions
(1) (2) (3)
Hospital stay −0.083∗∗∗ −0.082∗∗∗ −0.057∗∗∗
(0.000) (0.000) (0.000)
Hospital stay with matched diagnosis −0.113∗∗∗ −0.110∗∗∗ −0.080∗∗∗
(0.001) (0.001) (0.001)Controlling for fixed effects:
Time X X X
Active ingredient X X X
Physician X X
Patient X
Notes: This table summarizes the hospital effect on all medical therapy prescriptions. The dependent variableis a binary indicator for generic versus brand-name choice. Each entry represents the results from a separateregression with different explanatory variables of interest indicated on the left-hand side and controlling fordifferent levels of fixed effects indicated at the bottom of the table. The number of observations is 15,945,098for hospital stay regressions, 13,413,156 for hospital stay with matched diagnosis, and 11,694,960 for hospitaldischarge prescriptions. Robust standard errors are in parentheses; ∗ p < 0.1, ∗∗ p < 0.05, ∗∗∗ p < 0.01.
Notes: This table summarizes the hospital effects on the first outpatient medical therapy prescription using dischargeprescriptions. The dependent variable is a binary indicator for generic versus brand-name choice. Each line reflectsthe results from a separate regression for different samples indicated at the very left. Column (1) presents thecorresponding sample mean of the dependent variable, columns (2)–(4) show the point estimates, robust standarderrors, and the corresponding 95 % confidence intervals. The number of observations is indicated in column (5).Additional covariates control for time, active ingredient, physician, and patient-fixed effects. ∗ p < 0.1, ∗∗ p < 0.05,∗∗∗ p < 0.01.
25
Table 9: Comparison of drug choice in hospitals and the outpatient sector
Discharge prescriptions Outpatient prescriptions
(1) (2) (3) (4)
Patient under 40 −0.014∗∗∗ −0.009∗∗∗ 0.016∗∗∗ 0.019∗∗∗
(0.002) (0.002) (0.001) (0.001)Patient over 70 −0.002 0.003 −0.012∗∗∗ −0.017∗∗∗
N 267,260 267,260 3,129,858 3,129,858Mean of dept. 0.253 0.253 0.640 0.640
Notes: This table summarizes the effects of patient characteristics on hospital discharge prescriptions (columns(1) and (2)) and outpatient prescriptions with no prior hospital stay (columns(3) and (4)). The dependentvariable is a binary indicator for generic versus brand-name choice. Additional covariates controlling fordifferent levels of fixed effects are indicated at the bottom of the table. Robust standard errors are inparentheses; ∗ p < 0.1, ∗∗ p < 0.05, ∗∗∗ p < 0.01.
26
Table 10: Physicians’ adherence to hospital choices
(1) (2) (3)Adherence Adh. to brand-name Adh. to generic
Physician characteristics
Physician over 50 −0.005 −0.001 −0.002(0.004) (0.005) (0.004)
N 52,994 38,804 14,190Mean of dept. 0.817 0.766 0.955
Notes: This table summarizes the effects of patient and physician characteristics on physicians’ adherence todischarge prescriptions. The dependent variable is a binary indicator for adherence and non-adherence. Column(1) depicts overall adherence to the type of discharge prescriptions. Column (2) depicts adherence to a brand-name discharge prescription, and column (3) to a generic discharge prescription. All regressions include fixedeffects for time and active ingredient. Robust standard errors are in parentheses; ∗ p < 0.1, ∗∗ p < 0.05, ∗∗∗