Hospitals and the Louisiana Economy, 2018 Prepared for the Louisiana Hospital Association by Dr. James A. Richardson, Alumni Professor of Economics and Public Administration, Louisiana State University
Transcript
Hospitals and the Louisiana Economy, 2018
Prepared for the Louisiana Hospital Association by Dr. James A. Richardson, Alumni Professor of Economics and Public Administration, Louisiana State University
Hospitals and the Louisiana Economy, 2018 Executive SummaryPrepared for the Louisiana Hospital Association by Dr. James A. Richardson, Alumni Professor of Economics and Public Administration, Louisiana State University
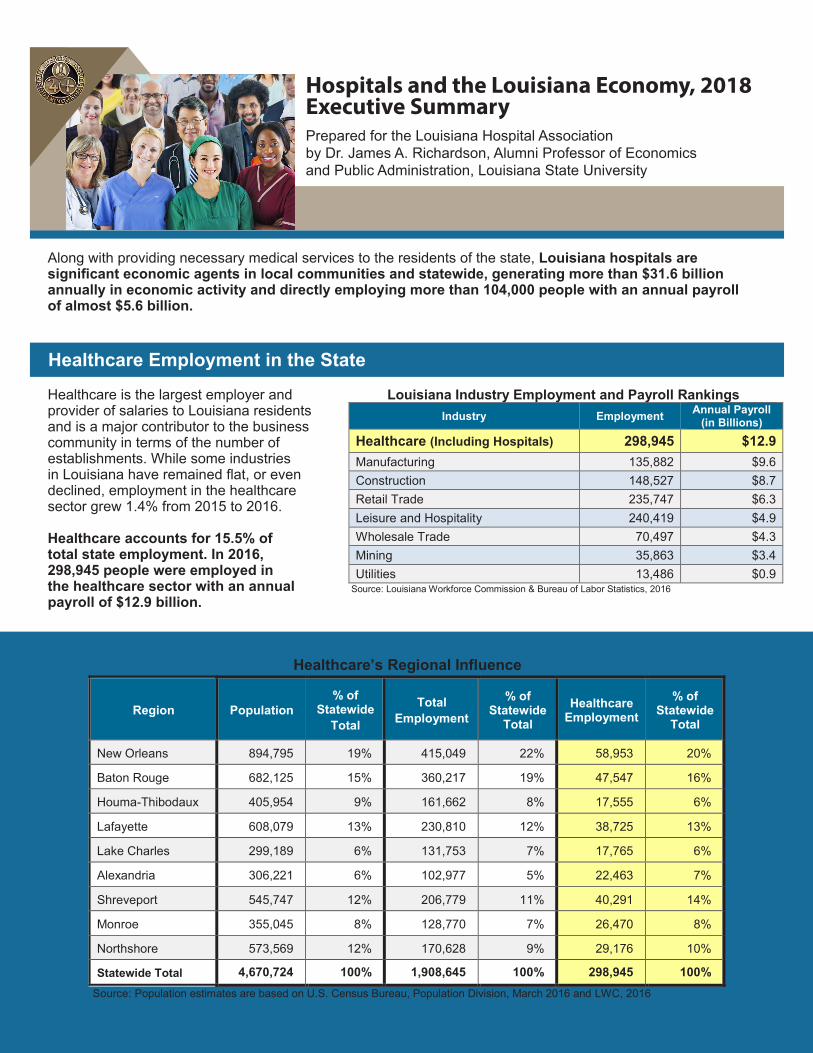
Along with providing necessary medical services to the residents of the state, Louisiana hospitals are significant economic agents in local communities and statewide, generating more than $31.6 billion annually in economic activity and directly employing more than 104,000 people with an annual payroll of almost $5.6 billion.
Healthcare is the largest employer and provider of salaries to Louisiana residents and is a major contributor to the business community in terms of the number of establishments. While some industries in Louisiana have remained flat, or even declined, employment in the healthcare sector grew 1.4% from 2015 to 2016.
Healthcare accounts for 15.5% of total state employment. In 2016, 298,945 people were employed in the healthcare sector with an annual payroll of $12.9 billion.
Healthcare Employment in the StateLouisiana Industry Employment and Payroll Rankings
Source: Louisiana Workforce Commission & Bureau of Labor Statistics, 2016
Healthcare’s Regional Influence
Region Population % of
Statewide Total
Total Employment
% of Statewide
Total Healthcare
Employment % of
Statewide Total
New Orleans 894,795 19% 415,049 22% 58,953 20%
Baton Rouge 682,125 15% 360,217 19% 47,547 16%
Houma-Thibodaux 405,954 9% 161,662 8% 17,555 6%
Lafayette 608,079 13% 230,810 12% 38,725 13%
Lake Charles 299,189 6% 131,753 7% 17,765 6%
Alexandria 306,221 6% 102,977 5% 22,463 7%
Shreveport 545,747 12% 206,779 11% 40,291 14%
Monroe 355,045 8% 128,770 7% 26,470 8%
Northshore 573,569 12% 170,628 9% 29,176 10%
Statewide Total 4,670,724 100% 1,908,645 100% 298,945 100% Source: Population estimates are based on U.S. Census Bureau, Population Division, March 2016 and LWC, 2016
Louisiana Hospital Revenue by Source
Source: Louisiana Health Information Network
31%
47%
15%
7%
27%
47%
20%
6%
0% 5% 10% 15% 20% 25% 30% 35% 40% 45% 50%
Private
Medicare
Medicaid
Other
2016 2015
Hospital Revenue Sources and the Medicaid ProgramHospitals receive revenue from private insurance companies, federal insurance programs such as Medicare, federal and state insurance programs such as Medicaid, and self-payment by individuals. In 2016, approximately 47% of hospital revenue came from Medicare, 27% from private insurers, 20% from Medicaid and 6% from self-pay.
In 2016, there was a decline in both commercial and uninsured categories and an increase in Medicaid; however, further study is necessary to determine whether the shift is a direct effect of Medicaid expansion or if other state economic factors contributed to the change.
Overall Economic Impact of HospitalsConstruction activity, major equipment purchases and recurring expenditures, such as salaries, supplies, business services and other hospital operating costs, produce economic ripples that reach far beyond the hospital to local communities and throughout the state.
The overall economic impact of Louisiana hospitals, including daily operations and one-time capital expenditures, led to business transactions of more than $31.6 billion; the creation and support of more than 254,000 jobs in hospitals and other sectors with personal earnings of more than $11.7 billion; and $1.7 billion in state and local tax collections.
In Business Transactions
Created and Supported Statewide
State & Local Taxes Generated
254,000 Jobs
$1.7 Billion
$31.6Billion
In Annual Payroll
$11.7 Billion
Overall Economic Impact of Louisiana Hospitals from Construction and Operations:
“Louisiana hospitals not only play a critical role in supporting the health of our residents, but also in fostering a vibrant economy.” - Dr. James A. Richardson, Alumni Professor of Economics and Public Administration, LSU
Direct State SupportIn state fiscal year 2017, hospitals were responsible for more than $560 million in direct financial support to the Medicaid program through inter-governmental transfers, certified public expenditures, lease payments and the hospital assessment. Through this support, the state was able to draw down approximately $1.3 billion in additional federal Medicaid funding.
$560 Million
In New Federal Medicaid Funds
$1.3Billion
Overall Economic Impact of Hospitals ($ in Millions)
Source: Author and RIMS Multipliers (U.S. Bureau of Economic Analysis), 2015 and 2016
Hospitals and the Louisiana Economy, 2018
Prepared for the Louisiana Hospital Association
Prepared By
Dr. James A. Richardson* Alumni Professor of Economics and Public Administration
Louisiana State University
January 2018
*Dr. Richardson is solely responsible for the analysis and findings in this report.
Hospitals and the Louisiana Economy, 2017-18
2
Introduction Louisiana hospitals provide necessary medical services to the residents of the state. In the process of providing these vital services, the healthcare sector becomes a significant agent in local communities and across the state. This report focuses on the integral role hospitals play in commerce and the magnitude of their contributions to the local and state economies, including the nine Louisiana Department of Health (LDH) regions and the six congressional districts within the state. The economic significance of hospitals in Louisiana is highlighted through the following considerations: 1. Lack of medical care and facilities can deter economic development. Economic development
may start without an adequate healthcare system, but it will not continue to flourish unless an acceptable healthcare system exists, including the presence of hospitals.
2. In addition to shaping the long-term economic and social development of a community, hospitals hire highly-trained personnel to deliver medical services, develop commercial relationships with other businesses and conduct research. Hospitals, by their nature, are labor-intensive and geographically diverse, making employment in hospitals more substantial compared to other businesses and public enterprises.
3. Hospitals serve as anchors in the development of medical districts, fostering the growth of clinical specialties and teaching programs, and necessitating the need for additional healthcare services and facilities. Often medical districts gain an overall reputation for excellence that attracts patients from beyond the primary service area. Healthcare becomes more than just a service industry; it becomes one of the economic drivers of a local economy.
4. The Medicaid program is a significant contributor to the Louisiana economy, because of the funding relationship between the state and the federal government. Presently, for every 38 cents Louisiana contributes to the Medicaid program, the federal government contributes 62 cents for individuals not covered under the Affordable Care Act (ACA). This is known as the federal medical assistance percentage (FMAP) rate, which is re-computed on an annual basis and can change given economic conditions in the state. In state fiscal year 2015-2016, a $2.8 billion commitment by the state to the Medicaid program generated $5.4 billion in federal funds in Louisiana’s Medicaid program.1
5. Hospitals provide direct support to the state Medicaid program via inter-governmental transfers, certified public expenditures, lease payments and the hospital assessment.
6. Medicaid expansion under the ACA allows for a reduced state FMAP for non-elderly adults below 138% of the Federal Poverty Level (FPL), gradually increasing annually to a state FMAP of 10% effective in 2020. In 2016, the federal government paid 100% of the expenses associated with Medicaid expansion with the FMAP gradually moving to a 90:10 ratio. As of December 2017, more than 456,000 non-elderly Louisiana residents have insurance coverage because of Medicaid expansion.
7. Between daily operations and one-time capital expenditures, Louisiana hospitals create and support more than 254,000 jobs with an annual payroll of more than $11.7 billion and $1.7 billion in net state and local tax receipts.
1 Louisiana Medicaid 2016 Annual Report
Hospitals and the Louisiana Economy, 2017-18
3
Healthcare Employment in the State2 In the most recent annual data available from the Louisiana Workforce Commission (LWC), 298,945 people were employed in the healthcare sector with an annual payroll of $12.9 billion, which is an average annual wage of approximately $43,100 per person. While some industries in Louisiana have remained flat, or even declined, employment in the healthcare sector has grown from 294,931 employees in 2015 to 298,945 people in 2016, a 1.4% increase. Healthcare employment as a share of the total workforce in Louisiana is at 15.5%, which is on par with the national average of 15%. Between 2015 and 2016:
• Healthcare employment increased from 294,931 to 298,945 individuals;
• Annual payroll increased from $12.6 billion to $12.9 billion; and
• Average annual wage increased from $42,000 to $43,100 per person. Figure 1 illustrates the number of employees by business sector revealing the large impact the healthcare category, including hospitals, has on the state’s economy, followed by leisure and hospitality and retail trade. Seven business sectors have more than 100,000 employees including: healthcare, leisure and hospitality, retail trade, educational services, construction, manufacturing, and administrative and waste services. If hospitals were isolated, this industry would also employ more than 100,000 people.
Figure 1. Employees by Business Sector, Louisiana, 2016
Source: LWC, 2016
Establishments, employment and annual payroll for 2016 are illustrated on the next page in Table 1 with healthcare having the most employees and the largest annual payroll but the third largest number of establishments. These statistics merely illustrate the differences among major industries in Louisiana. Healthcare is a major contributor to the business community in terms of establishments and is the largest employer and provider of wages and salaries to Louisiana residents.
2 All information in this section is based on LWC, Wage and Employment, 2016.
298,945
240,419
235,747
164,846
148,527
135,882
102,712
97,098
88,808
79,378
70,497
56,570
48,231
35,863
31,487
26,964
23,344
13,486
9,570
- 50,000 100,000 150,000 200,000 250,000 300,000
Healthcare
Leisure Hospitality
Retail trade
Educational services
Construction
Manufacturing
Administrative and waste services
Public administration
Professional and technical services
Transportation and warehousing
Wholesale trade
Finance and insurance
Other services, except public administration
Mining
Real estate and rental and leasing
Information
Management of companies and enterprises
Utilities
Agriculture, forestry, fishing and hunting
Hospitals and the Louisiana Economy, 2017-18
4
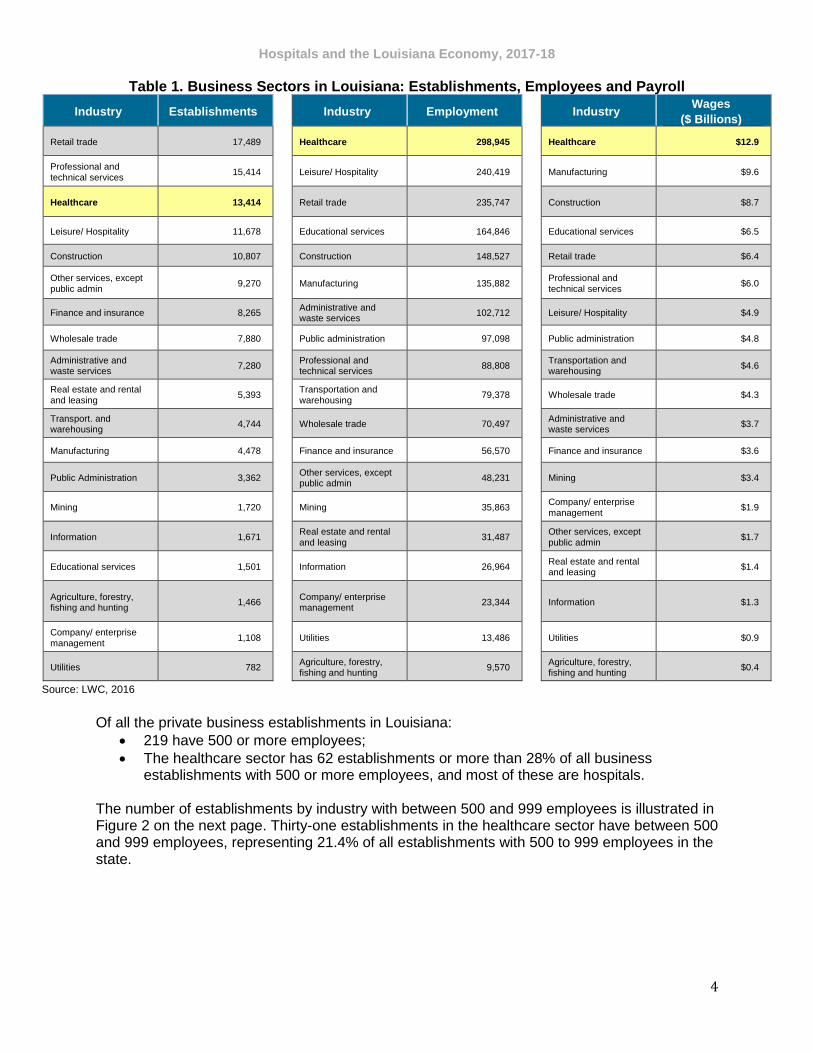
Table 1. Business Sectors in Louisiana: Establishments, Employees and Payroll
Industry Establishments Industry Employment
Industry Wages
($ Billions)
Retail trade 17,489
Healthcare 298,945
Healthcare $12.9
Professional and technical services
15,414
Leisure/ Hospitality 240,419
Manufacturing $9.6
Healthcare 13,414
Retail trade 235,747
Construction $8.7
Leisure/ Hospitality 11,678
Educational services 164,846
Educational services $6.5
Construction 10,807 Construction 148,527 Retail trade $6.4
Other services, except public admin
9,270
Manufacturing 135,882 Professional and
technical services $6.0
Finance and insurance 8,265 Administrative and
waste services 102,712 Leisure/ Hospitality $4.9
Wholesale trade 7,880
Public administration 97,098 Public administration $4.8
Administrative and waste services
7,280 Professional and
technical services 88,808
Transportation and warehousing
$4.6
Real estate and rental and leasing
5,393 Transportation and
warehousing 79,378
Wholesale trade $4.3
Transport. and warehousing
4,744
Wholesale trade 70,497 Administrative and
waste services $3.7
Manufacturing 4,478
Finance and insurance 56,570 Finance and insurance $3.6
Public Administration 3,362 Other services, except
public admin 48,231
Mining $3.4
Mining 1,720
Mining 35,863 Company/ enterprise
management $1.9
Information 1,671 Real estate and rental
and leasing 31,487
Other services, except public admin
$1.7
Educational services 1,501
Information 26,964 Real estate and rental
and leasing $1.4
Agriculture, forestry, fishing and hunting
1,466
Company/ enterprise management
23,344
Information $1.3
Company/ enterprise management
1,108
Utilities 13,486
Utilities $0.9
Utilities 782 Agriculture, forestry,
fishing and hunting 9,570
Agriculture, forestry, fishing and hunting
$0.4
Source: LWC, 2016
Of all the private business establishments in Louisiana:
• 219 have 500 or more employees;
• The healthcare sector has 62 establishments or more than 28% of all business establishments with 500 or more employees, and most of these are hospitals.
The number of establishments by industry with between 500 and 999 employees is illustrated in Figure 2 on the next page. Thirty-one establishments in the healthcare sector have between 500 and 999 employees, representing 21.4% of all establishments with 500 to 999 employees in the state.
Hospitals and the Louisiana Economy, 2017-18
5
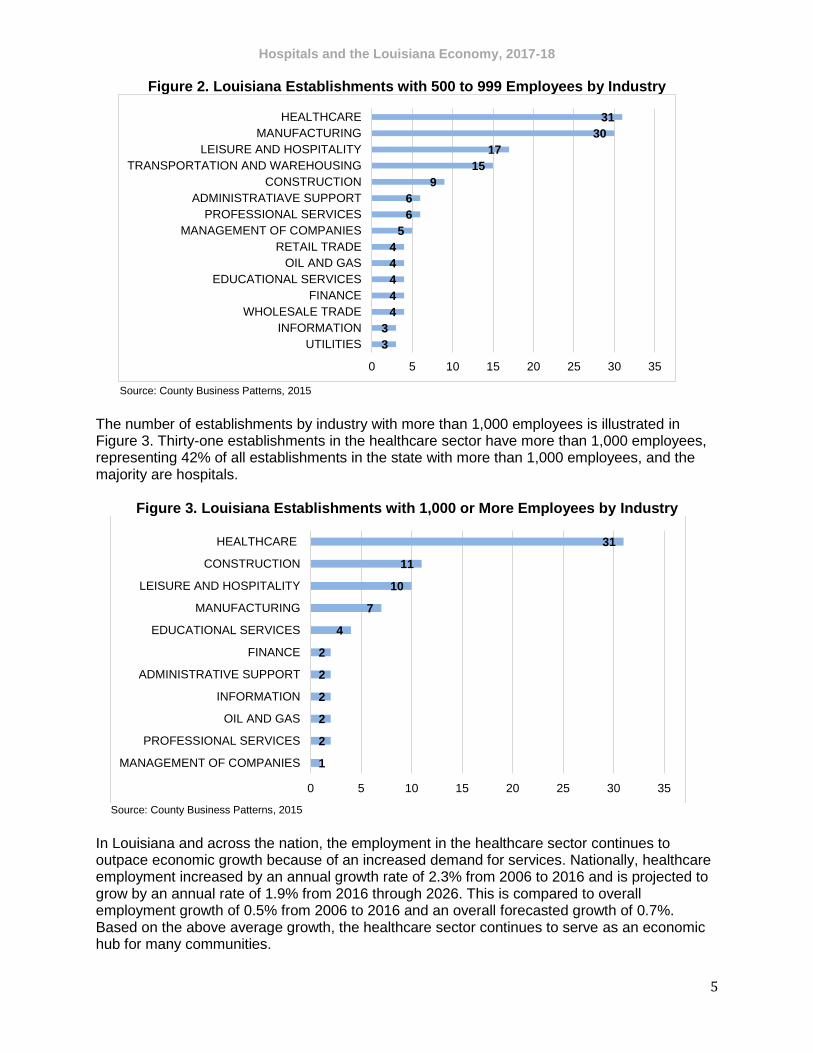
Figure 2. Louisiana Establishments with 500 to 999 Employees by Industry
Source: County Business Patterns, 2015
The number of establishments by industry with more than 1,000 employees is illustrated in Figure 3. Thirty-one establishments in the healthcare sector have more than 1,000 employees, representing 42% of all establishments in the state with more than 1,000 employees, and the majority are hospitals.
Figure 3. Louisiana Establishments with 1,000 or More Employees by Industry
Source: County Business Patterns, 2015
In Louisiana and across the nation, the employment in the healthcare sector continues to outpace economic growth because of an increased demand for services. Nationally, healthcare employment increased by an annual growth rate of 2.3% from 2006 to 2016 and is projected to grow by an annual rate of 1.9% from 2016 through 2026. This is compared to overall employment growth of 0.5% from 2006 to 2016 and an overall forecasted growth of 0.7%. Based on the above average growth, the healthcare sector continues to serve as an economic hub for many communities.
3
3
4
4
4
4
4
5
6
6
9
15
17
30
31
0 5 10 15 20 25 30 35
UTILITIES
INFORMATION
WHOLESALE TRADE
FINANCE
EDUCATIONAL SERVICES
OIL AND GAS
RETAIL TRADE
MANAGEMENT OF COMPANIES
PROFESSIONAL SERVICES
ADMINISTRATIAVE SUPPORT
CONSTRUCTION
TRANSPORTATION AND WAREHOUSING
LEISURE AND HOSPITALITY
MANUFACTURING
HEALTHCARE
1
2
2
2
2
2
4
7
10
11
31
0 5 10 15 20 25 30 35
MANAGEMENT OF COMPANIES
PROFESSIONAL SERVICES
OIL AND GAS
INFORMATION
ADMINISTRATIVE SUPPORT
FINANCE
EDUCATIONAL SERVICES
MANUFACTURING
LEISURE AND HOSPITALITY
CONSTRUCTION
HEALTHCARE
Hospitals and the Louisiana Economy, 2017-18
6
Healthcare employment by facility type is illustrated in Figure 4 based on information from the LWC.
• Ambulatory care, which includes physician offices and other facilities not defined as hospitals, has more than 100,000 employees or about 34% of total healthcare employment;
• Hospitals make up 35% of healthcare employment with 104,069 employees;
• Nursing and residential care facilities make up 15%; and
• Social assistance makes up about 16% of healthcare employment.
Figure 4. Healthcare Employment in Louisiana by Facility Type
Source: LWC, 2016
Healthcare Employment by Region Employment is further divided into each of the nine regions (Map 1 below).
Map 1. LDH Regions
101,722 104,069
43,97349,182
0
20,000
40,000
60,000
80,000
100,000
120,000
Ambulatory healthcare services
Hospitals Nursing andresidential care
facilities
Social assistance
Num
ber
of
em
plo
yees
Hospitals and the Louisiana Economy, 2017-18
7
Healthcare employment in each health region is noted in Table 2. Healthcare employees make up 15.5% of total state employment.
Table 2. Comparison of Population and Employment by Region
Region Population % of
Statewide Total
Total
Employment
% of Statewide
Total
Healthcare Employment
% of Statewide
Total
New Orleans 894,795 19% 415,049 22% 58,953 20%
Baton Rouge 682,125 15% 360,217 19% 47,547 16%
Houma-Thibodaux
405,954 9% 161,662 8% 17,555 6%
Lafayette 608,079 13% 230,810 12% 38,725 13%
Lake Charles 299,189 6% 131,753 7% 17,765 6%
Alexandria 306,221 6% 102,977 5% 22,463 8%
Shreveport 545,747 12% 206,779 11% 40,291 13%
Monroe 355,045 8% 128,770 7% 26,470 9%
Northshore 573,569 12% 170,628 9% 29,176 10%
Statewide Total 4,670,724 100% 1,908,645 100% 298,945 100%
Source: Population estimates are based on U.S. Census Bureau, Population Division, March 2016 and LWC, 2016
Healthcare Employment by Congressional District3 The six Congressional Districts in Louisiana are illustrated in Map 2, and the healthcare workers by district are illustrated in Table 3.
Map 2. Louisiana Congressional Districts
Healthcare employees ranged from a low of 44,921 in District 6 to a high of 55,734 in District 1. Healthcare employment is most significant in Districts 4 and 5 from an overall employment perspective, with a ratio of healthcare employment to total private employment of 21.0%, and 26.3%, respectively. Healthcare employment relative to the total population of each Congressional District varies from a low of 4.6% in District 2 to a high of 7.4% in District 5. The state average is 6.2%.
3 Information in this section on Congressional Districts is based on the census.gov (My Congressional District), The American
Community Survey and County Business Patterns.
Hospitals and the Louisiana Economy, 2017-18
8
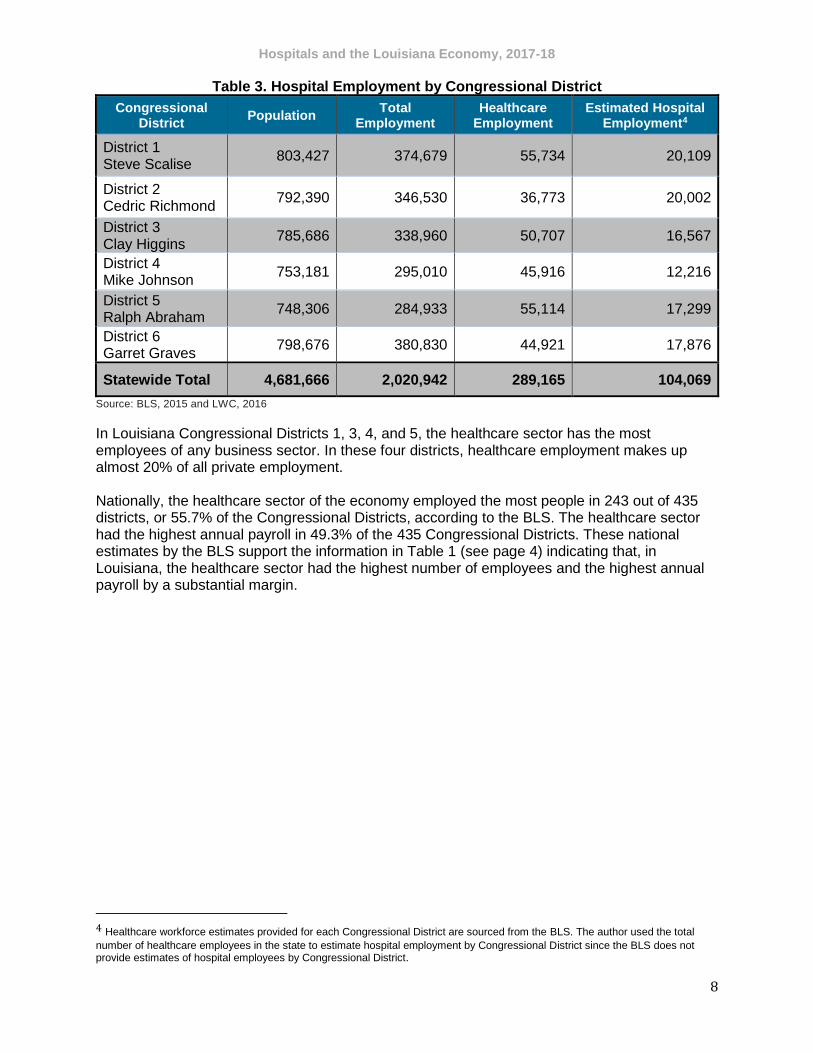
Table 3. Hospital Employment by Congressional District
Congressional District
Population Total
Employment Healthcare
Employment Estimated Hospital
Employment4
District 1 Steve Scalise
803,427 374,679 55,734 20,109
District 2 Cedric Richmond
792,390 346,530 36,773 20,002
District 3 Clay Higgins
785,686 338,960 50,707 16,567
District 4 Mike Johnson
753,181 295,010 45,916 12,216
District 5 Ralph Abraham
748,306 284,933 55,114 17,299
District 6 Garret Graves
798,676 380,830 44,921 17,876
Statewide Total 4,681,666 2,020,942 289,165 104,069
Source: BLS, 2015 and LWC, 2016
In Louisiana Congressional Districts 1, 3, 4, and 5, the healthcare sector has the most employees of any business sector. In these four districts, healthcare employment makes up almost 20% of all private employment. Nationally, the healthcare sector of the economy employed the most people in 243 out of 435 districts, or 55.7% of the Congressional Districts, according to the BLS. The healthcare sector had the highest annual payroll in 49.3% of the 435 Congressional Districts. These national estimates by the BLS support the information in Table 1 (see page 4) indicating that, in Louisiana, the healthcare sector had the highest number of employees and the highest annual payroll by a substantial margin.
4 Healthcare workforce estimates provided for each Congressional District are sourced from the BLS. The author used the total
number of healthcare employees in the state to estimate hospital employment by Congressional District since the BLS does not provide estimates of hospital employees by Congressional District.
Hospitals and the Louisiana Economy, 2017-18
9
Economic Impact of Hospitals
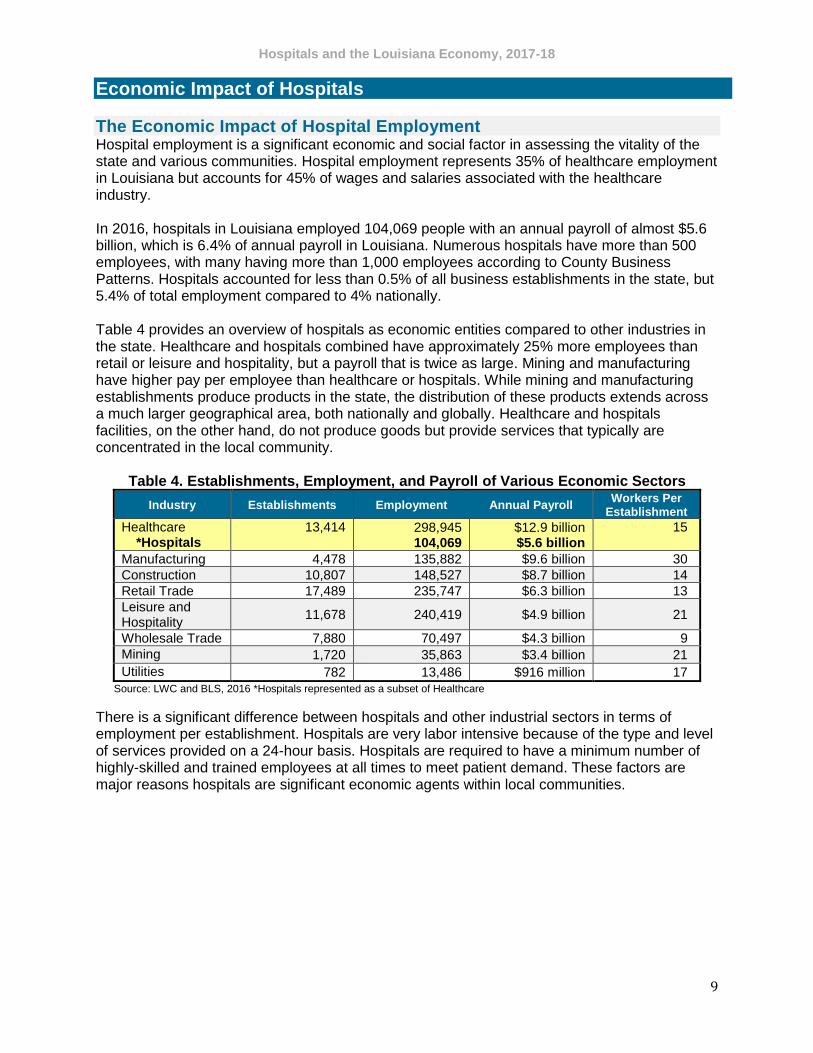
The Economic Impact of Hospital Employment Hospital employment is a significant economic and social factor in assessing the vitality of the state and various communities. Hospital employment represents 35% of healthcare employment in Louisiana but accounts for 45% of wages and salaries associated with the healthcare industry. In 2016, hospitals in Louisiana employed 104,069 people with an annual payroll of almost $5.6 billion, which is 6.4% of annual payroll in Louisiana. Numerous hospitals have more than 500 employees, with many having more than 1,000 employees according to County Business Patterns. Hospitals accounted for less than 0.5% of all business establishments in the state, but 5.4% of total employment compared to 4% nationally. Table 4 provides an overview of hospitals as economic entities compared to other industries in the state. Healthcare and hospitals combined have approximately 25% more employees than retail or leisure and hospitality, but a payroll that is twice as large. Mining and manufacturing have higher pay per employee than healthcare or hospitals. While mining and manufacturing establishments produce products in the state, the distribution of these products extends across a much larger geographical area, both nationally and globally. Healthcare and hospitals facilities, on the other hand, do not produce goods but provide services that typically are concentrated in the local community.
Table 4. Establishments, Employment, and Payroll of Various Economic Sectors
Industry Establishments Employment Annual Payroll Workers Per
Establishment
Healthcare *Hospitals
13,414 298,945 104,069
$12.9 billion $5.6 billion
15
Manufacturing 4,478 135,882 $9.6 billion 30
Construction 10,807 148,527 $8.7 billion 14
Retail Trade 17,489 235,747 $6.3 billion 13
Leisure and Hospitality
11,678 240,419 $4.9 billion 21
Wholesale Trade 7,880 70,497 $4.3 billion 9
Mining 1,720 35,863 $3.4 billion 21
Utilities 782 13,486 $916 million 17
Source: LWC and BLS, 2016 *Hospitals represented as a subset of Healthcare
There is a significant difference between hospitals and other industrial sectors in terms of employment per establishment. Hospitals are very labor intensive because of the type and level of services provided on a 24-hour basis. Hospitals are required to have a minimum number of highly-skilled and trained employees at all times to meet patient demand. These factors are major reasons hospitals are significant economic agents within local communities.
Hospitals and the Louisiana Economy, 2017-18
10
The Economic Impact of Hospital Capital Expenditures The economic benefits of the hospital industry are felt far beyond the doors of each hospital and its employees. Construction activity for hospitals creates jobs for persons in the industry and related suppliers, producing economic ripples that are generally associated with any construction job. These economic ripples include purchases from local businesses for the project and the workers who are consumers of goods and services in the local economy. The impact of the construction project is obviously for a limited period; however, given the size of the hospital industry, technological advances and aging infrastructure, there will always be some construction projects going on throughout the state. The economic impacts are estimated and summarized in the following section of this report.
Statewide construction activity is illustrated in Figure 5 for 2015 and 2016 for both construction and major equipment purchases. In 2015, hospitals spent more than $509 million on construction projects, and in 2016, they spent more than $604 million. They spent $396 million on equipment in both 2015 and 2016. These are substantial expenditures that affect the total economy.
Figure 5. Louisiana Hospital Capital Expenditures
Source: 2015 and 2016 Cost Report, HCRIS, July 2017
Impact of Hospital Capital Expenditures by Region The local economic impact of construction spending is more substantial than the economic impact of major equipment purchases, since these purchases are likely made outside of Louisiana. Though equipment purchases undoubtedly enhance the healthcare services offered by the hospital, they do not have a large impact on the local economy. Hence, we will focus on the economic impact of the construction spending by the hospitals.
The construction spending by region is illustrated in Table 5 on the next page. This impact varies across the state depending on the extent of construction projects occurring within each region. Major construction projects related to hospitals occurred in the New Orleans area in both 2015 and 2016, averaging $194 million in capital expenditures. Capital expenditures in the Shreveport area averaged $85.9 million between 2015 and 2016, while in the Baton Rouge area, hospital spending on capital projects average $66.1 million. Significant capital expenditures took place in every region with the lowest capital expenditures occurring in the Lake Charles region in 2015 and 2016 at an average of $23.2 million per year and in the Alexandria region at an average of $23.8 million per year.
$509 Million
$605 Million
$397 Million $396 Million
$0
$100,000,000
$200,000,000
$300,000,000
$400,000,000
$500,000,000
$600,000,000
$700,000,000
2015 2016
Buildings and Fixtures Equipment
Hospitals and the Louisiana Economy, 2017-18
11
Table 5. Average Construction Expenditures by Region, 2015 and 2016
Regions 2015 2016
New Orleans $164,300,000 $225,500,000
Baton Rouge $55,100,000 $77,000,000
Houma-Thibodaux $27,900,000 $27,100,000
Lafayette $57,900,000 $66,100,000
Lake Charles $23,800,000 $22,600,000
Alexandria $24,200,000 $23,500,000
Shreveport $84,100,000 $87,700,000
Monroe $31,500,000 $31,800,000
Northshore $40,200,000 $43,600,000
Statewide Total $509,200,000 $604,900,000 Source: 2015 and 2016 Cost Report, HCRIS, July 2017
Table 6 illustrates the economic impact of construction expenditures for 2015 and 2016 combined. Statewide, construction activity at hospitals:
• Created or supported an average of 8,008 jobs each year with an annual income of about $46,500 per employee;
• Generated payroll of $372.3 million; and
• Produced $54 million in state and local tax collections.
Employment gains ranged from 2,800 jobs in New Orleans, or 35% of the state gain, down to about 340 new jobs in Lake Charles and Alexandria.
Table 6. Economic Impact of Construction Expenditures by Region ($ in Millions)
Region Business
Transactions Annual Payroll
Jobs Created and Supported
State and Local Tax Collections
New Orleans $383 $131 2,803 $18.9
Baton Rouge $130 $44 950 $6.4
Houma-Thibodaux $54 $18 395 $2.7
Lafayette $122 $41 891 $6.0
Lake Charles $46 $16 334 $2.2
Alexandria $47 $16 343 $2.3
Shreveport $169 $57 1,235 $8.3
Monroe $62 $21 455 $3.1
Northshore $83 $28 602 $4.1
Statewide Total $1,096 $372 8,008 $54.0 Source: Author and RIMS Multipliers (U.S. Bureau of Economic Analysis), 2015 and 2016
Impact of Hospital Capital Expenditures by Congressional District Table 7 on the next page illustrates the economic impacts of hospital capital expenditures in 2015 and 2016 on the various Congressional Districts. Capital spending by hospitals in District 1 created and supported almost 2,000 jobs and close to 1,700 jobs in District 2.
Hospitals and the Louisiana Economy, 2017-18
12
Table 7. Economic Impact of Capital Expenditures ($ in Millions)
Congressional District
Business Transactions
Annual Payroll
Jobs Created and Supported
State and Local Tax Collections
District 1 Steve Scalise
$268 $91 1,953 $13.2
District 2 Cedric Richmond
$227 $77 1,659 $11.2
District 3 Clay Higgins
$170 $58 1,243 $8.4
District 4 Mike Johnson
$182 $62 1,333 $9.0
District 5 Ralph Abraham
$115 $39 841 $5.6
District 6 Garret Graves
$134 $45 979 $6.6
Statewide Total $1,096 $372 8,008 $54.0 Source: Author and RIMS Multipliers (U.S. Bureau of Economic Analysis), 2015 and 2016
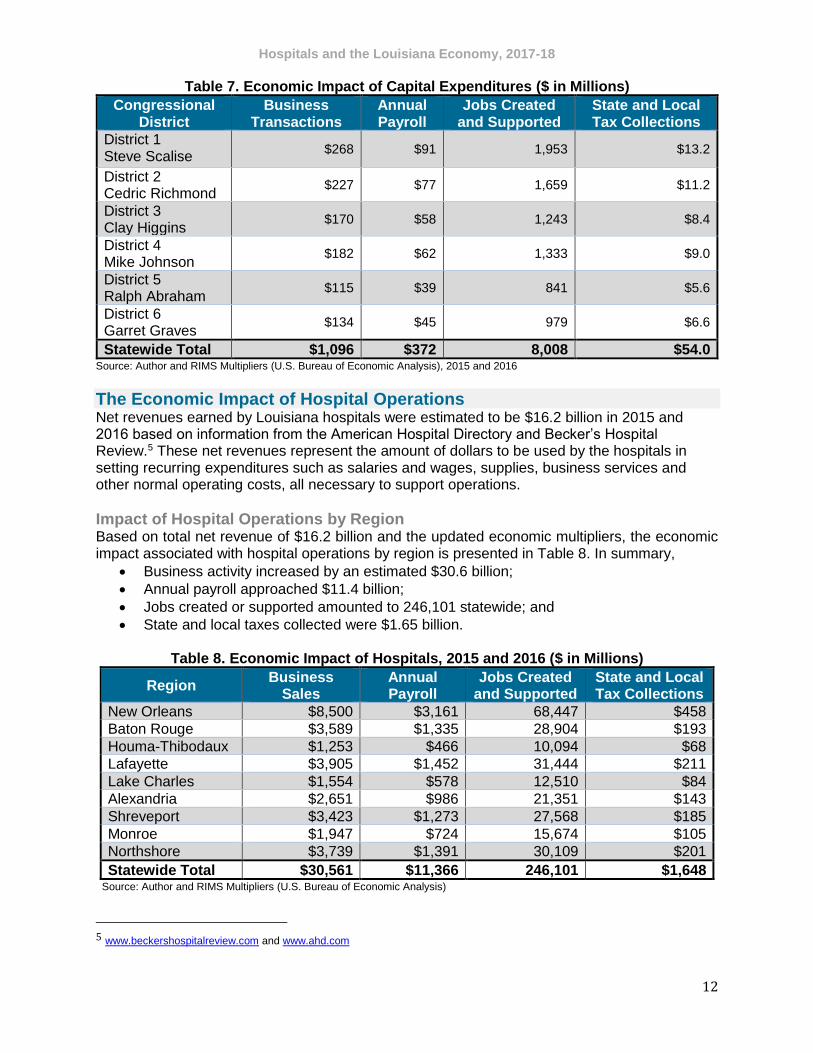
The Economic Impact of Hospital Operations Net revenues earned by Louisiana hospitals were estimated to be $16.2 billion in 2015 and 2016 based on information from the American Hospital Directory and Becker’s Hospital Review.5 These net revenues represent the amount of dollars to be used by the hospitals in setting recurring expenditures such as salaries and wages, supplies, business services and other normal operating costs, all necessary to support operations.
Impact of Hospital Operations by Region Based on total net revenue of $16.2 billion and the updated economic multipliers, the economic impact associated with hospital operations by region is presented in Table 8. In summary,
• Business activity increased by an estimated $30.6 billion;
• Annual payroll approached $11.4 billion;
• Jobs created or supported amounted to 246,101 statewide; and
• State and local taxes collected were $1.65 billion.
Table 8. Economic Impact of Hospitals, 2015 and 2016 ($ in Millions)
Region Business
Sales Annual Payroll
Jobs Created and Supported
State and Local Tax Collections
New Orleans $8,500 $3,161 68,447 $458
Baton Rouge $3,589 $1,335 28,904 $193
Houma-Thibodaux $1,253 $466 10,094 $68
Lafayette $3,905 $1,452 31,444 $211
Lake Charles $1,554 $578 12,510 $84
Alexandria $2,651 $986 21,351 $143
Shreveport $3,423 $1,273 27,568 $185
Monroe $1,947 $724 15,674 $105
Northshore $3,739 $1,391 30,109 $201
Statewide Total $30,561 $11,366 246,101 $1,648 Source: Author and RIMS Multipliers (U.S. Bureau of Economic Analysis)
Jobs created and supported across various industries as a result of the economic impact of hospital operations include:
• Almost 195,000 jobs in personal and business services;
• More than 25,000 jobs in retail and wholesale trade;
• More than 11,000 jobs combined for other industries, including construction, manufacturing, and even agricultural activities;
• Approximately 10,000 jobs in transportation and utilities; and
• 5,000 jobs in financial services.
Most of the jobs are in personal and business services, since this is the category in which healthcare services are placed. State and local taxes are collected throughout the state with the New Orleans area collecting the most state and local taxes from hospital activity, while Baton Rouge, Lafayette and the Northshore secure approximately the same amount of state and local tax collections.
Impact of Hospital Operations by Congressional District The economic impact of hospitals spans across the six Congressional Districts in Louisiana as illustrated in Table 9. All Congressional Districts have a relatively large number of jobs being created and supported by the hospitals inside the districts but based on the concentration of hospitals, the largest number of employment-related to the activity is in Districts 1 and 2.
Table 9. Economic Impact of Hospitals
Congressional District
Jobs Created and Supported
Annual Payroll (in Millions)
District 1, Steve Scalise 47,553 $2,196
District 2, Cedric Richmond 47,301 $2,185
District 3, Clay Higgins 39,178 $1,810
District 4, Mike Johnson 28,887 $1,334
District 5, Ralph Abraham 40,908 $1,889
District 6, Garret Graves 42,273 $1,953
Statewide Total 246,101 $11,367 Source: Author and RIMS Multipliers (U.S. Bureau of Economic Analysis), 2015 and 2016 combined
Hospital Revenue Sources and the Medicaid Program Hospitals receive revenue from insurance companies and other private payors, government insurance programs such as Medicare and Medicaid, and self-payments from individual patients. Some individuals do not carry insurance, cannot afford insurance, and do not qualify for Medicare or Medicaid. Some hospitals in Louisiana receive payments from the state to care for the indigent or uninsured. Louisiana provides disproportionate share hospital (DSH) payments to hospitals to partially fund the cost of indigent care; however, as part of the ACA, DSH payments will gradually be reduced as hospitals treat fewer indigent patients under expansion. Hospitals are required by the Emergency Medical Treatment & Labor Act (EMTALA) to ensure public access to emergency services regardless of the individual’s ability to pay. EMTALA imposes specific obligations on Medicare-participating hospitals that offer emergency services to provide a medical screening examination when a request is made for examination or treatment for an emergency medical condition, including active labor. Any unreimbursed costs for services are either absorbed by the hospital or ultimately shifted to other payors through higher negotiated reimbursement rates for medical services.
Hospitals and the Louisiana Economy, 2017-18
14
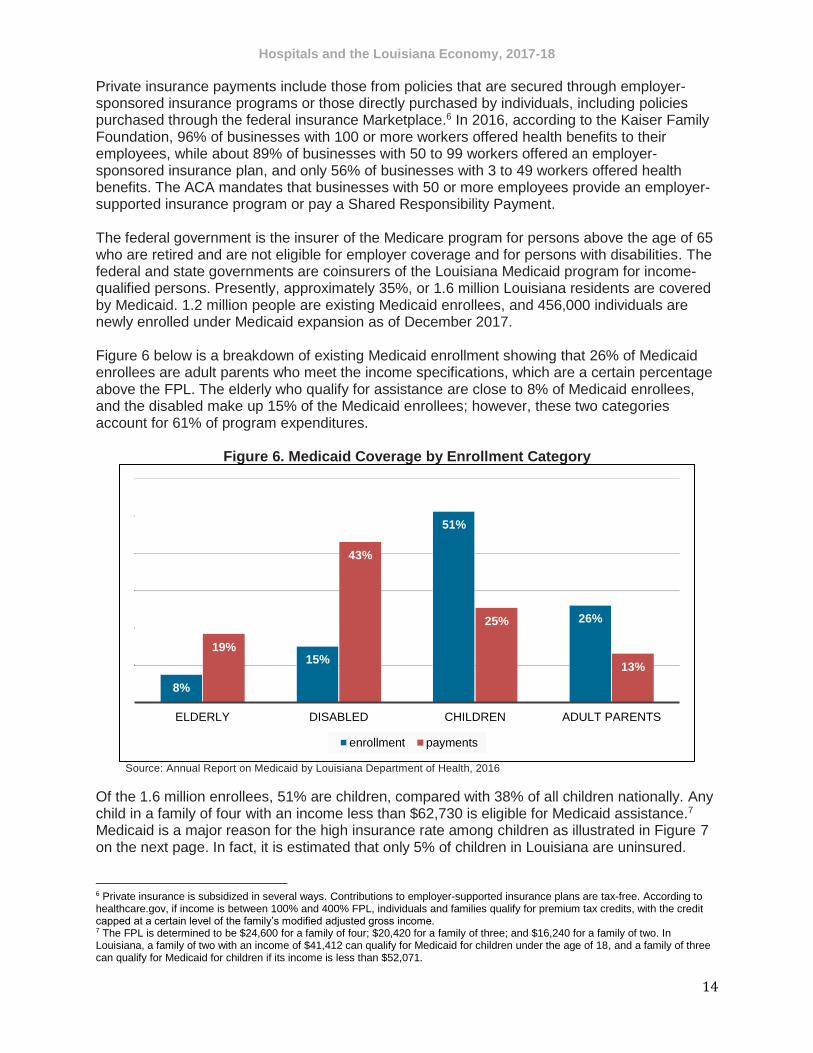
Private insurance payments include those from policies that are secured through employer-sponsored insurance programs or those directly purchased by individuals, including policies purchased through the federal insurance Marketplace.6 In 2016, according to the Kaiser Family Foundation, 96% of businesses with 100 or more workers offered health benefits to their employees, while about 89% of businesses with 50 to 99 workers offered an employer-sponsored insurance plan, and only 56% of businesses with 3 to 49 workers offered health benefits. The ACA mandates that businesses with 50 or more employees provide an employer-supported insurance program or pay a Shared Responsibility Payment. The federal government is the insurer of the Medicare program for persons above the age of 65 who are retired and are not eligible for employer coverage and for persons with disabilities. The federal and state governments are coinsurers of the Louisiana Medicaid program for income-qualified persons. Presently, approximately 35%, or 1.6 million Louisiana residents are covered by Medicaid. 1.2 million people are existing Medicaid enrollees, and 456,000 individuals are newly enrolled under Medicaid expansion as of December 2017. Figure 6 below is a breakdown of existing Medicaid enrollment showing that 26% of Medicaid enrollees are adult parents who meet the income specifications, which are a certain percentage above the FPL. The elderly who qualify for assistance are close to 8% of Medicaid enrollees, and the disabled make up 15% of the Medicaid enrollees; however, these two categories account for 61% of program expenditures.
Figure 6. Medicaid Coverage by Enrollment Category
Source: Annual Report on Medicaid by Louisiana Department of Health, 2016
Of the 1.6 million enrollees, 51% are children, compared with 38% of all children nationally. Any child in a family of four with an income less than $62,730 is eligible for Medicaid assistance.7 Medicaid is a major reason for the high insurance rate among children as illustrated in Figure 7 on the next page. In fact, it is estimated that only 5% of children in Louisiana are uninsured.
6 Private insurance is subsidized in several ways. Contributions to employer-supported insurance plans are tax-free. According to healthcare.gov, if income is between 100% and 400% FPL, individuals and families qualify for premium tax credits, with the credit capped at a certain level of the family’s modified adjusted gross income. 7 The FPL is determined to be $24,600 for a family of four; $20,420 for a family of three; and $16,240 for a family of two. In Louisiana, a family of two with an income of $41,412 can qualify for Medicaid for children under the age of 18, and a family of three can qualify for Medicaid for children if its income is less than $52,071.
8%
15%
51%
26%
19%
43%
25%
13%
ELDERLY DISABLED CHILDREN ADULT PARENTS
enrollment payments
Hospitals and the Louisiana Economy, 2017-18
15
Figure 7. Healthcare Coverage of Children, 2016
Source: Kaiser Family Foundation, Health Insurance Coverage of Children 0-18, 2016
Hospital Revenue Payor Mix Hospital net revenues come from private insurance, Medicare, Medicaid, and self-payment with the division of these revenues for hospitals being illustrated in Figure 8. In Louisiana, Medicare is by far the largest component of revenues received by hospitals, with 2015 and 2016 Medicare revenues representing 47% of revenues. Private insurance accounted for 31% in 2015 and 27% in 2016. Medicaid accounted for 15% in 2015 and up to 20% in 2016. Self-pay and other patient revenue declined by 1% between years. Medicaid expansion was implemented in July 2016, with only six months of data reflected in Figure 8. Figures below indicate a decline in both commercial and uninsured categories and an increase in Medicaid; however, further study is necessary to determine whether the shift is a direct effect of Medicaid expansion or if other state economic factors contributed to the change.
Figure 8. Louisiana Hospital Revenue by Source
Source: Louisiana Health Information Network
37%
5%
50%
5%3%
49%
6%
38%
5%2%
EMPLOYER NON-GROUP MEDICAID UNINSURED OTHER
LA U.S.
31%
47%
15%
7%
27%
47%
20%
6%
0% 5% 10% 15% 20% 25% 30% 35% 40% 45% 50%
Private
Medicare
Medicaid
Other
2016 2015
Hospitals and the Louisiana Economy, 2017-18
16
Impact of Medicaid Expansion By expanding Medicaid to cover low-income adults, it is estimated that Louisiana has gained $1.9 billion in federal support. The new net federal outlay being spent in the state supports an additional 23,000 jobs with an estimated payroll of $1 billion and state and local tax collections of approximately $115 million. This impact extends beyond the healthcare sector benefitting the economy statewide. Medicaid expansion under the ACA allows for a reduced state FMAP for non-elderly adults below 138% of the FPL, gradually increasing annually to a state FMAP of 10% effective in 2020. In 2016, the federal government paid 100% of the expenses associated with Medicaid expansion with the FMAP gradually moving to a 90:10 ratio. As of December 2017, more than 456,000 non-elderly Louisiana residents had insurance coverage because of Medicaid expansion.
Direct State Support In state fiscal year 2017, in addition to the impacts on the economy in the form of earnings and tax collections, hospitals were responsible for more than $560 million in direct financial support to the Medicaid program through inter-governmental transfers, certified public expenditures, lease payments, and the hospital assessment. Through this support, the state was able to draw down approximately $1.3 billion in additional federal Medicaid funding.
Summary and Conclusions The healthcare sector in our state, including hospitals and other healthcare facilities, provides a range of healthcare services to the residents of Louisiana. In providing these services, the industry becomes an important economic force within the communities and around the state. Almost 299,000 individuals, with an estimated payroll approaching $12.8 billion, work for 13,414 healthcare establishments with more than 60 of these establishments having 500 or more employees. In addition, the healthcare sector accounts for approximately 16% of the state’s private payroll. Hospitals alone account for more than 104,000 employees with an annual payroll of $5.6 billion. Between daily operations and one-time capital expenditures, Louisiana hospitals created and supported more than 254,000 jobs with an annual payroll of more than $11.7 billion and $1.7 billion in net state and local tax receipts. Hospitals generate economic activity because of the magnitude of capital expenditures, including payroll and construction activity. Hospitals engaged in construction projects for 2015 and 2016 averaged annual capital expenditures on building and building improvements of approximately $557 million. This construction activity led to the creation and support of more than 8,000 jobs within the state, only half of which were directly in the construction industry; about one-third of these jobs were related to services including wholesale and retail trade and the business and personal services sector. Because of this construction activity, the state and local governments collected about $54 million in new taxes—that is, tax dollars that otherwise would not have been available. These jobs and additional tax collections last only as long as the construction activity; however, there will always be construction activity in the hospital industry as there will always be demand for medical services.
Hospitals and the Louisiana Economy, 2017-18
17
Hospitals are continuous enterprises with estimated total operational expenditures of $16.2 billion per year. This substantial economic input leads to the creation and support of more than 246,000 jobs in the Louisiana economy with an annual payroll of more than $11 billion. These jobs include direct hospital jobs and jobs in other industries, such as retail and financial services necessary to serve hospitals and their employees. The overall economic impact also generates $1.65 billion in state and local tax collections. These jobs and state and local tax receipts are spread around the state with the following approximate distribution:
• New Orleans: 68,447 jobs and $458.4 million in state and local tax receipts;
• Baton Rouge: 28,904 jobs and $193.6 million in state and local tax receipts;
• Houma-Thibodaux: 10,094 jobs and $67.6 million in state and local tax receipts;
• Lafayette: 31,444 jobs and $210.6 million in state and local tax receipts;
• Lake Charles: 12,510 jobs and $83.8 million in state and local tax receipts;
• Alexandria: 21,351 jobs and $143.0 million in state and local tax receipts;
• Shreveport: 27,568 jobs and $184.6 million in state and local tax receipts;
• Monroe: 15,674 jobs and $105.0 million in state and local tax receipts; and
• Northshore: 30,109 jobs and $201.6 million in state and local tax receipts. Hospitals serve first and foremost the healthcare needs of the community and they also provide a significant economic impact for local communities and the state in terms of their capital investment and ongoing business activities as suggested by the number of jobs created and supported. The economic benefits of the hospital industry extend far beyond the doors of the hospitals and the people directly employed by these facilities. Louisiana hospitals not only play a critical role in supporting the health of our residents, but also in fostering a vibrant economy.
Hospitals and the Louisiana Economy, 2017-18
18
Economic Summary by LDH Region Region 1: New Orleans Because of the newly-constructed University Medical Center and the Southeast Louisiana Veterans Healthcare System, New Orleans has the potential to develop a Medical District similar to those in Birmingham or Memphis. The two facilities serve as anchors of this area, with space to expand medical facilities, office space for physicians, and other medically-related businesses as well non-medical offices, businesses, and housing further cultivating the development of this area. The New Orleans area has:
• Almost 59,000 healthcare employees;
• The economic benefit from construction projects alone generated $383 million in business transactions, created and supported 2,803 jobs with a payroll of $131 million, and led to the collection of $18.9 million in state and local taxes;
• The economic benefit from ongoing hospital operations generated $8.5 billion in business sales, created and supported 68,447 jobs with an annual payroll of $3.1 billion; and led to the collection of $458 million in state and local taxes, the most of any region in the state.
Region 2: Baton Rouge The new Baton Rouge Health District includes major hospitals and research facilities providing medical services, education and scientific research, resulting in economic benefits to the Baton Rouge region and beyond. The relatively common location of health services in Baton Rouge has enabled the formation of this district, attracting medical consumers; increasing competition for grants, private-industry contracts and other funding; and generating new product development. The Baton Rouge region has:
• 48,000 healthcare employees;
• The economic benefit from construction projects alone generated $130 million in business transactions, created and supported 950 jobs with a payroll of $44 million, and led to the collection of $6.4 million in state and local taxes;
• The economic benefit from ongoing hospital operations generated $3.6 billion in business sales, created and supported 28,904 jobs with an annual payroll of $1.3 billion; and led to the collection of $193 million in state and local taxes.
Region 3: Houma-Thibodaux The Houma-Thibodaux area has:
• 17,555 healthcare employees;
• The economic benefit from construction projects alone generated $54 million in business transactions, created and supported 395 jobs with a payroll of $18 million, and led to the collection of $2.7 million in state and local taxes;
• The economic benefit from ongoing hospital operations generated $1.2 billion in business sales, created and supported 10,094 jobs with an annual payroll of $466 million; and led to the collection of $68 million in state and local taxes.
Region 4: Lafayette
• 38,725 healthcare employees;
• The economic benefit from construction projects alone generated $122 million in business transactions, created and supported 891 jobs with a payroll of $41 million, and led to the collection of $6 million in state and local taxes;
• The economic benefit from ongoing hospital operations generated $3.9 billion in business sales, created and supported 31,444 jobs with an annual payroll of $1.4 billion; and led to the collection of $211 million in state and local taxes.
Hospitals and the Louisiana Economy, 2017-18
19
Region 5: Lake Charles 17,765 healthcare employees; The economic benefit from construction projects alone generated $46 million in business
transactions, created and supported 334 jobs with a payroll of $16 million, and led to the collection of $2.2 million in state and local taxes;
The economic benefit from ongoing hospital operations generated $1.5 billion in business sales, created and supported 12,510 jobs with an annual payroll of $578 million; and led to the collection of $84 million in state and local taxes.
Region 6: Alexandria 22,463 healthcare employees; The economic benefit from construction projects alone generated $47 million in business
transactions, created and supported 343 jobs with a payroll of $16 million, and led to the collection of $2.3 million in state and local taxes;
The economic benefit from ongoing hospital operations generated $2.6 billion in business sales, created and supported 21,351 jobs with an annual payroll of $986 million; and led to the collection of $143 million in state and local taxes.
Region 7: Shreveport 40,291 healthcare employees; The economic benefit from construction projects alone generated $169 million in business
transactions, created and supported 1,235 jobs with a payroll of $57 million, and led to the collection of $8.3 million in state and local taxes;
The economic benefit from ongoing hospital operations generated $3.4 billion in business sales, created and supported 27,568 jobs with an annual payroll of $1.3 billion; and led to the collection of $185 million in state and local taxes.
Region 8: Monroe 26,470 healthcare employees; The economic benefit from construction projects alone generated $62 million in business
transactions, created and supported 455 jobs with a payroll of $21 million, and led to the collection of $3.1 million in state and local taxes;
The economic benefit from ongoing hospital operations generated $1.9 billion in business sales, created and supported 15,674 jobs with an annual payroll of $724 million; and led to the collection of $105 million in state and local taxes.
Region 9: Northshore 29,176 healthcare employees; The economic benefit from construction projects alone generated $83 million in business
transactions, created and supported 602 jobs with a payroll of $28 million, and led to the collections of $4.1 million in state and local taxes;
The economic benefit from ongoing hospital operations generated $3.7 billion in business sales, created and supported 30,109 jobs with an annual payroll of $1.4 billion; and led to the collection of $201 million in state and local taxes.
Hospitals and the Louisiana Economy, 2017-18
20
Summary by Congressional District
In Congressional Districts 1, 3, 4 and 5, the healthcare sector has the most employees of any industry. In these four districts, healthcare employment makes up almost 20% of all private employment.
District 1, Steve Scalise
• 55,734 individuals work in healthcare, with an estimated 20,109 of those employed by hospitals or 36% of the healthcare workforce.
• Through construction projects in 2015 and 2016, approximately 1,954 additional jobs were created and supported with a payroll of $91 million, and more than $13 million in new state and local taxes were collected.
• Ongoing hospital operations created and supported 47,553 jobs with an annual payroll of $2.2 billion.
District 2, Cedric Richmond
• 36,773 individuals work in healthcare, with an estimated 20,002 of those employed by hospitals or 54% of the healthcare workforce. The only industry that employed more was leisure/hospitality.
• Through construction projects in 2015 and 2016, approximately 1,659 additional jobs were created and supported with a payroll of $77 million, and more than $11 million in new state and local taxes were collected.
• Ongoing hospital operations created and supported 47,301 jobs with an annual payroll of $2.2 billion.
District 3, Clay Higgins
• 50,707 individuals work in healthcare, with an estimated 16,567 of those employed by hospitals or 33% of the healthcare workforce.
• Through construction projects in 2015 and 2016, approximately 1,243 additional jobs were created and supported with a payroll of $58 million, and more than $8 million in new state and local taxes were collected.
• Ongoing hospital operations created and supported 39,178 jobs with an annual payroll of $1.8 billion.
District 4, Mike Johnson
• 45,916 individuals work in healthcare, with an estimated 12,216 of those employed by hospitals or 27% of the healthcare workforce.
• Through construction projects in 2015 and 2016, approximately 1,333 additional jobs were created and supported with a payroll of $62 million, and more than $9 million in new state and local taxes were collected.
• Ongoing hospital operations created and supported 28,887 jobs with an annual payroll of $1.3 billion.
Hospitals and the Louisiana Economy, 2017-18
21
District 5, Ralph Abraham
• 55,114 individuals work in healthcare, with an estimated 17,299 of those employed by hospitals or 31% of the healthcare workforce.
• Through construction projects in 2015 and 2016, approximately 841 additional jobs were created and supported with a payroll of $39 million, and more than $5.7 million in new state and local taxes were collected.
• Ongoing hospital operations created and supported 40,908 jobs with an annual payroll of $1.9 billion.
District 6, Garret Graves
• 44,921 individuals work in healthcare, with an estimated 17,876 of those employed by hospitals or 40% of the healthcare workforce. The only two industries that employed more people were the construction industry with 58,288 employees and the retail-trade industry with 48,118.
• Through construction projects in 2015 and 2016, approximately 979 additional jobs were created and supported with a payroll of $45.5 million, and more than $6.6 million in new state and local taxes were collected.
• Ongoing hospital operations created and supported 42,273 jobs with an annual payroll of $1.9 billion.