Page 1/27 Time to First Optimal Glycemic Control and its Predictors Among Type 1 Diabetic Children<15 Years in Bahir Dar City Public Referral Hospitals, North West Ethiopia: A Retrospective Follow Up Study Fentahun Meseret ( [email protected]) Haramaya University Amare Belachew Bahir Dar University Getasew Tesfa Bahir Dar University Teshale Mengesh Dire Dawa University Tsegasew Embiale Dire Dawa University Ayichew Alemu Haramaya University Melsew Dagne Woldia University Research Article Keywords: type 1 diabetes mellitus, First optimal glycemic control, Time, children, Ethiopia Posted Date: November 3rd, 2021 DOI: https://doi.org/10.21203/rs.3.rs-982922/v1 License: This work is licensed under a Creative Commons Attribution 4.0 International License. Read Full License
Transcript
Page 1/27
Time to First Optimal Glycemic Control and its Predictors AmongType 1 Diabetic Children<15 Years in Bahir Dar City Public ReferralHospitals, North West Ethiopia: A Retrospective Follow Up StudyFentahun Meseret ( [email protected] )
Haramaya UniversityAmare Belachew
Bahir Dar UniversityGetasew Tesfa
Bahir Dar UniversityTeshale Mengesh
Dire Dawa UniversityTsegasew Embiale
Dire Dawa UniversityAyichew Alemu
Haramaya UniversityMelsew Dagne
Woldia University
Research Article
Keywords: type 1 diabetes mellitus, First optimal glycemic control, Time, children, Ethiopia
Posted Date: November 3rd, 2021
DOI: https://doi.org/10.21203/rs.3.rs-982922/v1
License: This work is licensed under a Creative Commons Attribution 4.0 International License. Read Full License
AbstractBackground: Recognizing the level of glycemic control of a client is an important predictor of the development of complication and riskof death from diabetes. However, the other most important predictor which is the time that the patient stayed in that poor glycemic levelbefore reaching optimal glycemic control has not been studied so far.
Objective: The aim of this study was to estimate time to �rst optimal glycemic control and identify predictors among type 1 diabeticchildren<15 years in Bahir Dar city public referral hospitals, Northwest, Ethiopia, 2021
Methods: Retrospective cohort study was conducted at Bahir Dar city public referral hospitals among randomly selected sample of 385patients with type 1 diabetes who were on follow up from January1, 2016 to February30, 2021.Data were collected by using dataabstraction tool and then entered into Epi-data version 4.2 and exported into STATA 14.0 statistical software. Descriptive statistics,Kaplan Meier plots and median survival times, Log-rank test and Cox-proportional hazard regression were used for analysis. Afterperforming Cox-proportional hazard regression, model goodness-of-�t and assumptions were checked. Finally, association betweenindependent variables and time to �rst optimal glycemic control in months were assessed using multivariable Cox Proportional Hazardmodel and Variables with p-value < 0.05 were considered as statistically signi�cant.
Result: Median survival time to �rst optimal glycemic control among type 1 diabetic client was 8 months (95%CI: 6.9-8.9).First optimalglycemic achievement rate was 8.2(95%CI: 7.2-9.2) per 100 person/month observation. Factors that affect time to �rst optimal glycemiccontrol were age (AHR=0.32;95%CI=0.19-0.55),weight(AHR=0.96;95%CI=0.94-0.99),primary care giver(AHR=2.09;95%CI=1.39-3.13),insulin dose (AHR=1.05;95%CI=1.03-1.08),duration of diabetes (AHR=0.64;95%CI=0.44-0.94), adherence (AHR=9.72;95%CI=6.09-15.51),carbohydrate counting(AHR=2.43;95%CI=1.12-5.26),and comorbidity (AHR=0.72;95%CI=0.53-0.98).
Conclusion and Recommendation: The median survival time to �rst optimal glycemic control in this study was long. Age, weight,primary care giver, insulin dose, duration of diabetes, adherence, and carbohydrate counting including history of comorbidity weredeterminant factors. Therefore, clinicians should advice weight reduction, increase the dose of insulin during initial treatment, counseltheir parents about adherence of insulin drug and auditing their children diet as prescription helps to reduce the length of glycemiccontrol.
IntroductionDiabetes mellitus(DM) is a serious, chronic and progressive disease that occurs either when the pancreas does not produce enoughinsulin or the body can not properly use the insulin it produces(1).There are three classi�cation of diabetes mellitus commonly acceptedby different scholars(1, 2).These are: type one diabetes mellitus( T1DM) ,type two diabetes mellitus( T2DM) and gestationaldiabetes(3).According to American diabetic association(ADA) type one is the commonest type in pediatrics age categories(2).
Type 1 diabetes also known as insulin dependent, juvenile or child hood onset DM which is characterized by de�cient insulin productionin the body(1). It encompasses a group of metabolic disease causing in hyperglycemia(2). Juvenile diabetes is currently not preventablebut we can control and prevent its complication. Otherwise, uncontrolled diabetes over time may lead to a serious damage to the heart,blood vessels, eyes, kidneys and nerves(1–5) .
A patient indicating any of the following can diagnosed as having diabetes based on ADA and international society of pediatrics andadolescent diabetes(ISPAD): fasting blood glucose(FBG) ≥126 mg/dL (11.1mmol/L), poly symptoms of diabetes plus random bloodsugar ≥200 mg/ (7 mmol/L) or 2 hour plasma glucose during glucose tolerance test. ≥200 mg/ (7 mmol/L) and glycosylated/glycated(Hb A1) ≥6.5 %.(2, 6).
Glycemic control is a level of glucose in diabetic clients(1);Glycemic control followed by the diagnosis was re�ected by optimal and poormetabolic control as mean HbA1c <7.5% and >7.5% respectively and /or average FBG level between 80-150mg/dl and either < 80 or >150mg/dl respectively(6–8, 80) and HbA1c can be calculated from the following formula, if HBA1c is not consistently available for some ofthe clients; estimated average glucose level in (mg/dl)=28.7*HbA1c-46.7(8).
Diabetes mellitus pandemic have become one of the largest global health emergencies among non-communicable disease in thiscentury(3). In many countries, over 500 000 children < 15 years old are diagnosed with T1DM(4, 6–8)with an average incidence of 3–4%per year worldwide(6, 7).This increment is also noted more alarmingly in developing countries(9, 10–14).
Page 3/27
Although there are a lots of advanced management of T1DM,more than 70% of them were unable to maintain their glycaemia(10, 11).More over noncompliance rate escalating 50% that highlights the need for focusing on timely optimal glycemic control(10). Manychildren had also suffered from T1DM which is associated with high morbidity, mortality rate and most of the time the poor has beenhighly affecting by this disease (9, 15, 16). Both In developed and developing nations the prognosis of children with T1DM is poor (14).As a result, optimal glycemic control were oscillating from 2.6–39.1%(11, 15, 17). Many are not detected and those diagnosed havedramatically reduced their life expectancy by one year,(17–19). Poor glycemic control was much higher among type one patients(82.9%)as compared with type two diabetics(57.7%)(14, 20, 21).
A varieties of factors that predict glucose control in children with T1DM have documented (7, 18–22).High proportion of patients withuncontrolled glycemic level were due to sociodemographic factors, concomitant disease, personal and other clinical factors (16, 17, 23);health care system with limited resources, lack of trained health personnel and in ability of the patient or family to use and affordtreatment expenditures (10, 24).
Uncontrolled glycemic situation results complication which can hurt many parts of the body including growth failure later in time(3, 22–24). As a result, both acute and chronic complications were reported in different studies(24).Adverse effects like lipodystrophy is one ofthe clinical complication which may occur related to insulin injection and leads to insulin absorption problems, which ultimately canhinder �rst optimal glycemic control(25, 26).The most common complication prior in three months were hypoglycemia(21-42%) followedby 31.5%-39% of diabetic keto acidosis(DKA),10.5%-32.9% of nephropathy,13.6%of neuropathy,10.5% of convulsion,10.3% of retinopathy(27–29). Sustained abnormal blood sugar �uctuation for periods of greater than two months can also contribute to high burden of thedisease, hospitalization and negative consequences of disease out comes(30, 32).
Similarly, study in Ethiopia highlights the di�culty of achieving glycemic control early in time. As a result, early occurrence of bothretinopathy and maculopathy among diabetic children were reported(13). Another study In Ethiopia speci�cally in Gojjam, also indicates58.5% DKA among 354 T1DM children with the incidence rate of 2.27/100 children/month of observation.(31).
However, strict glycemic control minimizes the incidence and progression of such possible complication(14–17).The Diabetes Controland Complication Trial (DCCT) and the follow-up study Epidemiology of Diabetes Interventions and Complications (EDIC) shows that,good glycemic control with in short duration delays the development of both acute and chronic complication in T1DM patients by 35-76% (9).Novel treatment are emerging to manage T1DM with the ultimate goal being to achieve glycemic control, limit weight gain,reduce comorbidities and improve quality of life(7).T1DM treatment is based on frequent monitoring of blood glucose andadministration of insulin, in line with their meal and exercise(33–35).It was recommended that T1DM children should check their bloodglucose at least four times a day(6).And which expected to bring 26.2% satisfactory glycemic control level (7, 35).People with diabetescan live longer and have a healthy life if their diabetes is become aware of early and well-managed by multidisciplinary approach withthe allocation of accessible resources(10, 36, 37).Being updated about the recent diabetes care can also help in improving �rst glycemiccontrol (15, 38).
In Ethiopia a little studies were conducted to recognize level of glycemic control among type one diabetic children(16).However, the othermost important parameter, which is the time, in which, the patient stayed on that poor glycemic level before reaching optimal glycemiccontrol has not studied so far. If efforts are not made to recognize the contributing factors for optimal glycemic control with possibletime frame, the number of children affected will preserve growing and this in turn lead to an emotional and economical burden on boththe clients and the families at large(6).And it will also disturb the sustainability of our health care system which is still over burdenedwith communicable diseases.
Therefore, this study was aimed to estimate time to �rst optimal glycemic control among type 1 diabetic children in Bahir Dar city publicreferral hospitals, Northwest, Ethiopia.
Methods And Materials
Study area and periodThe study was conducted in Bahir Dar city; located 565Km far from Addis Ababa, the capital city of Ethiopia, at Amhara nationalregional state, North West Ethiopia. In Bahir Dar city there are two public referral hospitals, one primary hospitals, ten health center andfour private hospitals. And this study was conducted in the two public referral hospitals, namely: Felege Hiwot comprehensivespecialized referral hospital (FHCSH) and Tibebe Ghion specialized teaching hospital (TGSTH). Each of this hospital can be expected to
Page 4/27
serve for more than 10 million populations coming from Bahir Dar city, west Gojjam zone, east Gojam zone, awi zone, north and southwollo zones, south& north Gondar zones, partial part of Benshangul Gumuz and Oromia region. FHCSH has currently a total of 1431man power in each discipline with 500 formal beds, 11 wards, 39 clinical and non-clinical departments /service unit / providingDiagnostic, curative, Rehabilitation and preventive service at outpatient &inpatient based. Similarly TGSTH is a teaching hospital underBahir Dar University College of medicine and health sciences that has 459 bed capacity and with around 14 outpatient departments.
Apart from other services both referral hospitals provide diabetic treatment services by nurse practitioners, pediatrics residents andpediatricians.
The study period address from1stJanuary, 2016 to February 30 /2021.
Study designAn institution based retrospective follow up study was employed.
Source populationThe source population were all type 1 diabetes mellitus children<15 years old who had follow up at diabetes clinic of the two referralhospitals.
Study population
The study population were all type 1 diabetes mellitus children <15 years old who were on follow up during the study period.
Study unit
All type one diabetic children’s chart that were selected randomly for investigation.
Inclusion criteriaChildren age less than 15 years old and diagnosed with T1DM with regular follow up and had at least one HbA1c and/or a three monthconsecutive measurements of fasting blood sugar (FBS) with clear date of diagnosis between January 1/2016 to February 30/2021were included.
Exclusion criteriaChildren’s medical record/chart with incomplete information (such as HbA1c/average FBG and other relevant predictors like age withdate of diagnosis, sex, treatment modality, frequency of follow up visit and last visit health condition of the children), those having lessthan 3 month follow up during the study period and those cases transferred in with unclear date of diagnosis from other institution wereexcluded from the study.
Sample size determinationSample size was determined by double proportion formula after taking of predictors associated to optimal glycemic control fromprevious study conducted by retrospective cohort design (50)with the help of epi info version 7 by considering the following statisticalassumptions: 95% Con�dence Interval (CI), power 80%,percent of outcome in unexposed group 8.93%,risk ratio 0.253, marginal error 5%(50) .The calculated total sample size is 378, then by adding 10% for data incompleteness from the client chart, the �nal sample sizebecame 416.
Sampling technique and procedure
Page 5/27
The study participants were selected from the registration book. The medical records of children who were on follow up with type onediabetes mellitus from January 2016 to February 2021 were selected. A total of 721 children were recorded from the registration book ofthe two referral hospitals (sampling frame). Of which 416 cards were sampled using a simple random sampling technique by acomputer generating method. Finally, cards that ful�lled the criteria were reviewed.
Dependent variablesTime to �rst optimal glycemic control
Independent variables
Socio demographic (age, gender, Residence); Institutional related variable (frequency of clinic visit); Diabetic related variables (durationof diabetes, diabetes related complication.); Comorbidities (preceding infections and other pathology) and treatment related variables(insulin therapy and adherence, noncompliance and other self-monitoring practice)
Age of the participants, frequency of glycemic control, body mass index and duration of diabetes were categorized in to groups in orderto alien with the other literatures(36,40,50)
Operational de�nitionsOptimal glycemic control: Optimal glycemic control is de�ned as the three consecutive month HbA1c <7.5% and/or average FBG of 80–150 mg/dl with more or less stringent glycemic goals for individual clients based on age/life expectancy, comorbid condition, advancedcomplication, hypoglycemia unawareness and individual patient considerations (6- 8,80).
Event: Achieving �rst optimal glycemic control during the study period
Survival time: The time starting from date of diagnosis to �rst optimal glycemic control was determined for each participant
Censoring: Patients died, lost to follow up, transferee out, and complete the follow up period without achieving optimal glycemic control
Time to event: Time between diagnosis up to achieving �rst optimal glycemic control or censoring with measure of interest in month
Carbohydrate counting: Practicing healthy diet at home by non-re�ned carbohydrate utilization and eating consistent amount of foodregularly with application of food pyramid as a meal planning tool to optimize blood sugar level (35).
Data collection procedureThe data were collected from patients chart that visit Felege Hiwot comprehensive specialized referral hospital and Tibebe Ghionspecialized teaching hospital. Data that were relevant to measure the association between times to �rst optimal glycemic control amongdiabetic children were collected by two BSc nurses supervised by one senior nurse having second degree in public health.
Patient records were retrieved using their medical registration number identi�ed in the total DM case load in the logbook of registrationfollow up form. Then medical registration number (MRN) of all diabetic pediatric patient were sorted. After that, the sample selectionmechanism was simple random sampling technique, in which each of the patients had equal chance of being selected to be part ofstudy.
A structured data extraction tool adapted by considering study variables such as socio demographic, personal and clinical predictorsfrom patients’ charts.
Data quality assuranceTraining was given for data collectors and supervisors about the objective and process of data collection by the principal investigator.Pretest was done on 5 % of sample size. Then pretested data abstraction tool/check list that comprises of questions to measure therelevant variables were used to collect the necessary data from the patient medical chart by those trained data collectors. Data quality
Page 6/27
was also assured by designing proper data abstraction tool and through continuous supervision. All collected data were checked forcompleteness and clarity.
Data processing and statistical analysisThe collected data was coded, enter, cleaned and stored into Epi-data version 3.1 and exported into STATA 14.0 statistical software foranalysis. Descriptive statistics were presented with frequency tables, Kaplan Meier (KM) plots and median survival times. Months areused as a time scale to calculate time to �rst optimal glycemic control. The outcome of each participant was dichotomized in tocensured or event (�rst optimal glycemic control)
Kaplan-Meier technique was used to measure survival experience of diverse groups of patients by using survival curves. Log-rank testwas used to assess signi�cant difference among survival distributions of groups for equality. After performing the Cox-proportionalhazard regression, model goodness-of-�t was checked by Cox Snell residuals & assumptions was checked by using Shen�eld residualtest and graphically by using log minus log function survival curves.
Bivariable analysis was performed to calculate crud hazard ratio (CHR) and to screen out potentially signi�cant independent variables atp value < 0.25 level of signi�cance.
Association between the signi�cant independent variables and the time to �rst optimal glycemic control was assessed usingmultivariable Cox Proportional Hazard (PH) model.
Adjusted hazard ratio (AHR) and 95% CI for HR were used to test signi�cance and interpretation of results.
Variables with p-value < 0.05 were considered as statistically associated with the time to �rst optimal glycemic control in months.
Ethical considerationsEthical clearance was obtained from the institutional review board (IRB) of Bahir Dar University (IRB number 01-008).Written supportiveletter was taken from pediatrics department of the hospitals on behalf of the patients. This study had no any danger or negativeconsequences for the study participants. Medical record numbers were used for the data collection and personal identi�ers of the clientwere not used in this research report. Access to collected information was limited to the principal investigator and con�dentiality hadpreserved throughout the time.
Results
Socio demographic characteristicswith censuring and event status Four hundred sixteen (416) medical records were reviewed; off which, thirty one (7.5%) cases were excluded from the study due topertinent data being missing. As a result, 385 clients were included in the study which is 92.5% in response rate.
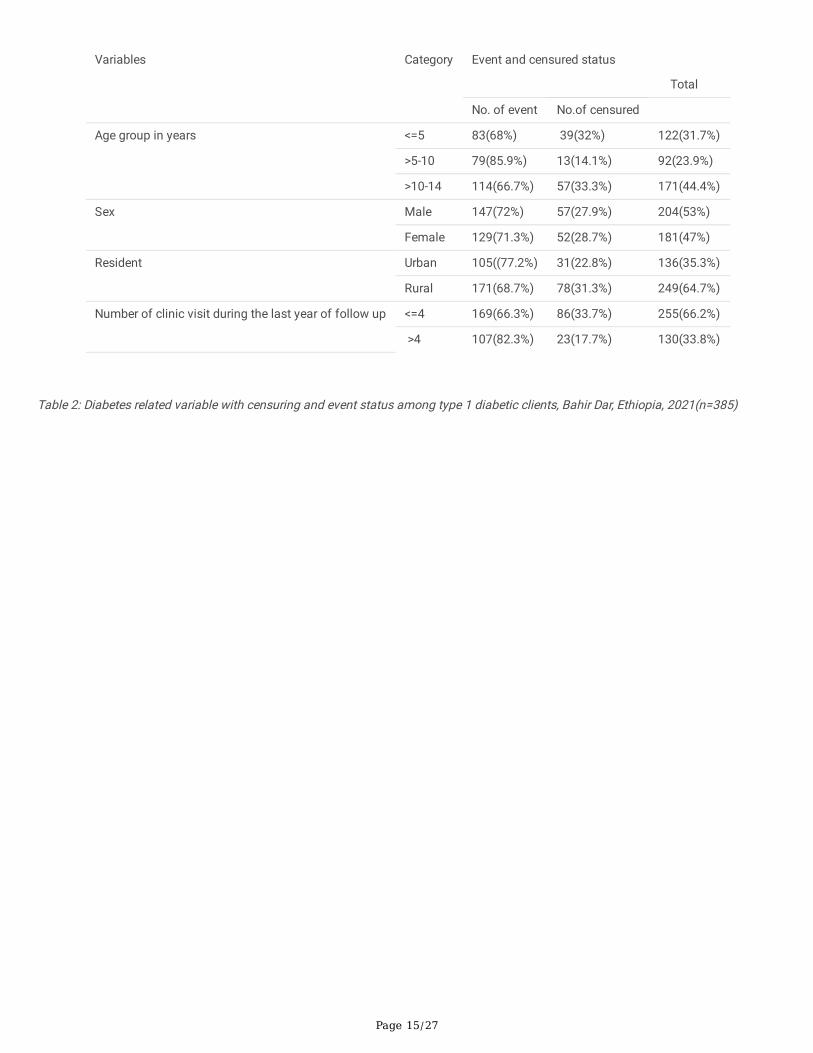
Mean age of the study participant was 8.2±4.7 years with 2.4 years mean duration of diabetes.
More than half of the patients were male (53%) and proportion of �rst optimal glycemic achievement among male is (72%) which isalmost proximal to female (71.3%).
Majority of the patients (64.7%) were from rural area. However, the Proportion of patients who achieved �rst optimal glycemic controlamong rural is (68.7%) which is lower than clients from urban area residents (77.2%).
Those clients having >4 clinical visit for the last year of their follow up had higher proportional glycemic control (82.3%) than clientshaving clinical visit <=4(663%). (Table 2).
Median survival time to �rst optimal glycemic controlThe estimated median survival time to achieve �rst glycemic control was 8 months with inter quartile range of (6.9-8.9).
Page 7/27
The median survival time to �rst optimal glycemic control among type one diabetic children were varied by various categories ofpredictors. For example, the median survival time to achieve �rst optimal glycemic control among under 5 children was 6.8 where as inabove 5-10 and >10-14 years was 8, 8.5 respectively. (Table 5).
Incidence rate of optimal glycemic achievement rateFrom 385 study participants, 276(71.7%) of the clients have achieved glycemic control with mean value of FBG&HA1c (112±3mg/dl,5.6%) respectively; whereas 109(28.3%) were censored. The lowest and the highest length of follow up were 2.9 and 36.4 monthsrespectively, and the total person-time risk was 3373 months.
The overall �rst optimal glycemic control rate was 8.2(95%CI: 7.2-9.7) per 100 person/month observation. Optimal glycemicachievement rate among male and female children with type 1 diabetes was 7.9(95%CI: 6.7-9.3) per 100 person/month and 8.4(95%CI:7.1-10.0) per 100 person/month observation respectively which is nearly comparable in both sex.
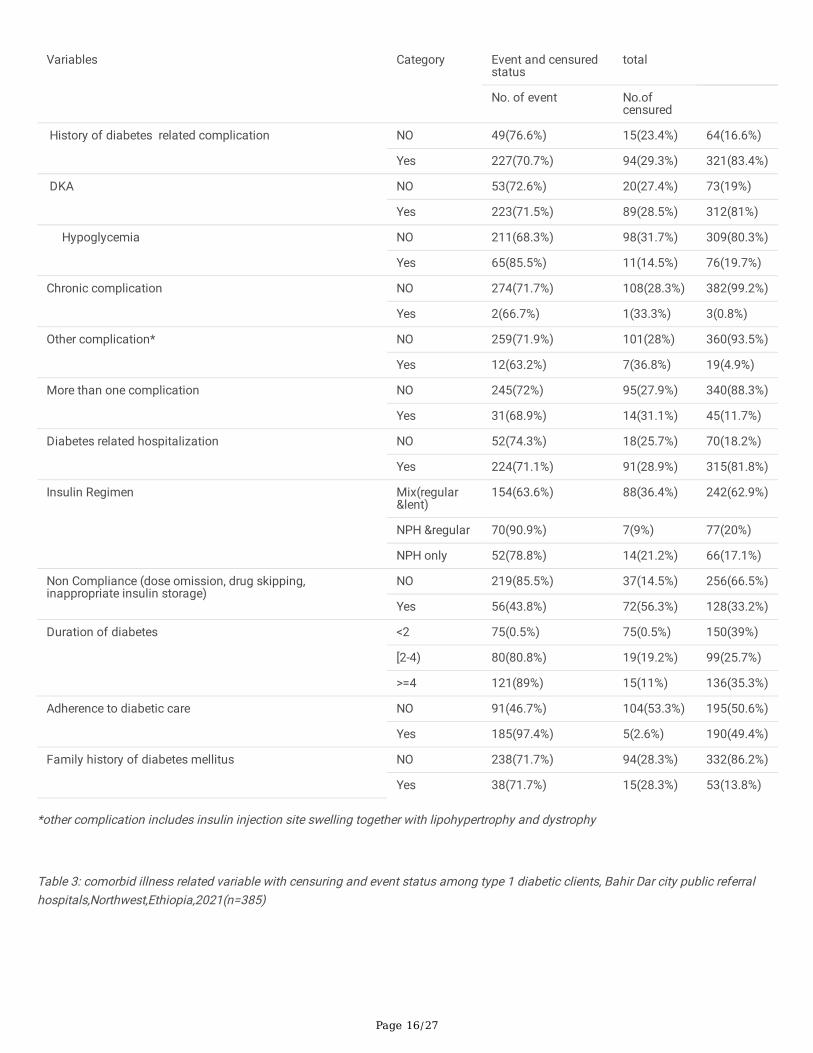
Diabetes related variableswith censuring and event statusConcerning complication, 83.4% of the patients had history of one or more diabetes related complication .Majority of the clients haddiabetic keto acidosis (DKA) (81%) including the episodes at the time of diagnosis followed by hypoglycemia (19.7%), othercomplication (4.9%) and chronic complication (0.8%). The proportion of patients who achieved optimal glycemic control is relativelyhigher among those with no history of diabetes related complication (76.6%) as compared to those with history of complication(70.7%).Mixed insulin (lent ®ular) drugs had given for the majority of the patients (62.9%) during the initiation of treatment ascompared to other regimens like NPH with regular and NPH alone (20%, 17.1%) respectively. (Table 3).
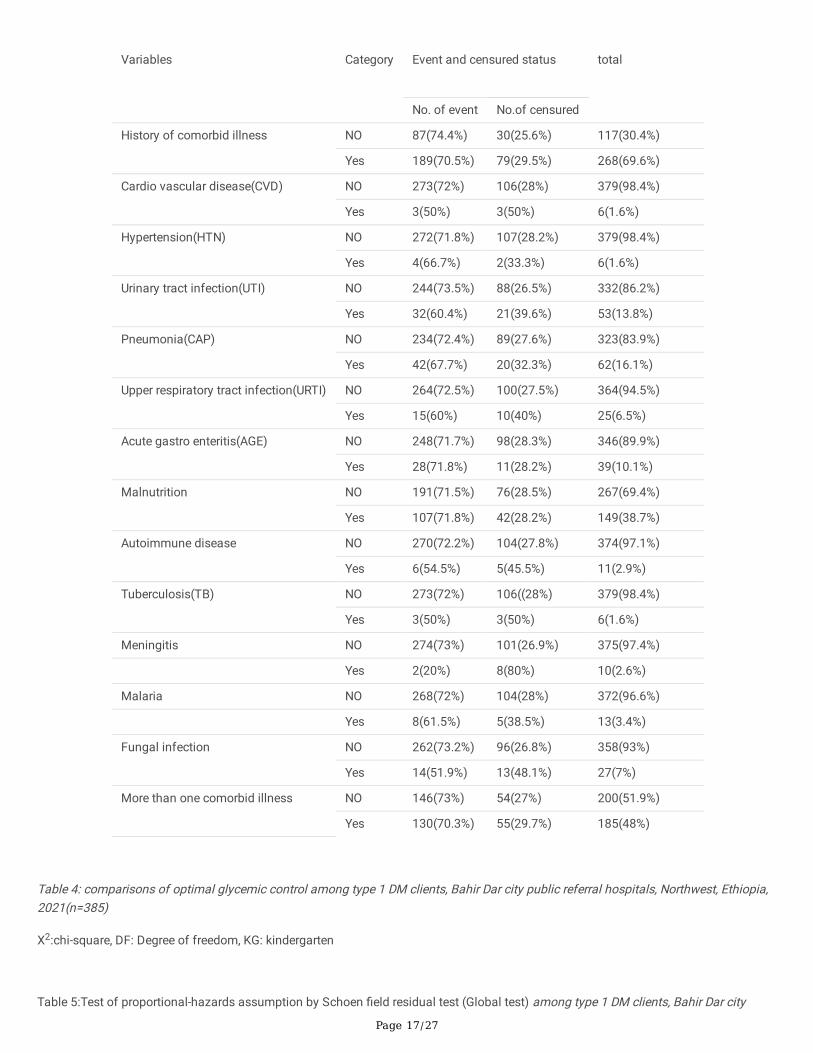
Comorbidity related variableswith censuring and event statusIn regard to comorbidity, 69.6% of the patients had history of comorbid illness and only 30.4% of them didn’t have recognized history ofcomorbid illness. Majority of the clients had malnutrition (38.7%) followed by pneumonia (16.1%), urinary tract infection (13.8%), acutegastro enteritis (10.1%), fungal infection (7%) and upper respiratory tract infection (6.5%).Nearly half (48%) of the patients had morethan one comorbid illness. The proportion of clients who achieved �rst optimal glycemic control is higher among those with no historyof comorbid illness (74.4%) than those with one or more comorbid illness (70.5%). (Table 4).
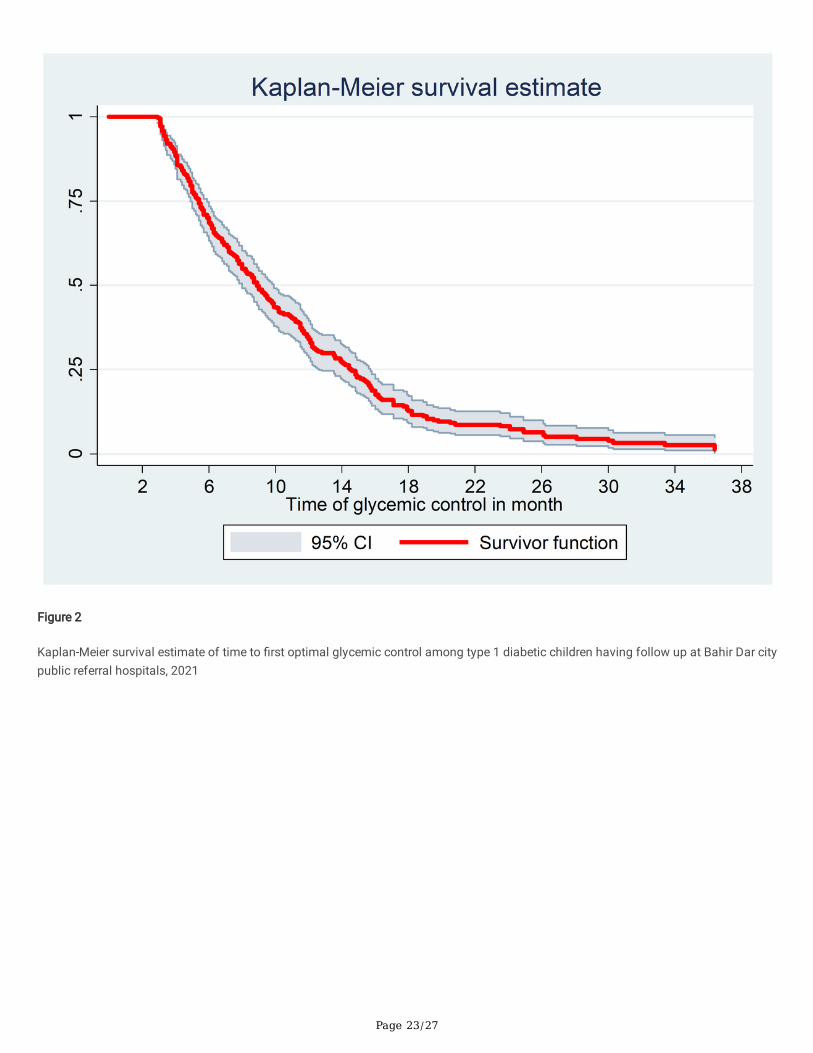
Survival estimates for time to �rst optimal glycemic controlThe survival status of children with type 1 diabetes was estimated by the Kaplan-Meier survival curve.
The curve tends to decrease rapidly with in the �rst one year indicating that most children achieved �rst optimal glycemic control withinthis time (Figure 2).
The survival estimates of clients were varied in relation to different predictors. (Figure 3).
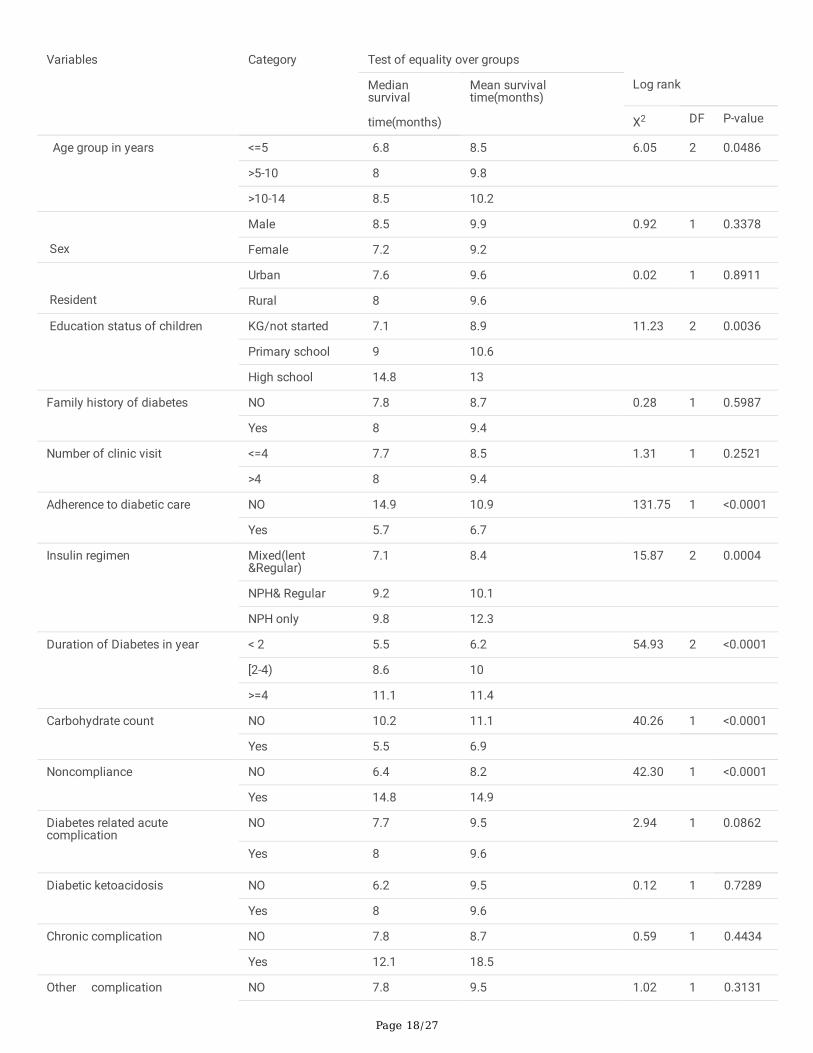
Comparison of survival experienceThe long rank test was used to assess differences in equality of survival distribution among diverse groups. The median survival time toachieve �rst optimal glycemic control among clients in the age groups of <=5 years showed shorter median time to achieve �rst optimalglycemic control (6.8 months) as compared with patients whose age group between 6-10 years (8months) and 11-14 years (8.5months).and the survival time was signi�cantly different among the age groups(X2(2)) = 6.05, P-value = 0.0486).whereas, the mediansurvival time to achieve �rst optimal glycemic control among male participant showed relatively longer time (8.5 months) than females(7.2 months).But the long rank test was not statistically signi�cant(X2(1))=0.92,p-value=0.3378). (Table 5).
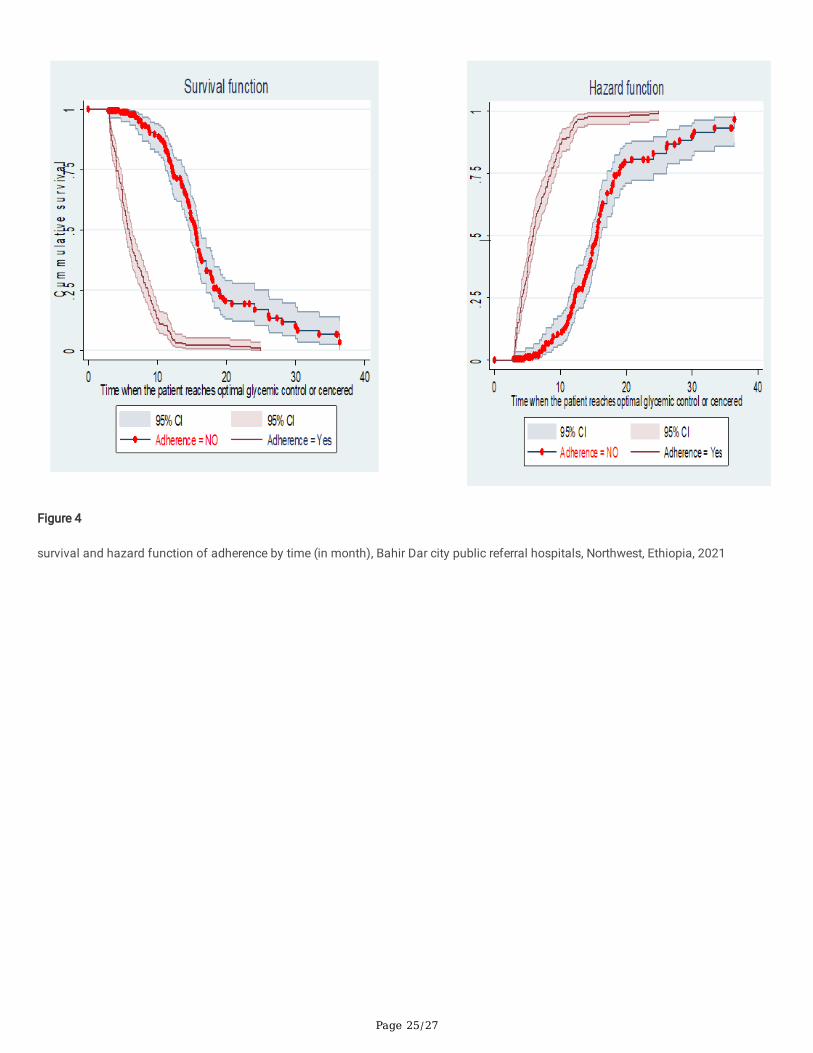
Regarding adherence, those clients who adhere to the management had shorter duration of time (5.7 months) to achieve �rst optimalglycemic control than those who didn’t adhere towards the management of the disease(14.9 months).The long rank test was
Page 8/27
statistically signi�cant(X2(1)) = 131.75, P-value <0.0001). The Kaplan Meier survival function showed that, clients with adherencehave satisfactory survival experience by achieving their glycemic targets early in time. The �gure also showed that, clients direct chanceof achieving �rst optimal glycemic control increases for both group as the duration of treatment increases. (Figure 4).
Those patients having comorbid illness appears to extend time to �rst optimal glycemic control. The median survival time to achieveoptimal glycemic control was shorter among patients with no history comorbid illness (6.3 months) than patients who had comorbidillness (8.9 months) with statistical signi�cant difference among the group (X2(1)) = 10.85, P-value = 0.0010). (Table 5).
However, no statistically signi�cance difference were shown for sex, residence, family history of diabetes militias ,number of clinic visit,DKA as presentation and being malnourished in determining time to �rst optimal glycemic control. (Table 5 & Table 6).
Results of multivariable cox proportional hazard model Goodness of �t checked by cox Snell residuals by plotting cox Snell residual against the cumulative hazard function. As a residualsfollow unit of exponential distribution or a linear line through the origin with a unit gradient, which indicates a well �tted model to theobserved data point and expected value. (Figure 5).
Proportional assumption of cox proportional hazard model was tested by using Schoen �eld residual test and graphically by using logminus log function on Stata version 14.2 (Table 6& Fig 6).The survival curve looks like parallel throughout the study time; which showsequitable �tting to the proportional hazard assumption.(Figure 6).
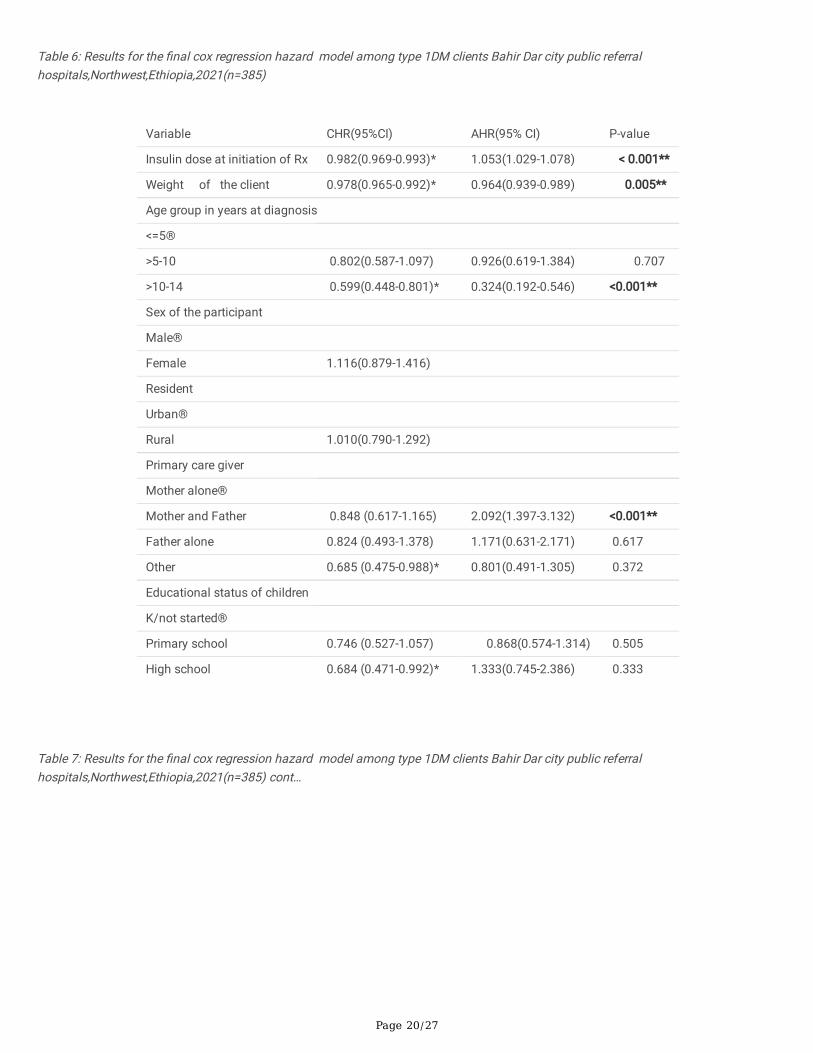
The independent variables such as age client educational status, primary care giver, dose of insulin at initiating of treatment, duration ofdiabetes, �rst insulin regimen, current insulin regimen, frequency of glycemic control, carbohydrate count, exercise, noncompliance,adherence, diabetes related acute complication, having history of comorbidity were signi�cantly associated with time to �rst optimalglycemic control at the point less than 0.25 level of signi�cance from bivariable analysis. However, only age, duration of DM, dose ofinsulin at initiating of treatment, weight, primary care giver, adherence to DM care, carbohydrate counting and history of comorbiditywere found to be signi�cantly associated with time to �rst optimal glycemic control in the multivariable cox regression hazard modelless than 5% level of signi�cance.
The presence of interaction among independent variables were checked by multicollinearity test but there was no signi�cant interactionas it was con�rmed by the value of variance in�ation factor (VIF) which is less than ten..
Consequently, after adjusting other predictor, the hazard of achieving optimal glycemic control among the age groups >10-14 years werelower by 67.6% as compared with the age groups of the client<=5 years(AHR=0.324,95%CI=0.192-0.546).
Likewise, the hazard of achieving optimal glycemic control among clients with history of comorbid illness was lower by 24.3% comparedto clients with no history of comorbid illness (AHR= 0.722, 95%CI=0.530-0.981).this means, the time needed to reach optimal glycemiccontrol among clients with history of comorbid illness was signi�cantly longer compared with clients with no history of comorbid illness.
However, the rate of achieving �rst optimal glycemic control among clients who adhered to diabetic care had 9.7 times increment thanclients who didn’t adhered to diabetic management (AHR=9.723, 95%CI=6.094-15.513). (Table 6).
DiscussionThe aim of this study was to identify predictors of time to optimal glycemic control in Ethiopia. The estimated median survival time toachieve �rst glycemic control was 8 months with inter quartile range of (6.9-8.9).The �nding in this study is in line with another studyconducted among type 1 diabetic children in united states (38) but a little bit shorter than previous study conducted inEthiopia(9.5months) (3).This could be due to differences in age pattern, type of diabetes and comorbidity among study participants(28,31, 47, 49, 50, 55, 57–60).
The overall �rst optimal glycemic control rate was 8.2(95%CI: 7.2-9.7) per 100 person/month observation.The �nding related to overallincidence rate to achieve glycemic target in this study is less than other studies conducted in Kenya (28%),Jordan (20.9%), Saudi Arabia(39.1%), and California( 33%)(39, 40, 50, 51) but greater than a study done in Tanzania(2.6%)(26).This discrepancy can be due todifferences in population characteristics, sample size, study methodology and overall health care system including resourceallocation(10, 16, 17, 23, 24, 52).
Page 9/27
In regard to predictors, the age of the participant was found to be signi�cantly associated variables that determine time to �rst optimalglycemic control. The study showed that, the time needed to reach �rst optimal glycemic control is longer among clients of age group>10-14 years followed by the age group 6-10 years compared to clients in the age group<=5 years(AHR=0.324,95%CI=0.192-0.546),indicating that for children older than 10 years, the rate of achieving optimal glycemic control decreases as age increases which is in linewith study done in Tanzania ,Bulgaria, Iraq, Taiwan and Jordan (26, 46, 47, 49, 50). This can be due to the fact that As a child develops,he/she under goes a varieties of physical and life style changes(24). In addition to this, it can be also due to hormonal effect at pubertalage of the child and decline in parental supervision over different clinical aspects of diabetic care in the adolescents(46, 50).
Weight of the client also signi�cantly associated with time to �rst optimal glycemic control. Rate of glycemic achievement decreases by3.6% as weight increase by one unit which means the weight of the client is 0.964 times less likely associated with optimal glycemicachievement rate. This could be due to, weight gain may contribute to increased insulin resistance and cardio metabolic risk such asincreased dyslipidemia and blood pressure(62).It is in line with another controlled study among T1DM patients which stated previouslyas “normal weight preschool children have better glycemic control than age matched overweight children (63, 64).’’It can signi�cantlyimplies that, body weight status may impede achievement of glycemic targets with in the expected time in this group of patients.Therefore, having regular exercise which is non-strenuous can be encouraged. The recommendation is supported by the studyconducted in United Kingdom and the authors of International society of pediatrics and adolescents diabetes (ISPAD) guide line revisedsince 2018 GC (6, 34).
Dose of insulin at initiation of treatment increases �rst optimal glycemic achievement rate by 1.053 times as dose of insulin increasesby one unit. This �nding is supported by the study done in many countries such as India, china, Germany, Austria, and Luxembourg (66–70).
This study also showed that, primary care giver during the follow up period was signi�cantly associated with optimal glycemic control.Especially those clients whose care giver mother and father was two times more likely associated with �rst optimal glycemic control ascompared with clients supported by their mothers alone. The �nding was supported by the study conducted in Tanzania and middle eastJordan(32, 50).
In regard to adherence to diabetic care, those clients with adherence had 9.7 fold of instantaneous chance of increasing their glycemicachievement rate as compared with those clients with no adherence to wards their diabetic management. Which is in line with the studyconducted in Ethiopia entitled with incidence of diabetic keto acidosis and its predictors among type one diabetic children(31).Correspondingly, those clients well adhered to Diet counseling speci�cally on food pyramid and non-re�ned carbohydrate utilizationwere found to have increasing their glycemic achievement rate by 2.4 folds as compared with those clients with no habit of practicinghealthy diet at home and the �nding is in line with the study conducted in Uganda (35, 54, 64).
Duration of diabetes was also signi�cantly associated with time to �rst optimal glycemic control in this study. Those clients living withdiabetes for more than or equal to four years were 35.8% times less likely to achieve optimal glycemic control as compared with clientswho were living with diabetes less than two years. This could be due to age maturation with advancement of the disease following todiabetic duration as it was explained above (24, 46, 50).This �nding is similar with the study done in Tanzania(31) but different withstudy done in cameron(75).
In addition to the above factors, having comorbid illness is another important predictors that can affect time to optimal glycemic control.The rate of achieving optimal glycemic control among clients with history of comorbid illness were 27.8% times less likely as comparedwith clients with no comorbid illness. This is because having comorbid illness has an in�uence on diabetes disease progress withimpairment of glucose metabolism possibly lead to deterioration of glycemic control. Comorbid illness such as infection might alsocause high level of counteracting hormones which triggering an episode of hyperglycemia and could also be due to the effect of takingmany drugs which can lead to drug interaction and also can decrease drug adherence which interferes with drug effectiveness. This�nding is in line with the studies conducted in Saudi Arabia, Brazil and university of California, San Francisco(18, 57–60).
Strength and Limitation of the Study
Strength of the studySince the data were collected from two referral hospitals, the �nding can have more power in regard to generalizability.
Page 10/27
Limitation of the studySince the data were collected from medical records, variables like parental socio economic factors cannot be addressed through cardreview which may affect the outcome of the study.
Fasting blood glucose level (FBG) measurements obtained from medical records might be subjected to measurement errors that lead tounderestimated or overestimated of the result. However, effort was made to overcome this issues by taking the mean value of threemonth consecutive value of FBG measurements.
Conclusion And RecommendationThe median survival time to �rst optimal glycemic control in this study was long compared to other studies. Age, weight, primary caregiver, insulin dose, duration of diabetes, adherence, and carbohydrate counting including history of comorbidity were determinantfactors. Therefore, clinicians should advice weight reduction, increase the dose of insulin during initial treatment, counsel their parentsabout adherence of insulin drug and auditing their children diet as prescription helps to reduce the length of glycemic control.
AbbreviationsADA: American Diabetic Association; BGM: Blood Glucose Monitoring; CGM: Continuous Glucose Monitoring; DCCT: Diabetes Controland Complication Trial; DM: Diabetes Mellitus; EDIC: Epidemiology of Diabetes Interventions and Complications; FBS: Fasting BloodGlucose; HbA1c: Glycated Hemoglobin A1C; IDF: International Diabetic Federation; ISPAD: International Society of Pediatrics andAdolescent Diabetes; NCDs: Non Communicable Diseases; SMBG: Self-Monitoring of Blood Glucose; SSA: Sub Saharan Africa; T1DM:Type 1 Diabetes Mellitus; URTI: Upper Respiratory Tract Infection; WHO: World Health Organization; EMoH: Ethiopian Ministry Of Health
DeclarationsEthical approval and consent to participate
Ethical clearance and approval were obtained from the institutional review board (IRB) of Bahir Dar University (IRB number 01-008).Written supportive letter was taken from pediatrics department of the hospitals on behalf of the patients. This study had no anydanger or negative consequences for the study participants. Medical record numbers were used for the data collection and personalidenti�ers of the client were not used in this research report. Access to collected information was limited to the principal investigator andcon�dentiality had preserved throughout the time.
Consent for publication
Not applicable
Availability of data and materials
Data will be available upon consortium approval.
Competing interests
All authors declared that they have no competing interests.
Funding
For this research the principal investigator (PI) receive grants from Haramaya University as funding agency.
Authors’ contribution
Fentahun Meseret had a substantial contribution from conception to the acquisition of the data. All the authors had a great contributionto the study design, analysis, and interpretation of the �ndings. Fentahun Meseret drafted the manuscript. All authors revised the draftedmanuscript carefully for important intellectual contents. All authors read and approved the �nal manuscript.
Acknowledgment
Page 11/27
Our earnest gratitude goes to institutional review board (IRB) of Bahir Dar University for their proper review and approval of this paper.We are very happy to be in a position to thank to Haramaya University College of medicine and health science for funding
We would like to extend my acknowledgment to Felege Hiwot and Tibebe Ghion specialized hospital staffs for their cooperation whenwe were in need of information related to this research writing.
Our sincere gratitude and appreciation forward data collectors and participants without whom it would not be realized.
Authors’ information
1Haramaya University, college of health and medical science, school of nursing, and Midwifery P.O. Box 235, Harar, Ethiopia. 2BahirdarUniversity, College of Health and Medical Science, School of Allied Health Science, P.O.Box 79, Bahir dar, Ethiopia.
References1. OMS. Global Report on Diabetes. Isbn [Internet]. 2016;978:6–86. Available from:
2. Care D, Suppl SS. Children and adolescents: Standards of medical care in diabetes- 2020. Diabetes Care. 2020;43(January):S163–82. https://doi.org/10.2337/dc20-S013/accessed date 12/172020
3. Leulseged TW, Ayele BT. Time to optimal glycaemic control and prognostic factors among type 2 diabetes mellitus patients inpublic teaching hospitals in Addis Ababa, Ethiopia. PLoS One [Internet]. 2019;14(7):1–12. Available from:http://dx.doi.org/10.1371/journal.pone.0220309
4. Driscoll KA, Johnson SB, Wang Y, Wright N, Deeb LC. Blood Glucose Monitoring Before and After Type 1 Diabetes Clinic Visits. JPediatr Psychol. 2019;44(1):32–9.
5. Cheneke W, Suleman S, Yemane T, Abebe G. Assessment of glycemic control using glycated hemoglobin among diabetic patients inJimma University specialized hospital, Ethiopia. BMC Res Notes. 2016;9(1):1–10.
�. DiMeglio LA, Acerini CL, Codner E, Craig ME, Hofer SE, Pillay K, et al. ISPAD Clinical Practice Consensus Guidelines 2018: Glycemiccontrol targets and glucose monitoring for children, adolescents, and young adults with diabetes. Pediatr Diabetes.2018;19(July):105–14. https://onlinelibrary.wiley.com/doi/full/10.1111/pedi.12737/accessed date12/17/2020
7. Shah AS, Nadeau KJ. The changing face of paediatric diabetes. Diabetologia. 2020;63(4):683–91.
�. Bozkaya G, Ozgu E, Karaca B. The association between estimated average glucose levels and fasting plasma glucose levels.Clinics. 2010;65(11):1077–80.
9. L. N, B. A, W. M, K. P. Determinants of outcome of children with type 1 diabetes in Cameroon. Horm Res Paediatr [Internet].2015;84:185. Available from: http://www.embase.com/search/results?subaction=viewrecord&from=export&id=L72085656%0Ahttp://dx.doi.org/10.1159/000437032
10. Ramírez-Mendoza F, González JE, Gasca E, Camacho M, Cruz M V., Caraveo D, et al. Time in range and HbA1C after 6 months with amultidisciplinary program for children and adolescents with diabetes mellitus, real world data from Mexico City. Pediatr Diabetes.2020;21(1):61–8.
11. Musenge EM, Michelo C, Mudenda B, Manankov A. Glycaemic Control and Associated Self-Management Behaviours in DiabeticOutpatients: A Hospital Based Observation Study in Lusaka, Zambia. J Diabetes Res. 2016;2016.
12. Adamu Y, Garba KM, YAU S, Ya’u J. Glycemic Control and its Predictors among Diabetic Patients Attending a Tertiary Hospital inNigeria: A Retrospective Observational Study. J Biomed Anal. 2020;3(1):13–25.
13. Shibeshi MS, Fantahun B, Kebede T, Tilahun B. Pediatric diabetic retinopathy : experience of a tertiary hospital in Ethiopia. BMC ResNotes. 2016;1–6.
14. Niba LL, Aulinger B, Mbacham WF, Parhofer KG. Predictors of glucose control in children and adolescents with type 1 diabetes:Results of a cross-sectional study in Cameroon. BMC Res Notes. 2017;10(1):1–10.
15. Yazidi M, Chihaoui M, Chaker F, Rjeb O, Slimane H. Factors Predicting Glycemic Control in Type 1 Diabetic Patient. Open Med J.2016;3(1):153–8.
1�. Abebe SM, Berhane Y, Worku A, Alemu S, Mes�n N. Level of sustained Glycemic control and associated factors among patients withdiabetes mellitus in Ethiopia: A hospital-based cross-sectional study. Diabetes, Metab Syndr Obes Targets Ther. 2015;8:65–71.
Page 12/27
17. Gebreyohannes EA, Netere AK, Belachew SA. Glycemic control among diabetic patients in Ethiopia: A systematic review and meta-analysis. PLoS One [Internet]. 2019;14(8):1–14. Available from: http://dx.doi.org/10.1371/journal.pone.0221790
1�. Andrade CS, Ribeiro GS, Santos CAST, Neves RCS, Moreira ED. Factors associated with high levels of glycated haemoglobin inpatients with type 1 diabetes: A multicentre study in Brazil. BMJ Open. 2017;7(12):1–10.
19. Mutyambizi C, Pavlova M, Hongoro C, Groot W. Inequalities and factors associated with adherence to diabetes self-care practicesamongst patients at two public hospitals in Gauteng, South Africa. BMC Endocr Disord. 2020;20(1):1–10.
20. Seth A. Challenges of Achieving an Optimum Glycemic Control in Children with Type 1 Diabetes in India. Indian J Pediatr.2020;87(7):491–2.
21. Kangin M, Talay MN, Tanriverdi Yilmaz S, Unal E, Demiral M, Asena M, et al. A Retrospective Analysis of Children and AdolescentsWith Diabetic Ketoacidosis in the Intensive Care Unıt: Is It Signi�cant that the Blood Ketone Level Becomes Negative in DiabeticKetoacidosis? Cureus. 2020;12(10):1–8.
22. Zurita Cruz JN, Dosta Martínez GE, Villasís Keever MÁ, Rivera Hernández A de J, Garrido Magaña E, Nishimura Meguro E. Pacientespediátricos con diabetes tipo 1: crecimiento y factores asociados con su alteración. Bol Med Hosp Infant Mex. 2016;73(3):174–80.
23. Carneiro VL, Fraiz FC, Ferreira F de M, Pintarelli TP, Oliveira ACB, Boguszewski MC da S. The in�uence of glycemic control on theoral health of children and adolescents with diabetes mellitus type 1. Arch Endocrinol Metab. 2015;59(6):535–40.
24. Smokovski I. Managing Diabetes in Low Income Countries. Manag Diabetes Low Income Ctries. 2021;
25. Tsadik AG, Atey TM, Nedi T, Fantahun B, Feyissa M. Effect of Insulin-Induced Lipodystrophy on Glycemic Control among Childrenand Adolescents with Diabetes in Tikur Anbessa Specialized Hospital, Addis Ababa, Ethiopia. J Diabetes Res. 2018;2018.
2�. Mclarty RP, Alloyce JP, Chitema GG, Msuya LJ. Glycemic control , associated factors , acute complications of Type 1 DiabetesMellitus in children , adolescents and young adults in Tanzania. 2020;(July):1–8.
27. Msanga D, Reis K, Kayange N, Bakalemwa R, Kidenya B, Hau D, et al. Diabetic microvascular complications among children andadolescents in northwestern Tanzania: A cross-sectional study. Ann Glob Heal. 2020;86(1):1–8.
2�. Al-fraik NGS, Abdulrraziq SM, Najem MSM. Demographic and Clinical Characteristics of Type I Diabetes Mellitus at TobruckPediatric Intensive Care Unit. Middle East J Appl Sci. 2020;304–12.
29. Shiferaw WS, Akalu TY, Aynalem YA. Chronic Kidney Disease among Diabetes Patients in Ethiopia: A Systematic Review and Meta-Analysis. Int J Nephrol. 2020;2020.
30. Collin A.Ross. improved a1c readings for diabetic patients who receive feedback via text messaging. j chem inf model.2017;53(9):1689–99.
31. Zeleke H, Murugan R, Wondwossen K. Incidence and predictors of diabetic ketoacidosis among children with diabetes in west andeast gojjam zone referral hospitals north west Ethiopia ,. 2019;
32. Noorani M, Ramaiya K, Manji K. Glycaemic control in type 1 diabetes mellitus among children and adolescents in a resource limitedsetting in Dar es Salaam- Tanzania. BMC Endocr Disord [Internet]. 2016;16(1):1–8. Available from:http://dx.doi.org/10.1186/s12902-016-0113-y
33. Hannonen R, Aunola K, Eklund K, Ahonen T. Maternal parenting styles and glycemic control in children with type 1 diabetes. Int JEnviron Res Public Health. 2019;16(2).
34. Taylor GS, Smith K, Capper TE, Scragg JH, Bashir A, Flatt A, et al. Postexercise glycemic control in type 1 diabetes is associated withresidual b-cell function. Diabetes Care. 2020;43(10):2362–70.
35. Seckold R, Howley P, King BR, Bell K, Smith A, Smart CE. Dietary intake and eating patterns of young children with type 1 diabetesachieving glycemic targets. BMJ Open Diabetes Res Care. 2019;7(1).
3�. Al Zahrani AM, Al Shaikh A. Glycemic Control in Children and Youth With Type 1 Diabetes Mellitus in Saudi Arabia. Clin Med InsightsEndocrinol Diabetes [Internet]. 2019;12. Available from: https://doi.org/10.1177/1179551418825159
37. Karges B, Schwandt A, Heidtmann B, Kordonouri O, Binder E, Schierloh U, et al. Association of insulin pump therapy vs insulininjection therapy with severe hypoglycemia, ketoacidosis, and glycemic control among children, adolescents, and young adults withtype 1 diabetes. JAMA - J Am Med Assoc. 2017;318(14):1358–66.
3�. Patton SR, Noser AE, Youngkin EM, Majidi S, Clements MA, Al PET. Early Initiation of Diabetes Devices Relates to Improved GlycemicControl in Children with Recent-Onset Type 1 Diabetes Mellitus. 2019;21(7):379–84.
39. Hood KK, Ph D. Predictors of deteriorations in diabetes management and control in adolescents with type 1 diabetes.2015;52(1):28–34.
Page 13/27
40. Ngwiri T, Were F, Predieri B, Ngugi P, Iughetti L. Glycemic Control in Kenyan Children and Adolescents with Type 1 Diabetes Mellitus.Int J Endocrinol. 2015;2015.
41. Sarfo-Kantanka O, Sarfo FS, Ansah EO, Eghan B, Ayisi-Boateng NK, Acheamfour-Akowuah E. Secular trends in admissions andmortality rates from diabetes mellitus in the central belt of Ghana: A 31-year review. PLoS One [Internet]. 2016;11(11):1–14.Available from: http://dx.doi.org/10.1371/journal.pone.0165905
42. Uleanya ND, Aniwada EC, Nwokoye IC, Ndu IK, Eke CB. Relationship between Glycemic Levels and Treatment Outcome amongCritically Ill Children admitted into Emergency Room in Enugu. BMC Pediatr. 2017;17(1):1–7.
43. Amos M, Gladys C, Sandeni C, Alfred J, Levina M, Jedeni B, et al. Complications and Glycaemic Control of Type 1 Diabetes Mellitusamongst Children Aged 5 to 19 Years Attending Diabetic Clinic at Kamuzu Central Hospital In Malawi. Int J Diabetes Clin Res.2020;7(1).
44. Teklehaimanot berhane fseha, berhe abadi kidanemariam, welearegawi gebrehiwet gebremariam. Poor glycemic control andassociated factors among diabetic patients in Ethiopia; A Systemic review and meta-analysis. Poor glycemic Control Assoc factorsamong Diabet patients Ethiop A Syst Rev meta-analysis. 2019;19004986.
45. Dumrisilp T, Supornsilchai V, Wacharasindhu S, Aroonparkmongkol S, Sahakitrungruang T. Factors associated with glycemic controlin children and adolescents with type 1 diabetes mellitus at a tertiary-care center in Thailand: A retrospective observational study.Asian Biomed. 2017;11(6):443–50.
4�. Rewers MJ, Pillay K, de Beaufort C, Craig ME, Hanas R, Acerini CL, et al. Assessment and monitoring of glycemic control in childrenand adolescents with diabetes. Pediatr Diabetes. 2014;15(SUPPL.20):102–14.
47. Governorate S. Original Article Factors Affecting Glycemic Control in Type 1 Diabetes Mellitus among. 2019;8(2).
4�. Setoodeh A, Mostafavi F, Rabbani A, Hedayat T. Female Sex as a Risk Factor for Glycemic Control and Complications in IranianPatients with Type One Diabetes Mellitus. 2011;21(3):373–8.
49. Hsiao YT, Cheng WC, Liao WC, Lin CL, Shen TC, Chen WC, et al. Type 1 diabetes and increased risk of subsequent asthma: Anationwide population-based cohort study. Med (United States). 2015;94(36):1–6.
50. Alassaf A, Odeh R, Gharaibeh L, Ibrahim S, Ajlouni K. Personal and clinical predictors of poor metabolic control in children with type1 diabetes in Jordan. J Diabetes Res. 2019;2019:15–8.
51. A AlAgha M, M Majdi W, Aljefri HM, Abdelfattah Ali M, Alagha AE, Abd Elhameed IA, et al. Effect of Parents’ Educational Level andOccupational Status on Child Glycemic Control. J Patient Care. 2017;03(02):2–4.
52. Kajee Z, Harvey J, Zöllner EW. The impact of a diabetes care team on the glycaemic control of paediatric and adolescent patientswith type 1 diabetes mellitus at tygerberg children’s hospital. SAJCH South African J Child Heal. 2019;13(1):12–6.
53. Haynes A, Hermann JM, Clapin H, Hofer SE, Karges B, Jones TW, et al. Decreasing trends in mean HbA1c are not associated withincreasing rates of severe hypoglycemia in children: A longitudinal analysis of two contemporary population-based pediatric type 1diabetes registries from Australia and Germany/Austria between 1995 . Diabetes Care. 2019;42(9):1630–6.
54. Ndahura NB, Munga J, Kimiywe J, Mupere E. Caregivers ’ Nutrition Knowledge and Dietary Intake of Type 1 Diabetic Children Aged 3– 14 Years in Uganda. 2021;127–37.
55. Sildorf SM, Breinegaard N, Lindkvist EB, Tolstrup JS, Boisen KA, Teilmann GK, et al. Poor metabolic control in children andadolescents with type 1 diabetes and psychiatric comorbidity. Diabetes Care. 2018;41(11):2289–96.
5�. Schoenaker DAJM, Simon D, Chaturvedi N, Fuller JH, Soedamah-Muthu SS. Glycemic control and all-cause mortality risk in type 1diabetes patients: The EURODIAB prospective complications study. J Clin Endocrinol Metab. 2014;99(3):800–7.
57. Krzewska A, Ben-Skowronek I. Effect of Associated Autoimmune Diseases on Type 1 Diabetes Mellitus Incidence and MetabolicControl in Children and Adolescents. Biomed Res Int. 2016;2016.
5�. Al-Agha AE, Ala�f M, Abd-Elhameed IA. Glycemic control, Complications, and associated autoimmune diseases in children andadolescents with type 1 diabetes in Jeddah, Saudi Arabia. Saudi Med J. 2015;36(1):26–31.
59. Calliari LE, Almeida FJ, Noronha RM. Infections in children with diabetes. J Pediatr (Rio J). 2020;96:39–46.
�0. Chiang JL, Maahs DM, Garvey KC, Hood KK, Laffel LM, Weinzimer SA, et al. Type 1 Diabetes in Children and Adolescents : A PositionStatement by the American Diabetes Association. 2018;41(September):2026–44.https://care.diabetesjournals.org/content/41/9/2026.article-info/accessed date 12/17/2020
�1. Mbbs SAI, Edin F, Mbbs GA, Bajaj HS, Mb SR. Targets for Glycemic Control Diabetes Canada Clinical Practice Guidelines ExpertCommittee. 2018;42:42–6. https://guidelines.diabetes.ca/cpg/chapter34/accessed date1/162021
Page 14/27
�2. Jaja TC, Yarhere IE. Dyslipidaemia in Nigerian Children and Adolescents with Diabetes Mellitus: Prevalence and Associated RiskFactors. Int J Diabetes Metab. 2019;25(1–2):45–51.
�3. T.R. Nansel, PhD1, L.M. Lipsky, PhD1, and R.J. Iannotti P. Cross-sectional and longitudinal relationships of body mass index withglycemic control in children and adolescents with type 1 diabetes mellitus. 2014;100(1):126–32.
�4. Kerkeni L, Ruano P, Delgado LL, Picco S, Villegas L, Tonelli F, et al. Nutritional Management in Type 1 Diabetes Mellitus. Intech[Internet]. 2016;(tourism):13. Available from: https://www.intechopen.com/books/advanced-biometric-technologies/liveness-detection-in-biometrics
�5. Teni DA, Enquoselassie F, Atsmegiorgis C. Survival analysis of diabetes mellitus patients using parametric , non-parametric andsemi-parametric approaches : Addis Ababa , Ethiopia. Ethiop e-Journal Res Innov Foresight. 2015;7(1):20–39.
��. Wangnoo SK. Initiating insulin therapy in children and adolescents with type 1 diabetes mellitus. Indian J Endocrinol Metab.2015;19(7):S68–70.
�7. Krhač M, Lovrenčić MV. Update on biomarkers of glycemic control. World J Diabetes. 2019;10(1):1–15.
��. Thabit H, Prabhu JN, Mubita W, Fullwood C, Azmi S, Urwin A, et al. Use of Factory-Calibrated Real-time Continuous GlucoseMonitoring Improves Time in Target and HbA1c in a Multiethnic Cohort of Adolescents and Young Adults With Type 1 Diabetes: TheMILLENNIALS Study. Diabetes Care. 2020;43(10):2537–43.
�9. Maiorino MI, Signoriello S, Maio A, Chiodini P, Bellastella G, Scappaticcio L, et al. Effects of continuous glucosemonitoringonmetricsofglycemic control in diabetes: A Systematic Review with Meta-analysis of Randomized Controlled Trials.Diabetes Care. 2020;43(5):1146–56.
70. Klatman EL, Ogle GD. Access to insulin delivery devices and glycated haemoglobin in lower-income countries. World J Diabetes.2020;11(8):358–69.
71. DeSalvo DJ, Miller KM, Hermann JM, Maahs DM, Hofer SE, Clements MA, et al. Continuous glucose monitoring and glycemiccontrol among youth with type 1 diabetes: International comparison from the T1D Exchange and DPV Initiative. Pediatr Diabetes.2018;19(7):1271–5.
72. Zuberi Z, Sauli E, Cun L, Deng J, Li WJ, He XL, et al. Insulin-delivery methods for children and adolescents with type 1 diabetes. TherAdv Endocrinol Metab [Internet]. 2020;11:1–13. Available from: https://doi.org/10.1177/2042018820906016
73. Djonou C, Tankeu AT, Dehayem MY, Tcheutchoua DN, Mbanya JC, Sobngwi E. Glycemic control and correlates in a group of subSaharan type 1 diabetes adolescents. BMC Res Notes [Internet]. 2019;1–5. Available from: https://doi.org/10.1186/s13104-019-4054-1
74. Nuche-Berenguer B, Kupfer LE. Erratum to ‘Readiness of Sub-Saharan Africa Healthcare Systems for the New Pandemic, Diabetes: ASystematic Review’. J Diabetes Res. 2018;2018:3419290.
75. Djonou C, Tankeu AT, Dehayem MY, Tcheutchoua DN, Mbanya JC, Sobngwi E. Glycemic control and correlates in a group of subSaharan type 1 diabetes adolescents 11 Medical and Health Sciences 1117 Public Health and Health Services. BMC Res Notes[Internet]. 2019;12(1):1–5. Available from: https://doi.org/10.1186/s13104-019-4054-1
7�. Taha Z, Eltoum Z, Washi S. Predictors of glucose control in children and adolescents with type 1 diabetes: Results of a cross-sectional study in Khartoum, Sudan. Open Access Maced J Med Sci. 2018;6(11):2035–9.
77. Ganu D. Increasing Incidence and Prevalence of Type 1 Diabetes in Children Under 20 Years of Age between 1999-2019 in Sub-Saharan Africa : A Systematic Review. 2020;3(1):1–8.
7�. Home P, Haddad J, Latif ZA, Soewondo P, Benabbas Y, Litwak L, et al. Comparison of national/regional diabetes guidelines for themanagement of blood glucose control in non-western countries. Diabetes Ther. 2013;4(1):91–102.
79. Hitt JM. Hemoglobin A1C and the Diagnosis of Diabetes and Prediabetes in Children and Adolescents. Hemoglobin A1c DiagnosisDiabetes Prediabetes Child Adolesc. 2014;67 p.
�0. MOH. Guidelines on Clinical and Programmatic Management of Major Non Communicable Diseases. 2016;220. https://extranet.who.int/ncdccs/Data/ETH_D1_National%20NCD%20Guideline/accessed date 12/17/2020
TablesTable 1: sociodemographic and institution related variable with censuring and event status among type 1 diabetic clients, Bahir Dar,Ethiopia, 2021(n=385)
Page 15/27
Variables Category Event and censured status
Total
No. of event No.of censured
Age group in years <=5 83(68%) 39(32%) 122(31.7%)
>5-10 79(85.9%) 13(14.1%) 92(23.9%)
>10-14 114(66.7%) 57(33.3%) 171(44.4%)
Sex Male 147(72%) 57(27.9%) 204(53%)
Female 129(71.3%) 52(28.7%) 181(47%)
Resident Urban 105((77.2%) 31(22.8%) 136(35.3%)
Rural 171(68.7%) 78(31.3%) 249(64.7%)
Number of clinic visit during the last year of follow up <=4 169(66.3%) 86(33.7%) 255(66.2%)
>4 107(82.3%) 23(17.7%) 130(33.8%)
Table 2: Diabetes related variable with censuring and event status among type 1 diabetic clients, Bahir Dar, Ethiopia, 2021(n=385)
Page 16/27
Variables
Category Event and censuredstatus
total
No. of event No.ofcensured
History of diabetes related complication NO 49(76.6%) 15(23.4%) 64(16.6%)
Yes 227(70.7%) 94(29.3%) 321(83.4%)
DKA NO 53(72.6%) 20(27.4%) 73(19%)
Yes 223(71.5%) 89(28.5%) 312(81%)
Hypoglycemia NO 211(68.3%) 98(31.7%) 309(80.3%)
Yes 65(85.5%) 11(14.5%) 76(19.7%)
Chronic complication NO 274(71.7%) 108(28.3%) 382(99.2%)
Yes 2(66.7%) 1(33.3%) 3(0.8%)
Other complication* NO 259(71.9%) 101(28%) 360(93.5%)
Yes 12(63.2%) 7(36.8%) 19(4.9%)
More than one complication NO 245(72%) 95(27.9%) 340(88.3%)
Yes 31(68.9%) 14(31.1%) 45(11.7%)
Diabetes related hospitalization NO 52(74.3%) 18(25.7%) 70(18.2%)
Yes 224(71.1%) 91(28.9%) 315(81.8%)
Insulin Regimen Mix(regular&lent)
154(63.6%) 88(36.4%) 242(62.9%)
NPH ®ular 70(90.9%) 7(9%) 77(20%)
NPH only 52(78.8%) 14(21.2%) 66(17.1%)
Non Compliance (dose omission, drug skipping,inappropriate insulin storage)
NO 219(85.5%) 37(14.5%) 256(66.5%)
Yes 56(43.8%) 72(56.3%) 128(33.2%)
Duration of diabetes <2 75(0.5%) 75(0.5%) 150(39%)
[2-4) 80(80.8%) 19(19.2%) 99(25.7%)
>=4 121(89%) 15(11%) 136(35.3%)
Adherence to diabetic care NO 91(46.7%) 104(53.3%) 195(50.6%)
Yes 185(97.4%) 5(2.6%) 190(49.4%)
Family history of diabetes mellitus NO 238(71.7%) 94(28.3%) 332(86.2%)
Yes 38(71.7%) 15(28.3%) 53(13.8%)
*other complication includes insulin injection site swelling together with lipohypertrophy and dystrophy
Table 3: comorbid illness related variable with censuring and event status among type 1 diabetic clients, Bahir Dar city public referralhospitals,Northwest,Ethiopia,2021(n=385)
Page 17/27
Variables Category Event and censured status
total
No. of event No.of censured
History of comorbid illness
NO 87(74.4%) 30(25.6%) 117(30.4%)
Yes 189(70.5%) 79(29.5%) 268(69.6%)
Cardio vascular disease(CVD)
NO 273(72%) 106(28%) 379(98.4%)
Yes 3(50%) 3(50%) 6(1.6%)
Hypertension(HTN)
NO 272(71.8%) 107(28.2%) 379(98.4%)
Yes 4(66.7%) 2(33.3%) 6(1.6%)
Urinary tract infection(UTI) NO 244(73.5%) 88(26.5%) 332(86.2%)
Yes 32(60.4%) 21(39.6%) 53(13.8%)
Pneumonia(CAP)
NO 234(72.4%) 89(27.6%) 323(83.9%)
Yes 42(67.7%) 20(32.3%) 62(16.1%)
Upper respiratory tract infection(URTI) NO 264(72.5%) 100(27.5%) 364(94.5%)
Yes 15(60%) 10(40%) 25(6.5%)
Acute gastro enteritis(AGE)
NO 248(71.7%) 98(28.3%) 346(89.9%)
Yes 28(71.8%) 11(28.2%) 39(10.1%)
Malnutrition NO 191(71.5%) 76(28.5%) 267(69.4%)
Yes 107(71.8%) 42(28.2%) 149(38.7%)
Autoimmune disease
NO 270(72.2%) 104(27.8%) 374(97.1%)
Yes 6(54.5%) 5(45.5%) 11(2.9%)
Tuberculosis(TB)
NO 273(72%) 106((28%) 379(98.4%)
Yes 3(50%) 3(50%) 6(1.6%)
Meningitis NO 274(73%) 101(26.9%) 375(97.4%)
Yes 2(20%) 8(80%) 10(2.6%)
Malaria NO 268(72%) 104(28%) 372(96.6%)
Yes 8(61.5%) 5(38.5%) 13(3.4%)
Fungal infection
NO 262(73.2%) 96(26.8%) 358(93%)
Yes 14(51.9%) 13(48.1%) 27(7%)
More than one comorbid illness NO 146(73%) 54(27%) 200(51.9%)
Yes 130(70.3%) 55(29.7%) 185(48%)
Table 4: comparisons of optimal glycemic control among type 1 DM clients, Bahir Dar city public referral hospitals, Northwest, Ethiopia,2021(n=385)
X2:chi-square, DF: Degree of freedom, KG: kindergarten
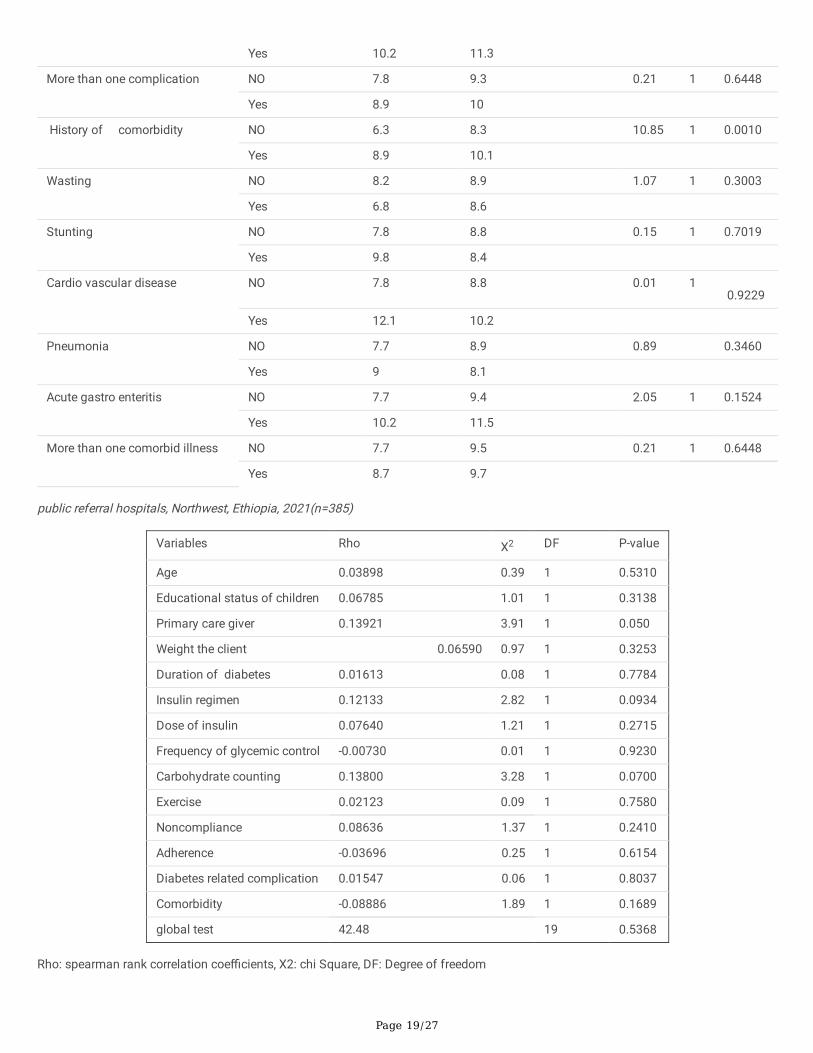
Table 5:Test of proportional-hazards assumption by Schoen �eld residual test (Global test) among type 1 DM clients, Bahir Dar city
Page 18/27
Variables Category Test of equality over groups
Log rankMediansurvival
time(months)
Mean survivaltime(months)
X2 DF P-value
Age group in years
<=5 6.8 8.5 6.05 2 0.0486
>5-10 8 9.8
>10-14 8.5 10.2
Sex
Male 8.5 9.9 0.92 1 0.3378
Female 7.2 9.2
Resident
Urban 7.6 9.6 0.02 1 0.8911
Rural 8 9.6
Education status of children KG/not started 7.1 8.9 11.23 2 0.0036
Primary school 9 10.6
High school 14.8 13
Family history of diabetes NO 7.8 8.7 0.28 1 0.5987
Yes 8 9.4
Number of clinic visit <=4 7.7 8.5 1.31 1 0.2521
>4 8 9.4
Adherence to diabetic care NO 14.9 10.9 131.75 1 <0.0001
Yes 5.7 6.7
Insulin regimen Mixed(lent&Regular)
7.1 8.4 15.87 2 0.0004
NPH& Regular 9.2 10.1
NPH only 9.8 12.3
Duration of Diabetes in year < 2 5.5 6.2 54.93 2 <0.0001
[2-4) 8.6 10
>=4 11.1 11.4
Carbohydrate count NO 10.2 11.1 40.26 1 <0.0001
Yes 5.5 6.9
Noncompliance NO 6.4 8.2 42.30 1 <0.0001
Yes 14.8 14.9
Diabetes related acutecomplication
NO 7.7 9.5 2.94 1 0.0862
Yes 8 9.6
Diabetic ketoacidosis
NO 6.2 9.5 0.12 1 0.7289
Yes 8 9.6
Chronic complication NO 7.8 8.7 0.59 1 0.4434
Yes 12.1 18.5
Other complication NO 7.8 9.5 1.02 1 0.3131
Page 19/27
Yes 10.2 11.3
More than one complication NO 7.8 9.3 0.21 1 0.6448
Yes 8.9 10
History of comorbidity
NO 6.3 8.3 10.85 1 0.0010
Yes 8.9 10.1
Wasting NO 8.2 8.9 1.07 1 0.3003
Yes 6.8 8.6
Stunting NO 7.8 8.8 0.15 1 0.7019
Yes 9.8 8.4
Cardio vascular disease NO 7.8 8.8 0.01 1 0.9229
Yes 12.1 10.2
Pneumonia NO 7.7 8.9 0.89 0.3460
Yes 9 8.1
Acute gastro enteritis
NO 7.7 9.4 2.05 1 0.1524
Yes 10.2 11.5
More than one comorbid illness NO 7.7 9.5 0.21 1 0.6448
Yes 8.7 9.7
public referral hospitals, Northwest, Ethiopia, 2021(n=385)
Variables Rho X2 DF P-value
Age 0.03898 0.39 1 0.5310
Educational status of children 0.06785 1.01 1 0.3138
Primary care giver 0.13921 3.91 1 0.050
Weight the client 0.06590 0.97 1 0.3253
Duration of diabetes 0.01613 0.08 1 0.7784
Insulin regimen 0.12133 2.82 1 0.0934
Dose of insulin 0.07640 1.21 1 0.2715
Frequency of glycemic control -0.00730 0.01 1 0.9230
Carbohydrate counting 0.13800 3.28 1 0.0700
Exercise 0.02123 0.09 1 0.7580
Noncompliance 0.08636 1.37 1 0.2410
Adherence -0.03696 0.25 1 0.6154
Diabetes related complication 0.01547 0.06 1 0.8037
Comorbidity -0.08886 1.89 1 0.1689
global test 42.48 19 0.5368
Rho: spearman rank correlation coe�cients, X2: chi Square, DF: Degree of freedom
Page 20/27
Table 6: Results for the �nal cox regression hazard model among type 1DM clients Bahir Dar city public referralhospitals,Northwest,Ethiopia,2021(n=385)
Variable
CHR(95%CI)
AHR(95% CI)
P-value
Insulin dose at initiation of Rx 0.982(0.969-0.993)* 1.053(1.029-1.078) < 0.001**
Weight of the client 0.978(0.965-0.992)* 0.964(0.939-0.989) 0.005**
Mother and Father 0.848 (0.617-1.165) 2.092(1.397-3.132) <0.001**
Father alone 0.824 (0.493-1.378) 1.171(0.631-2.171) 0.617
Other 0.685 (0.475-0.988)* 0.801(0.491-1.305) 0.372
Educational status of children
K/not started®
Primary school 0.746 (0.527-1.057) 0.868(0.574-1.314) 0.505
High school
0.684 (0.471-0.992)* 1.333(0.745-2.386) 0.333
Table 7: Results for the �nal cox regression hazard model among type 1DM clients Bahir Dar city public referralhospitals,Northwest,Ethiopia,2021(n=385) cont…
CHR=Crud hazard ratio, AHR=Adjusted hazard ratio, Rx=Treatment, ®=Reference group and *&** indicates statistically signi�cantvariable with bivariable& multivariable cox regression hazard model respectively.
Figures
Page 22/27
Figure 1
Time to glycemic control concept map among type 1 diabetic children in Bahir Dar city public referral hospitals,Northwest,Ethiopia,2021;adapted from(,36,40,50,79)
Page 23/27
Figure 2
Kaplan-Meier survival estimate of time to �rst optimal glycemic control among type 1 diabetic children having follow up at Bahir Dar citypublic referral hospitals, 2021
Page 24/27
Figure 3
Kaplan Meier survival estimate for time to optimal glycemic control among type 1 diabetic children with history of comorbidity in BahirDar city public referral hospitals, Northwest, Ethiopia, 2021
Page 25/27
Figure 4
survival and hazard function of adherence by time (in month), Bahir Dar city public referral hospitals, Northwest, Ethiopia, 2021
Page 26/27
Figure 5
Model goodness of �t by cox Snell residual among type 1 DM clients, Bahir Dar city public referral hospitals, Northwest, Ethiopia,2021(n=385)
Figure 6
Page 27/27
log of minus the Log of survival function by comorbidity and carbohydrate count for time to �rst optimal glycemic control among type 1diabetic children, Bahir Dar, 2021