87
Host System Resources Management User Guide Release 9.4 CA Spectrum®
Host System Resources Management User Guide
Release 9.4
CA Spectrum®
This Documentation, which includes embedded help systems and electronically distributed materials, (hereinafter referred to as the “Documentation”) is for your informational purposes only and is subject to change or withdrawal by CA at any time.
This Documentation may not be copied, transferred, reproduced, disclosed, modified or duplicated, in whole or in part, without the prior written consent of CA. This Documentation is confidential and proprietary information of CA and may not be disclosed by you or used for any purpose other than as may be permitted in (i) a separate agreement between you and CA governing your use of the CA software to which the Documentation relates; or (ii) a separate confidentiality agreement between you and CA.
Notwithstanding the foregoing, if you are a licensed user of the software product(s) addressed in the Documentation, you may print or otherwise make available a reasonable number of copies of the Documentation for internal use by you and your employees in connection with that software, provided that all CA copyright notices and legends are affixed to each reproduced copy.
The right to print or otherwise make available copies of the Documentation is limited to the period during which the applicable license for such software remains in full force and effect. Should the license terminate for any reason, it is your responsibility to certify in writing to CA that all copies and partial copies of the Documentation have been returned to CA or destroyed.
TO THE EXTENT PERMITTED BY APPLICABLE LAW, CA PROVIDES THIS DOCUMENTATION “AS IS” WITHOUT WARRANTY OF ANY KIND, INCLUDING WITHOUT LIMITATION, ANY IMPLIED WARRANTIES OF MERCHANTABILITY, FITNESS FOR A PARTICULAR PURPOSE, OR NONINFRINGEMENT. IN NO EVENT WILL CA BE LIABLE TO YOU OR ANY THIRD PARTY FOR ANY LOSS OR DAMAGE, DIRECT OR INDIRECT, FROM THE USE OF THIS DOCUMENTATION, INCLUDING WITHOUT LIMITATION, LOST PROFITS, LOST INVESTMENT, BUSINESS INTERRUPTION, GOODWILL, OR LOST DATA, EVEN IF CA IS EXPRESSLY ADVISED IN ADVANCE OF THE POSSIBILITY OF SUCH LOSS OR DAMAGE.
The use of any software product referenced in the Documentation is governed by the applicable license agreement and such license agreement is not modified in any way by the terms of this notice.
The manufacturer of this Documentation is CA.
Provided with “Restricted Rights.” Use, duplication or disclosure by the United States Government is subject to the restrictions set forth in FAR Sections 12.212, 52.227-14, and 52.227-19(c)(1) - (2) and DFARS Section 252.227-7014(b)(3), as applicable, or their successors.
Copyright © 2014 CA. All rights reserved. All trademarks, trade names, service marks, and logos referenced herein belong to their respective companies.

CA Technologies Product References
This guide references the following products:
■ CA Spectrum®
■ CA Spectrum® Report Manager (Report Manager)
■ CA SystemEDGE (SystemEDGE)
Contact CA Technologies
Contact CA Support
For your convenience, CA Technologies provides one site where you can access the information that you need for your Home Office, Small Business, and Enterprise CA Technologies products. At http://ca.com/support, you can access the following resources:
■ Online and telephone contact information for technical assistance and customer services
■ Information about user communities and forums
■ Product and documentation downloads
■ CA Support policies and guidelines
■ Other helpful resources appropriate for your product
Providing Feedback About Product Documentation
If you have comments or questions about CA Technologies product documentation, you can send a message to [email protected].
To provide feedback about CA Technologies product documentation, complete our short customer survey which is available on the CA Support website at http://ca.com/docs.


Contents 5
Contents
Chapter 1: Introduction 9
About Host System Resources Manager ...................................................................................................................... 9
Host System Resources Management Concepts .......................................................................................................... 9
Monitoring Tasks Overview ........................................................................................................................................ 10
Creating Process and File System Monitoring Rules ........................................................................................... 10
Using Rule Sets to Automate Monitoring Rule Creation ..................................................................................... 12
About Creating a Log File Monitor ...................................................................................................................... 12
Host Resources Monitoring and Service Level Agreements ....................................................................................... 13
Host Resource Events and Alarms Reporting ............................................................................................................. 13
Getting Started with Managing Host System Resources in OneClick ......................................................................... 13
Access the Workspace for Creating and Managing Monitoring Rules ................................................................ 13
Access the Workspace for Creating and Managing Rule Sets ............................................................................. 14
View Monitoring Rule Information ..................................................................................................................... 14
Chapter 2: Process Monitoring 15
Create a Process Monitoring Rule .............................................................................................................................. 15
Differentiating Processes ........................................................................................................................................... 17
Process Monitoring Rule Parameters ......................................................................................................................... 18
RFC 2790 Process Monitoring Rule Parameters .................................................................................................. 18
NSM Agent Process Monitoring Rule Parameters .............................................................................................. 20
SystemEDGE Host Process Monitoring Rule Parameters .................................................................................... 30
Creation of SystemEDGE Process Models ........................................................................................................... 33
Edit a Process Monitoring Rule .................................................................................................................................. 33
Delete a Process Monitoring Rule .............................................................................................................................. 34
Maintenance Mode .................................................................................................................................................... 35
Place Process Monitor in Maintenance Mode .................................................................................................... 35
Schedule Maintenance Mode for Process Monitor ............................................................................................ 36
Roll Down Maintenance Alarms from the Device Model .................................................................................... 37
Process Model Internal Condition .............................................................................................................................. 37
Chapter 3: File System Monitoring 39
Create a File System Monitoring Rule ........................................................................................................................ 39
Edit a File System Monitoring Rule ............................................................................................................................ 41
Delete a File System Monitoring Rule ........................................................................................................................ 42

6 Host System Resources Management User Guide
Chapter 4: Working with Monitoring Rule Sets 43
Create a Rule Set ........................................................................................................................................................ 43
Add a Monitoring Rule to a Rule Set .......................................................................................................................... 44
Apply a Rule Set to a Global Collection ...................................................................................................................... 45
Remove a Rule Set from a Global Collection .............................................................................................................. 46
Edit a Rule in a Rule Set .............................................................................................................................................. 47
Editing a Rule Outside of a Rule Set .................................................................................................................... 48
Delete a Rule from a Rule Set..................................................................................................................................... 48
Deleting a Rule Outside of a Rule Set .................................................................................................................. 48
Delete a Rule Set ........................................................................................................................................................ 49
Chapter 5: Log File Monitoring 51
About the Log File Monitoring Process ...................................................................................................................... 51
Log File Syntax ............................................................................................................................................................ 52
Create Log File Monitors for iAgent Hosts ................................................................................................................. 53
Log File Monitors for NSM Agents ............................................................................................................................. 54
Set Up a Log File Monitor for NSM Agents Using OneClick ................................................................................. 55
Set Up a File Monitor for NSM Agents Using OneClick ....................................................................................... 58
Create Log File Monitors for SystemEDGE Hosts ....................................................................................................... 59
Log-to-Process Mapping ............................................................................................................................................. 61
Specify a Mapping for RFC 2790 Agents and SystemEDGE Hosts ....................................................................... 61
Mapping for NSM r11 Agents.............................................................................................................................. 62
Managing Monitored Log and Process Log Mapping Settings ............................................................................ 63
Configuring CA Spectrum to Process Syslog File Matches ......................................................................................... 63
Trap Processing Overview ................................................................................................................................... 63
Processing Traps That Contain an IP Address, Host Name, or Model Handle .................................................... 63
Create ParseMap Files......................................................................................................................................... 64
Enable Event Forwarding for Agent Models ....................................................................................................... 68
Chapter 6: Application Monitoring 69
SystemEDGE Application Insight Modules (AIMs) ...................................................................................................... 69
Apache Web Server ............................................................................................................................................. 69
Microsoft IIS ........................................................................................................................................................ 70
CA Insight DPM.................................................................................................................................................... 70
Chapter 7: CA Unicenter NSM Agent 71
Introduction to CA Unicenter NSM Agent .................................................................................................................. 71
NSM Agent Support ............................................................................................................................................ 72
NSM MIB Support ............................................................................................................................................... 73

Contents 7
Modeling NSM Agents in CA Spectrum ............................................................................................................... 74
NSM Agent Interface Support in CA Spectrum ................................................................................................... 76
View NSM Agent Information .................................................................................................................................... 76
NSM Agent Dashboards and Performance Reports ................................................................................................... 77
Configure CA Spectrum to Launch NSM User Interfaces .................................................................................... 77
Launch Agent Dashboards................................................................................................................................... 78
Launch Performance Reporting .......................................................................................................................... 78
Trap-to-Alarm Mapping.............................................................................................................................................. 79
Event Code and Probable Cause File ID Ranges ......................................................................................................... 80
NSM System Agent Status in CA Spectrum ................................................................................................................ 80
Appendix A: System and Application Monitoring Privileges 83
Index 85


Chapter 1: Introduction 9
Chapter 1: Introduction
About Host System Resources Manager
Host resources monitoring is a CA Spectrum mechanism that defines host resource conditions and thresholds that, when met or violated, generate events and alarms. The goal of resource monitoring is to alert network administrators about significant resource events that could affect host performance and Service Level Agreements.
To help you monitor resources, CA Spectrum provides management support for the following resource monitoring agents:
■ CA SystemEDGE Agent
■ CA Unicenter NSM System Agent
■ Dell OpenManage
■ Fujitsu ServerView Agent (for PRIMERGY servers)
■ HP Systems Insight Manager
■ iAgent
■ IBM Director
■ Net-SNMP (UC Davis)
■ Sun Management Center
This support for the monitoring agents lets you view and evaluate relevant, up-to-date information about the status of resources on host systems in the network.
Host System Resources Management Concepts
The following terms and concepts are key to understanding and working with CA Spectrum host system resources management.
Alarm Condition
An alarm condition refers to process thresholds that you specify in an RFC 2790 monitoring rule.
Configuration Threshold
A configuration threshold refers to process thresholds that you specify in an NSM Agent monitoring rule.

Monitoring Tasks Overview
10 Host System Resources Management User Guide
File System
A file system is any data storage system on a host.
Host
A host is any computer system that communicates with other systems in the network. In this guide, a host refers to any device that is modeled in CA Spectrum and that supports the RFC 2790 host resources MIB, NSM Agent proprietary MIBs, or log file monitoring.
Host Resources
Host resources are the processes, file systems, processors, memory, and other host elements that can be monitored.
Log File
A log file is any file that includes status information about a host or a host application.
Monitor Rule
A monitor rule in OneClick lets you associate CA Spectrum alarms with resource state changes and resource activity thresholds.
Process
A process is any application that runs on a host.
Monitoring Tasks Overview
This guide provides instructions for completing the following tasks in OneClick:
■ Create and manage process monitoring rules
■ Create and manage the file system monitoring rules
■ Create the file system monitoring rule sets that are applied to CA Spectrum Global Collection containers to automate the creation of monitoring rules
■ Create a log file monitor
Creating Process and File System Monitoring Rules
When you create a process or file system monitoring rule for a host model, you specify conditions that cause CA Spectrum to generate alarms. You can specify multiple available conditions when you create a monitoring rule. You can also specify whether CA Spectrum generates alarms for the monitoring rule model or the host model.

Monitoring Tasks Overview
Chapter 1: Introduction 11
More information:
Create a Process Monitoring Rule (see page 15) Create a File System Monitoring Rule (see page 39)
RFC 2790 Host Resources MIB Monitoring Rule Alarm Conditions and Thresholds
A process monitoring rule for a host that supports the RFC 2790 host resources MIB includes the following alarm conditions:
■ Process start
■ Process stop
■ Process instance count exceeds a certain number
■ Process instance count falls below a certain number
A file system monitoring rule includes the following alarm conditions:
■ File system utilization threshold is met
■ File system goes offline
For more information about RFC 2790 host resources monitoring rules, see Configure RFC 2790 Process Monitoring Rule Parameters (see page 18).
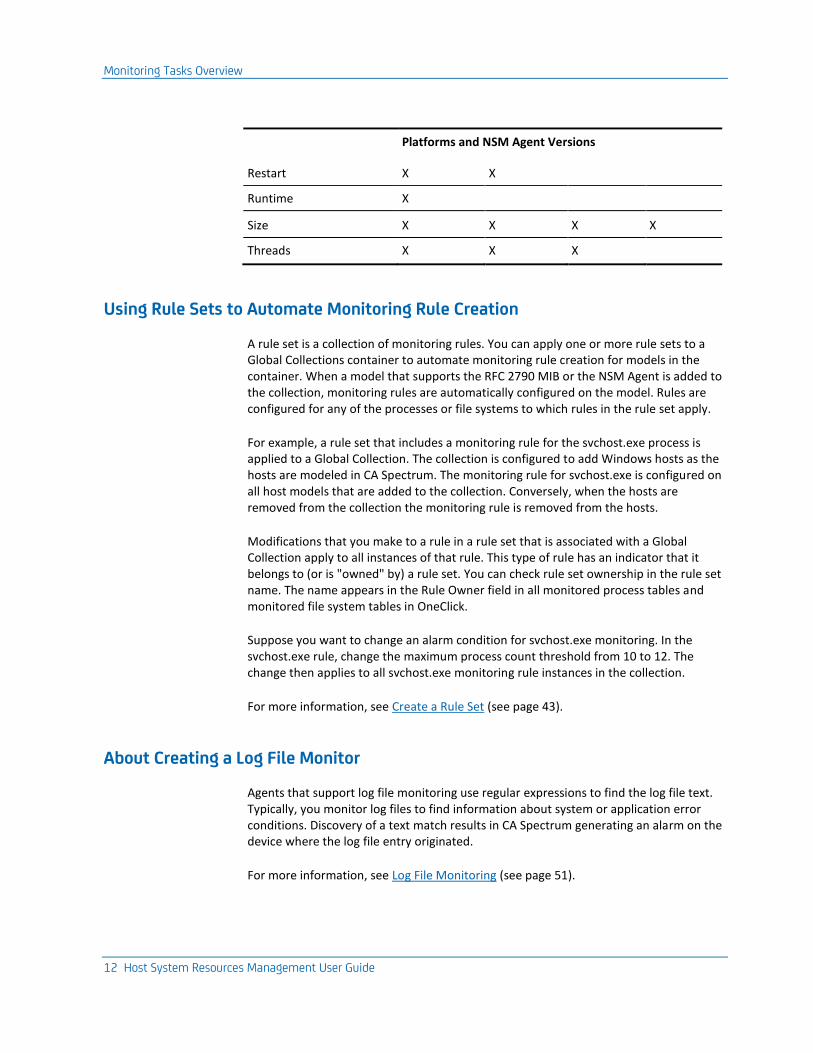
NSM Agent Monitoring Rule Thresholds
The following table shows the configuration thresholds that you can specify for an NSM Agent process monitoring rule. The available thresholds depend on both the host type (UNIX or Windows) and the version (3.1 or r11) of the agent on the host.
For more information, see NSM Agent Process Monitoring Rule Parameters (see page 20).
Platforms and NSM Agent Versions
Configuration Thresholds Win r11 UNIX r11 Win 3.1 UNIX 3.1
Children
X
X
X
X
CPU Usage X X X X
CPU Usage Long-term X
Handles X
Instances X X X X
Monitoring Tasks Overview
12 Host System Resources Management User Guide
Platforms and NSM Agent Versions
Restart X X
Runtime X
Size
X
X
X
X
Threads X X X
Using Rule Sets to Automate Monitoring Rule Creation
A rule set is a collection of monitoring rules. You can apply one or more rule sets to a Global Collections container to automate monitoring rule creation for models in the container. When a model that supports the RFC 2790 MIB or the NSM Agent is added to the collection, monitoring rules are automatically configured on the model. Rules are configured for any of the processes or file systems to which rules in the rule set apply.
For example, a rule set that includes a monitoring rule for the svchost.exe process is applied to a Global Collection. The collection is configured to add Windows hosts as the hosts are modeled in CA Spectrum. The monitoring rule for svchost.exe is configured on all host models that are added to the collection. Conversely, when the hosts are removed from the collection the monitoring rule is removed from the hosts.
Modifications that you make to a rule in a rule set that is associated with a Global Collection apply to all instances of that rule. This type of rule has an indicator that it belongs to (or is "owned" by) a rule set. You can check rule set ownership in the rule set name. The name appears in the Rule Owner field in all monitored process tables and monitored file system tables in OneClick.
Suppose you want to change an alarm condition for svchost.exe monitoring. In the svchost.exe rule, change the maximum process count threshold from 10 to 12. The change then applies to all svchost.exe monitoring rule instances in the collection.
For more information, see Create a Rule Set (see page 43).
About Creating a Log File Monitor
Agents that support log file monitoring use regular expressions to find the log file text. Typically, you monitor log files to find information about system or application error conditions. Discovery of a text match results in CA Spectrum generating an alarm on the device where the log file entry originated.
For more information, see Log File Monitoring (see page 51).
Host Resources Monitoring and Service Level Agreements
Chapter 1: Introduction 13
Host Resources Monitoring and Service Level Agreements
Host resource monitoring lets you monitor host resources that can affect the network services that are defined in a Service Level Agreement (SLA). For example, a process monitoring rule can determine whether a virus protection process has stopped unexpectedly, or whether a malicious process has started on a host. A file system monitoring rule can determine whether a disk drive or physical RAM on a host has reached or is nearing capacity. The viability of a business service can depend on whether processes are running on a host, or whether the host provides adequate data storage capacity.
Note: For more information about setting up a service management system and SLAs, see the Service Manager User Guide.
Host Resource Events and Alarms Reporting
The CA Spectrum Report Manager application lets you generate reports on events and alarms for host models. Alarms and reports are generated for threshold violations for monitored processes and the file systems. Alarms are also generated from error messages that are parsed from log files.
Note: For more information, see the Report Manager User Guide.
Getting Started with Managing Host System Resources in OneClick
This section describes how to invoke workspaces where you configure monitoring rules, rule sets, and views of monitored host resource information.
Note: For more information about the OneClick Console interface elements, see the Operator Guide.
Access the Workspace for Creating and Managing Monitoring Rules
Create and manage monitoring rules from the context of a host model that supports a monitoring agent.
Follow these steps:
1. Select the host for which you want to create a monitoring rule from the Contents panel.
2. Expand the System Resources option under the Information tab in the Component Detail panel.
Getting Started with Managing Host System Resources in OneClick
14 Host System Resources Management User Guide
The Running and Monitored Processes section lets you create and manage process monitoring rules. For more information, see Process Monitoring (see page 15).
The Monitored Logs and Process Logs section lets you create log file monitoring rules. For more information, see Log File Monitoring (see page 51).
The File Systems section lets you create file system monitoring rules. For more information, see File System Monitoring (see page 39).
Access the Workspace for Creating and Managing Rule Sets
Unlike monitoring rules that you create for a particular host, CA Spectrum creates different rules for Global Collections. For any host that is included in a Global Collection to which the rule set has been applied, CA Spectrum creates rules that you specify in a rule set. This feature automates the process of creating monitoring rules for multiple, different host types.
Manage rule sets in the Contents panel.
Follow these steps:
■ Select Locater, System & Application Monitoring, All Monitoring Rules.
The Contents panel lists any rule sets that have been created.
Default rules are not set. See Working with Monitoring Rule Sets (see page 43) for details about creating and managing rule sets and applying them to Global Collections.
View Monitoring Rule Information
OneClick lets you view comprehensive information about monitored processes and file systems in the Component Detail panel.
To view information about a process monitoring rule:
■ Select Locater, System & Application Monitoring, All Monitored Processes.
Note: Because process models are not created for rules for SystemEDGE hosts, monitoring rules for SystemEDGE hosts do not appear in this view.
To view information about a file system monitoring rule:
■ Select Locater, System & Application Monitoring, All Monitored File Systems.
The view provides information about the selected host and the monitoring configuration on the host. The monitoring agent that is associated with the rule determines the information that the view provides.
Chapter 2: Process Monitoring 15
Chapter 2: Process Monitoring
A process monitoring rule specifies the criteria that, when met, cause CA Spectrum to generate alarms. This section describes how to set up process monitoring rules for host models with process monitoring agents. See Working with Monitoring Rule Sets (see page 43) for information about setting up an automated method for creating process monitoring rules for models included in Global Collection containers.
This section contains the following topics:
Create a Process Monitoring Rule (see page 15) Differentiating Processes (see page 17) Process Monitoring Rule Parameters (see page 18) Edit a Process Monitoring Rule (see page 33) Delete a Process Monitoring Rule (see page 34) Maintenance Mode (see page 35) Process Model Internal Condition (see page 37)
Create a Process Monitoring Rule
You can create a process monitoring rule for a host model regardless of whether the process is running on the host.
Note: Only the users with the appropriate privileges can create process monitoring rules. For more information, see System and Application Monitoring Privileges (see page 83).
Follow these steps:
1. In the Contents panel, select the host model for which you want to create a monitoring rule.
Information for this host device appears in the Component Detail panel.
2. In the Component Detail panel, on the Information tab, expand System Resources, Running, and Monitored Processes.
The available process options for this host type appear.
Note: RFC 2790 indicates a host that supports the RFC 2790 host resources MIB.
3. Expand both Running Processes and Monitored Processes.
The Running Processes table lists running processes for the selected host model.
The Monitored Processes table lists process monitoring rules that have been created for the selected host model.

Create a Process Monitoring Rule
16 Host System Resources Management User Guide
4. To create a process monitoring rule for the selected host model, use one of the following methods:
■ If the process is running, right-click the process in the Running Processes table and select 'Monitor this process.'
■ If the process is not running, it is excluded from the Running Processes table. Click Add above the Monitored Processes table. You can then specify process monitoring rules for processes that run periodically but are not currently running that you want to know about when they start. For example, you want to know when virus scan and system maintenance processes run.
Note: For NSM Agent monitoring, use this method when you want to create a monitoring rule that watches multiple, different processes that the match criteria specify. For more information, see NSM Agent Process Monitoring Rule Parameters (see page 20).
A dialog opens, depending on the host type. If you selected a process from the Running Processes table, the dialog includes the process name and other information. If you invoked the dialog using the Add option, you are prompted to provide all process information.
5. Configure process monitoring rule settings:
■ For agents that support the RFC 2790 host resources MIB, see RFC 2790 Process Monitoring Rule Parameters (see page 18).
■ For agents that support NSM Agent versions 3.1 or r11, see NSM Agent Process Monitoring Rule Parameters (see page 20).
■ For SystemEDGE host agents, see SystemEDGE Host Process Monitoring Rule Parameters (see page 30).
6. Click OK.
The following events occur:
■ The process monitoring rule is added to the Monitored Processes table. The table columns represent predefined process identifier information specific to the monitoring agent type on the selected host. The rule applies to all identical instances of the process that satisfy the process match selection criteria.
■ A process model is created for RFC 2790 and NSM Agent rules.
Note: Local ownership in a monitoring rule indicates that the rule has been created explicitly for a particular host. As a result,it is not part of a rule set. For more information about rule sets, see Working with Monitoring Rule Sets (see page 43).

Differentiating Processes
Chapter 2: Process Monitoring 17
7. Specify the alarm generation and agent polling options, which are located above the Monitored Processes table, depending on host type:
Watch For New Processes Every (seconds)
Specify the frequency with which CA Spectrum inspects the Running Processes table for new instances of processes that a monitoring rule is watching. CA Spectrum updates the 'Number Running' value in the Monitored Processes table for a monitored process when it detects that a new instance of the process is running.
Generate Alarm On
Select a destination for alarms resulting from rule violations. You can specify that CA Spectrum create alarms on the process monitoring rule model or the host model.
Agent Poll Interval (seconds)
Specify the frequency with which the agent collects process information from the host device. The minimum value is 30 seconds.
Agent Poll Method
Specify how and when the agent collects process data:
disabled
The agent does not retrieve process information (by polling or by get request), and it sets all status indications for alarm conditions to passive or ok.
poll-interval-and-query
The agent retrieves process information both by polling and by the get request.
poll-interval-only
The agent retrieves process information by polling only.
query-only
The agent retrieves process information by get request only.
Differentiating Processes
At any time, a host can run multiple instances of a particular process. The svchost.exe process on Windows hosts and the nfsd process on Linux and UNIX hosts are typical examples. You can create a process monitoring rule that applies to all process instances, to some process instances, or to a single process instance. For example, if you decide to monitor all instances of svchost.exe, do not differentiate them by parameters or names.

Process Monitoring Rule Parameters
18 Host System Resources Management User Guide
For CA Spectrum, the alarm conditions and thresholds that are specified in the svchost.exe process monitoring rule apply to all instances of the process. Assuming that the rule specifies an alarm for process starts and stops, CA Spectrum generates an alarm for each start and stop, for each instance. In other words, CA Spectrum applies the rule to each entry in the Running Processes table that matches an entry (by process name) in the Monitored Processes table.
You can create a rule for an instance or a group of identical instances of a process. In this case, you must differentiate the instance or group of instances from the instances that you do not want to monitor. You can use a unique name, parameters, or both to distinguish them. The differentiation options let you make many different types of distinctions between process instances.
Process Monitoring Rule Parameters
The section describes the process monitoring rule parameters for the following host types:
■ RFC 2790 (see page 18)
■ NSM Agent (see page 20)
■ SystemEDGE Host (see page 30)
RFC 2790 Process Monitoring Rule Parameters
You can specify the following parameters when you create process monitoring rules for hosts that support RFC 2790 monitoring:
■ Process identifiers, including a process name and process differentiator
■ Process start/stop and process count alarm conditions
■ Polling of the Running Processes table for new instances of processes with associated monitoring rules

Process Monitoring Rule Parameters
Chapter 2: Process Monitoring 19
Monitor Information
You can selectively monitor all instances of a process or specific instances of a process. Use the following parameters in the monitoring rule:
Process Name
Identifies the process on the host model. You can differentiate a process instance with this setting , or you can also use the Match Parameters field to provide more precise differentiation.
For hosts that support RFC 2790 monitoring, the value that is entered in this field is case-insensitive. It converts to lowercase, as displayed in the Monitored Processes (RFC 2790) table. Also, duplicate entries are not allowed. If a new entry is created with the same Process Name (and Match Parameters value, if specified), the new entry replaces the existing entry. Any configuration settings that were changed are updated.
Match Parameters
Specifies one or more process parameters that differentiate identically named instances of the same process. You can add parameters or can modify the parameters that are included with a process before you save the configuration. This setting is used ialong with the Process Name to differentiate a process instance. See About Differentiating Processes (see page 17) for more information.
Descriptive Name
Identifies a nickname for the process. We recommend supplying a descriptive name that more clearly conveys the purpose or function of a process than its proper name (for example, "java runtime" for the javaw.exe process). This setting does not serve as a process differentiator.
Alarm Configuration
You can specify the following alarm conditions in an RFC 2790 monitoring rule:
Process Count Less Than
Specifies whether CA Spectrum generates an alarm when a process instance count is less than a particular value. CA Spectrum clears the alarm when the process count is equal to or greater than the value.
Process Count Greater Than
Specifies whether CA Spectrum generates an alarm when a process instance count is greater than a particular value. CA Spectrum clears the alarm when the process count is equal to or less than the value.
Process Start
Specifies whether CA Spectrum generates an alarm whenever the process is started. CA Spectrum clears the process-start alarm when the process stops.
Process Monitoring Rule Parameters
20 Host System Resources Management User Guide
Process Stop
Specifies whether CA Spectrum generates an alarm whenever the process is stopped. CA Spectrum clears the process-stop alarm when the process starts.
NSM Agent Process Monitoring Rule Parameters
Process monitoring rules are defined in the Add Monitored Process dialog, as described in Create a Process Monitoring Rule (see page 15). When you create a process monitoring rule for a host that supports NSM Agent monitoring, you can specify the following parameters:
■ Process monitoring rule identifiers
■ Process match criteria
■ Configuration threshold monitoring options
■ Configuration threshold values
■ Advanced options, such as aggregate status evaluation policy, resource cluster group, and aggregate violation threshold
Note: Your NSM Agent version and agent host platform determine your access to all of these settings and to the options that are described in this section.
You can specify the agent polling interval and method for all NSM Agent versions on all platforms. For more information, see Create a Process Monitoring Rule (see page 15).
Monitor Information
The Add Monitored Process dialog includes the following process monitoring rule identifiers. Available identifiers depend on the NSM Agent version and agent host platform:
Monitor Name
Identifies the name of the monitoring rule. CA Spectrum distinguishes identical monitoring rule configurations by the monitor name. This name must be unique.
Descriptive Name
Identifies a monitoring rule nickname or brief descriptive term.

Process Monitoring Rule Parameters
Chapter 2: Process Monitoring 21
The following table describes the attributes, or fields, that uniquely identify the process monitor for each agent type:
Version Monitor Identification Fields
Win r11
Monitor Name* Descriptive Name (optional)
UNIX r11 Monitor Name* Descriptive Name (optional)
Win 3.1
Descriptive Name (optional) Process Name* Path* User*
UNIX 3.1 Process Name* Parameters * Path * User *
* Uniquely identifies the process monitor.
Process Match Criteria
Before you implement a process monitoring rule on an NSM agent, identify the processes that you want CA Spectrum to evaluate according to the threshold criteria. You can use regular expressions and string comparisons to identify processes.
Important! The r11 agent supports regex for match criteria, but the 3.1 agent supports wildcard (*) use only.
The following table describes the attributes, or fields, that are used as process matching criteria for each type of NSM agent.

Process Monitoring Rule Parameters
22 Host System Resources Management User Guide
Note: For r11 NSM Agents, Match Type applies to the combination of all the other match criteria attributes. It defines how the combinations of the other process match fields are evaluated.
Version Monitor Identification Fields
Win r11
Process Name Match Type Path User
UNIX r11 Process Name Match Type Parameters Path User
Win 3.1
Process Name Path User
UNIX 3.1 Process Name Parameters Path User
The Add Monitored Process dialog includes the following fields and options, depending on the NSM Agent version and agent host platform you are working with:
Process Name
Identifies the process or processes text pattern to match. You can use literal string identifiers or regular expressions to specify a text search pattern.
Note: If no other process match criteria is specified, all processes matching the name in the Process Name field are monitored.
Match Type
Lets you specify the process or processes that match or do not match the process match criteria.
Note: Process Name match criteria are case-insensitive.
Options include:
positive-regular-expression
The agent searches for processes that match the process name as a regular expression.

Process Monitoring Rule Parameters
Chapter 2: Process Monitoring 23
negative-regular-expression
The agent searches for processes that do not match the process name as a regular expression.
positive-string-compare
The agent searches for processes that match the process name as a string comparison.
negative-string-compare
The agent searches for processes that do not match the process name as a string comparison.
Parameters
Identifies the process arguments to match. You can specify parameters as a literal string or a regular expression depending on the version of NSM and the platform you are using.
Path
Identifies the path name of the process or processes to match. You can specify paths as a literal string or a regular expression.
User
Identifies the user name of the process account to match. You can specify user names as a literal string or a regular expression depending on the version of NSM and the platform you are using.
Threshold Configuration for NSM Agent
Threshold configuration defines what is watched by the monitor. You can specify multiple thresholds when you create a monitoring rule. For example, you can instruct the monitor to watch only the amount of CPU time that a process consumes. Or you can instruct the monitor to watch CPU usage and process children, threads, and handles, and also how often a process restarts.
CA Spectrum generates Major (Orange) alarms for violations of warning thresholds and Critical (Red) alarms for violations of critical thresholds. Alarm generation depends on the overall status of the monitoring rule.
The thresholds that you can specify depend on the host platform (Windows or UNIX) and the NSM Agent version (3.1 or r11) running on the host.
The following table describes the threshold and monitoring options that are available for each NSM agent:

Process Monitoring Rule Parameters
24 Host System Resources Management User Guide
Threshold Monitoring Options
Platform and Agent Version
Win r11 UNIX r11 Win 3.1 UNIX 3.1
Children do-not-monitor down-warning down-critical
do-not-monitor down-warning down-critical
do-not-monitor down-warning down-critical
do-not-monitor monitor
CPU Usage do-not-monitor warning-only critical-only minimum-only maximum-only all
do-not-monitor warning-only critical-only minimum-only maximum-only all
do-not-monitor warning-only critical-only both
do-not-monitor warning-only critical-only both
CPU Usage Long-term N/A do-not-monitor warning-only critical-only minimum-only maximum-only all
N/A N/A
Handles do-not-monitor down-warning down-critical
N/A N/A N/A
Instances do-not-monitor down-warning down-critical
do-not-monitor down-warning down-critical
do-not-monitor down-warning down-critical
do-not-monitor monitor
Restart do-not-monitor down-warning down-critical
do-not-monitor down-warning down-critical
N/A N/A
Runtime do-not-monitor down-warning down-critical
N/A N/A N/A
Size
do-not-monitor warning-only critical-only minimum-only maximum-only all
do-not-monitor down-warning down-critical
do-not-monitor warning-only critical-only both
do-not-monitor monitor
Threads do-not-monitor down-warning down-critical
do-not-monitor down-warning down-critical
do-not-monitor down-warning down-critical
N/A
Process Monitoring Rule Parameters
Chapter 2: Process Monitoring 25
Note: Specify the value '-1' for a particular minimum or maximum value threshold to disable the threshold. You can selectively specify that the monitor watches, for example, a minimum threshold but not a maximum threshold, or the reverse.
Children
Specifies whether the monitor watches the process children count.
Note: For version r11 on Windows, this option is in the Resources, Type drop-down list.
CPU Usage/CPU Shortterm Usage/CPU Longterm Usage
Specifies whether the monitor watches the amount of CPU time that a process uses.
Some of the available options include the following:
Warning Threshold
This value can be between one (1) and ninety-nine (99) percent, but it must fall below the critical threshold percent value. For multiple process instances, the maximum of all instances is compared with this value.
Critical Threshold
This value can be between two (2) and one hundred (100) percent, but it must exceed the warning threshold percent value. For multiple process instances, the maximum of all instances is compared with this value.
CPU Interval
This value defines the total value in seconds to use as the base to calculate the CPU value. Specifically, the CPU usage of a process, in seconds, refers to this interval. You can set the value to any value greater than zero (0) or -1.
■ If set to -1, the CPU value is calculated as the CPU usage, in seconds, used up to the current time since the start of the agent or the creation of the process monitoring rule.
■ If the CPU interval is set to a value greater than the current agent polling interval and this time has not elapsed for the first time, the CPU value is extrapolated.
■ If the CPU interval is set to a value smaller than the current agent polling interval, the CPU value is calculated as the appropriate fraction of the value for the last agent polling interval.
■ If the CPU interval is set to a value greater than the current agent polling interval and this time has already elapsed, the CPU value is calculated as the sliding sum (the sum of the value for the current poll interval and the value calculated at the last poll) weighted according to its fraction of the CPU interval.
■ If the interval is set to -1, any overloading (%) used for the thresholds are ignored.
Process Monitoring Rule Parameters
26 Host System Resources Management User Guide
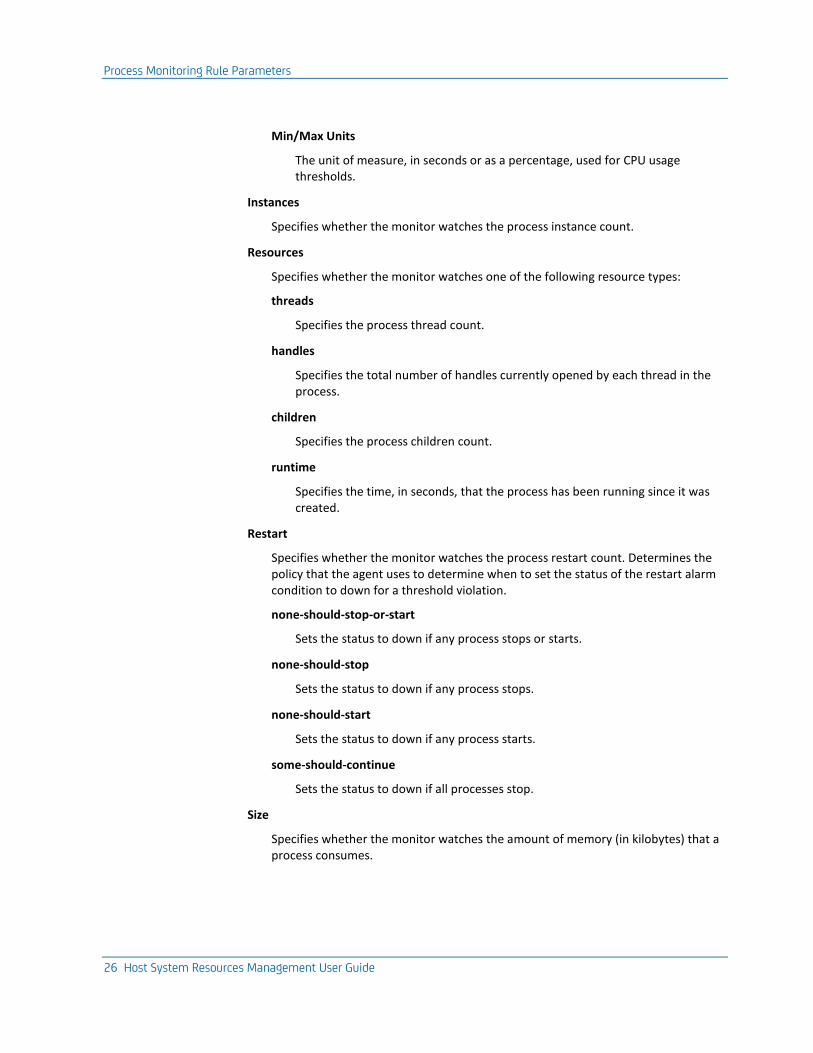
Min/Max Units
The unit of measure, in seconds or as a percentage, used for CPU usage thresholds.
Instances
Specifies whether the monitor watches the process instance count.
Resources
Specifies whether the monitor watches one of the following resource types:
threads
Specifies the process thread count.
handles
Specifies the total number of handles currently opened by each thread in the process.
children
Specifies the process children count.
runtime
Specifies the time, in seconds, that the process has been running since it was created.
Restart
Specifies whether the monitor watches the process restart count. Determines the policy that the agent uses to determine when to set the status of the restart alarm condition to down for a threshold violation.
none-should-stop-or-start
Sets the status to down if any process stops or starts.
none-should-stop
Sets the status to down if any process stops.
none-should-start
Sets the status to down if any process starts.
some-should-continue
Sets the status to down if all processes stop.
Size
Specifies whether the monitor watches the amount of memory (in kilobytes) that a process consumes.

Process Monitoring Rule Parameters
Chapter 2: Process Monitoring 27
Threads
Specifies whether the monitor watches the process thread count.
Note: For version r11 on Windows, this option is in the Resources, Type drop-down list.
Monitoring Options
A monitoring option specifies whether the NSM Agent watches a particular configuration threshold and which threshold types (warning or critical, minimum, or maximum values) to watch.
Monitor drop-down lists in the Add Monitored Process dialog contain the following options depending on the host platform (Windows or UNIX), the NSM Agent version (3.1 or r11), and the particular alarm condition you are configuring:
do-not-monitor
No alarm. The agent disregards threshold settings.
monitor
Critical alarm. The agent monitors minimum and maximum values for all thresholds.
warning-only
Major alarm. The agent evaluates only the warning thresholds (both minimum and maximum) to determine the status of the process.
critical-only
Critical alarm. The agent evaluates only the critical thresholds (both minimum and maximum) to determine the status of the process.
minimum-only
Major (warning) and Critical (critical) alarms. The agent evaluates only the minimum thresholds (both warning and critical) to determine the status of the process.
maximum-only
Major (warning) and Critical (critical) alarms. The agent evaluates only the maximum thresholds (both warning and critical) to determine the status of the process.
all
Major (warning) and Critical (critical) alarms. The agent evaluates all thresholds.
down-warning
Major alarm. When the resource is in a bad condition the agent uses a warning severity. This lets you designate a threshold violation as less crucial than a down-critical violation.
Process Monitoring Rule Parameters
28 Host System Resources Management User Guide
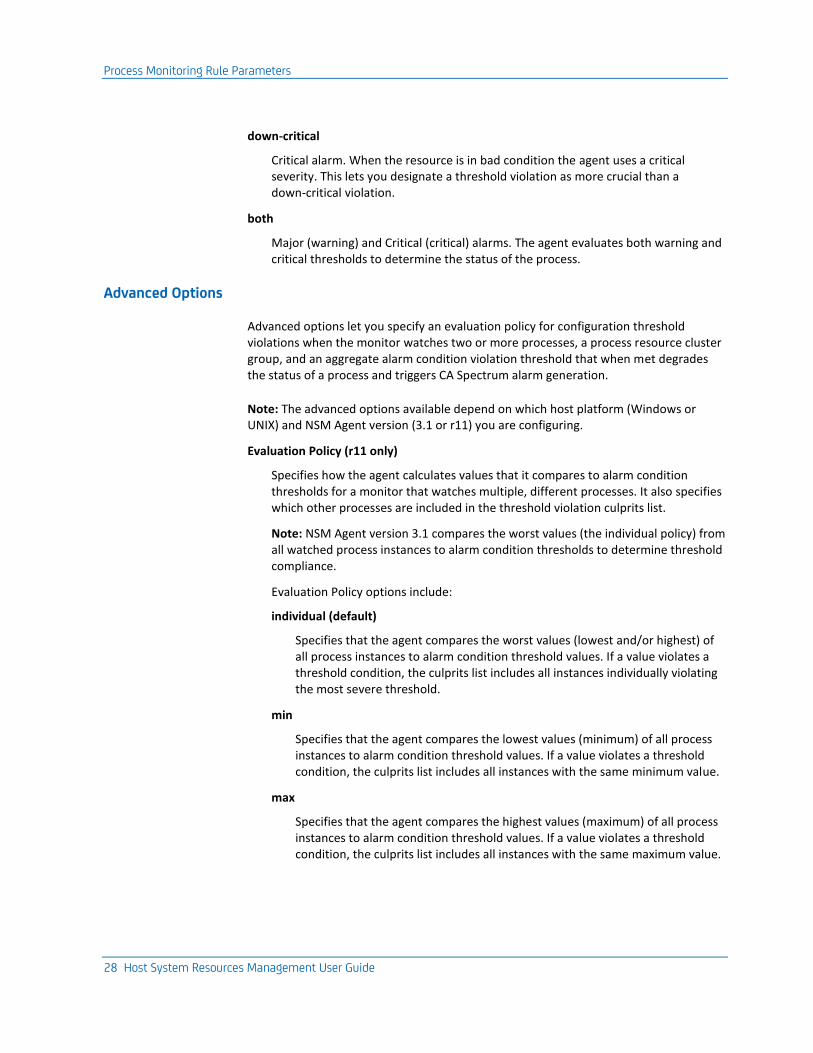
down-critical
Critical alarm. When the resource is in bad condition the agent uses a critical severity. This lets you designate a threshold violation as more crucial than a down-critical violation.
both
Major (warning) and Critical (critical) alarms. The agent evaluates both warning and critical thresholds to determine the status of the process.
Advanced Options
Advanced options let you specify an evaluation policy for configuration threshold violations when the monitor watches two or more processes, a process resource cluster group, and an aggregate alarm condition violation threshold that when met degrades the status of a process and triggers CA Spectrum alarm generation.
Note: The advanced options available depend on which host platform (Windows or UNIX) and NSM Agent version (3.1 or r11) you are configuring.
Evaluation Policy (r11 only)
Specifies how the agent calculates values that it compares to alarm condition thresholds for a monitor that watches multiple, different processes. It also specifies which other processes are included in the threshold violation culprits list.
Note: NSM Agent version 3.1 compares the worst values (the individual policy) from all watched process instances to alarm condition thresholds to determine threshold compliance.
Evaluation Policy options include:
individual (default)
Specifies that the agent compares the worst values (lowest and/or highest) of all process instances to alarm condition threshold values. If a value violates a threshold condition, the culprits list includes all instances individually violating the most severe threshold.
min
Specifies that the agent compares the lowest values (minimum) of all process instances to alarm condition threshold values. If a value violates a threshold condition, the culprits list includes all instances with the same minimum value.
max
Specifies that the agent compares the highest values (maximum) of all process instances to alarm condition threshold values. If a value violates a threshold condition, the culprits list includes all instances with the same maximum value.

Process Monitoring Rule Parameters
Chapter 2: Process Monitoring 29
sum
Specifies that the agent compares the cumulative values (sum) of all process instances to alarm condition threshold values. If a value violates a threshold condition, the culprits list includes all instances.
avg
Specifies that the agent compares the average values of all process instances to alarm condition threshold values. If a value violates the threshold condition, the culprits list includes all instances individually violating the most severe threshold.
Cluster Resource Group (r11 only)
Identifies the cluster resource group.
Aggregate Violation Threshold
This option specifies the consecutive number of agent polling cycles for which any threshold is required to be in a less-than-ok state before the aggregate status for the monitor changes. This value must be greater than 0. The Aggregate Violation Threshold field is not available for UNIX 3.1.
The Status field in the Monitored Processes table for the selected host model indicates the aggregate status condition.
If the NSM Agent Fails to Retrieve Process Information
If the NSM Agent subagent that is responsible for retrieving process monitoring information goes down, CA Spectrum responds as follows:
■ Generates an NSM PROCESS MONITORING AGENT LOST alarm on the host model
■ Asserts a suppressed APPLICATION_LOST alarm condition on the process models
When the process monitoring subagent restarts, CA Spectrum clears the NSM PROCESS MONITORING AGENT LOST alarm on the host model and clears the APPLICATION_LOST alarms on the associated process models.
Status Indications for NSM Agent Process Monitoring Rules
The Status field in the Monitored Processes table for the selected host model indicates the aggregate status condition of the monitor. The status field represents the worst-case aggregate for the status values of each threshold that is defined on the monitor.
The aggregate status enters a suboptimal state when any threshold is in a violated state over a particular number of consecutive agent polling cycles. The Aggregate Violation Threshold field defines the number of consecutive times that any threshold is in a violated state before the aggregate status value changes. CA Spectrum does not generate alarms for violated thresholds until the aggregate status is in a suboptimal state.
Process Monitoring Rule Parameters
30 Host System Resources Management User Guide
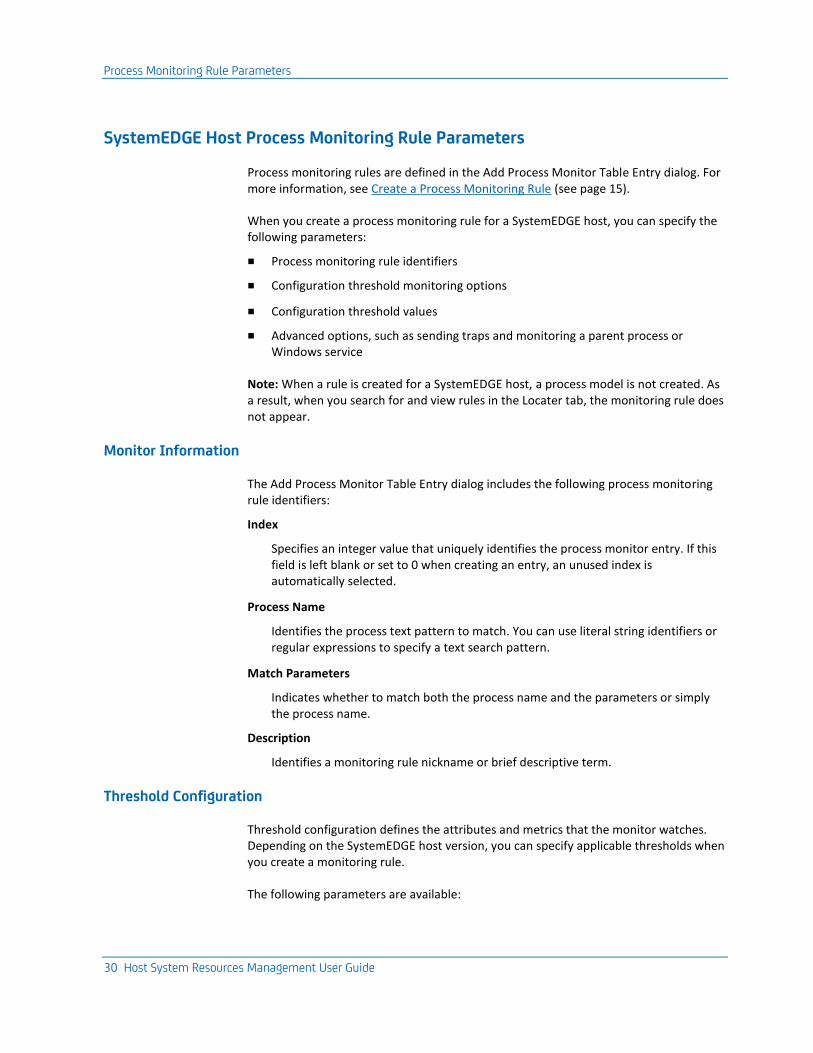
SystemEDGE Host Process Monitoring Rule Parameters
Process monitoring rules are defined in the Add Process Monitor Table Entry dialog. For more information, see Create a Process Monitoring Rule (see page 15).
When you create a process monitoring rule for a SystemEDGE host, you can specify the following parameters:
■ Process monitoring rule identifiers
■ Configuration threshold monitoring options
■ Configuration threshold values
■ Advanced options, such as sending traps and monitoring a parent process or Windows service
Note: When a rule is created for a SystemEDGE host, a process model is not created. As a result, when you search for and view rules in the Locater tab, the monitoring rule does not appear.
Monitor Information
The Add Process Monitor Table Entry dialog includes the following process monitoring rule identifiers:
Index
Specifies an integer value that uniquely identifies the process monitor entry. If this field is left blank or set to 0 when creating an entry, an unused index is automatically selected.
Process Name
Identifies the process text pattern to match. You can use literal string identifiers or regular expressions to specify a text search pattern.
Match Parameters
Indicates whether to match both the process name and the parameters or simply the process name.
Description
Identifies a monitoring rule nickname or brief descriptive term.
Threshold Configuration
Threshold configuration defines the attributes and metrics that the monitor watches. Depending on the SystemEDGE host version, you can specify applicable thresholds when you create a monitoring rule.
The following parameters are available:

Process Monitoring Rule Parameters
Chapter 2: Process Monitoring 31
Attribute
Is the process attribute to monitor.
Operator
Is the Boolean operator that is used to compare the current value to the threshold value. 'No Operation' only tracks the current value; it does not compare against the threshold value.
Threshold Value
Is the threshold value against which the agent compares the current value. This parameter works with the Operator parameter.
Interval
Is the time (in seconds) between successive samples by the agent. Values range from 30 to MAXINT and must be a multiple of 30.
Sample Type
Is the type of sampling to perform on the monitored object.
absolute
Measures the actual value (for example, a gauge).
delta
Measures a change in value (for example, a counter).
Severity
Is the severity to use for the object state model.
Note: This threshold value is not available for all SystemEDGE host versions.
Object Class
Is the object class to use for the object state model.
Note: This threshold value is not available for all SystemEDGE host versions.
Object Attribute
Is the object attribute to use for the object state model.
Note: This threshold value is not available for all SystemEDGE host versions.
Object Instance
Is the object instance to use for the object state model.
Note: This threshold value is not available for all SystemEDGE host versions.

Process Monitoring Rule Parameters
32 Host System Resources Management User Guide
Execute Action
Specifies the command that is executed if a threshold is crossed (a string, up to 4096 characters). The action script must be present on the host.
Send Arguments
Indicates whether to send default arguments to action scripts or programs (for example, trap type or a description field).
Advanced Options
Advanced options let you specify actions to perform during the monitoring process.
Send SNMP Traps
Indicates whether to send SNMP traps.
Send Process Start Traps
Indicates whether to send process start traps.
Handle Process Start Traps
Indicates whether to execute actions, log events, and send SNMP traps when a process start trap occurs. Acts as a convenience flag for setting the three individual flags at the same time.
Send Not-Ready Trap
Indicates whether to send not-ready traps.
Single
A single not-ready trap is sent.
Continuous
A continuous not-ready trap is sent.
Send Process Clear Traps
Indicates whether to send process clear traps.
Monitor Parent Process
Indicates whether to monitor the parent process.
Monitor Windows Service
Indicates whether to monitor the Windows service.
Reinitialize Entry
Indicates whether to reinitialize the entry.
Log Events
Indicates whether to log events.
Edit a Process Monitoring Rule
Chapter 2: Process Monitoring 33
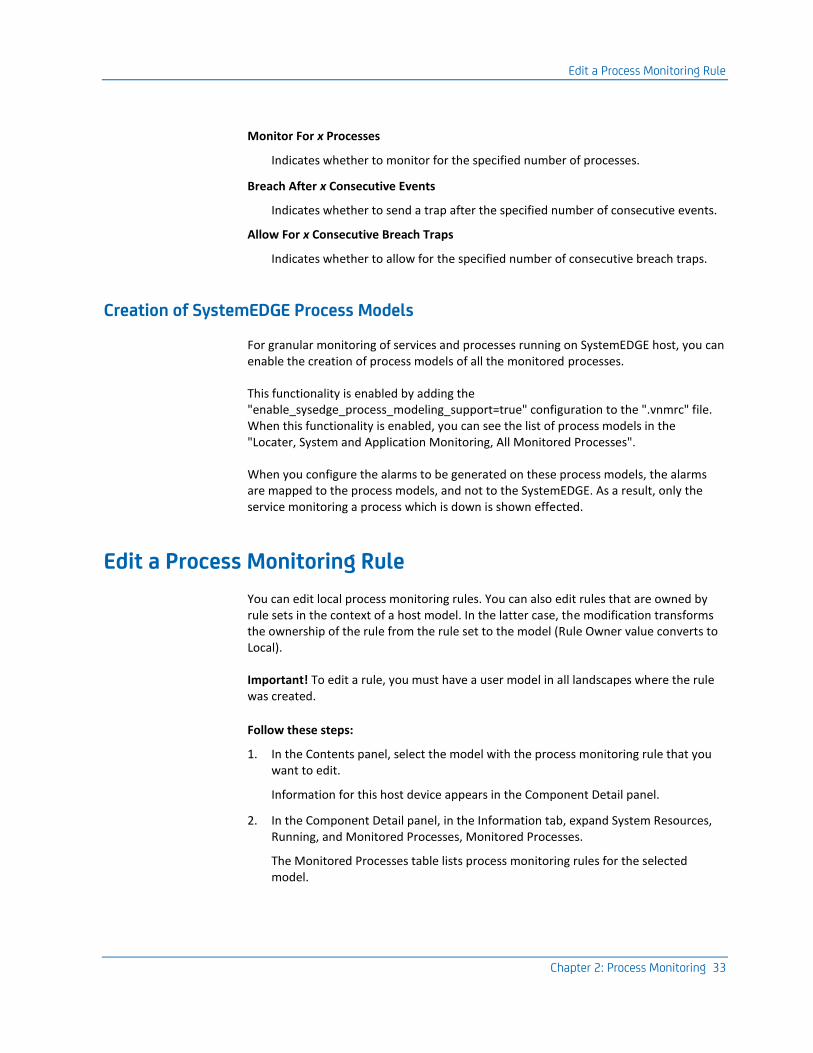
Monitor For x Processes
Indicates whether to monitor for the specified number of processes.
Breach After x Consecutive Events
Indicates whether to send a trap after the specified number of consecutive events.
Allow For x Consecutive Breach Traps
Indicates whether to allow for the specified number of consecutive breach traps.
Creation of SystemEDGE Process Models
For granular monitoring of services and processes running on SystemEDGE host, you can enable the creation of process models of all the monitored processes.
This functionality is enabled by adding the "enable_sysedge_process_modeling_support=true" configuration to the ".vnmrc" file. When this functionality is enabled, you can see the list of process models in the "Locater, System and Application Monitoring, All Monitored Processes".
When you configure the alarms to be generated on these process models, the alarms are mapped to the process models, and not to the SystemEDGE. As a result, only the service monitoring a process which is down is shown effected.
Edit a Process Monitoring Rule
You can edit local process monitoring rules. You can also edit rules that are owned by rule sets in the context of a host model. In the latter case, the modification transforms the ownership of the rule from the rule set to the model (Rule Owner value converts to Local).
Important! To edit a rule, you must have a user model in all landscapes where the rule was created.
Follow these steps:
1. In the Contents panel, select the model with the process monitoring rule that you want to edit.
Information for this host device appears in the Component Detail panel.
2. In the Component Detail panel, in the Information tab, expand System Resources, Running, and Monitored Processes, Monitored Processes.
The Monitored Processes table lists process monitoring rules for the selected model.

Delete a Process Monitoring Rule
34 Host System Resources Management User Guide
3. Select the process monitoring rule that you want to edit, and click Edit.
The Edit Process Monitor Table Entry dialog opens.
4. Modify the settings as required, and click OK.
Changes to the process monitoring rule for the selected model take effect immediately.
Delete a Process Monitoring Rule
You can delete local process monitoring rules and rules that are owned by rule sets for a host model. In the former case, monitoring stops for the process. In the latter case, the deletion also stops monitoring for the particular model by the rule from the rule set. However, the deletion of a rule set rule is temporary. Process monitoring that is specified by the rule is reestablished the next time the rule set is updated. See Deleting a Rule Outside of a Rule Set (see page 48) for more information.
When you delete a process monitoring rule, CA Spectrum and the process monitoring agent stop monitoring all identical (non-differentiated) instances of the process that is specified in the rule. In addition, the rule is removed from the agent MIB.
Follow these steps:
1. In the Contents panel, select the model with the process monitoring rule that you want to delete.
Information for this host device appears in the Component Detail panel.
2. In the Component Detail panel, expand System Resources, Running, and Monitored Processes, Monitored Processes.
The Monitored Processes table lists process monitoring rules for the selected model.
3. Select the process monitoring rule that you want to delete, and click Delete.
You are prompted to confirm the deletion.
4. Confirm the deletion.
The process monitoring rule is deleted.
Process monitoring that is specified by the rule for the selected model stops immediately.

Maintenance Mode
Chapter 2: Process Monitoring 35
Maintenance Mode
When a process monitor is in maintenance mode, the process is not monitored. Any events or alarms that are related to monitoring of that process are not generated.
Placing a process monitor into maintenance mode can be useful when a single application on a host where several critical applications are running is upgraded. You can place only the process that is associated with that particular application into maintenance mode while the upgrade is taking place. Monitoring of the other applications can continue.
Maintenance mode can also be scheduled, which allows you the ability to specify what time of day to alarm on processes.
Maintenance mode is only supported for RFC 2790 and NSM Agent process monitoring.
Note: When a host device is in maintenance, process monitoring for that device is automatically suspended.
Place Process Monitor in Maintenance Mode
A process monitor can be placed into maintenance mode at any time. This procedure describes how to place a process monitor into maintenance mode immediately.
Follow these steps:
1. In the Contents panel, select the host model for which you want to place a process monitor into maintenance mode.
Note: Maintenance mode is only supported for RFC 2790 and NSM Agent process monitoring.
2. In the Component Detail panel, in the Information tab, expand System Resources, Running and Monitored Processes, and RFC 2790, if applicable.
3. Perform one of the following steps from the Monitored Processes or Monitored Processes (RFC 2790) table to place a process monitor into maintenance mode:
■ Select the process monitor to place into maintenance mode, and click the Maintenance button above the table.
■ Right-click the process monitor to place into maintenance mode, and select 'Toggle Maintenance Mode.'
The process monitor is now in maintenance mode, and its icon changes to brown. The mode is reflected in the Condition column of the Monitored Processes table. If the icon does not change immediately, click Refresh.
Note: You can use this same procedure to take a process monitor out of maintenance mode.
Maintenance Mode
36 Host System Resources Management User Guide
Schedule Maintenance Mode for Process Monitor
You can schedule the times when a process monitor is in maintenance mode by applying a maintenance schedule. You can apply an existing schedule, or you can create a new one. You can apply multiple schedules to a process monitor.
Follow these steps:
1. On the Locater tab, select System & Application Monitoring, All Monitored Processes.
2. Select the process monitor in the Contents panel to which you want to apply a maintenance schedule.
Note: Maintenance mode is only supported for RFC 2790 and NSM Agent process monitoring.
3. In the Component Detail panel, expand the Process Monitor Details subview, locate 'In Maintenance,' and click Schedule.
The Add/Remove Schedules dialog opens. Any maintenance schedules that are applied to the process monitor appear in the Current Schedules column.
4. (Optional) Apply an existing schedule. Select a schedule from the Available Schedules column, and click the left arrow to move it to the Current Schedules column.
5. Click Create.
The Create Schedule dialog opens.
6. Select a Start Date, a Start Time, and either an End Time or Duration for the schedule.
7. Select a Recurrence factor.
Note: Leave the Recurrence set to None to create a one-time maintenance mode window.
8. Supply a Description to identify the schedule.
9. Click OK.
The Create Schedule dialog closes. The new schedule appears in the Current Schedules column in the Add/Remove Schedules dialog.
10. Click OK.
The Add/Remove Schedules dialog closes. The maintenance mode scheduling changes are applied to the process monitor. The changes appear in the Assigned Maintenance Schedules list.
Process Model Internal Condition
Chapter 2: Process Monitoring 37
Roll Down Maintenance Alarms from the Device Model
When a device is placed in maintenance mode, the maintenance alarms that are generated on the device can be rolled down to the associated process models. Enable this propagation by setting the rollMMAlarmToApp attribute to true. When this option is enabled, the alarms also roll down to the application models that are associated with the device.
Note: For information about placing a device into maintenance mode, see the Operator Guide. For information about modifying model attributes, see the Modeling and Managing Your IT Infrastructure Administrator Guide.
Process Model Internal Condition
CA Spectrum can maintain the condition of process models without having the process monitoring events generate alarms. This functionality can be useful when incorporating multiple monitored process models within a service or resource monitor. Rather than having alarms generated on the device or process models each time a process monitoring rule is violated, you can have a single alarm on the service model when the service policy is violated.
The functionality is disabled by default. Enable it by using the Attribute Editor to set the value of the EnableInternalCondition attribute to Yes. This attribute is on the device model for NSM Process Monitoring and on the rfc2790App application model for RFC 2790 Process Monitoring. When the functionality is either enabled or disabled, any existing process monitoring alarms are cleared on the associated process models, and their InternalCondition attribute is set to Normal.
While the functionality is enabled and the 'Generate Alarm On' option is set to 'Process Model', process monitoring events do not generate alarms. Instead, the InternalCondition attribute of the process model is set to reflect the condition of the process model. The value of this attribute is displayed on the Internal Condition column of the System & Application Monitoring, All Monitored Processes table on the Locater tab. The value can also be found on the Attributes tab of the process model.
While the Internal Condition functionality is enabled, do not map log-file monitors to any process models. The log-file monitoring events continue to generate alarms.

Process Model Internal Condition
38 Host System Resources Management User Guide
For hosts that support RFC 2790 monitoring:
■ When the functionality is enabled or disabled:
■ Manually clear any process monitoring alarms that exist on the affected device model.
■ Process count conditions are reasserted; however, the process start and process stop conditions are not reasserted.
■ If a SpectroSERVER is restarted while the Internal Condition functionality is enabled on a device in its landscape, you must disable the functionality and then reenable it on the device. These steps ensure that the Internal Condition of the process models accurately synchronizes with the actual condition of the process monitor.

Chapter 3: File System Monitoring 39
Chapter 3: File System Monitoring
A file system monitoring rule (RFC 2790) specifies file system alarm conditions that cause CA Spectrum to generate alarms. Alarms are generated when the conditions occur on a host model for which the rule is created:
■ File system utilization
■ File system goes offline
This section describes how to set up file system monitoring for particular host models. See Working with Monitoring Rule Sets (see page 43) for information about automating the creation of file system monitoring rules for models in Global Collection containers.
Create a File System Monitoring Rule
When you create a file system monitoring rule, you can specify any file system, online or offline. CA Spectrum creates a model for the rule.
During file system monitoring rule configuration, you define the alarm conditions that cause CA Spectrum to generate alarms. Examples of such alarm conditions include system utilization thresholds or a file system that goes offline.
Note: Only users with the appropriate privileges can create file system monitoring rules. For more information, see System and Application Monitoring Privileges (see page 83).
Follow these steps:
1. In the Contents panel, select the model with the file system that you want to monitor.
Information for this host device appears in the Component Detail panel.
2. In the Component Detail panel, expand System Resources, File Systems.
The available file system monitoring options for this host type appear.
3. Expand File Systems (RFC 2790) and Monitored File Systems (RFC 2790).
The File Systems (RFC 2790) table lists file systems for the selected model. The Monitored File Systems (RFC 2790) table lists file system monitoring rules that have been created for the selected model.
4. Use one of the following methods to create a file system monitoring rule for the selected model:
■ If the file system you want to monitor is available, right-click the file system in the File Systems (RFC 2790) table and select Monitor this File System.

Create a File System Monitoring Rule
40 Host System Resources Management User Guide
■ If the file system is not available and therefore not included in the File Systems (RFC 2790) table, click Add on the Monitored File Systems (RFC 2790) table. This lets you specify, for example, a file system that is offline that you want to know about and monitor when it does come online.
The Add File System Monitor dialog opens. If you selected a file system from the File Systems (RFC 2790) table, the box includes the file system name.
5. Configure the settings. The available settings include the following:
File System Name
Specifies the file system. If you added a file system to monitor that is not currently available, type the name. If you added an available file system, the name is entered automatically.
For hosts that support RFC 2790 monitoring, the value that you enter in this field is case-insensitive. This field converts to lowercase, as displayed in the Monitored File Systems (RFC 2790) table. Duplicate entries are not allowed. If a new entry is created with the same File System Name, the new entry replaces the previous one, updating any configuration settings that were changed.
Description
Specifies a nickname, or alias, for the file system.
Threshold Value Type
Specifies whether to monitor file system utilization thresholds in terms of capacity percentage or unit of storage (Bytes, Kbytes, Mbytes, Gbytes, Tbytes).
Utilization Thresholds
Specifies thresholds for events, minor alarms, major alarms, and critical alarms. CA Spectrum clears threshold alarms when metrics no longer exceed thresholds.
Alarm if Offline
Specifies whether CA Spectrum generates an alarm when the file system goes offline. CA Spectrum clears the alarm when the file system comes back online.
6. Click OK.
The file system monitoring rule is added to the Monitored File Systems (RFC 2790) table. CA Spectrum generates alarms in response to the alarm condition threshold violations specified in the rule.
Note: A value of "Local" in the Rule Owner field of a monitoring rule indicates that the rule has been created explicitly for a particular host and is therefore not part of a rule set. For more information about rule sets, see Working with Monitoring Rule Sets (see page 43).
7. Select a destination for alarms resulting from rule violations from the Generate Alarm On drop-down list. You can specify that CA Spectrum create alarms on the monitoring rule model or the host model.

Edit a File System Monitoring Rule
Chapter 3: File System Monitoring 41
Edit a File System Monitoring Rule
You can edit local file system monitoring rules and rules that are owned by rule sets for a host model. In the latter case, the modification transforms the ownership of the rule from the rule set to the model (Rule Owner value converts to Local). However, the changes and the ownership conversion are temporary because the original rule specifications and ownership are reestablished the next time the rule set is updated. See Editing a Rule Outside of a Rule Set (see page 48) for more information.
Important! To edit a rule, you must have a user model in all landscapes where the rule was created.
Follow these steps:
1. In the Contents panel, select the model with the file system monitoring rule that you want to edit.
Information for this host device appears in the Component Detail panel.
2. In the Component Detail panel, expand System Resources, File Systems, Monitored File Systems (RFC 2790).
The Monitored File Systems (RFC 2790) table lists file system monitoring rules.
3. Select the file system rule that you want to edit, and then click Edit.
The Edit File System Monitor dialog opens. Read-only settings are grayed out.
Delete a File System Monitoring Rule
42 Host System Resources Management User Guide
4. Modify settings as required, and click OK.
Changes to the file system monitoring rule for the selected model take effect immediately.
Delete a File System Monitoring Rule
You can delete local file system monitoring rules and rules that are owned by rule sets for a host model. In the former case, monitoring stops for the file system. In the latter case, the deletion also stops monitoring for the particular model by the rule from the rule set. However, deletion of a rule set rule is temporary because file system monitoring specified by the rule is reestablished the next time the rule set is updated. See Deleting a Rule Outside of a Rule Set (see page 48) for more information.
Follow these steps:
1. In the Contents panel, select the model with the file system monitoring rule you want to delete.
Information for this host device appears in the Component Detail panel.
2. In the Component Detail panel, expand System Resources, File Systems, Monitored File Systems (RFC 2790).
The Monitored File Systems (RFC 2790) table lists file system monitoring rules.
3. Select the file system monitoring rule that you want to delete, and then click Delete.
You are prompted to confirm the deletion.
4. Confirm the deletion.
File system monitoring that is specified by the rule for the selected model stops immediately.
Chapter 4: Working with Monitoring Rule Sets 43
Chapter 4: Working with Monitoring Rule Sets
A rule set is a collection of monitoring rules for processes and file systems you can apply to a Global Collection. Rule set automates the process of setting up and managing monitoring for hosts modeled in CA Spectrum. When you create a process or file system monitoring rule for a particular host model, that rule applies only to that host model. If you want to apply the same rule to other host models, create the same rule again and again for each host model. If you want to edit the rule for all models, modify each instance of the rule for each host model. This task is obviously a tedious and inefficient way to manage host monitoring for numerous host models.
By applying rule sets to Global Collections, you leverage a more efficient method of managing IT infrastructure resources. When host models are added to a collection, CA Spectrum creates monitoring rules that reference the processes or file systems for those models. Furthermore, when monitoring rules in rule sets are modified, the modifications apply to all host models in the collection. When host models are removed from a collection, all monitoring rules for the models are removed too.
Create a Rule Set
You can create rule sets that contain multiple monitoring rules for both host processes and file systems, or you can create rule sets that include one or the other. You can apply as many rule sets as you want to a Global Collection. You can also apply the same rule set to multiple collections.
Important! Plan your rule set implementation carefully to avoid duplicating rules or implementing conflicting rules. Duplicate or conflicting rules can cause unexpected results and make troubleshooting difficult. Also verify that the Global Collections to which you apply rule sets include host models that are appropriate for the monitoring rules in those rule sets.
As you create rule sets, keep the following points in mind:
■ Rule sets must have unique names.
■ Rules that are included in rule sets do not override identically named local monitoring rules for host models included in Global Collections. If a local monitoring rule has been created for a particular host model and the model is included in a Global Collection that has a rule set applied to it that contains an identically named rule, the local rule is preserved and remains in effect for the model.
Note: Only users with the appropriate privileges can create monitoring rule sets. For more information, see System and Application Monitoring Privileges (see page 83).

Add a Monitoring Rule to a Rule Set
44 Host System Resources Management User Guide
Follow these steps:
1. Select Locater, System & Application Monitoring, All Monitoring Rules.
The Contents panel lists any rule sets that have been created.
Default rule sets are not present.
2. Click (Create a New Rule Set by Type) and then select one of the following options, depending on the agent you are working with:
■ RFC2790
■ NSM Agent:
■ r11 Windows
■ r11 UNIX
■ 3.1 Windows
■ 3.1 UNIX
The 'New Rule Set' dialog appears.
3. Type a name for the rule set in the Rule Set Name field, and then click OK.
The new rule set appears in the list. You can now add process monitoring and file system monitoring configuration rules to the rule set. And you can apply the rule set to a Global Collection container.
Add a Monitoring Rule to a Rule Set
You can add monitoring rules to a rule set before or after you apply the rule set to a Global Collection.
Follow these steps:
1. Select Locater, System & Application Monitoring, All Monitoring Rules.
The Contents panel lists rule sets.
Note: If no rule sets are listed, create a rule set for the rule, as described in Create a Rule Set (see page 43).
2. Select the rule set to which you want to add the monitoring rule.
The Component Detail panel displays information about the rule set.
Apply a Rule Set to a Global Collection
Chapter 4: Working with Monitoring Rule Sets 45
3. On the Information tab, specify the type of rule to add to the rule set:
■ To add a process monitoring rule, expand Process Monitoring Rules.
■ To add a file system monitoring rule, expand File System Monitoring Rules.
Note: The NSM rule sets do not support file system monitoring rules.
Each rules table lists rules that have been added to the rule set.
4. Click Add for the type of rule to add to the rule set.
Either the Add Monitored Process dialog or the Add File System Monitor dialog opens.
5. Configure settings.
■ See Process Monitoring Rule Parameters (see page 18) for information about configuring a process monitoring rule.
■ See Create a File System Monitoring Rule (see page 39) for information about creating a file system monitoring rule.
6. Click OK.
The rule is added to the rule set.
Apply a Rule Set to a Global Collection
Applying a rule set to a Global Collection automates the process of creating monitoring rules. CA Spectrum automatically creates monitoring rules for all models in the Global Collection.
As you apply rule sets to Global Collections, consider the following facts:
■ If you remove models from the Global Collection, all monitoring rules that are specified by the rule set are removed from the models.
■ If you edit a rule from a rule set for a particular model that is included in a Global Collection, the ownership of a rule changes to local ownership. The rule is no longer associated with the rule in the rule set and applies only to that particular model.
■ If you delete a rule set that is associated with a Global Collection or vice versa, the rules that are specified by the rule set are removed from the models in the collection.
Follow these steps:
1. Select Locater, System & Application Monitoring, All Monitoring Rules.
The Contents panel lists rule sets.
Note: If no rule sets are listed, create a rule set as described in Create a Rule Set (see page 43).

Remove a Rule Set from a Global Collection
46 Host System Resources Management User Guide
2. Right-click the rule set or sets that you want to apply to a Global Collection, and select Apply/Remove Global Collection(s).
The 'Apply and Remove Collection(s) to/from the Rule Set' dialog appears.
All Global Collections that are listed in the left side of the dialog are currently applied to the selected rule set. Global Collections that are listed on the right side have not been applied.
3. In the Not Applied To list, double-click the Global Collection to which you want to apply the rule set.
The selected Global Collection moves to the Applied To list.
Note: You cannot apply Global Collections to multiple rule sets simultaneously.
4. (Optional) Select the Reapply check box to reapply the Global Collection or Collections that are already applied to the rule set when you click OK in the dialog.
5. Click OK to apply your changes.
Note: Only the changes that you made in the dialog are applied. A Global Collection that already appears in the Applied To list is not reapplied unless you have selected the Reapply check box.
The Applied Global Collections List in the Information tab of the selected rule set shows the Global Collections to which it is applied.
Remove a Rule Set from a Global Collection
When you remove a rule set from a Global Collection, CA Spectrum removes monitoring rules in the rule set from all models in the Global Collection.
Follow these steps:
1. Select Locater, System & Application Monitoring, All Monitoring Rules.
The Contents panel lists rule sets.
2. Right-click the rule set or sets from which you want to remove a Global Collection and select Apply/Remove Global Collection(s).
The 'Apply and Remove Collection(s) to/from the Rule Set' dialog appears.
Note: You can also click in the Results tab toolbar to launch this dialog.
All Global Collections that are listed in the left side of the dialog are currently applied to the selected rule set. Global Collections that are listed on the right side have not been applied.
3. In the Applied To list, double-click the Global Collection that you want to remove from the rule set.

Edit a Rule in a Rule Set
Chapter 4: Working with Monitoring Rule Sets 47
The selected Global Collection is moved to the Not Applied To list.
Note: You cannot remove Global Collections from multiple rule sets simultaneously.
4. (Optional) Select the Reapply check box to reapply the Global Collection or Collections that are already applied to the rule set when you click OK in the dialog.
5. Click OK to apply your changes.
Note: Only the changes you made in the dialog are applied. A Global Collection that already appears in the Applied To list is not reapplied unless you have selected the Reapply check box.
The Applied Global Collections List in the selected Information tab of the rule set is updated. The Global Collection or Collections that you removed are no longer displayed.
Edit a Rule in a Rule Set
When you edit a rule in a rule set that is applied to a Global Collection, the revised rule settings extend to all models in the Global Collection.
Important! To edit a rule, you must have a user model in all landscapes where the rule was created.
Follow these steps:
1. Select Locater, System & Application Monitoring, All Monitoring Rules.
The Contents panel lists rule sets.
2. Select the rule set with the rule that you want to edit.
The Component Detail panel displays information about the rule set.
3. In the Component Detail panel, specify the type of rule to edit, either a process monitoring rule or a file system monitoring rule.
Each rule type table lists rules that have been included in the rule set.
4. Select a rule, and click Edit.
The Edit dialog opens.
Note: Some settings are unavailable for edit.
5. Edit settings, and then click OK.
The modified settings take effect immediately.
Delete a Rule from a Rule Set
48 Host System Resources Management User Guide
Editing a Rule Outside of a Rule Set
Under some circumstances, you may want to modify a monitoring rule for a particular model in a Global Collection even though the rule belongs to a rule set that has been applied to a Global Collection. You might not want the modification to apply to the rule in the rule set because the modification would then apply to all models in the Global Collection. But you still want to keep the model in the collection.
In this case, convert the rule to a local version for the model. You can modify this rule from the context of the particular model outside of the rule set to achieve this result.
Delete a Rule from a Rule Set
When you delete a rule from a rule set that is applied to a Global Collection, the rule is removed from all models in the Global Collection.
Follow these steps:
1. Select Locater, System & Application Monitoring, All Monitoring Rules.
The Contents panel lists rule sets.
2. Select the rule set with the rule that you want to delete.
The Component Detail panel displays information about the rule set.
3. In the Component Detail panel, specify the type of rule to delete from the rule set, either a process monitoring rule or a file system monitoring rule.
Each rule table lists rules that have been included in the rule set.
4. Select the rule, and click Delete.
The rule is removed from the rule set and from its rule table.
Deleting a Rule Outside of a Rule Set
Under some circumstances, you may want to delete a rule for a particular model in a Global Collection even though that rule belongs to a rule set that is applied to a Global Collection. You might not want to delete the rule in the rule set and thus delete it for all models in the Global Collection. But you still want to keep the model in the collection.
In this case, delete this rule from the context of the particular model outside of the rule set. When the association between the rule set and the Global Collection is updated, however, the deleted rule is recreated for the model.

Delete a Rule Set
Chapter 4: Working with Monitoring Rule Sets 49
Delete a Rule Set
When you delete a rule set that is applied to a Global Collection, all rules in the rule set are removed from the models in the collection.
Follow these steps:
1. Select Locater, System & Application Monitoring, All Monitoring Rules.
The Contents panel lists all available rule sets.
2. Select the rule set to delete, and click Delete.


Chapter 5: Log File Monitoring 51
Chapter 5: Log File Monitoring
This chapter describes how to set up log file monitoring in OneClick for the following agents:
■ iAgent
■ CA SystemEDGE Agent
■ CA Unicenter NSM Agent
This chapter also describes how to configure iAgent syslog server monitoring and trap forwarding to CA Spectrum.
Setting up log file monitoring entails the following tasks:
■ Specifying the criteria that initiate the trap and the event generation. The traps and events are generated when the type of information that you specify is detected in a log file.
■ (Optional) Specifying an association between a log file and a monitored process model. Events are then generated in response to a log file entry for the process model. The events are generated on the process model rather than on the process host model.
About the Log File Monitoring Process
Various devices on your network can be configured to send data to log files on an iAgent, SystemEDGE agent, or NSM server. Or the applications on one of these servers can send data to a log file. In either case, these agents can be configured to monitor these log files and generate SNMP traps based on the content in log file entries.
Log file monitoring involves setting up a text pattern matching system that detects and parses log files for the type of information that you specify. The monitoring agent then sends a trap to CA Spectrum that contains data about the parsed text. This data is then mapped to a CA Spectrum event and an alarm is asserted on the agent model or the device or process to which it pertains. You can also use an event condition rule to configure CA Spectrum to create a more granular event, and optionally an alarm, from the "text match in log file" event. As a result, you receive notifications of events that have occurred in your infrastructure and that indicate potential or actual problems. For more information, see the Event Configuration User Guide.
The syntax of the log file that you are monitoring depends on the type of log file and the data that is sent to it. Because application log files are matched directly to the applications that you are monitoring, no special log file syntax is required. However, CA Spectrum processes other log files that gather data from other devices differently. Therefore, these log file entries must conform to certain syntax criteria.
Log File Syntax
52 Host System Resources Management User Guide
Regardless of the type of log file that you want to monitor, whether an application log file or a syslog file containing entries for multiple applications from multiple devices, you must define a regular expression (regex) that identifies, or parses, the type of information that you want to monitor. The regex syntax must be compatible with the type of agent. When matching text is found, the monitoring agent sends a trap to CA Spectrum that contains the matching text. CA Spectrum associates the trap to an event that is asserted on the host model.
Note: For more information about defining regular expressions, see the Event Configuration User Guide.
Configuring CA Spectrum to Process Syslog File Matches (see page 63) explains how to configure an agent to monitor log files for strings of information that generate a trap.
Note: iAgent can only monitor log files that exist on the iAgent server. It cannot monitor log files on a mapped network drive.
More information:
Log File Syntax (see page 52)
Log File Syntax
You can monitor application logs or log files that receive data from other devices, such as Syslog files. No special syntax is required for log files that monitor application logs. However, for CA Spectrum to assert the trap information about the appropriate device model, log files that receive information from devices on the network must have the following format, which is based on the BSD Syslog and Cisco IOS format:
<MessagePrefix>%<MessageHeader><Additional_Information>
<MessagePrefix>
Contains the date and time of the message and the IP address or the host name of the source of the information contained in the entry. There can be other information that is interspersed within the prefix, but it must contain these two pieces of information.
Note: If a host name is used to identify the source, it can be of the form myhost.ca.com or myhost.
<MessageHeader>
Must have the format <A>-<B>-
<A>
Contains any number of uppercase alpha characters, underscores, or the string "Aprisma."

Create Log File Monitors for iAgent Hosts
Chapter 5: Log File Monitoring 53
<B>
Contains any number of uppercase alpha characters, numeric characters, or underscores.
<C>
Contains any number of uppercase alpha characters, underscores, or dashes.
<Additional_Information>
Can contain any data.
In general, this syntax can be found in the following types of log files:
■ Solaris syslog file entries from a Cisco or Riverstone device.
■ Solaris syslog file entries from another type of device that uses the <MessageHeader> format described previously.
■ Kiwi syslog file entries from a Cisco or Riverstone device.
■ Kiwi syslog file entries from another type of device that uses the <MessageHeader> format described previously.
■ CA log files.
Note: For information about configuring CA Spectrum to process iAgent traps, see Configuring CA Spectrum to Process Syslog File Matches (see page 63).
More information:
About the Log File Monitoring Process (see page 51)
Create Log File Monitors for iAgent Hosts
The following procedure describes how to set up log file monitoring for iAgent host agents.
Follow these steps:
1. In the Contents panel, select the model with the log file you want to monitor.
Information for this host device appears in the Component Detail panel.
2. In the Component Detail panel, in the Information tab, expand System Resources, Monitored Logs and Process Logs, Monitored Logs.
The Monitored Logs list is displayed.
Note: Some list fields are agent-specific.

Log File Monitors for NSM Agents
54 Host System Resources Management User Guide
3. Click Add in the Monitored Logs list.
The Add Log File Monitor dialog for the agent opens.
4. Configure log file monitor settings as needed. Pay particular attention to the following mandatory and optional settings:
Log File Name
Identifies the monitored log file.
Regular Expression
Identifies the text patterns to parse in the log file.
Note: For more information about defining regular expressions, see the Event Configuration User Guide.
Description
Indicates the purpose of the monitor to other users.
Send Trap on Match/Send Trap
Specifies whether the agent sends a trap to CA Spectrum when the regular expression detects a matching text pattern.
5. Click OK.
The monitoring configuration is added to the Monitored Logs list, and monitoring begins immediately.
Log File Monitors for NSM Agents
You can set up log file monitoring and file monitoring for NSM Agents in OneClick. The following definitions describe how these two monitors differ:
NSM Log File Monitor
An NSM Log File Monitor watches contents of a file for specific patterns.
NSM File Monitor
An NSM File Monitor simply watches for the existence or absence of a file.
NSM Agent log file monitoring lets you perform the following tasks.
■ Edit and view file monitors for NSM Agents
■ Edit and view log monitors for NSM Agents
■ View status changes for file and log monitors for NSM Agents

Log File Monitors for NSM Agents
Chapter 5: Log File Monitoring 55
Set Up a Log File Monitor for NSM Agents Using OneClick
You can use OneClick to set up log file monitoring for NSM host agents.
Follow these steps:
1. In the Contents panel, select the model with the log file that you want to monitor.
Information for this host device appears in the Component Detail panel.
2. In the Component Detail panel, in the Information tab, expand System Resources, Monitored Logs and Files, Monitored Logs.
The Monitored Logs list appears.
3. Click Add in the Monitored Logs list.
The Add Log File Monitor dialog opens.
4. Configure log file monitor settings as needed. The following options are available:
Monitor Name
Identifies the name of this log file monitor.
File Name
Identifies the full path and file name (or wildcarded file name) of the log file to monitor.
Positive Pattern
Places the monitor in a DOWN state if the specified regular expression is found in the file.
Negative Pattern
Places the monitor in a DOWN state if the specified regular expression is not found in the file.
Toggle Positive Pattern
Places the monitor in an UP state if the specified regular expression is found in the file. This field is only available when the Status Policy is toggled or toggledEOF.
Toggle Negative Pattern
Places the monitor in an UP state if the specified regular expression is not found in the file. This field is only available when the Status Policy is toggled or toggledEOF.
Start
Is the starting character position.
End
Is the ending character position.

Log File Monitors for NSM Agents
56 Host System Resources Management User Guide
Status Policy
Defines how the monitor handles files. The following options are available:
poll
Sets monitor status to UP at the beginning of each poll. If a match is made, the state changes to DOWN. The file is scanned from the last read location unless it is a new monitor, in which case the entire file is read.
historical
Sets monitor status to DOWN when a match occurs, and status remains DOWN for the life of the log file. Therefore, the log file is recreated. The file is scanned from the last read location unless it is a new monitor, in which case the entire file is read.
startFromPreviousRead
Sets monitor status to DOWN when a match occurs, and status remains DOWN until you reset it. The file is scanned from the last read location.
toggled
Lets you specify a DOWN pattern, as with the historical attribute, and also an UP pattern (formed with the toggle positive and negative pattern attributes), which is compared for changing the state back to UP. The file is scanned from the last read location.
firstLineOnly
Reads only the first line of a file. The monitor status is set to UP at the beginning of each poll. If a match is found, the state changes to DOWN.
pollEOF
Sets the monitor status to UP at the beginning of each poll. If a match is found, the state changes to DOWN. The file is scanned from the last read location unless it is a new monitor, in which case reading starts at the end of the file.
startFromPreviousReadEOF
Sets the monitor status to DOWN when a match occurs, and status remains DOWN until you reset it. The file is scanned from the last read location unless it is a new monitor, in which case reading starts at the end of the file.
toggledEOF
Lets you specify a down pattern, as with the historical attribute, and also an up pattern (formed with the toggle positive and negative pattern attributes) which is compared for changing the state back to UP. The file is scanned from the last read location unless it is a new monitor, in which case reading starts at the end of the file.

Log File Monitors for NSM Agents
Chapter 5: Log File Monitoring 57
rescan
Rescans the file from the beginning if the file length has increased. If the file exceeds 10 KB, sets the monitor to UNKNOWN.
Monitor Status
Lets you disable the status side of the monitor without matching trap sending. The following options are available:
downCritical
Indicates that the state change works as configured and a critical alert is raised.
doNotMonitor
Indicates that the log file is monitored, but the state is always UP.
downWarning
Indicates that the state change works as configured and a warning alert is raised.
Trap Send Policy
Defines the policy that is applied to the monitor status traps. The following options are available:
never
Indicates that the state change never causes traps to be sent.
once
Indicates that the state change trap is sent only when the monitor state changes.
perPoll
Indicates that the state change trap is sent every poll, even if the state does not change but a match condition occurred since the last poll.
each
Indicates that the state change trap is sent for each match that the agent finds. For toggle attributes, when the monitor goes down, the toggle pattern is the next match that is looked for. As a result, subsequent down patterns are not matched.
Match Trap Policy
Defines the policy that is applied to the match traps. The following options are available:

Log File Monitors for NSM Agents
58 Host System Resources Management User Guide
send
Sends a trap for each match that is found. For toggle attributes, when the monitor goes down, the toggle pattern is the next match that is looked for. As a result, subsequent down patterns are not matched unless status monitoring is switched off.
doNotSend
Does not send a trap for each match found.
History Policy
Defines whether trap details are stored in the history table. The following options are available:
generateHistory
Indicates that status traps are recorded in the history table.
noGenerateHistory
Indicates that status traps are not recorded in the history table.
5. Click OK.
The monitoring configuration is added to the Monitored Logs list. Monitoring begins immediately.
Set Up a File Monitor for NSM Agents Using OneClick
You can use OneClick to set up log file monitoring for NSM host agents.
Follow these steps:
1. In the Contents panel, select the model with the file that you want to monitor.
Information for this host device appears in the Component Detail panel.
2. In the Component Detail panel, in the Information tab, expand System Resources, Monitored Logs and Files, Monitored Files.
The Monitored Files list is displayed.
3. Click Add in the Monitored Files list.
The Add File Monitor dialog opens.
4. Configure file monitor settings. Pay particular attention to the following mandatory and optional settings:
Monitor Name
Identifies the name of the file monitor.
File Name
Identifies the name of the file that this monitor watches.
Create Log File Monitors for SystemEDGE Hosts
Chapter 5: Log File Monitoring 59
File Exists
Indicates whether the file exists.
Trap Send Policy
Specifies the frequency with which the NSM Agent sends traps. The following settings are available:
never
Never sends a trap.
once
Sends a trap only when the state has changed.
perPoll
Sends a status trap at each poll if the state is DOWN.
History Policy
For details about History Policy settings, see Set Up a Log File Monitor for NSM Agents Using OneClick (see page 55).
5. Click OK.
The monitoring configuration is added to the Monitored Files list, and monitoring begins immediately.
Create Log File Monitors for SystemEDGE Hosts
You can use OneClick to set up log file monitoring for a SystemEDGE host agent.
Follow these steps:
1. In the Contents panel, select the model with the log file that you want to monitor.
Information for this host device appears in the Component Detail panel.
2. In the Component Detail panel, in the Information tab, expand System Resources, Monitored Logs and Process Logs, Monitored Logs.
The Monitored Logs list appears.
3. Click Add in the Monitored Logs list.
The Add Log File Monitor dialog for the agent opens.
4. Configure the log file monitor settings as needed:
Log File Name or Directory Name
Identifies the monitored log file or directory, depending on the Monitor Type.
Create Log File Monitors for SystemEDGE Hosts
60 Host System Resources Management User Guide
Monitor Type
Identifies whether to monitor a log file or a directory.
File
Indicates that a log file is monitored.
Directory
Indicates that a directory is monitored. You can also specify whether to Monitor Recursively and whether to Follow Symbolic Links.
Description
(Optional) Is a brief description to indicate the purpose of the monitor, for example.
Interval
Is the interval, in minutes, between successive scans of the log file.
Severity
Is the severity to use for this monitor entry.
Parse File
Is a regular expression to match in the log file (up to 256 characters). The value must be a valid string, as defined in ed(1).
Does Not Match
Indicates whether to apply a logical NOT operator when parsing the log file.
Execute Action
Is a string that specifies the command that is executed after finding a match (up to 4096 characters). The action script must be present on the host.
Send Arguments
Indicates whether to send default arguments to action scripts or programs (for example, trap type, a description field).
Send SNMP Traps
Specifies whether the agent sends a trap to CA Spectrum when the regular expression detects a matching text pattern.
Send Not-Ready Trap
Indicates whether to send not-ready traps.
Single
A single not-ready trap is sent.
Continuous
A continuous not-ready trap is sent.
Log-to-Process Mapping
Chapter 5: Log File Monitoring 61
Reinitialize Entry
Indicates whether to reinitialize the entry.
Breach After x Consecutive Matches
Indicates whether to send a trap after the specified number of consecutive matches have occurred.
Log Events
Specifies whether to log events.
5. Click OK.
The monitoring configuration is added to the Monitored Logs list, and monitoring begins immediately.
Log-to-Process Mapping
CA Spectrum can generate an event on the process that a parsed log file entry references rather than on the host model. To configure such events, verify that the process monitoring rule for the host model references the process. And associate the process with the log file that includes the entry that is related to the process. See Process Monitoring (see page 15) for more information about process monitoring rules.
Specify a Mapping for RFC 2790 Agents and SystemEDGE Hosts
You can use OneClick to specify a mapping of log to process for RFC 2790 Agents.
Follow these steps:
1. In the Contents panel, select the model with the log files that you want to monitor.
Information for this host device appears in the Component Detail panel.
2. In the Component Detail panel, expand System Resources, Monitored Logs and Process Logs, Monitored Process Log File Mappings.
The Monitored Process Log File Mappings list appears.
3. Click Add in the Monitored Process Log File Mappings list.
The Add Log to Process Mapping dialog appears.
4. Enter the following data:
Log File Name
Is the log file to monitor.
Process Name
Is the process that is specified in the process monitoring rule.

Log-to-Process Mapping
62 Host System Resources Management User Guide
5. Click OK.
The mapping is added to the Monitored Process Log File Mappings list. CA Spectrum generates events on the monitored process model whenever text about the process is parsed from a log file.
Mapping for NSM r11 Agents
You can use OneClick to specify a mapping of log to process for NSM r11 Agents.
Note: You cannot create mappings for NSM 3.1 Agents.
Follow these steps:
1. In the Contents panel, select the model with the log files that you want to monitor.
Information for this host device appears in the Component Detail panel.
2. In the Component Detail panel, expand System Resources, Monitored Logs and Files, Monitored Process Log File Mappings.
The Monitored Process Log File Mappings list appears.
3. Click Add in the Monitored Process Log File Mappings list.
The Add Log to Process Mapping dialog opens.
4. Enter the following data:
Log File Name
Name of the log file.
Monitor Name
Name of the process monitor. This value likely differs from the name that is specified for the process in the process monitoring rule.
5. Click OK.
The mapping is added to the Monitored Process Log File Mappings list. CA Spectrum generates events on the monitored process model whenever text about the process is parsed from a log file.
Configuring CA Spectrum to Process Syslog File Matches
Chapter 5: Log File Monitoring 63
Managing Monitored Log and Process Log Mapping Settings
You can use OneClick to edit and delete monitored log and process log file mapping settings.
■ To edit monitored log and process log file mapping settings, select a configuration entry that you want to modify, click Edit on the configuration entry list, edit the entry, and then click OK.
Note: You cannot edit an active monitor entry. To edit a monitor entry that is in an active state, change the status of the entry to notInService(2) or notReady(3). You can perform this task in MIB Tools, using the SET command.
■ To delete monitored log and process log file mapping settings, select a configuration entry that you want to remove, click Delete on the configuration entry list, and then click OK.
Configuring CA Spectrum to Process Syslog File Matches
You can configure CA Spectrum to process a syslog file matches from iAgent, SystemEDGE, and NSM Agents.
Trap Processing Overview
Each trap that an agent generates based on the content of a log file entry has an OID. This OID generates the CA Spectrum event 0x3e00009 based on the trap mapping in the AlertMap file of agent. This event is asserted on the model.
The matched line of each log file entry (up to 255 characters) and the log file name that generated the trap is sent as part of the trap information. CA Spectrum parses the trap data to determine the original source of the log file entry. The source can be an IP Address, host name, CA Spectrum model handle, or application log file name.
Processing Traps That Contain an IP Address, Host Name, or Model Handle
If an IP address, host name, or a model handle has been extracted as the source of the log file entry, CA Spectrum can find the device model that matches the IP address, host name, or model handle and can assert the event on this model. If the log file entry conforms to the syntax described in Log File Syntax (see page 52), to make the event asserted on the device model meaningful, you can create a ParseMap file to customize the event and its contents.
Note: CA Spectrum contains many ParseMap files. You do not always have to create one.

Configuring CA Spectrum to Process Syslog File Matches
64 Host System Resources Management User Guide
If no ParseMap file is created, the event that is routed to the device model is the same event asserted on the mode of the agentl.
Create ParseMap Files
ParseMap files specify the event that is associated with the information in the incoming trap. In addition, ParseMap files allow you to specify that portions of the log file entry text be used as event variables. You can use these variables in conjunction with an Event Rule to process the event.
Note: For information about event processing and Event Rules, see the Event Configuration User Guide.
As described in Log File Syntax, a log file entry contains the following components:
<MessagePrefix>%<MessageHeader><Additional_Information>
CA Spectrum identifies the ParseMap file that processes the trap by finding the ParseMap file whose name matches the text of the <MessageHeader> from the log file entry. The following log is an example of a log file entry:
2004-2-19 11:19:14 Local7.Info 172.19.38.36 Feb 19 09:14:50
%SNMP-I-SENT_TRAP, Sending notification linkUp to 192.168.32.44
The <MessageHeader> portion of the entry is SNMP-I-SENT_TRAP. As a result, CA Spectrum looks for a ParseMap file named SNMP-I-SENT_TRAP. Create a ParseMap file for each log entry with a unique <MessageHeader> that you configure to generate a trap.
Note: Many ParseMap files are available for use in CA Spectrum. You can find them in the following directory: <$SPECROOT>/SS/CsVendor/ParseMaps.
Follow these steps:
1. Create new text file using any text editor.
A text file is ready for editing.
2. In the first line of the text file, type the new event file name for the event that you want to generate. The event file name must begin with Eventffff and end with xxxx where x is any valid hexadecimal number.
For example, Eventffff1A2F and Eventffff1234 are the valid event file names; Event012za8b is not.

Configuring CA Spectrum to Process Syslog File Matches
Chapter 5: Log File Monitoring 65
3. Add a new line in the text file (press the Enter key).
4. Use this line as the <Additional_Information> portion of the log file entry. You can specify portions of this text as event variables, which can be used to process the event with an Event Rule.
Specify variables using a data type and an integer. Valid data types are STRING, STRINGNOWS, INTEGER, and IPADDRESS. See STRING Data Type Usage Guidelines (see page 66) for important information.
The following image shows a valid ParseMap file for the log entry shown in the previous section. The variable 1 stores Uplink as a String. The Variable 2 stores 192.168.32.44 as an IP Address.
5. Save the text file in the <$SPECROOT>/SS/CsVendor/ParseMaps directory. The name of this text file must match the <MessageHeader> portion of the log file entry. In this example, the filename would be SNMP-I-SENT_TRAP.
Note: Do not include a file extension in the filename.
Only the first two lines of the ParseMap file are processed. The information that you include on subsequent lines is not processed but can be included for informational purposes.
More information:
Log File Syntax (see page 52)
ParseMap File Example
The following sequence of lines is an example of a ParseMap file that is provided with CA Spectrum named SYS-0-MOD_TEMPMAJORFAIL. The ParseMap file can be found in the following directory: <$SPECROOT>/SS/CsVendor/ParseMaps.
Event04bd1522
Module {STRING 1} major temperature threshold exceeded
%SYS-0-MOD_TEMPMAJORFAIL: Module {STRING} major temperature threshold exceeded
Configuring CA Spectrum to Process Syslog File Matches
66 Host System Resources Management User Guide
This instructs a matched syslog file:
Jul 28 10:56:42 [10.253.9.11.2.45] 7931: *Jul 28 10:50:47.271:
%SYS-0-MOD_TEMPMAJORFAIL: Module 100 major temperature threshold exceeded
This causes the event Event04bd1522 to be generated on the model with the IP address 10.253.9.11, even though the agent generated the trap.
STRING Data Type Usage Guidelines
This section provides important information about using STRING data types in your ParseMap files.
Valid STRING Data Types
As mentioned in "To create a ParseMap file," the following data types are valid for use in variables.
STRING
Matches all string characters up to the next literal, data type, or to the end of a string.
STRINGNOWS
Matches all string characters up to the next space, literal, data type, or the end of a string.
INTEGER
Matches any positive integer value.
IPADDRESS
Matches any valid IPv4 address.
Whitespace in STRING Variables
Because whitespace is a valid character in the definition of the STRING variable, always separate multiple STRING tokens with recognizable patterns.
For example, The following ParseMap are valid entries:
{STRING 1}, {STRING 2}
{STRING 1} {IPADDRESS 2} {STRING 3}
{STRING 1} literal text {STRING 2}
{STRINGNOWS 1} {STRING 2}
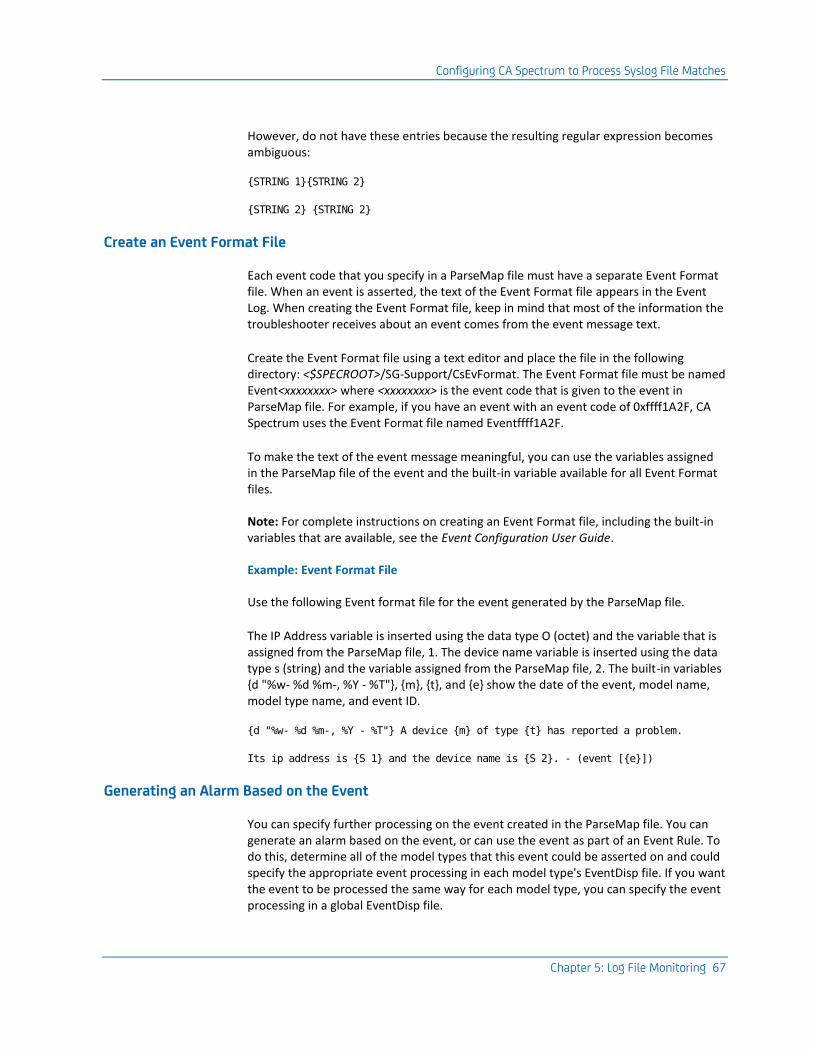
Configuring CA Spectrum to Process Syslog File Matches
Chapter 5: Log File Monitoring 67
However, do not have these entries because the resulting regular expression becomes ambiguous:
{STRING 1}{STRING 2}
{STRING 2} {STRING 2}
Create an Event Format File
Each event code that you specify in a ParseMap file must have a separate Event Format file. When an event is asserted, the text of the Event Format file appears in the Event Log. When creating the Event Format file, keep in mind that most of the information the troubleshooter receives about an event comes from the event message text.
Create the Event Format file using a text editor and place the file in the following directory: <$SPECROOT>/SG-Support/CsEvFormat. The Event Format file must be named Event<xxxxxxxx> where <xxxxxxxx> is the event code that is given to the event in ParseMap file. For example, if you have an event with an event code of 0xffff1A2F, CA Spectrum uses the Event Format file named Eventffff1A2F.
To make the text of the event message meaningful, you can use the variables assigned in the ParseMap file of the event and the built-in variable available for all Event Format files.
Note: For complete instructions on creating an Event Format file, including the built-in variables that are available, see the Event Configuration User Guide.
Example: Event Format File
Use the following Event format file for the event generated by the ParseMap file.
The IP Address variable is inserted using the data type O (octet) and the variable that is assigned from the ParseMap file, 1. The device name variable is inserted using the data type s (string) and the variable assigned from the ParseMap file, 2. The built-in variables {d "%w- %d %m-, %Y - %T"}, {m}, {t}, and {e} show the date of the event, model name, model type name, and event ID.
{d "%w- %d %m-, %Y - %T"} A device {m} of type {t} has reported a problem.
Its ip address is {S 1} and the device name is {S 2}. - (event [{e}])
Generating an Alarm Based on the Event
You can specify further processing on the event created in the ParseMap file. You can generate an alarm based on the event, or can use the event as part of an Event Rule. To do this, determine all of the model types that this event could be asserted on and could specify the appropriate event processing in each model type's EventDisp file. If you want the event to be processed the same way for each model type, you can specify the event processing in a global EventDisp file.
Configuring CA Spectrum to Process Syslog File Matches
68 Host System Resources Management User Guide
If you have specified that an alarm is created based on an event, create a probable cause file that are displayed in the OneClick Console when the alarm is asserted.
Note: For more information about EventDisp and probable cause files, see the Event Configuration User Guide.
Apply the Changes to the SpectroSERVER
To activate the new or updated Event Format and ParseMap files, apply the changes to the SpectroSERVER. This can be done using the Update command found in the Event Configuration Editor, using the command line interface, or by stopping and restarting the SpectroSERVER. See the Event Configuration User Guide for more information about each of these methods.
Enable Event Forwarding for Agent Models
You can configure the model of an agent to forward events to models on remote landscapes. Set the SBG_AlertForwardingEnabled (0x3dc000c) attribute for the model to TRUE.

Chapter 6: Application Monitoring 69
Chapter 6: Application Monitoring
SystemEDGE Application Insight Modules (AIMs)
The SystemEDGE agent provides a plug-in architecture through which it can load Application Insight Modules (AIMs) when it initializes. These AIMs provide an extensible and flexible approach to supporting application-specific semantic knowledge.
CA Spectrum supports the following AIMs:
■ Apache Web Server
■ Microsoft IIS
■ CA Insight DPM for DB2, Oracle, SQL Server, and Sybase
Note: The SystemEDGE AIMs are available from the Information tab in the Component Detail panel for a selected SystemEDGE agent.
In addition, CA Spectrum reports alarms which are sent through traps by the Insight AIMs. Each Insight AIM sends out a trap unique to its type, which lets you differentiate between the Insight AIM agent types. Detailed per-alarm information also includes the database name, the alarm type, and the alarm description.
The Insight AIM alarm types vary between agent types and cover a wide range of notifiable conditions. These AIM alarms are no different from other alarms in CA Spectrum and appear in the same tables and offer the same functionality.
Apache Web Server
The AIM for Apache lets you monitor the health and availability of the Apache web server.
This module works with the SystemEDGE agent to provide the following information:
■ The number of "hits" that your web server is receiving. You can track daily volume and set monitor points to watch for unusual traffic levels or denial of service attacks.
■ The amount of space that your web log file and web server file are consuming.
■ Idle services and active processes. You can gauge how effectively the Apache web server processes monitor idle services, see a warning when the number of idle services is too low, and can monitor the number of active processes.
SystemEDGE Application Insight Modules (AIMs)
70 Host System Resources Management User Guide
■ The percentage of system resources (CPU and memory) that the Apache web server is using.
■ Whether bottlenecks on your web server are related to the CPU, memory, disk, or network.
Microsoft IIS
The AIM for Microsoft IIS provides you with the information you required to monitor the Microsoft IIS application and its use of your system resources.
This module works with the SystemEDGE agent to let you do the following tasks:
■ Monitor the availability of Microsoft IIS and its services (Web, FTP, SMTP, and NNTP).
■ Automatically restart any service that fails.
■ Determine if Microsoft IIS starts to consume significant levels of system resources, including central processing unit (CPU) usage, disk space, and memory.
■ Monitor logs for security, system, and application events across the Web, FTP, SMTP, and NNTP services.
■ Detect error statistics across the Active Server Pages (ASP), Common Gateway Interface (CGI), and Internet Server Application Program Interface (ISAPI) application extension pages, including Web 404 (page-not-found) errors and ASP script errors.
CA Insight DPM
The Insight AIM provides important information about performance, configuration, availability, and health of DBMS type, for real-time management and long term trending and capacity planning.
The Insight AIM implements a management information base (MIB) that includes variables that are specific to each supported DBMS type. The following DBMS types are supported:
■ DB2
■ Oracle
■ SQL Server
■ Sybase

Chapter 7: CA Unicenter NSM Agent 71
Chapter 7: CA Unicenter NSM Agent
This section contains the following topics:
Introduction to CA Unicenter NSM Agent (see page 71) View NSM Agent Information (see page 76) NSM Agent Dashboards and Performance Reports (see page 77) Trap-to-Alarm Mapping (see page 79) Event Code and Probable Cause File ID Ranges (see page 80) NSM System Agent Status in CA Spectrum (see page 80)
Introduction to CA Unicenter NSM Agent
CA Spectrum management module SM-CAI1000 provides support in CA Spectrum for management of CA Unicenter NSM agents from the OneClick interface. This management module provides the following CA Spectrum features for CA Unicenter r11 and 3.1 versions of NSM agents:
■ CA Spectrum provides unique device model types for NSM agent hosts. This support enables the management of NSM agents as well as their host devices in CA Spectrum.
■ The OneClick interface displays system information that is gathered by NSM agents and lets you configure process, log file, and file monitoring on NSM agent hosts.
Note: Process monitors are models in CA Spectrum, thus you can set up alarm conditions for the monitor models, generate reports on monitor model events and alarms with the CA Spectrum Report Manager application, and incorporate monitor models into CA Spectrum service level agreement management configurations.
For more information about the process monitoring capabilities of the NSM agent, see Process Monitoring (see page 15).
For more information about the log file and file monitoring capabilities of the NSM agent, see Create Log File Monitors for NSM Agents (see page 54).
■ CA Spectrum generates events and alarms upon receipt of NSM agent traps.
■ CA Spectrum provides insight into the proprietary interfaces of NSM agent host devices.
■ CA Spectrum provides launch points for CA Unicenter Web management interfaces such as Agent Dashboards from within OneClick.
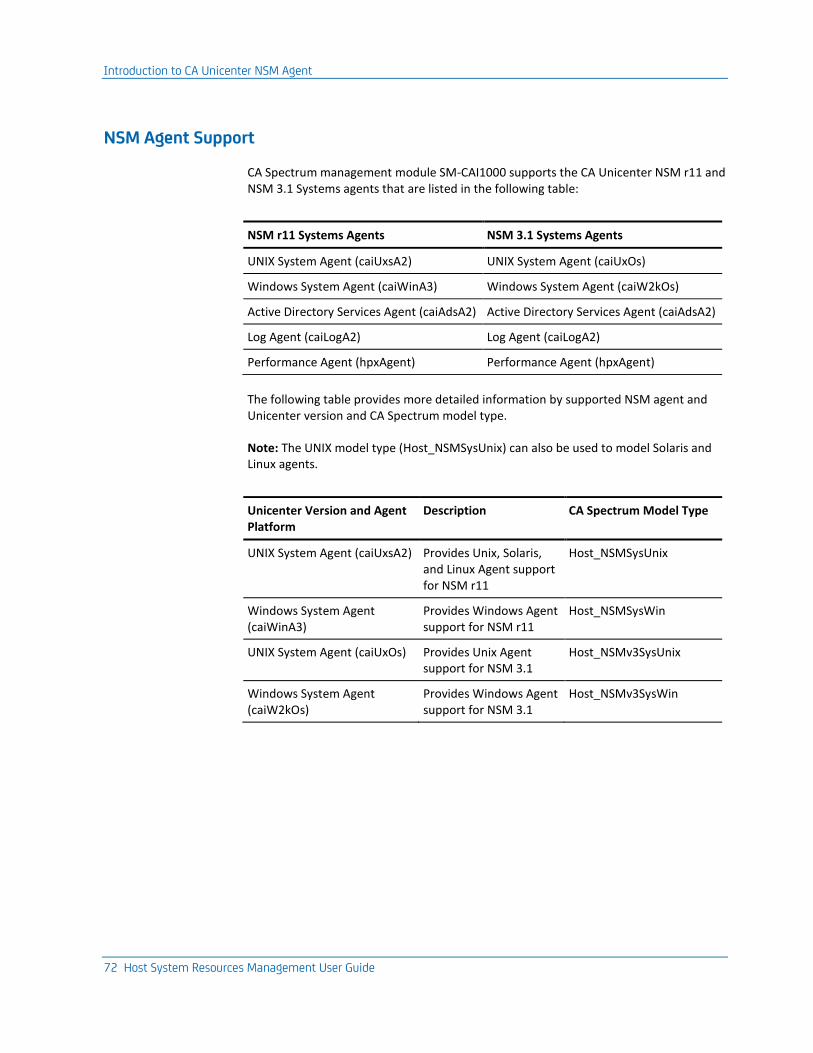
Introduction to CA Unicenter NSM Agent
72 Host System Resources Management User Guide
NSM Agent Support
CA Spectrum management module SM-CAI1000 supports the CA Unicenter NSM r11 and NSM 3.1 Systems agents that are listed in the following table:
NSM r11 Systems Agents NSM 3.1 Systems Agents
UNIX System Agent (caiUxsA2) UNIX System Agent (caiUxOs)
Windows System Agent (caiWinA3) Windows System Agent (caiW2kOs)
Active Directory Services Agent (caiAdsA2) Active Directory Services Agent (caiAdsA2)
Log Agent (caiLogA2) Log Agent (caiLogA2)
Performance Agent (hpxAgent) Performance Agent (hpxAgent)
The following table provides more detailed information by supported NSM agent and Unicenter version and CA Spectrum model type.
Note: The UNIX model type (Host_NSMSysUnix) can also be used to model Solaris and Linux agents.
Unicenter Version and Agent Platform
Description CA Spectrum Model Type
UNIX System Agent (caiUxsA2) Provides Unix, Solaris, and Linux Agent support for NSM r11
Host_NSMSysUnix
Windows System Agent (caiWinA3)
Provides Windows Agent support for NSM r11
Host_NSMSysWin
UNIX System Agent (caiUxOs) Provides Unix Agent support for NSM 3.1
Host_NSMv3SysUnix
Windows System Agent (caiW2kOs)
Provides Windows Agent support for NSM 3.1
Host_NSMv3SysWin
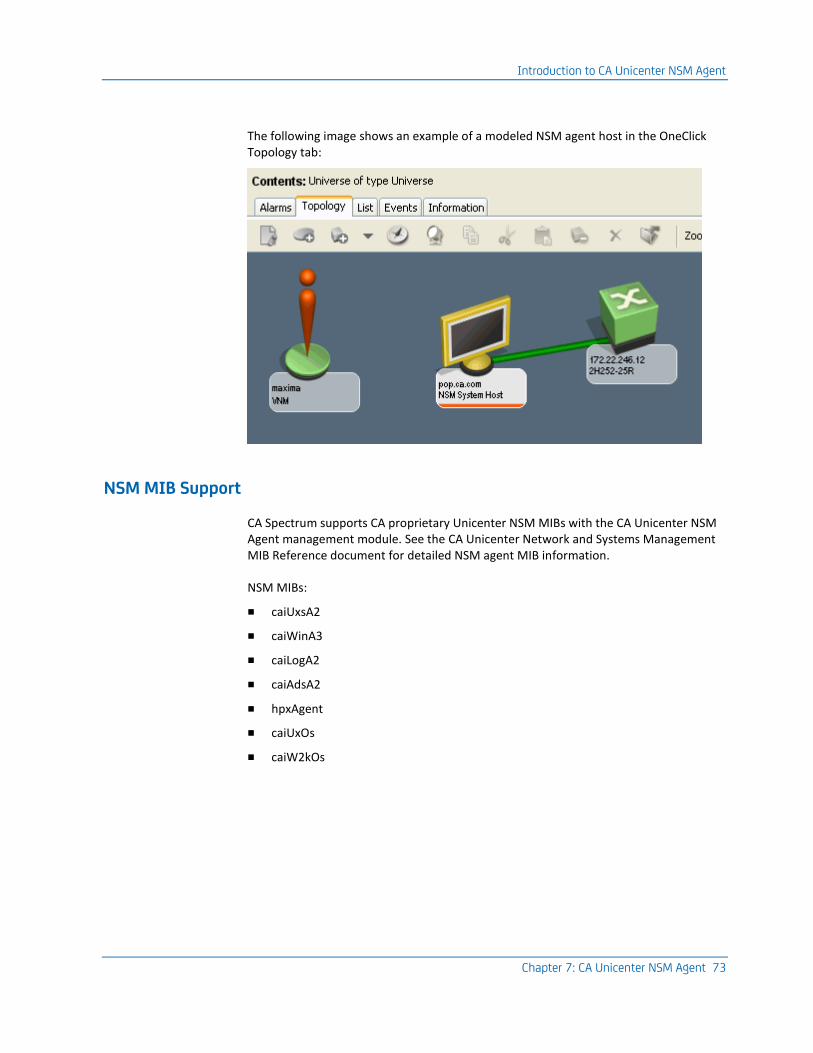
Introduction to CA Unicenter NSM Agent
Chapter 7: CA Unicenter NSM Agent 73
The following image shows an example of a modeled NSM agent host in the OneClick Topology tab:
NSM MIB Support
CA Spectrum supports CA proprietary Unicenter NSM MIBs with the CA Unicenter NSM Agent management module. See the CA Unicenter Network and Systems Management MIB Reference document for detailed NSM agent MIB information.
NSM MIBs:
■ caiUxsA2
■ caiWinA3
■ caiLogA2
■ caiAdsA2
■ hpxAgent
■ caiUxOs
■ caiW2kOs

Introduction to CA Unicenter NSM Agent
74 Host System Resources Management User Guide
Modeling NSM Agents in CA Spectrum
NSM agents can be discovered and modeled automatically using CA Spectrum Discovery, or you can model them manually. Consider the following factors when you model NSM agents in CA Spectrum:
■ NSM agent hosts that run additional SNMP agents
■ Modeling considerations for accessing the NSM web portals
Note: For more information about modeling, see the Modeling and Managing Your IT Infrastructure Administrator Guide.
NSM Agent Hosts that Run Additional SNMP Agents
When you model and manage NSM agents in CA Spectrum, be aware that other agents running on the host device can also be discovered and modeled by CA Spectrum during a Discovery. Because NSM agents use UDP port 6665 for SNMP communications by default rather than the standard SNMP port 161.
For example, if a Windows workstation is running an NSM agent bound to port 6665 and the Microsoft SNMP agent bound to port 161, CA Spectrum creates two models for the device; an NSM System Host device model and a Windows Host device model, as shown in the following image:
This scenario can create poor performance for the following reasons:
■ Unnecessary duplicate models in CA Spectrum.
■ Redundant SNMP traffic and polling which can reduce the network and CA Spectrum performance.
■ Reduction in performance of the agent host machine due to multiple management agents providing performance data.

Introduction to CA Unicenter NSM Agent
Chapter 7: CA Unicenter NSM Agent 75
To avoid this scenario:
■ Before discovery and modeling, stop and remove all management agents except the one you want to use to manage the system. This cleanup avoids creating and managing multiple models in CA Spectrum for the same host.
■ If you must run more than one agent on a given host system, consider manually modeling only the agent that you want to manage with CA Spectrum.
Modeling Considerations for Accessing NSM Web Portals
In order to have access to the NSM web portal and Reporting launch points in OneClick you must first model the NSM agents in CA Spectrum using the name service rather than the IP address.
Note: For more information about modeling devices in OneClick, see the Modeling and Managing Your IT Infrastructure Administrator Guide.
Whenever an NSM agent host is already modeled in CA Spectrum by IP instead of by the name service, you can remove the model, configure the CA Spectrum model naming, and then manually remodel the agent.
To manually re-model the agent
1. Right-click the IP-named NSM agent device model in the Topology tab and click Delete.
The model is deleted from CA Spectrum.
2. Right-click the VNM icon in the Topology view and click Component Detail.
The Component Detail window opens in the context of the VNM.
3. Expand the SpectroSERVER Control subview in the Information tab of the Component Detail window for the VNM.
4. Click Set Order to change the Model Naming Order on the VNM.
The Set Order dialog opens.
5. Select Name Service and move it to the top of the list using the up arrow button and click OK.
The Set Order dialog closes.
6. In the OneClick topology view, remodel the NSM agent host using the Create New Model by IP button.
The new NSM agent model is named with the name service of the device.

View NSM Agent Information
76 Host System Resources Management User Guide
NSM Agent Interface Support in CA Spectrum
NSM agents do not support the standard MIB-II interface table but instead use a proprietary interface table defined in the relevant CA MIB. Because of this behavior, the NSM agent management module is designed to provide interface support that is based on the proprietary NSM interface table. The following table provides the correlation between the MIB-2 attributes and the corresponding proprietary NSM MIB objects.
MIB-2 Attribute
NSM r11 Windows OS agent (caiWinA3) Attribute
NSM 3.1 Windows OS agent (caiW2kOs) Attribute
NSM r11 Unix OS agent (caiUxsA2) Attribute
NSM 3.1 Unix OS agent (caiUxOs) Attribute
ifIndex winEHIfIndex w2kEHIfIndex uxsEHIfIndex ux3EHIfIndex
ifType winEHIfType w2kEHIfType uxsEHIfType ux3EHIfType
ifSpeed winEHIfSpeed w2kEHIfSpeed uxsEHIfSpeed ux3EHIfSpeed
ifPhysAddress winEHIfPhysAddres w2kEHIfPhysAddress uxsEHIfPhysAddres ux3EHIfPhysAddress
ifDescr winEHIfDescr w2kEHIfDescr uxsEHIfDescr ux3EHIfDescr
IpAdEntAddr winEHIfIpAdEntAddr w2kEHIfIpAdEntAddr uxsEHIfIpAdEntAddr ux3EHIfIpAdEntAddr
ifAdminStatus winEHIfAdminStatus w2kEHIfAdminStatus uxsEHIfAdminStatus ux3EHIfAdminStatus
ifOperStatus ifOperStatus w2kEHIfOperStatus uxsEHIfOperStatus ux3EHIfOperStatus
ifLastChange winEHIfLastChange w2kEHIfLastChange uxsEHIfLastChange ux3EHIfLastChange
View NSM Agent Information
CA Spectrum OneClick provides visibility into information that the NSM System agents gather. You can configure process, log file, and file monitoring in the System Resource subview section. Other views provide read-only information that is available from the proprietary MIB values.
You can access NSM agent information in OneClick. This procedure assumes that you have already modeled the NSM agents in your network, either by Discovery or by modeling them manually.
Follow these steps:
1. Select a modeled NSM agent device icon in the Topology tab.
The Component Detail panel displays the Information tab for the selected NSM agent model.
2. Expand the System Resources subview.
NSM agent-specific information is displayed.

NSM Agent Dashboards and Performance Reports
Chapter 7: CA Unicenter NSM Agent 77
More information:
Modeling NSM Agents in CA Spectrum (see page 74)
NSM Agent Dashboards and Performance Reports
The CA Unicenter NSM Agent management module provides OneClick launch points for NSM agent dashboards and Performance reporting. You configure the launch points using the NSM configuration utility available from the OneClick Administration Pages.
Note: Access to the launch points requires you to model the NSM agents in CA Spectrum by device name rather than IP address.
NSM launch points in OneClick include:
■ NSM Agent Dashboards
■ NSM Performance Report
Configure CA Spectrum to Launch NSM User Interfaces
To enable context-sensitive launching of Unicenter NSM dashboard and report server from CA Spectrum, configure values for your environment on the OneClick web server. You configure values using the NSM Configuration page in the OneClick Administration Pages.
CA Spectrum saves the configuration values to a customized version of the default <Install Area>/tomcat/webapps/spectrum/WEB-INF/topo/config/nsm-system-config.xml file to the <Install Area>/custom/topo/config/ directory. This directory is not overwritten when you upgrade, so your NSM configuration values are retained.
You can configure custom values for launching the Unicenter NSM dasboard.
Follow these steps:
1. Click Administration in the OneClick home page.
The Administration Pages open.
2. Click NSM Configuration in the panel on the left.
The NSM Configuration window opens.

NSM Agent Dashboards and Performance Reports
78 Host System Resources Management User Guide
3. Complete the fields as needed:
NSM Dashboard Server Name
Identifies the NSM dashboard server (server.domain.extension).
NSM Dashboard Server Port
Default value is 9090.
NSM Report Server
Identifies the NSM report server (server.domain.extension).
NSM Report Port
Default value is 9090.
4. Click Save.
5. Restart any running OneClick clients for the changes to take effect.
The custom values are configured.
Launch Agent Dashboards
To launch agent dashboards, right-click the NSM agent device model in the OneClick Topology view, and select the NSM agent dashboard that you want to launch.
The Unicenter Dashboard Web interface opens.
Launch Performance Reporting
OneClick provides a performance reporting menu selection for each of the NSM model types. The performance reporting menu selection is available by right-clicking on an NSM device model. This menu selection launches Unicenter WRS-based Systems Performance Reports.
For NSM performance reporting to be launched from OneClick, each of the following conditions must be true:
■ The hpxAgent must be installed on the NSM agent host.
■ The WRS to which a connection is required must have Systems Performance Reporting installed.
■ The WRS also requires a connection that serves data for the given host server.
■ OneClick must be configured as described in Configure CA Spectrum OneClick to Launch NSM User Interfaces (see page 77).
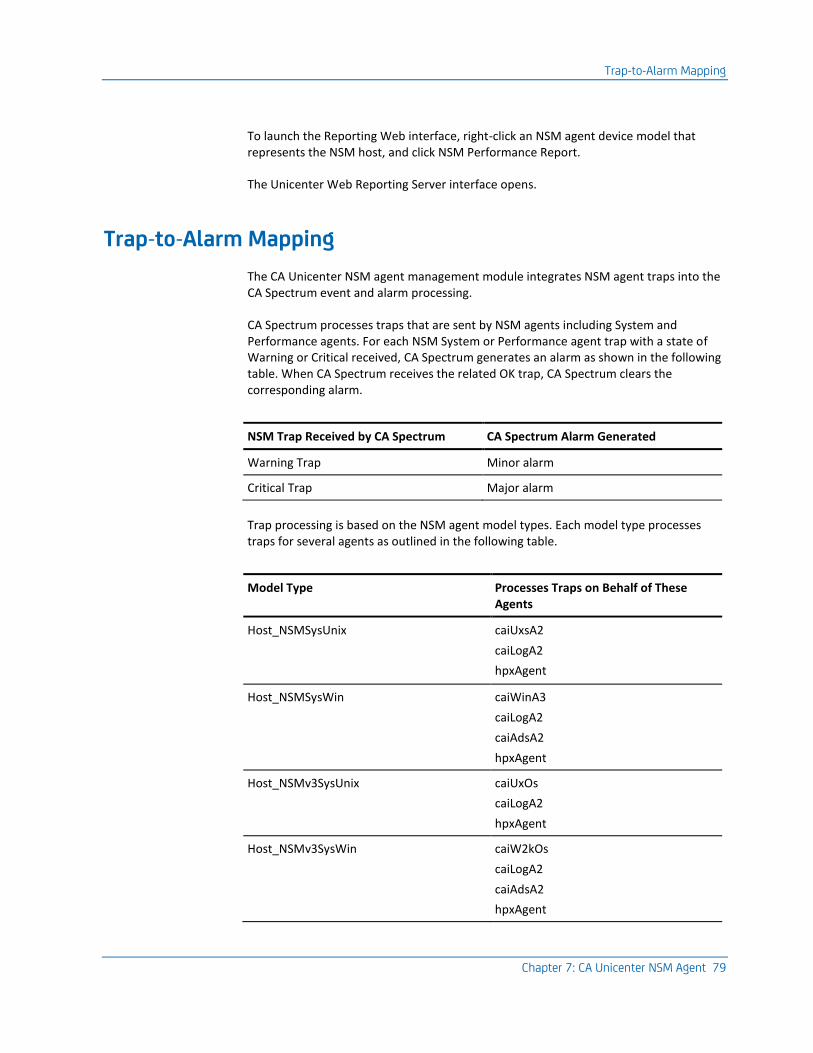
Trap-to-Alarm Mapping
Chapter 7: CA Unicenter NSM Agent 79
To launch the Reporting Web interface, right-click an NSM agent device model that represents the NSM host, and click NSM Performance Report.
The Unicenter Web Reporting Server interface opens.
Trap-to-Alarm Mapping
The CA Unicenter NSM agent management module integrates NSM agent traps into the CA Spectrum event and alarm processing.
CA Spectrum processes traps that are sent by NSM agents including System and Performance agents. For each NSM System or Performance agent trap with a state of Warning or Critical received, CA Spectrum generates an alarm as shown in the following table. When CA Spectrum receives the related OK trap, CA Spectrum clears the corresponding alarm.
NSM Trap Received by CA Spectrum CA Spectrum Alarm Generated
Warning Trap Minor alarm
Critical Trap Major alarm
Trap processing is based on the NSM agent model types. Each model type processes traps for several agents as outlined in the following table.
Model Type Processes Traps on Behalf of These Agents
Host_NSMSysUnix caiUxsA2
caiLogA2
hpxAgent
Host_NSMSysWin caiWinA3
caiLogA2
caiAdsA2
hpxAgent
Host_NSMv3SysUnix caiUxOs
caiLogA2
hpxAgent
Host_NSMv3SysWin caiW2kOs
caiLogA2
caiAdsA2
hpxAgent
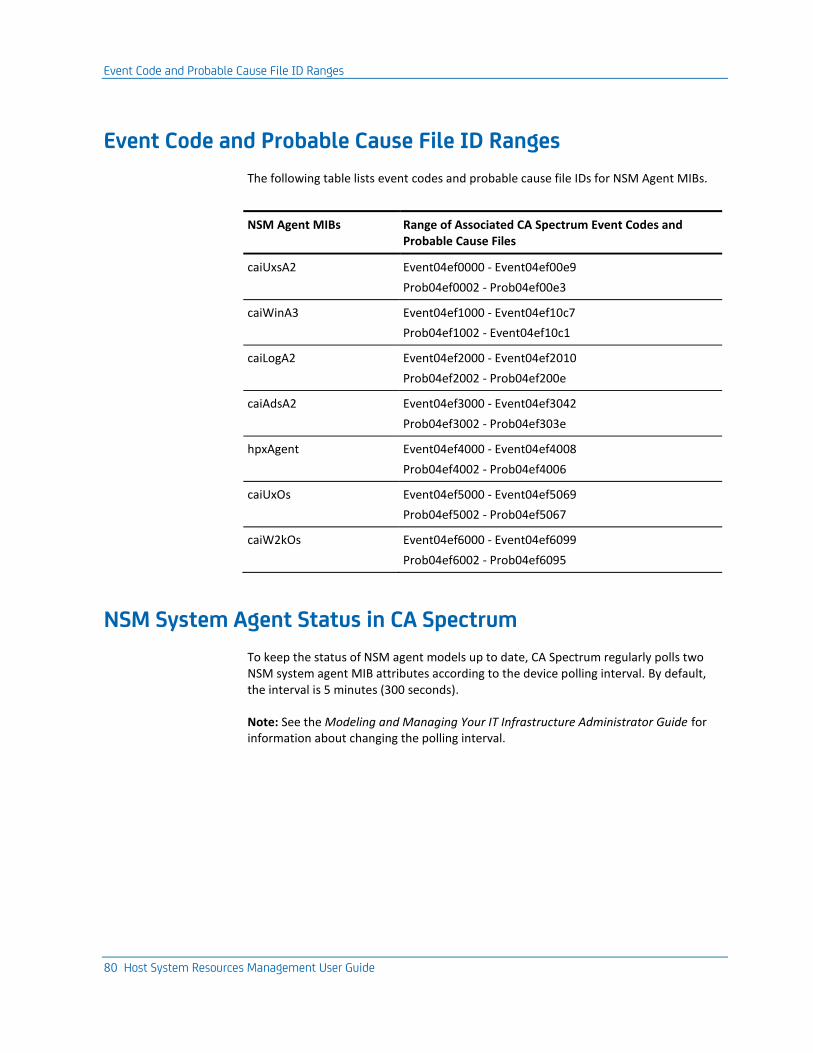
Event Code and Probable Cause File ID Ranges
80 Host System Resources Management User Guide
Event Code and Probable Cause File ID Ranges
The following table lists event codes and probable cause file IDs for NSM Agent MIBs.
NSM Agent MIBs Range of Associated CA Spectrum Event Codes and Probable Cause Files
caiUxsA2 Event04ef0000 - Event04ef00e9
Prob04ef0002 - Prob04ef00e3
caiWinA3 Event04ef1000 - Event04ef10c7
Prob04ef1002 - Event04ef10c1
caiLogA2 Event04ef2000 - Event04ef2010
Prob04ef2002 - Prob04ef200e
caiAdsA2 Event04ef3000 - Event04ef3042
Prob04ef3002 - Prob04ef303e
hpxAgent Event04ef4000 - Event04ef4008
Prob04ef4002 - Prob04ef4006
caiUxOs Event04ef5000 - Event04ef5069
Prob04ef5002 - Prob04ef5067
caiW2kOs Event04ef6000 - Event04ef6099
Prob04ef6002 - Prob04ef6095
NSM System Agent Status in CA Spectrum
To keep the status of NSM agent models up to date, CA Spectrum regularly polls two NSM system agent MIB attributes according to the device polling interval. By default, the interval is 5 minutes (300 seconds).
Note: See the Modeling and Managing Your IT Infrastructure Administrator Guide for information about changing the polling interval.

NSM System Agent Status in CA Spectrum
Chapter 7: CA Unicenter NSM Agent 81
The polled attributes indicate the number of warning or critical resources on a given NSM system agent host. One attribute represents the total number of resource warnings for the NSM system agent and the other represents the total number of resources in critical condition. If the number of warning or critical resources for a given NSM system agent is greater than zero, CA Spectrum creates an appropriate alarm. This alarm is cleared when the value for the attribute is zero. The following table shows the polled attributes for each supported model type as well as the alarms generated.
Model Type Polled Attributes Event/Minor Alarm ID Generated when total resource warnings is greater than zero
Event/Major Alarm ID Generated when total critical resources value greater than zero
Host_NSMSysUnix uxsA2StatusGeneralTotalWarn
uxsA2StatusGeneralTotalCrit
0x04ef00ea 0x04ef00ec
Host_NSMSysWin winA3StatusGeneralTotalWarn
winA3StatusGeneralTotalCrit
0x04ef10c8 0x04ef10ca
Host_NSMv3SysUnix uxsStatusGeneral TotalWarning
uxsStatusGeneral TotalCritical
0x04ef506a 0x04ef506c
Host_NSMv3SysWin w2kStatusGeneral TotalWarn
w2kStatusGeneral TotalCrit
0x04ef609a 0x04ef609c
Note: These alarms are cleared when the number of total resource warnings or total critical resources respectively is zero when polled.

Appendix A: System and Application Monitoring Privileges 83
Appendix A: System and Application Monitoring Privileges
This section lists privileges that are related to system and application monitoring for OneClick users.
Note: For more information about configuring privileges, see the Administrator Guide.
System & Application Monitoring
Controls access to the System & Application Monitoring privileges. Deselecting this privilege automatically deselects the following privileges:
Manage Rule Sets
Allows the user to create a monitoring rule set.
Monitor File Systems
Allows the user to create a file system monitoring rule.
Monitor Processes
Allows the user to create a process monitoring rule.

Index 85
Index
A
adding rules to a rule set • 44 aggregate status • 29 AIM
for Apache • 69 for Insight • 70 for Microsoft IIS • 70
AIMs • 69 alarm condition (RFC 2790)
alarm if count is greater than • 19 alarm if offline • 39 alarm on start • 19 alarm on stop • 19 defined • 9 file system utilization • 39 process instances • 19 process start • 19 process stop • 19
alarm conditions (RFC 2790) for file system monitoring rules • 11, 39 for process monitoring rules • 11, 19
alarm, destination file system rule violations • 39 process monitoring rule violation • 15
alarm, do not generate • 37 application insight modules • 69 application monitoring • 69
C
CA SystemEDGE Agent • 51, 69 children spawned by a process • 23 Cisco • 52 configuration threshold (NSM Agent)
children • 23 CPU usage • 23 defined • 9 handles • 23 instances • 23 restart • 23 runtime • 23 size • 23 threads • 23
CPU time a process consumes • 23 critical alarm
file system offline • 39 file system utilization threshold violation • 39
critical thresholds, NSM Agent process monitoring rule • 27
Culprits list, threshold violations • 28
E
Event Format file • 67 event forwarding • 68 Event Rule • 67 event, file system utilization threshold violation • 39 event, log file entry • 51 EventDisp file • 67
F
file system • 9 file system monitoring rule
alarm conditions • 11, 39 creating • 10, 39 deleting • 42 destination for alarms • 39 editing • 41 utilization thresholds • 39
file system name, file system monitoring rule setting • 39
File Systems option • 13
G
global collection apply rule set to • 43, 45 remove rule set from • 46
H
handles opened by a process • 23 host • 9 host resources • 9 host resources monitoring • 9 host resources monitoring, network services
management • 13
I
iAgent • 51 instances of a process • 23 interface support • 76

86 Host System Resources Management User Guide
internal condition • 37
K
Kiwi • 52
L
locating monitored file systems • 14 monitored processes • 14 monitoring rule sets • 14
log file defined • 9 map to process • 53 monitoring • 12 monitoring, regular expression • 51 monitoring, traps • 53
M
maintenance mode • 35 major alarm
file system utilization threshold violation • 39 memory a process consume • 23 MIB-II interface table • 76 MIBs, Unicenter NSM • 73 minor alarm
file system utilization threshold violation • 39 modeling, NSM agents • 74, 75 monitor files • 58 monitor log files • 53, 55 monitored log configuration
deleting • 63 editing • 63
monitored logs editing configuration • 53
monitoring file systems • 39 processes • 15
monitoring options, NSM Agent • 23 monitoring rule
editing outside rule set • 48 monitoring rule, file system • 39 monitoring rule, process
NSM Agent • 20 RFC 2790 • 18
monitoring rules workspace • 13
N
NSM agent host, topology view • 72
NSM Agent process monitoring rule monitor name • 20, 21 monitoring options for configuration thresholds •
27 process match criteria • 21 status indicators • 29
NSM Agent, subagent failure alarm • 29 NSM agents, interface support • 76 NSM agents, modeling • 74, 75 NSM System Host, device model • 74
P
parameters, process arguments • 21 ParseMap files • 64 path, process • 21 polling
watch for new instances • 34 privileges • 83 process
children • 23 CPU usage • 23 handles • 23 instance count (RFC 2790) • 19 instances • 23 mapping to log file • 53 parameters • 21 path • 21 restarts • 23 runtime • 23 size • 23 start/stop (RFC 2790) • 19 threads • 23 user • 21
process log file mappings deleting • 63 editing • 63
process match criteria, NSM Agent process monitoring rule • 21
process model internal condition • 37 process monitoring rule
adding to rule set • 44 alarm conditions • 11 creating • 15 deleting • 34 destination for alarms • 15 differentiating process instances • 17 editing • 33 maintenance mode • 35
Index 87
R
regular expression for log file parsing • 51 regular expression, match criteria • 21 reports on events and alarms • 13 resources, host • 23 restarts for a process • 23 RFC 2790 file system monitoring rule setting
utilization threshold • 39 Riverstone • 52 rule set
adding rules to • 44 apply to global collection • 43, 45 creating • 43 deleting • 49 deleting a rule from • 48 editing a rule in • 47 remove association with global collection • 46 rule, adding to rule set • 44 view in Contents panel • 43 viewing • 14
Running and Monitored Processes option • 13 runtime for a process • 23
S
searches all monitored file systems • 14 all monitored processes • 14 all monitoring rule set • 14
size of a process • 23 SM-CAI1000, management module • 72 SNMP port, 6665 for NSM agents • 74 Solaris • 52 status indicators, NSM Agent process monitoring
rule • 29 string compare, match criteria • 21 Syslog • 52 System Resources option • 13
T
thread count for a process • 23 threshold type, file system monitoring rule setting •
39 threshold violations
aggregate status change as a result of • 28 alarm destination • 15, 39 alarm types • 23 evaluation policy • 28
monitoring options • 27 reports • 13
thresholds for process monitoring rules (NSM Agent) • 11
Topology view, NSM agent host • 72 traps, log file monitoring • 53
U
Unicenter NSM MIBs • 73 user, process • 21 utilization, file system monitoring rule setting • 39
V
viewing monitored file systems • 14 monitored processes • 14 monitoring rule sets • 14
W
warning thresholds, NSM Agent process monitoring rule • 27
watch for new instances, polling interval • 15


