Hostage Taking: Understanding Terrorism Event Dynamics Patrick T. Brandt, Todd Sandler * School of Economic, Political and Policy Sciences GR 31 800 W. Campbell Road The University of Texas at Dallas Richardson, Texas 75080-3021 Abstract This paper employs advanced time series methods to identify the dynamic properties of three hostage taking series. The immediate and long run multipliers of three covariates — success- ful past negotiations, violent ends, and deaths — are identified. Each hostage series responds differently to the covariates. Past concessions have the strongest impact on generating future kid- napping events, supporting the conventional wisdom to abide by a stated no-concession policy. Each hostage series has different changepoints caused by a variety of circumstances. Skyjack- ings and kidnappings are negatively correlated, while skyjackings and other hostage events are positively correlated. Policy recommendations are offered. JEL classification : C22; D74; H56 Key words: Kidnappings, Skyjackings, No-concession policy, Impact multipliers, Poisson autoregressive model, Changepoint models, reversible-jump Markov chain Monte Carlo methods 1. Introduction From the seizure of the Israeli athletes during the 1972 Munich Olympics to the four simultaneous skyjackings on September 11, 2001 (henceforth, 9/11), hostage events have been some of the most spectacular and newsworthy attacks during the modern era of * Corresponding author. Email addresses: [email protected], [email protected](Patrick T. Brandt, Todd Sandler). Preprint submitted to Elsevier 2 September 2008
Patrick T. Brandt, Todd Sandler ∗School of Economic, Political and Policy Sciences
GR 31800 W. Campbell Road
The University of Texas at DallasRichardson, Texas 75080-3021
Abstract
This paper employs advanced time series methods to identify the dynamic properties of threehostage taking series. The immediate and long run multipliers of three covariates — success-ful past negotiations, violent ends, and deaths — are identified. Each hostage series respondsdifferently to the covariates. Past concessions have the strongest impact on generating future kid-napping events, supporting the conventional wisdom to abide by a stated no-concession policy.Each hostage series has different changepoints caused by a variety of circumstances. Skyjack-ings and kidnappings are negatively correlated, while skyjackings and other hostage events arepositively correlated. Policy recommendations are offered.
JEL classification: C22; D74; H56
Key words: Kidnappings, Skyjackings, No-concession policy, Impact multipliers, Poissonautoregressive model, Changepoint models, reversible-jump Markov chain Monte Carlo methods
1. Introduction
From the seizure of the Israeli athletes during the 1972 Munich Olympics to the foursimultaneous skyjackings on September 11, 2001 (henceforth, 9/11), hostage events havebeen some of the most spectacular and newsworthy attacks during the modern era of
international terrorism. In fact, this modern era is traced to the July 22, 1968 hijacking ofan Israeli El Al flight by the Popular Front for the Liberation of Palestine (PFLP) (Hoff-man, 2006). During the incident, the PFLP terrorists gained significant media coverageand forced the Israelis to negotiate with the Palestinians (Hoffman, 1998, 68). After theincident, terrorists increasingly staged attacks at foreign venues to capture the world’sattention. Other high-profile hostage events include: the PFLP’s abduction of eleven Or-ganization of Petroleum Exporting Countries (OPEC) ministers on December 21, 1975;the students’ takeover of the U.S. embassy in Tehran, Iran on November 4, 1979; and theChechen rebels’ seizure of over a thousand hostages at a middle school in Beslan, Russiaon September 1, 2004.
Terrorist hostage incidents fall into four categories: kidnappings, skyjackings, barri-cade and hostage taking missions (i.e., the takeover of a building with hostages), andthe capture of a nonaerial means of transportation (e.g., a boat, train, or bus). Kidnap-pings are the least risky hostage events owing to their unknown location and, as such,account for over two-thirds of the hostage incidents (1318 of 1941 incidents in our dataset). Skyjackings are less risky than barricade and hostage taking missions and otherforms of hijackings, since it is more difficult for authorities to approach a plane unseenthan to approach buildings or other means of transport. Terrorists engage more oftenin skyjackings than in other forms of nonkidnapping hostage events (see below). Eventhough hostage taking incidents are among some of the most dangerous missions, terror-ists resort to such attacks because they can result in high payoffs in terms of publicity,recruitment, and ransoms. Hostage events comprise 15% of all terrorist events for the1968-2005 sample period (Mickolus et al., 2006). Terrorists choose their mix of attacksaccording to perceived risks, engaging in riskier modes less often (Sandler et al., 1983),which is borne out by the frequency of the four kinds of hostage missions.
For hostage events, the conventional wisdom is that past concessions to terrorists en-courage additional seizures owing to terrorists’ updated priors of high payoffs. If, instead,terrorists know beforehand that they have nothing to gain from hostage taking due toa government’s announced no-concession stance, then they will never abduct hostages.Thus, many governments — including the United States — have adopted a no-concessionpolicy in the hopes of reducing hostage taking (U.S. Department of State, 2003). Lapanand Sandler (1988), however, demonstrate that the efficacy of the no-concession stancehinges on some unstated assumptions, which often do not hold (e.g., credibility of the gov-ernment’s pledge and the absence of terrorist gains from a negotiation failure). Terroristsbelieve that, if they capture a sufficiently valuable hostage, the government will renegeon its no-concession pledge. There have been many instances of this in the past—e.g., alarge ransom was paid to the PFLP for the release of the OPEC ministers in 1975—thatfoster this belief. Each concession made to hostage taking terrorists by one governmentmakes the terrorists change their beliefs about the likelihood of other governments’ givinginto their demands. For example, the Reagan administration’s arms-for-hostages deal torelease Rev. Benjamin Weir, Rev. Lawrence Jenco, and David Jacobsen encouraged theterrorists to capture other academics and journalists in Beirut (e.g., Robert Polhill, Al-lan Steen, Jesse Turner, Mithileshwar Singh, and Roger Augue) to replace those released(Enders & Sandler, 2006, 172–173). In 2004, terrorists in Iraq took other countries’ cit-izens hostage once South Korea and the Philippines made concessions. Apparently, onecountry’s concession causes a negative influence or externality on the perceived credibilityof other target countries’ pledges. Although the influence of past concessions on generat-
2
ing future hostage incidents is an important policy question, the essential no-concessionwisdom has never been tested empirically.
There has also been no dynamic test of whether the use of force to end a hostage missiondiscourages future incidents, thereby justifying the associated loss of life including thatof some of the hostages. Up until now, there has not been a sufficiently long time series ofhostage events to test important dynamic propositions including how policy statementsand past actions generate or discourage future hostage incidents. In addition, advancedtime series methods have not been applied to disaggregated hostage events to identifyimportant changepoints resulting from policies and/or exogenous shocks.
This paper has a number of purposes. First, it employs sophisticated time series tech-niques to quantify how past concessions encourage future hostage events; similarly, itapplies these methods to quantify how violent actions (e.g., the authorities storming ahijacked plane) influence future hostage missions. Second, we use advanced methods toidentify past changepoints in the hostage taking series where the arrival rates increase ordecrease. Once these changepoints are identified, we can match them, in most cases, withthe precipitating shock or event. By using only exogenously given policy interventions,past analyses miss many changepoints. Third, we ascertain how hostage events differwhen the location is unknown or known. If, for example, the dynamics associated withkidnappings (unknown location) differs from that of other kinds of hostage events, thenpolicy recommendations must also differ between types of hostage events. Fourth, wedetermine the temporal level of aggregation (i.e., days, months, or quarters) or the unitof analysis that is most appropriate.
In the course of the study, we establish significant empirical support for the conven-tional wisdom with respect to maintaining a no-concession policy. For kidnappings, eachconcession to the terrorists results in two to three additional abductions. A smaller num-ber of additional skyjackings and other hostage incidents follows concessions granted.Unexpectedly, violent ends or deaths are associated in many instances with more, notfewer, hostage incidents. Thus, decisive actions by the authorities to end a hostage eventwith force did not always deter future actions, except for skyjackings. The level of ag-gregation can make a difference in identifying the impact of these covariates. Moreover,alternative types of hostage events are associated with different changepoints. The esti-mated arrival rates of kidnappings and skyjackings are negatively correlated, indicativeof substitution effects; the arrival rates of kidnappings and nonskyjacking hostage eventsare uncorrelated; and the arrival rates of skyjackings and nonkidnapping hostage eventsare positively correlated, indicative of complementarity.
The body of the paper contains four sections. Section 2 presents preliminaries includingessential definitions, concepts, and brief review of the relevant literature. The data isdiscussed in Section 3. This is followed by the empirical analysis in Section 4. The finalsection contains concluding remarks and further policy implications.
2. Preliminaries
Terrorism is the premeditated use or threat to use violence by individuals or subna-tional groups against noncombatants to obtain political or social objectives through theintimidation of a large audience, beyond that of the immediate victims. In this definition,two crucial ingredients are violence and the political/social motive; violent acts without
3
such motives are merely criminal acts and do not constitute terrorism. Other essentialaspects of terrorism that have been subject to debate concern the identity of the victim(i.e., noncombatant or otherwise), perpetrator (e.g., states as terrorists), and audience(Hoffman, 1998; Enders & Sandler, 2006). Our definition is closely akin to that of theU.S. Department of State (2003) and captures many features of the myriad definitions inthe literature. Moreover, this definition is consistent with that of the data set describedin the next section. Terrorists utilize different modes of attack — e.g., bombings, assassi-nations, armed attacks, skyjackings, kidnappings, and barricade missions — to pressurea government into conceding to their political demands. Our focus is on hostage eventssince we are interested in how past concessions or violent actions by governments influ-ence the arrival rate of future incidents. Such a study informs governments as to whethertheir independent policy responses work to curtail or encourage future hostage takingincidents. The analysis here assists governments learn best practices.
Terrorism is further subdivided into domestic and transnational events. Domestic ter-rorism is homegown (i.e., home financed, planned, and executed) and has consequencesfor just the host country, its institutions, citizens, property, and policies. The kidnappingof a German industrialist, Hanns Martin Schleyer, in 1977 by the Red Army Factionis a domestic terrorist incident. In contrast, transnational terrorism involves perpetra-tors, victims, institutions, governments, or citizens from at least two countries. Incidentsfunded or planned abroad are transnational terrorist events, as are incidents where theterrorists cross a national border to engage in the attack. The January 2002 kidnappingof Wall Street Journal reporter Daniel Pearl in Pakistan is a transnational terrorist event.A skyjacking of a plane that originates in Rome and is made to fly to Beirut is a transna-tional incident. The kidnappings of Westerners and other foreign nationals in Lebanonduring the 1980s, as well as the kidnappings of foreign contractors and aid workers in Iraqfollowing the Abu Ghraib prison scandal on April 6, 2004, are examples of transnationalhostage missions. The four simultaneous skyjackings on 9/11 are transnational becausethe hijackers were foreigners, the victims came from many countries, and the financialimplications were global. In general, transnational terrorist incidents have ramificationsthat transcend the host country’s soil.
The past literature on terrorist hostage taking includes both theoretical and empiricalcontributions. The theoretical literature is primarily interested in the desirability (Islam& Shahin, 1989) and the practicality (Lapan & Sandler, 1988) of the no-concession policyin discouraging future hostage taking. These papers provide some casual evidence, but donot present any empirical test of the propositions put forward. The empirical literaturefocuses on the effectiveness of metal detectors in airports and other counterterrorism poli-cies (e.g., sky marshals, UN conventions outlawing skyjackings, and longer jail sentencesto convicted skyjackers) to inhibit subsequent skyjackings (Enders & Sandler, 1993; En-ders et al., 1990a,b; Landes, 1978). These past studies prespecify the changepoints inhostage events rather than allow the data to uncover them. Moreover, the dependentvariable — say, the number of skyjackings — were not related to covariates about the(past) events, such as past concessions. Another set of articles investigates the determi-nants of hostage taking success (Gaibulloev & Sandler, 2009; Sandler & Scott, 1987) andbargaining aspects (Atkinson et al., 1987). Like this study, Poe (1988) examines whethera tough stance against hostage takers limits future abductions. This earlier study usesmultiple regression and cannot capture the true dynamics of past hostage taking inci-dents, in contrast to the Poisson autoregressive and changepoint models in this paper.
4
Poe finds that a tough stance did not deter future hostage missions.In a recent paper, Enders & Sandler (2005) examine prespecified (e.g., 9/11) and
unspecified changepoints in hostage events time series. Unlike the current study, whichdisaggregates hostage incidents into three distinct classes, Enders & Sandler (2005) aggre-gate all hostage events to quarterly series. These authors apply Bai-Perron (1998, 2003)methods rather than the changepoint models employed here. In this study, we identify amuch richer set of changepoints that differ among alternative hostage missions.
Finally, Lee et al. (2008) use an alternative estimation method (sequential importancesampling) rather than a reversible jump Markov chain Monte Carlo method, but applyit to nonhostage incidents for a truncated time period that ends prior to 9/11. Likethe current study, these authors use monthly data. Their main concern is whether pastpatterns in the data could have predicted 9/11.
3. Data
We use event data on terrorist hostage incidents drawn from International Terrorism:Attributes of Terrorist Events (ITERATE), which was originally devised by Mickolus(1982) and later updated by Mickolus et al. (2006). ITERATE records just transnationalterrorist incidents using a host of sources, including the Associated Press, United PressInternational, Reuters tickers, New York Times, Washington Post, the Foreign BroadcastInformation Services (FBIS) Daily Reports, ABC, NBC, and CBS evening news. Through1996, the regional FBIS Daily Reports have been invaluable: these reports draw fromhundreds of world print and electronic media services and are the most complete sourcefor foreign coverage of terrorist incidents. ITERATE currently includes 12,942 terrorismincidents from 1968 to 2005. An overlap of coders ensures a consistency of coding as thedata are updated.
ITERATE’s COMMON file records a host of general observations about each terroristevent including the incident date, incident type, and the total number of individuals(i.e., terrorists, victims, or bystanders) killed. In addition, ITERATE’s HOSTAGE file,which has been recently updated to run from 1968 to 2005, includes a negotiation successvariable that indicates whether the terrorists received none, some, or all of their demands.The HOSTAGE file also includes the response of the target — shoot-out with terroristsor something else (e.g., capitulation, Bangkok solution [i.e., a plane to a safe haven], nocompromise, or no shoot-out). These two variables allow us to construct two importantcovariates. We have merged the hostage events with those in the COMMON file sothat we have common and hostage attributes of 1941 hostage events, made up of 1318kidnappings, 380 skyjackings, and 243 other hostage events (i.e., barricade missions andnonaerial hijackings). 1 For hostage events without a fully specified date (either missing amonth or a day), events were assigned a modal date. Missing days were assigned the 15thof the month (if a month were supplied) and missing months were assigned to June. Allobservations with a missing month have a missing day. Using this data, we constructed
1 These are ITERATE incident types 1 (kidnapping), 2 (barricade and hostage seizure), 9 (aerial hi-jacking) and 10 (takeover of nonaerial means of transportation).
5
three time series — a KIDNAP series, a SKYJACK series, and an OTHER hostage eventsseries (known henceforth as OTHER) for the 1968-2005 period. 2
Figure 1 presents the KIDNAP time series and their autocorrelation functions atmonthly and quarterly levels of aggregation. The dashed vertical line in each graph isfor 9/11. Visual inspection of these series reveal two immediate properties: 1) the seriesare cyclical (around an AR(1-4) processes depending on the level of aggregation), and 2)the variance of the series increases over time. The latter property is especially evident inthe quarterly data. The right column in Figure 1 are the autocorrelation functions forthe three series. 3 Time scales in these ACFs are based on the periodicity of the data, sothe “1” on the x-axis in the monthly data is 12 months, and 4 quarters in the quarterlydata. The y-axis are the autocorrelations.
Figures 2 and 3 present the same information as Figure 1 for the SKYJACK, andOTHER series. Note that the SKYJACK and OTHER series appear to have negativetrends, descending from high points in the 1980s and 1990s. The KIDNAP event seriesdisplay higher volatility in more recent periods. particularly post 9/11 where the seriesreaches its historical maximum. An upward trend since 1990 is evident for the quarterlyKIDNAP series, except for a drop prior to 9/11.
4. Testing for cycles and changes in hostage taking events
We are particularly interested in two questions about hostage events: are they cyclicaland have there been structural changes in the hostage taking series. The former are moti-vated by previous findings such as Enders & Sandler (2005) where hostage taking eventsare shown to be both cyclical and subject to structural shifts. However, these earlieranalyses can be refined by careful modeling of the KIDNAP, SKYJACK and OTHERseries. In the literature, cycles are attributed to a cat-and-mouse game between the au-thorities and the terrorists as defensive breakthroughs (e.g., metal detectors at airports)are countered by operational innovations (e.g., plastic guns or flammable liquids). Inother cases, cycles may stem from demonstration effects of success or failure (see Enders& Sandler, 2006, 2005; Enders et al., 1992; Im et al., 1987). Whatever their cause, wemust account for cycles and structural breaks to identify the true dynamics of the timeseries.
The refinements we employ here are threefold. First, we work with more disaggregateddata (also see Barros & Gil-Alana, 2006). This is important since 1) aggregating toquarterly data can mask cyclical components (at frequencies less than a quarter), and 2)may confound inferences about structural shifts since they may be “lost” in a quarter.Second, we employ event count time series methods rather than ARIMA or (normal)linear regression models. Event count models based on Poisson and negative binomial
2 These data are sparse. For the January 1, 1968 to December 31, 2005 period, 8.6% of the days haveone or more KIDNAP event, 2.6% of the days have one or more SKYJACK event, and 1.7% of thedays have one or more OTHER event. For a monthly aggregation of the data, 85% of the months havesome KIDNAP events, 47% of the months have some SKYJACK events, and 35% of the months havean OTHER event.3 These ACFs are computed using the standardized hostage counts. They are computed using zt = yt−y
σwhere y and σ are the mean and standard deviation, respectively of the series. This method is suggestedby Cameron & Trivedi (1998).
6
Monthly KIDNAP Events
Date
1970 1980 1990 2000
05
1015
0.0 0.2 0.4 0.6 0.8 1.0
0.0
0.4
0.8
LagA
CF
ACF for Monthly KIDNAP Counts
Quarterly KIDNAP Events
1970 1980 1990 2000
010
2030
0.0 1.0 2.0 3.0
−0.
20.
20.
61.
0
AC
FACF for Quarterly KIDNAP Counts
Fig. 1. ITERATE KIDNAP events time series, 1968–2005.
data generation processes provide less biased and more consistent estimates of cyclicaland structural components for data like those presented here. Brandt et al. (2000), Brandt& Williams (2001) and Park (2007) all present models for count data that produce lessbiased inferences about cyclical components and structural shifts. This is important, sinceincorrect data generation process assumptions will potentially invalidate tests for cyclesand shifts. Finally, we employ more robust methods for checking for structural changesin the disaggregated data. Such methods check for possibly incorrect assumptions aboutthe number and timing of structural breaks in the three hostage (event count) series. Themethods used here — event count time series regressions and a Bayesian reversible-jumpchangepoint model — allows us to combine prior beliefs about the number of changepointsand the data to produce robust inferences about changepoints, without indefensible dataaggregation or exogenously limiting the number of changepoints in the data (see, e.g.,Barros, 2003; Barros & Gil-Alana, 2006; Enders et al., 1990a,b). The remainder of thissection presents two alternative models of the three hostage event series.
7
Monthly SKYJACK Events
Date
1970 1980 1990 2000
02
46
810
0.0 0.2 0.4 0.6 0.8 1.0
0.0
0.4
0.8
LagA
CF
ACF for Monthly SKYJACK Counts
Quarterly SKYJACK Events
1970 1980 1990 2000
05
1015
20
0.0 1.0 2.0 3.0
−0.
20.
20.
61.
0
AC
FACF for Quarterly SKYJACK Counts
Fig. 2. ITERATE SKYJACK events time series, 1968–2005.
4.1. PAR(p) analyses
One can look at the cyclical properties of the data using the Poisson autoregressivemodel (PAR(p)) of Brandt & Williams (2001). This model is based on an extendedKalman filter for the count process. Let yt be the observed number of hostage events attime t, and xt be a 1 × k vector of covariates. The basic model for the counts has twoequations, a measurement equation and a transition equation that describe the evolutionof the counts via an autoregressive process and some initial conditions:
Measurement equation:
Pr (yt|mt) =myt
t exp(−mt)yt!
Transition Equation:
mt =p∑
i=1
ρiyt−i +
(1−
p∑i=1
ρi
)exp (xtβ)
Initial Conditions:
8
Monthly OTHER Events
Date
1970 1980 1990 2000
02
46
8
0.0 0.2 0.4 0.6 0.8 1.0
0.0
0.4
0.8
LagA
CF
ACF for Monthly OTHER Counts
Quarterly OTHER Events
1970 1980 1990 2000
02
46
810
0.0 1.0 2.0 3.0
−0.
20.
20.
61.
0
AC
FACF for Quarterly OTHER Counts
Fig. 3. ITERATE OTHER events time series, 1968–2005.
Pr (mt|yt−1, . . . , yt−p) = Γ (σt−1mt−1, σt−1)
where mt is the mean of the Poisson process at time t, ρi’s are the autoregressive param-eters for the lagged counts, β is a k×1 vector of regression coefficients for the covariates,and σt is the scale of the transition equation at time t. The measurement equation isa Poisson density for the number of events yt at time t, while the transition equationdescribes how the (latent) mean number of events evolves via an autoregressive process.The initial conditions determine the probability density for the autoregressive processin each time period, whose mean is gamma distributed with a scale parameter of σt.The resulting predictive distribution of the counts is a negative binomial (for details seeBrandt & Williams, 2001), which accounts for the overdispersion of the data due to theserial correlation in the counts.
The analysis here includes three covariates for each of hostage series. The first covariateindicates past negotiation success of the hostage missions, in which the terrorists obtainsome or all of their demands. Because terrorists are apt to ask for as much as possibleto maximize concessions paid, gaining their full demands is too stringent a conditionfor negotiation success. Based on conventional wisdom (previously discussed), successfulnegotiations in one type of hostage incident is likely to generate more incidents of the
9
same type as terrorists raise their priors for expected gains. From the HOSTAGE file, thenegotiation success covariate is coded as 1 if the terrorists received some or all of theirdemand and 0 otherwise. The second covariate derives from the “response of the target”from the HOSTAGE file of ITERATE, where the constructed variable of a violent endis coded as 1 for “shoot out with terrorists” and 0 otherwise. We anticipate that such aforceful end to an incident will deter future incidents of that type unless the terrorists aremotivated by martyrdom or publicity. The third covariate is from the COMMON file ofITERATE and indicates whether deaths are associated with a hostage incident. Incidentswith one or more deaths are coded as 1 and those with no deaths are coded as 0. Suchbloodshed is anticipated to deter future incidents of that type unless the perpetrators aremore bent on murder than on other gains. All three covariants are recorded as within-period sums of the relevant variable for the specific kind of hostage event.
There are two issues that must be addressed in specifying the PAR(p) model withthese covariates. The first is the number of lags of the count series in the model. We fita series of these PAR(p) models for each of the three hostage time series. In so doing,we tested for the lag length of each PAR model using successive models with higher lagsand selected the most parsimonious model with statistically significant lag coefficients.The second issue is the distributed lag specification for the exogenous variables. Welooked at models with contemporaneous covariates and lags up to two periods. Basedon hypothesis tests and Akaike information criteria (AIC) values, we selected the mostparsimonious distributed lag specification. Table 1 summarizes the results of the modelsfor both quarterly and monthly aggregations of the data. 4
These results generate four main insights into the hostage data. First, the hostageevents are not independent of each other. The joint hypothesis for ρi = 0, i = 1, . . . p forthe PAR(p) is a test of whether the autoregressive process is jointly zero and the dataare better explained by a Poisson regression, where the hostage events are independentof each other. This test is rejected for each of the models. Thus, there is a dependent,autoregressive process among the hostage events in each time series. Second, this temporaldependence among the series is generally positive, which means that hostage takingevents generally are correlated positively over time. Third, the equilibration of additionalnew hostage events is rather rapid, since the sum of the AR coefficients tends to bebounded away from 1. This is interpreted as meaning that the impact of each hostagetaking event on subsequent events occurs over a short period of time (approximately8-12 months at most). Finally, negotiation successes, violent endings, and incidents withdeaths have statistically significant effects in predicting each of the hostage series. Thislast conclusion is based on the statistically significant covariates in the latter rows ofthe table. The positive influence of negotiation success agrees with our priors, while thepositive influence of violent end and deaths does not agree with our priors, except whenmartydom or publicity are motivators. By calculating the multipliers for each covariatefor each of the three series, we are better able to quantify their impacts.
This latter result can be seen by computing the impact and long run multipliers of aone unit change in each of the covariates (holding the others at their means). These arefound by the following (see Brandt and Williams 2001 for details):
4 There are fewer observations in some of the series because the PAR(p) model cannot be estimatedwith initial observations of zero. Truncating the data series to the first nonzero observation produces thesmaller samples.
10
Table
1.PA
R(p
)re
sults
for
month
lyand
quart
erly
KID
NA
P,SK
YJA
CK
and
OT
HE
Rse
ries
1968–2005.
KID
NA
PSK
YJA
CK
OT
HE
R
Par
amet
ers
Mon
thly
Qua
rter
lyM
onth
lyQ
uart
erly
Mon
thly
Qua
rter
ly
ρ1
0.23
(0.0
4)0.
18(0
.05)
0.25
(0.0
7)0.
30(0
.07)
0.19
(0.0
5)0.
21(0
.09)
ρ2
0.13
(0.0
5)0.
14(0
.05)
0.17
(0.0
8)0.
16(0
.08)
ρ3
0.02
(0.0
4)0.
06(0
.07)
-0.1
3(0
.05)
ρ4
-0.0
2(0
.04)
0.13
(0.0
7)0.
11(0
.06)
ρ5
0.00
2(0
.04)
ρ6
0.12
(0.0
4)
ρ7
0.03
(0.0
4)
ρ8
-0.1
2(0
.04)
Neg
otia
tion
Succ
ess t
0.27
(0.0
6)0.
22(0
.04)
0.67
(0.0
7)0.
33(0
.06)
0.34
(0.1
9)0.
43(0
.15)
Neg
otia
tion
Succ
ess t−
10.
12(0
.04)
-0.4
2(0
.24)
Vio
lent
End
t0.
37(0
.06)
0.24
(0.0
5)0.
87(0
.14)
-0.1
6(0
.16)
0.66
(0.1
6)0.
07(0
.20)
Vio
lent
End
t−1
-0.0
8(0
.06)
0.53
(0.2
0)
Inci
dent
sw
ith
Dea
ths t
0.36
(0.0
4)0.
16(0
.02)
0.87
(0.0
9)0.
53(0
.10)
0.93
(0.1
4)0.
52(0
.13)
Inci
dent
sw
ith
Dea
ths t−
1-0
.10
(0.0
3)-0
.26
(0.1
8)
Inte
rcep
t0.
73(0
.07)
1.65
(0.0
8)-0
.52
(0.1
6)0.
20(0
.18)
-0.8
3(0
.11)
0.06
(0.1
3)
Log
likel
ihoo
d-8
62-4
05-5
03-2
65-3
99-2
18
AIC
1747
827
1019
544
806
450
χ2,H
0:Poi
sson
mod
el(p
-val
ue)1
07(<
0.01
)29
(<0.
01)
98(<
0.01
)51
(<0.
01)
13(<
0.01
)6
(0.0
2)
d.f.
437
140
446
144
425
135
Not
e:St
anda
rder
rors
are
inpa
rent
hese
s.T
heρ
ite
rms
are
the
auto
regr
essi
vela
gco
effici
ents
atla
gi.
All
ofth
eW
ald
test
sfo
ra
redu
ctio
nto
aPoi
sson
mod
elha
vep
degr
ees
offr
eedo
m(t
henu
mbe
rof
lagg
edco
unts
)an
dha
vep-
valu
esge
nera
llyle
ssth
an0.
01.
11
Impact multiplier :
(1−
p∑i=1
ρi
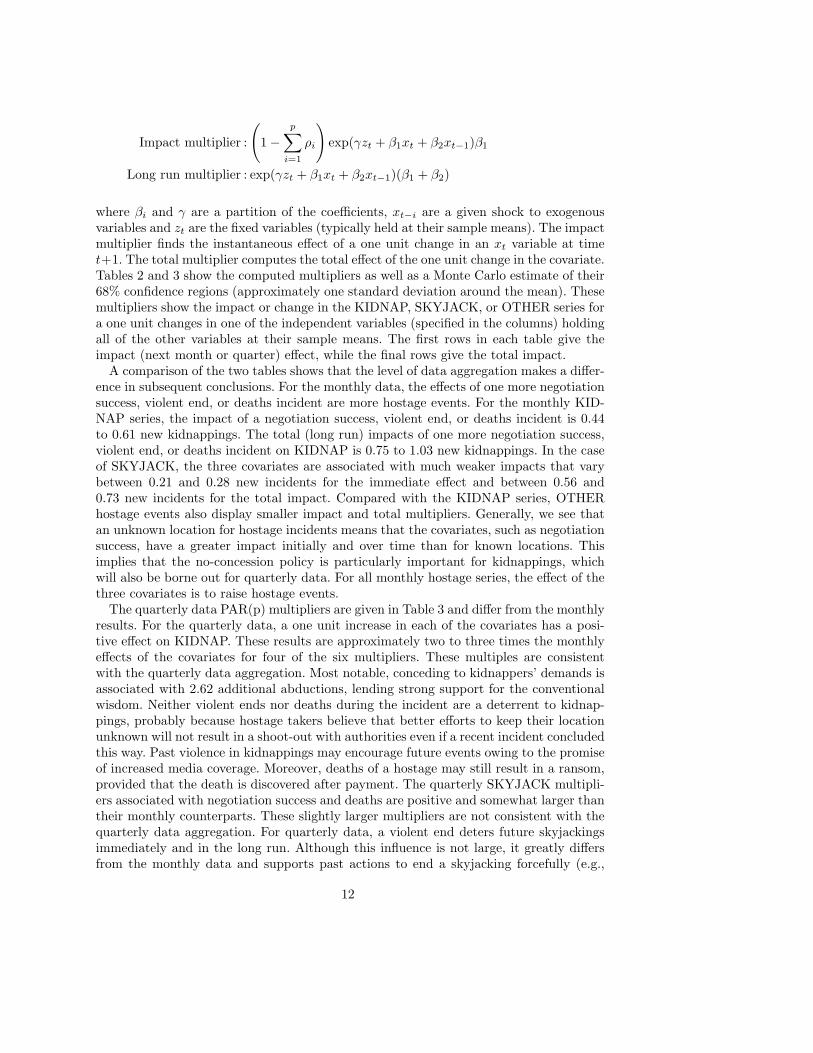
)exp(γzt + β1xt + β2xt−1)β1
Long run multiplier : exp(γzt + β1xt + β2xt−1)(β1 + β2)
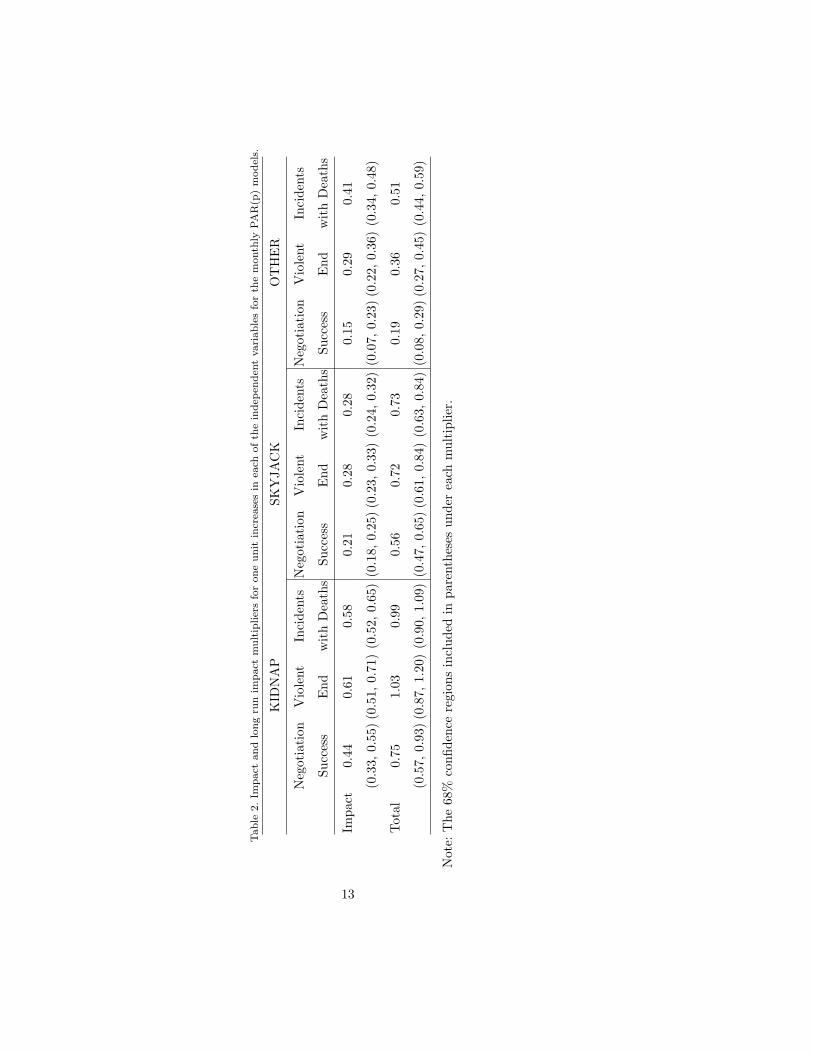
where βi and γ are a partition of the coefficients, xt−i are a given shock to exogenousvariables and zt are the fixed variables (typically held at their sample means). The impactmultiplier finds the instantaneous effect of a one unit change in an xt variable at timet+1. The total multiplier computes the total effect of the one unit change in the covariate.Tables 2 and 3 show the computed multipliers as well as a Monte Carlo estimate of their68% confidence regions (approximately one standard deviation around the mean). Thesemultipliers show the impact or change in the KIDNAP, SKYJACK, or OTHER series fora one unit changes in one of the independent variables (specified in the columns) holdingall of the other variables at their sample means. The first rows in each table give theimpact (next month or quarter) effect, while the final rows give the total impact.
A comparison of the two tables shows that the level of data aggregation makes a differ-ence in subsequent conclusions. For the monthly data, the effects of one more negotiationsuccess, violent end, or deaths incident are more hostage events. For the monthly KID-NAP series, the impact of a negotiation success, violent end, or deaths incident is 0.44to 0.61 new kidnappings. The total (long run) impacts of one more negotiation success,violent end, or deaths incident on KIDNAP is 0.75 to 1.03 new kidnappings. In the caseof SKYJACK, the three covariates are associated with much weaker impacts that varybetween 0.21 and 0.28 new incidents for the immediate effect and between 0.56 and0.73 new incidents for the total impact. Compared with the KIDNAP series, OTHERhostage events also display smaller impact and total multipliers. Generally, we see thatan unknown location for hostage incidents means that the covariates, such as negotiationsuccess, have a greater impact initially and over time than for known locations. Thisimplies that the no-concession policy is particularly important for kidnappings, whichwill also be borne out for quarterly data. For all monthly hostage series, the effect of thethree covariates is to raise hostage events.
The quarterly data PAR(p) multipliers are given in Table 3 and differ from the monthlyresults. For the quarterly data, a one unit increase in each of the covariates has a posi-tive effect on KIDNAP. These results are approximately two to three times the monthlyeffects of the covariates for four of the six multipliers. These multiples are consistentwith the quarterly data aggregation. Most notable, conceding to kidnappers’ demands isassociated with 2.62 additional abductions, lending strong support for the conventionalwisdom. Neither violent ends nor deaths during the incident are a deterrent to kidnap-pings, probably because hostage takers believe that better efforts to keep their locationunknown will not result in a shoot-out with authorities even if a recent incident concludedthis way. Past violence in kidnappings may encourage future events owing to the promiseof increased media coverage. Moreover, deaths of a hostage may still result in a ransom,provided that the death is discovered after payment. The quarterly SKYJACK multipli-ers associated with negotiation success and deaths are positive and somewhat larger thantheir monthly counterparts. These slightly larger multipliers are not consistent with thequarterly data aggregation. For quarterly data, a violent end deters future skyjackingsimmediately and in the long run. Although this influence is not large, it greatly differsfrom the monthly data and supports past actions to end a skyjacking forcefully (e.g.,
12
Table
2.Im
pact
and
long
run
impact
multip
lier
sfo
rone
unit
incr
ease
sin
each
ofth
ein
dep
enden
tvari
able
sfo
rth
em
onth
lyPA
R(p
)m
odel
s.
KID
NA
PSK
YJA
CK
OT
HE
R
Neg
otia
tion
Vio
lent
Inci
dent
sN
egot
iati
onV
iole
ntIn
cide
nts
Neg
otia
tion
Vio
lent
Inci
dent
s
Succ
ess
End
wit
hD
eath
sSu
cces
sE
ndw
ith
Dea
ths
Succ
ess
End
wit
hD
eath
s
Impa
ct0.
440.
610.
580.
210.
280.
280.
150.
290.
41
(0.3
3,0.
55)(0
.51,
0.71
)(0
.52,
0.65
)(0
.18,
0.25
)(0
.23,
0.33
)(0
.24,
0.32
)(0
.07,
0.23
)(0
.22,
0.36
)(0
.34,
0.48
)
Tot
al0.
751.
030.
990.
560.
720.
730.
190.
360.
51
(0.5
7,0.
93)(0
.87,
1.20
)(0
.90,
1.09
)(0
.47,
0.65
)(0
.61,
0.84
)(0
.63,
0.84
)(0
.08,
0.29
)(0
.27,
0.45
)(0
.44,
0.59
)
Not
e:T
he68
%co
nfide
nce
regi
ons
incl
uded
inpa
rent
hese
sun
der
each
mul
tipl
ier.
13
Table
3.Im
pact
and
long
run
impact
multip
lier
sfo
rone
unit
incr
ease
sin
each
ofth
ein
dep
enden
tvari
able
sfo
rth
equart
erly
PA
R(p
)m
odel
s.
KID
NA
PSK
YJA
CK
OT
HE
R
Neg
otia
tion
Vio
lent
Inci
dent
sN
egot
iati
onV
iole
ntIn
cide
nts
Neg
otia
tion
Vio
lent
Inci
dent
s
Succ
ess
End
wit
hD
eath
sSu
cces
sE
ndw
ith
Dea
ths
Succ
ess
End
wit
hD
eath
s
Impa
ct1.
151.
200.
840.
33−
0.16
0.53
0.48
0.09
0.59
(0.9
7,1.
33)(1
.00,
1.41
)(0
.75,
0.94
)(0
.27,
0.39
)(−
0.31
,−
0.01
)(0
.43,
0.63
)(0
.33,
0.62
)(−
0.14
,0.
31)
(0.4
4,0.
73)
Tot
al2.
621.
180.
470.
59−
0.29
0.96
0.01
0.87
0.37
(2.1
9,3.
06)(0
.72,
1.65
)(0
.27,
0.67
)(0
.49,
0.69
)(−
0.57
,−
0.02
)(0
.81,
1.11
)(−
0.32
,0.
34)
(0.4
5,1.
30)
(0.0
4,0.
70)
Not
e:T
he68
%co
nfide
nce
regi
ons
incl
uded
inpa
rent
hese
sun
der
each
mul
tipl
ier.
14
Operation Thunderbolt by Israeli commandos at Entebbe Airport in Uganda to free thehostages from Air France flight 139 in June 1976). Data aggregation also makes a dif-ference for OTHER hostage events, where instead of the net positive multipliers of themonthly data, the quarterly data’s impact and long run multipliers are more complexwhen the confidence intervals are consulted. The total multiplier is nonzero for only theviolent end and death covariates; thus, the immediate impact of negotiation success onOTHER events is ameliorated in the long run.
In sum, we find that negotiation success generates more kidnappings regardless of theunit of analysis. Moreover, kidnappings with violent ends or deaths do not deter futureincidents. When examined quarterly, violent ends deter skyjackings but deaths do not.The latter finding is likely due to past events where the skyjackers murdered a passenger— e.g., TWA flight 847 on June 14, 1985 — to make the authorities take their demandsseriously. Such tactics were often associated with concessions eventually being made. ForOTHER hostage events, the three covariates generally resulted in more hostage taking.The magnitude and, for skyjackings, the direction of the covariate’s influence is time-frame dependent.
One reason for the differing results for the monthly versus quarterly data is that theremay be structural changes in the three hostage series. The next section looks at thisposssibility.
4.2. Bayesian multiple changepoint model analysis
The PAR(p) models assume that the data have a unique equilibrium, which is violatedif there are structural changes in the number of average events per period or a noninde-pendent arrival time between hostage events. This could be the result of the data beingbetter explained by a clustered or time-dependent Poisson process, such as a negative bi-nomial process. In fact, the PAR(p) models results show that the predictive distributionfor this model is a negative binomial.
The PAR(p) model does not allow one to test for the presence of structural changesin the inter-arrival times of hostage events. One could do this by fitting a sequence ofmodels and using tests analogous to those for structural breaks in regression models.Such a task, however, requires the analyst to know or specify the number and timing ofthe possible structural breaks. This would be an ad hoc task and is largely self-fulfillingbecause of analysts’ biases in looking for or “confirming” changes (cf., Park, 2007).
Alternatively, one could use a Bai-Perron test for structural breaks. But this testdepends on an assumption that the data are normally distributed, which is not the casefor event count data at low frequencies unless the mean number of counts is “large.”Thus, we adopt a different model that uses a multiple changepoint model, which looksfor changes in the arrival of events in a Poisson process. The assumption here is that eachindividual event is a draw from a cumulative counting process where the timing betweenthe events is a time-dependent rate. 5 The model is referred to as “multiple” changepointmodel because it allows for an endogenous set of changes or shifts to occur in the rate ofevents. At each point in time one evaluates whether there should be a changepoint to anew level (a birth) or a changepoint back to a previous level (a death), a change in the
5 Such models are commonly used to model disasters, such as coal mining accidents (Raftery & Akman,1986; Green, 1995).
15
height or probability of each changepoint, or a change in the location of the position of achangepoint. For these four options, one estimates the endogenously determined numberof breaks or shifts in the arrival rate. These shifts can be to higher or lower hostage eventarrival rates. This procedure surmounts the problem of pre-specifying the changepointsand biasing the results.
An additional complication with specifying a multiple changepoint model for frequen-tist inference is that an analyst would need to pre-specify the maximal number of breaks.Since a priori the number of changepoints is unknown, one must find a robust methodfor evaluating whether to add or eliminate a changepoint from the model. This problemhas been solved in a Bayesian approach by the development of reversible jump Markovchain Monte Carlo (RJ-MCMC) methods. These methods allow one to sample whetherthe posterior distribution of the data (and parameters) are better characterized by amodel with either k− 1, k, or k +1 changepoints. The choice of the value of k is a modeldetermination or order issue: the choice of k determines the number of parameters in themodel.
The Bayesian model for the changepoints is provided by Green (1995). The modeluses daily data on the hostage events, since any aggregation of the data would onlyrescale the arrival rate of the events by the periodicity of the data. Thus, for determiningbreaks, the level of aggregation often has little consequence. Let the data points for thePoisson process of number of hostage events per day be yi, i = 1, 2, . . . , n ∈ [0, L]. Thedaily arrival rate for the Poisson process for the events varies over time according to thearrival rate function w(t). The likelihood for these Poisson events is
n∑i=1
log{w(yi)} −L∫
0
w(t)dt
where n is the number of events and L is the total elapsed days of the hostage events.The multiple changepoint aspect enters the model by assuming there are step functionsthat describe the jumps in the rate function w(t). Suppose there are k steps at intervals0 < s1 < s2 < . . . < sk < L and the steps take a value or height of hj between [sj , sj+1]for j = 0, 1, 2 . . . , k. The number of possible steps is assumed to be Poisson distributedwith
p(k) = exp(−λ)λk
k!,
where k ≤ kmax and kmax is the arbitrary maximum number of breaks. Under theseassumptions, the steps are even-numbered order statistics from 2k + 1 points over auniform interval [0, L]. The heights of the steps, h0, h1, . . . , hk (which describe the densityof changepoints) are independent draws from a Γ(α, β) density. These assumptions definea model where up to kmax breaks are possible, with a uniform density for the breaklocations. The latter is computationally expensive and possibly leads to selecting toomany breaks.
This model could be implemented by classical (i.e., maximum likelihood) methods ifone were to pre-specify k, but this presupposes knowing the number of changepoints.One instead can take a Bayesian approach and condition the model on the choice ofk, which requires comparing the posterior probability of adding or subtracting from k.This is the “reversible” part of the estimation since it changes the dimension of the
16
number of changepoints in w(·) from either 1) k to k − 1 (a death step), 2) k to k + 1(a birth step), 3) changing the step height, or 4) changing the position of a step. In thissituation, classical likelihood theory breaks down because the changepoint models for kversus k± 1 are nonnested, but Bayesian estimation (even with a diffuse prior about thenumber of changepoints and their arrival times) provides a solid basis for inference (seeGreen, 1995).
Bayesian RJ-MCMC changepoint models for the daily KIDNAP, SKYJACK, andOTHER series were fitted with a diffuse prior. 6 The RJ-MCMC sampler consisted of400,000 burn-in iterations (which were discarded to remove the initial conditions fromthe sampler) and a final posterior sample of one million draws, which were thinned froma total of twenty million draws from the posterior density. 7
Figure 4 shows the plot of the cumulative number of events, the arrival rate of newevents and the changepoints in the KIDNAP series, while Table 4 shows the ten estimatedbreaks in the KIDNAP series. The solid line in the figure is the cumulative number ofKIDNAP events over the period while the dashed line is the estimated arrival rate of newevents. Changes in the slope of the arrival rate are identified as the changepoints which arepresented in Table 4. The table’s columns display the median date for the changepoints,their 68% credible intervals, and the direction of change. In the right-most column ofTable 4, we have matched, based on detailed historical accounts (e.g., U.S. Department ofState, various years and ITERATE writeups), the precipitating events. Thus, changepoint1 is attributed to the rise in transnational terrorism that followed Israeli occupation afterthe Arab-Israeli wars. For changepoint 2, there is no clearly defined cause. Changepoint3 is attributed to the arrival of Lebanon multinational (peacekeeping) force (MNF) thattriggered a rise in kidnappings in Lebanon and throughout the Middle East. The eventualfall in these kidnappings by 1988 results in changepoint 4. At times, certain countriesor regions were plagued with a spate of kidnappings — see changepoints 5 and 7. Animportant recent changepoint followed the Abu Ghraib revelations at the start of April2004 that resulted in myriad kidnappings of foreign contractors and aid workers in Iraq(Enders & Sandler, 2006, Table 7.3, 174). Thus, changepoints 1, 3, and 9 followed frompolicy decisions with unintended awful consequences. Many of the breaks in Table 4have not been identified previously, thus underscoring the importance of our procedure.Notably, 9/11 is not a changepoint.
Figure 5 shows the SKYJACK series results, where there are eight breaks in the series,indicated by the vertical lines. Once again, the solid line is the cumulative number ofSKYJACK events and the dashed line is the estimated arrival rate of new events. Theinformation on the changepoints from Figure 5 is summarized in Table 5, along withconfidence intervals, direction of change, and precipitating events. Two important con-trasts between the KIDNAP and SKYJACK series are worth highlighting: SKYJACK
6 The prior sets kmax = 50, α = 1, β = L/n, which is the elapsed days from the first event divided by thetotal number of events, or a very low prior step height for changes, λ = 2 or a prior of two changepoints.This prior is consistent with the Bai-Perron breakpoint analysis results of Enders & Sandler (2005).Using a larger prior number of changepoints merely generates clusters of changepoints around thosereported here.7 The posterior sample of the parameters passes standard diagnostic tests for convergence (Gelman andRubin potential scale reduction factors computed using multiple chains are all one, traceplots show goodmixing and convergence, and the acceptance rates of the acceptance rates for the Hasting steps for thenumber of changepoint are between 35-55%.)
17
Dat
e
Cumulative number of kidnap events
02006001000
Posterior mean arrival rate of kidnap events0.000.050.100.150.200.25
1970
1980
1990
2000
Fig
.4.C
um
ula
tive
num
ber
ofK
IDN
AP
even
tsand
the
post
erio
rarr
ivalra
teofkid
nap
even
ts,1968–2005.
18
Table
4.K
IDN
AP
even
tch
angep
oin
tdate
sand
thei
r68%
cred
ible
inte
rvals
,1968-2
005.
Cha
ngep
oint
Med
ian
Dat
e68
%cr
edib
lese
tD
irec
tion
Eve
nt
119
70-0
2-17
(197
0-01
-28,
1970
-02-
25)
+R
ise
oftr
ansn
atio
nalte
rror
ism
219
77-1
0-25
(197
1-08
-19,
1983
-06-
21)
-Sm
allde
clin
ein
kidn
appi
ngs
319
83-0
7-27
(198
3-04
-22,
1988
-03-
17)
+Leb
anon
MN
F,ri
sein
Mid
dle
Eas
tki
dnap
ping
s
419
88-0
7-27
(198
7-09
-16,
1991
-10-
26)
-D
ownt
urn
inM
iddl
eE
ast
kidn
appi
ngs
519
93-0
5-22
(199
2-09
-01,
1994
-01-
17)
+A
lger
ian/
Tur
kish
kidn
appi
ngs
619
98-0
1-09
(199
7-12
-20,
1998
-04-
02)
-D
rop
intr
ansn
atio
nalte
rror
ism
719
98-1
2-21
(199
8-12
-01,
1999
-01-
05)
+A
fric
an/
Lat
inA
mer
ican
kidn
appi
ngs
820
00-1
0-14
(200
0-09
-19,
2000
-11-
24)
-P
re9/
11dr
op
920
04-0
4-05
(200
4-03
-30,
2004
-04-
07)
+A
buG
hrai
bre
vela
tion
s
1020
04-1
1-06
(200
4-11
-02,
2004
-11-
15)
-R
educ
tion
inIr
aqiki
dnap
ping
s
19
has fewer changepoints, and the changepoints differ between the two series. This lastobservation means that past studies — e.g., Enders & Sandler (2005) — that aggregateall hostage events miss important breaks in the series. In Table 5, changepoint 1 corre-sponds to a number of well-publicized PFLP skyjackings that demonstrated to terroristsworldwide that well-executed seizures with lives hanging in the balance not only capturemedia attention, but may also yield concessions. The introduction of metal detectorsat the start of 1973 led to a fall in skyjackings as the U.S. lead on January 3, 1973was gradually followed by other countries over the next six months. Changepoint 3 isattributed to Cuban exiles commandeering U.S. planes to Cuba, a practice that finallyended (changepoint 4) once Castro dished out 40-year sentences to hijackers upon arrivaland passengers started to take matters into their own hands. Changepoint 5 is associatedwith a large number of skyjackings in the Soviet Union prior to its collapse in 1991. Thereduction in state-sponsored terrorism after the Cold War is matched to changepoint 6,while the decline of all forms of terrorism in 1996 may explain changepoint 7. Finally,increased airport security is tied to changepoint 8.
Figure 6 shows the cumulative number of OTHER hostage events and their arrivalrate. The four changepoints are marked with vertical lines that match the entries inTable 6. Note that these breaks are much more spaced out — there are roughly six toeight years between each break. Large shifts in the arrival rate occur from late 1975through 1985. Barricade missions and nonaerial hijackings lost their popularity in thelate 1980s, thus explaining the paucity of changepoints after 1985. In Table 6, the fourchangepoints are matched to precipitating causes. Efforts to secure airports and otheractions to protect business people from kidnappings resulted in a substitution into otherkinds of hostage events — changepoint 2. As embassies were fortified in 1985, there wasa drop in barricade missions (Enders & Sandler, 1993, 2006). Finally, the post-Cold Warreduction in state-sponsored terrorism is tied to changepoint 4.
It is noteworthy that as hostage taking missions become more difficult (e.g., skyjackingsare more difficult than kidnappings) that the number of changepoints fall from Table 4to Table 6. Quite simply, innovations and shocks are more difficult to achieve for moredifficult missions. The arrival rate changes are plotted together in Figure 7. The KIDNAPand SKYJACK events are negatively correlated (r = −0.12), which is indicative ofsubstitutes. Thus, as metal detectors cut down on skyjackings, terrorists substituted intokidnappings, not protected by these detectors. The arrival rates of KIDNAP and OTHERhostage events are uncorrelated (r = −0.01). In contrast, these arrival rates are positivelycorrelated (r = 0.15) for SKYJACK and OTHER hostage events, where the location isknown to authorities. This positive correlation is indicative of complements.
The identification of substitute and complement modes of hostage taking is essential toinformed and effective policymaking. Policymakers must anticipate that actions to reduceone attack mode will be somewhat offset by greater reliance by terrorists on a substitutemode. Thus, the authorities must also protect against this anticipated substitution withforesight. In the case of complementary modes, a single policy intervention is apt toreduce both forms of hostage taking. If hostage models are uncorrelated, then a policyintervention for one mode is unlikely to have repercussions on the other attack mode.
20
Dat
e
Cumulative number of skyjack events
0100200300
Posterior mean arrival rate of skyjack events0.010.030.050.07
1970
1980
1990
2000
Fig
.5.C
um
ula
tive
num
ber
ofSK
YJA
CK
even
tsand
the
post
erio
rarr
ivalra
teofsk
yja
ckev
ents
,1968–2005.
21
Table
5.SK
YJA
CK
even
tch
angep
oin
tdate
sand
thei
r68%
cred
ible
inte
rvals
,1968-2
005.
Cha
ngep
oint
Med
ian
Dat
e68
%cr
edib
lese
tD
irec
tion
Eve
nt
119
69-0
8-02
(196
9-05
-09,
1973
-03-
12)
+P
FLP
skyj
acki
ngs
dem
onst
rati
oneff
ect
219
73-0
4-17
(197
2-10
-18,
1979
-11-
10)
-M
etal
dete
ctor
s
319
80-0
1-02
(197
9-06
-04,
1981
-10-
12)
+C
uban
skyj
acki
ngs
419
81-1
1-24
(198
1-06
-09,
1987
-08-
03)
-C
astr
o40
-yr
sent
ence
s
519
90-0
4-29
(198
6-01
-15,
1990
-06-
15)
+So
viet
skyj
acki
ngs
619
91-0
1-02
(199
0-05
-21,
1995
-04-
10)
-E
ndof
Col
dW
ar
719
96-0
9-03
(199
4-12
-15,
1998
-08-
08)
-Low
terr
oris
mye
ar
820
03-0
4-23
(199
9-07
-10,
2003
-06-
27)
-In
crea
sed
airp
ort
secu
rity
22
Dat
e
Cumulative number of other events
0100200
Posterior mean arrival rate of other events0.0050.0150.025
1970
1975
1980
1985
1990
1995
2000
2005
Fig
.6.C
um
ula
tive
num
ber
ofO
TH
ER
host
age
even
tsand
the
post
erio
rarr
ivalra
teofnonkid
nap
even
ts,1968–2005.
23
Table
6.O
TH
ER
even
tch
angep
oin
tdate
sand
thei
r68%
cred
ible
inte
rvals
.
Cha
ngep
oint
Med
ian
Dat
e68
%C
redi
ble
Set
Dir
ecti
onE
vent
119
72-0
6-26
(196
9-11
-17,
1972
-09-
04)
+Pos
t-Is
rael
ioc
cupa
tion
219
79-1
0-01
(197
2-08
-14,
1981
-10-
31)
+Su
bsti
tuti
onin
toot
her
host
age
even
ts
319
85-0
2-10
(198
1-02
-28,
1991
-09-
10)
-E
mba
ssy
fort
ifica
tion
419
93-0
6-10
(199
1-05
-26,
2001
-02-
11)
-Pos
t-C
old
War
redu
ctio
n
24
1970
1975
1980
1985
1990
1995
2000
2005
0.000.050.100.150.200.25
Tim
e
Arrival Rate
KID
NA
PS
KY
JAC
KO
TH
ER
Fig
.7.E
stim
ate
darr
ivalra
tes
for
each
type
ofhost
age
even
t,base
don
the
RJ-M
CM
Cch
angep
oin
tm
odel
,1968-2
005
25
5. Concluding remarks
This paper investigates the dynamic properties of three hostage taking series — kid-nappings, skyjackings, and other hostage events. Based on the Poisson autoregressivemodel, we identify the lag structure of these three series for monthly and quarterly data,as well as the impacts of three covariates (i.e., successful negotiations, violent ends, anddeaths). These impacts are expressed in terms of an impact and a long run multiplier.In the latter half of the paper, we apply a changepoint model estimated using reversiblejump Markov chain Monte Carlo methods to identify the changepoints for the three seriesand to relate these breaks to the precipitating event.
This study shows that the level of aggregation — monthly or quarterly — makes adifference in the inferences about the dynamics of the series and the impacts of covari-ates. Moreover, we show that the covariates have different impacts on various hostageseries. This indicates that policy recommendations for, say, kidnappings do not necessar-ily apply to skyjackings or other hostage events. For example, past concessions grantedhave the strongest impact on inducing future kidnapping events. For quarterly data, eachsuccessful negotiation results on average in 2.62 additional abductions over time. In fact,violent ends encourage further kidnappings and other hostage events, a disturbing andunexpected finding.
When changepoints are investigated, we find that each type of hostage event has dif-ferent changepoints. The more risky the event, the fewer are the number of changepoints.These differences again underscore that policy recommendations must distinguish amongthe various types of hostage incidents. Another disturbing finding is that some policies —e.g., Lebanon MNF and Abu Ghraib abuses — have unintended negative consequencesthat generate a wave of kidnappings. Thus, changepoints may result from policies, polit-ical events, or terrorism hotspots. Past studies that only used counterterrorism policiesto identify changepoints will miss many such points.
Kidnappings and skyjackings estimated arrival rates are negatively correlated so thatpolicies that discourage skyjackings — e.g., airport metal detectors — may encouragekidnappings. This negative correlation, thus, alerts policymakers to account for such po-tential substitutions, which may call for multiple policy interventions to head off policy-induced transference of attacks. Since skyjackings and other hostage events estimatedarrival rates are positively correlated, a single policy intervention may have a double div-idend by curbing more than one terrorist tactic. When making allocation decision amongalternative counterterrorism actions, policymakers need to account for such negative andpositive correlations.
Our methods can be fruitfully applied to other terrorist tactics for policy and forecast-ing purposes.
Acknowledgments
Patrick Brandt appreciates the support of the National Science Foundation (grantsSES-0351205 and SES-0540816). The code used to estimate the models in this paper(written in R and Fortran), replication materials, and additional results are availableupon request.
26
Todd Sandler gratefully acknowledge research support from the Vibhooti Shukla en-dowment.
References
Atkinson, S. E., Sandler, T., & Tschirhart, J. (1987). Terrorism in a bargaining frame-work. Journal of Law and Economics, 30 (1), 1–21.
Bai, J. & Perron, P. (1988). Estimating and testing linear models with multiple structuralchanges. Econometrica, 66 (1), 47–78.
Bai, J. & Perron, P. (2003). Computation and analysis of multiple structural changemodels. Journal of Applied Econometrics, 18 (1), 1–22.
Barros, C. P. (2003). An intervention analysis of terrorism: The Spanish ETA case.Defence and Peace Economics, 14 (6), 401–412.
Barros, C. P. & Gil-Alana, L. A. (2006). ETA: A persistent phenomenon. Defence andPeace Economics, 17 (2), 95–116.
Brandt, P. T. & Williams, J. T. (2001). A linear Poisson autoregressive model: ThePoisson AR(p) model. Political Analysis, 9 (2), 164–184.
Brandt, P. T., Williams, J. T., Fordham, B. O., & Pollins, B. (2000). Dynamic modelingfor persistent event count time series. American Journal of Political Science, 44 (4),823–843.
Cameron, A. C. & Trivedi, P. K. (1998). Regression analysis of count data. Cambridge:Cambridge University Press.
Enders, W., Parise, G. F., & Sandler, T. (1992). A time-series analyssis of transnationalterrorism. Defence and Peace Economics, 3 (4), 305–320.
Enders, W. & Sandler, T. (1993). The effectiveness of anti-terrorism policies: A vector-autoregression-intervention analysis. American Political Science Review, 87 (4), 829–844.
Enders, W. & Sandler, T. (2005). After 9/11: Is it all different now? Journal of ConflictResolution, 49 (2), 259–277.
Enders, W. & Sandler, T. (2006). The political economy of terrorism. Cambridge: Cam-bridge University Press.
Enders, W., Sandler, T., & Cauley, J. (1990a). Assessing the impact of terrorist-thwartingpolicies: An intervention time series approach. Defence and Peace Economics, 2 (1),1–18.
Enders, W., Sandler, T., & Cauley, J. (1990b). UN conventions, technology, and retalia-tion in the fight against terrorism: An econometric evaluation. Terrorism and PoliticalViolence, 2 (1), 83–105.
Gaibulloev, K. & Sandler, T. (2009). Hostage taking: Determinants of logistical andnegotiated success. Journal of Peace Research, 46 (forthcoming).
Green, P. J. (1995). Reversible jump Markov chain monte carlo computation andBayesian model determination. Biometrika, 82 (4), 711–732.
Hoffman, B. (1998). Inside terrorism. New York: Columbia University Press.Hoffman, B. (2006). Inside terrorism: Revised and expanded Ed. New York: Columbia
University Press.Im, E. I., Cauley, J., & Sandler, T. (1987). Cycles and substitutions in terrorist activities:
A spectral approach. Kyklos, 40 (2), 238–255.
27
Islam, M. Q. & Shahin, W. N. (1989). Economic methodology applied to political hostage-taking in light of the Iran-Contra affair. Southern Economic Journal, 55 (4), 1019–1024.
Landes, W. M. (1978). An economic study of U.S. aircraft hijackings, 1961–1976. Journalof Law and Economics, 21 (1), 1–31.
Lapan, H. E. & Sandler, T. (1988). To bargain or not to bargain: That is the question.American Economic Association Papers and Proceedings, 78 (2), 16–20.
Lee, B. S., Enders, W., & Sandler, T. (2008). 9/11: What did we know and when did weknow it? Defence and Peace Economics, 19.
Mickolus, E. F. (1982). International terrorism: Attributes of terrorist events, 1968–1977(ITERATE 2). Ann Arbor, MI: Inter-University Consortium for Political and SocialResearch.
Mickolus, E. F., Sandler, T., Murdock, J. M., & Flemming, P. (2006). Internationalterrorism: Attributes of terrorist events, 1968–2005 (ITERATE 5). Dunn Loring, VA:Vinyard Software.
Park, J. H. (2007). Bayesian analysis of structural changes: Historical changes inU.S. presidential uses of force abroad. Annual Meeting of Society for Political Method-ology, State College, Pennsylvania.
Poe, S. (1988). Nations’ responses to transnational hostage events: An empirical evalu-ation. International Interactions, 14 (1), 27–40.
Raftery, A. E. & Akman, V. E. (1986). Bayesian analysis of a Poisson process with achange point. Biometrika, 73, 85–89.
Sandler, T. & Scott, J. (1987). Terrorist success in hostage-taking incidents: An empiricalstudy. Journal of Conflict Resolution, 31 (1), 35–53.
Sandler, T., Tschirhart, J., & Cauley, J. (1983). A theoretical analysis of transnationalterrorism. American Political Science Review, 77 (1), 36–54.
U.S. Department of State (various years). Patterns of global terrorism. Washington, DC:U.S. Department of State.