Hot Mix Asphalt Research Investigation For Connecticut: Part E – Comparison of Field Performance Of Superpave and Traditional Marshall Mixes Prepared by: Scott Zinke, James Mahoney Report Number CT-2250-3-12-9 July 24, 2014 SPR 2250 – Part E Connecticut Advanced Pavement Laboratory Connecticut Transportation Institute University of Connecticut Prepared for: Connecticut Department of Transportation James A. Fallon, P.E. Manager of Facilities and Transit Bureau of Engineering and Construction
Transcript
Hot Mix Asphalt Research Investigation For Connecticut:
Part E – Comparison of Field Performance Of Superpave and Traditional Marshall Mixes
Prepared by: Scott Zinke, James Mahoney
Report Number CT-2250-3-12-9
July 24, 2014
SPR 2250 – Part E
Connecticut Advanced Pavement Laboratory Connecticut Transportation Institute
University of Connecticut
Prepared for: Connecticut Department of Transportation
James A. Fallon, P.E.
Manager of Facilities and Transit Bureau of Engineering and Construction
ii
Disclaimer
This report [article, paper or publication] does not constitute a standard, specification or regulation. The contents of this report [article, paper or publication] reflect the views of the author(s) who (are) responsible for the facts and the accuracy of the data presented herein. The contents do not necessarily reflect the views of the Connecticut Department of Transportation or the Federal Highway Administration.
iii
Acknowledgements This report was prepared by the University of Connecticut, in cooperation with the Connecticut Department of Transportation and the United States Department of Transportation, Federal Highway Administration. The opinions, findings and conclusions expressed in the publication are those of the author(s) and not necessarily those of the Connecticut Department of Transportation or the Federal Highway Administration. This publication is based upon publicly supported research and is copyrighted. It may be reproduced in part or in full, but it is requested that there be customary crediting of the source. The research team would like to thank all those within the Connecticut Department of Transportation who contributed time and supplied the data and information, which was necessary to complete this study. Without their support this research would not have been possible. The research team would also like to thank the Federal Highway Administration for their support of this research.
iv
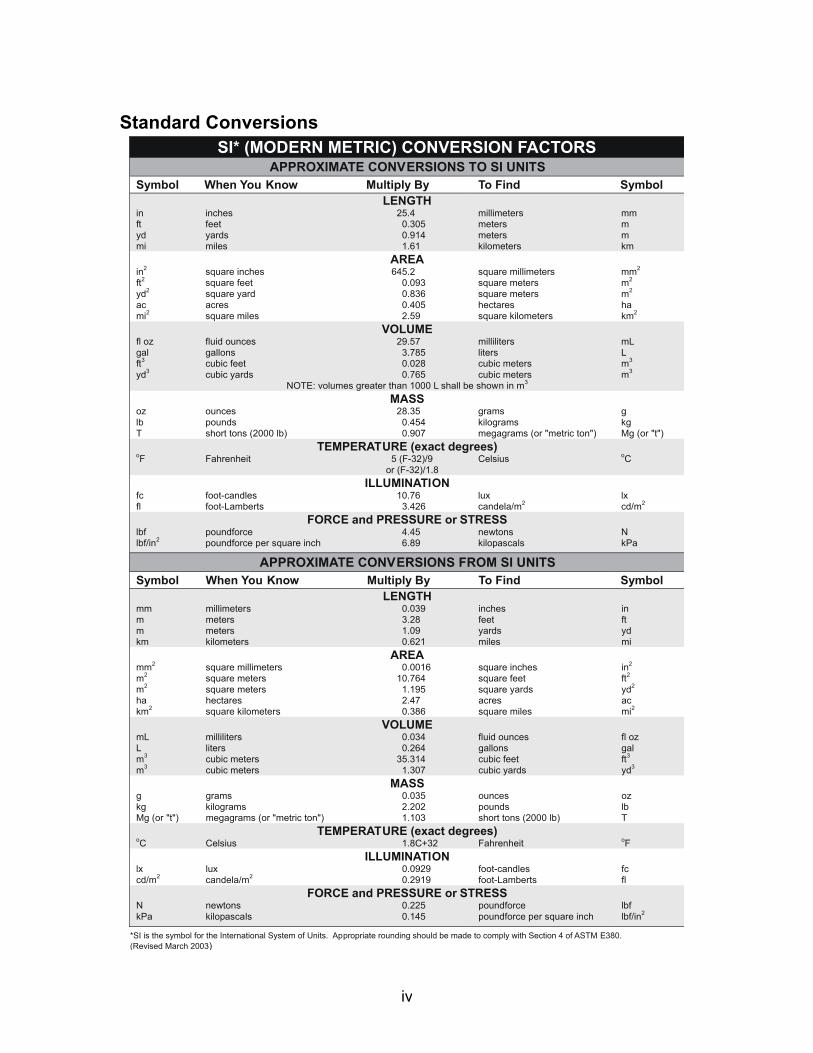
Standard Conversions SI* (MODERN METRIC) CONVERSION FACTORS
APPROXIMATE CONVERSIONS TO SI UNITSSymbol When You Know Multiply By To Find Symbol
LENGTH in inches 25.4 millimeters mm ft feet 0.305 meters m yd yards 0.914 meters m mi miles 1.61 kilometers km
AREA in2 square inches 645.2 square millimeters mm2
ft2 square feet 0.093 square meters m2
yd2 square yard 0.836 square meters m2
ac acres 0.405 hectares ha mi2 square miles 2.59 square kilometers km2
VOLUME fl oz fluid ounces 29.57 milliliters mL gal gallons 3.785 liters L ft3 cubic feet 0.028 cubic meters m3
yd3 cubic yards 0.765 cubic meters m3
NOTE: volumes greater than 1000 L shall be shown in m3
MASS oz ounces 28.35 grams glb pounds 0.454 kilograms kgT short tons (2000 lb) 0.907 megagrams (or "metric ton") Mg (or "t")
TEMPERATURE (exact degrees) oF Fahrenheit 5 (F-32)/9 Celsius oC
or (F-32)/1.8 ILLUMINATION
fc foot-candles 10.76 lux lx fl foot-Lamberts 3.426 candela/m2 cd/m2
FORCE and PRESSURE or STRESS lbf poundforce 4.45 newtons N lbf/in2 poundforce per square inch 6.89 kilopascals kPa
APPROXIMATE CONVERSIONS FROM SI UNITS Symbol When You Know Multiply By To Find Symbol
LENGTHmm millimeters 0.039 inches in m meters 3.28 feet ft m meters 1.09 yards yd km kilometers 0.621 miles mi
AREA mm2 square millimeters 0.0016 square inches in2
m2 square meters 10.764 square feet ft2
m2 square meters 1.195 square yards yd2
ha hectares 2.47 acres ac km2 square kilometers 0.386 square miles mi2
VOLUME mL milliliters 0.034 fluid ounces fl oz L liters 0.264 gallons gal m3 cubic meters 35.314 cubic feet ft3
m3 cubic meters 1.307 cubic yards yd3
MASS g grams 0.035 ounces ozkg kilograms 2.202 pounds lbMg (or "t") megagrams (or "metric ton") 1.103 short tons (2000 lb) T
TEMPERATURE (exact degrees) oC Celsius 1.8C+32 Fahrenheit oF
FORCE and PRESSURE or STRESS N newtons 0.225 poundforce lbf kPa kilopascals 0.145 poundforce per square inch lbf/in2
*SI is the symbol for th International System of Units. Appropriate rounding should be made to comply with Section 4 of ASTM E380. e(Revised March 2003)
v
Technical Report Documentation Page
1. Report No. CT-2250-3-12-9
2. Government Accession No.
3. Recipient’s Catalog No.
4. Title and Subtitle Hot Mix Asphalt Research Investigation for Connecticut Part E - Field Performance of Superpave and Traditional Marshall Mixtures Mixtures, Final Report
5. Report Date
June 24, 2014 6. Performing Organization Code
SPR-2250 7. Author(s)
Bria Scott Zinke, James Mahoney 8. Performing Organization Report No.
CAPLAB 7-2014 9. Performing Organization Name and Address
University of Connecticut Connecticut Advanced Pavement Laboratory Connecticut Transportation Institute 270 Middle Turnpike, U-5202 Storrs, Connecticut 06269-5202
10 Work Unit No. (TRIS)
11. Contract or Grant No. CT Study No. SPR-2250 13. Type of Report and Period Covered
Final Report, SPR 2250, Part E
12. Sponsoring Agency Name and Address
Connecticut Department of Transportation 2800 Berlin Turnpike Newington, CT 06131-7546
14. Sponsoring Agency Code
SPR-2250 15. Supplementary Notes Conducted in cooperation with the U.S. Department of Transportation, Federal Highway
Administration 16. Abstract This research is part of the series of investigated topics surrounding hot mix asphalt in Connecticut. This research investigates the performance of sections of pavements designed using both the Marshall and Superpave mix design methods. Sixteen different pavement sections in Connecticut ( eight Superpave and eight Marshall) were analyzed by means of site visits, photolog image analysis and numerical condition ratings. This research was intended to investigate whether there are difference(s) between the two differently designed types of pavement as far as their ability to withstand environmental distress, as well as traffic loading. Results showed no conclusive evidence that the two pavement types perform differently. 17. Key Words Asphalt Pavements, Mix Design,
Superpave, Marshall
18.Distribution Statement No restrictions. This document is available to the public
through the National Technical Information Service, Springfield, Virginia 22161. The report is available on-line from National Transportation Library at http://ntl.bts.gov.
19. Security Classif. (of report) Unclassified
20. Security Classif. (of this page) Unclassified
21. No. of Pages 57
21. Price
Form DOT F 1700.7 (8-72) Reproduction of completed page authorized
vi
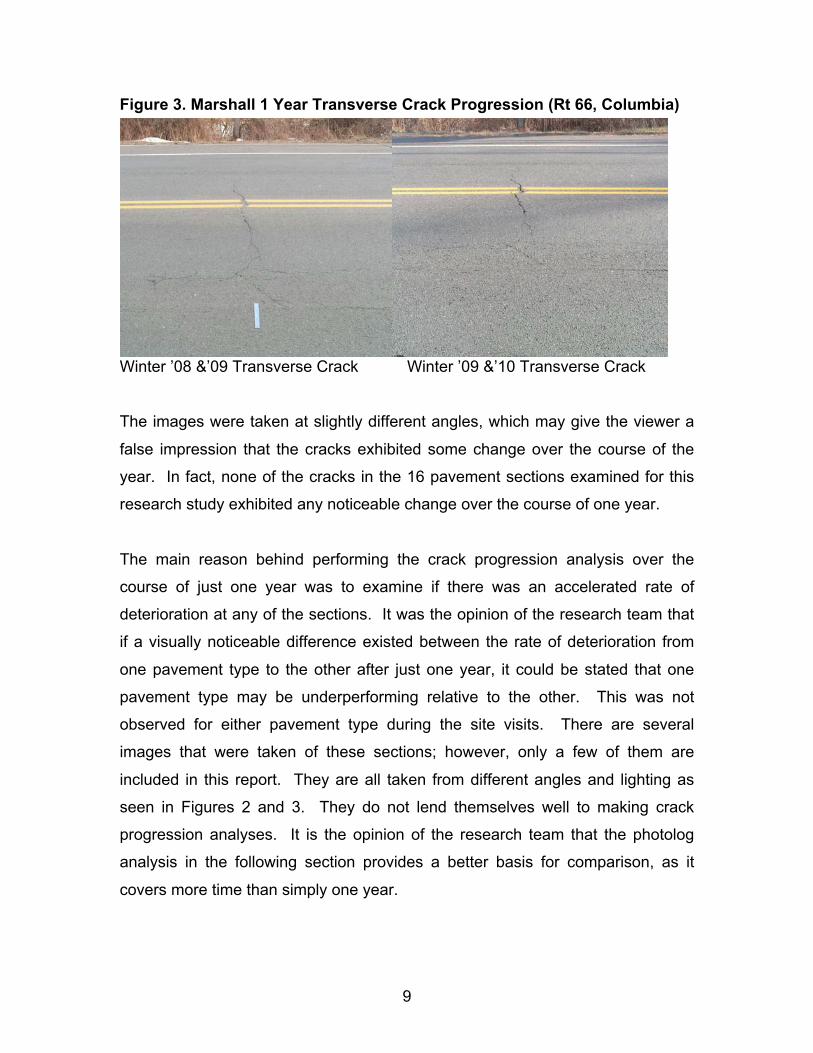
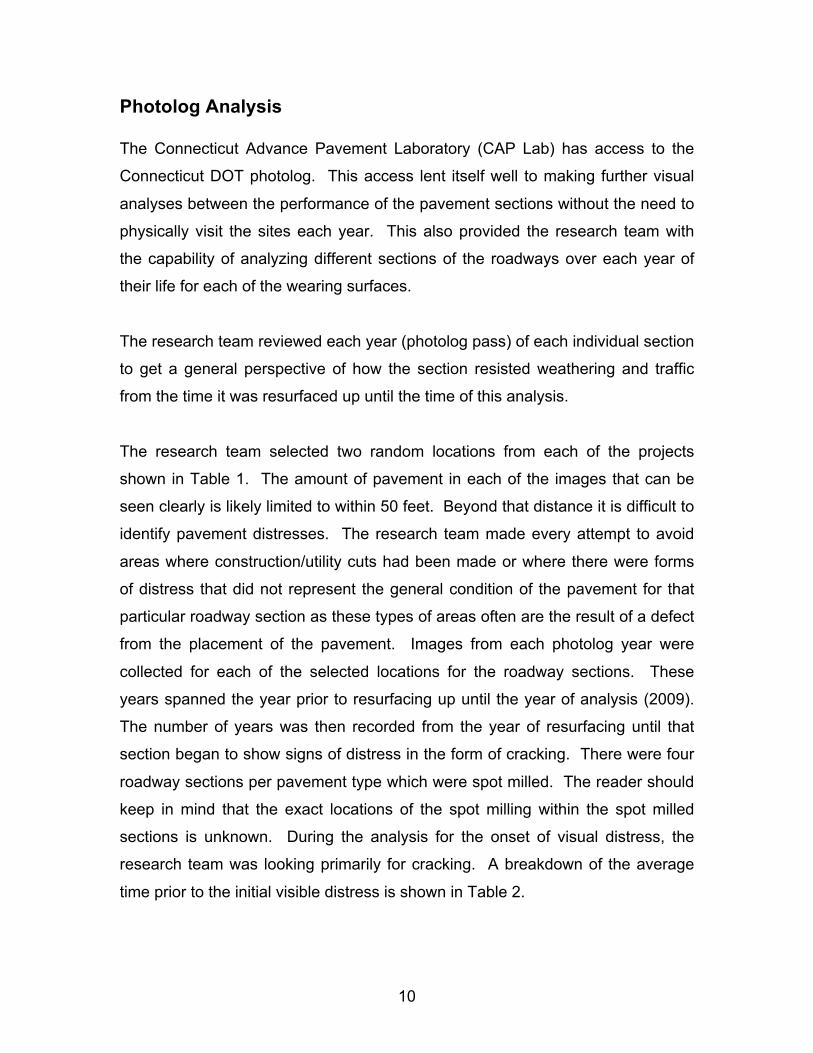
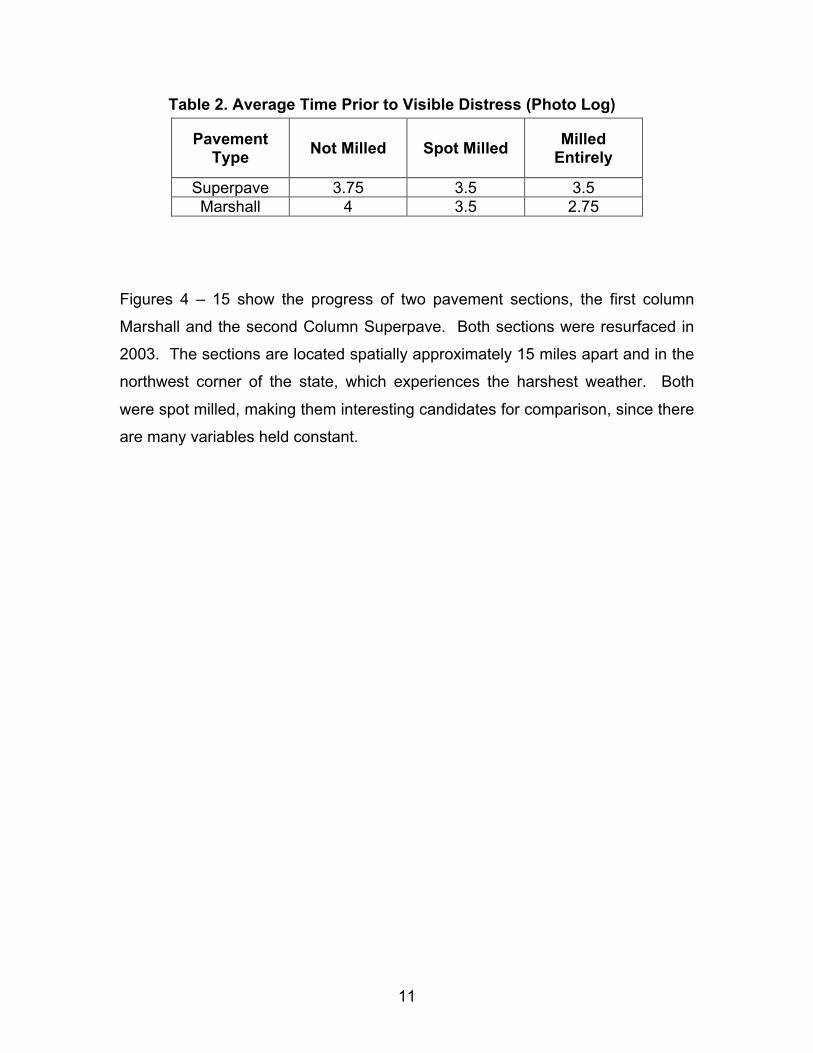
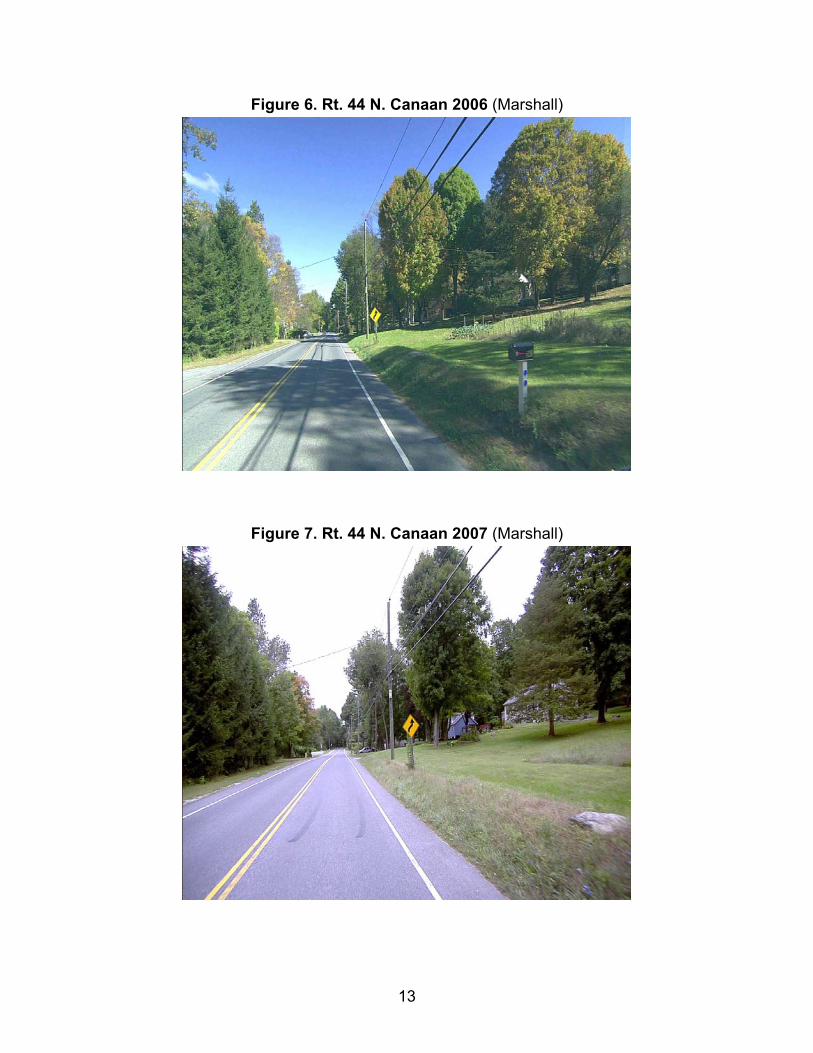
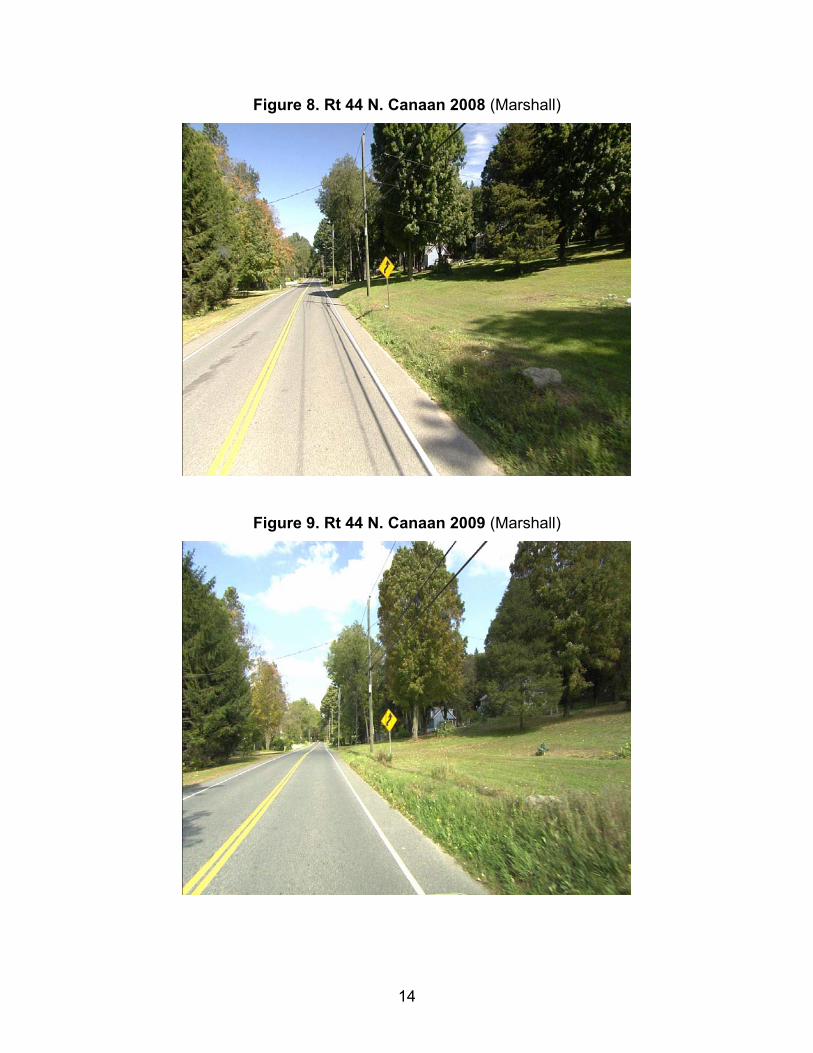
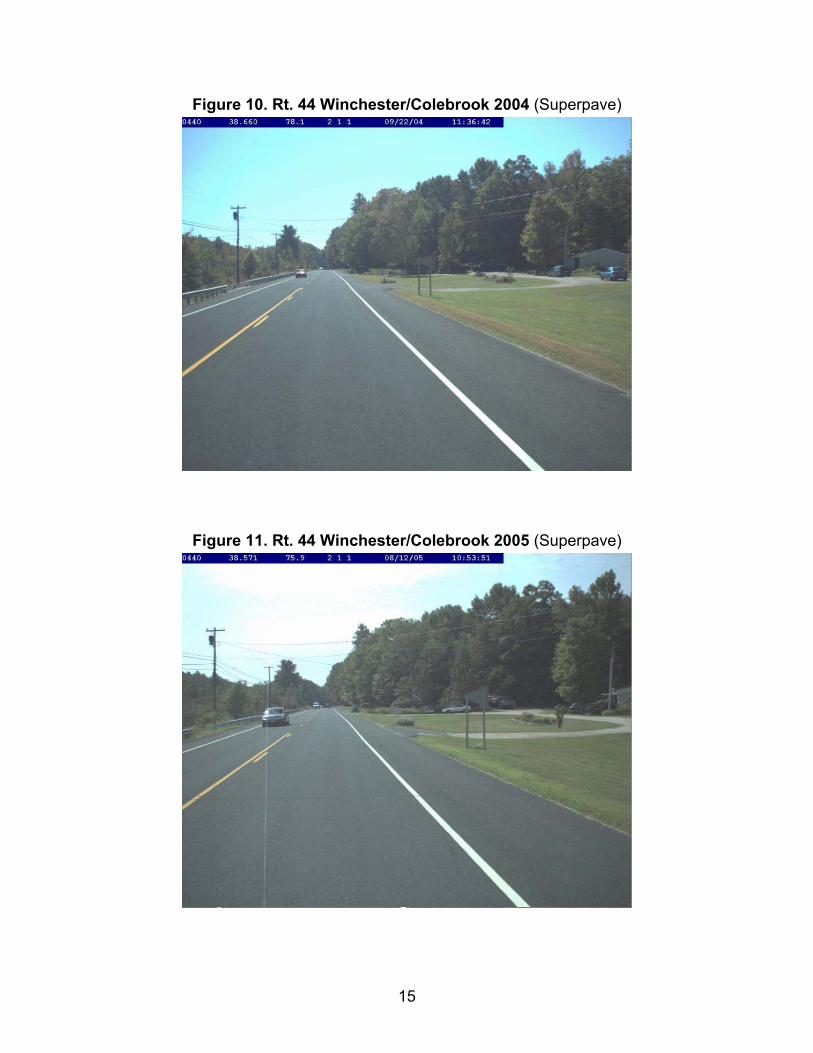
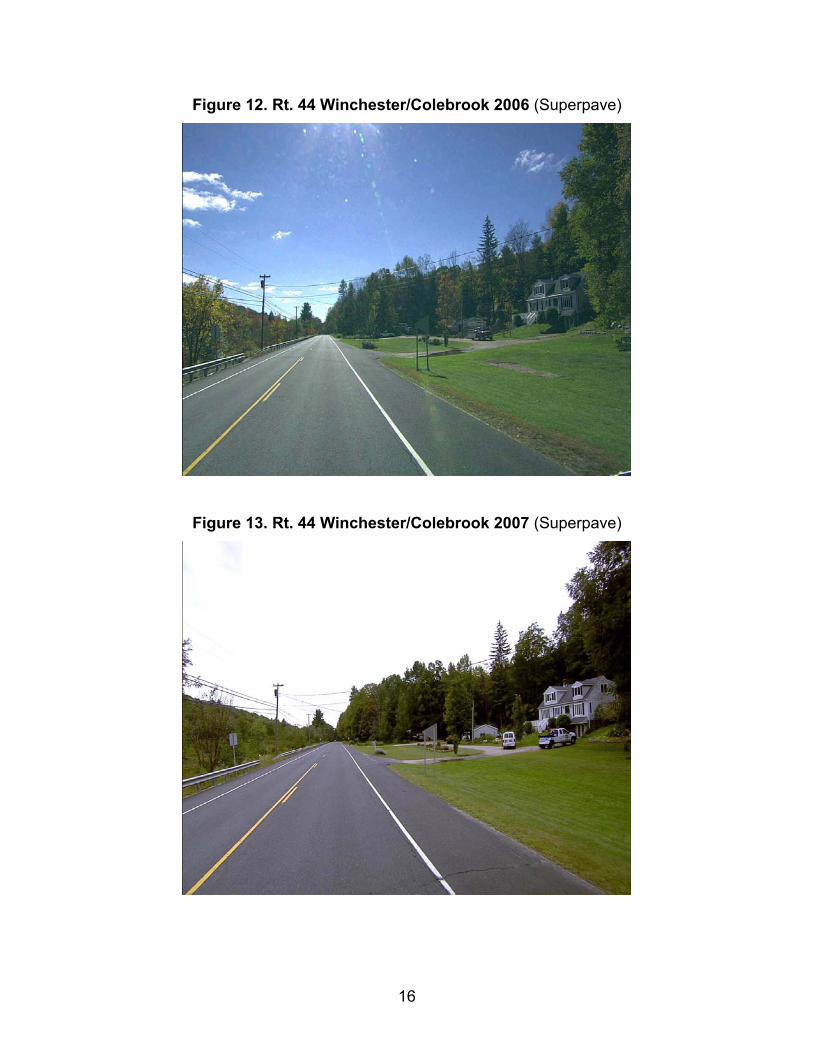
Table of Contents Disclaimer .......................................................................................................................... ii Acknowledgements ........................................................................................................... iii Standard Conversions ...................................................................................................... iv Technical Report Documentation Page ............................................................................ v Table of Contents .............................................................................................................. vi Executive Summary ......................................................................................................... vii Background ....................................................................................................................... 1 Objectives ......................................................................................................................... 2 Reviewed Literature .......................................................................................................... 2 Pavement Section Selection ............................................................................................. 3 Work Plan ......................................................................................................................... 6 Road Section Site Visits .................................................................................................... 7 Photolog Analysis ........................................................................................................... 10 Pavement Serviceability Rating Analysis ........................................................................ 18 Conclusions .................................................................................................................... 23 References ...................................................................................................................... 25 Appendix A. PSR Manual .............................................................................................. 26 Appendix B - Roadway Sections Provided by ConnDOT District ................................... 45 List of Tables Table 1. Pavement Sections ............................................................................................ 5 Table 2. Average Time Prior to Visible Distress (Photo Log) .......................................... 11 Table 3. PSR Rating Conditions .................................................................................... 19 Table 4. PSR Component Weights ................................................................................. 19 Table 5. PSR Record 1999 - 2008 ................................................................................. 20 Table 6. Slope of PSR Values Resurfacing through 2008 ............................................. 21 Table 7. PSR Geographical Comparisons ..................................................................... 23 List of Figures Figure 1. Connecticut Department of Transportation Maintenance Districts .................... 4 Figure 2. SuperPave 1 Year Transverse Crack Progression ............................................ 8 Figure 3. Marshall 1 Year Crack Progression ................................................................... 9 Figure 4. Rt. 44 N. Canaan 2004 (Marshall) ................................................................... 12 Figure 5. Rt. 44 N. Canaan 2005 (Marshall) ................................................................... 12 Figure 6. Rt. 44 N. Canaan 2006 (Marshall) ................................................................... 13 Figure 7. Rt. 44 N. Canaan 2007 (Marshall) ................................................................... 13 Figure 8. Rt 44 N. Canaan 2008 (Marshall) .................................................................... 14 Figure 9. Rt 44 N. Canaan 2009 (Marshall) .................................................................... 14 Figure 10. Rt. 44 Winchester/Colebrook 2004 (Superpave) ........................................... 15 Figure 11. Rt. 44 Winchester/Colebrook 2005 (Superpave) ........................................... 15 Figure 12. Rt. 44 Winchester/Colebrook 2006 (Superpave) ........................................... 16 Figure 13. Rt. 44 Winchester/Colebrook 2007 (Superpave) ........................................... 16 Figure 14. Rt. 44 Winchester/Colebrook 2008 (Superpave) ........................................... 17 Figure 15. Rt. 44 Winchester/Colebrook 2009 (Superpave) ........................................... 17 Figure 16. Interstate 84 Geographical Delineation ........................................................ 22
vii
Executive Summary This research investigates the in-place long-term durability of Superpave mixes as compared with traditional Marshall mixes in Connecticut. One of the primary focuses of the Superpave mix design method was the mitigation of permanent deformation of the pavement that presented itself in the form of wheel path rutting. No studies were available which investigated the long-term field durability of Superpave mixes as the design process was so new. Several people from within ConnDOT expressed concern about the integrity of these new Superpave pavements in Connecticut.. The concern was the ability of Superpave mixes to adequately resist distresses caused by the freezing and thawing cycles in colder climates while resisting the permanent deformation of rutting. Three analytical methods were used to investigate the performance of these new mixes in comparison with Marshall mixes. First, a list of pavement sections to be analyzed was obtained from each maintenance district within the Connecticut Department of Transportation (ConnDOT). The research team visited each pavement section and narrowed the list down to two Marshall sections and two Superpave sections per maintenance district for a total of 16 sections throughout the state. Once the pavement sections were selected, they were photographed during the winter months and then photographed again one year later to analyze whether certain sections were deteriorating rapidly in comparison with others. Another comparison took place by viewing the sections from year to year with the Connecticut Photolog images. This provided a better platform to analyze deterioration rates, as it covered from the time each section was resurfaced until the time of the analysis. The last method of analyzing these sections for performance was viewing the ConnDOT Office of Maintenance Pavement Serviceability Ratings (PSR) over several years. The PSR ratings not only allowed the research team to gain the perspective of the quality of each section from the ConnDOT viewpoint, but it also gave a numerical platform for analysis of performance. These PSR values were analyzed to see the rate of decline in serviceability over several years. They were also used to compare the pavement sections in the areas in the state that experience the harshest weather with those sections located in other areas which do not typically experience as much harsh weather. All of these analyses were conducted as a basis of comparison between the performance of Superpave mixes and Marshall mixes. Conclusions were made from this research that indicate no difference in the ability of the two differently
viii
designed pavement types (Marshall and Superpave) to withstand environmental and/or traffic loading over a period of four to eight years.
1
Background Superpave mix design methods were developed at the national level in a wide-
scale effort to improve upon the quality, structural integrity and service life of hot-
mix asphalt (HMA) roadways. Structural integrity was a primary focus during the
development of the Superpave system as roadways constructed under traditional
design methods frequently experienced permanent deformation that presented
itself in the form of wheel path rutting. The Superpave mix design system
promotes stone-on-stone contact to create a greater degree of internal friction
within the pavement. This increased internal friction is intended to allow the
denser and more angular stone matrix to absorb and distribute loading stress
from traffic, while resisting rutting to a much more substantial degree than
traditional mix designs. The PG asphalts used in Superpave were also
developed to address temperature susceptibility (hot and cold) of in place
asphalts, and to extend the range of temperatures that could be experienced by
in-place pavements without detrimental results (i.e, less cracking induced by cold
and stiffness, less rutting and shoving induced by heat and viscosity).
After development, the Superpave system was widely adopted by agencies all
across the United States. Because the Superpave system wasn’t developed until
the 1990’s, there were no available studies from which long-term performance of
Superpave roadways could be examined, and there was no long-term research
available comparing performance characteristics of traditionally designed
pavements and pavements designed under the Superpave protocol.
Some pavements in Connecticut designed under the Superpave system have
now been in service in excess of 10 years, and many of those surfaces have
been overlaid. ConnDOT made the full switch from Marshall mixes to Superpave
mixes in 2004. Concerns were expressed by ConnDOT regarding the durability
of Superpave mixes, specifically with respect to excessive cracking. This
2
research is intended to compare those pavements with similar pavements of the
same age and traffic levels that were designed using the traditional Marshall
method.
Objectives The objective of this research was to examine and compare performance
characteristics of Superpave mixes and mixes designed using the Marshall
method throughout the state of Connecticut. Three different data collection
methods, including field evaluations of several roadways constructed in
Connecticut, were used to provide insight as to how the two different pavement
design types perform in the field, with respect to each other. This information
provided long-term performance data comparing the two methods and was as a
tool in future long-term performance comparisons, which were conducted.
Reviewed Literature Long-term, in-depth comparisons of field evaluations between Marshall and
Superpave mix designs, from a perspective other than rutting, were difficult to
find. Another confounding issue in finding studies for comparison are the various
adjustments made to Marshall mix requirements by the individual states. There
was, however, a study conducted in Alabama (Watson et al, 2005) that examined
performance measures between Superpave mixes and Marshall mixes on similar
projects, for the purpose of optimizing the number of gyrations used in the
Superpave mix design process. Although the Alabama research was conducted
for different reasons, it lends itself well to this investigation in light of the fact that
it makes some similar comparisons.
Twenty-five Marshall mix pavement sections and 25 Superpave pavement
sections throughout Alabama were selected for analysis. Among several
performance measures that were examined are rut depth, crack severity and
3
crack intensity. At the time of analysis, both sets of sections averaged
approximately four years old, and both sets had a reasonably similar average
daily traffic (ADT).
Average rut depths from the Marshall projects were compared with average rut
depths from the Superpave projects. Watson et al. indicate that that there was
no difference in the rutting performance between the projects constructed under
the differing mix designs at the time of the comparison (i.e., at average four years
age).
When results of cracking severity and intensity were compared between the
projects, the authors indicated only a 0.03 LF/SF (linear feet of cracking per
square foot of pavement) average difference between the two sets of data. It
was also noted that only seven Marshall projects and six Superpave projects
exhibited any cracking distress, which was another indication the surfaces were
performing similarly.
Among the conclusions made by the authors were that both mix sets were
performing well with minimal rutting and cracking after they had been in service
approximately four years. The authors stated that the cracking resistance for
both types of mixes appeared to be similar.
Pavement Section Selection The research team consulted with ConnDOT to identify pavement sections
throughout Connecticut that would lend themselves well to making mixture
performance comparisons. Although Connecticut is a relatively small state, there
are notable differences in climatic conditions within the state due to the variable
geography and relative proximity to the Atlantic Ocean. Connecticut elevations
range from zero feet above mean sea level at Long Island Sound to almost 2500
feet near the northern border of the state. Since environmental distresses were of
4
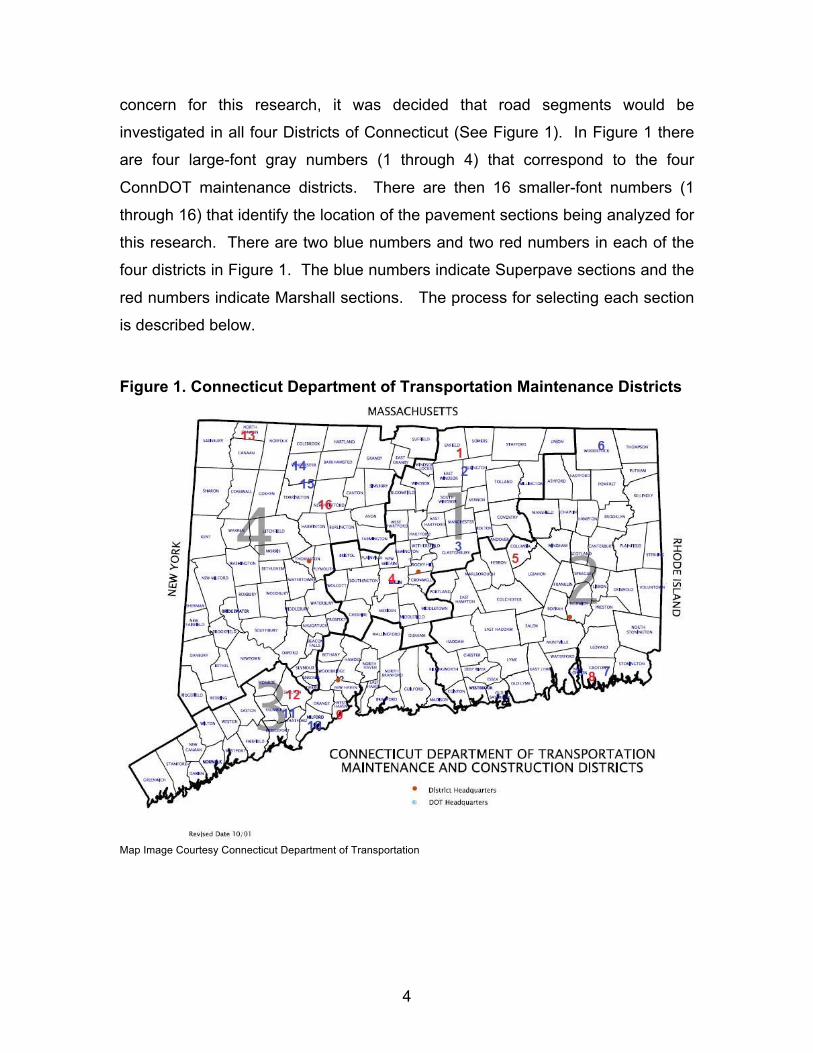
concern for this research, it was decided that road segments would be
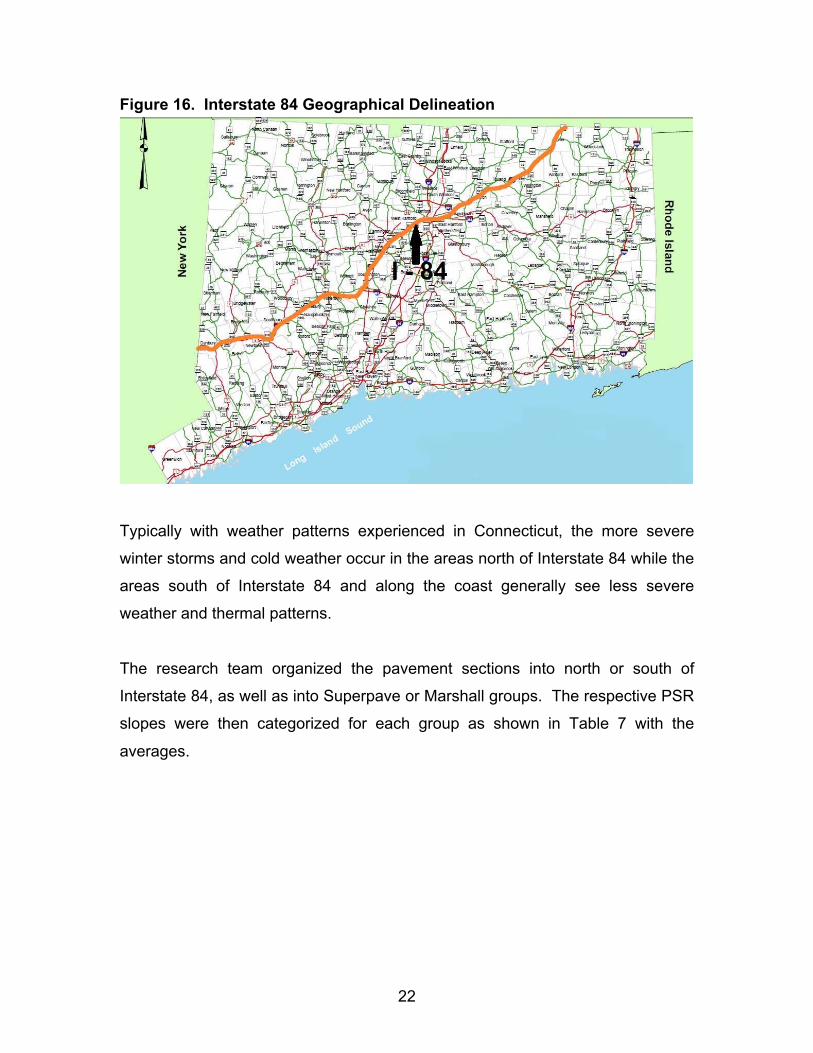
investigated in all four Districts of Connecticut (See Figure 1). In Figure 1 there
are four large-font gray numbers (1 through 4) that correspond to the four
ConnDOT maintenance districts. There are then 16 smaller-font numbers (1
through 16) that identify the location of the pavement sections being analyzed for
this research. There are two blue numbers and two red numbers in each of the
four districts in Figure 1. The blue numbers indicate Superpave sections and the
red numbers indicate Marshall sections. The process for selecting each section
is described below.
Figure 1. Connecticut Department of Transportation Maintenance Districts
Map Image Courtesy Connecticut Department of Transportation
5
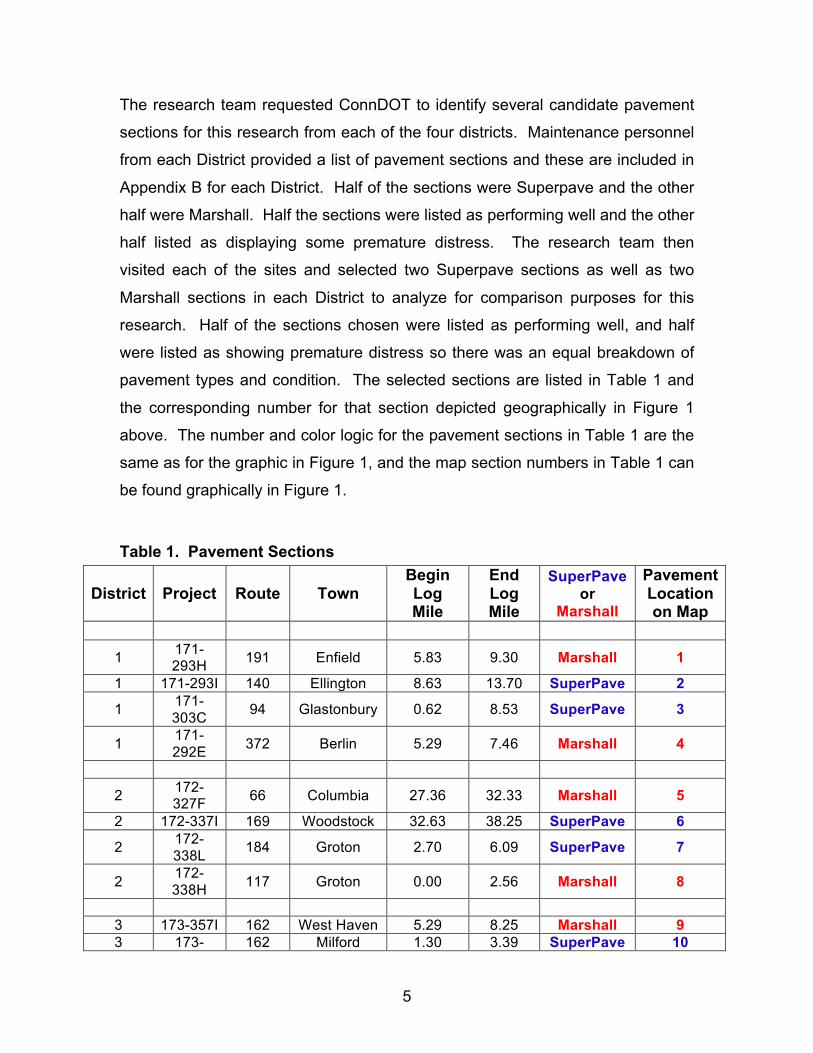
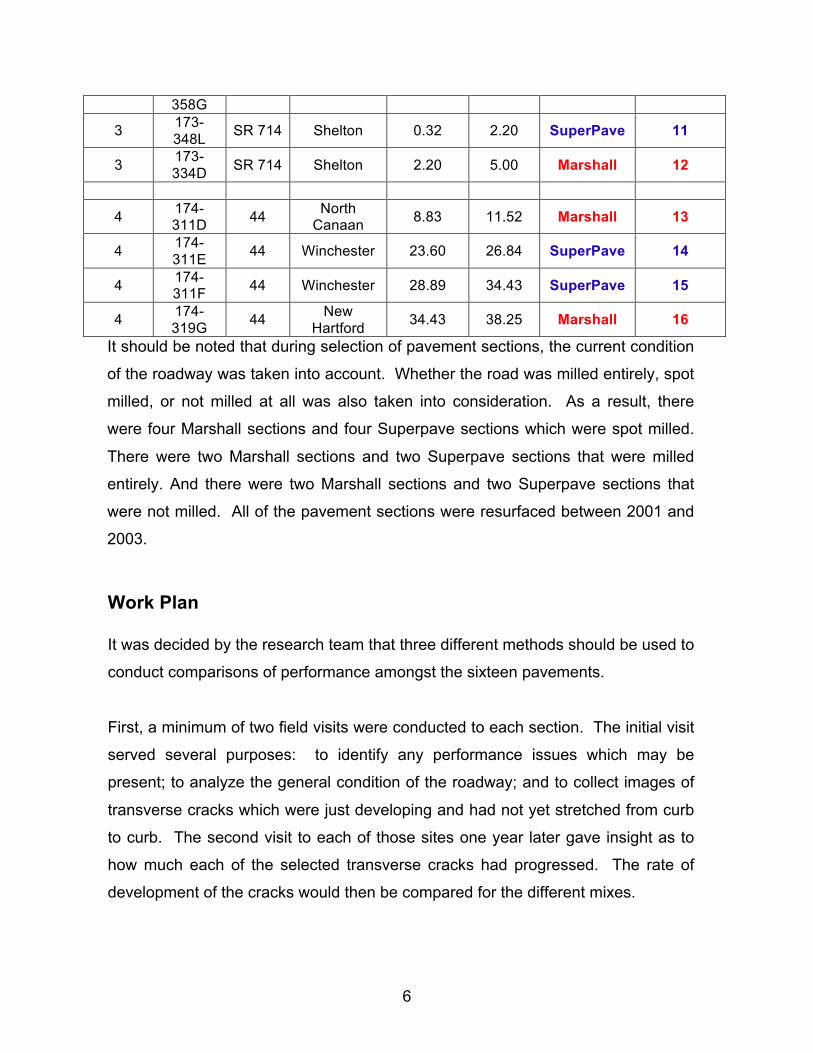
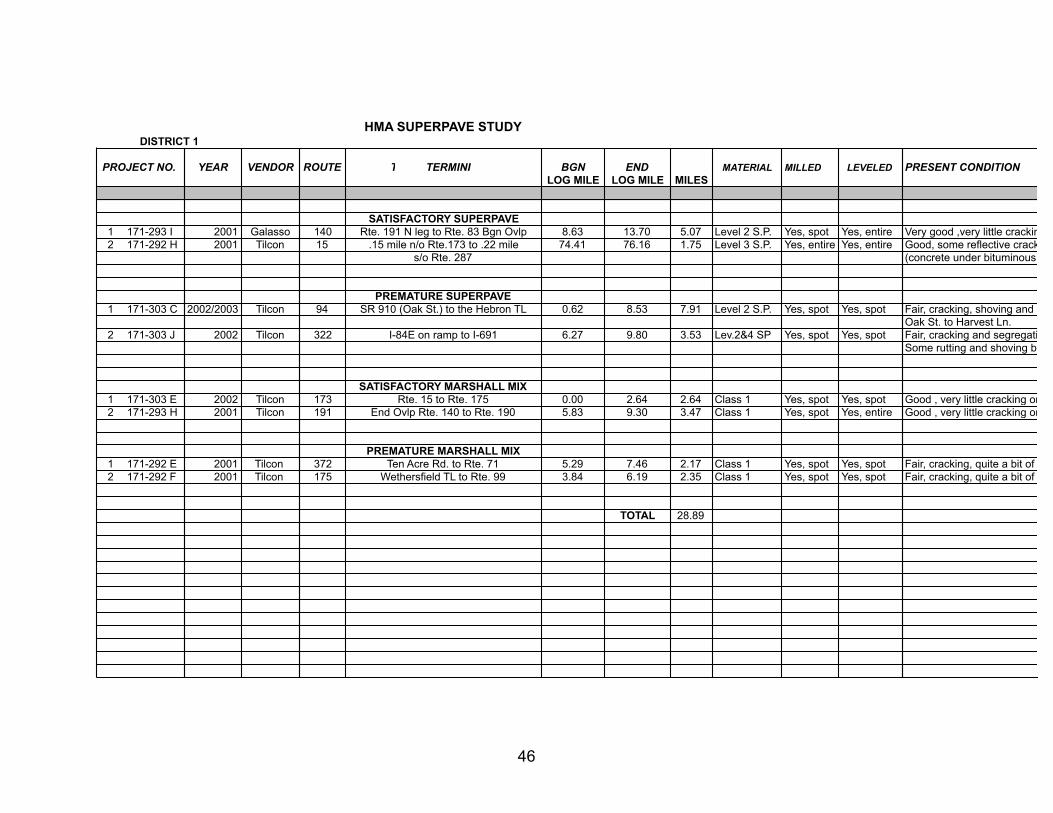
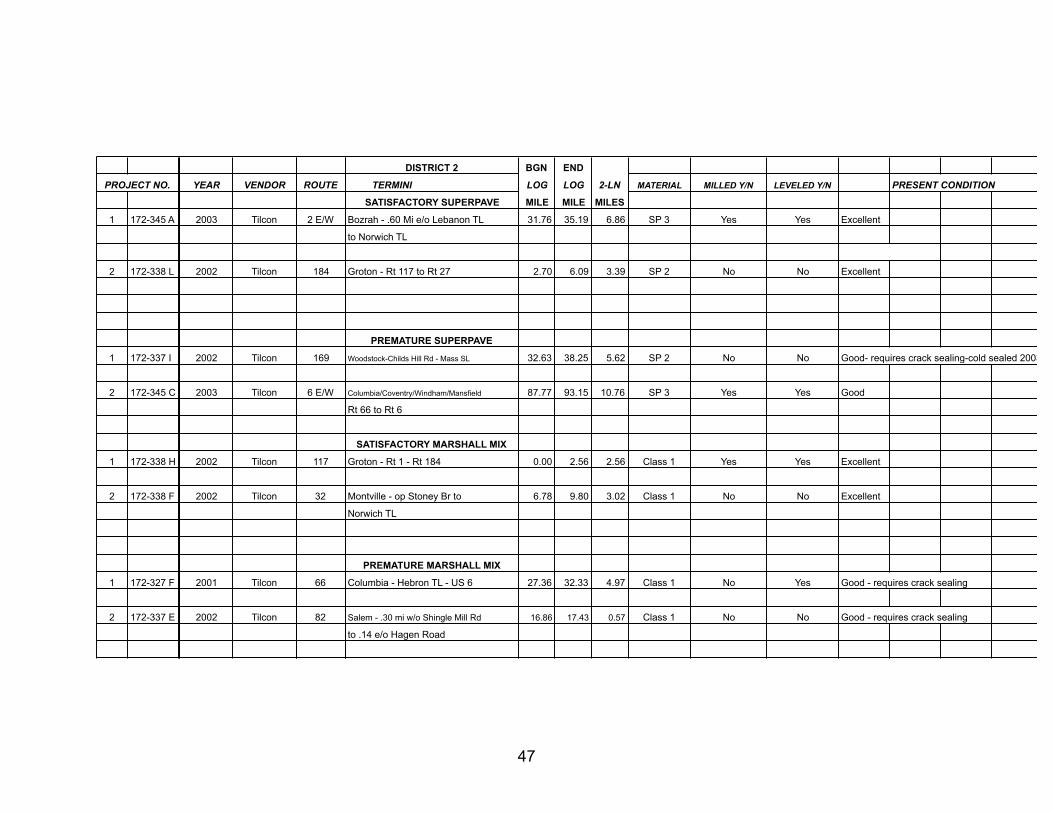
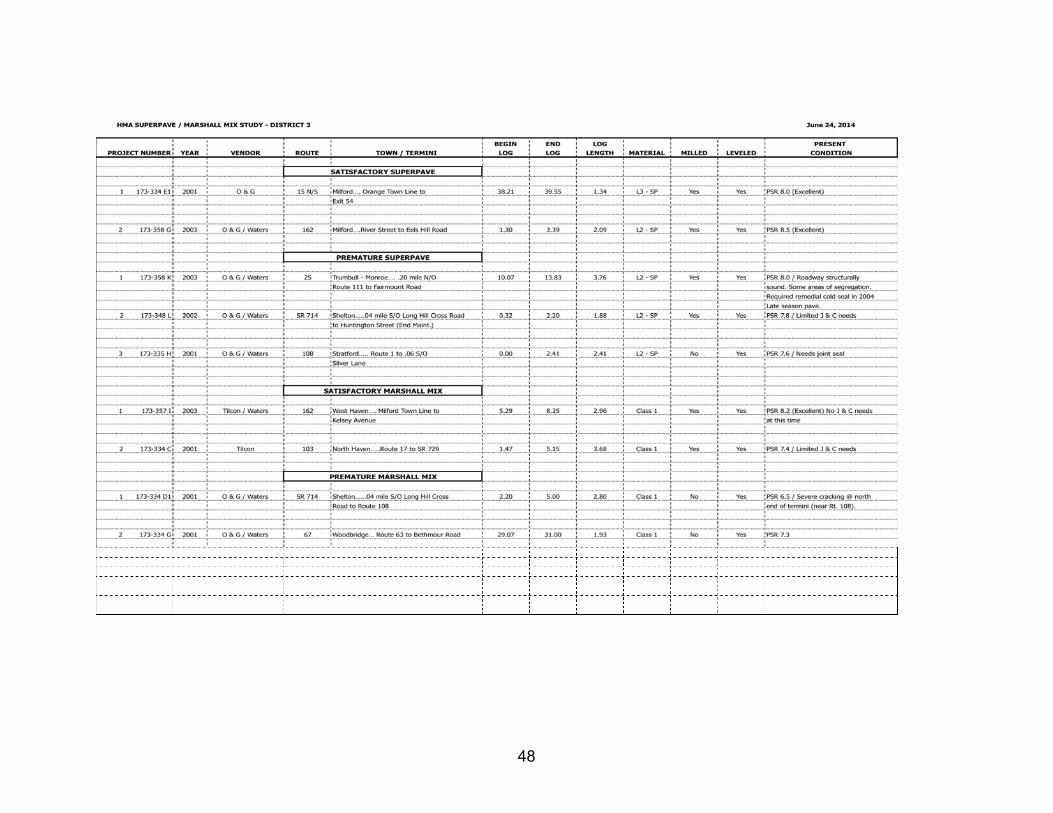
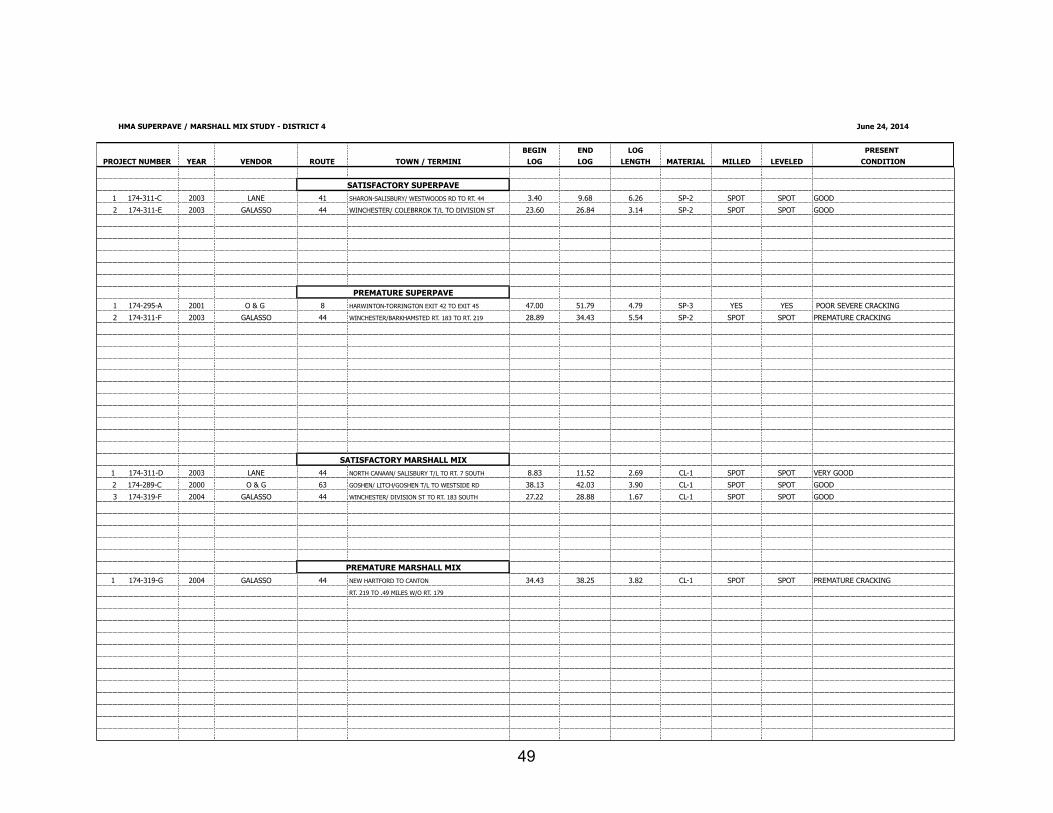
The research team requested ConnDOT to identify several candidate pavement
sections for this research from each of the four districts. Maintenance personnel
from each District provided a list of pavement sections and these are included in
Appendix B for each District. Half of the sections were Superpave and the other
half were Marshall. Half the sections were listed as performing well and the other
half listed as displaying some premature distress. The research team then
visited each of the sites and selected two Superpave sections as well as two
Marshall sections in each District to analyze for comparison purposes for this
research. Half of the sections chosen were listed as performing well, and half
were listed as showing premature distress so there was an equal breakdown of
pavement types and condition. The selected sections are listed in Table 1 and
the corresponding number for that section depicted geographically in Figure 1
above. The number and color logic for the pavement sections in Table 1 are the
same as for the graphic in Figure 1, and the map section numbers in Table 1 can
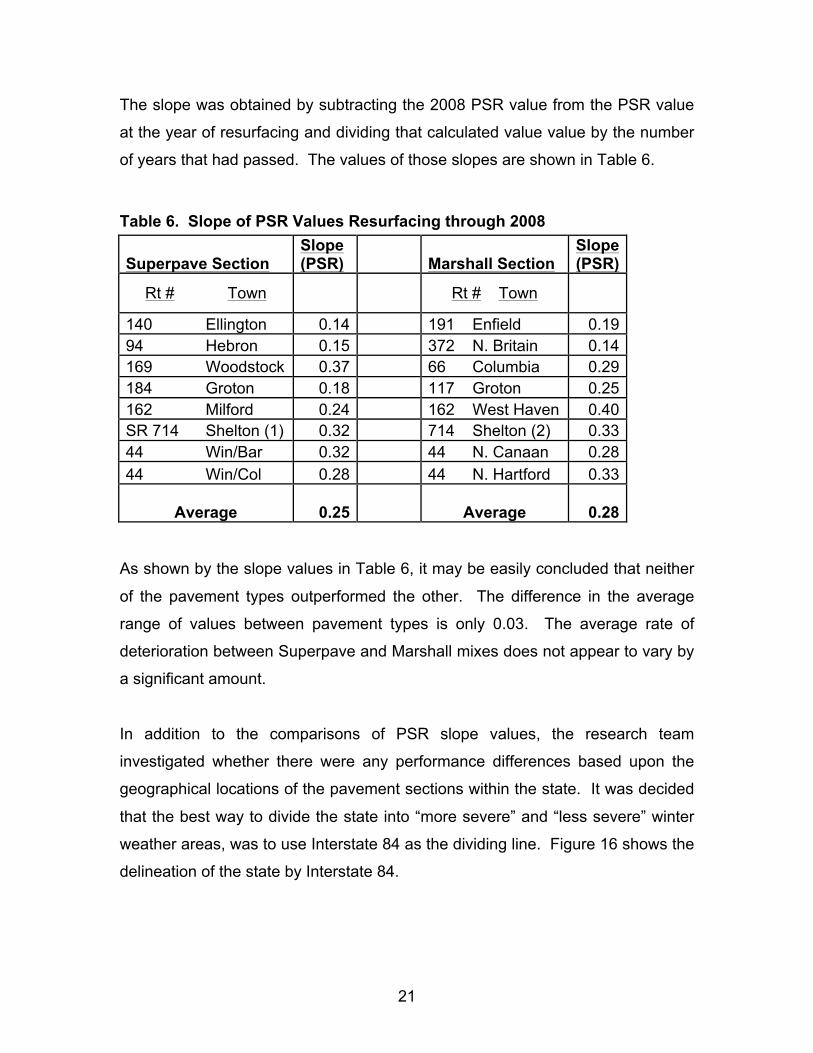
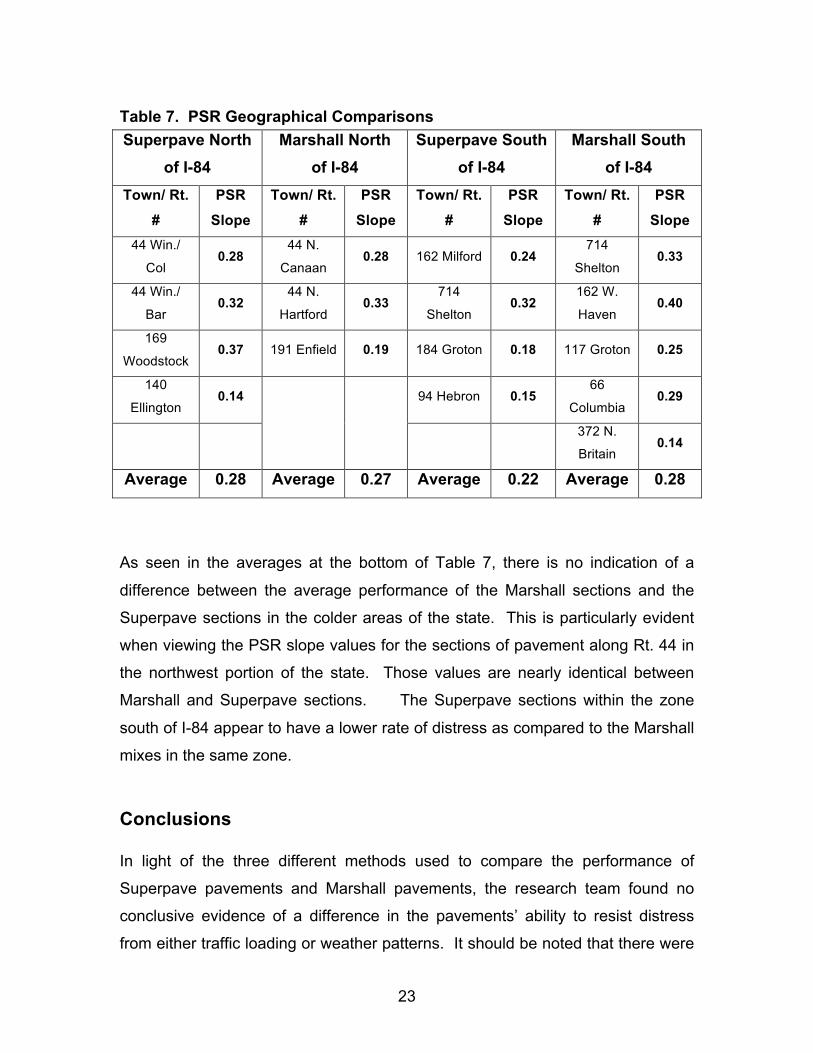
Average 0.28 Average 0.27 Average 0.22 Average 0.28
As seen in the averages at the bottom of Table 7, there is no indication of a
difference between the average performance of the Marshall sections and the
Superpave sections in the colder areas of the state. This is particularly evident
when viewing the PSR slope values for the sections of pavement along Rt. 44 in
the northwest portion of the state. Those values are nearly identical between
Marshall and Superpave sections. The Superpave sections within the zone
south of I-84 appear to have a lower rate of distress as compared to the Marshall
mixes in the same zone.
Conclusions In light of the three different methods used to compare the performance of
Superpave pavements and Marshall pavements, the research team found no
conclusive evidence of a difference in the pavements’ ability to resist distress
from either traffic loading or weather patterns. It should be noted that there were
24
no instances of significant rutting or wheel path fatigue observed during any of
the site visits to the entire paving project or during the photolog analysis on the
selected sections.
The results shown in Tables 2, 6, and 7, as well as the results of examinations of
numerous photolog images and analysis from the field visits, do not indicate that
there is any significant difference in performance between Marshall pavements
and Superpave pavements placed in Connecticut from 2001 through 2003.
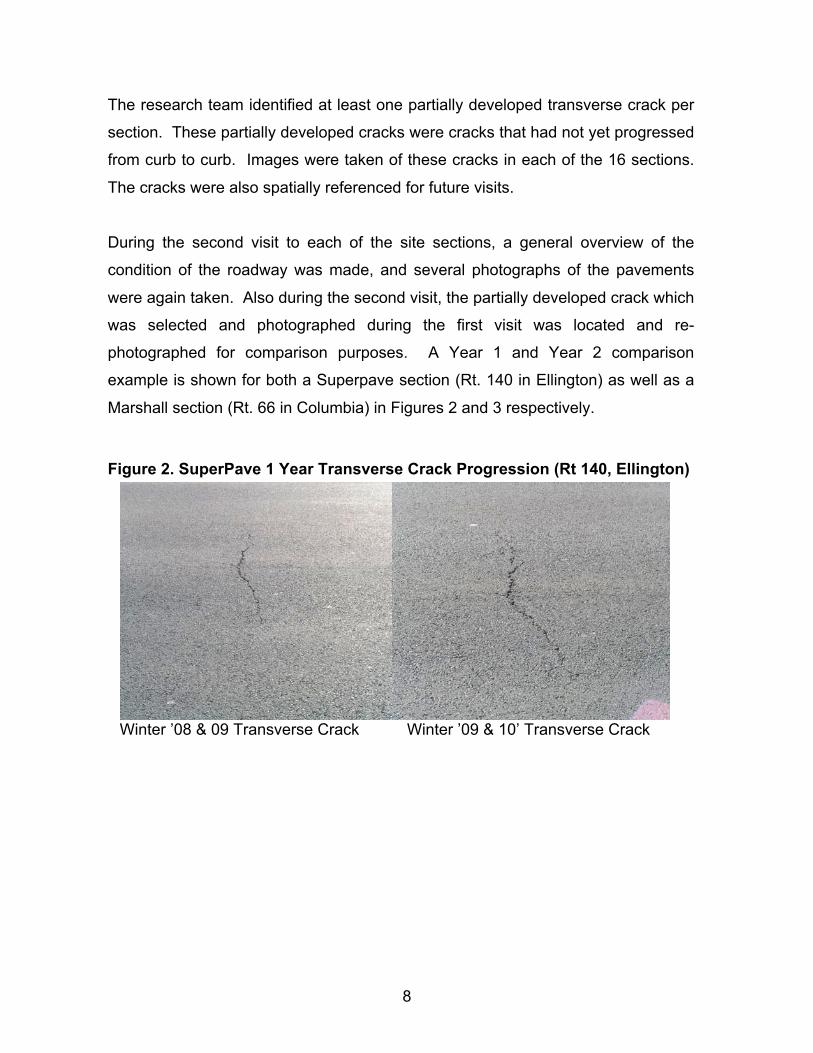
The reader should take into consideration that visual analysis of pavements
involves a small amount of interpretation. The images from the photolog and site
visits were analyzed visually by the research team, and conclusions were taken
from these analyses.
What also needs to be considered for any future evaluations are the changes
that have taken place with the ConnDOT specifications from the time of
implementation of Superpave in 2004 through current practice. It is more difficult
to evaluate performance of pavement types amidst ongoing specification
changes. There are some specification changes that have taken place since the
period covered by this report ended, such as increases in the amount of
allowable RAP content, the elimination of Superpave traffic level 4, minimum
asphalt content specifications, maximum voids in the mineral aggregate
specifications and changes in the specified low temperature performance grade
of asphalt, just to name a few.
25
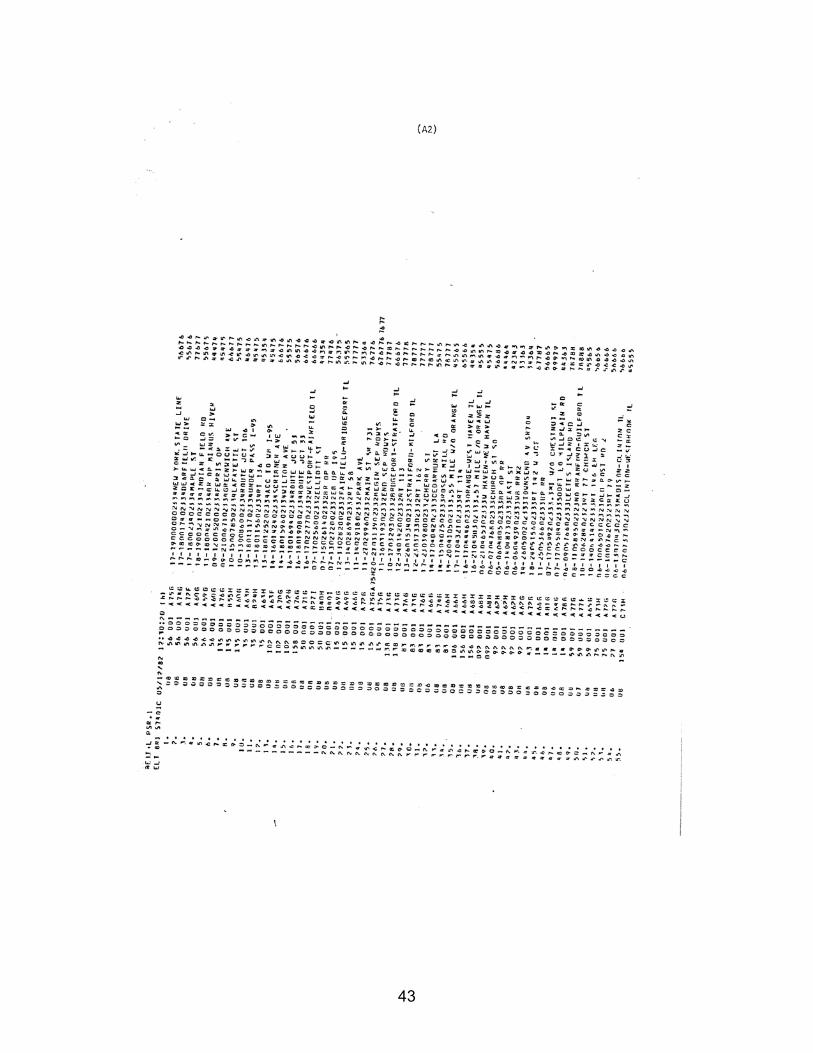
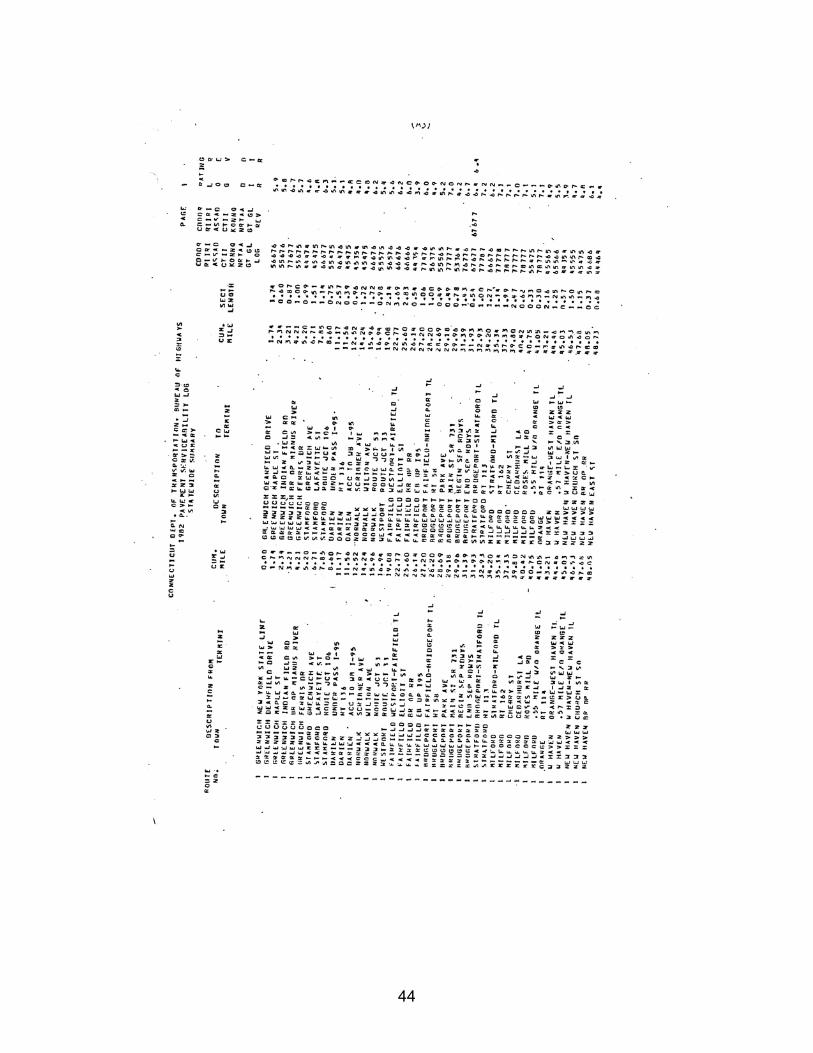
References Watson, Donald E., Ray Brown and Jason Moore. Comparison of Superpave and Marshall Mix Performance in Alabama. Transportation Research Record: Journal of the Transportation Research Board, No. 1929. Washington D.C., 2005, pp. 133-140. Pavement Serviceability Rating System. Bureau of Highways. Connecticut Department of Transportation. 1982. Bituminous Concrete. Section 4.06 Standard Specifications for Roads, Bridges and Incidental Construction. Connecticut Department of Transportation. 2004 – 2011. Bituminous Concrete Materials. Section M.04. Standard Specifications for Roads, Bridges and Incidental Construction. Connecticut Department of Transportation. 2004 – 2011.
26
Appendix A. PSR Manual
27
28
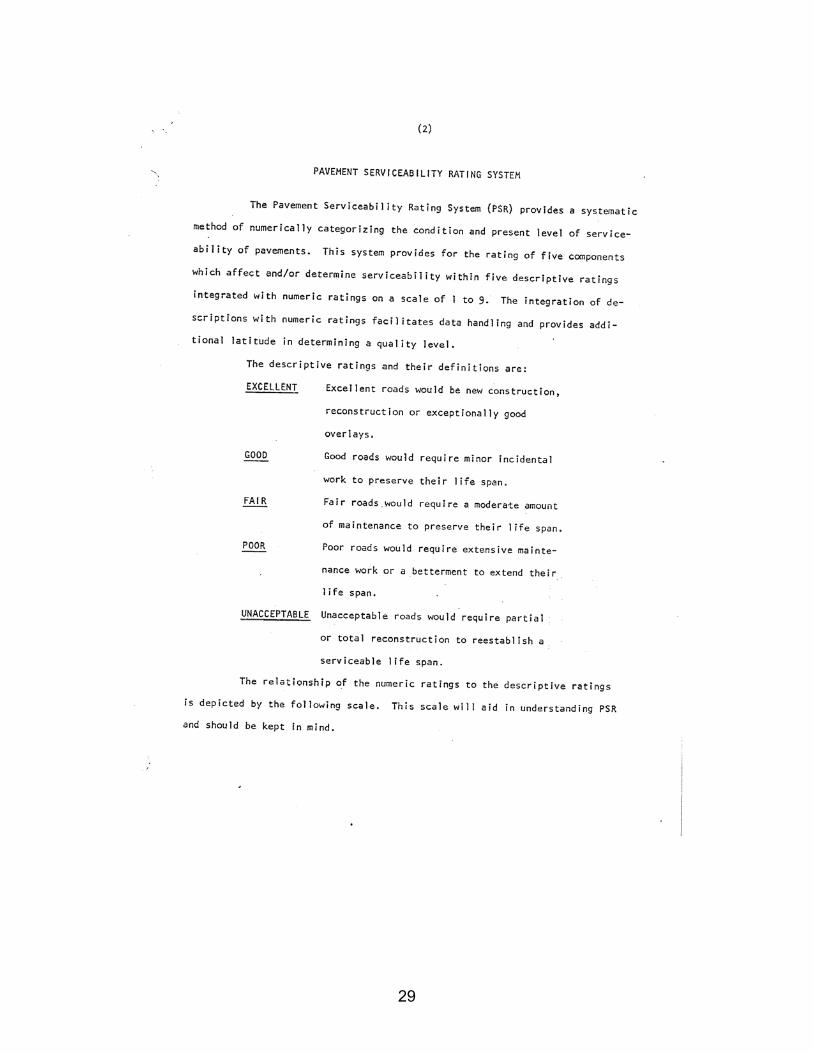
29
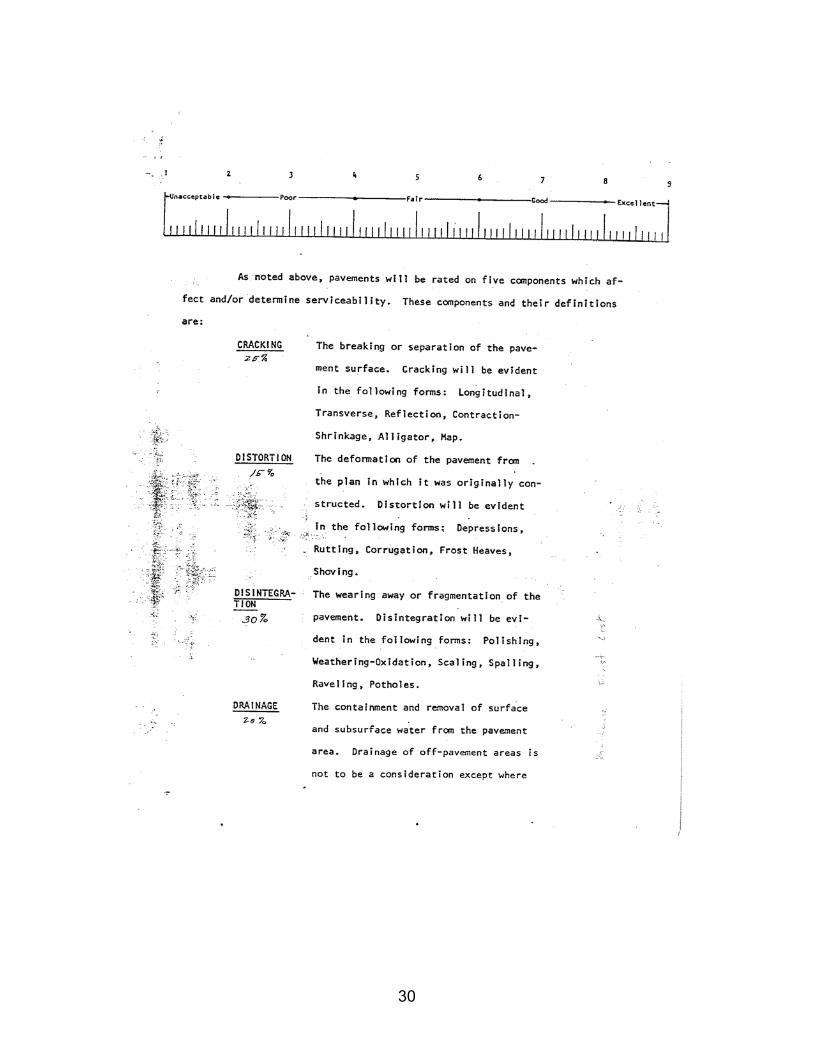
30
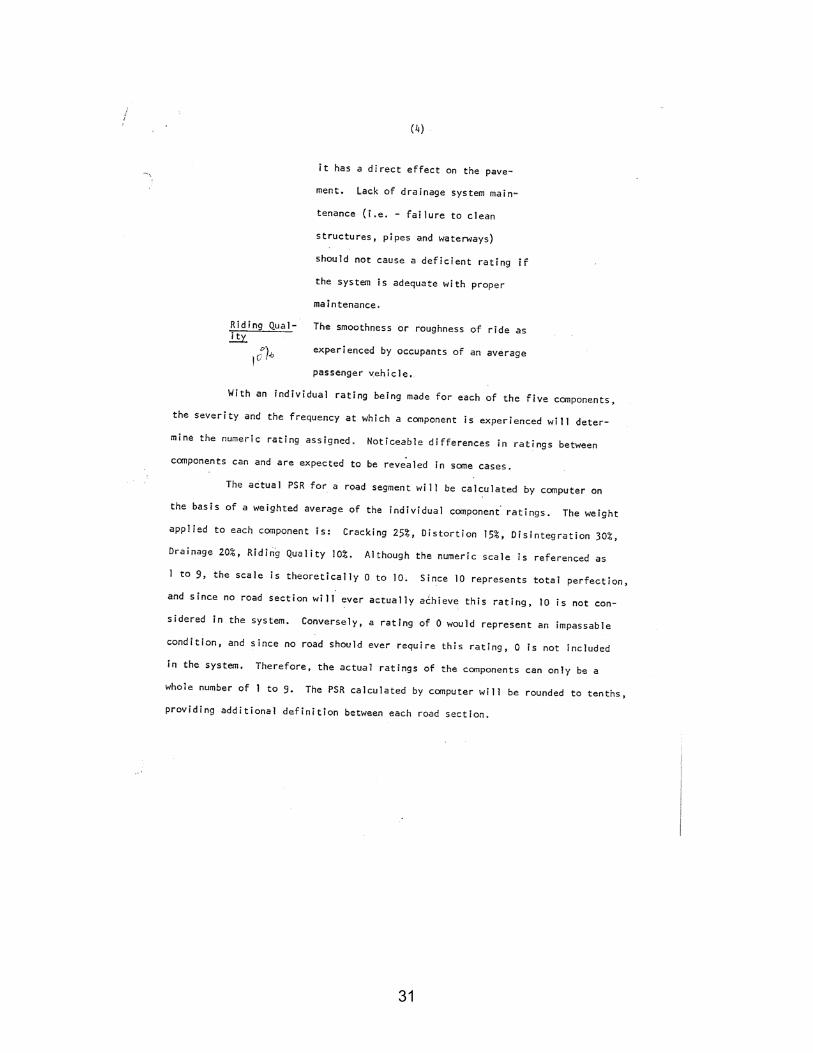
31
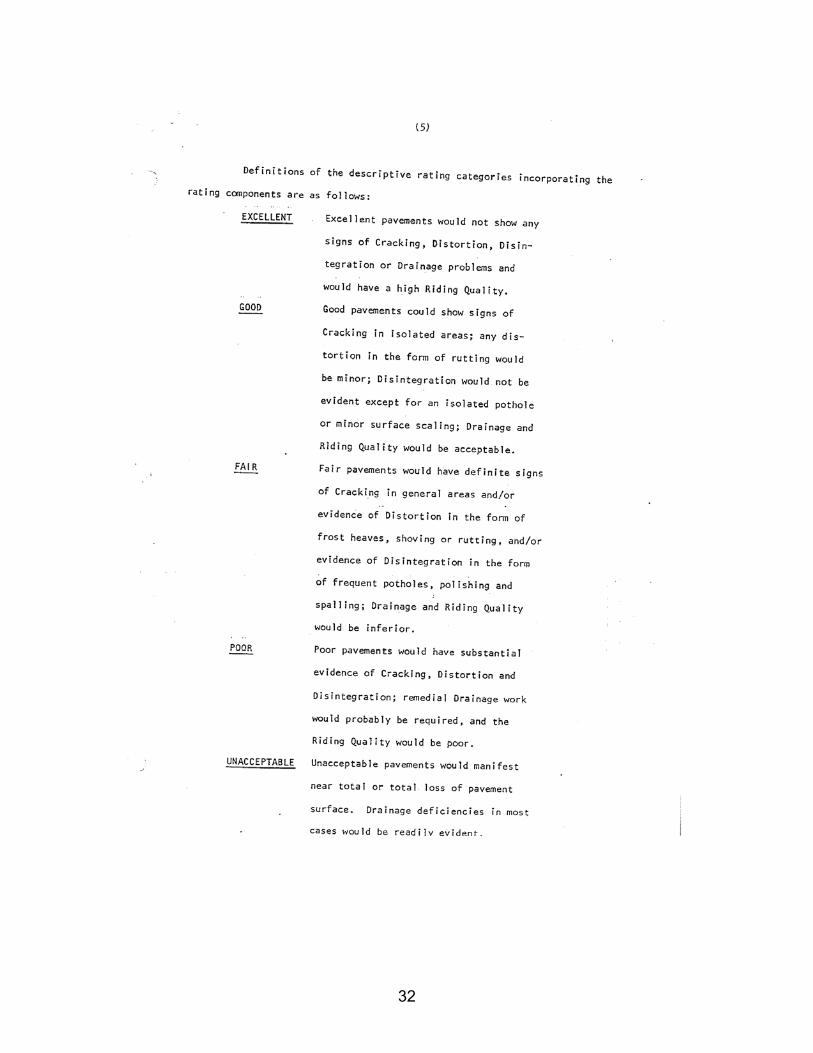
32
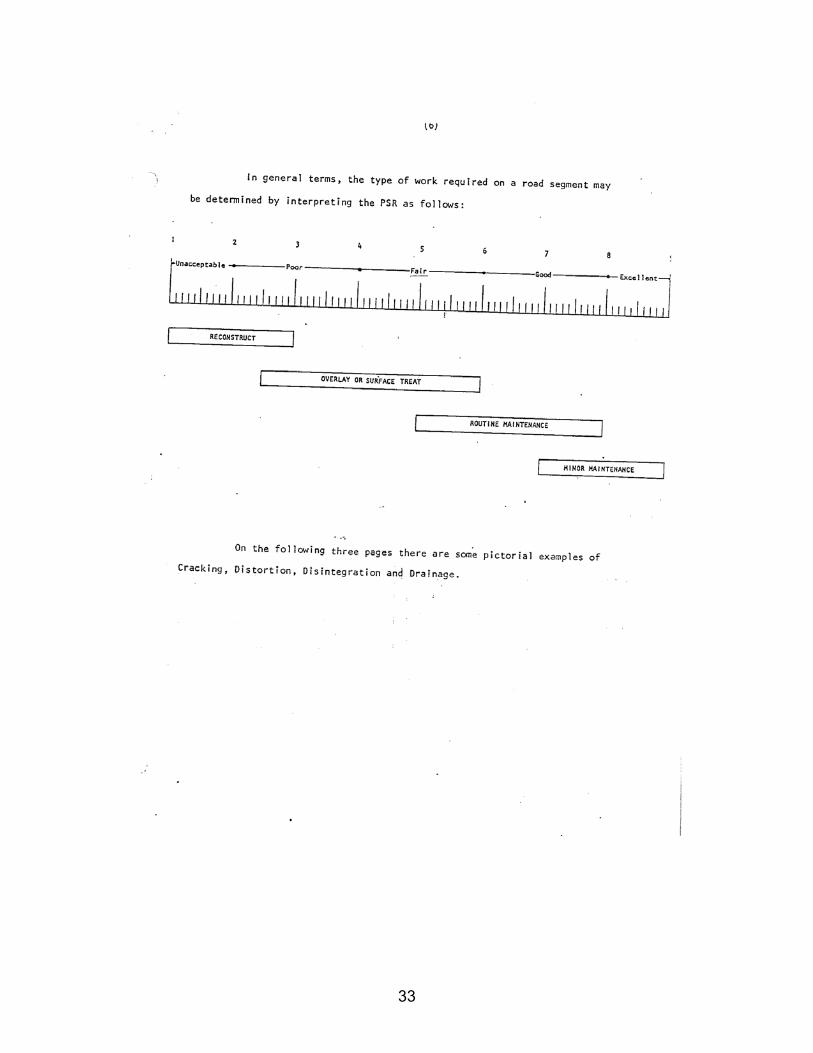
33
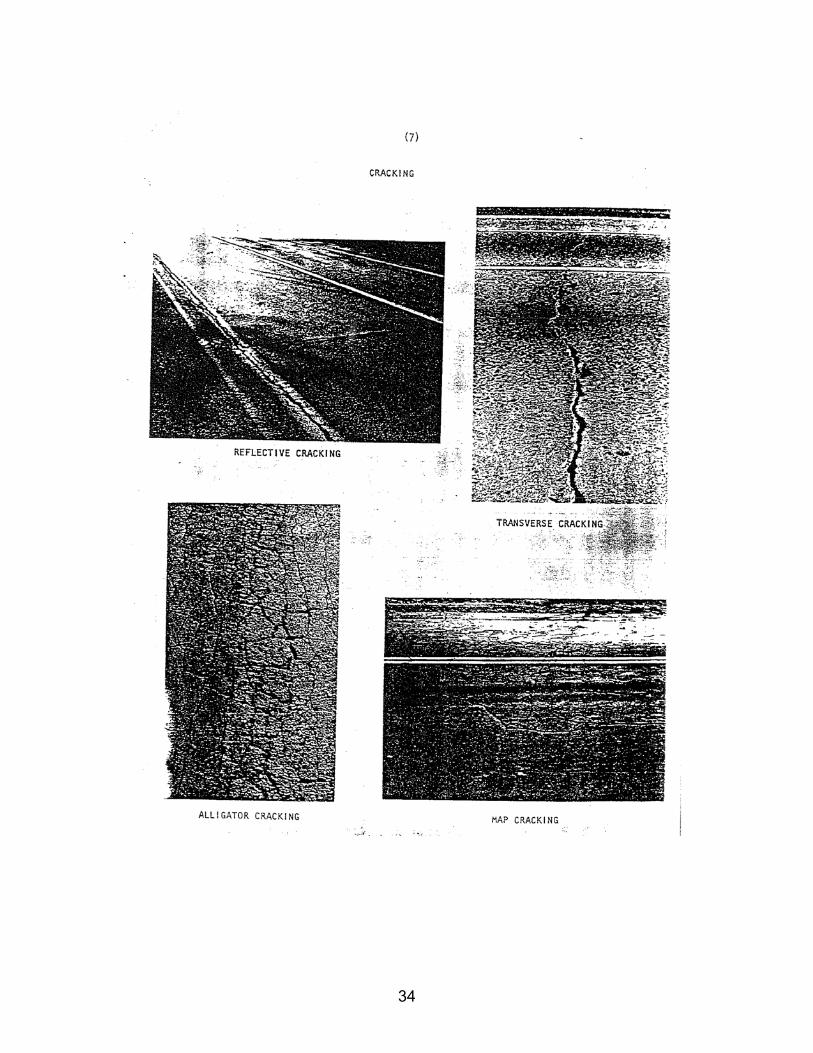
34
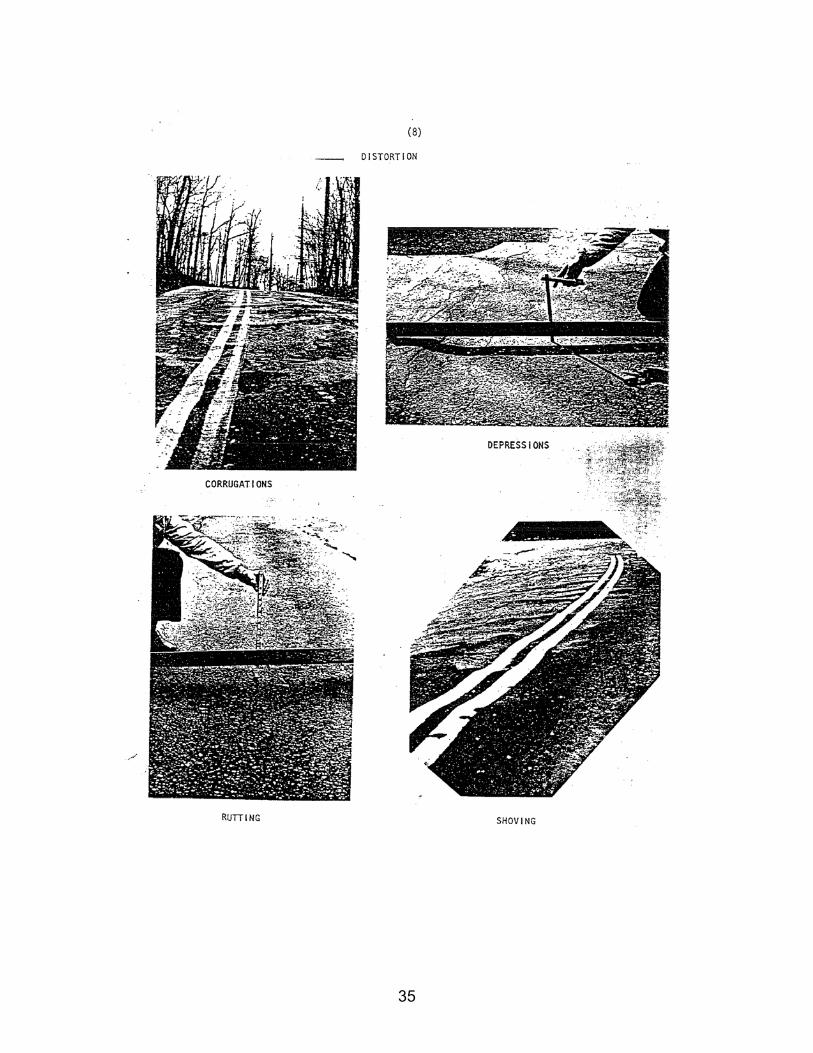
35
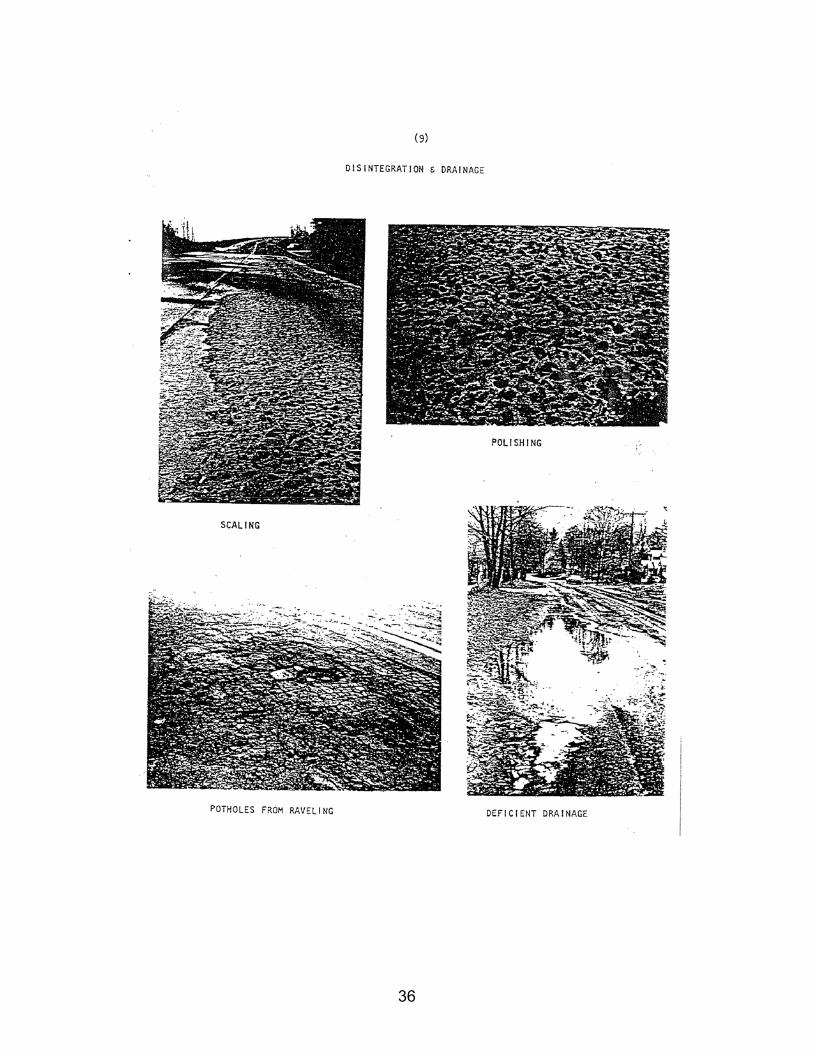
36
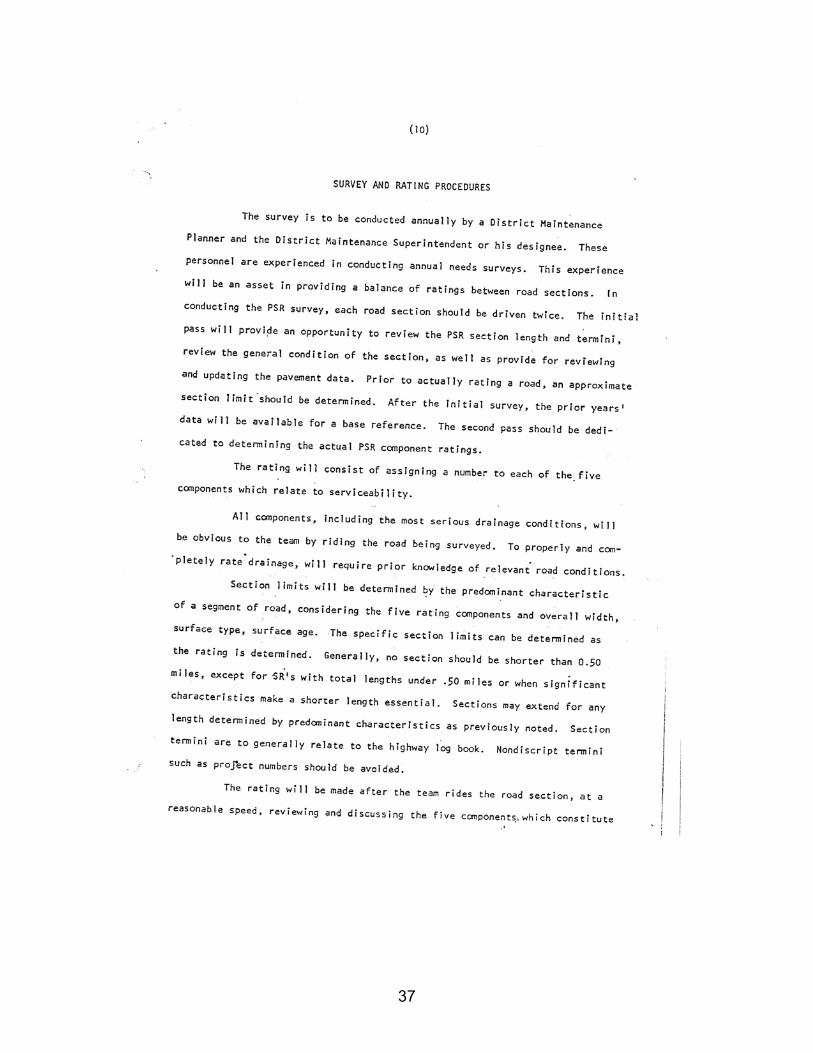
37
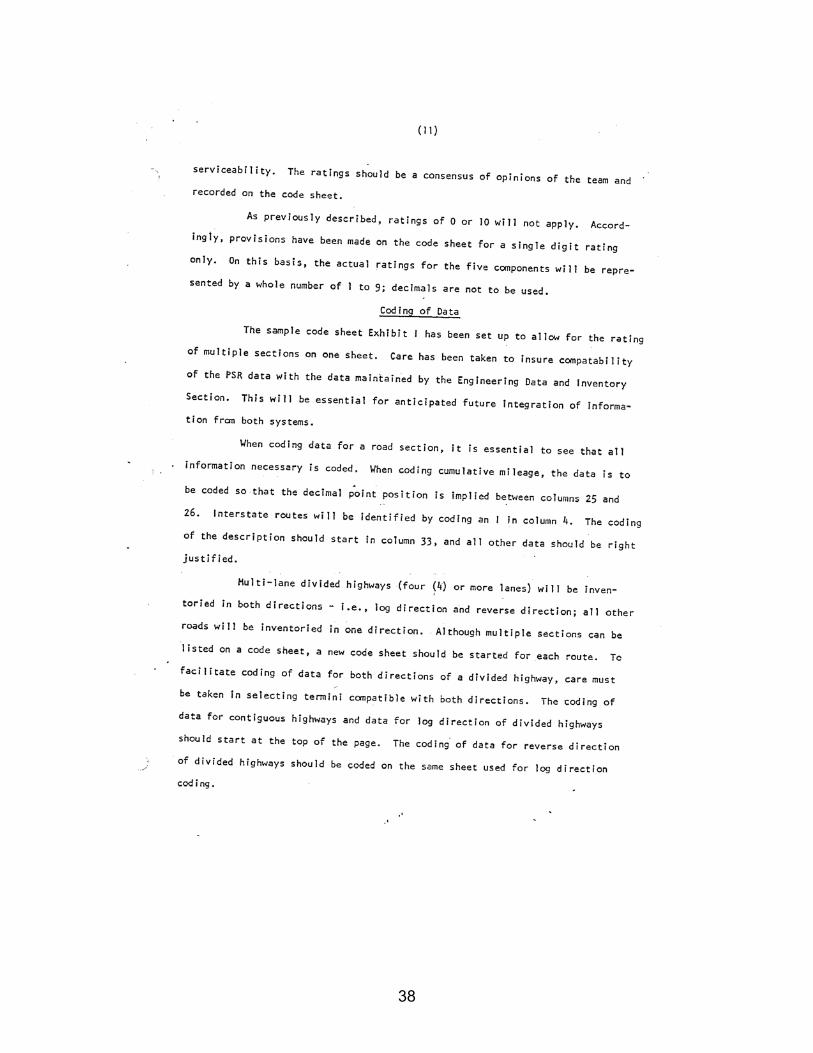
38
39
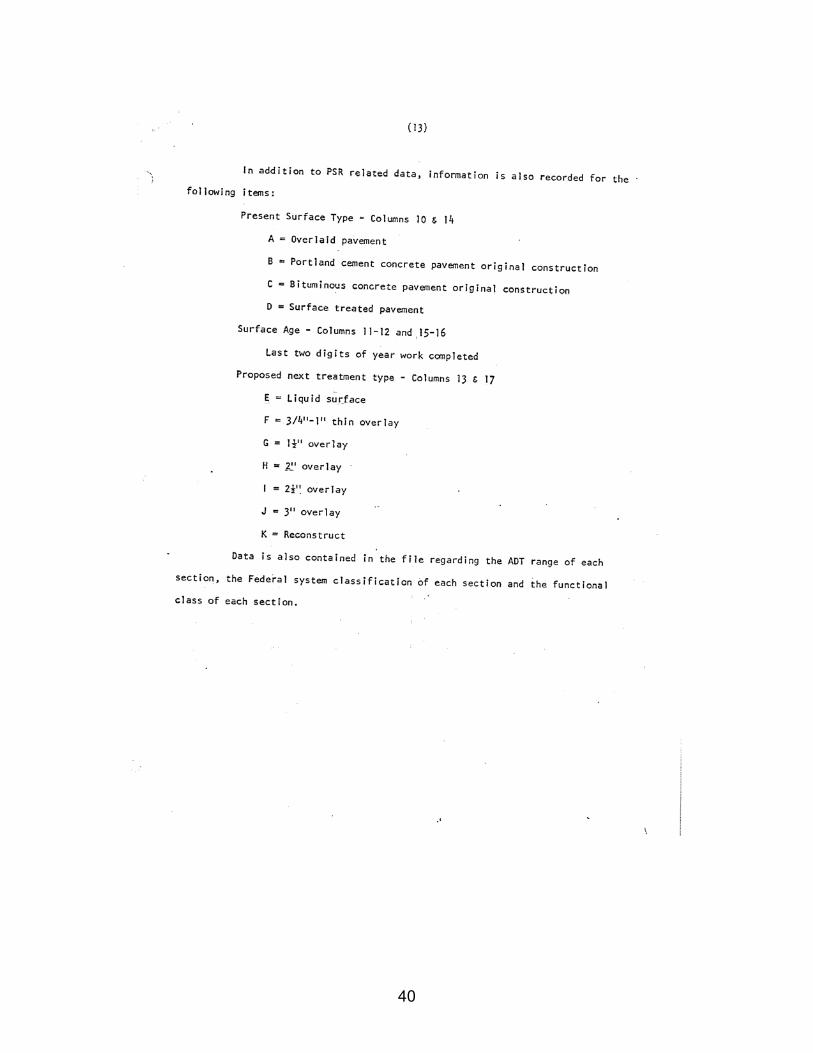
40
41
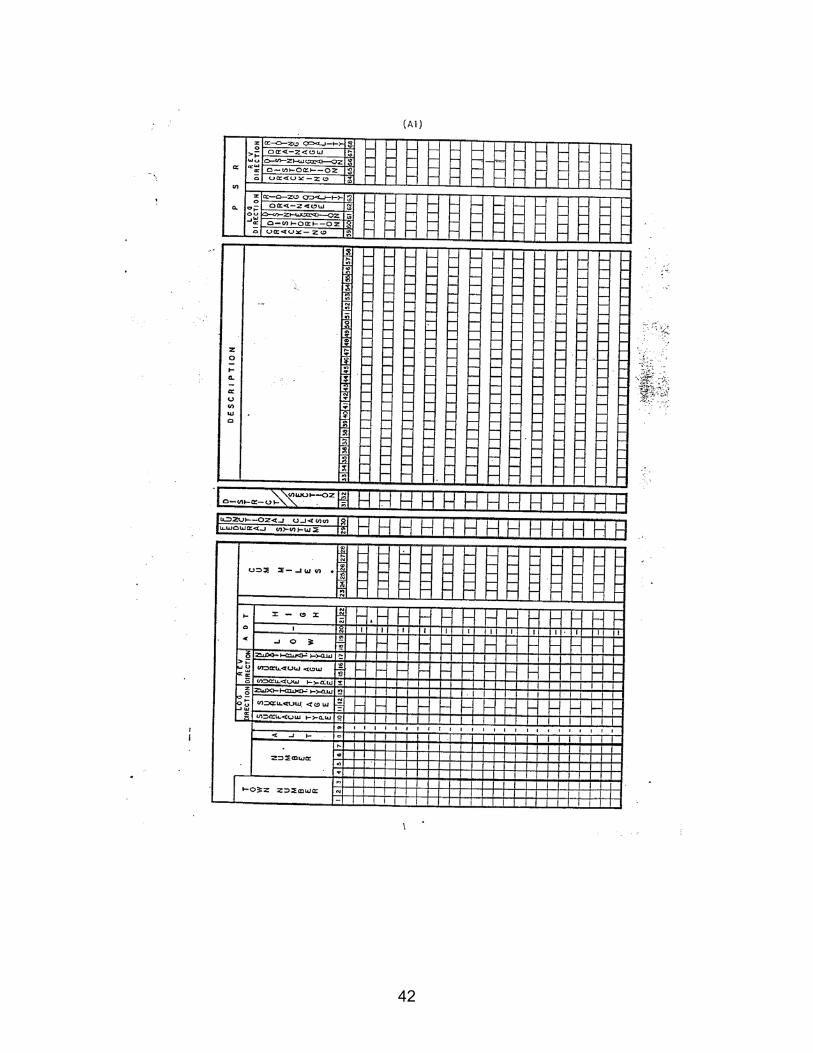
42
43
44
45
Appendix B - Roadway Sections Provided by ConnDOT District
46
1 171-293 I2 171-292 H
DISTRICT 1
PROJECT NO. YEAR VENDOR
2001 Galasso2001 Tilcon
DISTRICT 1
ROUTE TERMINI TERMINI BGN END MATERIAL MILLED LEVELED LOG MILE LOG MILE MILES