19
Hotel Capital Markets Hodges Ward Elliott Mark W. Elliott Senior Managing Director Presented to Hotel Asset Managers Association
| Date post: | 23-Dec-2015 |
| Category: |
Documents |
| Upload: | leona-fleming |
| View: | 231 times |
| Download: | 0 times |

Hotel Capital MarketsHotel Capital Markets
Hodges Ward Elliott
Mark W. ElliottSenior Managing Director
Hodges Ward Elliott
Mark W. ElliottSenior Managing Director
Presented toHotel Asset Managers Association
2
Current EBITDA Multiples
3
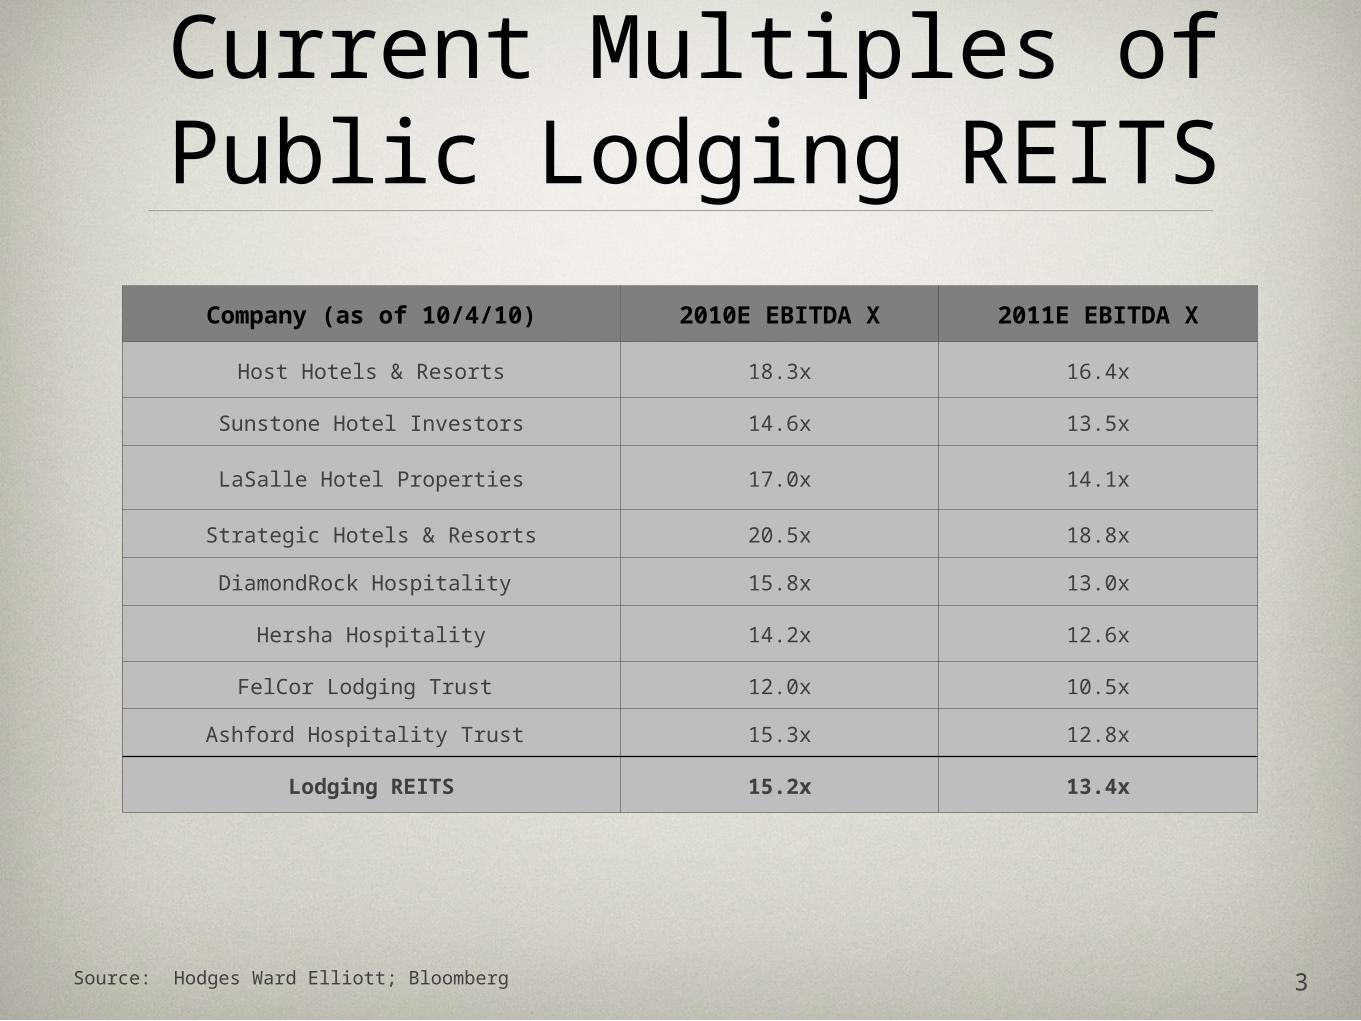
Current Multiples of Public Lodging REITS
Source: Hodges Ward Elliott; Bloomberg
Company (as of 10/4/10) 2010E EBITDA X 2011E EBITDA X
Host Hotels & Resorts 18.3x 16.4x
Sunstone Hotel Investors 14.6x 13.5x
LaSalle Hotel Properties 17.0x 14.1x
Strategic Hotels & Resorts 20.5x 18.8x
DiamondRock Hospitality 15.8x 13.0x
Hersha Hospitality 14.2x 12.6x
FelCor Lodging Trust 12.0x 10.5x
Ashford Hospitality Trust 15.3x 12.8x
Lodging REITS 15.2x 13.4x
4
Current Transactions
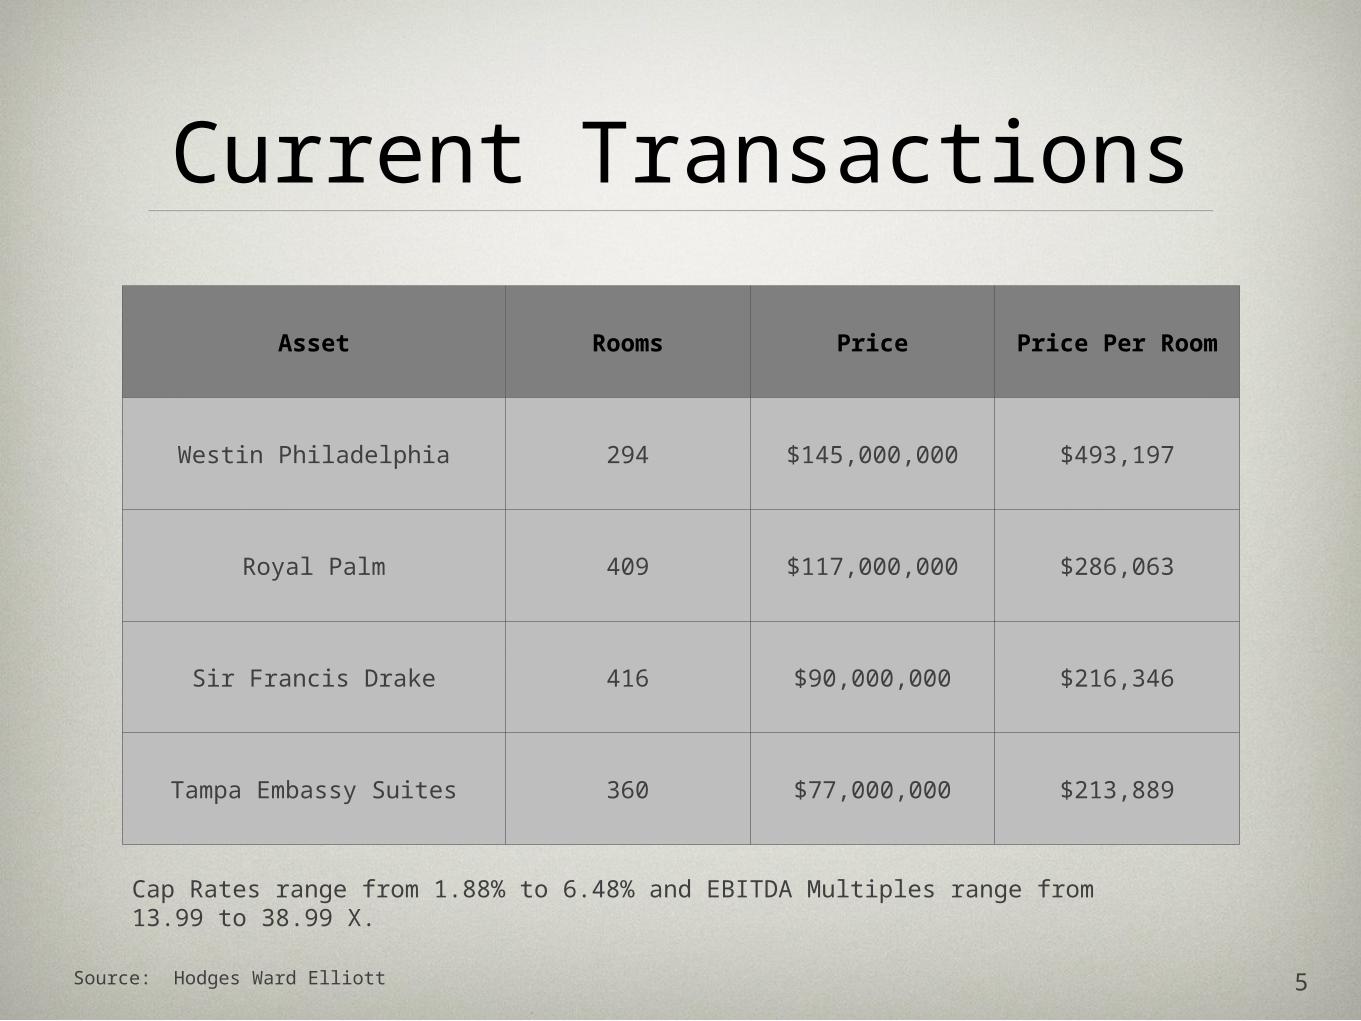
Current Transactions
5
Asset Rooms Price Price Per Room
Westin Philadelphia 294 $145,000,000 $493,197
Royal Palm 409 $117,000,000 $286,063
Sir Francis Drake 416 $90,000,000 $216,346
Tampa Embassy Suites 360 $77,000,000 $213,889
Source: Hodges Ward Elliott
Cap Rates range from 1.88% to 6.48% and EBITDA Multiples range from 13.99 to 38.99 X.
6
Rationale
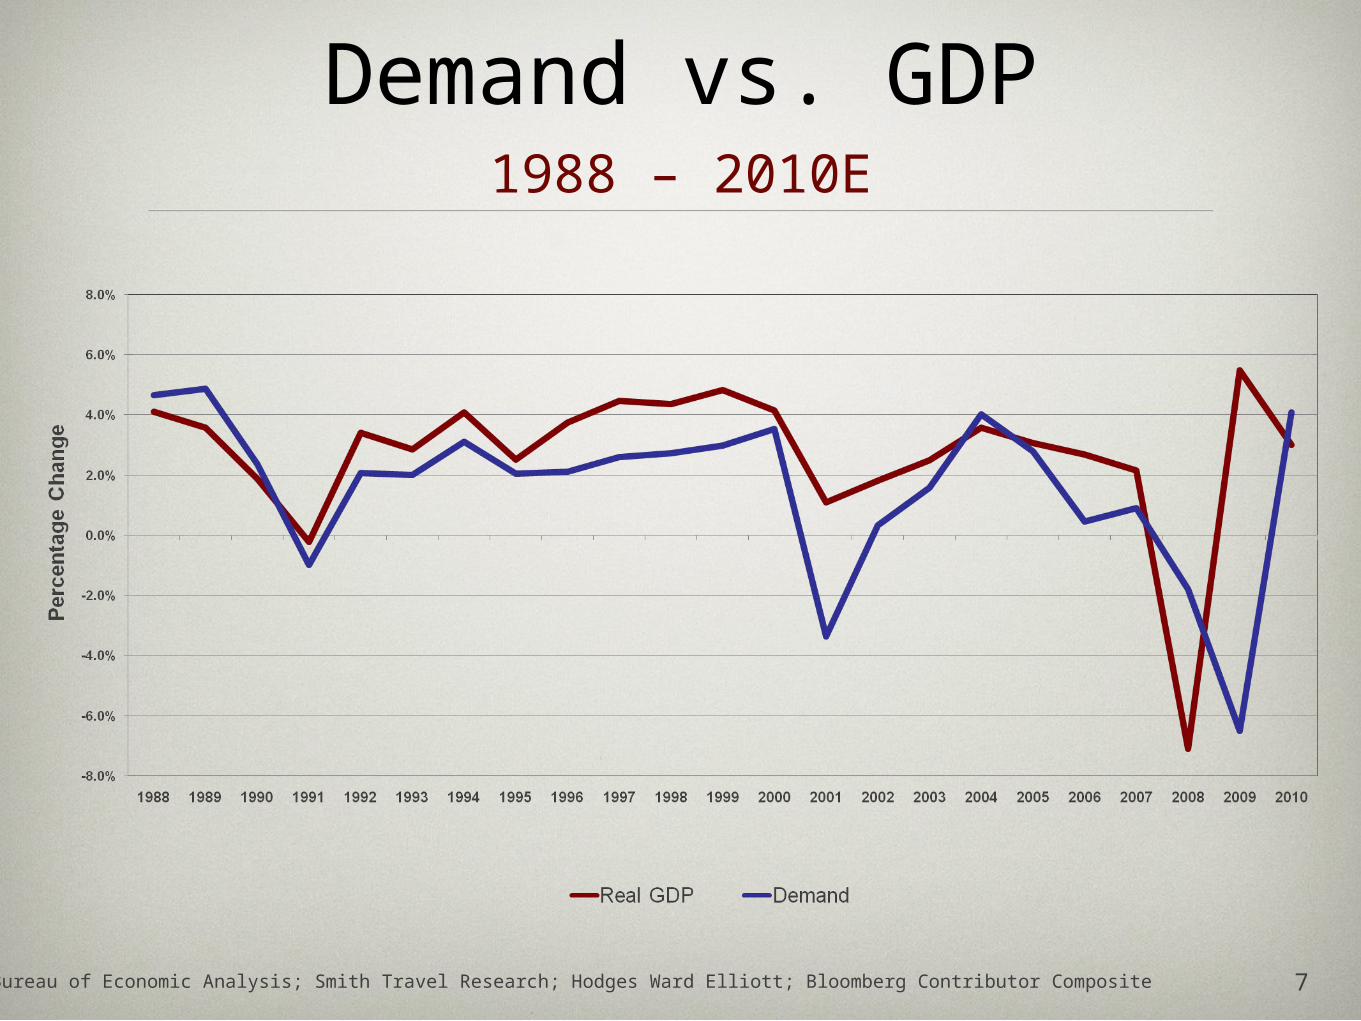
Demand vs. GDP
7
1988 – 2010E
Source: Bureau of Economic Analysis; Smith Travel Research; Hodges Ward Elliott; Bloomberg Contributor Composite
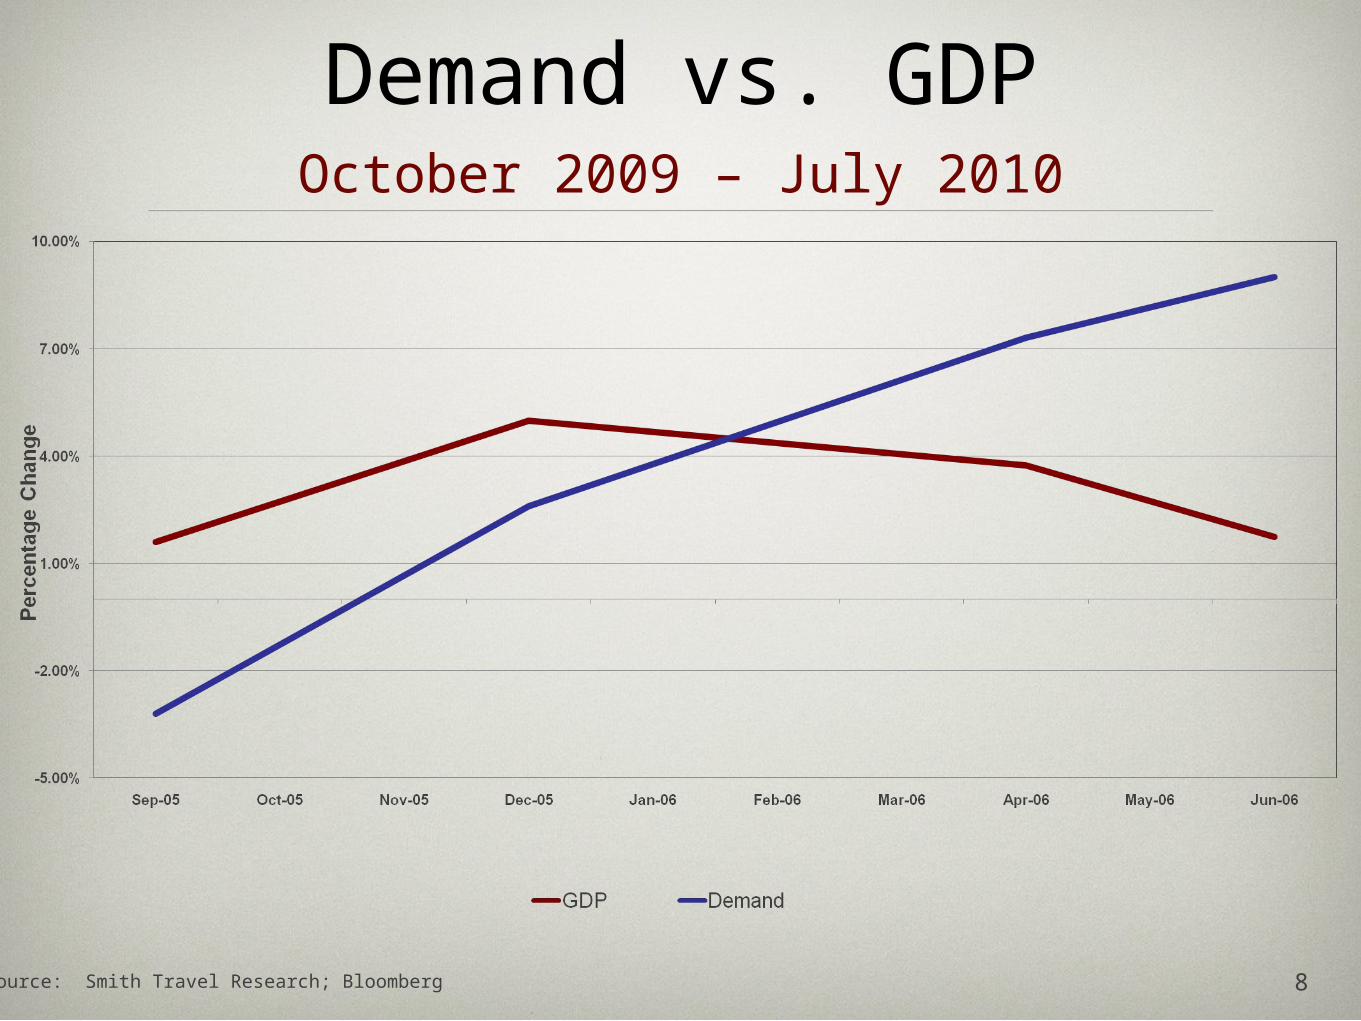
Demand vs. GDP
8
October 2009 – July 2010
Source: Smith Travel Research; Bloomberg
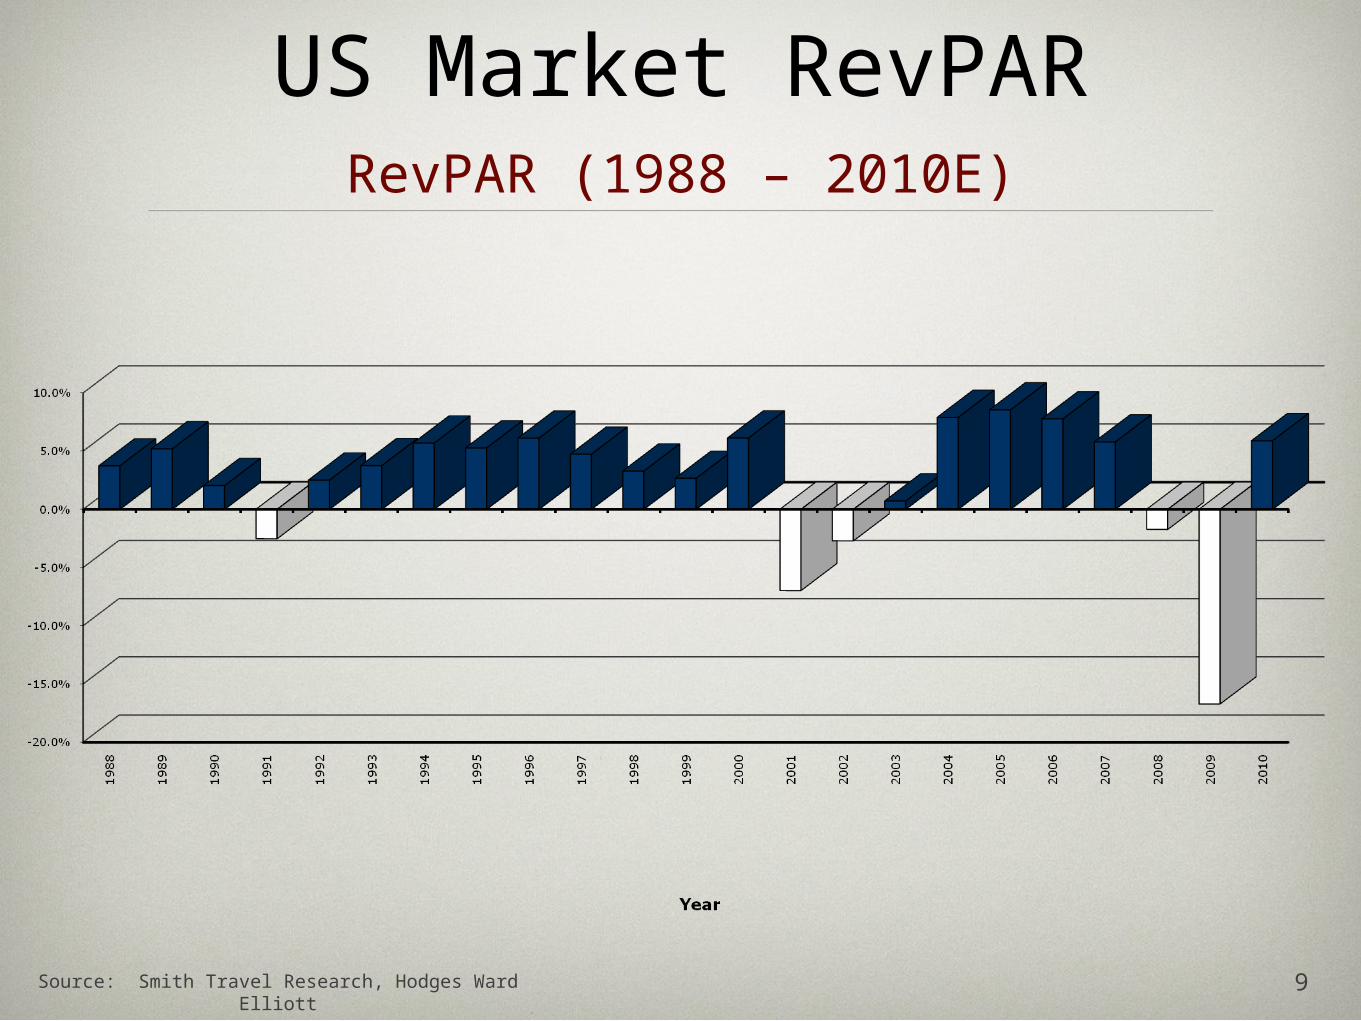
US Market RevPAR
9
RevPAR (1988 – 2010E)
Source: Smith Travel Research, Hodges Ward Elliott
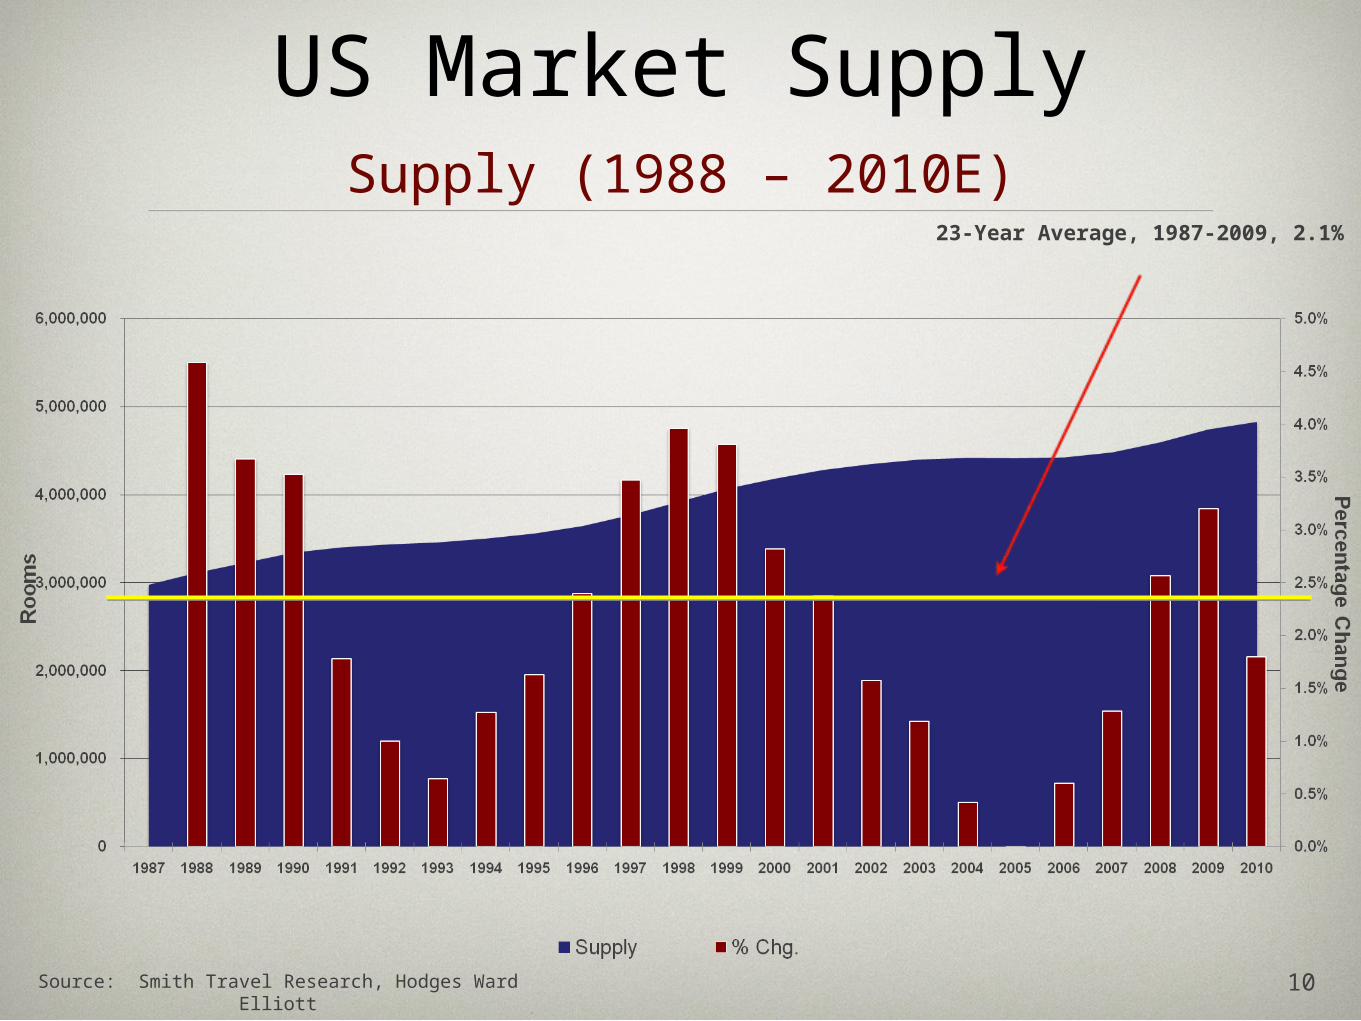
US Market Supply
10
Supply (1988 – 2010E)
Source: Smith Travel Research, Hodges Ward Elliott
23-Year Average, 1987-2009, 2.1%
Review of Past Cycles
11
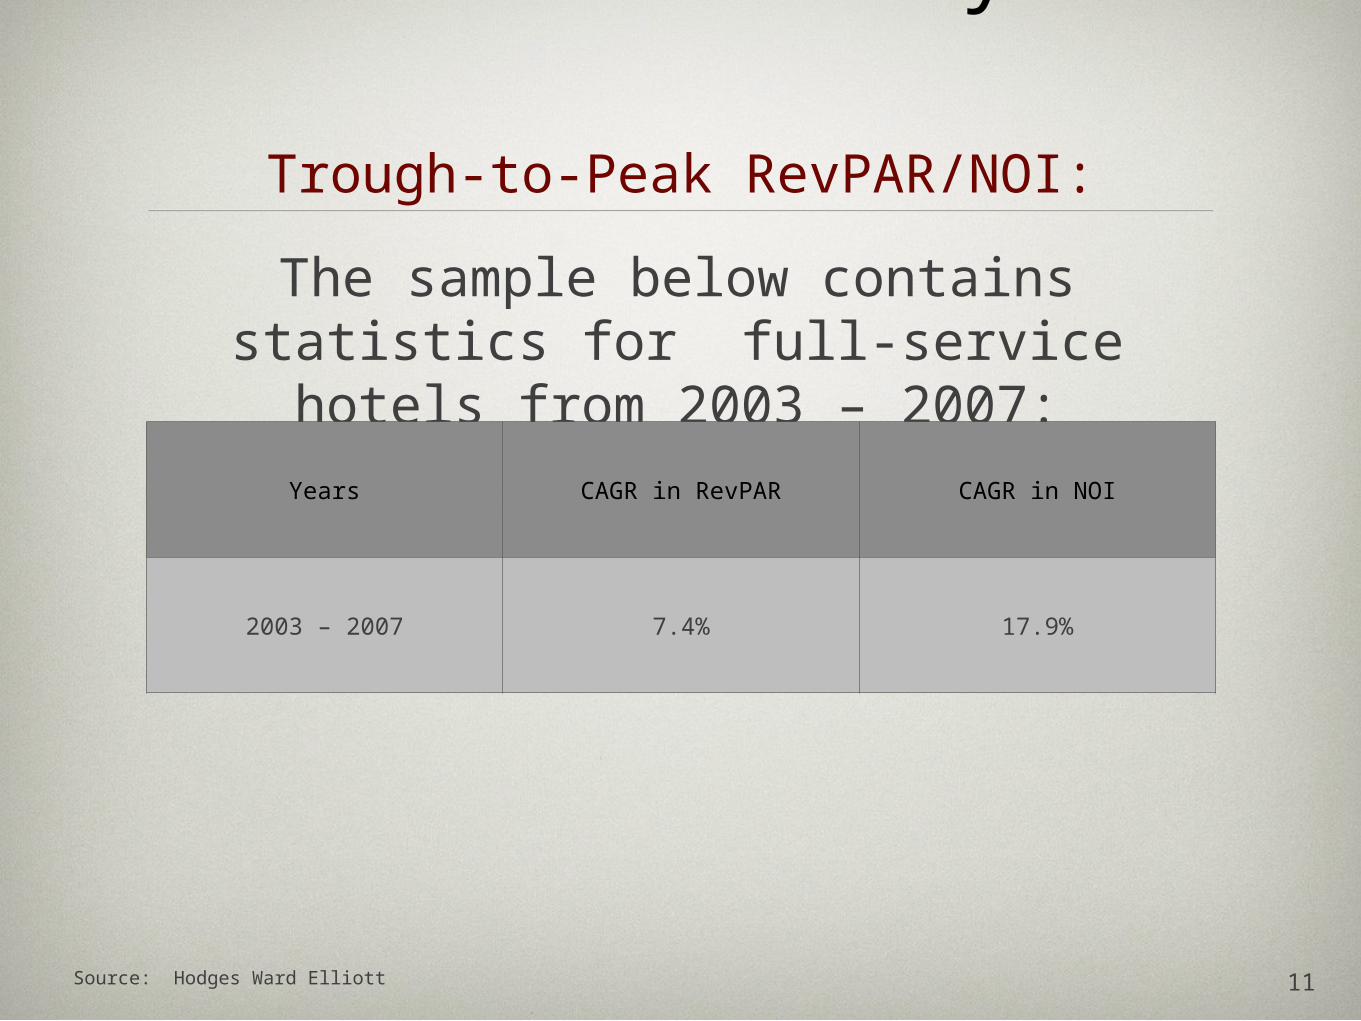
Trough-to-Peak RevPAR/NOI:
The sample below contains statistics for full-service hotels
from 2003 – 2007:Years CAGR in RevPAR CAGR in NOI
2003 – 2007 7.4% 17.9%
Source: Hodges Ward Elliott
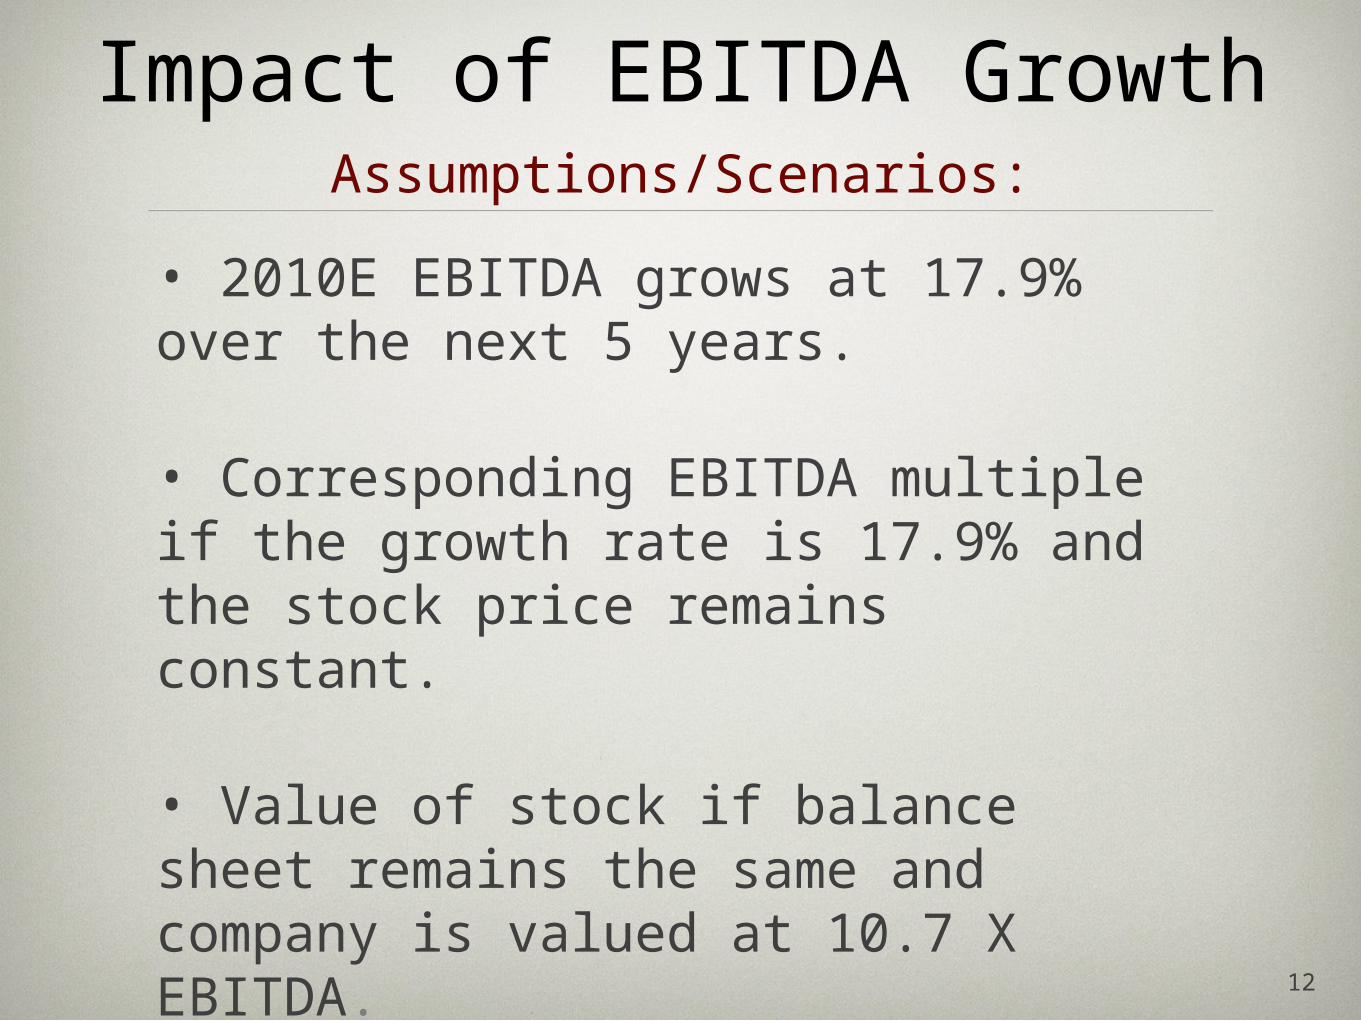
Impact of EBITDA Growth
12
Assumptions/Scenarios:
• 2010E EBITDA grows at 17.9% over the next 5 years.
• Corresponding EBITDA multiple if the growth rate is 17.9% and the stock price remains constant.
• Value of stock if balance sheet remains the same and company is valued at 10.7 X EBITDA.
13
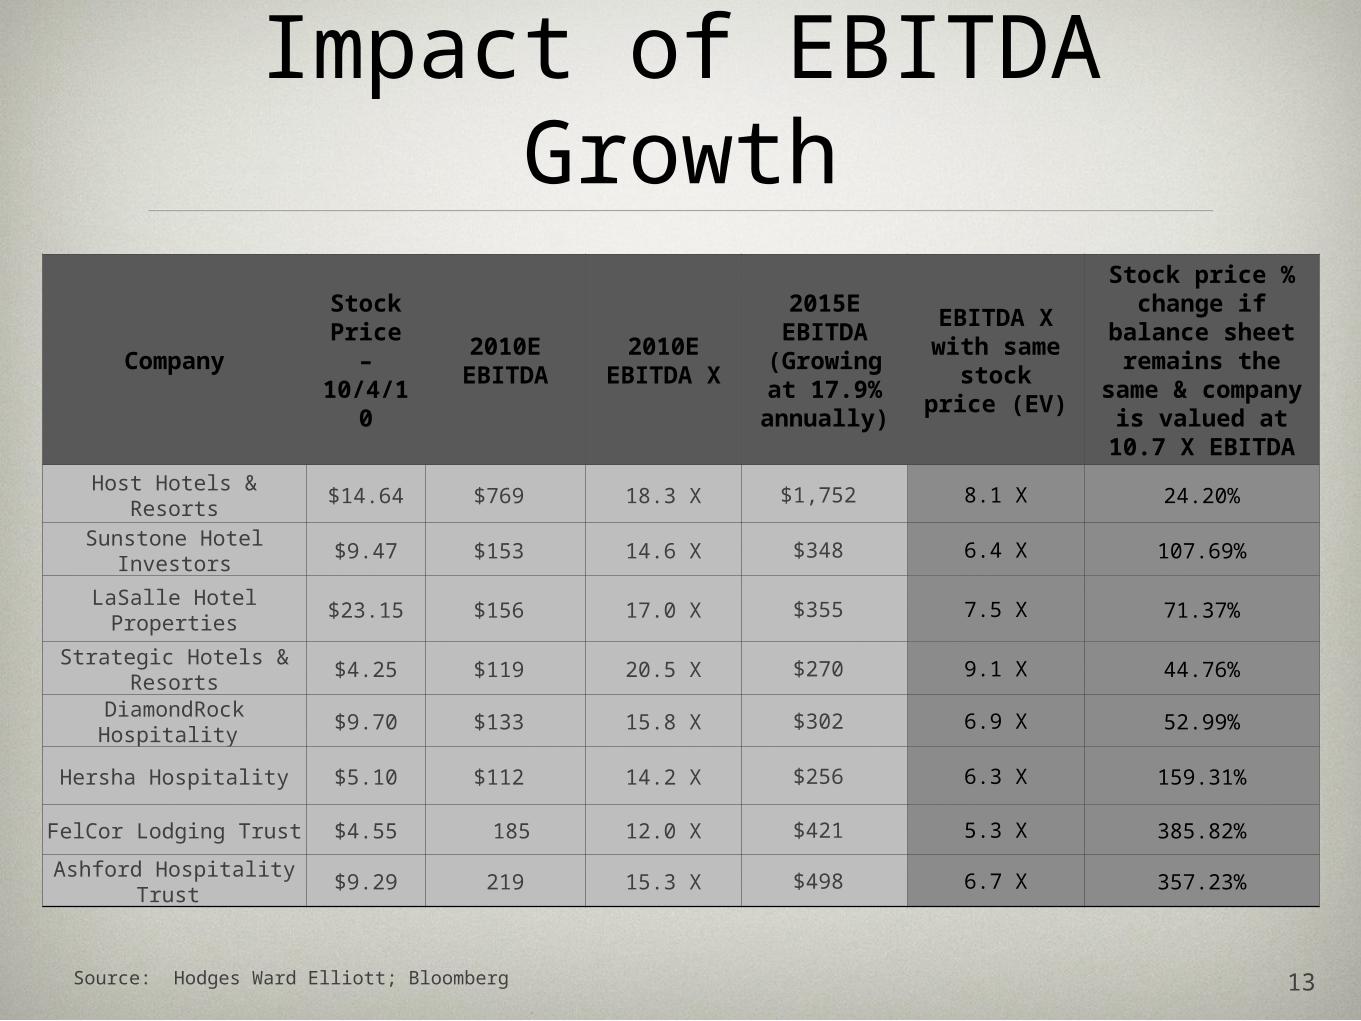
Impact of EBITDA Growth
Source: Hodges Ward Elliott; Bloomberg
Company
Stock Price – 10/4/1
0
2010E EBITDA
2010E EBITDA X
2015E EBITDA
(Growing at 17.9% annually)
EBITDA X with same stock price
(EV)
Stock price % change if
balance sheet remains the
same & company is
valued at 10.7 X EBITDA
Host Hotels & Resorts $14.64 $769 18.3 X $1,752 8.1 X 24.20%Sunstone Hotel
Investors $9.47 $153 14.6 X $348 6.4 X 107.69%
LaSalle Hotel Properties
$23.15 $156 17.0 X $355 7.5 X 71.37%
Strategic Hotels & Resorts
$4.25 $119 20.5 X $270 9.1 X 44.76%
DiamondRock Hospitality
$9.70 $133 15.8 X $302 6.9 X 52.99%
Hersha Hospitality $5.10 $112 14.2 X $256 6.3 X 159.31%FelCor Lodging Trust $4.55 185 12.0 X $421 5.3 X 385.82%
Ashford Hospitality Trust
$9.29 219 15.3 X $498 6.7 X 357.23%
Sources of Capital
14
• Public Issuance
• Private Equity
• Debt Markets
15
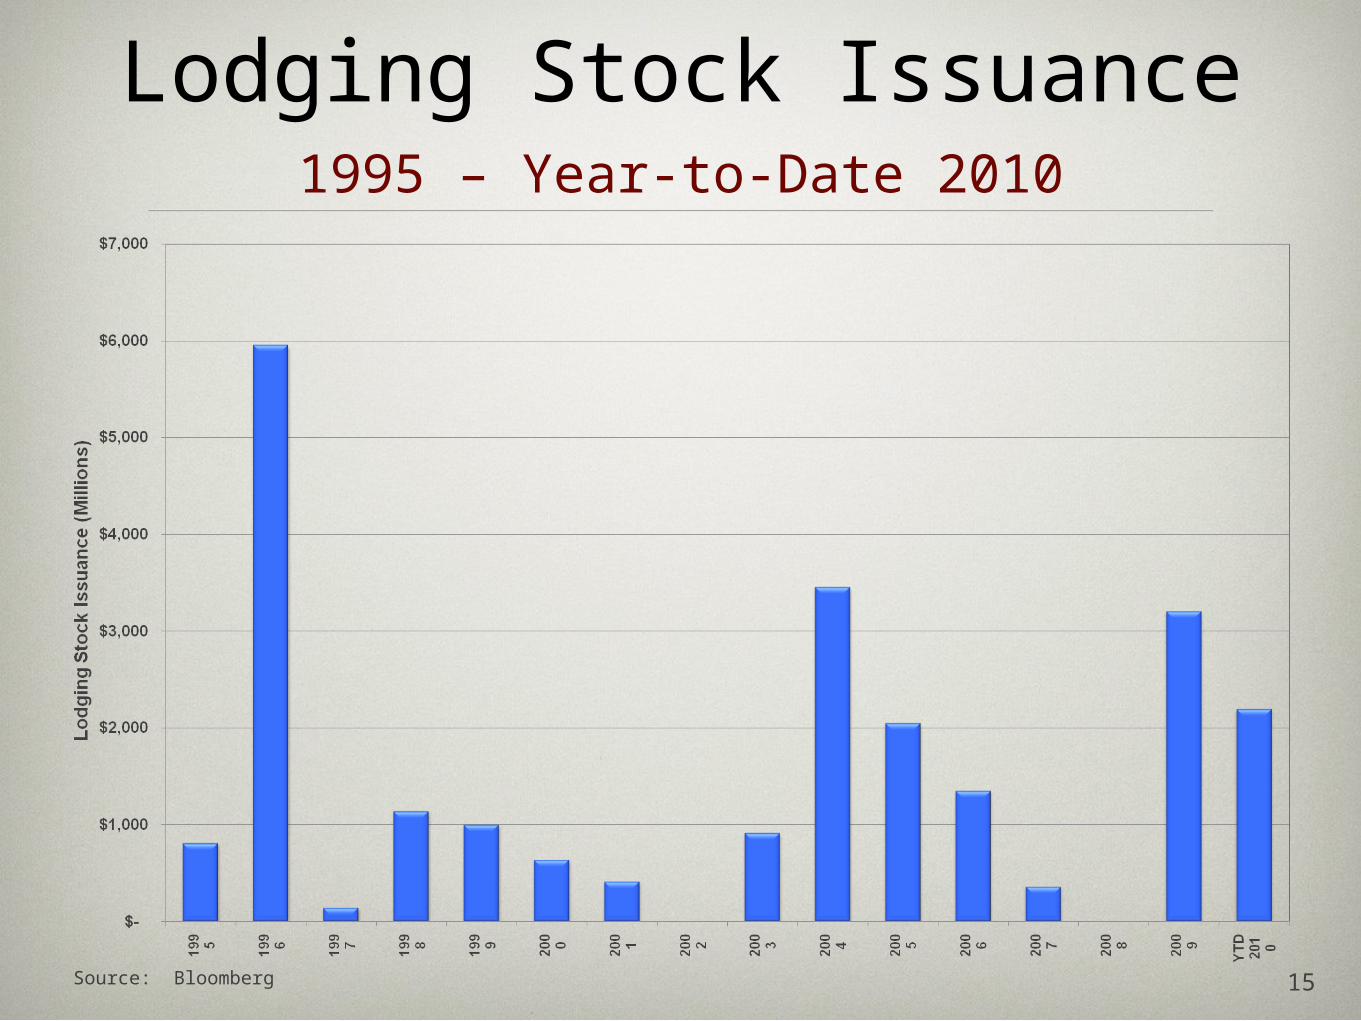
Lodging Stock Issuance1995 – Year-to-Date 2010
Source: Bloomberg
16
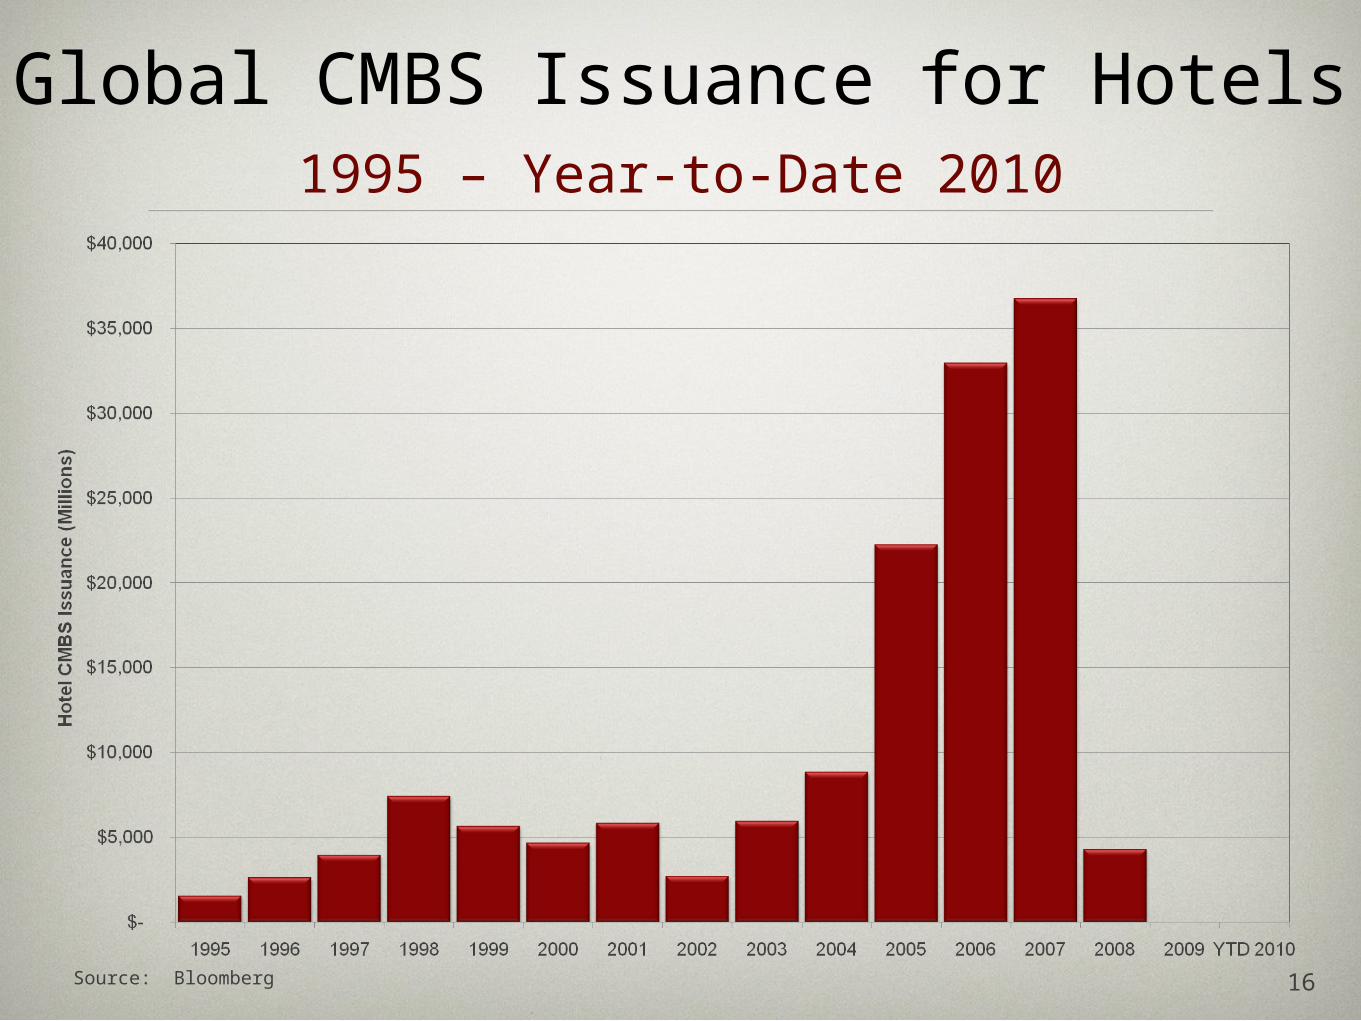
Global CMBS Issuance for Hotels1995 – Year-to-Date 2010
Source: Bloomberg
17
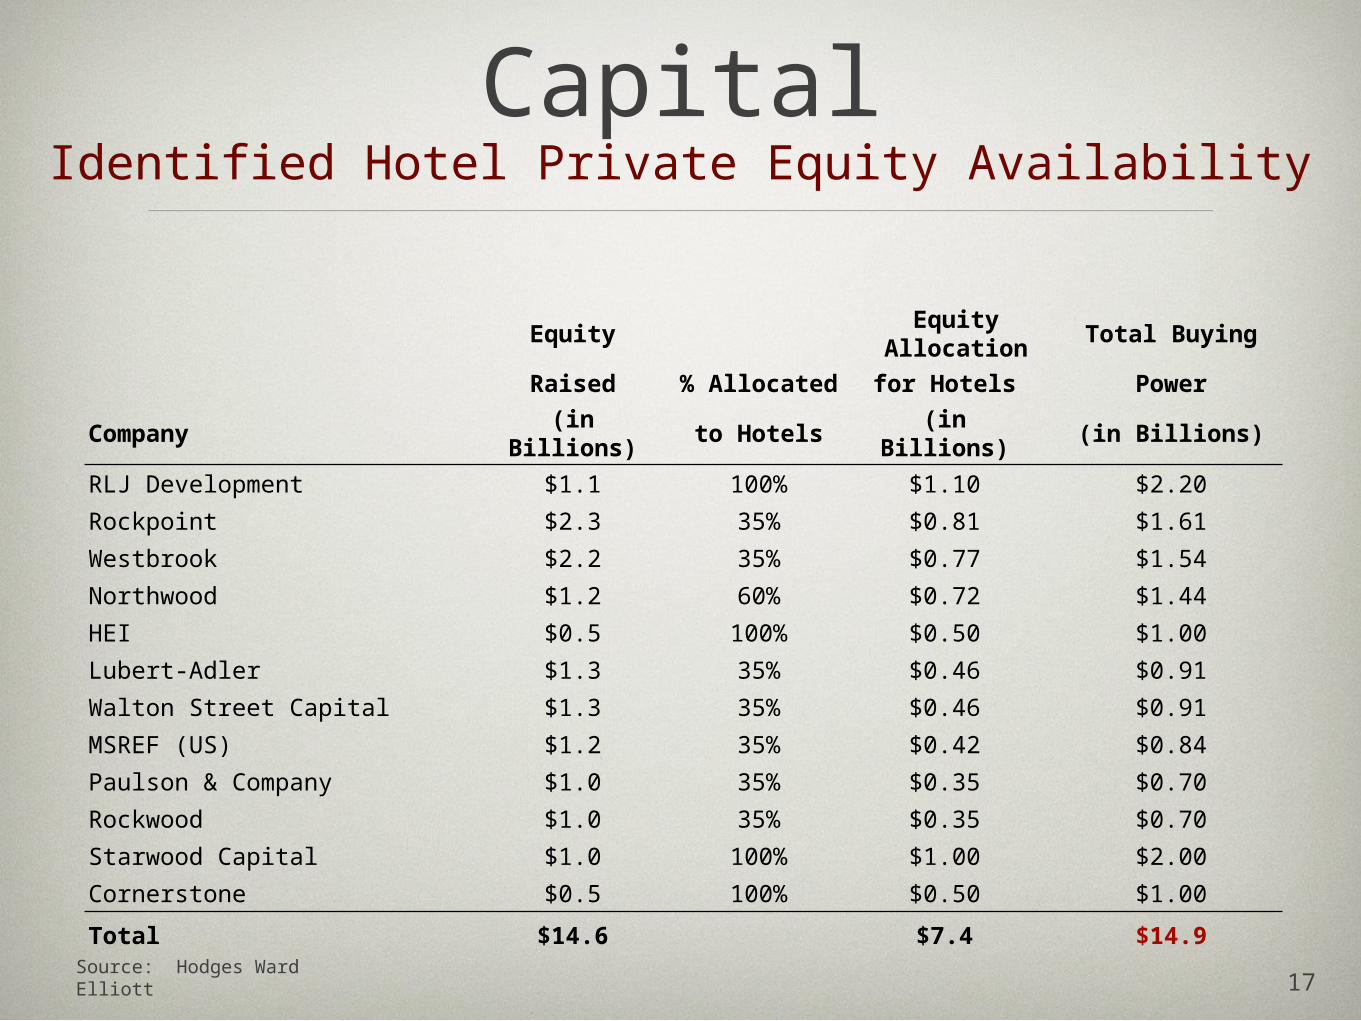
Identified Hotel Private Equity Availability
Source: Hodges Ward Elliott
Capital
EquityEquity
AllocationTotal Buying
Raised % Allocated for Hotels Power
Company (in Billions) to Hotels (in Billions) (in Billions)
RLJ Development $1.1 100% $1.10 $2.20
Rockpoint $2.3 35% $0.81 $1.61
Westbrook $2.2 35% $0.77 $1.54
Northwood $1.2 60% $0.72 $1.44
HEI $0.5 100% $0.50 $1.00
Lubert-Adler $1.3 35% $0.46 $0.91
Walton Street Capital $1.3 35% $0.46 $0.91
MSREF (US) $1.2 35% $0.42 $0.84
Paulson & Company $1.0 35% $0.35 $0.70
Rockwood $1.0 35% $0.35 $0.70
Starwood Capital $1.0 100% $1.00 $2.00
Cornerstone $0.5 100% $0.50 $1.00
Total $14.6 $7.4 $14.9
18
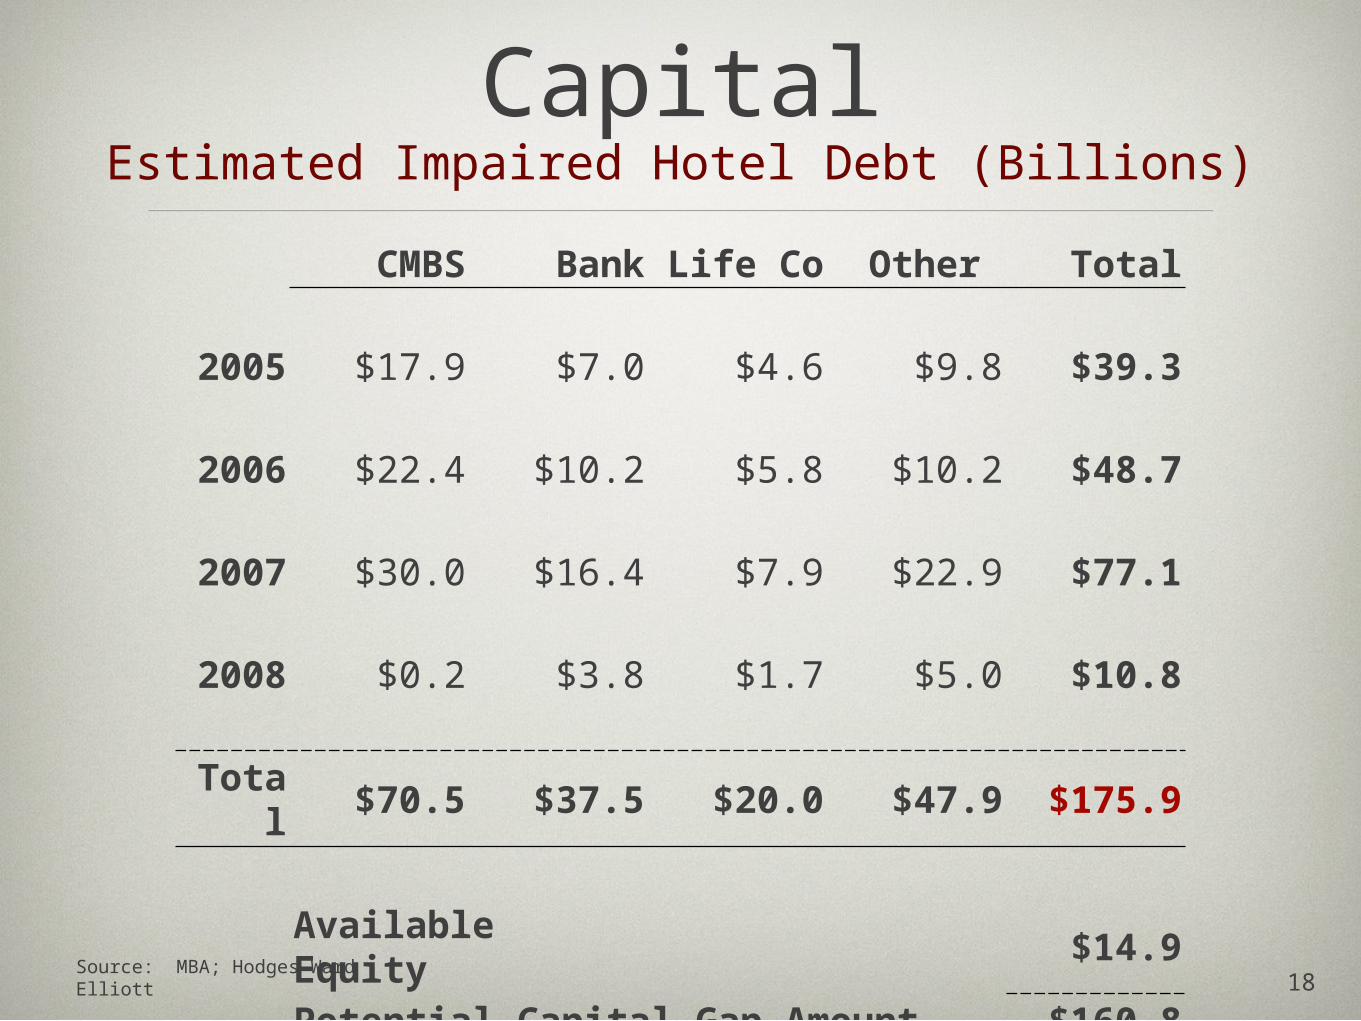
Estimated Impaired Hotel Debt (Billions)
Source: MBA; Hodges Ward Elliott
Capital
CMBS Bank Life Co Other Total
2005 $17.9 $7.0 $4.6 $9.8 $39.3
2006 $22.4 $10.2 $5.8 $10.2 $48.7
2007 $30.0 $16.4 $7.9 $22.9 $77.1
2008 $0.2 $3.8 $1.7 $5.0 $10.8
Total
$70.5 $37.5 $20.0 $47.9 $175.9
Available Equity $14.9Potential Capital Gap Amount $160.8
Hodges Ward Elliott, IncMark W. Elliott
Senior Managing [email protected]
Sovereign Building, 25th Floor3344 Peachtree Road NE
Atlanta GA 30326(404) 233-6000
www.hwehotels.com
Hodges Ward Elliott, IncMark W. Elliott
Senior Managing [email protected]
Sovereign Building, 25th Floor3344 Peachtree Road NE
Atlanta GA 30326(404) 233-6000
www.hwehotels.com
Hotel Asset Managers AssociationHotel Asset Managers Association


