+ All Categories
Home > Documents > HOTEL DISTRIBUTION DATA MANAGEMENT AND ANALYSIS - c.ymcdn.com · HEDNA’s Hotel Analytics working...

HOTEL DISTRIBUTION DATA MANAGEMENT AND ANALYSIS - c.ymcdn.com · HEDNA’s Hotel Analytics working...

Date post: 12-Jul-2018
Category:
Upload: vanthuy
View: 220 times
Download: 1 times
Share this document with a friend
34
HOTEL DISTRIBUTION DATA MANAGEMENT AND ANALYSIS A 2018 assessment on global and regional practices HEDNA Hotel Analytics Working Group Report of Findings Written and Presented by Co-Chairs David Turnbull, CCO & Co-Founder, SnapShot & Matthew Goulden, CEO, Triometric Winter Conference, Austin TX, January 30th 2018
Transcript

HOTEL DISTRIBUTION DATA MANAGEMENT AND ANALYSISA 2018 assessment on global and regional practices

HEDNA Hotel Analytics Working Group Report of Findings

Written and Presented by Co-Chairs

David Turnbull, CCO & Co-Founder, SnapShot & Matthew Goulden, CEO, Triometric

Winter Conference, Austin TX, January 30th 2018

2

Table of contents

1. Executive Summary 3

2. About HEDNA 5

3. About Hotel Analytics Working Group 6

4. Introduction 84.1 Background 8

4.2 Research Objectives 9

4.3 Research Methodology 9

4.4 Research Results 10

5. Survey Results & Analysis 11

6. Findings 256.1 General 25

6.2 Chains 27

6.3 Management Companies 27

6.4 Independents 28

7. Conclusions & Next Steps 30

3

1. Executive Summary

“Water, water everywhere, but not a drop to drink” – Samuel Taylor Coleridge, 1798, The Rime of the Ancient Mariner

Coleridge’s quote is an apt description for the global state of hotel distribution data management

and as this paper sets out to reveal, the responses and general enthusiasm for the initial survey

validates a mandate for guidance as well as change.

HEDNA’s Hotel Analytics working group (founded in the spring of 2017) set-out to investigate

key ways in which hoteliers collect store, analyze and action their data as part of their distribution

operations, The objective is to prepare industry best practice recommendations and identify

opportunities for added value from the data.

The group opted to focus initially on defining the current status of hotels’ approach to distribution

data management, based on a working group pre-survey that quantified that issues related to data

collection and storage were pre-requisites for future industry improvements.

A 20-part survey was released in October 2017 and over an 8-week period, generated 1,053 global

responses, representing over 40,000 hotels and Management Companies., in itself a significant

achievement as one of the largest survey samples collected.

The survey set out to quantify current practice in data collection, storage and usages, as well as test

respondents’ overall data satisfaction. The Survey responders come from all major continents and

represent hotels, management companies and independents. The Analytics Working Group split into

3 groups to analyze the sample size across these three segments.

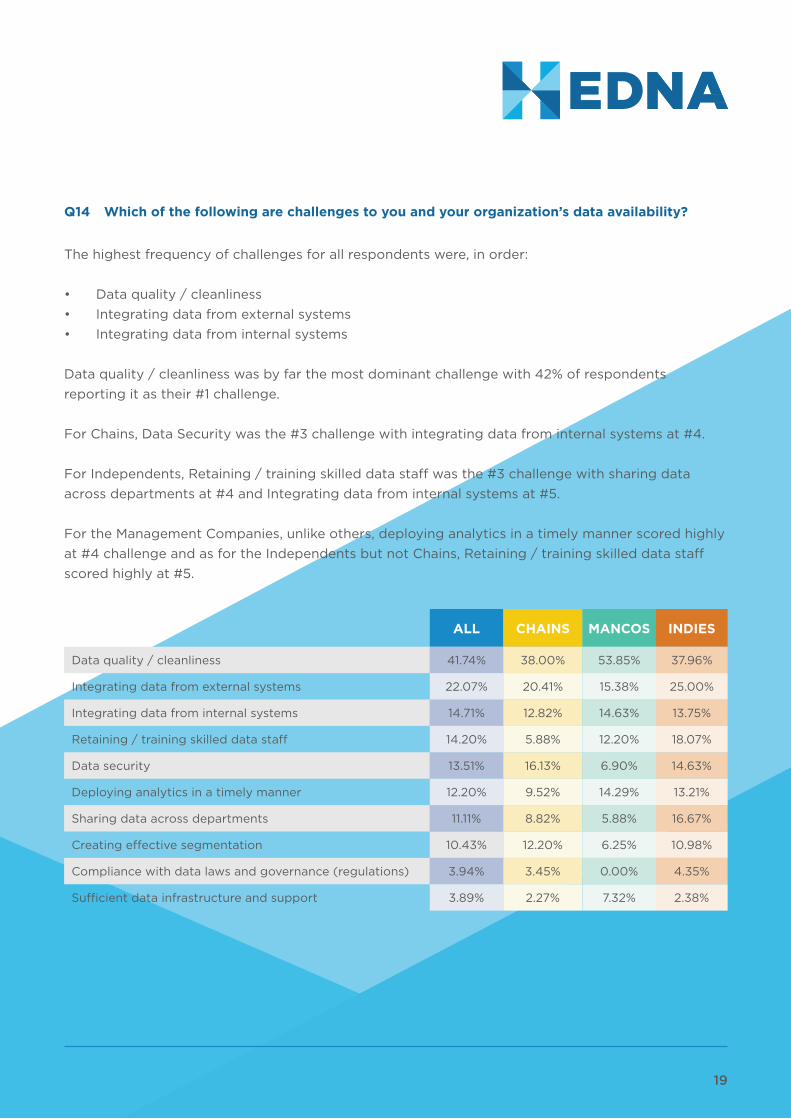
Data quality and systems integration were cited as key challenges and potential barriers to analytics

initiatives.

Throughout the survey, the importance of the OTAs both in terms of impact on inventory allocation

but also the relatively positive quality and access to data was reinforced across all segments

surveyed.

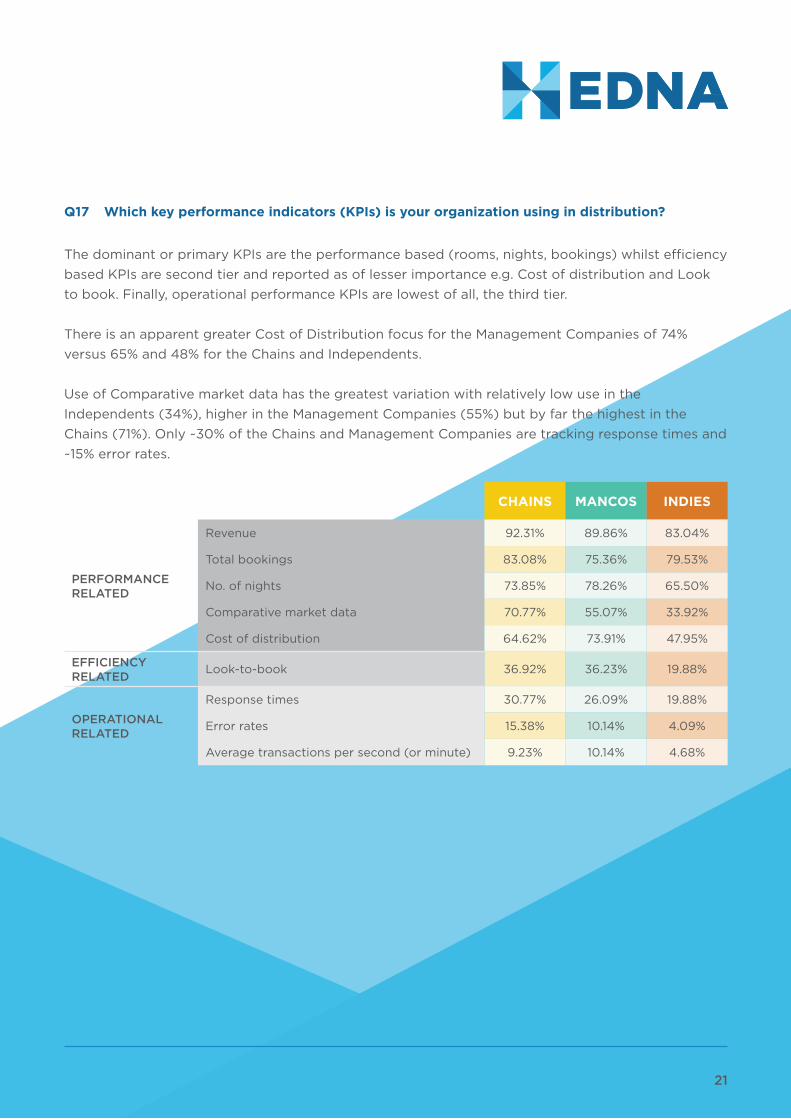
Repeatedly throughout the survey it became apparent that despite high collection rates across all

segments in key distribution data, such as Costs or Operational Performance, this did not translate

into KPI definition and data usage.

4

At Chain level, the data findings were surprisingly consistent with the global average, with the

unusual exception of inventory mix, where 30% of Chains were found to have more than 50% of

their available inventory placed with OTAs.

For the Independents, which dominated the results with 59% of responses, the absence of resources

and education was frequently observed both in the qualitative and qualitative data collected.

This however did not limit their ability to track key data sets such as Guest Data, OTA Fees and

Cancellations.

Finally and the most interesting contribution to the study, were the responses from the Management

Companies. In general they communicated high dissatisfaction with the data quality and systems

provided by their respective chains/brands but reacted to this with substantially greater investments

into human resources, data warehousing and 3rd party analysis tools.

This lead to their scoring proportionately higher ranking in KPI’s such as Cost of Distribution, which

alludes in itself to the future recommendations and best practice guidelines to be generated by the

working group.

The initial survey results and findings were first unveiled and presented on the 30th of January 2018

at the Winter HEDNA Conference in Austin, Texas at which time next steps and an outline for future

best practice guidelines were defined.

Two distinct approaches for further best practice developments were proposed and are currently

being explored. The first suggestion aims to find ways to help hoteliers leverage more of their

existing data by making it more accessible and usable in real operational contexts. The second

suggestion promotes greater collaboration between vendors and hoteliers in defining and aligning a

set of data standards across channel types to overcome current data fragmentation.

5

2. About HEDNA

Founded in 1991, HEDNA (Hotel Electronic Distribution Network Association) is the only global

forum exclusively dedicated to the advancement of hospitality distribution through strategic

collaboration and knowledge sharing.

For over 25 years, the non-for-profit association has provided its members with networking

platforms, educational opportunities and professional resources to help them navigate the ever-

evolving landscape of hotel electronic distribution.

HEDNA works to optimize the use of technologies while influencing the development of current

and emerging distribution channels. It promotes an open exchange of information and professional

development among its members. HEDNA’s global conferences deliver the most comprehensive

information, insights and dialogue on trends in hotel distribution.

HEDNA is comprised of hospitality industry leaders and innovators. Members represent all areas of

electronic distribution including hotels, representation and Management Companies, GDSs, switch

companies, OTAs, tour operators, software and payment service providers, industry consultants and

educational institutions.

HEDNA is funded by the dues of its members and is governed by an elected Board of Directors

comprised of Principal and Allied Members.

6

3. About Data Analytics Working Group

Founded in Spring 2017, the working group’s vision is to empower hoteliers to collect, store, analyze

and action their data to make intelligent decisions about their distribution strategies.

Working Group Mission

1) Increase awareness and adoption of data analytic practices and tools

2) To demonstrate how data analytics can be applied to hotel distribution

3) To create global and regional recommendations for hotel best practice.

Identified Business Problems

The perishable nature of the hotel product means hotel distribution is a race against time. The

need to optimize occupancy depends on a number of disciplines working well together, not just

distribution.. There is the urgency to keep IT operations, optimized with its complex web of APIs

and networks with powerful intermediaries, switches and GDSs, at the center. Data is the crucial

ingredient to retaining control of pricing, inventory and customer relationships, and being able to

compete effectively. The key challenge is identifying what data is needed to answer key questions,

how can it be obtained and how it can be best applied in daily operational and commercial decision

making.

Working Group Objectives

Via engagement with HEDNA members and the broader hospitality community, the working group

seeks to increase awareness and adoption of data analytic practices and tools and to demonstrate

how they can be applied to hotel distribution incorporating recommendations for hotel best

practices.

7

Working Group Participants

Working Group Co-ChairsDavid Turnbull, CCO and Co-founder, Snapshot

Matthew Goulden, CEO, Triometric

Working Group CoordinatorSonja Woodman, Marketing Manager, Triometric

HEDNA Board LiaisonsJodie Gibson, Manager Strategic Accounts, DerbySoft

Clive Wood, Vice President, Business Development, Snapshot

EditingThe team appreciates the editorial contribution from Julie Garrett, Rocco Forte Hotels

GROUP 1Chains

GROUP 2 Management Companies

GROUP Independents

Matthew Goulden

(Triometric)

Sonja Woodman

(Triometric)

David Turnbull

(Snapshot)

Clive Wood

(Snapshot)

Criss Chrestman

(NTT Data)

Caroline Faries

(ErevMax)

Dave Chestler

(Kognitiv)

Nicole Young

(Rosewood Hotels)

Casey Davy

(Busy Rooms)

Julie Garrett

(Rocco Forte Hotels)

Jodie Gibson

(Derbysoft)

Arunn Ramaduss

(Fornova)

Michael Klein

(MGM)

Rajesh Vohra

(Sarova Hotels)

8

4. Introduction

i. Background

HEDNA is ideally placed to use the expertise of its membership to address the challenge and

identify best practices for industry adoption of data analytics.

The following are five examples, where Hotels large or small today do not have sufficient visibility:

1. Cost of Distribution – Hotels need to fully understand the relative costs of direct and indirect

distribution channels and their respective models and costs (i.e. commission or advertising-

based). With limited insight hotels have difficulty comparing or benchmarking the different types

of channels and identifying those that deliver the best returns in terms of value against the costs

involved.

2. Market Trends – In a climate of high look to book ratios, hotels can lack insight into the

spectrum of which products / destinations are being searched for, by channel and how they convert.

This makes it difficult sometimes to spot market trends and opportunities ahead of the competition.

3. Distribution Supply Insight – Many hotels are dependent on third parties for the provision of

distribution data and this information asymmetry puts hotels at a disadvantage. With reliance on

third party channels or the GDSs to provide the data, often historical and not in real-time, many

hotels are restricted in their ability to verify the accuracy and understand the effectiveness of

channels and to fully understand the complete distribution picture.

4. Operational Performance – The travel market revolves around speed and accuracy. Greater

visibility is needed in real-time IT operations and connectivity performance to ensure product

searches are not missed and booking engines are keeping up with fluctuating demands. Poor

responsiveness and errors is the cause of serious lost revenue opportunities.

5. Data Management – As the gap widens between technologically fragmented hotel chains

and OTAs, hotel owners and operators are under increasing pressure to reclaim ownership of the

customer by reinventing their approaches and attitude to data collection, storage and usage. This

requires greater visibility into a variety of data for distribution, marketing, and revenue management.

9

ii. Research Objectives

The aim of the survey is to gain an understanding of the current distribution data management

and analysis practices. The objectives of the research are to help hoteliers globally exploit the

commercial value residing in their data. This can be done by helping them apply data analysis in the

way they conduct their distribution, revenue management and marketing functions, by focusing on:

• Increasedawarenessofwhattypeofdatacanbeanalyzedandtheinsightstobegained

• Educationonpotentialanalyticalprocessesandtoolsandinnovationsthatcanbedeployed

• Creationofinsightsintohowandwheredataanalysiscanhelpachieverealreturns(ROI)

• Developmentofbestpracticeguidelines

iii. Research Methodology

Concluded at the June 2017 Summer Conference in Dublin, the working group agreed to focus on

the creation and development of a largescale survey that would take the pulse of current global/

regional practice across 3 key segments:

• HotelChains

• ManagementCompanies

• IndependentHotels

The survey was developed based on 3 aspects of distribution data management:

1) Data Collection

2) Data Storage

3) Data Usage

With the goals to identify general and segment level consistencies and anomalies whilst presenting

both global and regional best practice.

The survey asked the following questions:

• Howmanypropertiesdoesyourorganizationhave(allbrands)?

• Howwouldyoudescribeyourorganization?

• Howwouldyoudescribeyourrolewithinyourorganizationregardingyoursystems

andprocesses?

• Whichdatadoyougathertogenerateinsightintoyourthirdpartyelectronicdistribution?

• Whichsystemsdoyoucurrentlyworkwithtocollectdataforuseindistributionanalysis?

• Whichthirdpartyelectronicdistributionchannelsdoyoucurrentlyusetodistribute

yourinventory?

10

• Whichthirdpartyelectronicdistributionchannelsprovideyouwithdataforyour

distributionanalysis?

• Howcurrentisthedatayouuseindistributionanalysis?

• Howdoyoucurrentlystorethedatausedfordistributionanalysis?

• Howlongdoyoukeepdata?

• Whichofthefollowingarechallengestoyouandyourorganization’sdataavailability?

• Doyouhaveaparticulardatachallengenotmentionedabove?

• Doesyourdistributionorganizationhaveadataanalysisteam?

• Whichkeyperformanceindicators(KPIs)isyourorganizationusingindistribution?

• DoyouthinkyourorganizationismeasuringtherightKPIstobeeffectiveindistribution?

• Doyouhaveaccesstothedatayouneedtoeffectivelymanageyourdistribution?

• Whatistheprimaryuseofthedistributiondatathatyourorganizationcollects?

The survey was active over an 8 week period in Q4 2017, and was distributed to hoteliers in one of

3 ways:

1) Via HEDNA Hotel Member Network

2) VIA HEDNA Vendor Member Network

3) Via Social Media

The data was collected via an online survey and was segmented into the following categories for

initial data analysis by the working group:

• GeneralFindings

• HotelChain

• ManagementCompany

• Independent

iv. Research Results

The survey attracted responses from 1053 hospitality operators (Chains, Management Companies

and Independents), providing a broad sample base of over 40,000 hotels.

As outlined in the subsequent analysis and findings sections, the results were influenced by a high

percentage of independent hotels (60% - a logical reflection of the global and open nature of the

survey), with active representation across all continents and segments of hotel.

11

5. Survey Results & Analysis

Q1 How many properties does your organization have (all brands)?

Our first question was designed to give us feedback on the overall organizational scale and

distribution of our respondents.

Whilst the property count in North America is dominant within our survey, we have strong coverage

in Europe and at least some coverage for other regions.

With regard to scale of operations, the 0-51 interval dominates, accounting for approximately 80%

for all regions. The next highest coverage are the 51-100 and 1000+ intervals. Sample size was 1,053

respondents representing about 40,000 hotels.

!"#$%&'()#*+,&

-,./&'()#*+,&

01#"2)& 3*445)&0,6$& '6*,& '7#*+,&

3 37

7%

%

9%

Regional Distribution of Properties

23%

8% 8% 15%

12

Q2 How would you describe your organization?

The surveys had excellent representation both in numbers of respondents and hotel categories

making it one of the most extensive survey in hotel analytics to date.

37

Hotel Management Type

17% Hotel Chain

59% Independent

24%

Management Company

13

Q3 How would you describe your role within your organization regarding your systems

and processes?

The 58% of respondents with their stated role as Decision Maker clearly indicates the response to

the survey overall is fairly senior. This may be skewed to some extent by the Independents since we

see a different picture when we split by Hotel category:

Respondent’s Role

8%

Evaluator / Recommender

8%User

11%Approver

58%Decision Maker

15%Influencer

% of ‘Decision Maker’ Respondent

0% 20% 40% 60% 80%

Independent

Management Company

Hotel Chains

14

Q7 Which data (from the options provided in the table) do you gather to generate insight into

third party electronic distribution?

For Cost of Distribution, GDS and OTA fees have the greatest focus for Chains and Management

Companies, lower for Independents. This trend is also true for Modifications & Cancellations, with

the Chains and Management Companies reporting ~80%+ and the Indies less than 74%.

Management Companies give Operational performance much higher priority with 85% gathering

Response times versus 74% and 70% for Chains and Independents. Management Companies focus

on Operational data is also shown for Faults and errors with 83.5% versus 67% and 64% for the

Chains and Independents.

In the underlying data Chains reported by far the highest non-availability of Operational

performance data, 22% and 27% reporting no availability of Response time and Errors and faults

data. By comparison Management Companies reported 8% and 9% respectively.

CHAINS MANCOS INDIES

DISTRIbuTIoN coSTS

GDS platform fees 88.76% 83.33% 71.69%

OTA fees 90.91% 89.69% 84.58%

Metasearch platforms (CPC/CPA) 76.19% 74.19% 57.35%

Late Booking platform fees 63.41% 68.82% 56.94%

Modifications & Cancellations (All platforms) 82.76% 80.65% 73.76%

opERATIoNAl pERfoRmANcE

Response times 74.12% 84.95% 70.00%

Errors and Faults 67.06% 83.52% 64.32%

Service Level Agreements (SLAs) 80.49% 80.00% 60.66%

TRAffIc volumES

Searches 84.09% 89.13% 80.63%

Bookings 93.02% 92.63% 87.61%

Modifications & Cancellations 85.88% 88.04% 80.36%

Look to Book by Channel 88.10% 92.31% 75.23%

GuEST DATA 96.51% 93.55% 90.21%

15

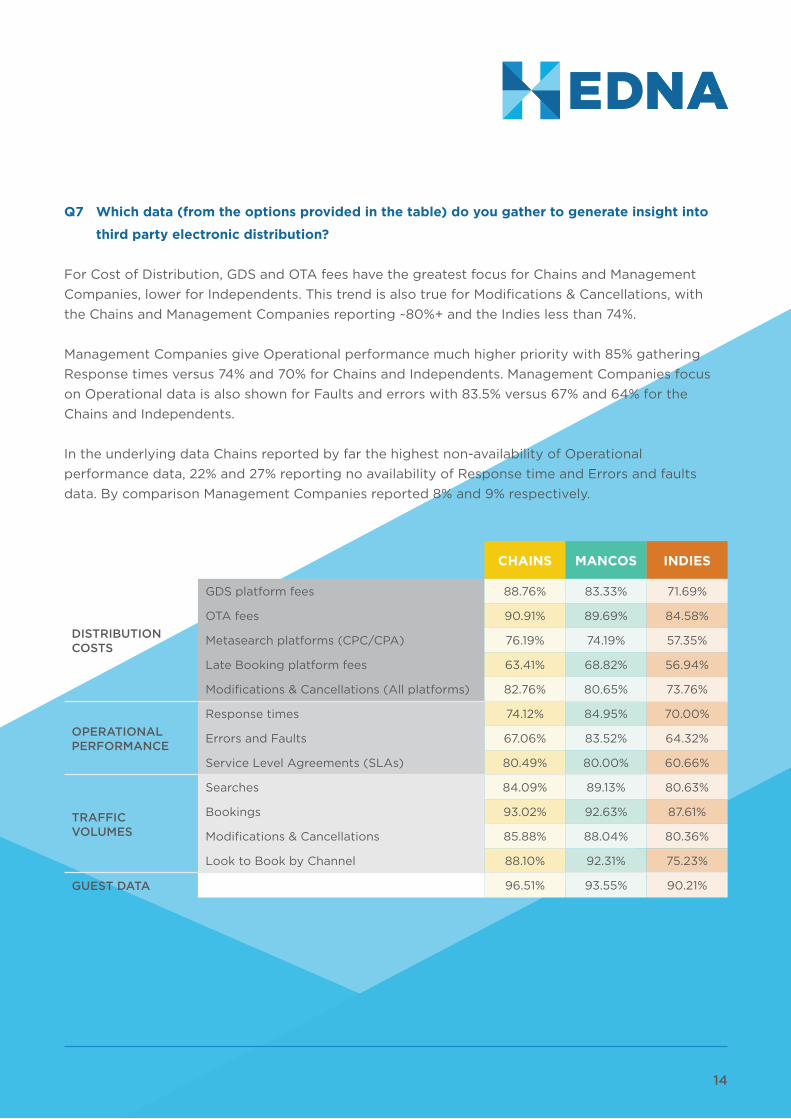
Q8 Which systems do you work with to collect data for use in distribution analysis?

The Property Management System (PMS) is the dominant system for the storage and therefore the

source of data for distribution analytics. Across the Hotel, 87% of Chains used their PMS for data

collection, with 91% of Management Companies using the PMS data and 69% of Independents. This

may reflect the scale and limited resources of some Independents.

The CRS and GDS are second and third data sets of choice for analytics, Chains showing a greater

use of CRS and GDS data than Management Companies.

Chains and Management Companies show significant use of CRM data for distribution analysis.

Independents show limited use of CRM data again a possible reflection on resources and

sophistication.

CRS

PMS

IBE

GDS

CRM

Other

CHAIN MANCO INDIE

0% 20% 40% 60% 80% 100%

16

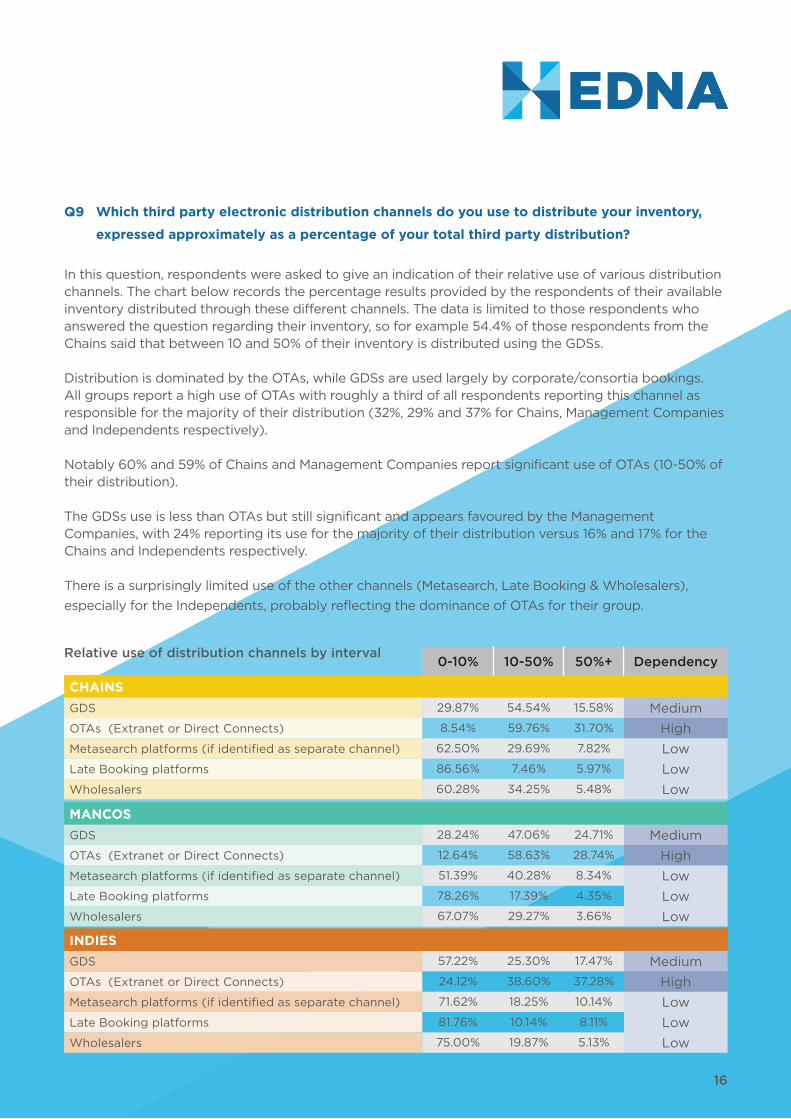
Q9 Which third party electronic distribution channels do you use to distribute your inventory,

expressed approximately as a percentage of your total third party distribution?

In this question, respondents were asked to give an indication of their relative use of various distribution channels. The chart below records the percentage results provided by the respondents of their available inventory distributed through these different channels. The data is limited to those respondents who answered the question regarding their inventory, so for example 54.4% of those respondents from the Chains said that between 10 and 50% of their inventory is distributed using the GDSs.

Distribution is dominated by the OTAs, while GDSs are used largely by corporate/consortia bookings. All groups report a high use of OTAs with roughly a third of all respondents reporting this channel as responsible for the majority of their distribution (32%, 29% and 37% for Chains, Management Companies and Independents respectively).

Notably 60% and 59% of Chains and Management Companies report significant use of OTAs (10-50% of their distribution).

The GDSs use is less than OTAs but still significant and appears favoured by the Management Companies, with 24% reporting its use for the majority of their distribution versus 16% and 17% for the Chains and Independents respectively.

There is a surprisingly limited use of the other channels (Metasearch, Late Booking & Wholesalers),

especially for the Independents, probably reflecting the dominance of OTAs for their group.

0-10% 10-50% 50%+ Dependency

CHAINSGDS 29.87% 54.54% 15.58% Medium

OTAs  (Extranet or Direct Connects) 8.54% 59.76% 31.70% High

Metasearch platforms (if identified as separate channel) 62.50% 29.69% 7.82% Low

Late Booking platforms 86.56% 7.46% 5.97% Low

Wholesalers 60.28% 34.25% 5.48% Low

MANCOSGDS 28.24% 47.06% 24.71% Medium

OTAs  (Extranet or Direct Connects) 12.64% 58.63% 28.74% High

Metasearch platforms (if identified as separate channel) 51.39% 40.28% 8.34% Low

Late Booking platforms 78.26% 17.39% 4.35% Low

Wholesalers 67.07% 29.27% 3.66% Low

INDIESGDS 57.22% 25.30% 17.47% Medium

OTAs  (Extranet or Direct Connects) 24.12% 38.60% 37.28% High

Metasearch platforms (if identified as separate channel) 71.62% 18.25% 10.14% Low

Late Booking platforms 81.76% 10.14% 8.11% Low

Wholesalers 75.00% 19.87% 5.13% Low

Relative use of distribution channels by interval

17

Q10 Which third party electronic distribution channels provide you with data for your

distribution analysis?

In the underlying data there was little variation with respect to the groups apart from the

Independents reporting No Access to the data more frequently than expected. The survey only

asked about access so this category may include non-use which likely will inflate the No Access

numbers particularly for the Independents.

OTAs are the best in the provision of real-time or near real-time data with over 60% of respondents

recording access to data within a day for this channel. That said a quarter of all OTA channel

respondents report that access is month at best!

GDSs are next best but a mixed bag as 44% of respondent’s report access to data within a day, but

21.6% state only monthly and 23.15% no access at all.

Generally low penetration or data access of other distribution channels with over a third reporting

No Access of Metasearch, late Booking or Wholesale platforms.

Real time Daily Weekly monthly Annually No Access

GDS 23.46% 20.68% 8.95% 21.60% 2.16% 23.15%

OTAs  (Extranet or Direct Connects) 30.85% 30.10% 11.69% 16.92% 0.75% 9.70%

Metasearch platforms 15.33% 19.86% 10.45% 18.82% 2.44% 33.10%

Late Booking platforms 17.67% 14.13% 9.89% 11.66% 2.12% 44.52%

Wholesalers 12.29% 10.24% 7.85% 20.82% 6.83% 41.98%

18

Q12 How do you currently store the data used for distribution analysis?

Management Companies show the highest usage of spreadsheets and the lowest use of 3rd party

data warehouses. The use of spreadsheets may reflect greater intent to combine data from different

sources and its analysis.

All reflect strong preference for the use of spreadsheets and internal databases for storage of

data for distribution analysis. 3rd party BI tools are being used to a degree by the Management

Companies and Chains (~30%) but much less so by the Independents.

CHAINS MANCOS INDIES

Spreadsheet 47.62% 61.86% 46.25%

Internal database 58.33% 61.86% 48.33%

Internal data warehouse 19.05% 15.46% 4.17%

3rd party business intelligence tool (Tableau, Qlikview, etc.) 32.14% 30.93% 10.83%

3rd party hosted data warehouse 19.05% 13.40% 14.58%

Other (please specify) 5.95% 4.12% 7.08%

Wholesalers 60.28% 34.25% 5.48%

19

Q14 Which of the following are challenges to you and your organization’s data availability?

The highest frequency of challenges for all respondents were, in order:

• Dataquality/cleanliness

• Integratingdatafromexternalsystems

• Integratingdatafrominternalsystems

Data quality / cleanliness was by far the most dominant challenge with 42% of respondents

reporting it as their #1 challenge.

For Chains, Data Security was the #3 challenge with integrating data from internal systems at #4.

For Independents, Retaining / training skilled data staff was the #3 challenge with sharing data

across departments at #4 and Integrating data from internal systems at #5.

For the Management Companies, unlike others, deploying analytics in a timely manner scored highly

at #4 challenge and as for the Independents but not Chains, Retaining / training skilled data staff

scored highly at #5.

ALL CHAINS MANCOS INDIES

Data quality / cleanliness 41.74% 38.00% 53.85% 37.96%

Integrating data from external systems 22.07% 20.41% 15.38% 25.00%

Integrating data from internal systems 14.71% 12.82% 14.63% 13.75%

Retaining / training skilled data staff 14.20% 5.88% 12.20% 18.07%

Data security 13.51% 16.13% 6.90% 14.63%

Deploying analytics in a timely manner 12.20% 9.52% 14.29% 13.21%

Sharing data across departments 11.11% 8.82% 5.88% 16.67%

Creating effective segmentation 10.43% 12.20% 6.25% 10.98%

Compliance with data laws and governance (regulations) 3.94% 3.45% 0.00% 4.35%

Sufficient data infrastructure and support 3.89% 2.27% 7.32% 2.38%

20

Q16 Does your distribution organization have a data analysis team?

Chains report the highest availability of ‘centralised’ analytics resources across all groups, that being

at HQ. Management Companies have resources devolved to property level with 39% Management

Companies reporting property level resources versus 30% for Chains.

All Chains reported availability of analytics resources either at property or HQ. 25% of Management

Companies report non-availability of analytics resources and 35% for Independents.

CHAINS MANCOS INDIES

General analytics team at HQ 68.18% 63.24% 25.85%

Dedicated analytics team by department (e.g. distribution) at HQ

50.00% 34.85% 16.55%

Dedicated analytics team at regional HQ (e.g. US, Europe, Asia, etc.)

39.06% 25.81% 14.49%

Dedicated analytics team at property 30.30% 39.06% 35.17%

None of the above 0.00% 25.00% 35.14%

21

Q17 Which key performance indicators (KPIs) is your organization using in distribution?

The dominant or primary KPIs are the performance based (rooms, nights, bookings) whilst efficiency

based KPIs are second tier and reported as of lesser importance e.g. Cost of distribution and Look

to book. Finally, operational performance KPIs are lowest of all, the third tier.

There is an apparent greater Cost of Distribution focus for the Management Companies of 74%

versus 65% and 48% for the Chains and Independents.

Use of Comparative market data has the greatest variation with relatively low use in the

Independents (34%), higher in the Management Companies (55%) but by far the highest in the

Chains (71%). Only ~30% of the Chains and Management Companies are tracking response times and

~15% error rates.

CHAINS MANCOS INDIES

pERfoRmANcE RElATED

Revenue 92.31% 89.86% 83.04%

Total bookings 83.08% 75.36% 79.53%

No. of nights 73.85% 78.26% 65.50%

Comparative market data 70.77% 55.07% 33.92%

Cost of distribution 64.62% 73.91% 47.95%

EffIcIENcy RElATED Look-to-book 36.92% 36.23% 19.88%

opERATIoNAl RElATED

Response times 30.77% 26.09% 19.88%

Error rates 15.38% 10.14% 4.09%

Average transactions per second (or minute) 9.23% 10.14% 4.68%

22

Q18 Do you think your organization is measuring the right KPIs to be effective in distribution?

There is a low confidence across all groups in the measurement of the right KPIs to drive effective

distribution. Only 50% reported yes. This is consistent across all groups with the Management

Companies showing greatest confidence at 54% and Independents least at 46%.

Measuring the right KPIs to be effective

INDIES

MANCOS

CHAINS

0% 10% 20% 30% 40% 50% 60%

Don’t know No / Don’t know Yes

23

Q19 Do you have access to the data you need to effectively manage your distribution?

Independents show the greatest confidence reporting at over 50% that they have the data needed

and that they receive it in a timely manner.

Only 36% of Chains and 45% Management Companies reported they have the data needed and

received in a timely manner.

43% of Chains and 45% of Management Companies reported that their organizations had the right

data but either delivered too slowly or limited in scope.

Don’t know

No

Yes but faster / more

Yes

0% 10% 20% 30% 40% 50% 60%

CHAINSMANCOSINDIES

24

Q20 What is the primary use of the distribution data that your organization collects?

All groups report that strategy decision making is the primary use of distribution data in the

organization with forecast modelling and channel performance close behind. Distribution data’s

use for negotiating with 3rd party channels is significant for Chains (70%), much more so than

Management Companies and Independents, both reporting 49%.

CHAINS MANCOS INDIES

Strategy Decision Making 90.91% 89.55% 80.54%

Forecast Modelling 85.71% 80.65% 63.77%

Determine Channel Performance (Look-2-book, bookings, modifications)

80.95% 71.88% 67.63%

Help negotiate Terms with 3rd party channels 70.15% 49.18% 48.89%

Manage SLAs with 3rd party channels 51.61% 48.28% 29.91%

25

6. findings

As the aim of the survey was to document the current state of global and regional practice in hotel

distribution data management, the results both confirm this current state but also accurately reflect

the nature of how the survey was created.

In reflection the survey was initially built from a HEDNA member perspective, which by default

implies a North American and Chain orientation and was optimized to incorporate smaller

organization (Management Companies and Independents).

Based on the qualitative feedback collected as part of the survey, it became apparent that more

specific question profiles tailored to each specific segment (Chain, Independent, Management

Company) as well as unique regional variations, may have yielded more focused data and findings

and remains an opportunity for further research in the next phase of the working group’s activities.

However, the results interestingly confirm a high degree of consistency of opinion across all

segments and regions and over 60% of the results analyzed were interpreted as being capable

of being read from a global perspective, which reinforces the validity of the survey approach and

opportunities for best practice guideline definition.

6.1 General

Main Takeaways

• Largeresponsetosurvey

• PMSdominanceofstorageandcollection(Q8)

• PositivequalityandAccesstodatafromthirdparties(Q10,Q7)

• ChallengesofDataQuality&Integrations(Q14)

• LowimpactofCostofDistributionasaKPI(Q7/Q17)

The survey completion rate of over 1000 respondents, representing 40,000 hotels is the clear

highlight of this initial result and confirmed a global appetite to improve distribution data

management, especially related to the themes of:

i. Data Collection (Q7, Q8, Q14)

ii. Data Storage (Q12)

iii. Data Quality (Q14)

26

Based on the uniformity of response in these areas, it can be observed hotel organizations appear to

have a data quality issue that can impede its use for KPI implementation and tracking, for example.

This is primarily an in-house resources issue. At the same time the observed lack of effective system

integration can be defined as an issue arising from the choice of vendor. It may be because the

decision maker wishes to obtain and analyse data first-hand, such as certain KPIs, but may not be

aware of the data collection process that is involved.

Considering the level of decision maker responding to the survey, it is alarming to discover that

50% didn’t know or agree if they are tracking the correct KPI’s (Q18) with an additional 50% of

respondents (Q19) claiming they do have access to the data they need, implying need for improved

aggregation, analysis resources.

Hotels of all categories, despite obvious media trends towards Cost of Distribution and CRM, remain

highly performance focused (revenue, bookings, nights) in their KPI requirements (Q17) which

reflects current and past management expectations and system behavior, but does not bode well

for future planning (e.g. Q17, Cost of Distribution, ranked only 4th in current KPI tracking with even

scanter regard for Distribution Operations Data).

When coupled with the low impact of data warehousing (6% - Q12) and prevalence to store and

analyze data in immediate databases (66% via spreadsheets and internal databases), further

validation of both resource and financial investment constraints are revealed. Considering the

significant cost savings that could be achieved via improved cost of distribution and or distribution

operations, it is surprising to see such low KPI and analytics adoption.

The beacon and bottleneck in all of this, appears to be the confirmation (Q8) of the Property

Management System (PMS) as the primary single source of truth (SSOT) system for data collection

and storage. Whilst this can be viewed very positively from a centralized data collection perspective,

it raises the requirement for improved integrations and data extraction capabilities, allowing

hoteliers (of all levels) to implement data action practices.

This data access inertia in perceived in-house systems, leads to an interesting contradiction

compared to the satisfaction all segments of hotel reported of their ability to access and work with

3rd party data.

27

6.2 Chains

Main Takeaways

• SurprisinglyHighOTAimpactoninventorymix(Q9)

• Proactiveavailabilityofanalyticsresources(Q16)

• ImportanceofDataforcontractnegotiations(Q20)

Based on the overt dominance of North America in the wider survey results, unsurprisingly the

responses from Chains were consistent with the wider general analysis and findings.

The big highlight from the survey (Q9) was the recorded importance (and domination!) of the

OTA’s on their inventory mix, with 30% of Hotel Chains supplying OTA’s with more than 50% of their

inventory.

As respondents are typically from a distribution background, this has high significance as it correctly

validates the respondents understanding of the data from a global perspective (they see demand

in all major continents). It however also may challenge the impact of direct booking campaigns and

is possibly a reflection of behavior of Chains who have a higher percentage of franchisee owner/

operators.

Unsurprisingly the Chains (Q16) invest the highest in head office data analytics resources (human

and systems) and yet repost consistent levels of dissatisfaction (Q14) with data quality, system

integration and data security.

Finally, the survey confirmed the importance of data management at global chain level during

contract negotiations, with 70% of using analysis to help negotiate contracts with 3rd party

channels and 52% using the data for enforcing and managing SLA’s. Converting this data into

actionable insights for commercial stakeholders being the current and future opportunities reported.

6.3 Management Companies

Main Takeaways

• HighestattentiontoCostofDistributionKPI’sofallrespondents(Q17)

• Suspicionoverdatasourcedfromchain/brand(Q14)

• Highestattentiontodetailonaccessanduseofdata(Q12)

• Highdevolvementtoproperty(Q16)

28

The results of the Management Companies, confirmed how interesting their individual insights are

as they balance the juxtaposition between chain and independent. Namely operating with a unique

independence in collective strategy whilst reliant and (potentially limited) by specific chains/brands,

for system and distribution capability.

This led to some interesting insights, especially inventory mix (Q9), that saw the most balanced of

all 3 hotel segments (compared to Chains and Independents), where all of distribution channels

listed had an even split of between 10-25% contribution assigned to them. Unsurprisingly, the Cost

of Distribution was indeed ranked 3rd as a measured KPI..

Throughout the survey, Management Companies indicated having more control, or insight into their

data (Q7, Q8, Q12, Q16) with the analytics resource allocation devolved to property (Q16) being a

contributing factor to this – due in part to obvious organizational structure differences to their chain

counter parts.

This also represents itself in their approach to data storage and system selection (Q12), with

proportionally high investments into both data warehouses (15%) and 3rd party business intelligence

tools (30%) compared to the general response (10% and 20% accordingly)

The advanced but property orientated organizational structure reveals itself in Management

Companies propensity (Q20) to manage SLAs and model forecasts than Independents and for

obvious dependencies, low use of data for negotiations purposes compared to the Chains.

6.4 Independents

Main Takeaways

• OTAFees&Cancellationsthemostcollecteddata(Q7)

• Balancedinventorymix(Q9)

• Lowinvestmentineducation&analyticsresources(Q16)

Independents made up 60% of the respondents and have a high impact on the overall general

findings of this survey. Interestingly, despite an obvious insight that Independents set aside lower

resources for data analysis, as a category, they recorded high engagement for in-house data

collections, especially in the areas of:

i. Guest Data (69%)

ii. OTA Fees (54%)

iii. Cancellation & Modifications (52%)

29

Quoting the obvious Rime of the Ancient Mariner quote “Water water everywhere but not a drop to

drink”, it is instantly obvious from the subsequent systems (Q8), storage (Q12) and resources (Q16)

data, that Independents are acutely aware of their limitations to accurately collect, store and use

data and therefore heavily rely upon 3rd party channels (Q10, Q11, Q14) that provide them with the

greatest data conveniences, namely:

i. Access

ii. Frequency

iii. Quality

Like Management Companies, Independents who openly rely on third party intermediaries for

generating demand, presented a balanced approach to inventory allocation, with close to 37%

actively working with up to 25% inventory all of the presented demand channels.

The dominance of OTAs as a distribution channel was quantified with only 5% of respondents having

75% or more inventory allocated to OTA channels and a further 17% having 50% or more. Q14’s focus

on data challenges in some respects, acutely summarized the issues independent hotels face from

a data and distribution management perspective with Data Quality, Integrations and Skilled Staff

ranked as the top 3.

Based on these findings, it is clear that the onus is on channels, system provider and hotel

associations to provide independent hotels with greater support.

30

7. conclusions & Next Steps

One of the key conclusions that can be drawn from the overall survey results is that the industry

collectively is not applying analytics sufficiently well to drive distribution strategy and operations.

This failure can be attributed to the very real challenges that exist in data collection and storage,

combined with the general quality and timeliness of the data.

High reliance for data on some systems such as the Property Management System (PMS) as the

single source of truth and lack of standards or integration across other platforms point to an

opportunity for hoteliers and hotel technology vendors to work more collaboratively to help

current industry data management practices to evolve into best practices that deliver wide ranging

operational efficiencies in the way data is sourced, stored and used for decision-making.

Associations like HEDNA, offer the ideal forum and opportunity to facilitate active dialogue and

collaboration between the suppliers and users of hotel technology. Such a constructive environment

can lead to more formal standards in data management from a distribution perspective being

recommended and adopted. Further engagement between subject matter experts from the vendor

and hotel groups will be orchestrated by the Analytics Working Group as part of this continued best

practice work.

Next Steps

To promote the study findings and prepare for next steps the Working Group will:

1. Promote awareness of the Study Findings publication via the HEDNA website and Linkedin Group

2. Engage discussion during workgroup meetings

3. Organize a Best Practice Roundtable to take place during the HEDNA conference in Lisbon, 4-6

June 2018. (As part of the format, vendors and hotel participants will be invited to discuss and

share their experiences and recommendations).

At the HEDNA Winter Conference in Austin, Texas, a number of possible next steps were suggested

with a view to taking these findings forward and developing a set of best practice guidelines that

the industry can recognize and adopt. The Best Practice section below sets out two specific ideas

put forward.

31

Best Practice – Leveraging Existing Data

One of the observations made at the conference, based on the survey findings, is that hotels are

actually collecting a broader set of data than they actually make use of in order to make informed

distribution decisions. This underpins a suggestion to identify ways in which hotels can leverage this

largely already available data set. The best practice work would include:

• Definingthelargelyavailabledatasetandit’ssources

• Recommendingthenecessarydataintegrationsanddatacleansingtechniques

• Definingthekeyperformanceindicatorsandtheirtrackingfrequency

• Suggestedreportsand/orothermeansfordisseminatinginformationintheorganization

The goal would be to provide the hotels with a ‘best practice tool-kit’ that would enable them to

implement more effective distribution decision making with relatively limited effort and capital

investment by leveraging much of the data already available to them today in combination with the

collective HEDNA analytics work group expertise.

Best Practice - Channel Data Collection & Storage Standards

Although the industry is well served with global data collection and benchmarking organizations

to assist in pricing and revenue management, these predominantly focus on more traditional hotel

market segmentation and do not either cross-reference or specifically address areas such as:

• ChannelType

• ChannelSegment

• ChannelCategory

• ChannelCost

As the survey findings revealed, this is impacted by data quality and integrations between different

systems (e.g. Channel Management & Central Reservation Systems) where a high percentage of the

required data is collected and stored but not used by the main data source, the PMS.

A suggestion for further best practice work is for the Analytics Working Group to encourage active

dialogue with key stakeholders such as:

• Hotels(Chains,ManagementCompanies&Independents)

• PropertyManagementSystems

• CentralReservationSystems

• ChannelManagers

• BenchmarkingAgencies

32

A key objective would be to review current practices and develop an aligned approach to defining

the data needs and standards for data collection, storage, mapping and benchmarking that would

address some of the industries core data quality issues as well as the need for a more standardized

approach to data sharing across platforms.

This suggestion for establishing best practices in improving data management at source for the

improved use of data analytics by hotels in the management of their distribution channels relies

heavily on hotel and vendor stakeholder collaboration in sharing data sources and operational

processes and platforms. At the time of writing this is a suggestion being put forward, but the

necessary resources have not been identified.

33

About HEDNA

Founded in 1991, HEDNA (Hotel Electronic Distribution Network Association) is the only global

forum exclusively dedicated to the advancement of hospitality distribution through strategic

collaboration and knowledge sharing.

For over 25 years, the non-for-profit association has provided its members with networking

platforms, educational opportunities and professional resources to help them navigate the ever-

evolving landscape of hotel electronic distribution.

HEDNA works to optimize the use of technologies while influencing the development of current

and emerging distribution channels. It promotes an open exchange of information and professional

development among its members. HEDNA’s global conferences deliver the most comprehensive

information, insights and dialogue on trends in hotel distribution.

HEDNA is comprised of hospitality industry leaders and innovators. Members represent all areas of

electronic distribution including hotels, representation and management companies, GDSs, switch

companies, OTAs, tour operators, software and payment service providers, industry consultants and

educational institutions.

HEDNA is funded by the dues of its members and is governed by an elected Board of Directors

comprised of Principal and Allied Members.

www.hedna.org

[email protected]

34

HEDNA would like to thank the organizations and individuals that participated in the Analytics

Working Group Survey project to document the distribution landscape and all those who responded

to the survey and provided information and perspectives that collectively form the foundation for

this findings report. This paper is primarily based on the findings from the Analytics Working Group.

The observations and conclusions in this document are not intended in any way or form to reflect

the views or perspectives of HEDNA and or the contributing organizations.

Copyright © 2018 HEDNA

All rights reserved. Reproduction by any method or un-authorized circulation is strictly prohibited,

and is a violation of international copyright law.


Recommended