50
Hotel InduSTRy Overview Brittany Baldwin CSGP, CHIA Director of Business Development, Destinations DMAI Webinar October 7, 2014

Hotel InduSTRy Overview
Brittany Baldwin CSGP, CHIA
Director of Business Development, Destinations
DMAI Webinar October 7, 2014

1. Visit www.HotelNewsNow.com 2. Create Free Login 3. Click on “Data Presentations”


1. Industry Pulse from 30,000 ft.
2. Group Demand ‘Comeback’?
3. Best & Worst Market Performance
4. Pipeline Growth
5. Where Are We Headed?
5 Things to Know …..

U.S. Pulse - Positive So Far 1

U.S. Records Set in 2013! Most Rooms Available
Most Rooms Sold
Highest Rooms Revenue
Highest ADR ($110)
Highest RevPAR ($70)
Full Year 2013

May 2014 RevPAR Growth
10%

May 2014 RevPAR Growth
10% Highest May of any on
record…ever!

June 2014 Occupancy 71.7%

June 2014 Occupancy 71.7%
Highest June occupancy this century!

July 2014: Most Rooms Sold Ever!
113 Million

August 2014 YTD: Strong Demand Drives Very Strong RevPAR
% Change
• Room Supply* 0.8% • Room Demand* 4.3% • Occupancy 66% 3.4% • ADR* $115 4.4% • RevPAR* $76 8.0% • Room Revenue* 8.9%
August 2014 YTD, Total US Results * All Time High for First 8Months

Demand Growth Accelerates Again. Smooth Sailing Ahead!
-8
-4
0
4
8
1990 2000 2010
Supply % Change
Demand % Change -6.9%
-0.9%
- 4.7%
Total U.S., Supply & Demand % Change, 12 MMA 1/1990 – 8/2014
8.0%
3.5%

Steady ADR Growth As Room Demand Growth Continues
-10
-5
0
5
1990 2000 2010
Demand % Change ADR % Change
-4.5%
7.5% 6.8%
-8.7%
4.1%
Total U.S., ADR & Demand % Change, 12 MMA 1/1990 – 8/2014

Group Demand ‘Comeback’?
Group Transient Contract
2

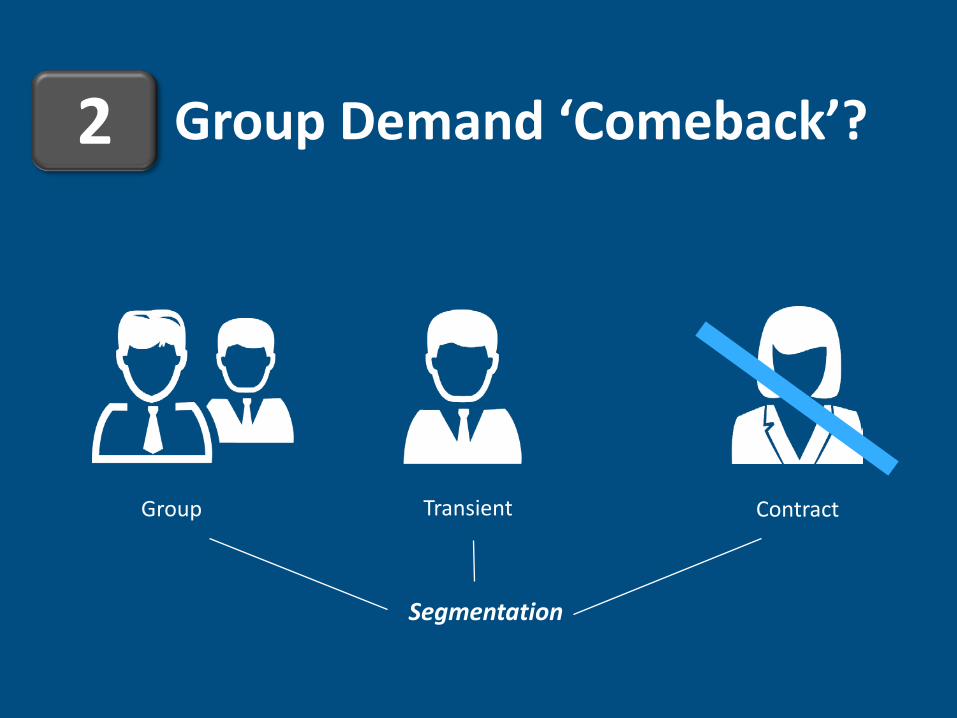
Group Demand ‘Comeback’?
Group Transient Contract
Segmentation
2
Group Demand ‘Comeback’?
Group Transient Contract
Segmentation
2

Total U.S.: Transient Occupancy Share Increases
43% 57%
Group
Transient
36% 64%
Transient and Group Occupancy as Share of Total OCC, 2005 and 2013 (Share does not include contract)
2005 2013

U.S. Transient and Group Occupancy Mix of Total OCC 2005 thru August 2014
Transient Continues To Grow Share of Occupancy
30%
40%
50%
60%
70%
2005 2007 2009 2011 2013
Group mix Trans Mix

Group Demand Is Roaring Back
-2%
-1%
1%
2%
3%
4%
5%
2012 2013 2014
Demand % Change ADR % Change
Group Demand and ADR % Change, 12 MMA, 1/2012 – 8/2014
*2013 Easter Comp
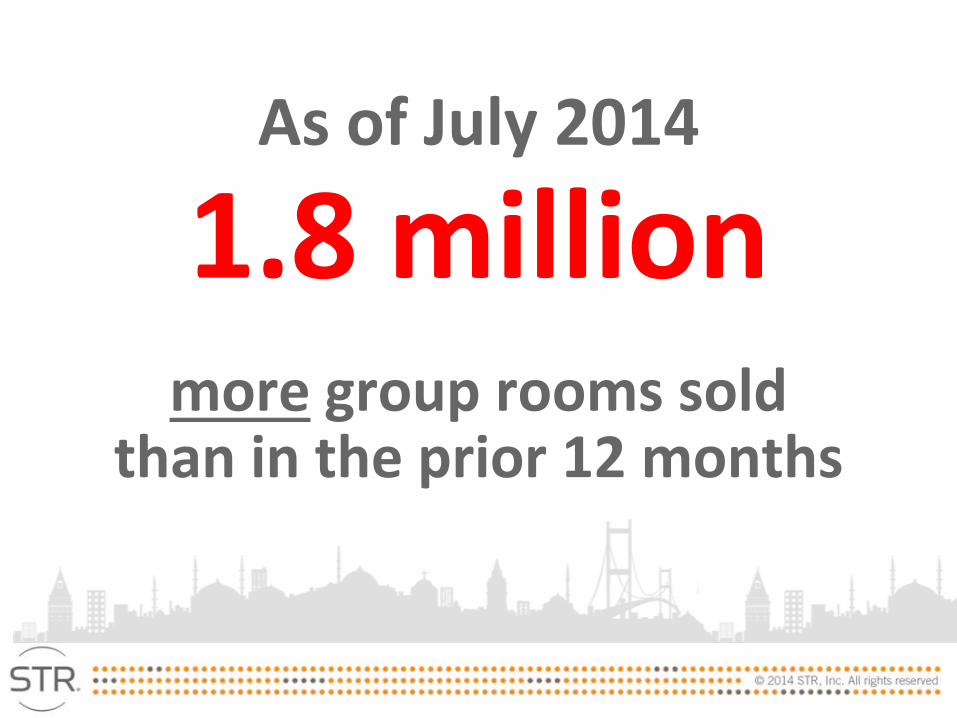
As of July 2014 1.8 million
more group rooms sold than in the prior 12 months

August 2014 Group ADR
4.1% Highest Monthly Group Rate
Growth This Year

What Do Meeting Planners Say?


Relative to Previous Years, was Attendance for your Largest Meeting…
46%
42%
46%
35% 36%
38%
19% 22%
16%
Overall Association Corporate
Up Unchanged Down
DestinationMAP 2013 Vol. 1; 40 North American Meeting Mkts; Largest meeting = 300+ attendees

DestinationMAP 2013 Vol. 1; 40 North American Meeting Mkts

What Planners Consider “Very Important” in Meeting Site Selection
57%
62%
62%
64%
64%
66%
73%
80%
81%
81%
81%
87%
Good restaurants
Attractiveness of conference hotels
Willing to make financial/other concessions
Number of hotel rooms available
Clean/attractive city
Security/crime rate
Good value for the money
Easy for delegates to get to
Convenient airline service
Travel costs to location
Food and lodging costs
Good hotels
DestinationMAP 2013 Vol. 1; 40 North American Meeting Mkts; Selection from 26 Characteristics

46% 57%
94%
2009 2011 2013
Wi-Fi Required for Largest Meeting Sees Exponential Growth
DestinationMAP 2013 Vol. 1; 40 North Am. Meeting Mkts; Largest =300+ attendees; Last 12 months

“Very Likely” Deterrents for Destination/City Site Selection
94% 89% 85%
61% 56% 51% 45%
44%
27% 20%
DestinationMAP 2013 Vol. 1; 40 North American Meeting Mkts; Selection from 22 Characteristics

DestinationMAP 2013 Vol. 1; 40 North American Meeting Mkts
High and Low Perception Ratings for 2013

3 U.S. Market Performance

August 2014 YTD RevPAR:
Market RevPAR %
Change Market RevPAR %
Change Nashville, TN 18.9 Maui Island, HI 1.9
Augusta, GA-SC 18.3 Central New Jersey 1.6 Denver, CO 16.5 Buffalo, NY 1.6
San Jose-Santa Cruz, CA 14.9 Connecticut Area 1.4 Fort Myers, FL 14.9 Oklahoma City, OK 1.3 Oakland, CA 14.6 New Jersey Shore 0.4
Sarasota-Bradenton, FL 14.3 Texas South 0 Las Vegas, NV 14.2 Long Island -1.3
Memphis, TN-AR-MS 14.1 North Dakota -1.7 Wyoming 13.6 Rochester, NY -2.7
Highest Growth Mkts Lowest Growth Mkts

August 2014 YTD ADR:
Market ADR % Change Market
ADR % Change
Nashville, TN 13.1 New York State 1.3 San Jose-Santa Cruz, CA 12.5 Texas South 1.3
San Francisco/San Mateo, CA 11.5 Milwaukee, WI 1.2 Florida Keys 10.5 California North Central 0.9 Oakland, CA 10.1 Philadelphia, PA-NJ 0.7 Denver, CO 8.4 Maryland Area 0.5 Seattle, WA 8.4 Harrisburg, PA -0.1 Portland, OR 7.7 Washington, DC-MD-VA -0.6 Boston, MA 7.5 North Dakota -1.3
Los Angeles-Long Beach, CA 7.5 Rochester, NY -1.8
Lowest Growth Mkts Highest Growth Mkts
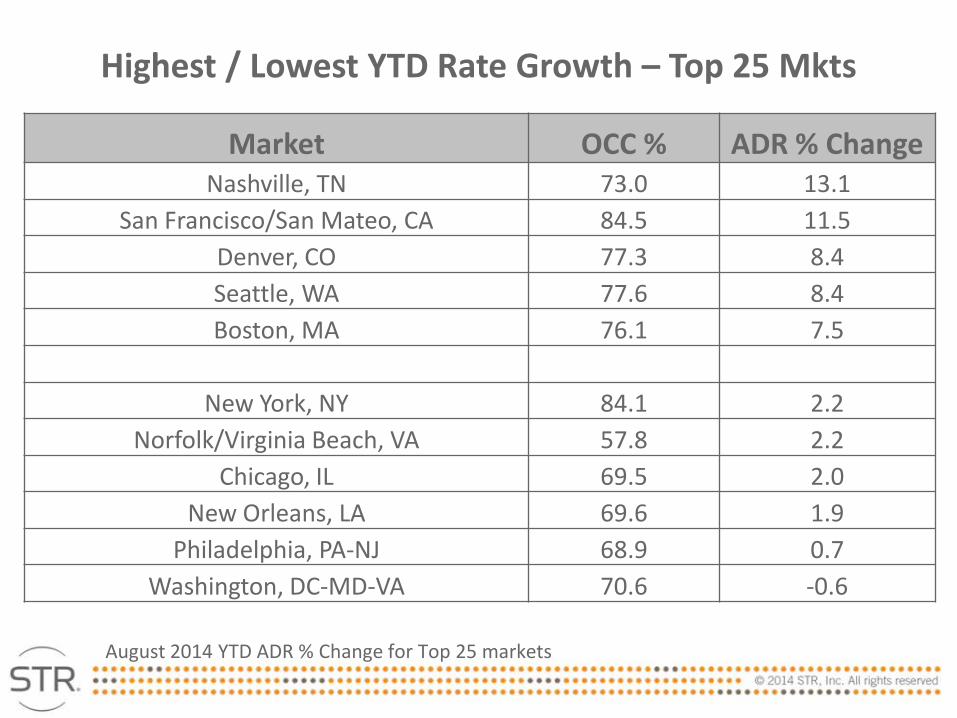
August 2014 YTD ADR % Change for Top 25 markets
Market OCC % ADR % Change Nashville, TN 73.0 13.1
San Francisco/San Mateo, CA 84.5 11.5 Denver, CO 77.3 8.4 Seattle, WA 77.6 8.4 Boston, MA 76.1 7.5
New York, NY 84.1 2.2 Norfolk/Virginia Beach, VA 57.8 2.2
Chicago, IL 69.5 2.0 New Orleans, LA 69.6 1.9
Philadelphia, PA-NJ 68.9 0.7 Washington, DC-MD-VA 70.6 -0.6
Highest / Lowest YTD Rate Growth – Top 25 Mkts

August 2014 YTD ADR % Change in Secondary Markets (26 – 50)
Market OCC % ADR % Change San Jose/Santa Cruz, CA 77.0 12.5
Oakland, CA 77.8 10.1 Portland, OR 73.6 7.7
Austin, TX 73.8 6.9 Fort Lauderdale, FL 79.9 6.5
Pittsburgh, PA 68.8 3.3 San Antonio, TX 67.3 2.8
Salt Lake City/Ogden, UT 68.2 2.7 Richmond/Petersburg, VA 61.6 2.1
Baltimore, MD 69.0 1.9
Highest / Lowest YTD Rate Growth – Secondary Mkts

Pipeline Accelerates
4

In Construction – Vertical construction on the physical building has begun. (This does not include construction on any sub-grade structures.) Final Planning – construction will begin within the next 12 months. Planning – construction will begin in more than 13 months. Unconfirmed (formerly Pre-Planning) - Potential projects that remain unconfirmed at this time.
Und
er C
ontr
act
STR Pipeline Phases U
nder
Con
trac
t

US Pipeline: Construction Accelerates, But Is Still Muted
Phase 2014 2013 % Change
In Construction 108 78 38%
Final Planning 123 125 -1%
Planning 159 141 12%
Under Contract 391 345 14%
Total US Pipeline, by Phase, ‘000s Rooms, August 2014 and 2013

Construction In Top 26 Markets: 16 With 2%+ Of Supply
US Pipeline, Top 26 Markets, U/C Rooms as % of Existing Supply, August 2014
Market Rooms U/C % Of Existing Las Vegas, NV 0.0%
Norfolk-Virginia Beach, VA 104 0.3% Tampa-St Petersburg, FL 211 0.5%
Orlando, FL 595 0.5% Oahu Island, HI 144 0.5%
San Francisco/San Mateo, CA 333 0.6% St Louis, MO-IL 255 0.7%
Atlanta, GA 852 0.9% Philadelphia, PA-NJ 521 1.1%
Detroit, MI 587 1.4% Phoenix, AZ 1,240 2.0% Chicago, IL 2,252 2.1%
New Orleans, LA 826 2.2% Minneapolis-St Paul, MN-WI 850 2.2% Los Angeles-Long Beach, CA 2,187 2.2%
San Diego, CA 1,381 2.3% Washington, DC-MD-VA 2,619 2.4%
Dallas, TX 1,974 2.5% Boston, MA 1,379 2.7% Denver, CO 1,250 2.9%
Nashville, TN 1,157 3.1% Anaheim-Santa Ana, CA 2,251 4.1%
Seattle, WA 1,918 4.7% Miami-Hialeah, FL 2,652 5.4%
Houston, TX 4,622 6.1% New York, NY 13,194 11.8%

Under Construction Rooms Mostly In Limited Service Segments
3.6
11.0
41.3
31.7
4.9 1.1
15.2
Luxury Upper Upscale
Upscale Upper Midscale
Midscale Economy Unaffiliated
US Pipeline, Rooms Under Construction , ‘000s Rooms, by Scale, August 2014
67%

Where Are We Headed? 5

Positive RevPAR Growth For The Foreseeable Future
-20
-15
-10
-5
0
5
10
1990 2000 2010
-16.8%
-2.6%
-10.1%
9% 8.6%
Total U.S., RevPAR % Change, 12 MMA 1/1990 – 8/2014
65 Months 46 Mo. 112 Months

Total United States Key Performance Indicator Outlook (% Change vs. Prior Year) 2014 – 2015 (As of August 12, 2014)
U.S. Outlook
2014 Forecast
2015 Forecast
Supply 1.0% 1.3%
Demand 3.6% 2.1%
Occupancy 2.6% 0.7%
ADR 4.2% 4.4%
RevPAR 6.9% 5.2%

2014 Year End Outlook
U.S. Chain Scales Occupancy
(% chg) ADR
(% chg) RevPAR (%chg)
Luxury -0.1% 4.6% 4.5%
Upper Upscale 2.0% 4.4% 6.5%
Upscale 2.0% 4.4% 6.5%
Upper Midscale 2.6% 3.3% 6.0%
Midscale 3.0% 3.5% 6.6%
Economy 2.9% 3.9% 6.8%
Independent 2.8% 4.6% 7.5%
Total United States 2.6% 4.2% 6.9%
As of August 12th , 2014
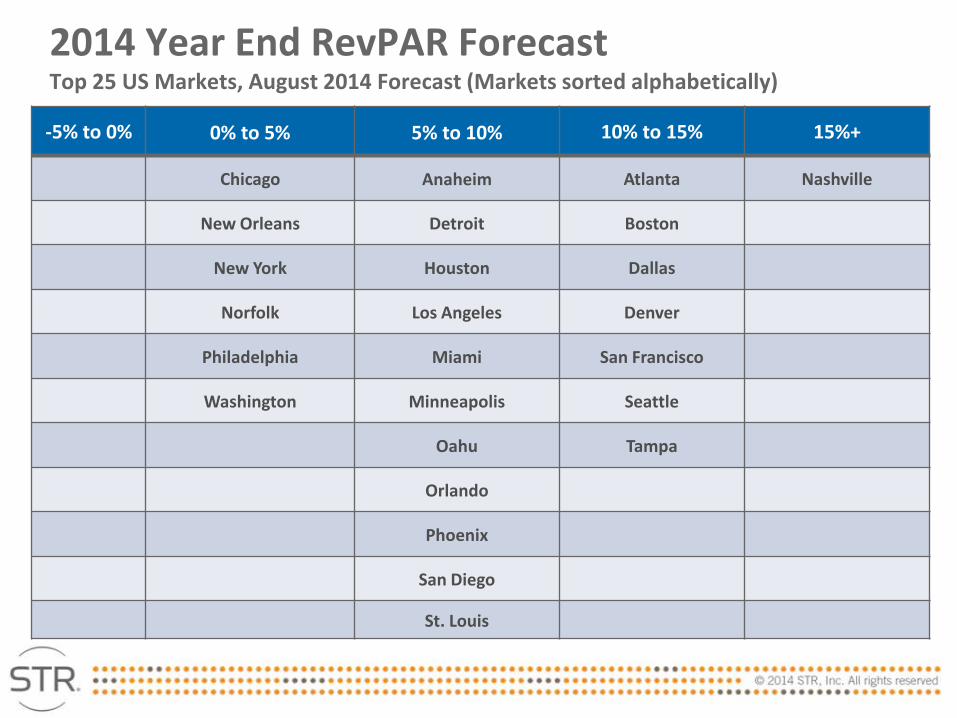
-5% to 0% 0% to 5% 5% to 10% 10% to 15% 15%+
Chicago Anaheim Atlanta Nashville
New Orleans Detroit Boston
New York Houston Dallas
Norfolk Los Angeles Denver
Philadelphia Miami San Francisco
Washington Minneapolis Seattle
Oahu Tampa
Orlando
Phoenix
San Diego
St. Louis
2014 Year End RevPAR Forecast Top 25 US Markets, August 2014 Forecast (Markets sorted alphabetically)

2015 Year End RevPAR Forecast Top 25 US Markets, August 2014 Forecast (Markets sorted alphabetically)
-5% to 0% 0% to 5% 5% to 10% 10% to 15% New York Atlanta Anaheim Nashville
New Orleans Boston Norfolk Chicago
Philadelphia Dallas Washington Denver
Detroit Houston
Los Angeles Miami
Minneapolis Oahu
Orlando Phoenix
San Diego San Francisco
Seattle St. Louis Tampa

To Recap…
• Life is Great! ‘Fish While the Fishing is Good’ • Demand Growth: Strong & Steady • Group Demand: Still Wild Card • Supply growth: Not an Issue, yet • YE RevPAR Forecast: Rosy!


@BrittanyB_STR
DMAI Blog Content


