House Dust Mites and the Built Environment: A Literature Review Prepared by David Crowther, Jane Horwood, and Nick Baker, The Martin Centre, Cambridge University David Thomson, Medical Entomology Centre, Cambridge Stephen Pretlove, School of Construction, South Bank University Ian Ridley and Tadj Oreszczyn, The Bartlett, University College London September 2000 Contents Background .................................................................................................................................................................... 1 1. HOUSE DUST MITE ECOLOGY .................................................................................................................... 2 1.1. The colonisation of buildings by HDMs ................................................................................................. 5 1.2. Methods of Control ..................................................................................................................................... 6 1.3. Sampling methods....................................................................................................................................... 8 2. HOUSE DUST MITE PHYSIOLOGY........................................................................................................... 10 2.1. General Ecology ........................................................................................................................................ 10 2.2. Relative Humidity ..................................................................................................................................... 11 2.3. Water Balance ............................................................................................................................................ 12 2.4. Influence of Temperature ......................................................................................................................... 15 2.5. The Bed Environment ............................................................................................................................... 16 3. HYGROTHERMAL ENVIRONMENT IN BEDS AND BEDDING...................................................... 19 3.1. Modelling ......................................................................................................................................................... 19 3.1.1. Beds ..................................................................................................................................................... 21 3.1.2. Bedrooms ........................................................................................................................................... 21 3.2. Human physiology in beds ...................................................................................................................... 22 3.3. Hygrothermal properties of beds and bedding ..................................................................................... 23 3.4. Monitored bedroom conditions............................................................................................................... 24 REFERENCES Background This is the first interim report for the EPSRC project “A Hygrothermal Model for Predicting House-Dust Mite Response to Environmental Conditions in Dwellings”. This report is a literature review divided into three sections, the first two review the house-dust mite physiology and ecology and the third reviews modelling and monitoring of the hygrothermal environment in beds and bedrooms. This report will remain as a working document throughout the two-year research project.
Transcript
House Dust Mites and the Built Environment:A Literature Review
Prepared byDavid Crowther, Jane Horwood, and Nick Baker, The Martin Centre, Cambridge University
David Thomson, Medical Entomology Centre, CambridgeStephen Pretlove, School of Construction, South Bank University
Ian Ridley and Tadj Oreszczyn, The Bartlett, University College London
September 2000
ContentsBackground.................................................................................................................................................................... 11. HOUSE DUST MITE ECOLOGY.................................................................................................................... 2
1.1. The colonisation of buildings by HDMs ................................................................................................. 51.2. Methods of Control ..................................................................................................................................... 61.3. Sampling methods....................................................................................................................................... 8
2. HOUSE DUST MITE PHYSIOLOGY........................................................................................................... 102.1. General Ecology ........................................................................................................................................ 102.2. Relative Humidity ..................................................................................................................................... 112.3. Water Balance ............................................................................................................................................ 122.4. Influence of Temperature ......................................................................................................................... 152.5. The Bed Environment............................................................................................................................... 16
3. HYGROTHERMAL ENVIRONMENT IN BEDS AND BEDDING...................................................... 193.1. Modelling ......................................................................................................................................................... 19
3.2. Human physiology in beds ...................................................................................................................... 223.3. Hygrothermal properties of beds and bedding..................................................................................... 233.4. Monitored bedroom conditions............................................................................................................... 24
REFERENCES
BackgroundThis is the first interim report for the EPSRC project “A Hygrothermal Model for Predicting House-DustMite Response to Environmental Conditions in Dwellings”. This report is a literature review divided intothree sections, the first two review the house-dust mite physiology and ecology and the third reviewsmodelling and monitoring of the hygrothermal environment in beds and bedrooms. This report willremain as a working document throughout the two-year research project.
10/10/02 Page 2
1. HOUSE DUST MITE ECOLOGY
Mites are arthropods within the class Arachnida (Figure 1). The term house dust mite generally refers to
those species belonging to the family Pyroglyphidae which is a member of the mite suborder, Astigmata.
Animalia
Phylum Arthropoda
Class Arachnida
Order Acari
Suborder Astigmata
Family Pyroglyphidae
Genus Dermatophagoides
Species pteronyssinus
Figure 1 Classification of the HDM Dermatophagoides pteronyssinus
In total 13 species have been found in house dust and recorded from locations throughout the world,
including the United States and Hawaii, Canada, Europe, Asia, the Middle East and parts of Australia,
South America and Africa (Blanco 1996; Colloff 1998). However, 3 species D. pteronyssinus (DP), D.
farinae (DF) and Euroglyphus maynei (EM) are most common comprising up to 90% of the HDM fauna
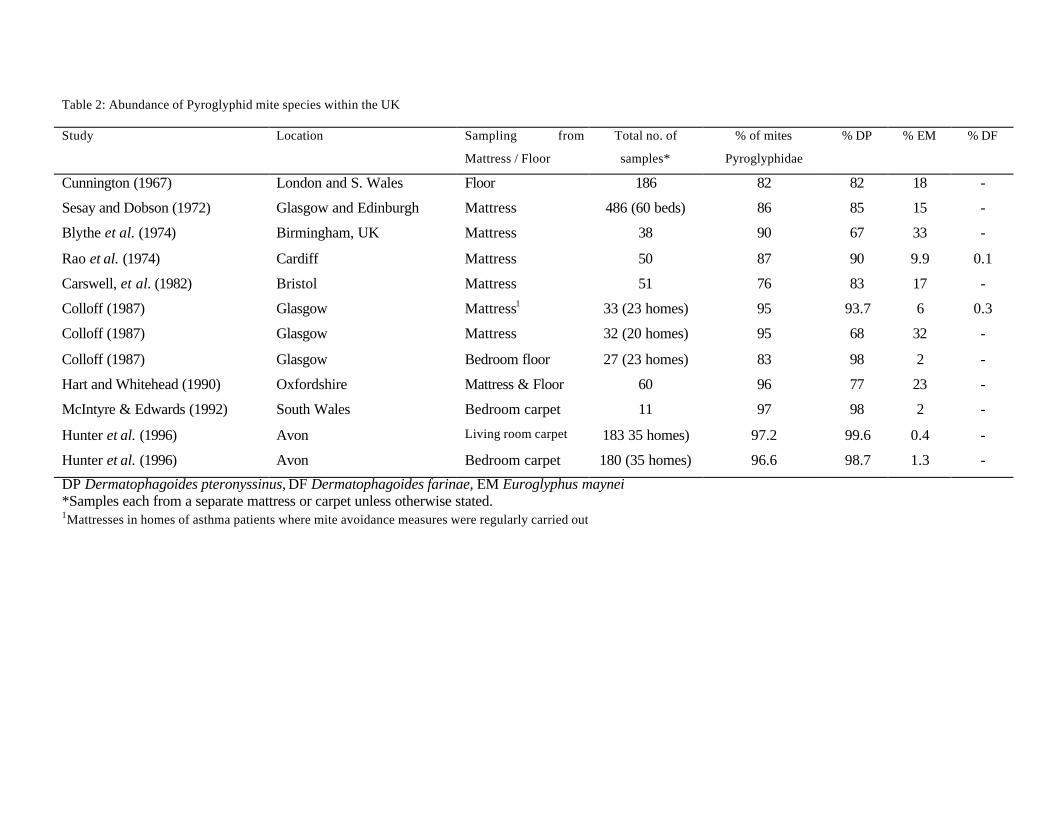
(Blythe et al. 1974; Blanco 1996). Other recorded species and their distributions are shown in Table 1. A
number of these species of HDM may be more widely distributed than is presently recorded, primarily
due to the lack of investigations in some areas of the world. Additional mites occurring in house dust are
the glistening mites (family Tarsonemidae), storage mites (families Acaridae, Glycyphagidae and
Chortoglyphidae) and the predatory mites (family Cheyletidae), however these groups will not be
examined in depth.
Despite their wide geographic range, there are differences in the distribution of common species (Table 1
- maps from Bronswijk 1981). In general DF is more commonly found in North America and other
regions with prolonged dry weather whilst DP is abundant in areas with constantly higher humidity such
as the UK (Platts-Mills and Chapman 1987). Within mattresses in homes in the UK, DP is usually the
most abundant mite species, followed by EM, although there is some variation in the proportions of these
two species (Table 2). For example Rao et al. (1975) found that 90% of the Pyroglyphid mites in their
samples from Cardiff were DP and 9.9% EM, compared with Blythe et al. (1974) who reported that only
67% of their Pyroglyphid mites were DP and the remaining 33% EM. In general studies have recorded
no DF in samples and speculate that conditions within the UK may be too cool and damp for the survival
of this species (Blythe et al. 1974; Abbott et al. 1981; Hart and Whitehead 1990; Wanner et al. 1993).
However, Rao et al. (1975) and Colloff (1987) both found a small number of this species although this
represented less than 0.5% of the total Pyroglyphidae collected. Walshaw and Evans (1987) stated that
there was a strong correlation between the density of EM within a mattress and the social class – with
increasing numbers as social class declined – however they did not examine this relationship with DP.
Colloff (1991a) also showed that EM occurred more frequently in samples from homes which he graded
as damp.
10/10/02 Page 3
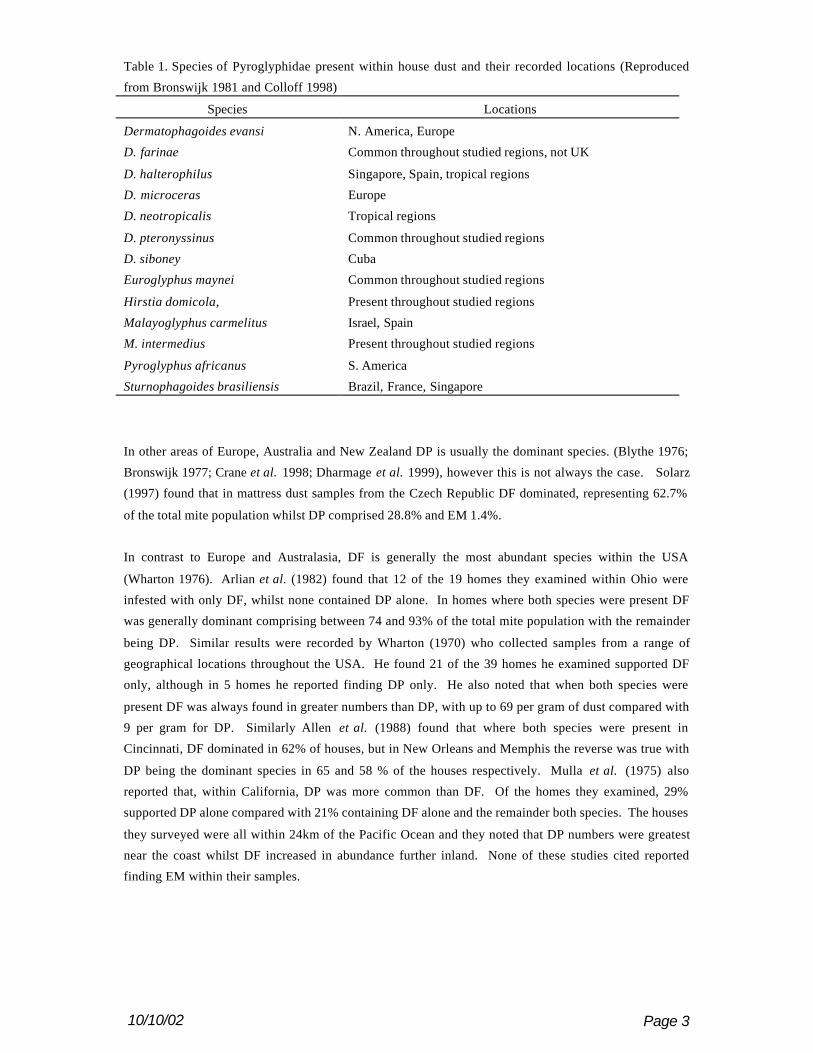
Table 1. Species of Pyroglyphidae present within house dust and their recorded locations (Reproduced
from Bronswijk 1981 and Colloff 1998)
Species Locations
Dermatophagoides evansi N. America, Europe
D. farinae Common throughout studied regions, not UK
D. halterophilus Singapore, Spain, tropical regions
D. microceras Europe
D. neotropicalis Tropical regions
D. pteronyssinus Common throughout studied regions
D. siboney Cuba
Euroglyphus maynei Common throughout studied regions
Hirstia domicola, Present throughout studied regions
Malayoglyphus carmelitus Israel, Spain
M. intermedius Present throughout studied regions
Pyroglyphus africanus S. America
Sturnophagoides brasiliensis Brazil, France, Singapore
In other areas of Europe, Australia and New Zealand DP is usually the dominant species. (Blythe 1976;
Bronswijk 1977; Crane et al. 1998; Dharmage et al. 1999), however this is not always the case. Solarz
(1997) found that in mattress dust samples from the Czech Republic DF dominated, representing 62.7%
of the total mite population whilst DP comprised 28.8% and EM 1.4%.
In contrast to Europe and Australasia, DF is generally the most abundant species within the USA
(Wharton 1976). Arlian et al. (1982) found that 12 of the 19 homes they examined within Ohio were
infested with only DF, whilst none contained DP alone. In homes where both species were present DF
was generally dominant comprising between 74 and 93% of the total mite population with the remainder
being DP. Similar results were recorded by Wharton (1970) who collected samples from a range of
geographical locations throughout the USA. He found 21 of the 39 homes he examined supported DF
only, although in 5 homes he reported finding DP only. He also noted that when both species were
present DF was always found in greater numbers than DP, with up to 69 per gram of dust compared with
9 per gram for DP. Similarly Allen et al. (1988) found that where both species were present in
Cincinnati, DF dominated in 62% of houses, but in New Orleans and Memphis the reverse was true with
DP being the dominant species in 65 and 58 % of the houses respectively. Mulla et al. (1975) also
reported that, within California, DP was more common than DF. Of the homes they examined, 29%
supported DP alone compared with 21% containing DF alone and the remainder both species. The houses
they surveyed were all within 24km of the Pacific Ocean and they noted that DP numbers were greatest
near the coast whilst DF increased in abundance further inland. None of these studies cited reported
finding EM within their samples.
10/10/02 Page 4
In addition to differences in distribution species may also show behavioural differences enabling them to
occupy different niches within the same habitat. For example Bronswijk (1981) reported findings from a
study by Wharton which noted that although DP and DF occupied the same niche DF tended to crawl on
top of the substrate whilst DP remained beneath it.
It is difficult to generalise about where HDMs are most abundant within houses since population size may
be influenced by a number of factors, including variations in the microclimatic conditions. However
mattresses are generally considered the main living and breeding ground for HDMs since they provide
ideal environmental conditions and a plentiful supply of food, but this is not always the case. Arlian et al.
(1982) found a living room carpet in Ohio, which supported a population of HDMs, primarily DF, seven
times larger than that found in the mattresses. Rao et al. (1975) also found 2 homes out of 35 in his UK
study where mite populations were higher on floors than in mattresses. However in the remaining 33
homes floor dust contained only 10% of the number of mites of mattress dust from the same house. The
species composition of mites within dust from the two samples was also shown to be considerably
different. DP were less abundant in floor dust, comprising only 66 % of the total population compared
with 90 % in mattress dust. Non pyroglyphid mites (e.g. Cheyletus) and unidentified specimens
accounted for 11 and 22 % of the total number of mites respectively. Colloff (1991a) also found
differences between floor dust and that on the surface of mattresses within the UK with EM being present
at a mean density of 34.4 mites m-2 mattresses compared to 5.6 mites m-2 in carpets. He speculates that
this may be due to mattresses retaining moisture for longer periods than carpets and therefore providing a
more suitable habitat for EM. The thickness of the mattress may also be a factor. Walshaw and Evans
(1987) found EM comprised 18% of the total mite population examined from living room carpets and
25% from bedroom carpets. In contrast to this Hunter et al. (1996) recorded a very low number of EM
within carpets and found that this species accounted for 0.4% of the total number of mites in the living
room carpet and 1.3% in the bedroom. Other soft furnishings may also support HDMs and Mitchell et al.
(1969) found that mite density was greater in frequently used furniture than pieces rarely used. This is
likely to be due to the greater number of skin scales supplying food for HDMs and the higher moisture
content of furniture which is used regularly.
In humid areas almost all homes may support HDMs whilst in drier climates and at higher altitudes fewer
homes contain mites and, when present, their population densities are lower (Spieksma 1971). Vervloet
et al. (1982), for example, found fewer house dust mites in high mountain areas of Switzerland where the
internal RH never exceeded 50 % at temperatures between 18 and 22ºC than in regions at lower altitude.
Since HDMs are not the only arthropods living in house dust it is likely that there is some interaction with
other species. Potential predators of HDMs include silverfish, dust lice, pseudoscorpions and other
predatory mites. The adults and deutonymphs of Cheyletus aversor, for example eliminated a well-
established culture of DF within 20 days (McGarth 1971 – cited from Bronswijk). However, this
particular species has not been reported as naturally occurring within house dust and Bronswijk et al.
(1971) found other Cheyletus spp. were unable to control HDM populations under laboratory conditions.
Typically cheyletid mites found in house dust (e.g. C. malaccensis) constitute only a small proportion of
the total number of mites and are present mainly in carpets rather than mattresses (Rao et al. 1975). In
comparison to HDMs their numbers are also lower than would be expected in a predator-prey population
equilibrium (Colloff 1991b) and they are therefore not suitable contenders for biological control.
10/10/02 Page 5
Previous studies have also suggested that in the absence of suitable prey, Chelytus mites may not only
bite humans in self-defence, but feed on their body fluids (Yoshikawa 1980; Htut 1994).
It is not known whether any factors limit the population size of HDMs within mattresses. The majority of
biological populations are limited by space, but this factor may not be of great importance for mites in
mattresses. It is known that HDMs and food are more common at the top surface of foam and sprung
mattresses (DeBoer and Kuller 1994; Hay 1995), however providing food is available and conditions are
suitable HDMs may be present throughout solid foam mattresses (DeBoer and Kuller 1994). If this were
the case the potential space for HDMs is vast in comparison to their size and, although such a factor
should be taken into consideration, it may therefore not be of importance in limiting their population size.
Predation, as discussed above, may have a small impact on HDM numbers in carpets, but is unlikely to be
a significant limiting factor in mattresses. Quantity of food is also unlikely to limit the HDMs population
size since a person typically produces 0.5-1g of dead skin per day whilst several thousand mites are able
to survive for months on just 0.25g of food (Korsgaard 1998). However, food quality may influence
population size since feeding rates and therefore nutritional uptake and reproduction are affected by the
moisture content of food (Arlian 1992). At high humidities moulds may also restrict the growth of HDM
populations either due to their physical presence or by producing toxins (Arlian et al. 1998, Asselt 1999).
It would therefore appear that the HDM population size will be primarily influenced by the physical
factors of temperature and humidity which are known to affect both reproduction and development rate
(Arlian et al. 1983; Arlian et al. 1998; See Physiology Review).
1.1. The colonisation of buildings by HDMs
The majority of Pyrogliphid mites are found exclusively on birds or within their nests. Of the 46
recognised species 62% are restricted to this habitat, whilst only 29% are found in house dust and just
13% exclusively so (Colloff 1991b). The nest dwelling species virtually all have restricted distributions
and are parasitic, unlike the ubiquitous, free living HDMs (Colloff 1998). It is likely that HDMs were
also originally nest dwellers that moved to occupy human beds at the time of the first settlements (Colloff
1998). They are generally found in houses that provide them with the humidity conditions they require
and are particularly prevalent in bedrooms. HDMs need some help to relocate and colonise new areas.
They may be moved between locations in infested furniture, use another animal species for transport
(phoresy) or be carried by humans and their pets. Bronswijk (1974) noted that clothing was often infested
with HDMs and in new buildings their populations did not become established until humans were present.
It is likely that complete colonisation of a new house with dust mites takes more than a year and numbers
may continue to increase for up to ten years due to the accumulation of dust (Bronswijk 1981). Initially
fungal feeding mites, springtails and dust lice will colonise new houses, but these will be succeeded by
HDMs as the house loses its initial moisture load following construction (Bronswijk 1981). Mulla et al.
(1975) reported a positive correlation between the age of a house and the number of mites in a mattress
whilst Hunter et al. (1996) found a higher number of mites in older carpets, although the relationship
between age and population size was not significant. In contrast to this Hart and Whitehead (1990) and
Solarz (1997) both showed no correlation between the age of carpets or mattresses and the number of
mites present. For example, Hart and Whitehead (1990) found a 6 month old mattress supported a
population of 318 mites per 0.1g of dust whilst a 25 year old mattress contained just 1 mite per 0.1g of
10/10/02 Page 6
dust. It was, however, noted that some mattresses were vacuumed which decreased the numbers of mites
and higher numbers of DP were present in homes over 10 years old compared with younger houses.
Differences between mite numbers in mattresses and carpets may be related to their age, but they will also
be influenced by a number of other factors such as room temperature, humidity, vacuuming and type of
mattress or carpet.
In addition to the time taken for mites to colonise houses and the increase in dust in older buildings,
HDMs may also be influenced by differences in building construction and occupant behaviour. Hart and
Whitehead (1990) suggest that more efficient insulation and central heating in newer homes creates a
warmer, drier environment which is detrimental to mite survival, however Korsgaard (1982) states that
modern homes which are more airtight increase indoor humidity thus favouring HDM populations. This
situation is exacerbated by the large quantities of water vapour emitted from the kitchen and bathroom,
often with insufficient ventilation. This may be particularly problematic where en suite bedroom facilities
are present (Whitrow 1993). Central heating has enabled the temperature within our homes to be raised,
whilst the increasing price of fuel has led to a reduction in ventilation by the addition of improved
insulation and double glazing designed to reduce drafts (Bronswijk 1981). This increased temperature
and production of water vapour provides ideal conditions for the proliferation of HDMs whilst
populations of other invertebrates have declined, therefore reducing the incidence of competition and
predation.
1.2. Methods of Control
Many studies have been carried out on methods to control and eradicate HDM populations. Strategies
have included vacuuming (Hughes and Maunsall 1973), encasing mattresses in plastic covers (Walshaw
and Evans 1986; Howarth et al. 1992), removing carpets (Dybendal et al. 1989), washing at high
temperatures (Andersen and Rosen 1989; McDonald and Tovey 1992), steam cleaning (Colloff et al.
1995), using electric blankets (Mosbech et al. 1988; DeBoer 1990), freezing with liquid nitrogen (Colloff
1986), spraying with acaricides (Le Mao et al. 1992) and using of dehumidifiers (Hyndman et al. 1997)
and mechanical ventilation systems (Harving et al. 1994; Fletcher et al. 1996). It would be almost
impossible to discuss all of these methods in depth and this review is therefore restricted to studies that
have attempted to control HDM populations by manipulating the temperature and humidity of their
environment.
Korsgaard (1983) demonstrated that within Denmark winter humidity was central to the survival of HDM
populations. By reducing humidity during these critical months the level of HDMs within a building
could be controlled. Hyndman et al. (1997) used a dehumidifier to decrease RH in bedrooms within the
UK during the period February to September, and showed that this significantly reduced HDM
populations in mattresses. However they concluded that mites may have moved deeper into the mattress
and were therefore not collected using their sampling method. Other studies using dehumidifiers have not
succeeded in reducing HMD populations within occupied houses (Yoshikawa et al. 1988; Custovic et al.
1995). However, the periods of such studies have been short and there may not have been sufficient time
for a reduction to occur. Yoshikawa et al. (1988), for example ran a dehumidifier for 10 hours per day for
2 months whilst Custovic et al. (1995) ran their study for 3 months.
10/10/02 Page 7
Mechanical ventilation with heat recovery (MVHR) units may also be used to reduce humidity. This
method consists of a heat exchanger and pump. Cold outside air is ducted into the building and warmed
using heat recovered from warm air that is going outside. Such a system allows the ventilation rate to be
controlled and may be used in conjunction with a dehumidifier.
A number of studies have shown that MVHR causes a significant reduction in HDM populations or
allergen concentration within Scandinavia (Korsgaard 1988; Harving et al. 1994; Wickman et al. 1994;
Emenius 1998). Here the dry cold winters are suited to this type of control, whilst in regions with
warmer, wetter winters this method may not be as successful. Within the UK results have been varied
with some studies reporting that MVHR had no influence on HDM numbers and others finding a
decrease. Fletcher et al. (1996) failed to demonstrate a significant reduction in mite numbers in North
West England by using MVHR, primarily because RH was rarely reduced to below 60%. Warner et al.
(2000), however did find that MVHR, coupled with daily vacuuming, reduced HDM populations and
allergen concentration, but not to a low enough level for there to be significant improvements in asthma
patients. Crane et al. (1998) found similar results in New Zealand where MHVR reduced humidity to
below CEH for only 39% of the time and did not significantly reduce the HDM population.
Other UK studies have shown there may be some benefit in installing MVHR. Within a laboratory study,
Htut et al. (1996) found that a MVHR unit exchanging air at a rate of approximately 3.5 air changes per
hour maintained the RH at, or below, CEH for a period of 8 weeks. During this time the population of
HDM was decreased to almost zero within 4 weeks. However, in subsequent summer months no
reduction in humidity was possible using MVHR and mites levels increased. McIntyre and Edwards
(1992) also found an overall reduction in HDM numbers within the bedroom carpet, although this too was
under winter conditions and they did not consider the mattress population where fluctuations in
temperature and humidity may still have favoured HDMs.
Other methods using changes in temperature and humidity to kill mites have also been attempted.
Mosbech et al. (1988) and DeBoer (1990) both attempted to reduce mite populations using electric
blankets (See The Bed Environment) whilst other studies have examined the effects of washing at high
temperatures. McDonald and Tovey (1992) found washing bedding at 55ºC killed all mites present whilst
reducing the temperature to 50ºC killed only half. Tovey and Woolcock (1994) demonstrated that
exposing carpets to sunlight for 6 hours created a microenvironment lethal to mites, and when dust was
removed from it and cultured no mites were present. Even a month later mite numbers were significantly
lower in treated carpet compared to untreated carpet. However, such a strategy would only be suitable in
warm climates and in houses where carpets or rugs could be removed. In Switzerland bedding is
traditionally aired out of the bedroom window during the day. This exposure to sunlight may have the
same effect in reducing mite numbers as Tovey and Woolcock (1994) have demonstrated in carpets.
It is likely that HDM control may not be achieved using only one of the methods outlined above, but will
need an integrated strategy combining changes in occupant behaviour with changes in the heating and
ventilation of the building, in particular the bedroom.
10/10/02 Page 8
1.3. Sampling methods
It is difficult to compare HDM counts from different studies since methods used for collection and
analysis of samples often vary.
Abbott et al. (1981) found brushing yielded significantly fewer mites than vacuuming for both mattress
and carpet samples. Blythe et al. (1974) found similar results, but also noted differences in mite
population structure with the smaller species and life cycle stages (larvae and nymphs) often being
underestimated in brushed samples. For example, in samples from the same bed they found 59
pyroglyphid mites per 0.1g of dust from a brushed sample of which 36% were EM compared to 498 mites
per 0.1g of dust , of which 74% were EM in vacuumed samples. More recently brushing has become a
redundant method and samples are generally collected by vacuuming. However, Bischoff et al. (1992)
reported that even vacuuming a 1m2 area of carpet for 2 minutes may removed only 10% of the HDM
population. Hay (1995) vacuumed the surface area of a sprung mattress and recorded a population
density of 3-46 living mites m-2, three orders of magnitude lower than the estimate of 8,200-26,800 m-2
obtained by extracting mites from a core taken from the upper 1.5cm of the same mattress. This
demonstrates, not only the inefficiency of vacuuming, but also that HDMs are not restricted to the
mattress surface.
Live mites will use their hooked legs to cling to the substrate on which they reside and, although repeated
vacuuming of an area has been shown to decrease the number of mites present (Hill 1998), it does not
remove all living individuals. Live mites can be removed by exploiting their natural response to changes
in light and humidity. To extract mites from textiles an adhesive film may be stuck to one side of the
surface area and heat applied to the other. As the temperature increases mites will migrate away from the
heat, since it decreases humidity, and towards the adhesive surface. The population of mites on the
adhesive film can then be counted. This method has been shown to remove up to 65% of live mites
present (Hill 1998). Tovey (Colloff 1991b) developed this method for use on surfaces where only one
side can be accessed. Instead of applying a strong source of heat to the underside of the surface a hot
water bottle is applied to the upper surface. The idea of this method is that the heat is mild so humidity is
not significantly decreased, but mite movement is increased therefore making them more likely to be
caught.
The application of heat can also be used to extract mites from precollected dust samples. Bronswijk
(1973) found a Tullgren funnel extracted 40-60% of live HDMs. This method samples only live mites in
a mobile state as opposed to other common extraction techniques such as flotation and suspension, which
collect all stages. However, it does enable mites to be kept alive.
Estimates of population size based on numbers of mites per unit weight of dust are difficult to compare
between habitats. Abbott et al. (1981), for example, reported that the surface of innersprung mattresses
yielded similar number of mites per gram of dust to foam mattresses 746 and 706 mites g-1 respectively.
However, when the number of mites m-2 was examined innersprung mattresses contained 2489 mites m-2
compared to only 720 mites m-2 in foam mattresses. This was due the mass of dust collected from the
innerspring mattresses being over three times greater than that from foam mattresses. Floor dust will, in
general, contain material that is heavier, such as sand and grit, than dust collected from a mattress and
comparison of such data will give misleading results. Blythe (1976) recorded 276 mites 0.1g -1 of dust in a
10/10/02 Page 9
mattress and 16.9 in a carpet. However when he expressed this as number of mites 100cm-2 the carpet
had higher numbers with 32 compared to 9.7 in the mattress. The number of mites per unit area is,
therefore, a more satisfactory measurement for mites collected in different locations (although this still
does not take into account the substrate thickness).
The position a sample is taken from may also influence the number of mites recovered. On mattresses it
is known that dust distribution, and therefore the presence of HDMs, is influenced by the pattern of seams
and buttons. For example, Blythe (1976) sampled a 10 x 10cm square of mattress with a seam running
across the centre and found that over 80% of the mite population was collected from within 0.5cm of the
seam.
10/10/02 Page 10
2. HOUSE DUST MITE PHYSIOLOGY
The majority of work discussed below has been conducted under steady state laboratory conditions using
cultured populations of house dust mites (HDMs). These have been maintained on a highly nutritious
diet, under optimum conditions and results may therefore not be comparable to similar experiments on
‘wild’ HDMs. This is supported by Colloff (1987) who found significant differences between the
development of eggs from laboratory and ‘wild’ HDM populations. In cool, dry conditions (20°C, 60%
RH) laboratory eggs took longer to develop and mortality due to dehydration was 7 times higher than
‘wild’ eggs which appeared to be resistant to dehydration under these conditions. However, in warm,
semi-humid conditions (30°C, 80% RH) eggs from the laboratory took less time to develop than ‘wild’
eggs and mortality was 4 times lower.
A considerable amount of research has concentrated on the American house dust mite, Dermatophagoides
farinae (DF), however wherever possible this review concerns work conducted on the European mite D.
pteronyssinus (DP).
2.1. General EcologyDP females weigh approximately 5.8 ± 0.2µg (fresh weight) whilst males are approximately half the size,
3.5 ± 0.2µg. A total of 72 and 74% of male and female weight is water, respectively (Arlian 1975a). Due
to their large surface area to volume ratio the loss of water from the HDMs body surface by evaporation is
a problem. However, they minimise this loss by having an impermeable exoskeleton and reducing water
loss associated with body processes (See Water Balance)
At optimal conditions (23°C, 75% RH) development from egg to adult (DP) takes approximately 1
month. The duration of each developmental stage and the period of the quiescent phases are shown in
Figure 2. Arlian et al. (1990) found no significant difference between development time of males and
females, the lifespan of adult males was found to be 77 days compared with 45 for unmated adult females
and 31 for mated adult females. At the end of each intervening active stage is a quiescent period lasting a
third to half of the time of that life stage (Arlian et al. 1990).
During their adult lifespan DP females have been shown to produce between 40 and 80 eggs (Colloff
1987). DF females are able to live considerably longer than DP (100 and 31 days respectively), due to an
extended post egg period. However, the reproductive period and number of eggs produced were similar
for both species. After death the bodies of HDMs desiccate and are present as crisp, flattened flakes.
They are persistent and often comprise up to 80% of the total mattress population.
There is some contention about whether DP forms a quiescent protonymph stage similar to the
overwintering stage in DF. DeBoer and Kuller (1997) state that the quiescent stages within DP are
“Relatively brief and never (as far as we know) prolonged”. In a later paper DeBoer et al. (1998)
reported that in the carpeted ground floor of Dutch houses, where temperature fluctuated around 16°C,
DP adults remained active throughout the winter. Their population the following Spring was then built
from these mature mites, rather than quiescent protonymphs. Eggs of DP have also been shown to remain
viable after 7 months at 10°C, 60% RH and may therefore survive overwintering (Colloff 1987).
However, Arlian et al. (1983) considered the seasonal dynamics of both Dermatophagoides species
together. They found a seasonal variation in lifestages present with an increase in tritonymphs during
10/10/02 Page 11
Spring followed by an increase in larvae as adults developed and their eggs hatched. However 63% of the
homes they investigated were infested only with DF and none with only DP (Arlian et al. 1982). The
increase in tritonymphs they observed during Spring may be due to DF being the dominant species and
overwintering as a quiescent protonymph. In their work on the development of DP at different humidities
Arlian et al. (1990) found quiescent protonymphs were not formed even at low humidities. However, the
conditions under which their mites developed were otherwise favourable and the food supplied was
highly nutritious (animal protein and yeast). They therefore suggest that the possibility should not be
ruled out of an extended quiescent protonymph stage being triggered in certain circumstances, such as a
combination of unfavourable RH, temperature, crowding and food supply.
If DP can form a prolonged quiescent protonymph stage, as in DF, this would ensure its survival during
adverse conditions. The quiescent protonymph of DF consumes 28.5 times less oxygen per hour than an
active protonymph and has a half life of water exchange of almost 160 days, compared to just 20 hours
for an active protonymph and 28 hours for an adult (Arlian et al. 1983).
Pollen, spores of microorganisms, fungal mycelia, bacteria and skin scales have all been found in the gut
of Dermatophagoides spp. (Bronswijk 1973). Several thousand mites are able to survive for months on
0.25g of food and since a person typically produces 0.5-1g of dead skin per day food quantity is not a
limiting factor in mite growth and development (Korsgaard 1998). However, freshly shed skin may be
dry and indigestible and mites therefore prefer older skin scales with a higher moisture content (Maunder
1990). Bronswijk (1981) reported that DP grew better on skin which had previously been partially
digested by Aspergillus amstelodami than skin with no fungal treatment whilst Douglas and Hart (1989)
concluded that no experimental studies provided definite evidence of this. However, they did show that
small quantities of A. penicilloides may be of nutritional value as a source of nutrients (Douglas and Hart
1989; Asselt 1999).
2.2. Relative HumidityRelative humidity (RH) is an important factor affecting HDM reproduction and survival. Critical
Equilibrium Humidity (CEH), for DP, is 73% at 25°C, below which transpiration of water from the mite
to the atmosphere is greater than the sorption of water by the mite from the atmosphere and dehydration
occurs (Arlian 1992). Above CEH water is gained by sorption and an active mechanism (See Water
Balance). Arlian (1975b) suggests that CEH is not a single value, but is more likely to cover a range of
humidities across a transition period during which gradual physiological changes occur to maintain water
balance.
A low RH may cause a decline in the HDM population. At 40-50% RH individual adults survived for no
longer than 8-11 days, however a population consisting of all life stages survived for 10 weeks, but
decreased in numbers (Arlian et al. 1998). Increasing RH to above 85% may also be detrimental to mite
populations. Mould growth under these conditions may inhibit mite survival either directly due to its
physical presence or via the production of toxins (Arlian et al. 1998, Asselt 1999). A fluctuating
environment with periods of high RH to maintain their water balance and low RH to minimise mould
growth may therefore be preferred by mites (Arlian et al. 1999).
10/10/02 Page 12
A number of studies performed in situ measure RH or temperature at a single point in space and at set
times during the day (e.g. Korsgaard 1983) or consider mean readings over a period of time (e.g. Arlian et
al. 1983; Htut et al. 1996). Such measurements may not be good indicators of mite survival since CEH
needs only to be exceeded for part of the day to enable egg production and a population increase to occur.
If only mean values for RH and temperature are recorded these periods of optimal conditions may be
overlooked. DeBoer et al. (1998) found DP populations survived for 10 weeks at 16°C when 1.5 hours of
moist air (76%) was given to them per day (remainder of the day 36%), although egg production did not
occur unless the period of most air was increased to at least 3 hours and a population expansion was not
possible until 6 hours of moist air was given. Decreasing the period of moist air caused the egg to adult
development time to increase (Arlian et al. 1998). For example, when DF eggs were exposed to 75 % RH
for 8 hours and 0 % RH for the remainder of the day development from egg to adult took 69 days
compared to 44 days when exposed to 75 % for 24 hours. This increased development time would lead to
a decline in population levels and therefore a decrease in faecal pellets and allergen.
Adult male HDMs have a higher water turnover rate and are more susceptible to death at dehydrating
conditions than females (Arlian 1975a). They have been shown to cluster in groups of 5 to 25 to decrease
their surface area to volume ratio and minimise water loss. Glass et al. (1998) found isolated males lost
2.63% of their body water per hour compared to 1.48% when clustered in a group of 6. Arlian et al.
(1998) reported differences in the sex ratio of HDMs depending on the RH under which populations
developed. At a constant 75% RH male to female ratio was approximately 50:50, but when RH was 75%
for 8 hours per day and 0% for the remainder of time three quarters of the eggs developed into males.
Females are more resilient at low RHs than males and are therefore more likely to survive a reduced RH.
This shift towards the production of males may therefore be a mechanism to maintain an even sex ratio.
Bronswijk (1973) showed seasonal fluctuations in the abundance of HDMs mirrored changes in the
absolute indoor and outdoor humidities (Figure 3) whilst Arlian et al. (1983) found a significant
correlation between mite abundance and RH (p<0.01). In both cases increased populations occurred
during periods of increased humidity. During the humid summer months Arlian et al. (1983) found live
mites constituted 90% of the population compared with less than 50% during winter. Korsgaard (1983)
demonstrated that humidity levels during the winter months were critical in controlling HDMs. His study
showed homes with very few mites during the winter months also had low counts during other seasons
despite an increased humidity. In general HDM populations within the UK have been shown to peak
during late summer (Blythe 1976; Hunter et al. 1996 ). However, although Carswell et al. (1982)
recorded a peak in EM abundance at this time of year, DP reached its maximum population between
March and May.
At a microclimate level mite survival is not dependent on absolute humidity. At 20°C, 79% RH and
27°C, 56% RH the absolute humidity is equal, but under the latter conditions mites die.
2.3. Water BalanceHDMs obtain their water in 4 ways:-
1. Ingestion with food,
2. Production of metabolic water from the oxidation of carbohydrates and fats,
3. Passive absorption,
4. Active absorption from unsaturated air via the “pump” (see below).
10/10/02 Page 13
Water is simultaneously lost:-
1. By transpiration or evaporation to ambient air from the pump,
2. By evaporation through the permeable surfaces of the body,
3. In digestive secretions and reproductive fluids,
4. During other functions such as feeding, excretion and oviposition (Arlian 1992).
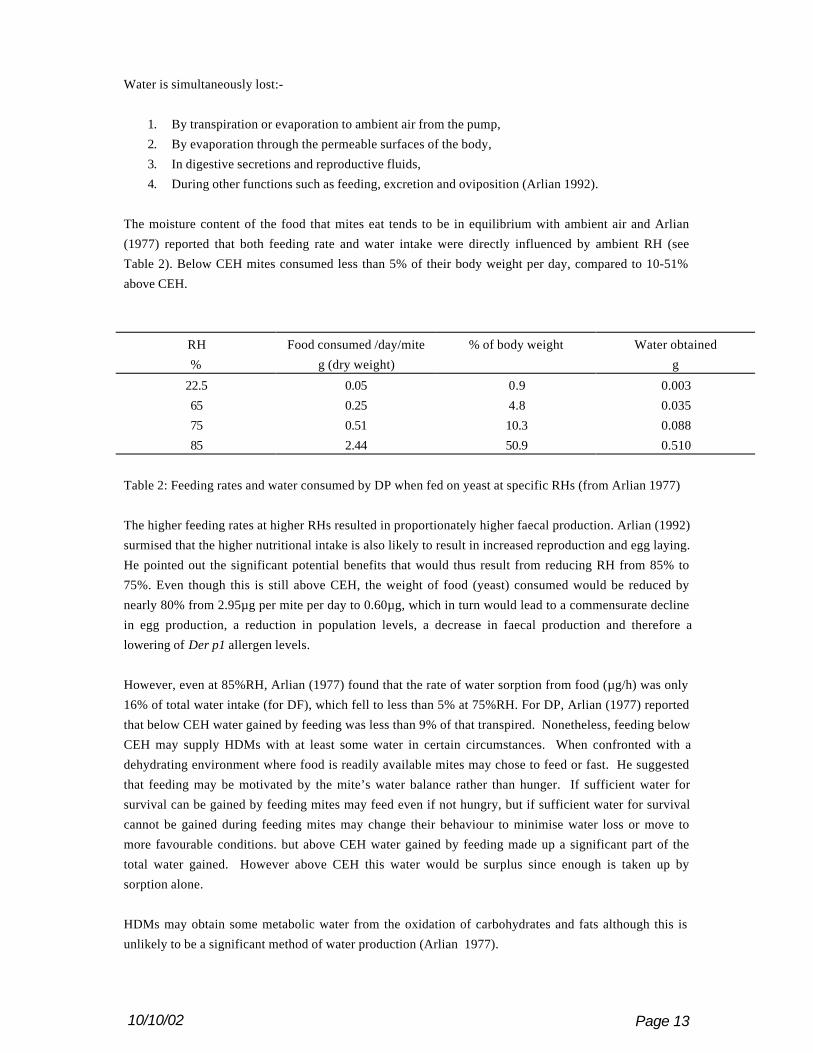
The moisture content of the food that mites eat tends to be in equilibrium with ambient air and Arlian
(1977) reported that both feeding rate and water intake were directly influenced by ambient RH (see
Table 2). Below CEH mites consumed less than 5% of their body weight per day, compared to 10-51%
above CEH.
RH Food consumed /day/mite % of body weight Water obtained
% g (dry weight) g
22.5 0.05 0.9 0.003
65 0.25 4.8 0.035
75 0.51 10.3 0.088
85 2.44 50.9 0.510
Table 2: Feeding rates and water consumed by DP when fed on yeast at specific RHs (from Arlian 1977)
The higher feeding rates at higher RHs resulted in proportionately higher faecal production. Arlian (1992)
surmised that the higher nutritional intake is also likely to result in increased reproduction and egg laying.
He pointed out the significant potential benefits that would thus result from reducing RH from 85% to
75%. Even though this is still above CEH, the weight of food (yeast) consumed would be reduced by
nearly 80% from 2.95µg per mite per day to 0.60µg, which in turn would lead to a commensurate decline
in egg production, a reduction in population levels, a decrease in faecal production and therefore a
lowering of Der p1 allergen levels.
However, even at 85%RH, Arlian (1977) found that the rate of water sorption from food (µg/h) was only
16% of total water intake (for DF), which fell to less than 5% at 75%RH. For DP, Arlian (1977) reported
that below CEH water gained by feeding was less than 9% of that transpired. Nonetheless, feeding below
CEH may supply HDMs with at least some water in certain circumstances. When confronted with a
dehydrating environment where food is readily available mites may chose to feed or fast. He suggested
that feeding may be motivated by the mite’s water balance rather than hunger. If sufficient water for
survival can be gained by feeding mites may feed even if not hungry, but if sufficient water for survival
cannot be gained during feeding mites may change their behaviour to minimise water loss or move to
more favourable conditions. but above CEH water gained by feeding made up a significant part of the
total water gained. However above CEH this water would be surplus since enough is taken up by
sorption alone.
HDMs may obtain some metabolic water from the oxidation of carbohydrates and fats although this is
unlikely to be a significant method of water production (Arlian 1977).
10/10/02 Page 14
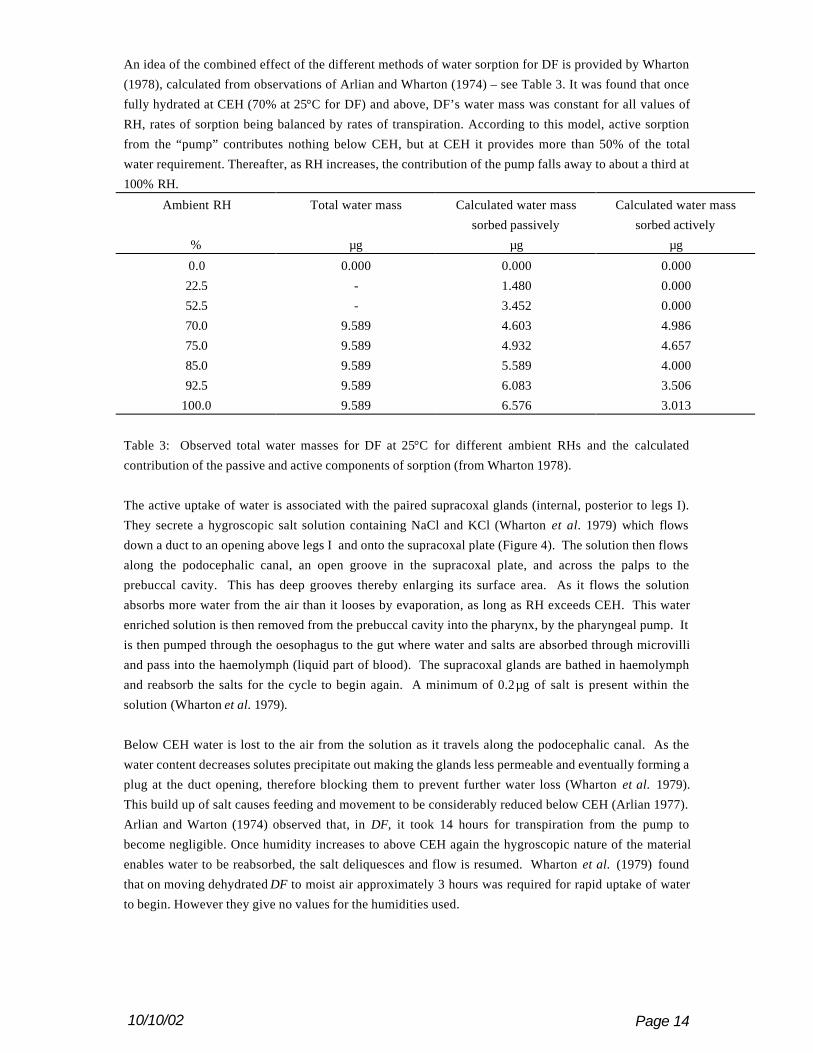
An idea of the combined effect of the different methods of water sorption for DF is provided by Wharton
(1978), calculated from observations of Arlian and Wharton (1974) – see Table 3. It was found that once
fully hydrated at CEH (70% at 25°C for DF) and above, DF’s water mass was constant for all values of
RH, rates of sorption being balanced by rates of transpiration. According to this model, active sorption
from the “pump” contributes nothing below CEH, but at CEH it provides more than 50% of the total
water requirement. Thereafter, as RH increases, the contribution of the pump falls away to about a third at
100% RH.
Ambient RH Total water mass Calculated water mass
sorbed passively
Calculated water mass
sorbed actively
% µg µg µg
0.0 0.000 0.000 0.000
22.5 - 1.480 0.000
52.5 - 3.452 0.000
70.0 9.589 4.603 4.986
75.0 9.589 4.932 4.657
85.0 9.589 5.589 4.000
92.5 9.589 6.083 3.506
100.0 9.589 6.576 3.013
Table 3: Observed total water masses for DF at 25°C for different ambient RHs and the calculated
contribution of the passive and active components of sorption (from Wharton 1978).
The active uptake of water is associated with the paired supracoxal glands (internal, posterior to legs I).
They secrete a hygroscopic salt solution containing NaCl and KCl (Wharton et al. 1979) which flows
down a duct to an opening above legs I and onto the supracoxal plate (Figure 4). The solution then flows
along the podocephalic canal, an open groove in the supracoxal plate, and across the palps to the
prebuccal cavity. This has deep grooves thereby enlarging its surface area. As it flows the solution
absorbs more water from the air than it looses by evaporation, as long as RH exceeds CEH. This water
enriched solution is then removed from the prebuccal cavity into the pharynx, by the pharyngeal pump. It
is then pumped through the oesophagus to the gut where water and salts are absorbed through microvilli
and pass into the haemolymph (liquid part of blood). The supracoxal glands are bathed in haemolymph
and reabsorb the salts for the cycle to begin again. A minimum of 0.2µg of salt is present within the
solution (Wharton et al. 1979).
Below CEH water is lost to the air from the solution as it travels along the podocephalic canal. As the
water content decreases solutes precipitate out making the glands less permeable and eventually forming a
plug at the duct opening, therefore blocking them to prevent further water loss (Wharton et al. 1979).
This build up of salt causes feeding and movement to be considerably reduced below CEH (Arlian 1977).
Arlian and Warton (1974) observed that, in DF, it took 14 hours for transpiration from the pump to
become negligible. Once humidity increases to above CEH again the hygroscopic nature of the material
enables water to be reabsorbed, the salt deliquesces and flow is resumed. Wharton et al. (1979) found
that on moving dehydrated DF to moist air approximately 3 hours was required for rapid uptake of water
to begin. However they give no values for the humidities used.
10/10/02 Page 15
When water losses and gains within the HDM are equal their water mass remains constant. However, a
net loss of water will occur when transpiration is greater than sorption and a net gain of water when
sorption exceeds transpiration. Arlian and Wharton (1974) noted that when DF was kept above CEH the
pump operated at full capacity, below this value it cut off completely. Above CEH the uptake of water, at
a constant temperature, is proportional to RH since it is dependent on the number of water molecules
present in the air. Therefore predessicated mites will rehydrate faster at 95% RH than 70% RH (Arlian
1992). The loss of water is unrelated to RH, but is a fixed percentage of the volume of water remaining
within the body and the permeability of the cuticle (Arlian and Wharton 1974). However, above CEH
transpiration appears to be proportional to RH as it compensates for water sorption.
When mites containing tritiated water are exposed to non-tritiated atmospheres at low RH their tritium
content has been shown to decrease more rapidly during the initial hours than later hours (Wharton 1978).
Below the CEH there are, in effect, 2 water compartments within HDMs which lose water at different
rates – a small compartment (water in the pump) which loses water rapidly to enable waterproofing to
commence and a larger, slow compartment (water in the main body) (Figure 5). A fully hydrated female
contains approximately 9.6µg of water, of which 3µg is present in the small compartment (Arlian and
Wharton 1974; Wharton et al. 1979).
Above CEH the pump and body function as a single water compartment and water is no longer lost from
the pump. However, 2 compartments have been identified at both 40 and 75% RH in DP, despite 75%
being above CEH and therefore a humidity at which water should not be lost from the pump (Arlian
1975b). It may be that 75% RH is so close to CEH that the pump is not fully functioning. This supports
the idea that there is a range of RHs over which an organism makes physiological changes to maintain its
water balance, rather than a single CEH value.
Active life stages of the HDM are able to actively extract water from unsaturated air to replace that lost
from the body, provided RH exceeds their CEH. The energy expenditure to maintain water balance is
relatively small. For example, in order to sorb water at 8µghr-1 DF uses 0.08-0.12% of the calories it
generates at 25°C, 75% RH (Arlian 1975b). If RH is increased a lower % of calories are used since the
vapour pressure against which water must be moved is lower.
Under dehydrating conditions HDMs show a reduction in oxygen consumption which is greater than the
decrease accounted for by reduced activity at these RHs. Gaseous exchange is likely to occur across the
same surface as water exchange and, since these surfaces become waterproofed at low RHs there is a
reduction in gas exchange and an associated decrease in oxygen consumption (Arlian 1975a).
2.4. Influence of Temperature
A decrease in temperature leads to an increase in mean development time of HDMs at all stages of the
life cycle as shown in Figure 6 (Arlian et al. 1983; Colloff 1987). Increasing the temperature from 23 to
35°C has been shown to accelerate development by 2.3 times (Arlian et al. 1990). Despite this, greatest
population growth for DP occurs at 25°C and 75% RH since higher temperatures also affect other
survival factors. At 35°C, for example, both fecundity and longevity were significantly reduced
compared with 23°C (Arlian et al. 1990).
10/10/02 Page 16
Extremes of temperature may have adverse effects on a population. Periods at very high temperatures,
e.g. 6 hours at 51°C or 24 hours at 45°C (both at 60% RH) will cause the death of DP (Kinnaird 1974).
However this species is relatively resistant to low temperatures with a 6 hour exposure at -15°C resulting
in only 60% mortality (compared with 100% mortality in DF) and 100% mortality not occurring till -
28°C. Increasing the time of exposure to cold conditions causes an increase in mortality, with only 15%
of individuals surviving following a 3 week exposure at -1°C (Bronswijk 1981).
Arlian and Dippold (1996) examined the effect of temperature on the life cycle of DF and compared it to
a similar study on DP (Arlian et al 1990). They found that DP was able to develop under a far wider
range of temperatures than DF. Both species were able to develop at 25 and 30°C, but at 16°C only 2%
of DF developed compared with 59% of DP whilst at 35°C development was 15 and 87% respectively.
As temperature increases CEH also rises (Arlian and Veselica 1981). This is likely to be the result of the
properties of the hygroscopic solution of NaCl/KCl and the fact that its saturated vapour pressure is
different at different temperatures (See Appendix – to follow). Varying temperatures also affect the
permeability of the transpiration surfaces with the cuticle being more permeable and therefore losing
water more rapidly at higher temperatures (Arlian and Veselica 1982). It is possible that transpiration is
more affected by temperature than the active mechanism. However, this has not been studied in depth.
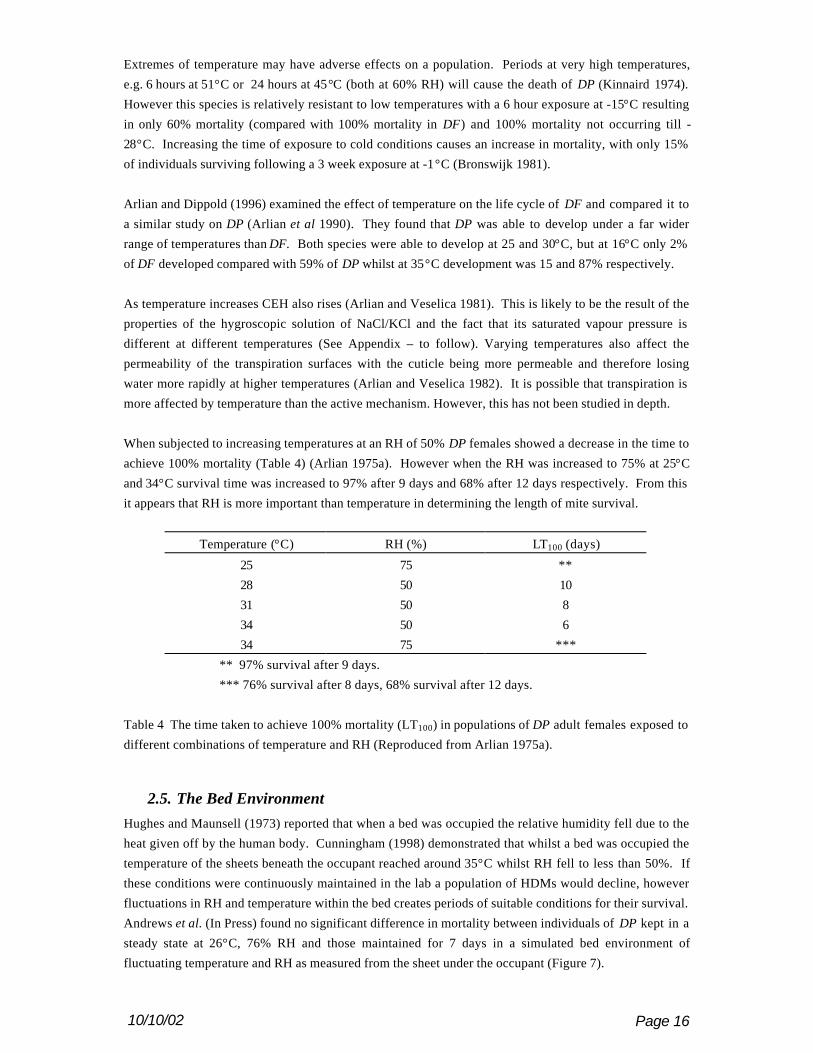
When subjected to increasing temperatures at an RH of 50% DP females showed a decrease in the time to
achieve 100% mortality (Table 4) (Arlian 1975a). However when the RH was increased to 75% at 25°C
and 34°C survival time was increased to 97% after 9 days and 68% after 12 days respectively. From this
it appears that RH is more important than temperature in determining the length of mite survival.
Temperature (°C) RH (%) LT100 (days)
25 75 **
28 50 10
31 50 8
34 50 6
34 75 ***
** 97% survival after 9 days.
*** 76% survival after 8 days, 68% survival after 12 days.
Table 4 The time taken to achieve 100% mortality (LT100) in populations of DP adult females exposed to
different combinations of temperature and RH (Reproduced from Arlian 1975a).
2.5. The Bed EnvironmentHughes and Maunsell (1973) reported that when a bed was occupied the relative humidity fell due to the
heat given off by the human body. Cunningham (1998) demonstrated that whilst a bed was occupied the
temperature of the sheets beneath the occupant reached around 35°C whilst RH fell to less than 50%. If
these conditions were continuously maintained in the lab a population of HDMs would decline, however
fluctuations in RH and temperature within the bed creates periods of suitable conditions for their survival.
Andrews et al. (In Press) found no significant difference in mortality between individuals of DP kept in a
steady state at 26°C, 76% RH and those maintained for 7 days in a simulated bed environment of
fluctuating temperature and RH as measured from the sheet under the occupant (Figure 7).
10/10/02 Page 17
DeBoer and Kuller (1997) measured changes in temperature and RH of a mattress before, during and after
a bed was occupied for 90 minutes (Figure 8). When the bed was unoccupied RH 4.5cm under the upper
surface of the mattress was above CEH therefore enabling mite survival. However, once the bed was
occupied temperature immediately under the occupant increased and, even with the extra moisture from
the occupant, there was insufficient to maintain the RH above CEH due to the increase in temperature.
The bed immediately under the occupant therefore appeared to be more suitable for mites when
unoccupied. Once the person leaves the temperature decreases and excess moisture from their presence
may provide a period of high RH sufficient for egg production and development (3 hours; DeBoer et al.
1998) even if it subsequently declines to below CEH. Therefore although the bed is unsuitable whilst
occupied it is the presence of a body for a period of time which creates an optimum habitat.
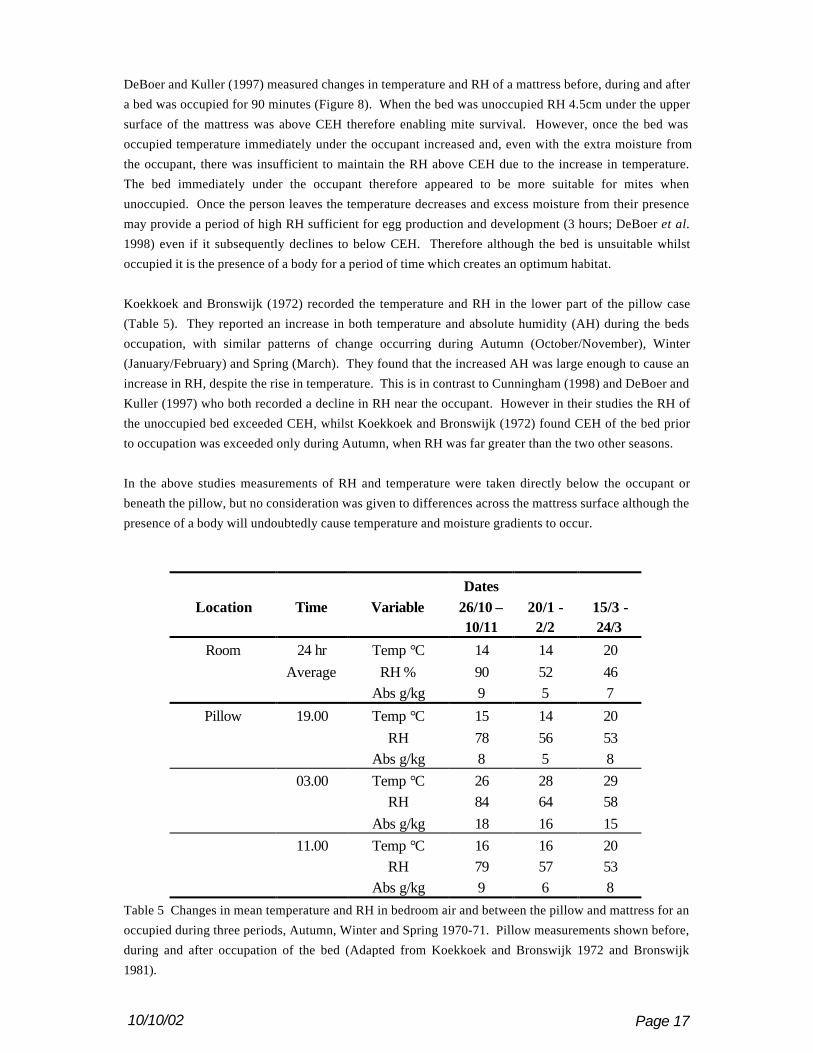
Koekkoek and Bronswijk (1972) recorded the temperature and RH in the lower part of the pillow case
(Table 5). They reported an increase in both temperature and absolute humidity (AH) during the beds
occupation, with similar patterns of change occurring during Autumn (October/November), Winter
(January/February) and Spring (March). They found that the increased AH was large enough to cause an
increase in RH, despite the rise in temperature. This is in contrast to Cunningham (1998) and DeBoer and
Kuller (1997) who both recorded a decline in RH near the occupant. However in their studies the RH of
the unoccupied bed exceeded CEH, whilst Koekkoek and Bronswijk (1972) found CEH of the bed prior
to occupation was exceeded only during Autumn, when RH was far greater than the two other seasons.
In the above studies measurements of RH and temperature were taken directly below the occupant or
beneath the pillow, but no consideration was given to differences across the mattress surface although the
presence of a body will undoubtedly cause temperature and moisture gradients to occur.
DatesLocation Time Variable 26/10 –
10/1120/1 -
2/215/3 -24/3
Room 24 hr Temp °C 14 14 20Average RH % 90 52 46
Abs g/kg 9 5 7
Pillow 19.00 Temp °C 15 14 20RH 78 56 53
Abs g/kg 8 5 803.00 Temp °C 26 28 29
RH 84 64 58Abs g/kg 18 16 15
11.00 Temp °C 16 16 20RH 79 57 53
Abs g/kg 9 6 8Table 5 Changes in mean temperature and RH in bedroom air and between the pillow and mattress for an
occupied during three periods, Autumn, Winter and Spring 1970-71. Pillow measurements shown before,
during and after occupation of the bed (Adapted from Koekkoek and Bronswijk 1972 and Bronswijk
1981).
10/10/02 Page 18
Bronswijk (1973) noted that dust was only found to a depth of 12mm within a mattress and concluded it
was therefore unlikely that mites were present at a greater depth. Hay (1995) found DP throughout the
top 1.5 cm of a sprung mattress (at greater depths the mattress became hollow) and reported that the
population was evenly distributed through this depth. However in a 12 year old foam mattress DeBoer
and Kuller (1994) found suitable food present to a depth of 20mm and a few mites survived in the centre
of the mattress. In a study on the horizontal distribution of dust mites Mulla et al. (1975) found
considerably more towards the edge rather than the centre of a mattress (Figure 9). This was generally
due to changes in the number of dead mites and may have been caused by their accumulation at the
mattress edges rather than the movement of live mites to optimal conditions.
Exposing the mattress to unsuitable temperature and humidities have both been experimented with as
methods to control HDM populations. By placing an electric blanket on a bed DeBoer (1990) forced
HDMs to migrate away from the upper mattress layers, but in areas which the blanket did not cover mites
were still present throughout all layers. He concluded that electric blankets reduced the population of
HDMs by 19-84% directly beneath the electric blanket, but did not consider horizontal movements of
mites to uncovered areas. Similar reductions in mite numbers and a decline in allergen concentration
were found by Mosbech et al. (1988) when using an electric blanket in conjunction with regular
vacuuming. However, they state that the reduction may have been due to mites migrating to the mattress
interior rather than their removal and consider the decline insufficient to benefit allergic patients already
possessing infected mattresses. Hart and Whitehead (1990) also reported on difference between HDM
population size in beds with and without electric blankets, possibly due to the blankets being turned on
for a shorter period of time than either of the above studies.
10/10/02 Page 19
3. HYGROTHERMAL ENVIRONMENT IN BEDS ANDBEDDING
3.1. ModellingThere exists a vast range of hygrothermal models that can be used to examine the environmental
conditions in buildings. These models range from very simple steady-state calculations to very complex
transient models requiring a significant amount of numerical analysis and the use of computers.
Various simple steady-state thermal and moisture models have been published (Loudon 1971) (BSI 1989)
(CEN 1997) and are generally easy to use. However, due to their crude nature they require relatively little
input data and provide crude predictions of environmental conditions. More complex hygrothermal
models have been produced including models that account for moisture absorption and desorption (Jones
1993, 1995), models which incorporate more sophisticated thermal models, such as the BREDEM-12
model (NES 1994), and complex transient models which account for a large number of input parameters
(El Diasty et al 1992, 1993) (Letherman 1988, 1989) (Isetti et al 1988) (Kusuda 1983) (De Wit 1990)
(Gan 1996) (Kerestecioglu et al 1989).
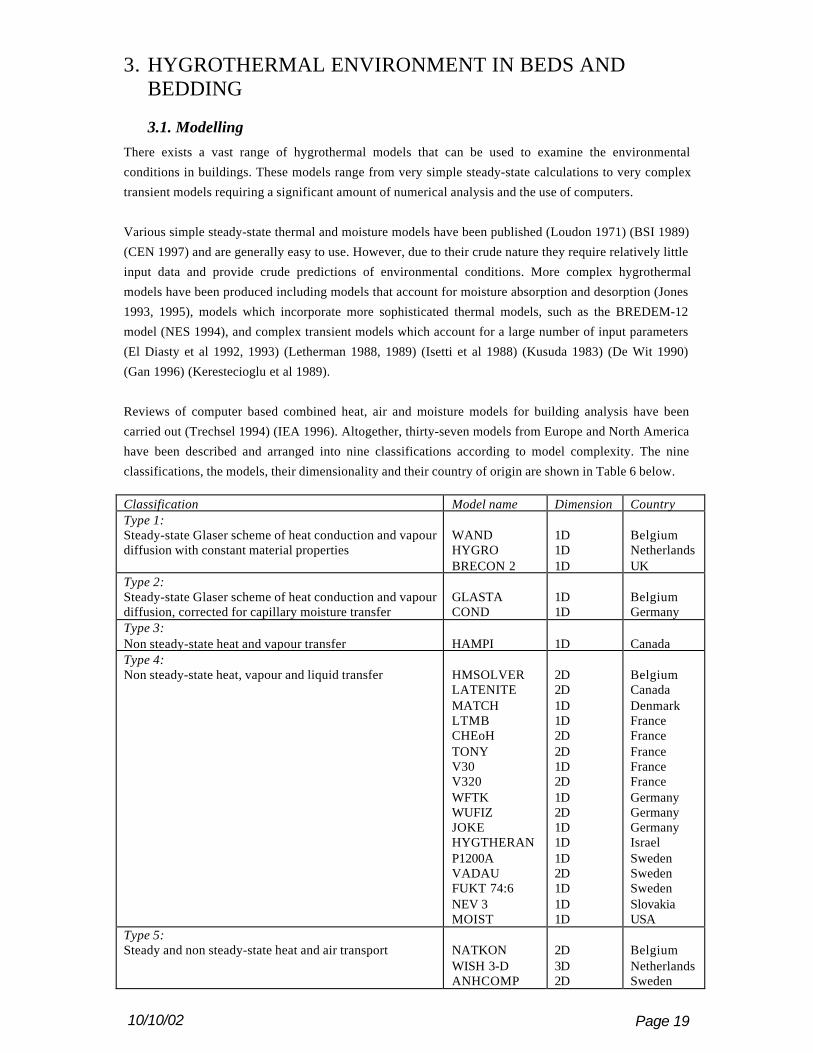
Reviews of computer based combined heat, air and moisture models for building analysis have been
carried out (Trechsel 1994) (IEA 1996). Altogether, thirty-seven models from Europe and North America
have been described and arranged into nine classifications according to model complexity. The nine
classifications, the models, their dimensionality and their country of origin are shown in Table 6 below.
Classification Model name Dimension CountryType 1:Steady-state Glaser scheme of heat conduction and vapourdiffusion with constant material properties
WANDHYGROBRECON 2
1D1D1D
BelgiumNetherlandsUK
Type 2:Steady-state Glaser scheme of heat conduction and vapourdiffusion, corrected for capillary moisture transfer
GLASTACOND
1D1D
BelgiumGermany
Type 3:Non steady-state heat and vapour transfer HAMPI 1D CanadaType 4:Non steady-state heat, vapour and liquid transfer HMSOLVER
Type 5:Steady and non steady-state heat and air transport NATKON
WISH 3-DANHCOMP
2D3D2D
BelgiumNetherlandsSweden
10/10/02 Page 20
Type 6:Steady-state heat, vapour and air transport, constantmaterials properties
KONVEKEMPTEDD
3D1D
BelgiumCanada
Type 7:Steady-state heat and air transfer and non steady-statevapour transfer
WALLDRY 1D Canada
Type 8:Non steady-state heat, vapour and air transfer, materialproperties a function of moisture and temperature
HAMTCCC2DHORSTENID-HAM
1D2D2D1D
BelgiumFinlandNetherlandsSweden
Type 9:Non steady-state heat, vapour, liquid and air transfer,material properties a function of moisture and temperature
HYGRAN24WALLFEMTRATMO2DIM25
1D1D2D2D
BelgiumCanadaFinlandGermany
Table 6 - Heat, air and moisture transport models (IEA 1996)
The large majority of these models remain research tools that are not generally available within the publicdomain. Eight of the models are commercially available including GLASTA, EMPTEDD, MATCH,COND, ANHCOMP, ID-HAM, BRECON 2 and MOIST (IEA 1996).
The BRE Domestic Energy Model (BREDEM) is a thermal model that has been developed over the last20 years and is used to predict the energy consumption in dwellings. The BREDEM models account fortwo different zones within a dwelling, zone 1 which is the living room, which is heated to a highertemperature than the rest of the house which is zone 2. There are currently three versions of BREDEMmainly in use including BREDEM-8, a monthly model, BREDEM-12 an annual model, and BREDEM-9,a simplified single zone annual version which forms the basis of the Standard Assessment Procedure(SAP) for Building Regulations compliance.
The BREDEM-8 model has recently been developed to include a steady-state moisture model (Loudon1971) which allows the prediction of the average monthly relative humidity in both zones of a dwelling(Pretlove 2000). A description of the development and application of this model has been published(Oreszczyn and Pretlove 1999). The BREDEM-8 Loudon model has been shown to predict the averagemonthly relative humidity in a dwelling with a reasonable level of accuracy. The BREDEM-8 Loudonmodel has a number of significant advantages over other simple models:
• The model has been developed to predict the average airspace relative humidity in both zones in adwelling and also the micro-environmental conditions of relative humidity at surfaces.
• The model predicts hygrothermal conditions on a monthly basis, which allows the variations inseasonal relative humidity to be examined.
• A moisture production rate algorithm has been incorporated, which accounts for all of the relevantcategories of moisture production using a minimum number of input parameters.
• Regional climatic data (temperature and vapour pressure) is incorporated into the model andtherefore geographical variations in relative humidity can be examined.
The BREDEM-8 Loudon model also has a number of limitations:
• The model is unable to predict what will happen in an individual bedroom. It has to be assumed thatthe average bedroom conditions will be those relating to zone 2.
• Steady-state conditions are assumed, even though in reality conditions in a dwelling will constantlybe varying.
• The ventilation rate algorithm is crude, even though it is known that ventilation is a key parameteraffecting the relative humidity in a dwelling. The ventilation rate is assumed to be constantthroughout the dwelling and throughout the year.
• Moisture generation is assumed to be the same in all areas of the dwelling, which is unlikely toreflect the different zones of moisture concentration.
10/10/02 Page 21
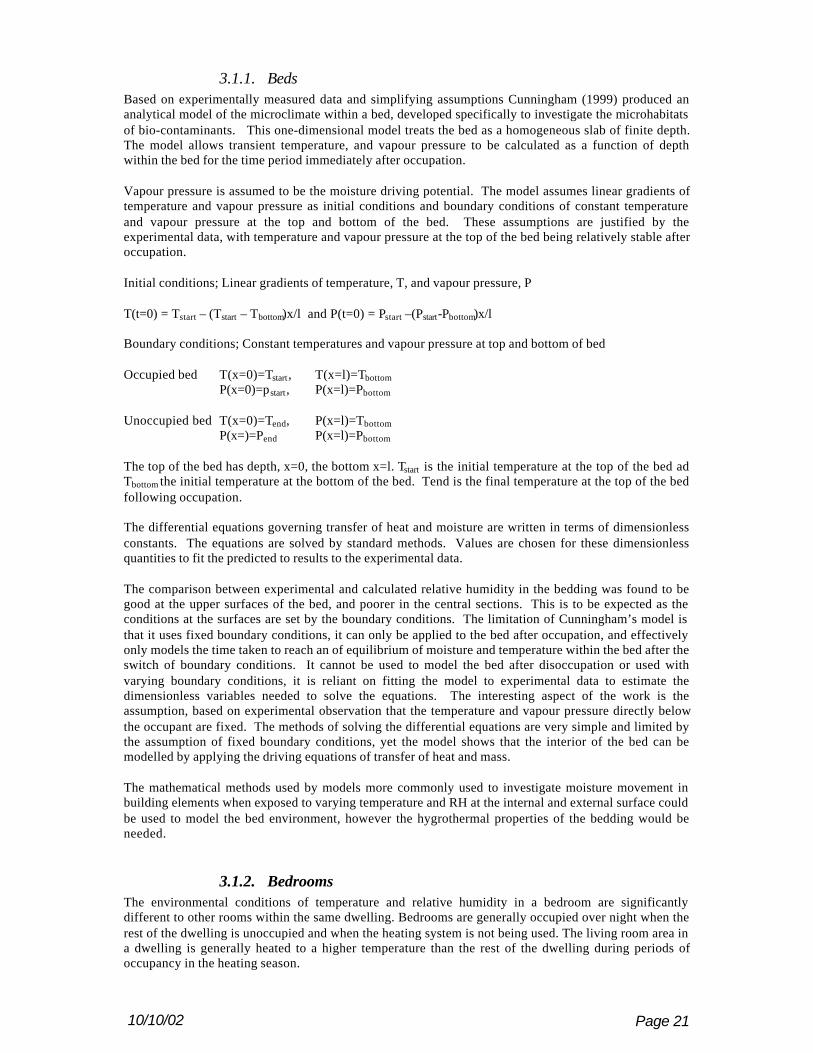
3.1.1. BedsBased on experimentally measured data and simplifying assumptions Cunningham (1999) produced ananalytical model of the microclimate within a bed, developed specifically to investigate the microhabitatsof bio-contaminants. This one-dimensional model treats the bed as a homogeneous slab of finite depth.The model allows transient temperature, and vapour pressure to be calculated as a function of depthwithin the bed for the time period immediately after occupation.
Vapour pressure is assumed to be the moisture driving potential. The model assumes linear gradients oftemperature and vapour pressure as initial conditions and boundary conditions of constant temperatureand vapour pressure at the top and bottom of the bed. These assumptions are justified by theexperimental data, with temperature and vapour pressure at the top of the bed being relatively stable afteroccupation.
Initial conditions; Linear gradients of temperature, T, and vapour pressure, P
Boundary conditions; Constant temperatures and vapour pressure at top and bottom of bed
Occupied bed T(x=0)=Tstart, T(x=l)=TbottomP(x=0)=pstart, P(x=l)=Pbottom
Unoccupied bed T(x=0)=Tend, P(x=l)=TbottomP(x=)=Pend P(x=l)=Pbottom
The top of the bed has depth, x=0, the bottom x=l. Tstart is the initial temperature at the top of the bed adTbottom the initial temperature at the bottom of the bed. Tend is the final temperature at the top of the bedfollowing occupation.
The differential equations governing transfer of heat and moisture are written in terms of dimensionlessconstants. The equations are solved by standard methods. Values are chosen for these dimensionlessquantities to fit the predicted to results to the experimental data.
The comparison between experimental and calculated relative humidity in the bedding was found to begood at the upper surfaces of the bed, and poorer in the central sections. This is to be expected as theconditions at the surfaces are set by the boundary conditions. The limitation of Cunningham’s model isthat it uses fixed boundary conditions, it can only be applied to the bed after occupation, and effectivelyonly models the time taken to reach an of equilibrium of moisture and temperature within the bed after theswitch of boundary conditions. It cannot be used to model the bed after disoccupation or used withvarying boundary conditions, it is reliant on fitting the model to experimental data to estimate thedimensionless variables needed to solve the equations. The interesting aspect of the work is theassumption, based on experimental observation that the temperature and vapour pressure directly belowthe occupant are fixed. The methods of solving the differential equations are very simple and limited bythe assumption of fixed boundary conditions, yet the model shows that the interior of the bed can bemodelled by applying the driving equations of transfer of heat and mass.
The mathematical methods used by models more commonly used to investigate moisture movement inbuilding elements when exposed to varying temperature and RH at the internal and external surface couldbe used to model the bed environment, however the hygrothermal properties of the bedding would beneeded.
3.1.2. BedroomsThe environmental conditions of temperature and relative humidity in a bedroom are significantlydifferent to other rooms within the same dwelling. Bedrooms are generally occupied over night when therest of the dwelling is unoccupied and when the heating system is not being used. The living room area ina dwelling is generally heated to a higher temperature than the rest of the dwelling during periods ofoccupancy in the heating season.
10/10/02 Page 22
Few hygrothermal models account for different spaces within the same dwelling and are generally used topredict average conditions within the whole dwelling over a period of time. The current British Standardfor condensation in buildings, BS5250: 1989 (BSI 1989), incorporates a very crude method for predictingthe relative humidity and is unable to account for separate spaces within a dwelling. Models that predictaverage dwelling conditions tend to under-estimate the average temperature in the living room and overestimate the average temperature in the remainder of the house. As a result, predictions of relativehumidity are over-estimated in the living room and under-estimated in the remainder of the house, whichincludes the bedrooms.
The BREDEM-8 Loudon model is able to predict the hygrothermal conditions in two zones within adwelling and is therefore suitable as a tool for predicting the environmental conditions in the bedrooms ina dwelling.
3.2. Human physiology in bedsAlthough much is written about human physiology and comfort in buildings little work has beenidentified covering people in modern beds. Some work relating to people lying on top of beds which hasbeen developed for patients undergoing operations. This is of little relevance to this study.
In the case of somebody asleep in a bed almost all the energy released by the oxidation process in thehuman body is converted into heat as very little is converted into mechanical motion. The bodiesthermoregulatory system aims to maintain a constant internal body temperature (36.4 to 37.2C). Understeady state conditions this will result in an energy balance whereby the metabolic rate equals the bodiesheat loss. Thus the metabolic rate when sleeping (41 W/m2) is equivalent to the following:
1. Heat loss by water diffusion through the skin2. Sensible radiant and convective loss from the skin to the bed clothes3. The heat loss by evaporation of sweat4. Latent respiration heat loss5. Dry respiration heat loss
The last two of these do not occur in the bedding unless the person sleeps with their head under thebedclothes and so can be ignored in most situations. Ideally bedclothes will be adjusted to preventsweating and so this form of heat loss is ignored in conditions of thermal comfort (this factor needschecking – experimental monitoring in beds may help identify if this is true. This is supported by astatement in Fanger 1970, that sweating does not occur and the mean skin temperature is 33-34C forsedentary people. This only leaves 1 and 2 above.
Sensible radiant and convective heat lossMeasurements undertaken by Fanger show a mean surface temperature of 34.5C for thermal comfort to beachieved at low metabolic rates. The simplest assumption when modelling an occupied bed is therefore toassume all internal bedding has a boundary condition of a fixed temperature at 34.5C when occupied.Again this effectively assumes that the bedding is adjusted to maintain this comfort condition, i.e. lessbedding in summer and more in winter. In practice this will not always happen a more sophisticatedmodel would adjust the temperature to accommodate the metabolic heat gain.
Heat loss by water diffusion through skinThis is not subject to thermoregulatory control but is simply controlled by the vapour pressure differenceacross the skin and the vapour resistance of the skin. This vapour resistance has been measured by Inouyeet al for sedentary subjects under comfort conditions at 7.9 x10⁸ Ns kg–1 (Source: Fanger, “ThermalComfort”, 1970 ). The skin vapour pressure is simply the saturated vapour pressure at the skintemperature 34.5C for low metabolic activity.
Note, significant variations from the steady state may occur in beds. Primarily associated withpreconditioning of the bed or body before the subject goes to sleep. For example, taking a hot bath beforegoing to bed results in considerable heat storage in the human body which is subsequently released in thebed thereby adding to the metabolic heat gains within the bed. Alternately we have all experienced thediscomfort associated in getting into a cold bed, or getting into bed after rapid exercise.
10/10/02 Page 23
In addition, the circadian rhythm results in a daily variation (0.3 to 0.5C) in the bodies core temperaturewith the maximum occurring before going to sleep and the minimum some time before awakening. It alsoappears that during D-sleep, which typically accounts for 20% of sleep time in adults rising to 50% innew-born children, our core-temperature is hardly controlled and so we operate similarly to cold-bloodedcreatures, (Microsoft Encarta, 1997)! The above simple steady state analysis will therefore only beapplicable to adults
Typical sleep patterns ranging from 16-18 hours for new born babies to 7 to 8 hours in adulthood. Source:Microsoft Encarta 97.
3.3. Hygrothermal properties of beds and beddingThe process of developing a model requires the adoption of equations that address the conservation ofmass, energy and momentum and represent physical transport processes. The use of transport equationsintroduces the need for transport properties of the medium, and the use of conservation equations requiresthe introduction of capacitive and storage properties. These properties must be determined byexperimentation. Therefore the success of the model depends on both the detail and sophistication of themathematical formulation, and the accuracy of the physical properties of the materials. The aim of suchmodels is to calculate Temperature and Moisture Content within the material. An excellent review anddatabase of material properties used in hygrothermal models is given by IEA (1996) in Task 3 of Annex24.
Moisture content may be defined in three ways:i) Mass of moisture per unit volume of the dry material, w, kg.m-3
ii) Mass of moisture per unit mass of the dry material, u, kg.kg -1
iii) Volume of condensed moisture per unit volume of the material, ψ, m3.m3
The material properties required for the most simple hygrothermal modelling are:
Property Symbol UnitDensity of dry Material ρ Kg.m3Thermal Conductivity λ W.m-1.K-1
Specific Heat capacity c J.kg.K-1
Thermal Diffusivity * a m2.s -1
Vapour permeability δp Kg.m-1.Pa-.1s -1
Sorption isotherm Function F Kg.kg-1
Specific Moisture Capacity * ξ Kg.kg-1.Pa-1
Moisture Diffusivity * Dw m2.s -1
* Note : Thermal Diffusivity can be calculated from thermal conductivity and specific heat capacity,Specific Moisture Capacity can be calculated from the sorption isotherm function. Moisture Diffusion canbe calculated from specific moisture capacity, vapour pressure, moisture permeability and dry density.
The isotherm function F gives the moisture content within the material as a function of Relative Humidityθ. It is the equilibrium moisture content that the material would have when exposed to a constant relativehumidity. The specific moisture capacity is the derivative with respect to relative humidity of thesorption isotherm.
More complex models include capillary and suction force acting on liquid water and require more data.The properties of most importance are dry density, thermal conductivity and specific heat capacity; theseare the most readily available, vapour permeability and the sorption isotherm are the most importantproperties as regard moisture movement. The greater the number of points on the sorption isothermcurve, the greater the accuracy, similarly it is an advantage to know how all properties vary as a functionof both temperature and more importantly relative humidity or moisture content.
10/10/02 Page 24
It must be noted that most hygrothermal models have been developed to model moisture movement inconstruction materials such as bricks and concrete. To produce a hygrothermal model of the bedenvironment data is required on the hygrothermal properties of bedding and textiles.
An excellent source of the above properties for the materials encountered in bedding and mattresses is thebook Physical Properties of Textile fibres, W.E. Morton and J.W.S. Hearle. All of the properties neededfor hygrothermal modelling, or those, which can be used to derive all necessary properties, are tabulatedfor a number of synthetic and manmade fibres.
It is interesting to note that there exists a property of textiles that is almost identical in definition to themoisture isotherm function of building materials. This property is known as the regain of the textile
Regain (θ) %= kg of water/kg dry material * 100% at a given RH%
The one difference being that regains are commonly quoted as percentages where as moisture contents ofconstruction materials and isotherms are usually quoted as kg/kg. As yet no good data source of thehygrothermal properties of the latex foams used in modern mattresses has been encountered.
3.4. Monitored bedroom conditionsEnvironmental conditions have been measured in a significant number of dwellings in the UK, and inother European countries, for the last 50 years. Although extensive data is available there are significantlimitations with this data:
• Temperature is the main environmental parameter that has been measured in dwellings with relativehumidity measurements forming a very small proportion of the data available.
• Most data has been collected in the living room or hall areas in dwellings and therefore theavailability of bedroom data is very limited.
• Frequently, surveys are carried out in an attempt to assess problems such as dampness so thatappropriate remedial measures can be taken. As a result, the conditions measured in these dwellingswill not reflect conditions within the average housing stock in the UK.
The largest survey of English dwellings, carried out every five years, is the English House ConditionSurvey (EHCS). The EHCS Energy Report, which contains data relating to home temperatures, for themost recently published EHCS (DETR 1998) has yet to be published and therefore the latest dataavailable relates to the EHCS survey carried out in 1991 (DoE 1996). During the EHCS survey of 1991temperatures were measured inside and outside each dwelling. Relative humidity was not measured,although assessments of dampness and condensation were made as part of the survey.
In the EHCS temperature survey two internal temperatures and one external temperature was measured ateach dwelling location. The period of measurement was from February to May 1992. The internaltemperature was generally taken in the living room and in the hall, the latter being viewed as a goodindicator for the mean temperature of all rooms. The average external temperature measured during thesurvey was 11°C. The average temperature in the living room was measured as 19.5°C and in the hall18.3°C. A number of important conclusions were made as a result of the temperature survey:
• Tenure is significant with the average temperature measured in Housing Association and LocalAuthority dwellings approximately 1°C higher than the average temperature measured in owneroccupied dwellings.
• Dwelling age is also significant, with older dwellings found to be colder than new dwellings.• No significant differences in internal temperatures were found at different geographical regions
within England.
A national survey of home temperatures carried out between 1972 and 1982 in one thousand dwellingsduring the heating season found that the mean living room temperature was 18.3°C and the bedroom15.2°C (Raw and Hamilton 1995).
Extensive monitoring of internal and external temperatures took place during a two year period at thePennyland Project (Lowe et al 1985) in Milton Keynes. In 18 dwellings which were well-insulated the
10/10/02 Page 25
average living room temperature was measured to be 17.8°C and the bedroom 16.5°C. In another 37dwellings which had very high levels of insulation the average living room temperature was found to be18.4°C and the bedroom 17.5°C.
Another extensive survey of environmental conditions in dwellings took place at the Milton KeynesEnergy Park (MKEP) between 1988 and 1993. Altogether, 160 dwellings were monitored for fuelconsumption and of these, 29 dwellings were more intensively monitored with hourly temperature andrelative humidity being measured in the living room and hourly temperatures being monitored in the mainbedroom and another room. The averages of the data collected during the heating season of October 1989to May 1990 is summarised in Table 7 below.
Table 7 - Environmental conditions in 29 intensively monitored dwellings a MKEP during theheating season Oct 1989 to May 1990
To summarise, although a great deal of environmental data has been collected in dwellings in the UK, thisreview has identified that of the very little bedroom data that exists it is primarily restricted to thetemperature measurements only.
10/10/02 Page 26
REFERENCES
Abbott, J., Cameron, J. and Taylor, B. (1981). House dust mite counts in different types of mattresses,sheepskins and carpets, and a comparison of brushing and vacuuming collection methods. ClinicalAllergy 11 : 589-595.
Allen, M. Arlian, L. G., Bernstein, I. L. (1988). Prevalence of dust mites in the homes of asthmatics inseveral US geographical regions. Journal of Allergy and Clinical Immunology 81 : 270.
Andersen and Rosen (1989). House dust mite, Dermatophagoides pteronyssinus, and its allergens: effectsof washing. Allergy 44 : 396-400.
Andrews, J., Cunningham, M., Pike. A., Wood, S. and Hearfield, M. (In Press). House dust mite(Dermatophagoides pteronyssinus) mortality in occupied beds and in heated and unheated carpets.
Arlian, L. G. (1975a). Water exchange and effect of water vapour activity on metabolic rate in the dustmite Dermatophagoides. Journal of Insect Physiology 21 : 1439-1442.
Arlian, L. G. (1975b). Dehydration and survival of the European house dust mite, Dermatophagoidespteronyssinus. Journal of Medical Entomology 12(4) : 437-442.
Arlian, L. G. (1977). Humidity as a factor regulating feeding and water balance of the house dust mitesDermatophagoides farinae and DP (Acari: Pyroglyphidae). Journal of Medical Entomology 14(4): 484-488.
Arlian, L. G. (1992). Water balance and humidity requirements of house dust mites. Experimental andApplied Acarology 16 : 15-35.
Arlian, L. G. and Wharton, G. W. (1974). Kinetics of water active and passive components of waterexchange between the air and a mite, Dermatophagoides farinae. Journal of Insect Physiology 20 : 1063-1077.
Arlian, L. G. and Veselica, M. M. (1981). Effect of temperature on the equilibrium body water mass inthe mite Dermatophagoides farinae. Physiological Zoology 54(4) : 393-399.
Arlian, L. G., Berstein, M. D. and Gallagher, J. S. (1982). The prevalence of house dust mites,Dermatophagoides spp., and associated environmental conditions in homes in Ohio. Journal of Allergyand Clinical Immunology 69(6) : 527-532
Arlian, L. G., Woodford, P. J., Berstein, I. L. and Gallagher, J. S. (1983). Seasonal population structure ofhouse dust mites, Dermatophagoides spp. (Acari: Pyroglyphidae). Journal of Medical Entomology 20(1) :99-102.
Arlian, L. G., Rapp, C. M. and Ahmed, S. G. (1990). Development of Dermatophagoides pteronyssinus(Acari: Pyroglyphidae). Journal of Medical Entomology 27(6) : 1035-1040.
Arlian, L. G. and Dipplod, J. S. (1996). Development and fecundity of Dermatophagoides farinae (Acari:Pyroglyphidae). Journal of Medical Entomology 33(2) : 257-260.
Arlian, L. G., Neal, J. S. and Bacon, S. W. (1998). Survival, fecundity and development ofDermatophagoides farinae (Acari: Pyroglyphidae) at fluctuating relative humidity. Journal of MedicalEntomology 35(6) : 962-966.
Arlian, L. G., Neal, J. S. and Vyszenski-Moher, D. L. (1999). Reducing relative humidity to control thehouse dust mite Dermatophagoides farinae. Journal of Clinical Immunology 104 : 852-856.
Asselt, L. Van. (1999). Interactions between domestic mites and fungi. Indoor and Built Environment 8 :216-220.
10/10/02 Page 27
Bischoff, E. (1992). Assessment of mite numbers - new methods and results. Experimental and AppliedAcarology 16 : 1-14.
Blanco, L. R. (1996). Dust Mites: A Primer. http://www.ozemail.com.au/~lblanco/index.html. (Accessed14th August 2000).
Blythe, M. E. (1976). Some aspects of the ecological study of the house dust mites. British Journal ofDiseases of the Chest 70 : 3-31.
Blythe, M. E., Williams, J. D. and Morrison Smith, J. (1974). Distribution of pyroglyphid mites inBirmingham with particular reference to Euroglyphus maynei. Clinical Allergy 4 25-33.
British Standards Institute (BSI) (1989) BS 5250:1989 Code of practice for control of condensation inbuildings
Bronswijk J. E. M. H. van (1974). Colonisation and its prevention on house floors and in mattresses withDermatophagoides pteronyssinus (Acari: Sarcoptiformes) in a center for asthmatic children. EntomologieExperimental and Applied 17 : 199
Bronswijk, J. E. M. H. van (1973). Dermatophagoides pteronyssinus (Trouessart, 1897) in mattress andfloor dust in a temperate climate (Acari: Pyroglyphidae). Journal of Medical Entomology 10(1) : 63-70.
Bronswijk, J. E. M. H. van (1981). House Dust Biology for Allergists, Acarologists and Mycologists. NIBPublishers, The Netherlands.
Bronswijk J. E. M. H. van et al. (1971). On the abundance of Dermatophagoides pteronyssinus in housedust. Researches on Population Ecology 13 : 67
Carswell, F., Robinson, D. W., Oliver, J., Clark, J., Robinson, P. and Wadsworth, J. (1982). House dustmites in Bristol. Clinical Allergy 12 : 533-545.
CEN Draft European Standard CEN/TC89 WG10 (1997) Hygrothermal performance of buildingcomponents and building elements - estimation of internal surface temperature to avoid critical surfacerelative humidity and calculation of interstitial condensation, (CEN) (1997)
Colloff, M. J. (1986). Use of liquid nitrogen in the control of house dust mite populations. ClinicalAllergy 16 : 41-47.
Colloff, M. J. (1987). Effects of temperature and relative humidity on development times and mortality ofeggs from laboratory and wild populations of the European house dust mite Dermatophagoidespteronyssinus (Acari: Pyroglyphidae). Experimental and Applied Acarology 3 : 279-289.
Colloff, M. J. (1987). Mites from house dust in Glasgow. Medical and Veterinary Entomology 1 : 163-168.
Colloff, M. J. (1991a). Population studies on the house dust mite, Euroglyphus maynei (Cooreman 1950)(Pyroglyphidae). In R. Schuster & P. W. Murphy (Eds) The Acari: Reproduction, development and lifehistory strategies. Chapman and Hall, London.
Colloff, M. J. (1991b). Practical and theoretical aspects of the ecology of house dust mites in relation tothe study of mite mediated allergy. Review of Medical and Veterinary Entomology 79 : 611-30
Colloff, M. J. (1998). Taxonomy and identification of dust mites. Allergy 53 Supplement 48 : 7-12.
Colloff, M. J., Taylor, C. and Merrett, T. G. (1995). The use of domestic steam cleaning for the control ofhouse dust mites. Clinical and Experimental Allergy 25 : 1061-1066.
Crane, J., Ellis, I., Siebers, R., Grimmet, D. , Lewis, S. and Fitzharris, P. (1998). A pilot study of theeffect of mechanical ventilation and heat exchange on house-dust mites and Der p1 in New Zealandhomes. Allergy 53 : 755-762.
10/10/02 Page 28
Cunningham, M. J. (1998). Direct measurements of temperature and humidity in dust mite microhabitats.Clinical and Experimental Allergy 28 : 1104-1112.
Cunningham M.J (1999). Modelling of some dwelling internal microclimates. Building and Environment34 523-536
Cunnington, A. M. (1967). The mite fauna of house dust. Acta Allergologica 22 : 415.
Custovic et al. (1995). Portable dehumidifiers in the control of house dust mites and mite allergens.Clinical and Experimental Allergy 25 : 312-316.
De Boer, R. (1990). Effect of heat treatments on the house dust mite Dermatophagoides pteronyssinusand DF (Acari: Pyroglyphidae) in a mattress-like polyurethane foam block. Experimental and AppliedAcarology 9 : 131.
De Boer, R. and Kuller, K. (1994). House dust mites (Dermatophagoides pteronyssinus) in mattresses:Vertical distribution. Proceedings of Experimental and Applied Entomology, NEV, Amsterdam 5 : 129.De Boer, R. and Kuller, K. (1997) Mattresses as a winter refuge for house-dust mite populations. Allergy52 : 299-305.
De Boer, R., Kuller, K. and Kahl, O. (1998). Water balance of Dermatophagoides pteronyssinus (Acari:Pyroglyphidae) maintained at brief daily spells of elevated air humidity. Journal of Medical Entomology35(6) : 905-910.
DeBoer, R. (1990). The control of house dust mite allergens in rugs. Journal of Allergy and ClinicalImmunology 86 : 808-814.
DeBoer, R. and Kuller, K. (1994). House dust mites (Dermatophagoides pteronyssinus) in mattresses:Vertical distribution. Proceedings of Experimental and Applied Entomology, NEV, Amsterdam 5 : 129.
Department for the Environment Transport and Regions (DETR) (1998) English House Condition Survey1996 (HMSO)
Department of the Environment (DoE) (1996) English House Condition Survey 1991: Energy Report,(HMSO)
De Wit M H (1990) A second order model for the prediction of indoor air humidity, EindhovenUniversity of Technology, Netherlands
Dharmage, S., Bailey, M., Raven, J., Cheng, A., Rolland, J., Thiens, F., Forbes, A., Abramson, M. andWalters, E. H. (1999). Residential characteristics influence Der p 1 levels I homes in Melbourne,Australia. Clinical and Experimental Allergy 29 : 461-469.
Douglas, A. E. and Hart, B. J. (1989). The significance of the fungus Asperigillus penicilloides to thehouse dust mite Dermatophagoides pteronyssinus. Symbiosis 7 : 105-116.
Dybandel, T., Vik, H. and Elsayed, S. (1989). Dust from smooth and carpeted floors. Allergy 44 : 401-411.
El Diasty R, Fazio P and Budaiwi I (1992) Modelling of indoor air humidity - the dynamic behaviourwithin an enclosure, Energy and Buildings 19 61-73
El Diasty R, Fazio P and Budaiwi I (1993) Dynamic modelling of air humidity behaviour in a multi-zonespace, Building and Environment 28 (1) 33-51
Emenius, G., Egmar, A. C. and Wickman, M. (1998). Mechanical ventilation protects one-storey single-dwelling house against increased air humidity, domestic mite allergens and indoor pollutants in a coldclimate region. Clinical and Experimental Allergy 28 1389-1396.
10/10/02 Page 29
Fanger P O Thermal Comfort: Analysis and Applications in Environmental Engineering, Mc Graw-HillBook Company, London (1970).
Fletcher, A. M., Pickering, C. A. C., Custovic, A., Simpson, J., Kennaugh, J. and Woodcock, A. (1996).Reduction in humidity as a method of controlling mites and mite allergens: the use of mechanicalventilation in British domestic dwellings. Clinical and Experimental Allergy 26 : 1051-1056.
Gan G (1996) Effect of combined heat and moisture transfer on the predicted indoor thermalenvironment, Indoor Built Environment 5 170-180
Glass, E. V., Yoder, J. A. and Needham, G. R. (1998). Clustering reduces water loss by adult Americanhouse dust mites Dermatophagoides farinae (Acari: Pyroglyphidae). Experimental and AppliedAcarology 22 : 31-37.
Hart, B. J. and Whitehead, L. (1990). Ecology of house dust mites in Oxfordshire. Clinical andExperimental Allergy 20(2) : 203-209.
Harving, H., Korsgaard, J. and Dahl, R. (1994). House dust mite exposure reduction in speciallydesigned, mechanically ventilated ‘healthy’ homes. Allergy 49 : 713-718
Hay, D. B. (1995). An in situ coring technique for estimating the population size of house dust mites intheir natural habitat. Acarologia 36(4) : 341-345.
Hill, M. R. (1998). Quantification of house-dust-mite populations. Allergy 53 Supplement 48 : 18-23.
Howarth, P. H., Lunn, A., and Tomkin, S. (1992). Bedding barrier intervention in house dust miterespiratory allergy. Clinical and Experimental Allergy 22(1) : ??.
Htut, T. (1994). A case study of bite reactions in man and domestic dust samples that implicate the housedust mite predator Cheyletus malaccensis Oudemans (Acari: Cheyletidae). Indoor Environment 3(2) :103-107.
Htut, T., Burgess, I. F., Maunder, J. W. and Basham, E. (1996). A pilot study on the effect of one roomMVHR units on HDM populations and Der p1 in laboratory simulated bedrooms. International Journal ofEnvironmental Health Research 6 : 301-313.
Hughes, M. A. and Maunsell, K. (1973). A study of a population of house dust mites in its naturalenvironment. Clinical Allergy. 3 : 127-131.
Hunter, C. A., Jeffrey, I. G., Berry, R. W. and Lea, R. G. (1996). Mites. In B.R.E. (Ed). Indoor AirQuality in Homes: Part 1 The BRE Indoor Environment Study. B.R.E., Watford.
Hyndman, S. J., Vickers, L. M., Htut, T., Maunder, J. W., Peock, A. and Higenbottam, T. W. (1997). AnInvestigation into the Effects of Dehumidification on House Dust Mite Populations. Health ServicesResearch Group, Cambridge.
International Energy Agency (IEA) (1996) IEA Annex XXIV Heat, Air and Moisture transfer in InsulatedEnvelope Parts Volume 1: Task 1: Modelling
International Energy Agency (IEA) (1996) IEA Annex XXIV Heat, Air and Moisture transfer in InsulatedEnvelope Parts Volume 1: Task 3: Material Properties
Isetti C, Laurenti L and Ponticiello A (1988) Predicting vapour content of the indoor air and latent loadsfor air conditioned environments: Effects of moisture storage capacity of the walls, Energy and Buildings12 141-148
Jones R (1993) Modelling water vapour conditions in buildings, Build. Serv. Eng. Res. Tech. 14 (3) 99-106
Jones R (1995) Indoor humidity calculation procedures, Build. Serv. Eng. Res. Tech. 16 (3) 119-126
10/10/02 Page 30
Kerestecioglu A, Swami M, Fairey P, Gu L and Chandra S (1989) Modelling heat, moisture andcontaminant transport in buildings: toward a new generation software, Florida Solar Energy Center,FSEC-PF-165-89
Kinnaird, C. H. (1974). Thermal death point of Dermatophagoides pteronyssinus (Trouessart 1897)(Astigmata, Pyroglyphidae) the house dust mite. Acarologia 16 : 340-342.
Koekkoek, H. H. M. and Bronswijk, J. E. M. H. van. (1972). Temperature requirements of a house dustmite Dermatophagoides pteronyssinus compared with the climate in different habitats of houses Entomol.Exp. Appl. 15 : 438-42.
Korsgaard, J. (1982). Preventive measures in house-dust allergy. American Review of Respiratory Disease125 : 80-84.
Korsgaard, J. (1983). House-dust mites and absolute indoor humidity. Allergy 38 : 85-92.
Korsgaard, J. (1998). Epidemiology of house-dust mites. Allergy 53 Supplement 48 : 36-40.
Korsgaard, J. (1998). House-dust mites and asthma. A review on house-dust mites as a domestic riskfactor for mite asthma. Allergy 53 Supplement 48 : 77-83.
Kusuda T (1983) Indoor humidity calculations, ASHRAE Transactions 89 (2)
Le Mao, J., Liebenberg, B., Bischoff, E. and David, B. (1992). Changes in mite allergen levels in homesusing an acaricide combined with cleaning agents: A 3 year follow-up study. Indoor Environment 1 : 212-218.
Letherman K M (1988) Room air moisture: Dynamic effects of ventilation and vapour generation , Build.Serv. Eng. Res. Tech. 9 (2) 49-53
Letherman K M (1989) Condensation avoidance in layered structures: synthesis of designs, Build. Serv.Eng. Res. Tech. 10 (2) 2-34
Loudon A G (1971) The effects of ventilation and building design factors on the risk of condensation andmould growth in dwellings, Building Research Station (BRS) CP 31/71
Lowe R, Chapman J and Everett R (1985) The Pennyland Project, Executive Summary, September 1985,Report ERG 054. ETSU-S-1046(S)
Maunder, J. (1990). House dust mites in the work place. Environmental Health 304-306.
McDonald, L. G. and Tovey, E. (1992). The role of water temperature and laundry procedures in reducinghouse dust mite populations and allergen content of bedding. Journal of Allergy and Clinical Immunology90 : 599-608.
McGarth, J. C. (1971). Proceedings of the North Central Branch of the Entomological Society ofAmerica 26 : 70.
McIntyre, D. A. and Edwards, J. P. (1992). Ventilation and house dust mites – a pilot study . EATechnology, Chester.
Microsoft Encarta 97 Encyclopedia (1997)
Mitchell, W. F., Wharton, G. W., Larson, D. G. and Modic, R. (1969). House dust, mites and insects.Annals of Allergy 27 : 93-99.
Mosbech, H., Korsgaard, J., and Lind, P. (1988). Control of house dust mites by electrical heatingblankets. Journal of Allergy and Clinical Immunology 81 : 706-710.
Morton W.E.and. Hearle J.W.S, Physical Properties of Textile fibres.
10/10/02 Page 31
Mulla, M. S., Harkrider, J. R., Galant, S. P. and Amin, L. (1975). Some house dust control measures andabundance of Dermatophagoides mites in Southern California (Acari: Pyroglyphidae). Journal ofMedical Entomology 12(1) : 5-9.
NES (National Energy Services) Ltd (1994) Programme manual for NHER Evaluator, NES Ltd,Rockingham Drive, Linford Wood, Milton Keynes, MK14 6EG
Oreszczyn T and Pretlove S E C (1999) Condensation Targeter II: Modelling surface relative humidity topredict mould growth in dwellings, Build. Serv. Eng. Res. Tech. 20 (3) 143-153
Platts-Mills, T. A. E. and Chapman, M. D. (1987). Dust mites: Immunology, allergenic disease andenvironmental control. The Journal of Allergy and Clinical Immunology. 80(6) : 755-775
Pretlove S E C (2000) Predicting Relative Humidity in UK dwellings, PhD Thesis, University of London,March 2000
Rao, V. R. M., Dean, B. V. Seaton, A. and Williams, D. A. (1975). A comparison of mites populations inmattress dust from hospital and from private houses in Cardiff, Wales. Clinical Allergy 5 : 209-215.
Sesay, H. R. and Dobson, R. M. (1972). Studies on the mite fauna of house dust in Scotland with specialreference to that of bedding. Acarologia 14 : 384-392.
Solarz, K. (1997). Seasonal dynamics of house dust mite populations in bed/mattress dust from twodwellings in Sosnoweic (Upper Silesia, Poland): An attempt to assess exposure. Annals of Agriculturaland Environmental Medicine 4 : 253-261.
Spieksma, F. et al. (1971). High altitude and house dust mites. British Medical Journal 1 : 82-84
Tovey, E. R., and Woolcock, A. J. (1994). Direct exposure of carpets to sunlight can kill all mites.Journal of Allergy and Clinical Immunology 93 : 1072-1075.
Trechsel H (Editor) (1994) Moisture control in buildings, American Society for Testing and Materials(ASTM)
Vervloet, D., Penaud, A., Razzouk, H., Senft, M., Arnaud, A., Boutin, C. and Charpin, J. (1982). Altitudeand house dust mites. Journal of Allergy and Clinical Immunology 39 : 325-338.
Walshaw, M. J., and Evans, C. C. (1987). The effect of seasonal and domestic factors on the distributionof Euroglyphus maynei in the homes of Dermatophagoides pteronyssinus allergic patients. ClinicalAllergy 17 : 7-14.
Wanner, H. U., Verhoeff, A. et al. (1993). Biological particles in indoor environments. Indoor Air Qualityand its Impact on Man. Luxembourg Office for Official Publications of the European Communities. EUR14988 European Collaborative Action.
Warner, J. A., Frederick, J. M., Bryant, T. N., Weich, C., Raw, G. J., Hunter, C., Stephen, F. R.,McIntyre, D. A. and Warner, J. O. (2000). Mechanical ventilation and high-efficiency vacuum cleaning: acombined strategy of mite and mite allergen reduction in the control of mite-sensitive asthma. Journal ofAllergy and Clinical Immunology 105(1) : 75-82.
Wharton, G. W. (1970). Mite and commercial extract of house dust. Science 167 : 1382-3
Wharton, G. W. (1976). House dust mites. Journal of Medical Entomology 12 : 577-621
Wharton, G. W. (1978). Uptake of water vapour by mites and mechanisms utilized by the Acaridei. In
K. Schmidt-Nielsen, L. Bolis and S. H. P. Maddrell. Comparative Physiology: Water, Ions and FluidMechanics. Cambridge University Press, Cambridge.
Wharton, G. W., Duke, K. M. and Epstein, H. M. (1979). Water and the physiology of house dust mites.In J. G. Rodriguez (Ed). Recent Advances in Acarology, Volume 1 . Academic Press, London.
10/10/02 Page 32
Whitrow, D. (1993). Dust Mites, Allergies and Asthma . Nottingham University Printing and PhotographicUnit, Nottingham.
Wickman, M. Emenius, G., Egmar, A. C., Axelsson, G. and Pershagen, G. (1994) Reduced mite allergenlevels in dwellings with mechanical exhaust and supply ventilation Clinical and Experimental Allergy 24: 109-114
Yoshikawa, M. (1980). Epidemic of dermatitis due to a cheylitid mite, Chelacaropsis sp. in tatami rooms,part 1. Annual Report of the Tokyo Metropolitan Research Laboratory of Public Health 31 : 253-260.
Yoshikawa, M. et al. (1988). Effects of a dehumidifier on mites and fungi. IN annual report of the TokyoResearch Laboratory of Public Health 39 : 237-244. Abstract in Review of Medical and VeterinaryEntomology 78(1)
Table 2: Abundance of Pyroglyphid mite species within the UK
Study Location Sampling from
Mattress / Floor
Total no. of
samples*
% of mites
Pyroglyphidae
% DP % EM % DF
Cunnington (1967) London and S. Wales Floor 186 82 82 18 -
Sesay and Dobson (1972) Glasgow and Edinburgh Mattress 486 (60 beds) 86 85 15 -
Blythe et al. (1974) Birmingham, UK Mattress 38 90 67 33 -
DP Dermatophagoides pteronyssinus, DF Dermatophagoides farinae, EM Euroglyphus maynei*Samples each from a separate mattress or carpet unless otherwise stated.1Mattresses in homes of asthma patients where mite avoidance measures were regularly carried out