34
Santee Cooper Ad Hoc Committee Meeting House Ways & Means Committee February 25, 2020

Santee Cooper Ad Hoc Committee Meeting
House Ways & Means Committee
February 25, 2020

2
Agenda
NextEra Energy's Philosophy & Track Record
NextEra Energy's Plan for Santee Cooper
Overview of NextEra Energy
3
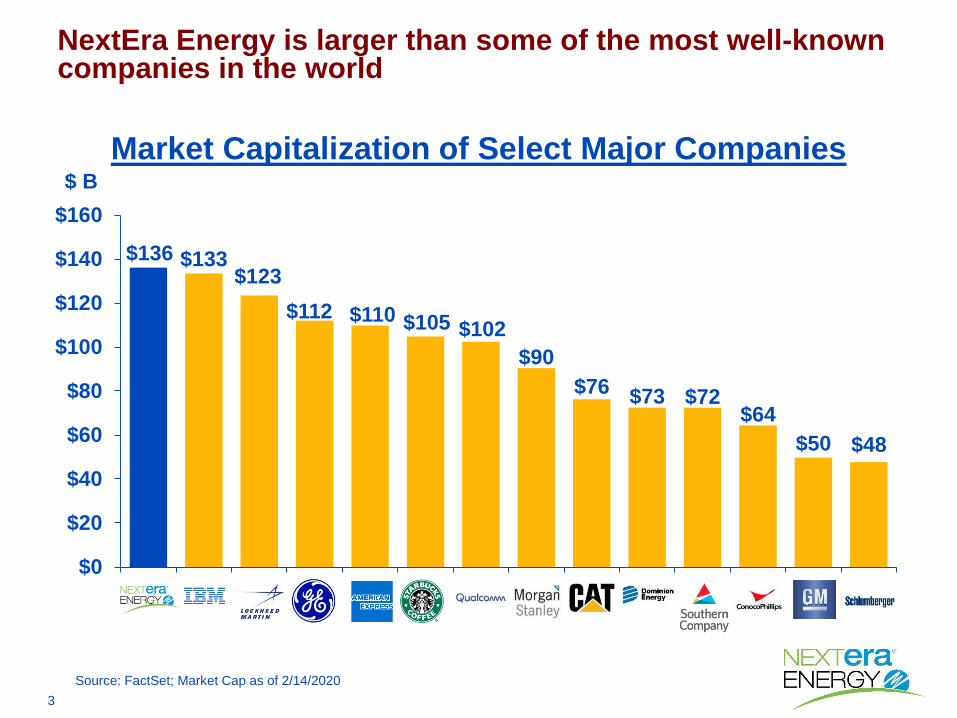
NextEra Energy is larger than some of the most well-known companies in the world
Market Capitalization of Select Major Companies
$136 $133$123
$112 $110 $105 $102
$90
$76 $73 $72$64
$50 $48
$0
$20
$40
$60
$80
$100
$120
$140
$160
$ B
Source: FactSet; Market Cap as of 2/14/2020
4
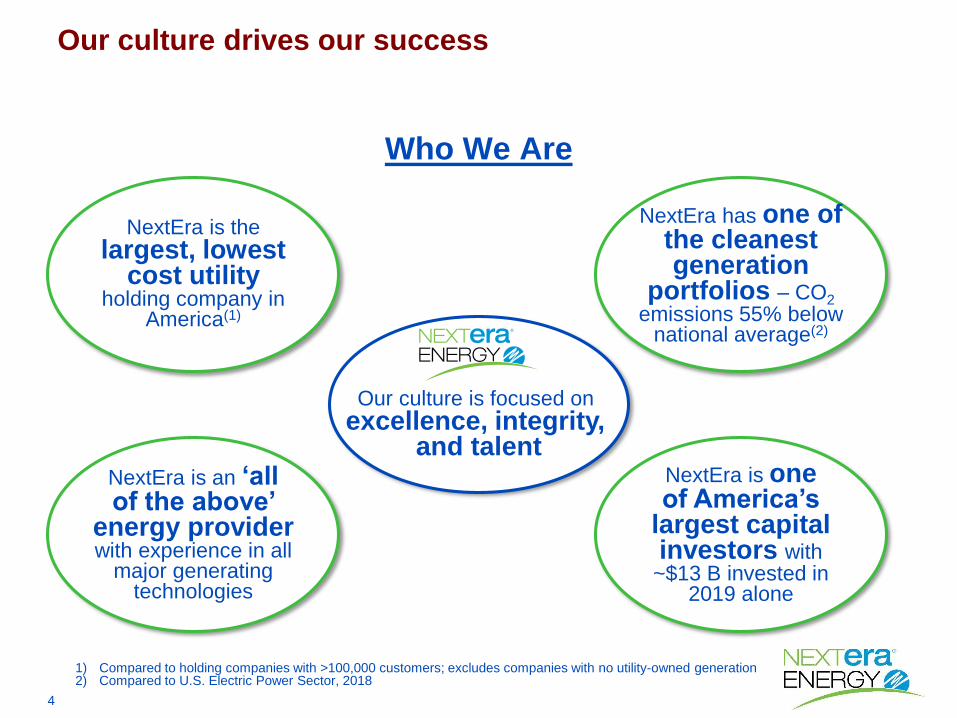
Who We Are
Our culture drives our success
NextEra is thelargest, lowest
cost utility holding company in
America(1)
NextEra has one of the cleanest generation
portfolios – CO2emissions 55% below
national average(2)
NextEra is an ‘all of the above’
energy provider with experience in all
major generating technologies
NextEra is one of America’s
largest capital investors with
~$13 B invested in 2019 alone
Our culture is focused onexcellence, integrity,
and talent
1) Compared to holding companies with >100,000 customers; excludes companies with no utility-owned generation2) Compared to U.S. Electric Power Sector, 2018

5
2018 Top 10 U.S. Capital Investors(1)
NextEra Energy was the fifth largest investor of capital in the U.S. across all sectors in 2018
$19.4 $18.8
$16.7
$12.9 $12.2 $10.8
$9.8 $9.4 $9.1 $8.6
$0.0
$2.0
$4.0
$6.0
$8.0
$10.0
$12.0
$14.0
$16.0
$18.0
$20.0
$22.0
A B C D NEE E F G H I
$ B
Since 2009, NextEra Energy has invested ~$96 B in 45 states across the country
1) NextEra Energy internal estimates based on publicly available information

6
NextEra Energy is America’s largest owner of wind and utility scale solar generation in the United States
2019 U.S. Utility Scale Solar Owners(2)
(GW)
2019 North America Wind Owners(1)
(GW)
15.9
9.0
7.0
4.7
NextEraEnergy
A B C
2.32.0
1.7
3.7
NextEraEnergy
D E F
1) Sources: AWEA WindIQ database as of 2/5/2020 and internal estimates; wind additions exclude build-own-transfer projects
2) GTM Utility PV Tracker and internal estimates as of December 13, 2019; SNL Database3) Includes NextEra Energy Partners assets and other minority-owned assets at ownership share %
(3) (3)
7
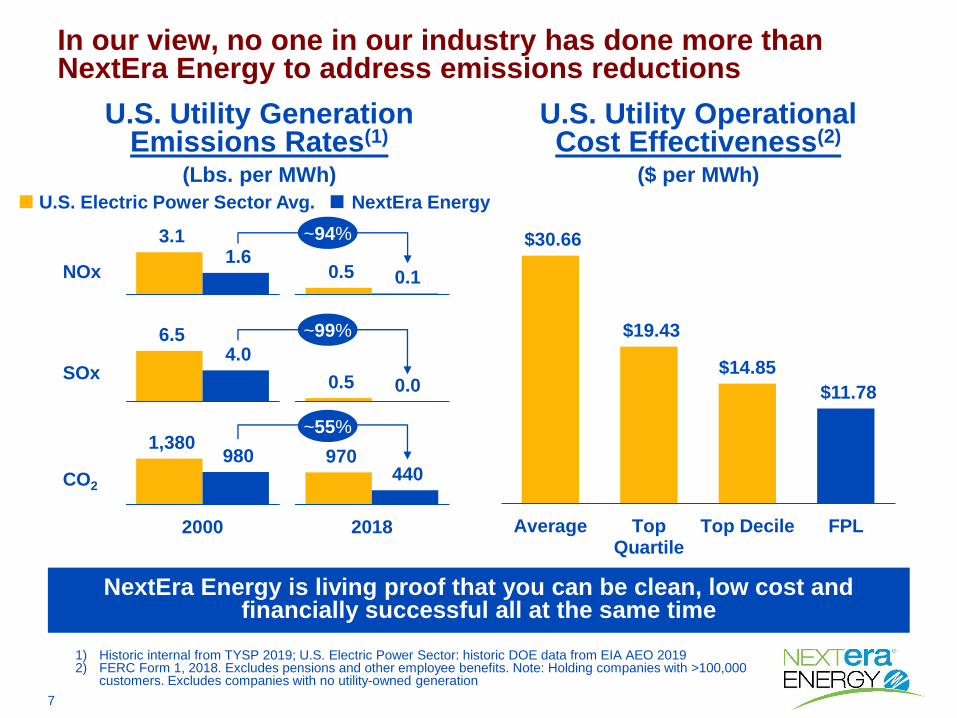
In our view, no one in our industry has done more than NextEra Energy to address emissions reductions
NextEra Energy is living proof that you can be clean, low cost and financially successful all at the same time
U.S. Utility Operational Cost Effectiveness(2)
($ per MWh)
U.S. Utility Generation Emissions Rates(1)
(Lbs. per MWh)
$30.66
$19.43
$14.85
$11.78
Average TopQuartile
Top Decile FPL
1) Historic internal from TYSP 2019; U.S. Electric Power Sector: historic DOE data from EIA AEO 20192) FERC Form 1, 2018. Excludes pensions and other employee benefits. Note: Holding companies with >100,000
customers. Excludes companies with no utility-owned generation
3.1
0.5 1.6
0.1
6.5
0.5
4.0
0.0
1,380 970 980
440
2000 2018
NOx
SOx
CO2
U.S. Electric Power Sector Avg. NextEra Energy
~94%
~99%
~55%
8
Agenda
Overview of NextEra Energy
NextEra Energy's Plan for Santee Cooper
NextEra Energy's Philosophy & Track Record

9
NextEra Energy Winning Culture
Our value proposition is anchored in a culture focused on delivering outstanding results
• Key elements of our culture:
– Setting big goals as well as high standards and expectations
– Passion to be the best and continue our track record of excellence
• Focus on our customers:
– Providing an outstanding value proposition for our customers
– Operational excellence, continuous improvement and delivering on our commitments
• Focus on our people:
– Diverse and talented team of employees who are the foundation of our success
– Commitment to talent development
Accountability, integrity and respect

10
0.00
0.50
1.00
1.50
2.00
2.50
2003 2005 2007 2009 2011 2013 2015 2017 2019 2020YTD
Commitment to Safety
Our commitment to safety is a hallmark of our operating culture and a reflection of our focus on execution
93% improvementin safety performance
OSHA_Recordable
Rate(1)
2.20
0.16
1) OSHA Recordable Incident Rate equals number of Occupational Safety and Health Administration Recordable injuries/illnesses * 200,000/Total Hours Worked
2) As of 1/31/2020
(2)
11
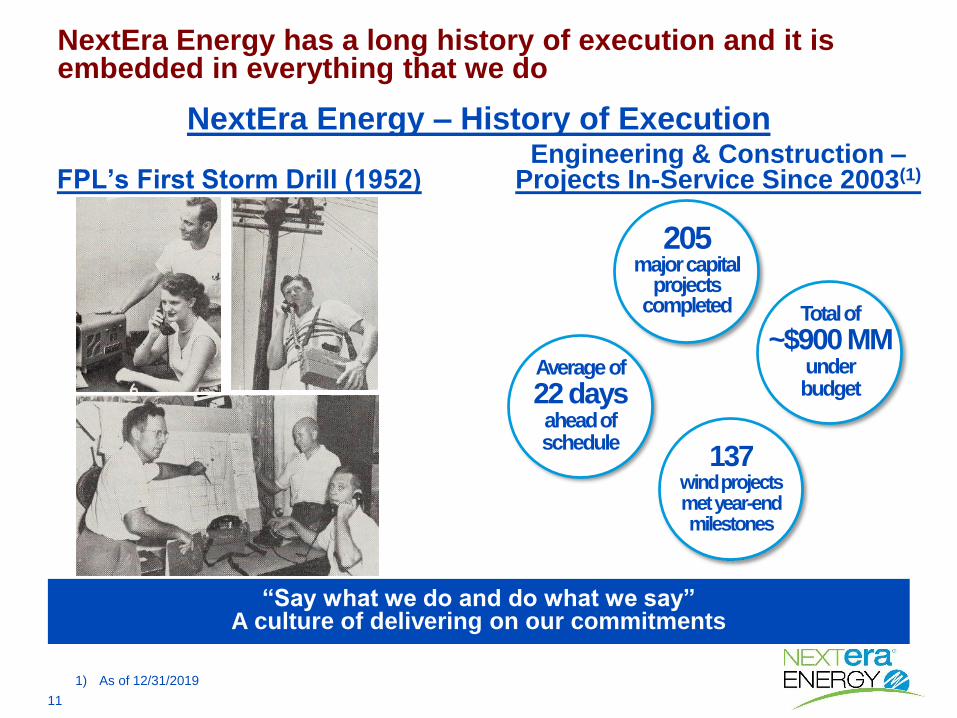
NextEra Energy – History of Execution
NextEra Energy has a long history of execution and it is embedded in everything that we do
FPL’s First Storm Drill (1952)Engineering & Construction –
Projects In-Service Since 2003(1)
205 major capital
projects completed Total of
~$900 MMunder budget
Average of
22 daysahead of schedule
137wind projects met year-end milestones
“Say what we do and do what we say” A culture of delivering on our commitments
1) As of 12/31/2019
12
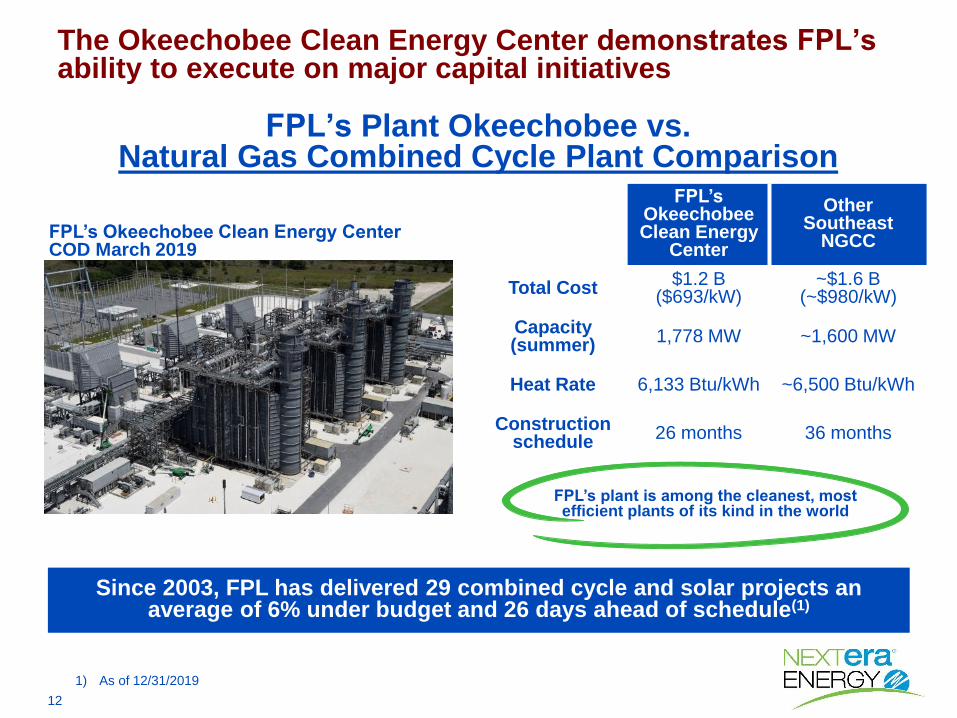
FPL’s Plant Okeechobee vs. Natural Gas Combined Cycle Plant Comparison
The Okeechobee Clean Energy Center demonstrates FPL’s ability to execute on major capital initiatives
Since 2003, FPL has delivered 29 combined cycle and solar projects an average of 6% under budget and 26 days ahead of schedule(1)
FPL’s Okeechobee Clean Energy CenterCOD March 2019
FPL’s Okeechobee Clean Energy
Center
Other Southeast
NGCC
Total Cost$1.2 B
($693/kW)~$1.6 B
(~$980/kW)
Capacity (summer)
1,778 MW ~1,600 MW
Heat Rate 6,133 Btu/kWh ~6,500 Btu/kWh
Construction schedule
26 months 36 months
FPL’s plant is among the cleanest, most efficient plants of its kind in the world
1) As of 12/31/2019

13
2002 – 2019 Customer Fuel Savings
FPL’s generation modernizations have saved customers nearly $10.5 B from fuel efficiency improvements since 2002
$0
$2
$4
$6
$8
$10
$0
$200
$400
$600
$800
$1,000
2002 2004 2006 2008 2010 2012 2014 2016 2018
Annual Fuel Savings Cumulative Savings
Annual Savings
$ MM
Cumulative Savings
$ B~25% improvement
in heat rate
14
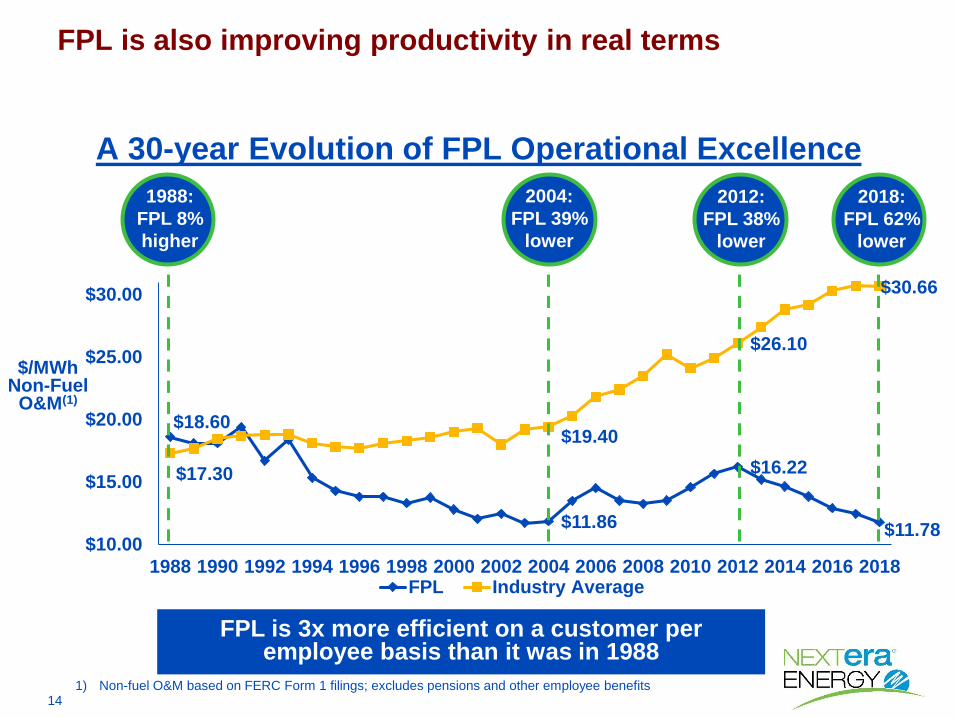
$18.60
$11.86
$16.22
$11.78
$17.30
$19.40
$26.10
$30.66
$10.00
$15.00
$20.00
$25.00
$30.00
1988 1990 1992 1994 1996 1998 2000 2002 2004 2006 2008 2010 2012 2014 2016 2018FPL Industry Average
A 30-year Evolution of FPL Operational Excellence
FPL is also improving productivity in real terms
$/MWhNon-Fuel
O&M(1)
1988:
FPL 8%
higher
2004:
FPL 39%
lower
2018:
FPL 62%
lower
2012:
FPL 38%
lower
FPL is 3x more efficient on a customer per employee basis than it was in 1988
1) Non-fuel O&M based on FERC Form 1 filings; excludes pensions and other employee benefits
15
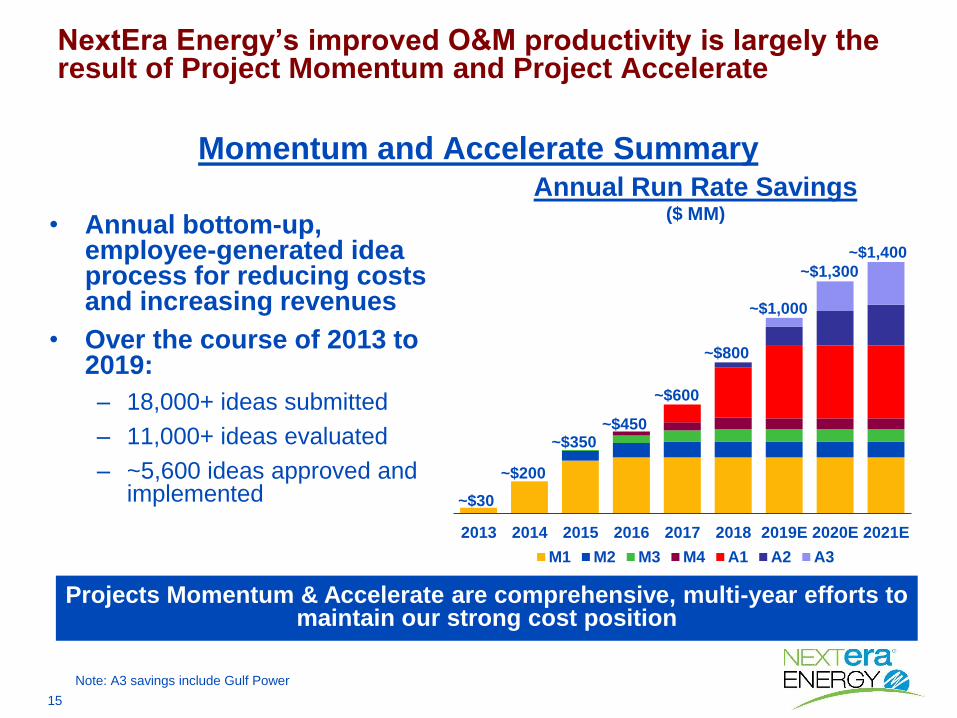
• Annual bottom-up, employee-generated idea process for reducing costs and increasing revenues
• Over the course of 2013 to 2019:
– 18,000+ ideas submitted
– 11,000+ ideas evaluated
– ~5,600 ideas approved and implemented
Momentum and Accelerate Summary
NextEra Energy’s improved O&M productivity is largely the result of Project Momentum and Project Accelerate
Annual Run Rate Savings($ MM)
Projects Momentum & Accelerate are comprehensive, multi-year efforts to maintain our strong cost position
2013 2014 2015 2016 2017 2018 2019E 2020E 2021E
M1 M2 M3 M4 A1 A2 A3
~$30
~$200
~$350~$450
~$600
~$800
~$1,000
~$1,300
~$1,400
Note: A3 savings include Gulf Power
16
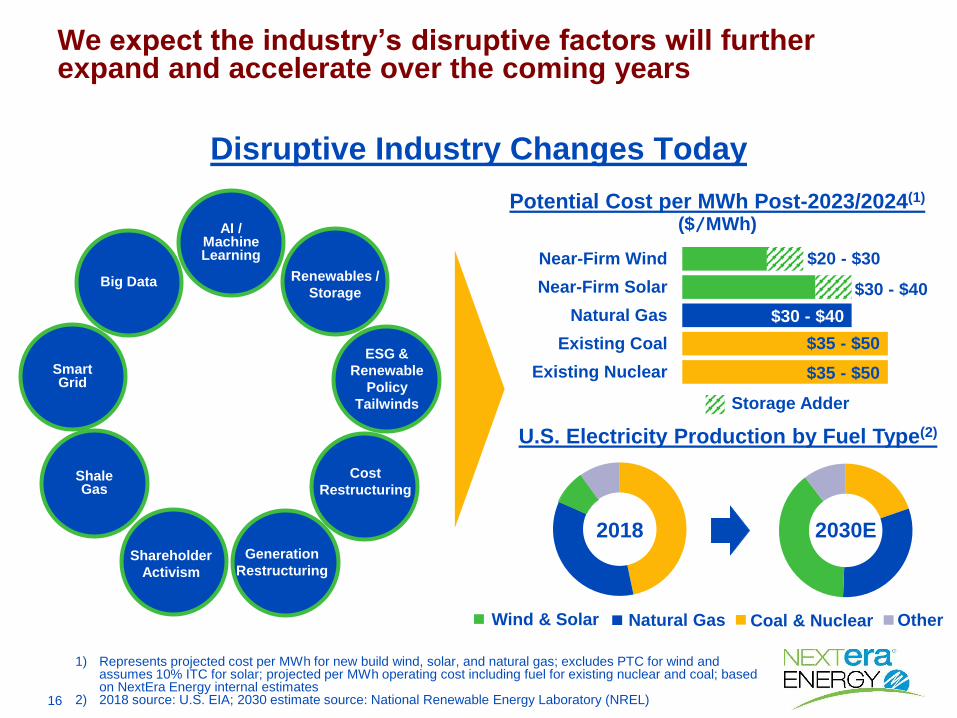
1) Represents projected cost per MWh for new build wind, solar, and natural gas; excludes PTC for wind and assumes 10% ITC for solar; projected per MWh operating cost including fuel for existing nuclear and coal; based on NextEra Energy internal estimates
2) 2018 source: U.S. EIA; 2030 estimate source: National Renewable Energy Laboratory (NREL)
Disruptive Industry Changes Today
We expect the industry’s disruptive factors will further expand and accelerate over the coming years
AI /Machine Learning
Shareholder
Activism
Shale Gas
Generation
Restructuring
Cost
Restructuring
Renewables /
Storage
U.S. Electricity Production by Fuel Type(2)
Existing Nuclear
Existing Coal
Natural Gas
Near-Firm Solar
Near-Firm Wind
2018 2030E
$20 - $30
Potential Cost per MWh Post-2023/2024(1)
($/MWh)
$30 - $40
$30 - $40
$35 - $50
$35 - $50
Coal & NuclearWind & Solar Natural Gas Other
Smart Grid
Big Data
ESG &
Renewable
Policy
Tailwinds Storage Adder

17
Change vs. 2009FPL 2009 FPL 2019
FPL Customer Bill(1) Comparison
Home Insurance
+26%
$108.98
FPL’s typical customer bill is nearly 8% lower today than it was in 2009, even as most other goods and services have increased in price
Medical Care +38%
$100.45
Cable & Satellite
TV+35%
FPL billdown ~8%
(2)
Food+18% Electric
Bills+17%
1) FPL annual average rates based on a typical 1,000 kWh residential bill2) Medical care, cable & satellite TV, home insurance and food data from U.S. Dept. of Labor Consumer Price
Index for January 2009 vs. December 2019; electric bills are national average as reported in EEI Typical Bill and Average Rates Report
18
2018 2021E
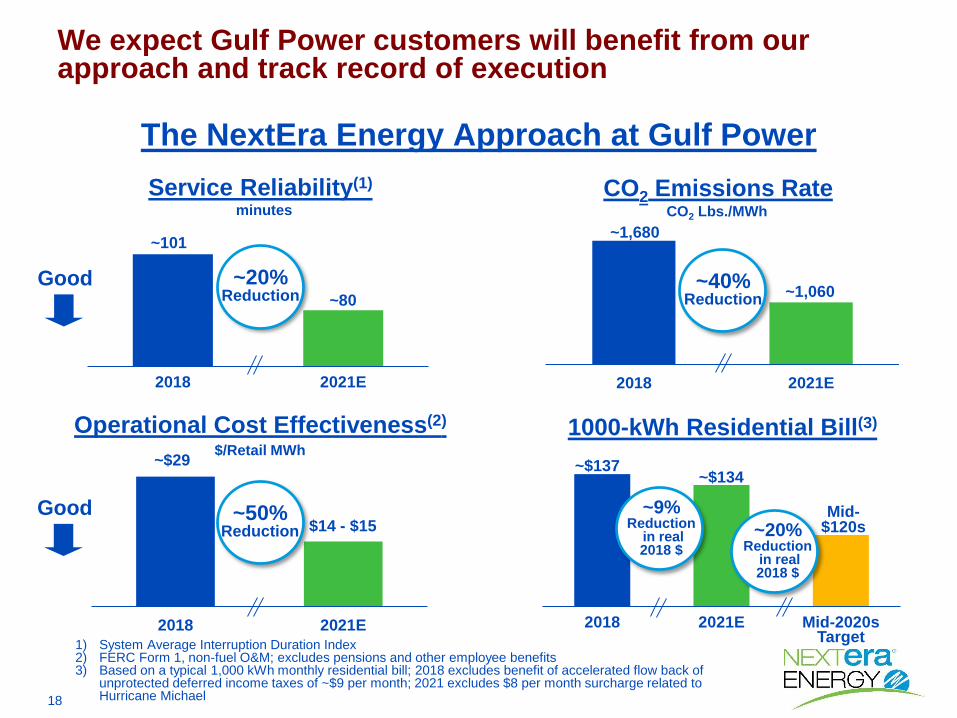
The NextEra Energy Approach at Gulf Power
We expect Gulf Power customers will benefit from our approach and track record of execution
2018 2021E
~101_
~80_
Good
CO2 Emissions RateService Reliability(1)
~1,680
CO2 Lbs./MWh
~1,060
2018 2021E Mid-2020s Target
~$137~$134
1000-kWh Residential Bill(3)Operational Cost Effectiveness(2)
~20%Reduction
~40%Reduction
~9% Reduction
in real 2018 $
Mid-$120s~20%
Reductionin real 2018 $
minutes
2018 2021E
~$29
$14 - $15~50%
Reduction
$/Retail MWh
Good
1) System Average Interruption Duration Index2) FERC Form 1, non-fuel O&M; excludes pensions and other employee benefits3) Based on a typical 1,000 kWh monthly residential bill; 2018 excludes benefit of accelerated flow back of
unprotected deferred income taxes of ~$9 per month; 2021 excludes $8 per month surcharge related to Hurricane Michael
19
Agenda
Overview of NextEra Energy
NextEra Energy's Philosophy & Track Record
NextEra Energy's Plan for Santee Cooper
20
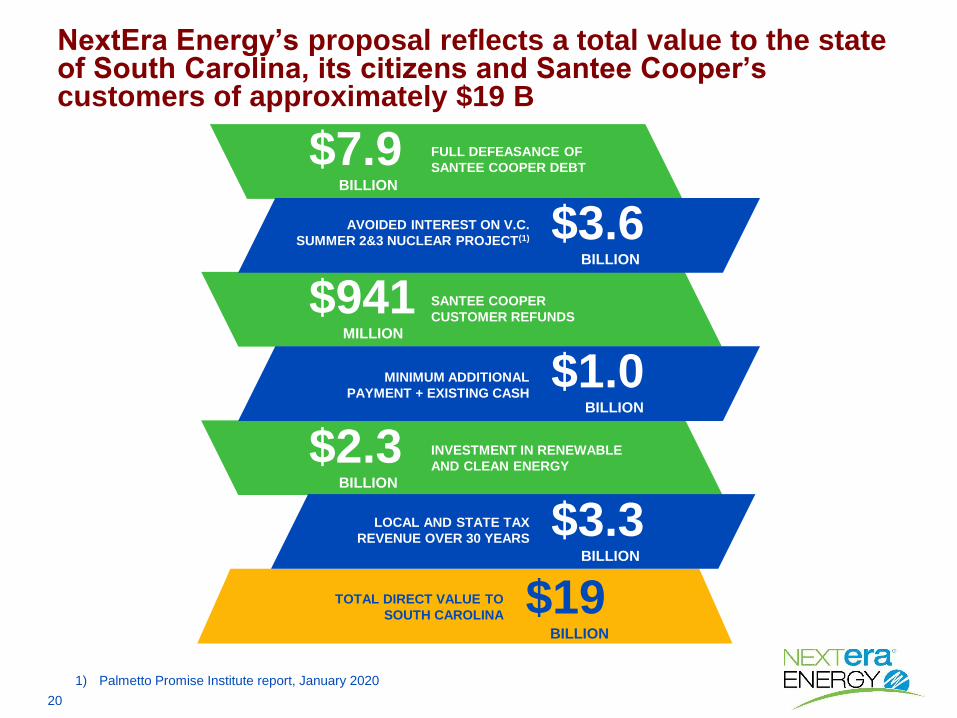
NextEra Energy’s proposal reflects a total value to the state of South Carolina, its citizens and Santee Cooper’s customers of approximately $19 B
$7.9BILLION
$1.0BILLION
$3.3BILLION
FULL DEFEASANCE OF
SANTEE COOPER DEBT
$2.3BILLION
$19BILLION
$941MILLION
SANTEE COOPER
CUSTOMER REFUNDS
MINIMUM ADDITIONAL
PAYMENT + EXISTING CASH
INVESTMENT IN RENEWABLE
AND CLEAN ENERGY
LOCAL AND STATE TAX
REVENUE OVER 30 YEARS
TOTAL DIRECT VALUE TO
SOUTH CAROLINA
AVOIDED INTEREST ON V.C.
SUMMER 2&3 NUCLEAR PROJECT(1) $3.6BILLION
1) Palmetto Promise Institute report, January 2020
21
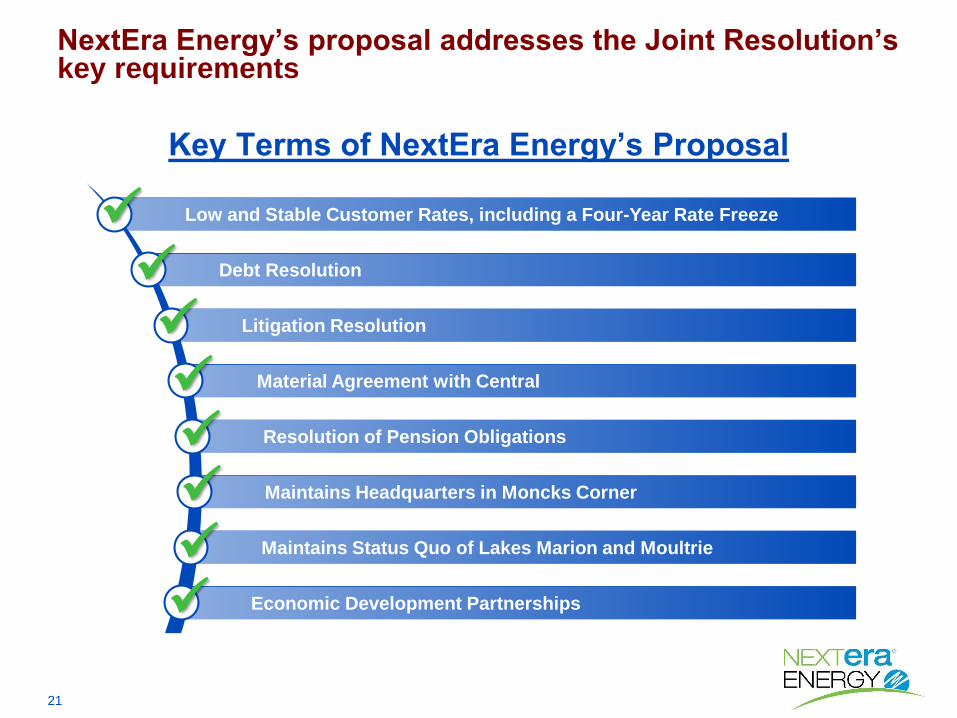
NextEra Energy’s proposal addresses the Joint Resolution’s key requirements
Key Terms of NextEra Energy’s Proposal
Low and Stable Customer Rates, including a Four-Year Rate Freeze
Debt Resolution
Litigation Resolution
Material Agreement with Central
Resolution of Pension Obligations
Maintains Headquarters in Moncks Corner
Maintains Status Quo of Lakes Marion and Moultrie
Economic Development Partnerships
22
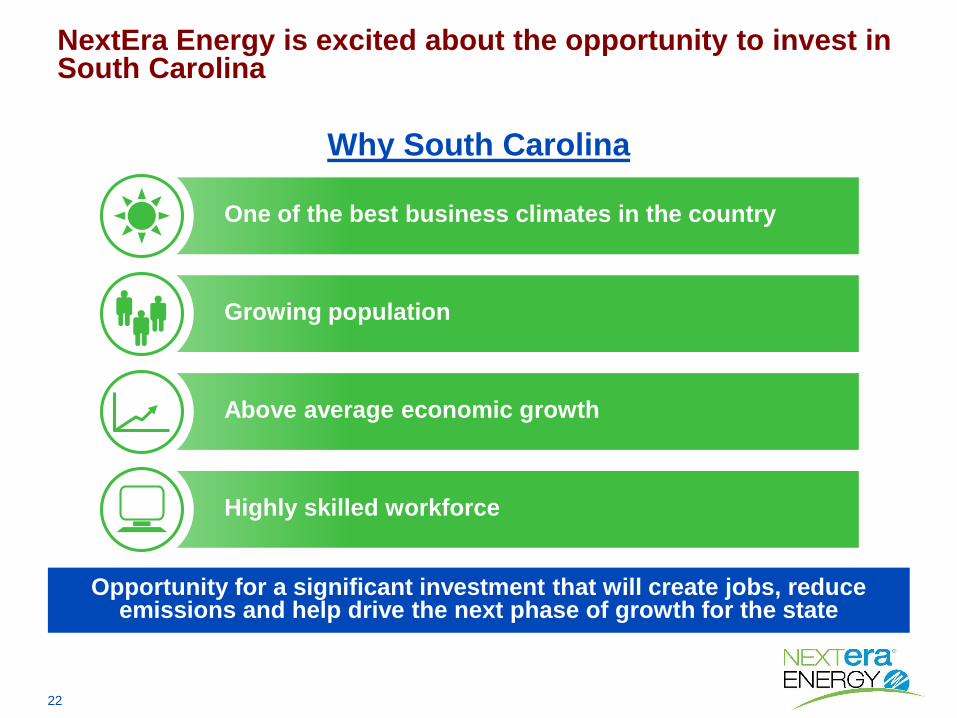
One of the best business climates in the country
Growing population
Above average economic growth
Highly skilled workforce
NextEra Energy is excited about the opportunity to invest in South Carolina
Why South Carolina
Opportunity for a significant investment that will create jobs, reduce emissions and help drive the next phase of growth for the state
23
Our plan for Santee Cooper is similar to the plan we are executing at Gulf Power and have executed at FPL
• Deliver outstanding customer value
• Execute on best-in-class operations
• Modernize the generation fleet
• Access to full resources of the NextEra Energy family
Our Vision for Santee Cooper Power & Light(1)
1) We are referencing the new utility as “Santee Cooper Power & Light Company” and would plan to use that name; however, we are amenable to the use of another name
24
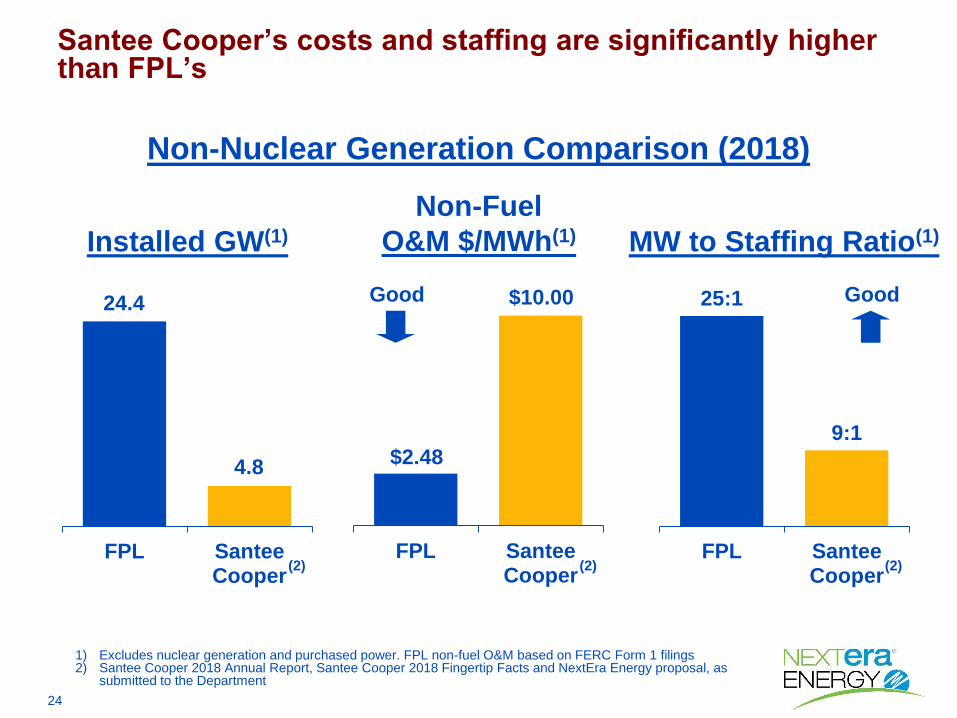
FPL SanteeCooper
4.8
24.4
Santee Cooper’s costs and staffing are significantly higher than FPL’s
Installed GW(1)
FPL SanteeCooper
$2.48
Non-Fuel
O&M $/MWh(1) MW to Staffing Ratio(1)
25:1
9:1
FPL SanteeCooper
Non-Nuclear Generation Comparison (2018)
1) Excludes nuclear generation and purchased power. FPL non-fuel O&M based on FERC Form 1 filings2) Santee Cooper 2018 Annual Report, Santee Cooper 2018 Fingertip Facts and NextEra Energy proposal, as
submitted to the Department
(2) (2)
$10.00Good Good
(2)

25
New Investment
NextEra Energy intends to invest approximately $2.3 B of capital to build new generation units in South Carolina, creating jobs and additional economic benefits
• ~$2.3 B investment in low-cost,
clean and reliable generation
• Retire ~1,150 MW of coal capacity
• Build new generation, including:
– 800 MW of solar across the state
– 50 MW of battery storage
– ~1,250 MW natural gas facility in
Fairfield County
– ~300 MW of additional capacity at
the Rainey Generating Station
Investment is expected to support or create ~5,000 direct and indirect jobs annually(1)
1) Boyette Strategic Advisors study, as submitted to the Department
26
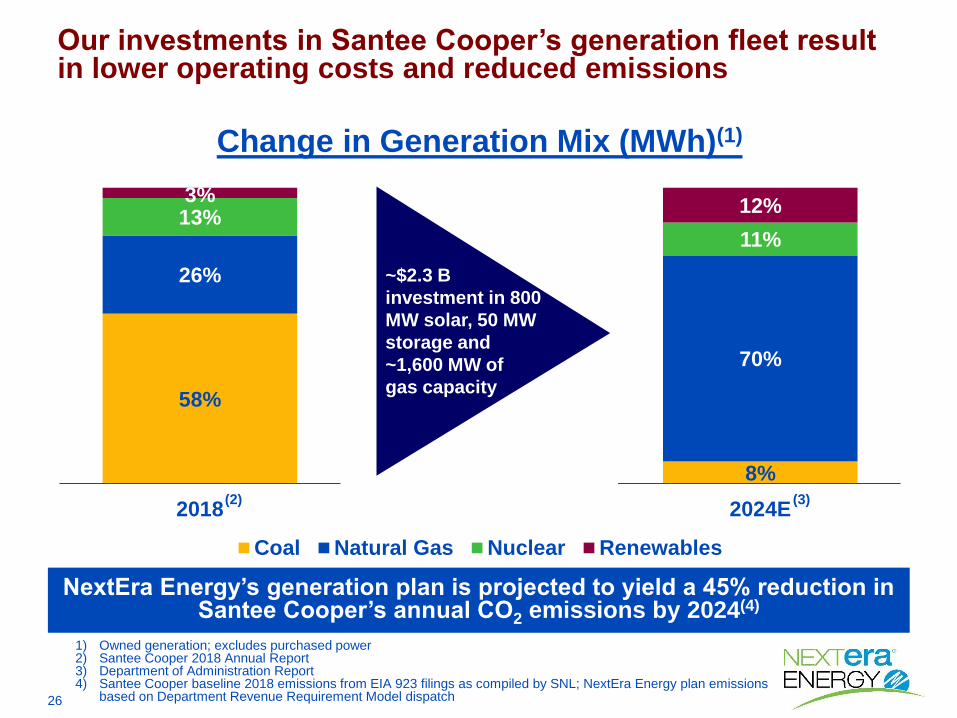
Change in Generation Mix (MWh)(1)
Our investments in Santee Cooper’s generation fleet result in lower operating costs and reduced emissions
Up to
300 MW of
New Solar and
1,860 MW of
New Natural
Gas 58%
8%
26%
70%
13%11%
3%12%
2018 2024E
Coal Natural Gas Nuclear Renewables
~$2.3 B
investment in 800
MW solar, 50 MW
storage and
~1,600 MW of
gas capacity
NextEra Energy’s generation plan is projected to yield a 45% reduction in Santee Cooper’s annual CO2 emissions by 2024(4)
(2) (3)
1) Owned generation; excludes purchased power2) Santee Cooper 2018 Annual Report3) Department of Administration Report4) Santee Cooper baseline 2018 emissions from EIA 923 filings as compiled by SNL; NextEra Energy plan emissions
based on Department Revenue Requirement Model dispatch
27
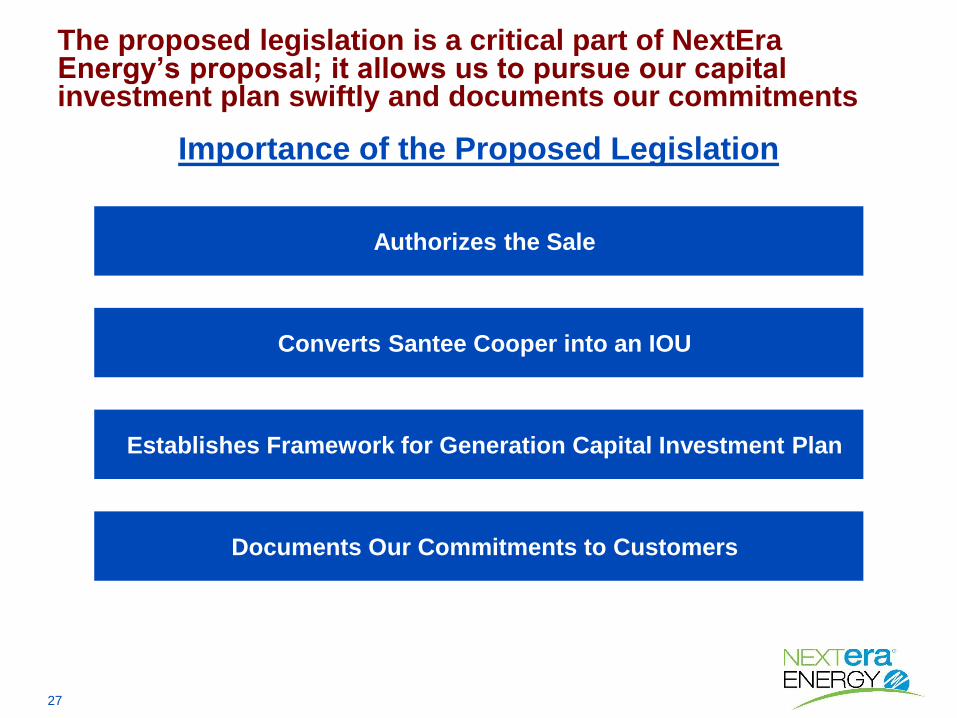
Importance of the Proposed Legislation
The proposed legislation is a critical part of NextEra Energy’s proposal; it allows us to pursue our capital investment plan swiftly and documents our commitments
Authorizes the Sale
Converts Santee Cooper into an IOU
Establishes Framework for Generation Capital Investment Plan
Documents Our Commitments to Customers

28
Average System Rates Comparison
NextEra Energy’s proposal offers rate certainty through a four-year rate freeze, $941 MM of up-front customer refunds and lower long-term rates
1) Range presented is from Santee Cooper’s Reform Plan rate to Santee Cooper’s 2019 budget rates under Department report assumptions
2) Rate freeze rate is $63 as submitted; post-freeze rates per Department report, excluding Department adjustments to O&M expenses and capital expenditures: $941 MM refund amortized over rate freeze period
3) NPV assumes a 6.15% discount rate4) These comparisons to Santee Cooper’s rates make no assumptions with respect to how Santee Cooper will
resolve litigation and the impact of that on customer rates
NextEra’s proposal delivers ~$2.9 B of NPV benefit to customers relative to Santee Cooper’s 2019 budget and ~$400 MM relative to Reform Plan(3,4)
$63
$77
$71 - $78
$78 - $87
$50
$60
$70
$80
$90
2021 - 2024 2021 - 2039
System Average
Customer Rates ($/MWh)
Santee Cooper NextEra Proposal(1) (2)
29
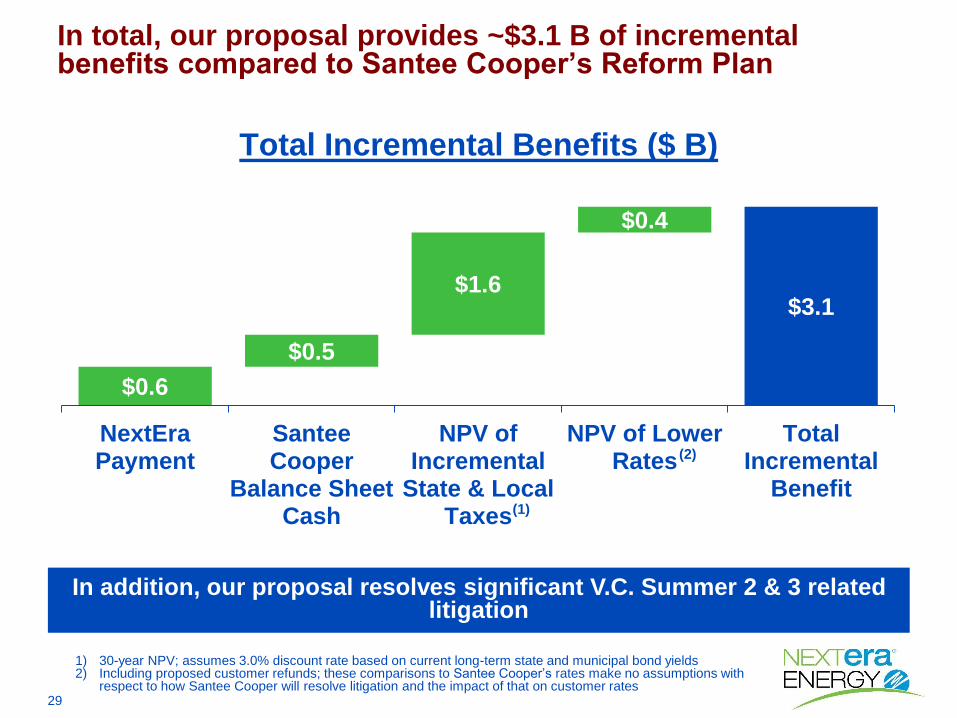
In total, our proposal provides ~$3.1 B of incremental benefits compared to Santee Cooper’s Reform Plan
Total Incremental Benefits ($ B)
$0.6
$3.1
$0.5
$1.6
$0.4
NextEraPayment
SanteeCooper
Balance SheetCash
NPV ofIncremental
State & LocalTaxes
NPV of LowerRates
TotalIncremental
Benefit(1)
1) 30-year NPV; assumes 3.0% discount rate based on current long-term state and municipal bond yields2) Including proposed customer refunds; these comparisons to Santee Cooper’s rates make no assumptions with
respect to how Santee Cooper will resolve litigation and the impact of that on customer rates
(2)
In addition, our proposal resolves significant V.C. Summer 2 & 3 related litigation

30
Commitment to Environmental Stewardship
• Santee Cooper has been the steward of Lakes Marion and Moultrie, South Carolina’s largest and most beloved freshwater resources
• NextEra Energy understands the responsibility of maintaining the economic value and legacy of the lakes for future generations
• Those who enjoy, use or depend on the lakes will not see a change
NextEra Energy understands the responsibility associated with Lakes Marion and Moultrie
NextEra Energy is committed to continuing and improving upon Santee Cooper’s stewardship of the lakes

31
Support for South Carolina Communities
• NextEra Energy has a proven track record as an economic development partner
• We will establish an economic development team in South Carolina
• We will be an active partner in local communities and will maintain Santee Cooper’s current level of charitable contributions
NextEra Energy will maintain commitments to economic development and current charitable contributions
With our low electric rates, we will create an even more powerful economic development engine for South Carolina
32
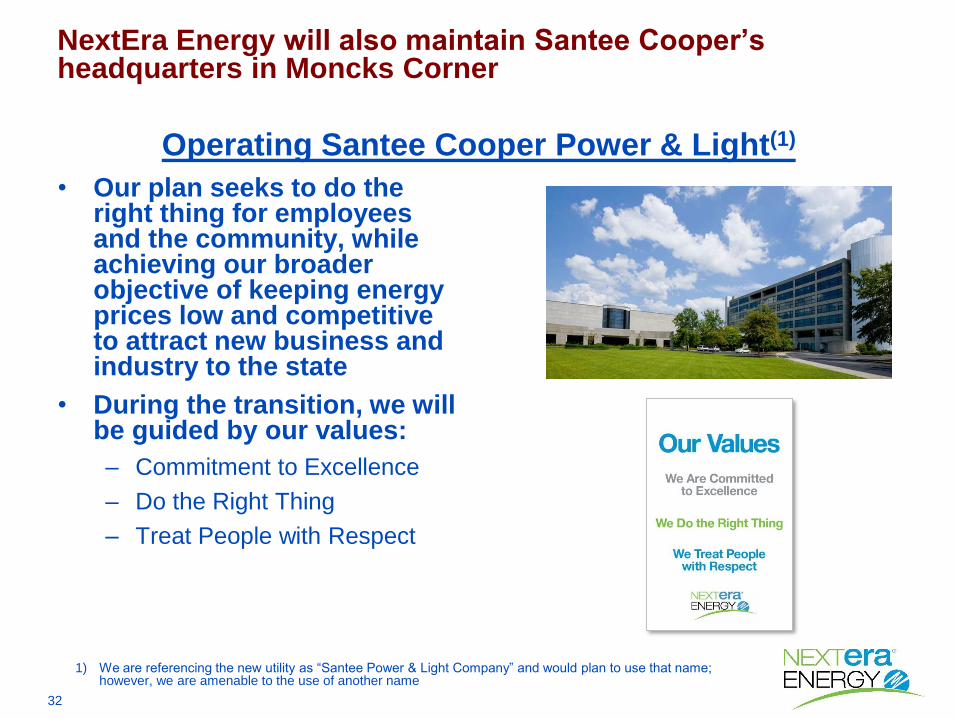
Operating Santee Cooper Power & Light(1)
• Our plan seeks to do the right thing for employees and the community, while achieving our broader objective of keeping energy prices low and competitive to attract new business and industry to the state
• During the transition, we will be guided by our values:
– Commitment to Excellence
– Do the Right Thing
– Treat People with Respect
NextEra Energy will also maintain Santee Cooper’s headquarters in Moncks Corner
1) We are referencing the new utility as “Santee Power & Light Company” and would plan to use that name; however, we are amenable to the use of another name

33
We believe our proposal offers a compelling combination of value and certainty for the state and Santee Cooper’s customers
Summary
• Represents over $19 B of value to South Carolina and the customers of Santee Cooper
– Four-year rate freeze coupled with significant customer refunds
– Repays and defeases Santee Cooper’s existing debt
• Delivers ~$3.1 B of incremental benefits compared to Santee Cooper’s reform plan
– Significant additional proceeds that can be deployed to address critical needs of the state
• Transforms Santee Cooper to a cleaner, more efficient, modern utility
• Enables access to the full resources of the best-run utility in the country
• Provides economic development partnerships that, coupled with low cost energy, will help drive growth in South Carolina
We look forward to working with the state to move the process forward


