Page 1
1
Household Debt and Credit
2015 in Review
Andrew Haughwout
The views presented here are those of the authors and do not necessarily reflect
those of the Federal Reserve Bank of New York, or the Federal Reserve System.
Page 2
2
0
3
6
9
12
15
0
3
6
9
12
15Mortgage HE Revolving Auto Loan Credit Card Student Loan Other
Trillions of Dollars
Total Debt Balance and its Composition Trillions of Dollars
Source: FRBNY Consumer Credit Panel/Equifax
2015Q4 Total: $12.12 Trillion
2014Q4Total: $11.83 Trillion
(3%)
(10%)
(6%)
(9%)
(4%) (68%)
Page 3
3
0.4
0.6
0.8
1.0
1.2
1.4
1.6
1.8
2.0
03
:Q1
03
:Q3
04
:Q1
04
:Q3
05
:Q1
05
:Q3
06
:Q1
06
:Q3
07
:Q1
07
:Q3
08
:Q1
08
:Q3
09
:Q1
09
:Q3
10
:Q1
10
:Q3
11
:Q1
11
:Q3
12
:Q1
12
:Q3
13
:Q1
13
:Q3
14
:Q1
14
:Q3
15
:Q1
15
:Q3
Housing Auto CC Student
Auto and Student Debt Growth has Outstripped
Mortgage and CC
Page 4
4
75
80
85
90
95
100
75
80
85
90
95
100
03:Q1 04:Q1 05:Q1 06:Q1 07:Q1 08:Q1 09:Q1 10:Q1 11:Q1 12:Q1 13:Q1 14:Q1 15:Q1
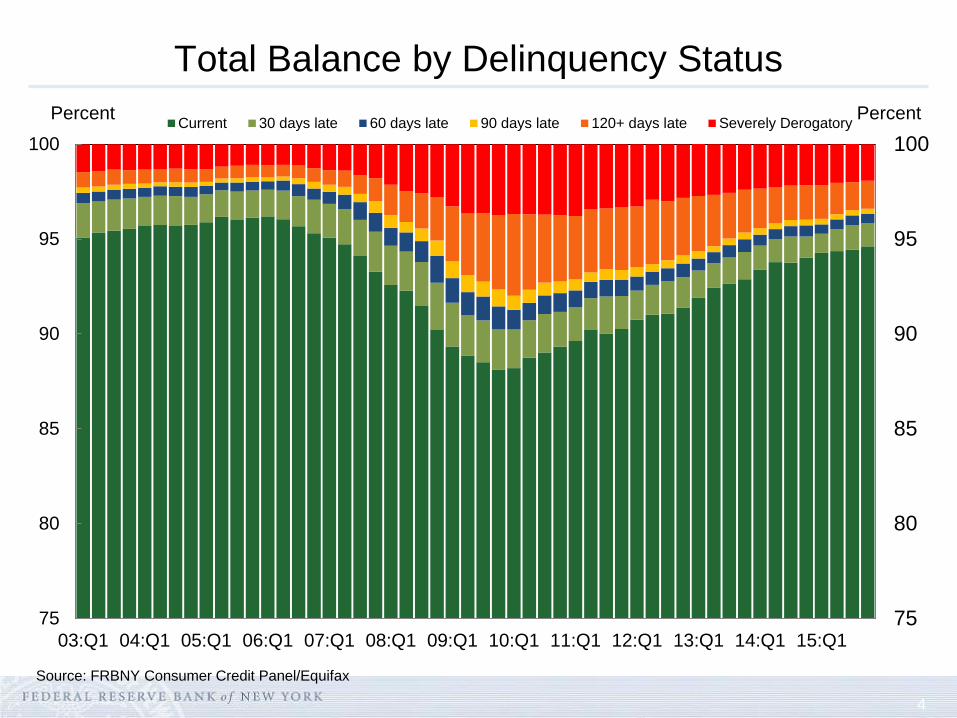
Current 30 days late 60 days late 90 days late 120+ days late Severely Derogatory
Total Balance by Delinquency Status
Percent
Source: FRBNY Consumer Credit Panel/Equifax
Percent
Page 5
5
Transition into delinquency for current mortgages
2015: 1.1%
2000-2005 avg: 1.45%
0.0
0.5
1.0
1.5
2.0
2.5
3.0
3.5
4.0
0.0
0.5
1.0
1.5
2.0
2.5
3.0
3.5
4.0
00:Q1 02:Q1 04:Q1 06:Q1 08:Q1 10:Q1 12:Q1 14:Q1 16:Q1
Percent Percent
Source: FRBNY Consumer Credit Panel/Equifax
Page 6
6
Number of Consumers with New Foreclosures
and Bankruptcies
0
300
600
900
1,200
0
300
600
900
1,200
03:Q1 04:Q1 05:Q1 06:Q1 07:Q1 08:Q1 09:Q1 10:Q1 11:Q1 12:Q1 13:Q1 14:Q1 15:Q1
Foreclosures Bankruptcies
Thousands Thousands
Source: FRBNY Consumer Credit Panel/Equifax
Page 7
7
Notable in 2015
Delinquencies continued to decline
At year end 5.4% of debt was delinquent, lowest since early 2007
New foreclosures are at the lowest level we’ve seen
Data begin in 1999
Bankruptcies also trending down
Student loan delinquency remains high
Total household debt rose $289 billion, or 2.4%
Auto debt led the way, growing $109 billion (over 11%)
Outstanding auto debt crossed the $1 trillion mark in Q2
Other non-housing debt also grew strongly (4.7% - 6.5%)
Housing debt growth has been sluggish since end of deleveraging, and continued in 2015
Page 8
8
WHITHER MORTGAGES?
Page 9
9
Why has mortgage debt been so sluggish?
In spite of rising house prices, mortgage credit hasn’t expanded much
House prices up more than 1/3 since early 2012
But mortgage debt hasn’t grown (up less than 1%)
A stark contrast to last expansion
Both prices and debt roughly doubled 2000-2006
Why is this time different?
Page 10
3000
4000
5000
6000
7000
8000
9000
10000
60
80
100
120
140
160
180
200
2000 2002 2004 2006 2008 2010 2012 2014 2016
House Prices and Mortgage Debt
Index (Jan 2000 = 100) $ Billions
Source: FRBNY Consumer Credit Panel/Equifax and CoreLogic
CoreLogic HPI
(Left Axis)
Mortgage Debt
Outstanding
(Right Axis)
Page 11
11
Fact 1: Foreclosures’ influence is fading
Foreclosures eventually result in debt being “charged off”: disappearing from borrower’s credit report, reducing balances
Charge offs were minor (< $50 billion per year) until 2007
Then grew sharply to > $250 billion in 2009-13
Now declining ($130 billion in 2015)
So foreclosures are still reducing balances, but influence fading
Can’t explain sluggish growth since 2012
Page 12
12
-400
-200
0
200
400
600
800
1,000
20
00
Q4
20
01
Q2
20
01
Q4
20
02
Q2
20
02
Q4
20
03
Q2
20
03
Q4
20
04
Q2
20
04
Q4
20
05
Q2
20
05
Q4
20
06
Q2
20
06
Q4
20
07
Q2
20
07
Q4
20
08
Q2
20
08
Q4
20
09
Q2
20
09
Q4
20
10
Q2
20
10
Q4
20
11
Q2
20
11
Q4
20
12
Q2
20
12
Q4
20
13
Q2
20
13
Q4
20
14
Q2
20
14
Q4
20
15
Q2
20
15
Q4
First and second lien charge offs
$ Billion
Source: FRBNY Consumer Credit Panel/Equifax
Fact 1: Foreclosures’ influence is fading
Page 13
13
Fact 2: Purchases not adding much
Housing transactions typically add to outstanding debt
Some new construction purchased with (net) new mortgages
Housing starts still well below boom levels
Sellers’ (paid off) mortgages are smaller than buyers’ (opened)
Sellers have paid down debt
Especially true when prices are rising, buyer must borrow more
In 2006 and 2007, transactions added $800B - $1T annually
$200B in 2009-11, now back to $350B
Much lower contribution to mortgage debt than during the boom
Page 14
14
-400
-200
0
200
400
600
800
1,000
20
00
Q4
20
01
Q2
20
01
Q4
20
02
Q2
20
02
Q4
20
03
Q2
20
03
Q4
20
04
Q2
20
04
Q4
20
05
Q2
20
05
Q4
20
06
Q2
20
06
Q4
20
07
Q2
20
07
Q4
20
08
Q2
20
08
Q4
20
09
Q2
20
09
Q4
20
10
Q2
20
10
Q4
20
11
Q2
20
11
Q4
20
12
Q2
20
12
Q4
20
13
Q2
20
13
Q4
20
14
Q2
20
14
Q4
20
15
Q2
20
15
Q4
First lien originations plus normal (non-charge-off) payoffs First and second lien charge offs
$ Billion
Source: FRBNY Consumer Credit Panel/Equifax
Fact 2: Purchases not adding much
Page 15
15
Fact 3: Much less cash out than in boom
Borrowers can take cash out of properties without moving
With a cash-out refinance
With a junior lien (eg, Home Equity Loans or Lines of Credit)
Very important during the boom
$300-$400 billion in cash withdrawn per year in 2003-2007
Declined sharply during the bust
$10-$40 billion annual rate since 2012
Much lower contribution to mortgage debt than during the boom
Page 16
16
Fact 3: Much less cash out than during the boom
-300
-200
-100
0
100
200
300
20
00
Q1
20
00
Q3
20
01
Q1
20
01
Q3
20
02
Q1
20
02
Q3
20
03
Q1
20
03
Q3
20
04
Q1
20
04
Q3
20
05
Q1
20
05
Q3
20
06
Q1
20
06
Q3
20
07
Q1
20
07
Q3
20
08
Q1
20
08
Q3
20
09
Q1
20
09
Q3
20
10
Q1
20
10
Q3
20
11
Q1
20
11
Q3
20
12
Q1
20
12
Q3
20
13
Q1
20
13
Q3
20
14
Q1
20
14
Q3
20
15
Q1
20
15
Q3
refinance second lien activity
Source: FRBNY Consumer Credit Panel/Equifax
$ Billion
Page 17
17
Fact 4: First-lien principal pay-down has grown a lot
2015Q4 outstanding mortgage debt is $8.25T
We’ve seen this level 3 times now (all Q4)
2006: $170 billion in annual pay-down (2.1%)
2011: $234 billion in annual pay-down (2.8%)
2015: $288 billion in annual pay-down (3.5%)
$118 billion or 70% increase since 2006 on same base
Page 18
18
-300
-200
-100
0
100
200
300
20
00
Q1
20
00
Q3
20
01
Q1
20
01
Q3
20
02
Q1
20
02
Q3
20
03
Q1
20
03
Q3
20
04
Q1
20
04
Q3
20
05
Q1
20
05
Q3
20
06
Q1
20
06
Q3
20
07
Q1
20
07
Q3
20
08
Q1
20
08
Q3
20
09
Q1
20
09
Q3
20
10
Q1
20
10
Q3
20
11
Q1
20
11
Q3
20
12
Q1
20
12
Q3
20
13
Q1
20
13
Q3
20
14
Q1
20
14
Q3
20
15
Q1
20
15
Q3
refinance first lien paydown second lien activity
Amortization has increased by $90 billion per year since 2009
Fact 4: First-lien principal pay-down has grown a lot
$ Billion
Page 19
19
Why is pay-down share increasing?
Three factors determine pay-down share
Interest rate
Loans with low rates have higher principal pay-down per dollar of payment
Loan age
Older loans have higher principal pay-down per dollar of payment
Term of loan
Loans with shorter terms have higher principal pay-down per payment
All of these factors are currently pushing principal share up
Page 20
20
0%
10%
20%
30%
40%
50%
60%
70%
80%
90%
100%
11
32
53
74
96
17
38
59
71
09
12
11
33
14
51
57
16
91
81
19
32
05
21
72
29
24
12
53
26
52
77
28
93
01
31
33
25
33
73
49
Payment number
30-yr @ 6.8%
30-yr @ 3.5%
15-yr @ 2.7%
Source: Authors’ calculations
Interest rate, term and age determine principal share
Page 21
21
Savings from refinancing a $200,000 mortgage
30-yr @ 6.8%, pmt 78
Principal
Interest
Payment $1,303
Principal $ 263 (4.2% of income)
15-yr @ 2.7%, pmt 1
Principal
Interest
Payment $1,352 (+3.7%)
Principal $ 902 (14.4% of income)
Assumes borrower income of $75,000 finances all payments
Source: Authors’ calculations
Page 22
22
Stock of outstanding debt has aged since 2003
0
10
20
30
40
50
60
70
80
199
9Q
1
199
9Q
3
200
0Q
1
200
0Q
3
200
1Q
1
200
1Q
3
200
2Q
1
200
2Q
3
200
3Q
1
200
3Q
3
200
4Q
1
200
4Q
3
200
5Q
1
200
5Q
3
200
6Q
1
200
6Q
3
200
7Q
1
200
7Q
3
200
8Q
1
200
8Q
3
200
9Q
1
200
9Q
3
201
0Q
1
201
0Q
3
201
1Q
1
201
1Q
3
201
2Q
1
201
2Q
3
201
3Q
1
201
3Q
3
201
4Q
1
201
4Q
3
201
5Q
1
201
5Q
3
25th percentile 50th percentile
75th percentile average
Source: New York Fed Consumer Credit Panel / Equifax
Months since origination
Mean loan age rises from 23 to 50 months
Page 23
23
Mortgage rates much lower, especially for 15-year
-0.4
-0.2
0
0.2
0.4
0.6
0.8
1
0
1
2
3
4
5
6
7
8
9
20
00
- J
an
20
00
- A
ug
20
01
- M
ar
20
01
- O
ct
20
02
- M
ay
20
02
- D
ec
20
03
- J
ul
20
04
- F
eb
20
04
- S
ep
20
05
- A
pr
20
05
- N
ov
20
06
- J
un
20
07
- J
an
20
07
- A
ug
20
08
- M
ar
20
08
- O
ct
20
09
- M
ay
20
09
- D
ec
20
10
- J
ul
20
11
- F
eb
20
11
- S
ep
20
12
- A
pr
20
12
- N
ov
20
13
- J
un
20
14
- J
an
20
14
- A
ug
20
15
- M
ar
30-year 15-year Diff (right axis)7/06: 6.8%
12/12: 2.7%
Page 24
24
Median
25th percentile
10th percentile
500
550
600
650
700
750
800
500
550
600
650
700
750
800
99:Q2 01:Q2 03:Q2 05:Q2 07:Q2 09:Q2 11:Q2 13:Q2 15:Q2
Credit Score at Origination: Mortgages* Score Score
Source: FRBNY Consumer Credit Panel/Equifax
* Credit Score is Equifax Riskscore 3.0; mortgages include first-liens only.
Tight lending standards mean lower interest rates for average borrower
Page 25
25
Effective rate on outstanding mortgages has fallen
0
1
2
3
4
5
6
7
8
19
99
:Q1
19
99
:Q3
20
00
:Q1
20
00
:Q3
20
01
:Q1
20
01
:Q3
20
02
:Q1
20
02
:Q3
20
03
:Q1
20
03
:Q3
20
04
:Q1
20
04
:Q3
20
05
:Q1
20
05
:Q3
20
06
:Q1
20
06
:Q3
20
07
:Q1
20
07
:Q3
20
08
:Q1
20
08
:Q3
20
09
:Q1
20
09
:Q3
20
10
:Q1
20
10
:Q3
20
11
:Q1
20
11
:Q3
20
12
:Q1
20
12
:Q3
20
13
:Q1
20
13
:Q3
20
14
:Q1
20
14
:Q3
20
15
:Q1
20
15
:Q3
Percent
Source: Bureau of Economic Analysis
Down over 50% (380 bps) since 2000
Page 26
26
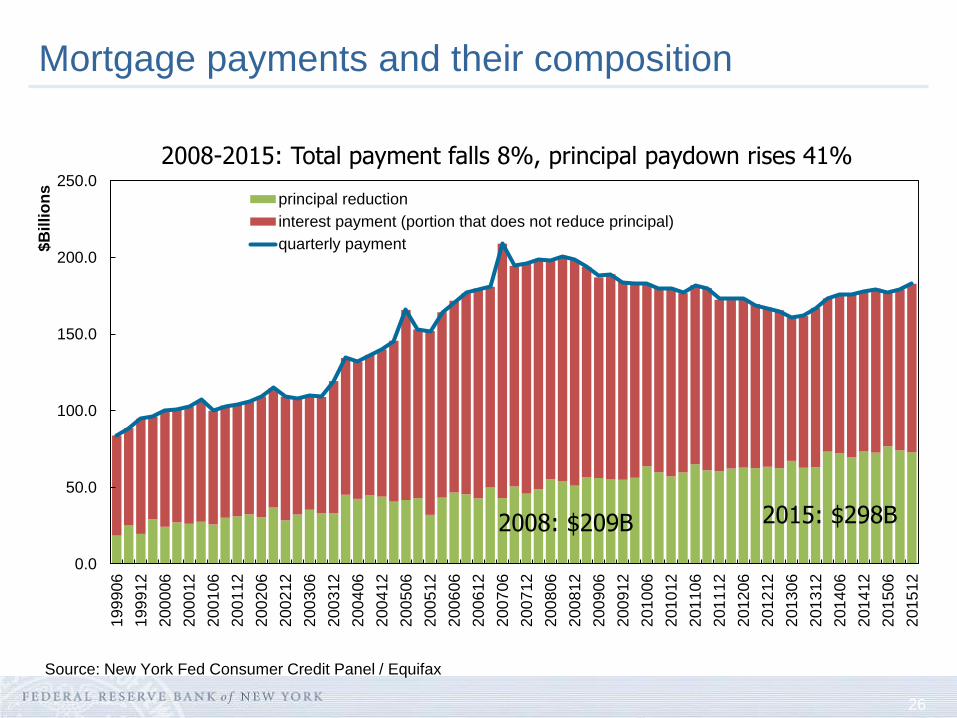
Mortgage payments and their composition
0.0
50.0
100.0
150.0
200.0
250.0
199
906
199
912
200
006
200
012
200
106
200
112
200
206
200
212
200
306
200
312
200
406
200
412
200
506
200
512
200
606
200
612
200
706
200
712
200
806
200
812
200
906
200
912
201
006
201
012
201
106
201
112
201
206
201
212
201
306
201
312
201
406
201
412
201
506
201
512
$B
illi
on
s
principal reduction
interest payment (portion that does not reduce principal)
quarterly payment
Source: New York Fed Consumer Credit Panel / Equifax
2008: $209B 2015: $298B
2008-2015: Total payment falls 8%, principal paydown rises 41%
Page 27
27
Summary
Between 2000-2006, house prices and mortgage debt both doubled
Since 2012 house prices have risen 34%, mortgage debt < 1%
Foreclosures’ effect on reducing debt is fading
Equity withdrawal and transactions adding only modestly to balances
$400 billion vs $1.4 trillion annual
Stable since 2012
A big change: increased principal paydown from aging stock of continuing debt and refinances into lower rate, shorter term debt
$300 billion in paydown annually
A major increase in savings for these households
Page 28
28
Explanations, implications and outlook
Some of this is easy to understand
When borrower doesn’t move or refinance, debt gets older and principal payment goes up
Lower rates and shorter terms refinances largely due to . . .
. . . decline in overall rates
. . . especially low 15-yr r
Tighter standards mean average borrower gets a lower rate
Some of it is less clear
Are less equity withdrawal and transactions due to . . .
. . . borrower caution
or
. . . tighter standards/supply?
Could be a sign of stress for some borrowers (eg young student borrowers)
Page 29
29
Explanations, implications and outlook
Whatever the causes, these factors are increasing personal savings for these borrowers
Existing stock of debt likely to “age in place”
If rates go up, strong incentives to continue in low rate mortgage
Leading to slow increase in pay-down/saving
Could be offset by increase in equity withdrawal or purchase borrowing
But little sign of that yet