+ All Categories
Home > Documents > Household expenditure cycles and economic cycles, …2010) we compare movements of the components of...

Household expenditure cycles and economic cycles, …2010) we compare movements of the components of...

Date post: 07-Jul-2018
Category:
Upload: halien
View: 214 times
Download: 0 times
Share this document with a friend
34
Household expenditure cycles and economic cycles, 1920 – 2010 Steven Gjerstad and Vernon L. Smith Economic Science Institute Chapman University Orange, CA 92866 June 22, 2010 Abstract The recent recession differs from other post-war recessions in two important respects: it has seriously disrupted the financial system, and it has already exhibited strong resilience to monetary stimulus. Yet, as we demonstrate in this paper, the recent recession shares two important features with other post-war recessions: most recessions originate in a pronounced downturn in expenditures on new single-family and multi-family housing units, and the housing sector is the primary transmission channel for monetary policy in both downturns and recoveries. We argue that there are three reasons this recession differs from past recessions. Excessive mortgage credit – augmented by large foreign capital inflows – created a house price bubble. When it collapsed, many households and financial firms were left burdened with extreme balance sheet problems. Consequently, accommodative monetary policy has had a muted impact on households that seek to de-leverage rather than borrow for new housing assets. Moreover, in a saturated housing market, residential construction, which has led all sustained post-war recoveries, has also been suppressed. KEYWORDS: Business cycles, durable goods, financial crises, inflation, investment, monetary policy, residential construction JEL Codes: E22, E31, E32, E52, N1, N6
Transcript

Household expenditure cycles and economic cycles, 1920 – 2010

Steven Gjerstad and Vernon L. Smith

Economic Science Institute

Chapman University

Orange, CA 92866

June 22, 2010

Abstract

The recent recession differs from other post-war recessions in two important

respects: it has seriously disrupted the financial system, and it has already exhibited

strong resilience to monetary stimulus. Yet, as we demonstrate in this paper, the recent

recession shares two important features with other post-war recessions: most

recessions originate in a pronounced downturn in expenditures on new single-family

and multi-family housing units, and the housing sector is the primary transmission

channel for monetary policy in both downturns and recoveries. We argue that there are

three reasons this recession differs from past recessions. Excessive mortgage credit –

augmented by large foreign capital inflows – created a house price bubble. When it

collapsed, many households and financial firms were left burdened with extreme

balance sheet problems. Consequently, accommodative monetary policy has had a

muted impact on households that seek to de-leverage rather than borrow for new

housing assets. Moreover, in a saturated housing market, residential construction,

which has led all sustained post-war recoveries, has also been suppressed.

KEYWORDS: Business cycles, durable goods, financial crises, inflation, investment,

monetary policy, residential construction

JEL Codes: E22, E31, E32, E52, N1, N6

1

1. Introduction

The recent economic crisis – already deservedly labeled the ‘Great Recession’ – continues to

plague the health of the economy as a whole and has motivated us to probe its characteristic

features and compare it to recent historical economic downturns, the Great Depression, and to

the anomalous recession of 2001.1 The boom began with an unprecedented house price

bubble from 1997 to 2006 that was financed by a surge in the net flow of mortgage credit

between 1998 and 2006. The large increase in net mortgage credit was itself fed by an equally

rapid increase in the current account deficit, which surged from $157.2 billion in 1997 (1.60

percent of GDP) to $773.0 billion in 2006 (5.96 percent of GDP).2

This order of real and financial sector declines and the events that led up to it have provided

a fresh perspective with which to examine past economic cycles. We believe that this

perspective is likely to change how economists, policy makers, investors and others think about

monetary policy, housing cycles, and what have commonly been described as “business cycles.”

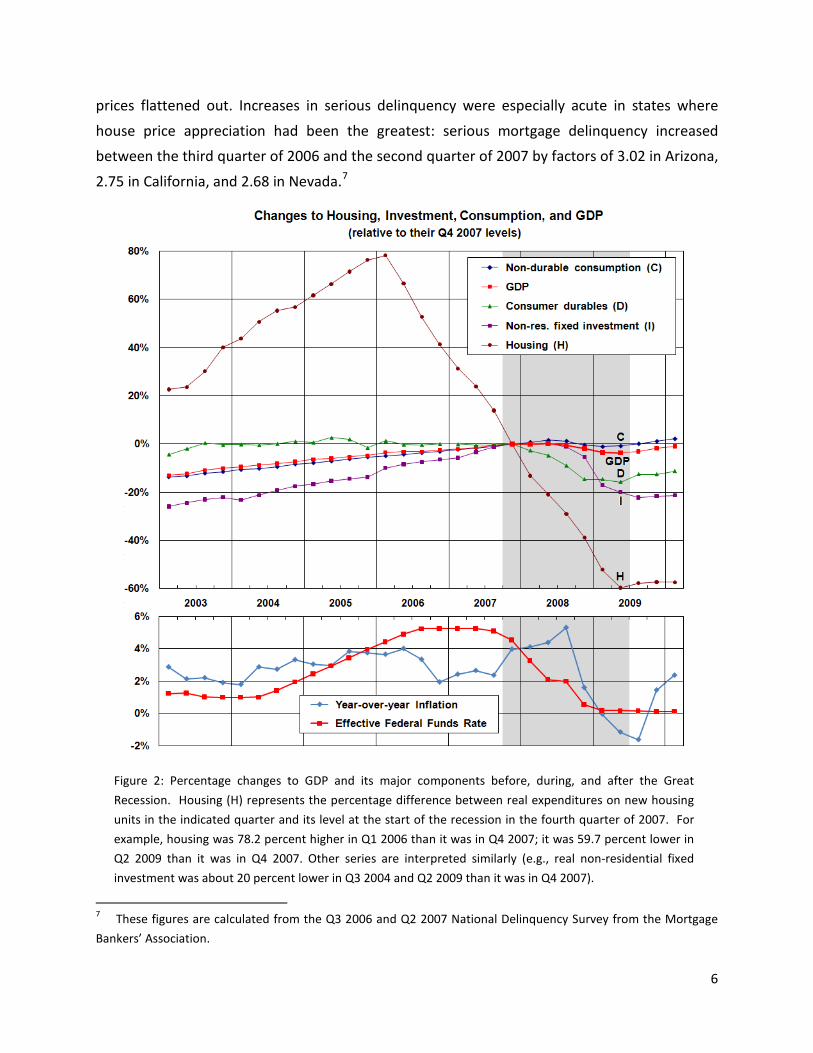
Events in the unraveling of

the bubble were sharply delineated, progressing from (1) a precipitous decline in expenditure

on new single-family and multi-family housing units that began in the second quarter of 2006 to

(2) a rapid house price decline beginning early in 2007, (3) a credit market seizure in August

2007, (4) a substantial decline in prices of financial firms’ stocks in the first half of 2008, (5)

deterioration of the financial system in 2008, (6) an aggressive and unprecedented Federal

Reserve intervention in September 2008, and (7) a sharp decline in output in the fourth quarter

of 2008 and the first quarter of 2009. In the aftermath of these events, many households have

suffered extreme balance sheet damage that has suppressed borrowing for new assets and

durable goods consumption. Households’ decreased expenditure on new housing units and

durable goods have in turn led to a sharp decline in non-residential fixed investment.

We find that eleven of the most recent fourteen economic downturns in the U.S. – from the

Great Depression that began in 1929 to the Great Recession starting in late 2007 – were led by

1 In Gjerstad and Smith (2009a) and Gjerstad and Smith (2009b), we describe the interactions between monetary

policy, financial developments, the housing bubble, and the course of the recent recession. In Smith and Gjerstad

(2010) we compare movements of the components of aggregate output in the Great Depression and the Great

Recession. This paper extends our evaluation of movements in GDP components in the last article to the ten post-

war recessions that preceded the Great Recession. Our examination of the cycles in these components – and

particularly the predominant roles of housing and consumer durable goods expenditures in economic expansions

and contractions – establishes basic facts of economic cycles that are necessary background for more adequate

models of the role that monetary policy plays in exacerbating or moderating economic cycles.

2 All dollar amounts in this section and in the remainder of the paper are inflation adjusted to 2005 dollars unless otherwise noted.

2

declines in expenditure on new single-family and multi-family housing units. In these eleven

downturns, percentage declines in expenditures on new housing units and consumer durables

preceded and exceeded percentage declines in every other major component of GDP. In the

1945 recession – one of the three recessions in which housing was not implicated – national

defense expenditures fell while all major components of private expenditure rose. The other

two – in 1937-38 and 2001 – resulted primarily from declines in non-residential fixed

investment. Figure 1 shows the percentage of GDP contributed by expenditure on new single-

family and multi-family housing units over the past 90 years.

Figure 1: Expenditure on new single-family and multi-family housing units as a percentage of GDP.

Although expenditure on new housing units is not a large component of GDP – which may

explain its limited role in typical macroeconomic accounts of recessions – it is volatile, it has

declined before ten of eleven post-war recessions and the Great Depression, it has rarely

declined substantially without a recession following soon afterward,3

3 In 1950-51 expenditure on new housing units declined sharply and remained at its lower level without a

recession following soon afterward. Durables fell too during the same period, but defense expenditure increased

90 percent more than the decline in housing plus durables expenditures. From early 1964 to early 1966,

expenditure on new housing units declined, but households’ durable goods consumption increased sharply so that

the sum of households’ expenditure on new housing units and consumer durables rose from the first quarter of

1964 to the first quarter of 1966. During 1966, the sum of housing and durable goods declined, but defense

expenditures increased slightly more than housing and durables declined, while a recession was narrowly averted.

and the extent of its

decline emerges as a good predictor of the depth and duration of the recession that follows. In

addition to its role as a leading indicator, and its volatility over the economic cycle, expenditure

3

on new housing units has recovered faster than any other major sector of the economy after

every recession since 1920-21, with the single exception of the 1980 recession when the

housing recovery faltered after two quarters and a new recession began two quarters later.

One of our main objectives in this paper is to demonstrate that interest rate sensitive

components of household expenditures play a large role in economic fluctuations. In order to

demonstrate this, we examine movements in four key GDP components from the National

Income and Product Accounts (NIPA): consumers’ expenditure on non-durable goods and

services (C), consumers’ durable goods expenditures (D), expenditure on new single-family and

multi-family housing units (H), and non-residential fixed investment (I).4

We find that changes in households’ expenditure on new housing units and changes in

investment (primarily firms’ investments in structures and equipment) differ systematically

prior to and during recessions, and in recoveries.

These four elements

of private expenditure have accounted for an average of 78.5 percent of GDP between 1947

and the first quarter of 2010. Most of the remaining 21.5 percent has been accounted for by

government spending, which has averaged 20.2 percent of GDP since 1947.

5

4 For brevity we refer to personal consumption of services and non-durable goods (NIPA Table 1.1.5 lines 5 and 6)

as ‘consumption’ (C), households’ durable goods expenditures (NIPA Table 1.1.5 line 4) as ‘durables’ (D),

expenditure on new single-family and multi-family housing units (from NIPA Table 5.4.5 line 36 and Table 5.3.5 line

19) as ‘housing’ (H), and non-residential fixed investment (NIPA Table 1.1.5 line 9) as ‘investment’ (I). For 1920 to

1928, expenditure on new single-family and multi-family housing units is from

Moreover, housing has varied much more

over the economic cycle in percentage terms than non-residential fixed investment in nine of

the eleven post-war economic cycles; also, the dollar amount of the sum of expenditure on new

housing units and on consumer durable goods has varied more over the economic cycle than

investment in eight of eleven post-war cycles. Although housing is a small portion of the

Grebler, Blank, and Winnick (1956)

Table B-3; consumption and durable goods expenditures are from Swanson and Williamson (1972) Appendix A;

investment is from Swanson and Williamson (1972) Table A-2 Column 3 minus expenditure on new housing units

from Grebler, Blank, and Winnick (1956) Table B-3; and GNP is from Swanson and Williamson (1972) Table 1. All

series are converted from nominal to real figures by dividing by GNP or GDP deflators. For 1920 to 1929 the GNP

deflators are from Balke and Gordon (1989) Table 10. For 1929 to Q1 2010 the GDP deflators are from NIPA Table

1.1.5 line 1 divided by Table 1.1.6 line 1.

5 National Income and Product Accounts and macroeconomic accounts of economic cycles treat housing as an

investment, but housing expenditures have a strong impact on economic cycles that differs systematically from the

impact of non-residential (primarily business) investment. Regardless of whether these expenditures are

investment or consumption, they are determined by households, and their expenditure decisions have a different

temporal pattern than firms’ investments. Therefore, in this paper we will use “housing” or “housing expenditure”

to indicate expenditures on new single-family and multi-family residences, rather than “housing investment.”

4

economy, its movements over economic cycles are sufficient to account for a large portion of

GDP changes, even before taking account of how the decline of income from housing

construction or the decline of household wealth from loss of housing equity affect demand in

other sectors.6

The evidence clearly indicates that housing fluctuates more over the economic cycle than any

other major component of GDP, so it is natural to consider what causes its movements.

Temporary saturation of the housing market appears to be one factor: it certainly has been in

the current recession. We also present substantial evidence that supports the principle

argument in Friedman and Schwartz (1963): monetary policy has a clear effect on the course of

the real economy. But we take their argument a step forward by demonstrating that housing is

an important transmission channel for monetary policy. Housing responds first to tightened

policy and typically recovers first when policy is relaxed.

Since changes in household expenditure on housing and durables precede and

exceed changes in non-residential investment, we argue that “business cycle” is a poor

description for the economic fluctuations in the U.S. over the past ninety years. We offer

evidence that an “economic cycle” is driven by a “household expenditure cycle” which in turn

generates an “investment cycle”: the combination of a household expenditure cycle and an

investment cycle comprises an economic cycle.

We also argue that there are two conditions in which monetary policy is deprived of much of

its power: both conditions are present in the aftermath of the recent recession. First,

accommodative monetary policy primarily affects new residential construction, and therefore a

saturated housing market has only a muted response to monetary easing. Second, when

household balance sheets are damaged in the aftermath of a serious housing bubble and

collapse, households remain unresponsive to accommodative monetary policy as their focus

turns to de-leveraging rather than borrowing for new housing assets or durable goods. In

extreme cases the net flow of mortgage funds turns negative: this occurred in both the Great

Depression and the Great Recession. (The third occurrence, in WWII, was the result of

government controls on new construction and mortgage financing.)

In Section 2 we evaluate the eleven post-war recessions and the Great Depression. Section 3

summarizes percentage changes in major GDP components during these twelve downturns; it

also summarizes the dollar values of declines in housing, durable goods expenditures, and non- 6 An account of the transmission of a decline in mortgage-financed expenditures on new housing units into the

broader economy must address its impact on households’ and financial firms’ balance sheets. We’ve evaluated

this transmission for the ‘Great Recession’ in Gjerstad and Smith (2009a) and (2009b). An examination of the

transmission in other post-war recessions is a task that we plan to undertake in a subsequent paper.

5

residential fixed investment. In Section 4, we offer conclusions from our evaluation of these

downturns, and propose a schematic model of the interactions between monetary policy,

inflation, and changes to GDP components over the economic cycle.

2. Post-war recessions and the Great Depression

In this section, we examine the development of post-war economic cycles. In a typical cycle,

inflation remains low while housing expands. Then inflation begins as housing slows. In

response to developing inflation, monetary policy is tightened and housing begins a sharper

decline. The resulting downturn in the household expenditure cycle reduces inflationary

pressure, but also leads to a turn in the investment cycle as firms encounter reduced demand

for housing and consumer durable goods. The combination of this household expenditure cycle

and the investment cycle form an economic cycle. Seven of the ten post-war downturns fit this

pattern closely. The 1948-49 and 1953-54 recessions fit this pattern in most respects, but large

defense expenditures and wage and price controls disrupted the patterns somewhat. The 2001

recession deviates from this pattern, but there is substantial evidence that the pattern was

disrupted by the huge influx of foreign investment into the housing market.

2.1 The Major Downturns

In the post-war era, three downturns stand out for their duration and their depth: the Great

Recession, the 1973-75 recession, and the “double dip” recessions of 1980 and 1981-82. We

look first at the Great Recession because it is the most familiar episode, it continues to inflict

damage on households and the economy, and recovery from it is uncertain. We then consider

the Great Depression and the other two major post-war recessions.

2.1.1 The Great Recession

The recent recession is widely attributed to a housing bubble that began about 1997 and

culminated with huge house price increases between 2003 and 2005. During the period of

most rapid price increases – between July 2003 and July 2005 – the Case-Shiller composite

index of housing prices in 20 U.S. cities increased 35 percent. Much of the increase was driven

by people who – for a variety of reasons – purchased homes that they could only afford (even

temporarily) if they were able to refinance after house price appreciation. As the flow of

mortgage funds into the market leveled off in late 2005, house prices also began to level off,

and many homeowners who relied on price increases to refinance became financially

distressed. Mortgage delinquencies began to rise rapidly toward the end of 2006 when house

6

prices flattened out. Increases in serious delinquency were especially acute in states where

house price appreciation had been the greatest: serious mortgage delinquency increased

between the third quarter of 2006 and the second quarter of 2007 by factors of 3.02 in Arizona,

2.75 in California, and 2.68 in Nevada.7

Figure 2: Percentage changes to GDP and its major components before, during, and after the Great

Recession. Housing (H) represents the percentage difference between real expenditures on new housing

units in the indicated quarter and its level at the start of the recession in the fourth quarter of 2007. For

example, housing was 78.2 percent higher in Q1 2006 than it was in Q4 2007; it was 59.7 percent lower in

Q2 2009 than it was in Q4 2007. Other series are interpreted similarly (e.g., real non-residential fixed

investment was about 20 percent lower in Q3 2004 and Q2 2009 than it was in Q4 2007).

7 These figures are calculated from the Q3 2006 and Q2 2007 National Delinquency Survey from the Mortgage

Bankers’ Association.

7

During the period of rising house prices, the net flow of mortgage funds increased rapidly.

Between Q1 2002 and Q1 2006 the real mortgage debt of U.S. households increased from $5.97

trillion to $8.97 trillion, an increase of just over 50 percent. This large flow of mortgage credit

into the market supported house price increases, which in turn supported refinancing among

those buyers in the weakest financial condition, thereby accommodating loose underwriting

standards. Obviously, this positive feedback loop would eventually be interrupted. The rapid

increase in serious delinquency in late 2006 and 2007 finally broke the chain when it frightened

investors: between Q2 2006 and Q2 2007, the net flow of mortgage funds fell by one third.

Three quarters later the net flow of mortgage funds turned negative for the first time in the

post-war era. After eight consecutive quarters of decline, nominal home mortgage credit

outstanding has fallen $372.2 billion below its peak level in Q1 2008.

The decline in the flow of mortgage funds then accelerated the price collapse: without credit

flowing into the housing market, there was nothing to support house prices, and the house

price decline gathered momentum. Since so many mortgages had been written with slender

down payments, the house price collapse impacted banks: many banks suffered an impaired

flow of mortgage payments from distressed homeowners, asset value losses on foreclosed

homes, and declining values of mortgage securities on their books.

The impact of these developments on the housing sector is apparent in Figure 2: residential

construction began to collapse in Q2 2006. When investment peaked in Q2 2008, housing plus

durables had been falling for nine quarters and had already fallen $349.0 billion, which was

almost as much as investment fell during the course of the recession. The damage eventually

spread from a large fraction of the nearly six million subprime loans to the broader economy.8

The grey area in Figure 2 shows the recession. We have assumed that the NBER Business

Cycle Dating Committee will eventually date the end of the recession sometime in Q2 2009,

8 In Gjerstad and Smith (2009a) and (2009b) we argue that financing in the low-price tier pushed prices up there,

and increased equity of incumbents in that tier, who in many cases traded up, causing prices to rise in the next tier.

When financing in the low-price tier collapsed, prices there collapsed fastest and farthest. This generated several

problems, each of which reinforced the general decline. Homeowners’ lost equity in the low-price tier ended the

process of ‘trading up’, which reduced demand in higher tiers. (This argument is similar to a model by Ortalo-

Magne and Rady (2007). Ho, Ma, and Haurin (2008) test data from the Hong Kong housing market and find that

movements in lower price tiers precede movements in higher price tiers.) Lost home equity led to financial

distress among homeowners. Their distress reduced the flow of mortgage payments to lenders, which created

financial sector losses. With both households’ and financial firms’ balance sheets under pressure, construction of

new homes, sales of durable goods, and non-residential investment all fell. Each of these problems led to declining

employment, which fed back to generate distress among more homeowners and further consumption declines.

8

although there is some uncertainty about this. As of the Q1 2010 NIPA estimates, real GDP has

still not recovered to its peak level in Q2 2008, or even to its level in Q4 2007, and the

recoveries in both housing and investment are weak, as Figure 2 shows.

Figure 3: Housing value, mortgage debt, and housing equity (value minus debt) grew steadily during the

bubble, but after the bubble collapsed, households were left with high mortgage debt loads and

diminished equity. Although real estate assets are only 30 percent of households’ assets, unlike financial

assets, they are widely distributed across households and for many households they are highly leveraged.

The impact of these developments on households’ balance sheets is indicated by Figure 3,

which shows households’ residential assets, their mortgage debt, and their housing equity

(residential assets minus mortgage debt). The three series grew in roughly similar proportions

throughout the formation of the bubble. When house prices collapsed in 2007 and 2008, a

large portion of the asset value increase was lost, but the higher debt load remained.

2.1.2 The Great Depression

Changes in output by sector in the Great Depression are uncharacteristic of recessions only in

their magnitudes. In every post-war recession except 2001 consumer durables, investment,

and housing all declined, but their percentage declines have never matched the declines during

the depression. During the Great Depression, durable goods expenditures declined 49.2

percent, investment declined 68.6 percent, and housing declined 91.9 percent. In the average

9

of eleven post-war recessions from 1948 to 2007, the corresponding declines were 11.4 percent

(durables), 11.8 percent (investment), and 32.5 percent (housing).

Figure 4: Percentage changes to GNP and its major components before, during, and after the Great

Depression. The interpretation of the series for each component is similar to the interpretation of the series

in Figure 2 for the Great Recession.

In the depression, real gross national product (GNP)9

9 In the NIPA data, Gross Domestic Product (GDP) has been emphasized as the measure of aggregate output since

the 1991 NIPA revision. GDP is the value of products and services produced within the U.S., whereas GNP is the

value of products and services produced by U.S. residents and U.S. owned firms. The 1991 NIPA revision only

applied to the official Commerce Department estimates from 1929 on. For the period from 1919 to 1929, Swanson

and Williamson (1972) revised earlier estimates by

declined 27.7 percent and every major

component of output declined: even non-durable consumption fell by an unprecedented 17.3

percent. In Figure 4 housing peaked in 1925 at a level 58.7 percent higher than its 1929 level.

Other major components of GNP – and GNP itself – all continued to rise until 1929. Every major

component of GNP fell in 1930, but none fell as much as housing. By 1933, housing was only

12.9 percent of its 1929 level and a paltry 8.1 percent of its peak level in 1925.

Kuznets (1961) so that their expenditure categories conform to

the 1965 Department of Commerce definitions. These authors use GNP as the measure of aggregate output – the

standard when they compiled their estimates – so we report GNP in our evaluation of the depression.

10

2.1.3 The 1973-75 Recession

Measured by its average depth times duration, the recession from Q4 1973 to Q1 1975 was

the third largest of the post-war era, exceeded only by the Great Recession and the 1981-82

recession. Though the recession has often been attributed to the Arab oil embargo that began

in October 1973, housing declined for two quarters before the embargo, and the $103.8 billion

housing decline was more than double the additional cost of imported oil and over 2 ½ times as

large as the $40.7 billion investment decline. The decline in housing plus consumer durables, at

$177.2 billion, was 4.35 times as large as the investment decline.

Figure 5: Percentage changes to GDP and its major components before, during, and after the recession of

1973-75. The housing decline was the second largest of the post-war era, as was the decline in durables,

while the investment decline was delayed and moderate. In a common pattern, inflation rose sharply after

housing peaked and inflation peaked during the recession.

11

The 50.6 percent decline in housing was the second largest of the post-war era, exceeded

only by the decline of the Great Recession.10

Monetary policy impacted the onset of and the recovery from the recession. Monetary

policy was loose throughout 1972. Between February 1973 and February 1974 inflation surged

from under 4 percent to 10 percent. In response to surging inflation, monetary policy was

tightened in Q1 1973, housing began to fall in Q2 1973, and the cyclical peak came in Q4 1973,

two quarters later. Inflation peaked seven quarters after housing began to decline, just before

housing reached its trough. The housing decline continued until two quarters after monetary

policy was eased in Q4 1974. Once the federal funds rate was reduced to a level comparable to

its 1972 level, a rapid recovery in housing and in the economy began.

The 17.5 percent decline in durable goods

consumption was the largest of any post-war recession before the Great Recession. The 7.4

percent investment decline was, however, surprisingly small given the depth of the recession.

Moreover, investment peaked three quarters after the recession began.

2.1.4 The 1980 and 1981-82 “Double Dip” Recessions

Measured by its average depth times its duration, the 1981-82 recession was the second

most severe of the post-war era, exceeded only by the Great Recession. Housing fell sharply

from two quarters before until the first quarter after the Q1 1980 cyclical peak, then briefly

recovered before it began a second sharp decline before the 1981-82 recession. Housing fell

40.6 percent during the first decline from Q3 1978 to Q3 1980; during the second decline from

Q1 1981 to Q2 1982 housing fell 36.0 percent. Over an almost four year period, from Q3 1978

to Q2 1982, housing fell 55.2 percent. During those 15 quarters, real GDP grew by a total of 2.2

percent, a growth rate of about one half percent per year, considerably below the 3.8 percent

average growth rate from Q1 1947 to Q3 1978. Investment rose 9.9 percent during this period

when housing collapsed by 55.2 percent. Over the course of the two combined recessions,

housing – which peaked six quarters before the cyclical peak in Q1 1980 – fell $120.9 billion

before it reached bottom in Q2 1982. Investment peaked in Q4 1981 – thirteen quarters after

the housing peak and two quarters before its trough – and fell $131.5 billion over the next six

quarters. Between Q4 1978 and Q2 1982 the sum of housing and durables fell $201.7 billion.

10 The 55.2 percent housing decline between Q3 1978 and Q2 1982 that was associated with the “double dip”

recessions of 1980 and 1981-82 exceeded the 50.6 percent decline between Q1 1973 and Q2 1975, and – as we

show in the next subsection – there is a good case to make that the double dip recessions were one recession

interrupted by a sharp monetary stimulus between May and September 1980, but we follow the convention of

treating the recessions separately in the statistics that we report.

12

Households’ interest rate sensitive components of consumption had a stronger impact on the

development of this serious downturn than non-residential fixed investment: housing plus

durables peaked twelve quarters before investment, and the dollar amount of their decline

exceeded the investment decline by 53.4 percent.

Figure 6: Percentage changes to GDP and its major components before, during, and after the “double dip”

recessions of 1980 and 1981-82. The combined double dip recessions of 1980 and 1981-82 included large

declines in housing and consumer durables, and a three year long period – from Q3 1979 until Q3 1982 –

when real GDP fell. During that three-year period housing fell 51.1 percent yet investment fell only 2.8

percent during the same period.

Monetary policy left a clear imprint on real sector developments over the six year period

represented in Figure 6, and its most pronounced impact was on housing. When President

Carter appointed Paul Volcker as Chairman of the Federal Reserve on August 6, 1979, the Fed

13

targeted money supply growth rates, using the federal funds rate as its instrument to affect the

money supply. Volcker increased the federal funds rate from 9.6 percent when he took office

to 19 percent eight months later. Monetary tightening had a significant effect, especially on

housing, which declined 34.8 percent between Q3 1979 and Q2 1980. By April 1980, the money

supply was contracting rapidly, but the Fed had only sought to reduce its growth rate. In

response, the federal funds rate was reduced from 19.4 percent in early April 1980 to 9.5

percent seven weeks later in late May; it then kept the rate below 10 percent until the end of

August. The effect on housing was sharp, and operated with only a one to two quarter lag.

The housing decline ended in Q3 1980 and an upturn began the next quarter. Monetary

policy, however, was once again tightened with an increase in the federal funds rate from

under 11 percent at the end of September 1980 to over 20 percent at the beginning of January

1981. Housing started down again in Q2 1981, this time falling 36.0 percent in five quarters to

a new post-war low of less than 1.7 percent of GDP in Q2 1982.

In the first two quarters of 1980 when Volcker’s tightened monetary policy first began to

have a strong effect on housing, the inflation rate averaged 14.4 percent. By Q4 1982 when the

recovery began, inflation averaged 4.7 percent. Monetary policy had been tight in ten of

eleven quarters from Q4 1979 to Q2 1982, bringing inflation under control. When monetary

policy was finally eased sharply in Q3 1982, housing again responded almost immediately:

housing increased 92.0 percent between Q3 1982 and Q2 1984.

This episode demonstrates a key argument in Friedman and Schwartz (1963): monetary

policy has a clear impact on the real economy – an argument that has been widely accepted for

30 years. But this natural experiment, in which monetary was tightened and then eased twice in

quick succession, demonstrates another point: monetary policy operates primarily through

interest rate sensitive components of household consumption, especially housing. This point

will be reinforced by our examination of other post-war recessions.

2.2 The Minor Recessions

The three major downturns of the post-war era all conform to our description of economic

cycles. Housing peaks well before downturns, inflation develops as housing levels off or

declines, and monetary policy tightening – a natural response to developing inflation –

accelerates the housing downturn and initiates a sharp decline in inflation. As inflation

subsides, monetary policy is eased, and housing increases sharply. Most post-war economic

cycles conform to this pattern. We now describe the other seven post-war recessions.

14

2.2.1 The 1948-49 Recession

Housing growth between 1945 and Q2 1948 was the strongest of the past century. Between

1932 and 1945, housing averaged only 1.3 percent of GDP. The stock of housing was depleted

during the depression and the world war. Pent-up demand and households’ accumulated

wartime savings led to a surge of housing construction between 1947 and 1956. During those

ten years, housing averaged 4.1 percent of GDP. The housing expansion between late 1945 and

Q2 1948 was more rapid than any other major component of GDP. By Q2 1948 housing

expenditures reached 4.4 percent of GDP.

During the rapid recovery that followed WWII, the consumer price index (CPI) increased by

28.9 percent between June 1946 and June 1948. Federal Reserve open market operations

were limited as a policy instrument from the depression until the Treasury-Fed accord in March

1951. During this period the Fed was required – through its bond price support program – to

passively monetize short-term Treasury debt.11 With limited means to control the money

supply, inflation escalated after the war, and the Federal Reserve was forced to resort to

changes in banks’ reserve ratio (their ratio of reserves on deposit with the Fed and vault cash to

their customers’ deposits) to control lending.12

The major surge in housing came in 1946, when it increased by a factor of four over its 1945

level. Inflation rose rapidly at the same time but had already peaked in Q1 1947 at 18.9

percent, though much of the rise resulted from lifting of wartime wage and price controls.

13

11

Nevertheless, the Fed decided to raise the reserve ratio in three equal steps – on February 27,

June 11, and September 24, 1948 – from 20 percent to 26 percent. Banks reacted with a

contraction to lending that further curtailed inflation but also led to a recession. The money

supply peaked in the same month that the reserve ratio was first increased; housing peaked in

Hetzel and Leach (2001) provide an excellent account of the economic issues and political context that led to

the Treasury-Fed accord on March 4, 1951.

12 For a history of reserve ratios, including changes to required reserves, see Feinman (1993).

13 Freidman and Schwartz (1963, pp. 557-8) note several effects of wartime price controls, such as shortages of

products with small price increases and substitution to available products with greater increases, “changes in

quality or in the services rendered along with the sale of a commodity” with the result that “the elimination of

price controls in 1946 did not involve any corresponding jump in ‘prices’; rather it reflected largely the unveiling of

price increases that had occurred earlier.” This is the only post-war economic cycle in which prices fell before

housing peaked. Some combination of the measurement problems described by Friedman and Schwartz and of

actual price increases on the lifting of price controls most likely impacted the unusual course of prices in this

economic cycle.

15

Q2 1948, several months later. The cyclical peak lagged the first reserve ratio increase and the

fall in the money supply by 10 months, and it lagged the housing decline by two quarters.

Figure 7: Percentage changes to GDP and its major components before, during, and after the 1948-49

recession. Bank reserve ratios were increased once in each of the first three quarters of 1948. Housing

peaked in Q2 1948 and continued to fall until the reserve ratio was lowered in May 1949.

With inflation rapidly falling and largely contained and a recession underway, the Fed

lowered the reserve ratio two percentage points on May 5, 1949 and then lowered it one half

percentage point four times between August 11 and September 1, 1949. Housing and durables

began to recover soon after the first reserve ratio reduction and the recovery began in Q1 1950

as housing surged. As in every post-war recession except 1980, housing and durables

responded first, and responded most, to monetary easing.

16

2.2.2 The 1953-54 Recession

The 1953-54 recession was the fourth largest of the post-war era (also measured by its

average depth times duration). A substantial and sharp decline in housing reached bottom in

Q1 1952, five quarters before the cyclical peak, and then remained near its new lower level for

the next eight quarters. That decline might be considered a false indication of a recession, and

the recession that did follow five quarters later might be considered a recession that was not

led by a housing decline. But the $37.0 billion decline in housing between its peak in Q3 1950

and its trough in Q1 1952 was swamped by the $173.7 billion increase in national defense

expenditures during the same period. Had defense expenditures remained fixed at their level

in Q2 1950 (the last quarter before hostilities began), GDP would have peaked in Q4 1950 and

declined from Q1 1951 through Q2 1952, just after housing reached its trough.

After the outbreak of the Korean War, households anticipated another long war and the

possibility of wartime restrictions on durable goods. Purchases of durables surged 24.0 percent

between Q2 and Q3 1950. Inflation once again shot up, this time from -1.4 percent in Q1 1950

to 8.9 percent in Q1 1951. The year-over-year inflation that we show understates the surge in

inflation late in 1950: the annualized 3-month CPI increase reached 17.2 percent on February 1,

1951.

The Fed responded with an increase to the reserve ratio, as it had in 1948, this time from 22

percent to 24 percent, in two equal steps on January 11 and January 25, 1951. Wage and price

controls, instituted on January 26, 1951, may have contributed to the slowdown of inflation,

but did not stop it. Although housing had already been falling, the housing decline accelerated

after the increase in the reserve ratio. Inflation peaked three quarters after housing peaked, in

spite of the large increase in defense expenditures that sustained GDP growth for two more

years. In most post-war economic cycles, inflation has developed as housing leveled off, and

then subsided as housing contracted. The same pattern occurred in this period, but it is

surprising that in this episode inflation subsided during the housing contraction even as the

government generated a large fiscal stimulus – defense expenditure increased 4.7 times as

much as housing declined – in its effort to contain communist expansion in the Korean

peninsula. Even in this unusual episode, in which aggregate output continued to rise due to

fiscal stimulus, the inflation cycle was more closely related to the housing cycle than to

movements in aggregate output.

Defense expenditure continued to increase for five quarters after housing reached its trough,

in effect forestalling the recession until the July 1953 Korean armistice. Defense expenditures

17

fell substantially in the seven quarters following the armistice, from 14.9 percent of GDP in Q2

1953 to 11.7 percent of GDP in Q1 1955. Over the course of the recession, GDP fell less than

the total decline in defense expenditures. Many components of private expenditure fell only

slightly during the recession, but – in a typical pattern – the recession only ended when housing

began to increase rapidly in the middle of 1954.

Figure 8: Percentage changes to GDP and its major components before, during, and after the 1953-54

recession.

2.2.3 The 1957-58 Recession

The 1957-58 recession was the fifth largest post-war recession. It was the deepest of the

post-war era (slightly deeper than the Great Recession), but unlike the Great Recession, it was

short, the recovery from it was sharp, and housing responded quickly and substantially to a

18

reduction of the effective federal funds rate from an average of over 3 ¼ percent in Q4 1957 to

under 1 percent in Q2 1958. In the five quarters after the trough of the recession GDP

increased 10.2 percent, an 8.1 percent annual growth rate.

Figure 9: Percentage changes to GDP and its major components before, during, and after the sharp

recession in 1957-58.

When investment peaked in Q3 1957 at the peak of the economic cycle, the sum of durables

and housing had already declined in seven of the previous eight quarters, and their $48.5 billion

decline at that point exceeded the $43.9 billion investment decline over the course of the

recession that followed. From peak to trough, the $73.8 billion decline in housing plus durables

was 68.1 percent larger than the investment decline, and the timing of the declines reinforces

the idea that the household expenditure cycle forces the investment cycle.

19

In eight of the nine quarters prior to the start of the recession, housing fell. Expenditure on

consumer durables fluctuated before the recession, but they had fallen 7.8 percent in the two

years prior to the cyclical peak. By contrast, non-residential fixed investment increased in eight

of the nine quarters prior to the recession. During and after the recession, investment fell 16.2

percent, which was the largest percentage decline in any post-war recession prior to the 2001

recession. Yet this large investment decline wasn’t as large in percentage terms as the decline

in housing, which fell 30.4 percent.

As in the period preceding the 1973-75 recession and the 1980 and 1981-82 recessions,

inflation was low while housing surged from Q1 1954 until Q2 1955, and only began to rise as

housing fell during before the recession. As inflation rose in 1956, monetary policy was

gradually tightened and housing continued to decline. Inflation peaked eight quarters after

housing began to decline, a delay one quarter longer than in the 1980 recession and the 1973-

75 recession, and – as in the 1973-75 and the 1980 recessions, and as we’ll see, in the 1969-70

and 1990-91 recessions – most of the inflation reduction came after the recession ended.

2.2.4 The 1960-61 Recession

In the 1960-61 recession, as in all post-war recessions other than 2001, the housing decline

preceded the investment decline. As in all recessions other than 1948-49 and 2001, the fall in

housing plus durables was considerably larger than the investment decline. Housing had

already declined $16.6 billion when investment peaked in Q2 1960 one quarter after the

cyclical peak. From the housing peak to trough, its $23.3 billion decline was 30.2 percent larger

than the $17.9 billion investment decline. From its peak to trough, the sum of housing and

durables fell $47.3 billion, which was over 2.6 times as large as the investment decline.

The 1960-61 recession was mild, both in depth and duration, and may have been avoided

altogether had the monetary tightening of 1959 been discontinued several months earlier.

Recovery from the 1957-58 recession was – like the two previous recessions – very sharp. The

strong recovery led to some concern that inflation might begin again, as it had in 1956 and early

1957 at the end of the 1954-57 expansion. The Federal Reserve increased the federal funds

rate from under 0.7 percent in July 1958 to an average of just over 3 percent in Q2 1959 when

housing peaked.

Although housing peaked in Q2 1959, the Fed continued raising the federal funds rate until

October 1959 when it reached 4 percent, where it was kept until May 1960. By that time a

recession had taken hold, with a large plunge in housing from Q1 to Q2 1960. The Fed

responded with a looser monetary policy starting in Q3 1960. By Q2 1961 the federal funds

20

rate was below 2 percent; the sharp recovery in housing began the next quarter and continued

for eleven quarters, yet inflation remained low until the late stage of the expansion when it

began to rise in 1968 and early 1969.

Figure 10: Percentage changes to GDP and its major components before, during, and after the 1960-61

recession.

2.2.5 The 1969-70 Recession

In the 1969-70 recession housing and durables began to decline before the recession, and

both dropped more sharply than investment after the recession began. From peak to trough

housing fell 20.2 percent, durables fell 11.3 percent, and investment fell 5.1 percent. Housing

plus durables fell $59.0 billion, 2 ½ times more that the $23.3 billion investment decline.

21

Figure 11: Changes in GDP and its major components before, during, and after the 1969-70 recession.

This mild recession demonstrates interactions between inflation, monetary policy, housing

and durables expenditures, and investment, since monetary policy appears to have initiated

changes in all of the other variables. When inflation approached 4 percent in Q1 1968 (for the

first time since Q4 1951), the Fed responded by tightening monetary policy in the first half of

1968: housing responded predictably to the change, peaking three quarters after the increase.

Inflation was rising steadily but moderately throughout the period of monetary tightening. As

the effective federal funds rate and three month Treasury bill rates increased in the middle of

1969 to their highest levels since the Treasury-Fed accord, inflation continued to rise, reaching

5 percent for the first time since the end of 1951 in Q2 1969. Housing reacted to tightening

monetary policy, declining 20.2 percent between Q1 1969 and Q2 1970. Three quarters after

22

the housing decline began, monetary policy was gradually eased, housing reached its trough

two quarters after the easing began, and inflation peaked when housing reached its trough.

2.2.6 The 1990-91 Recession

As is typical of post-war era recessions and the Great Depression, housing led the 1990-91

recession. Housing peaked fourteen quarters before the recession began, fluctuated but fell

moderately over the next nine quarters, and then declined more sharply during the five

quarters before the cyclical peak in Q2 1990. Durable goods and investment both peaked three

quarters before the recession began. From their peaks to their troughs, housing fell 34.8

percent, investment fell 13.4 percent, and durable goods declined 12.8 percent.

Figure 12: Percentage changes to GDP and its major components before, during, and after the 1990-91

recession.

23

In Q2 1986, fourteen quarters into the expansion, the federal funds rate was below 7 percent

for the first time since 1978 and inflation was below 2 percent for the first time since 1965.

Even with the relatively loose monetary policy, housing flattened out at the end of 1986 and

remained flat through 1987 while inflation began to rise. Just as inflation was developing in

early 1987 the federal funds rate was increased modestly, and the Fed was able to maintain the

expansion and avoid inflation well into 1988. By late 1988 and early 1989, inflation was rising

again and housing was fluctuating but overall housing was down from its peak in Q4 1986.

When the Fed tightened monetary policy in the first half of 1989, housing began a sharper

decline. The Fed responded with a slight easing in the second half of 1989, which it maintained

through 1990 while the recession was developing. As we’ve seen in several other recessions –

1970, 1974, 1980, and 2008 – inflation peaked during the recession.14

2.2.7 The 2001 Recession

The Fed began a sharper

easing of monetary policy in Q1 1991, just as inflation began to subside. A rapid housing

recovery began in two quarters later in Q3 1991 as inflation continued to subside.

The 2001 recession was clearly the anomaly of the post-war era, although it was more

concordant with the common belief that business investment drives the economic cycle.

Investment reached a plateau between Q2 and Q4 2000 and started to decline in Q1 2001. (The

crash of the dotcom stock bubble started in Q1 2000 and extended through Q4 2002.) The

Federal Reserve’s concern about investment spending was revealed in its March 20, 2001

FOMC Press Release, stating that “persistent pressures on profit margins are restraining

investment spending.” The Fed responded as the slowdown developed by lowering the

effective federal funds rate from 6.5 percent at the end of Q4 2000 to 5 percent by the end of

Q1 2001. The federal funds rate was reduced another percentage point in each of the three

quarters of the recession between Q2 2001 and Q4 2001, reaching 1.77 percent by the end of

2001. Even with this rapid reduction in the federal funds rate, investment continued to decline.

During the first three quarters of 2002, the federal funds rate remained around 1 ¾ percent,

14 Inflation peaked at 3.73 percent in March 1957, five months before the recession began, in the middle of the

recession ten months later inflation was still at 3.62 percent. After the recession ended, inflation fell until it was

under ½ percent in Q1 1959, then rose until it reached a new peak in Q2 1960 during the 1960-61 recession.

Inflation peaked just before the 2001 recession in Q3 2000 at 3.5 percent, but in the first quarter of the recession it

was still at 3.4 percent. Inflation has generally peaked during or just before a recession. The only exception was

the 1981-82 recession, but even in this case, if we consider the double dip as one recession interrupted by a brief

monetary stimulus from May to September 1980, then the course of inflation between 1978 and 1983 followed

the standard pattern.

24

but investment continued to fall. The housing recovery failed to deliver its usual stimulation to

the recession recovery. In the four quarters following the end of the recession, it increased

only 7.8 percent, far below its 28.3 percent average increase in the four quarters after the

previous nine post-war recessions.

Figure 13: Percentage changes to GDP and its major components before, during, and after the 2001

recession.

In its November 2002 meeting minutes the FOMC lowered the federal funds target rate to 1

¼ percent because “the generally disappointing data since the previous meeting ... pointed to a

longer-lasting spell of subpar economic performance than they had anticipated earlier” and

they concluded that “a relatively aggressive easing action could help to ensure that the current

25

soft spot in the economy would prove to be temporary and enhance the odds of a robust

rebound in economic activity next year.”

Housing had been growing modestly while investment declined, though not enough to offset

reduced investment. On June 25, 2003 the FOMC lowered the federal funds target rate to 1

percent, noting in its Press Release that the economy “has yet to exhibit sustainable growth”

and “with inflationary expectations subdued, the Committee judged that a slightly more

expansive monetary policy would add further support for an economy which it expects to

improve over time.” In Q2 2003, investment turned the corner and began to increase, but the

federal funds rate remained at 1 percent for the next year. Investment growth was slow, even

with the expansionary monetary policy, but housing surged 21.9 percent in the four quarters

when the federal funds rate was 1 percent, from Q2 2003 to Q2 2004.

Although this 21.9 percent increase was large, it was well below the 28.3 percent average

increase in housing during the first four quarters following the nine post-war recessions

between 1948-49 and 1990-91, and this 21.9 percent increase came between the sixth and the

tenth quarters after the recovery began. This suggests to some extent that the Fed didn’t create

the housing bubble through its lax monetary policy: it simply lowered short-term interest rates

to a level that generated a recovery of residential investment that approached the housing

recovery in other post-war recessions. Cross-country evidence in Bernanke (2010) supports this

view. He finds that countries with low monetary policy rates (relative to the Taylor rule) had

house price increases barely higher than countries with higher policy rates. He also replicates

analysis in Fatás et al. (2009) which shows that countries with large trade deficits typically had

high house price appreciation. A country finances a trade deficit largely by issuing or selling

financial instruments; during the U.S. housing bubble, mortgage securities formed a large

portion of the instruments issued to finance our trade deficits. A significant portion of the

funds that supported our housing bubble came from foreign investors, and many of the

mortgages that formed these securities were issued to borrowers in weak financial condition

who eventually were unable to meet the terms of their loans. Thus, the large flow of foreign

investment into the mortgage market and a lack of regulatory oversight of mortgage

underwriting practices combined as significant factors in the formation of the housing bubble.

From the end of June 2004 until the end of June 2006, the Fed raised the federal funds rate ½

percentage point per quarter. Even so, housing increased for six more quarters, as investment

funds sought out the high returns of mortgage securities rather than the anemic returns of

short-term Treasury bills. The combination of massive foreign investment, expansionary

26

monetary policy, and loose mortgage underwriting standards that invigorated housing kept the

2001 recession the mildest of the post-war era, yet it also set the stage for the Great Recession.

3. Summary of GDP component changes

The graphs in this paper show that in recessions, housing typically declines first. Table 1

shows that its declines have been substantially greater in percentage terms than investment

declines. Another way to consider whether housing or investment is more clearly associated

with recessions is by looking at the correlation between the severity of the recession and the

extent of housing declines, and then comparing that to the correlation between the severity of

the recession and the extent of investment declines.15

In the last two columns of Table 1, we examine the growth of housing and of investment in

the first four quarters following each post-war recession. Housing recovered more rapidly than

investment in all recessions except the abortive recovery in between Q3 1980 and Q3 1981.

The average growth of housing in the first four quarters of recovery has been 24.6 percent,

whereas the growth of investment has been only 4.7 percent.

The correlation between recession

severity and housing contraction is 0.796; between recession severity and investment

contraction it is 0.313. The results aren’t much changed if we use recession depth rather than

recession severity in the correlations. The correlation between recession depth and housing

contraction is 0.751; between recession depth and investment contraction it is 0.202. Serious

recessions are more clearly associated with large declines in housing than with large investment

declines.

Housing is a much smaller percentage of GDP than investment. Between Q1 1947 and Q1

2010, it has averaged only 3.0 percent of GDP, whereas investment has averaged 10.7 percent

of GDP. Yet – as shown in table 2 – in seven of the eleven post-war recessions, the dollar

decline in housing has exceeded the investment decline. The dollar decline in housing plus

15 The maximum percentage decline in GDP during a recession is the standard measure of severity. We rank

severity based on the number of quarters that the economy is below peak output, times the average percentage

that GDP is below its peak during the period when output is below the peak. The depth of a recession overstates

the impact of a short, sharp recession like 1957-58 and understates the effect of a longer, shallower recession like

1981-82. The order of post-war recessions differs only slightly in the two measures. The 1973-75 and the 1981-82

recessions are reversed, as are the 1948-49 and the 1980 recessions. The other difference is that the 1957-58

recession was the deepest of the post-war era, but it was only the fifth largest under our measure of severity. A

third method would be to examine deviations between GDP growth rates and trend growth rates, as in Leamer

(2007). Although this has conceptual advantages, we decided against it because it would render the reference

points for our measurements of changes in GDP components less transparent.

27

durables exceeded the investment decline in another recession. In the combined double dip

recessions in 1980 and 1981-82, the sum of housing and durables declined $201.7 billion,

substantially more than the $131.5 billion decline in investment. This leaves two post-war

recessions, 1948-49 and 2001, in which investment declines dominated the downturn.

Table 1: This table shows two measures of the severity of post-war recessions, changes in housing, durables,

and non-residential fixed investment from their pre-recession peaks to their troughs, and the percentage

changes in housing and investment in the first four quarters of the recovery.

Magnitudes of declines tell only part of the story. We’ve shown that housing declines

preceded investment declines in the Great Depression and in every post-war recession except

2001. Green (1997, p. 266) examines the hypothesis that housing causes recessions and

recoveries more formally, with Granger causality tests. He finds that “residential investment

appears to Granger cause GDP … while non-residential investment appears not to Granger

cause GDP. Thus residential investment seems to lead the nation into and out of recession,

while non-residential investment does not. The question remains as to why this should be

true.” Ten years later, Leamer (2007, p. 193) suggests why this might be: “If we choose to

stimulate [housing construction] today, tomorrow our ability to stimulate will be less.” This is a

reasonable hypothesis, and evidence suggests that the quantitative impact of housing

stimulation is large. In Q1 2006, residential construction reached $4,446 per household; by Q2

2009 it had fallen 78.0 percent to $979 per household. In earlier economic cycles, large

Recession Depth

Ave. depth times length

Housing change

Durables change

Investment change

Housing recovery

Investment recovery

2007-09 –3.66% –3.87% –77.1% –18.0% –22.5% 7.7%* –2.2%*

1981-82 –2.87% –3.31% –36.0% –8.8% –15.8% 75.5% 4.9%

1973-75 –3.19% –2.89% –50.6% –17.5% –7.4% 19.4% 1.1%

1953-54 –2.65% –2.35% –31.1% –7.5% –5.0% 26.8% 9.1%

1957-58 –3.73% –2.20% –30.4% –16.2% –16.2% 31.3% 8.3%

1948-49 –1.75% –1.34% –14.6% –3.4% –14.3% 34.4% 24.4%

1980 –2.23% –1.18% –40.6% –16.8% –5.0% –2.3% 8.6%

1960-61 –1.58% –0.84% –21.1% –10.7% –6.6% 13.4% 7.0%

1990-91 –1.36% –0.80% –34.8% –12.8% –13.4% 15.4% –6.2%

1969-70 –0.63% –0.43% –20.2% –10.9% –5.1% 41.1% 4.4%

2001 –0.27% –0.07% –1.1% –2.9% –19.0% 7.8% –8.0%

Average –2.17% –1.73% –32.5% –11.4% –11.8% 24.6% 4.7%

* Recovery from the 2007-09 recession is based on 3 quarters adjusted to annual rates.

28

changes also occurred. In Q1 1973 residential construction reached $3,031 per household, then

fell 52.9 percent to $1,429 in Q2 1975. A new cycle began almost immediately, with an

increase to $2,839 per household in Q4 1978, and a long 68.7 percent decline to $1,173 in Q2

1982. As we’ve seen, monetary policy stimulates housing construction and adds temporarily to

output, in amounts that add meaningfully to household income, even before considering

multiplier effects.

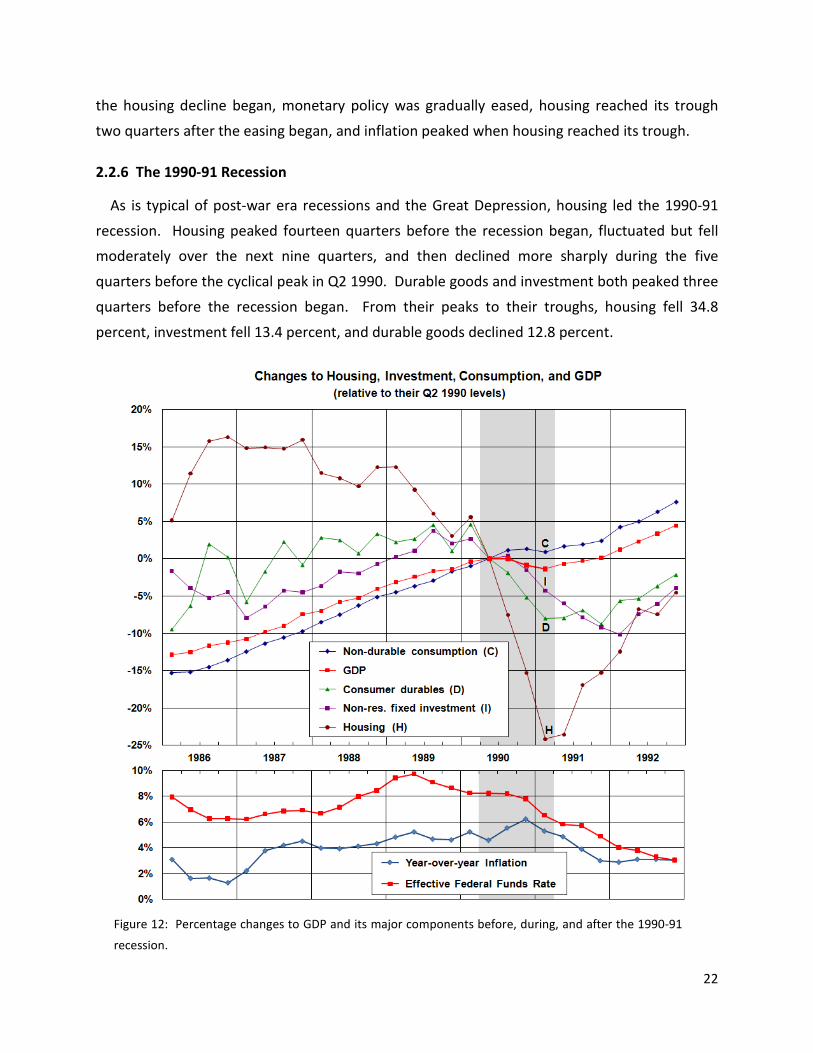
Table 2: This table shows total GDP declines (in billions of 2005 dollars) during the eleven post-war recessions. It also shows declines in housing, durables, and investment. The decline in housing plus durables is slightly lower than the decline in housing plus the decline in durables in each recession, because the peaks and troughs of the declines in these two series differ slightly.

Between 1997 and 2007, large trade deficits were financed by selling financial instruments to

our foreign suppliers, and a large portion of their investment found its way into U.S. housing

markets, which allowed us to sustain a housing construction boom for longer than usual.16

16 The $773.0 billion current account deficit in 2006 amounted to $6,758 per U.S. household, based on the census bureau estimate of 114,384,000 households in the U.S. This is a serious financial stimulus program, even if it brought to us by the invisible hand.

But

housing does react to and correct for excessive and prolonged stimulation. Given the large role

of housing fluctuations in economic activity, a better approach to economic stabilization would

include an effort to stabilize housing rather than attempts to work through periods of weak

economic growth with esoteric methods – such as large foreign capital inflows provided to

Recession GDP Housing Durables Housing

+ Durables Investment

1948-49 –$29.5 –$11.8 –$5.8 –$14.4 –$27.2

1953-54 –$59.8 –$37.0 –$70.2 –$105.9 –$5.1

1957-58 –$97.7 –$35.1 –$41.3 –$73.8 –$43.9

1960-61 –$45.1 –$23.3 –$27.0 –$47.3 –$17.9

1969-70 –$26.8 –$26.8 –$43.0 –$59.0 –$23.3

1973-75 –$157.8 –$103.8 –$84.1 –$177.2 –$40.7

1980 –$131.9 –$88.8 –$90.8 –$168.7 –$29.6

1981-82 –$163.8 –$55.0 –$42.8 –$86.3 –$131.5

1990-91 –$109.4 –$77.4 –$92.4 –$148.0 –$119.5

2001 –$31.2 –$12.0 –$30.4 –$23.4 –$275.4

2007-09 –$489.7 –$392.3 –$202.0 –$579.6 –$358.2

TOTALS –$1342.7 –$863.3 –$721.8 –$1482.6 –$1072.3

29

weak borrowers through relaxed underwriting standards – to stimulate housing and the

economy.

4. Conclusions

The Great Depression, the typical post-war recession, and the current ‘Great Recession’

followed similar sequences: housing increased rapidly during the expansion but fell before the

general contraction began. In many recessions, durable goods expenditures began to fall at the

same time as or soon after housing fell. Firms’ fixed investments have fallen in thirteen of the

past fourteen downturns, yet a downturn in investment has served as a leading indicator in

only two of the past fourteen downturns. Even in one of these two, 1990-91, housing peaked

eleven quarters before investment. The other exception, in 2001, was associated with a

massive capital inflow into the mortgage market and extremely weak underwriting standards

that sustained the housing boom through the recession.

Figure 14: Expenditure on housing, on investment, and on housing plus durables as percentages of GDP

over the past 90 years.

Beyond its poor performance as a leading indicator, investment has often been a lagging

indicator. In five of eleven post-war recessions, investment rose for at least one quarter after

the recession began. In 1953, 1960, and 1981 investment peaked one quarter after the

recession began. In 1974, investment peaked three quarters after the recession began. Even in

30

2008, investment peaked two quarters after the recession began: by that time, housing had

fallen for nine consecutive quarters.

Housing has led eleven of the last fourteen recessions whereas investment has only led the

declines in 1990 and 2001. Magnitudes of movements in housing reinforce its role in what is

universally referred to as the “business cycle.” During post-war recessions the average

percentage decline in housing – at 32.5 percent – was 2 ¾ times as large as the 11.8 percent

average decline in investment. When we aggregate households’ interest rate sensitive

expenditure on housing and durables, their declines (in dollar amounts) have been 38.3 percent

larger than investment declines, and their timing strongly indicate that the investment cycle is a

delayed response to downturns in interest rate sensitive elements of household expenditures.

Monetary policy has left a clear imprint on developments in the real economy. In the

immediate aftermath of most recessions, housing expands more rapidly than any other

component of GDP, and inflation falls. Through the first part of the expansion, housing

increases and inflation remains low. In the latter part of expansions, housing ceases to respond

to loose monetary policy, but inflation starts to develop. In response to developing inflation,

the Fed tightens monetary policy in order to rein in inflation, housing begins a sharper decline,

and the economy enters a recession. In most cases, declines in consumer durable goods

expenditures begin to fall soon after the decline in housing, yet the decline in investment

comes several quarters later, coincident with the start of the recession. Tightened monetary

policy, and the general contraction that follows, eases inflationary pressures. As inflation

subsides, the Fed returns to a looser monetary policy. At that point, housing begins a rapid

resurgence, and the economy emerges from recession. As a recovery gains momentum,

businesses respond to growing demand by increasing their capacity with investments in

structures and equipment. This general pattern has played out in most post-war recessions,

with only minor variations in the sequence of events. A genuine understanding of economic

fluctuations must recognize these basic facts of household expenditure cycles and investment

cycles.

References

Balke, Nathan S. and Robert J. Gordon (1989). “The Estimation of Prewar Gross National Product: Methodology and New Evidence,” Journal of Political Economy 97, pp. 38–92.

Bernanke, Ben (2010). “Monetary Policy and the Housing Bubble,” paper presented at the 2010 American Economic Association meeting.

31

Fatás, Antonio, Prakash Kannan, Pau Rabanal, and Alasdair Scott (2009). “Lessons for Monetary Policy from Asset Price Fluctuations,” in World Economic Outlook (Fall), Chapter 3. Washington: International Monetary Fund.

Feinman, Joshua N. (1993). “Reserve Requirements: History, Current Practice, and Potential Reform,” Federal Reserve Bulletin 79, pp. 569-89.

Friedman, Milton and Anna J. Schwartz (1963). A Monetary History of the United States. Princeton: Princeton University Press.

Gjerstad, Steven and Vernon L. Smith (2009a). “From Bubble to Depression?,” Wall Street Journal, April 6, 2009, p. A15.

Gjerstad, Steven and Vernon L. Smith (2009b). “Monetary Policy, Credit Extension, and Housing Bubbles: 2008 and 1929,” Critical Review 2 – 3, pp. 269–300.

Grebler, Leo, David M. Blank, and Louis Winnick (1956). Capital Formation in Residential Real Estate. Princeton: Princeton University Press.

Green, Richard K. (1997). "Follow the Leader: How Changes in Residential and Non-residential Investment Predict Changes in GDP," Real Estate Economics 25, pp. 253-270.

Hetzel, Robert L. and Ralph F. Leach (2001). “The Treasury-Fed Accord: A New Narrative Account,” Economic Quarterly, Federal Reserve Bank of Richmond.

Ho, Lok Sang, Yue Ma, and Donald R. Haurin (2008). "Domino Effects Within a Housing Market: The Transmission of House Price Changes Across Quality Tiers," Journal of Real Estate Finance and Economics 37, pp. 299-316.

Kuznets, S. (1961). Capital in the American Economy: Its Formation and Financing. Princeton: Princeton University Press.

Leamer, Edward E. (2007). “Housing is the Business Cycle,” Federal Reserve Bank of Kansas City Jackson Hole Symposium.

Otalo-Magne, Francois and Sven Rady (2006). “Housing Market Dynamics: On the Contribution of Income Shocks and Credit Constraints,” Review of Economic Studies 73, pp. 459–485.

Smith, Vernon L. and Steven Gjerstad (2010). “Housing, Depressions, and Credit Collapses,” Financial Times. January 24, 2010.

Swanson, Joseph A. and Samuel H. Williamson (1972). “Estimates of national product and income for the United States economy, 1919-1941,” Explorations in Economic History 10, pp. 53-73.

Wolf, Martin (2008). Fixing Global Finance. Baltimore: Johns Hopkins University Press.

Economic Science Institute Working Papers 

2010

10-01 Dickhaut, J., Lin, S., Porter, D. and Smith, V. Durability, Re-trading and Market Performance.

2009

09-11 Hazlett, T., Porter, D., Smith, V. Radio Spectrum and the Disruptive Clarity OF Ronald Coase. 09-10 Sheremeta, R. Expenditures and Information Disclosure in Two-Stage Political Contests. 09-09 Sheremeta, R. and Zhang, J. Can Groups Solve the Problem of Over-Bidding in Contests? 09-08 Sheremeta, R. and Zhang, J. Multi-Level Trust Game with "Insider" Communication. 09-07 Price, C. and Sheremeta, R. Endowment Effects in Contests. 09-06 Cason, T., Savikhin, A. and Sheremeta, R. Cooperation Spillovers in Coordination Games. 09-05 Sheremeta, R. Contest Design: An Experimental Investigation. 09-04 Sheremeta, R. Experimental Comparison of Multi-Stage and One-Stage Contests. 09-03 Smith, A., Skarbek, D., and Wilson, B. Anarchy, Groups, and Conflict: An Experiment on the Emergence of Protective Associations.

09-02 Jaworski, T. and Wilson, B. Go West Young Man: Self-selection and Endogenous Property Rights.

09-01 Gjerstad, S. Housing Market Price Tier Movements in an Expansion and Collapse.

2008

08-10 Dickhaut, J., Houser, D., Aimone, J., Tila, D. and Johnson, C. High Stakes Behavior with Low Payoffs: Inducing Preferences with Holt-Laury Gambles.

08-09 Stecher, J., Shields, T. and Dickhaut, J. Generating Ambiguity in the Laboratory.

08-08 Stecher, J., Lunawat, R., Pronin, K. and Dickhaut, J. Decision Making and Trade without Probabilities.

08-07 Dickhaut, J., Lungu, O., Smith, V., Xin, B. and Rustichini, A. A Neuronal Mechanism of Choice.

08-06 Anctil, R., Dickhaut, J., Johnson, K., and Kanodia, C. Does Information Transparency Decrease Coordination Failure?

08-05 Tila, D. and Porter, D. Group Prediction in Information Markets With and Without Trading Information and Price Manipulation Incentives.

08-04 Caginalp, G., Hao, L., Porter, D. and Smith, V. Asset Market Reactions to News: An Experimental Study.

08-03 Thomas, C. and Wilson, B. Horizontal Product Differentiation in Auctions and Multilateral Negotiations.

08-02 Oprea, R., Wilson, B. and Zillante, A. War of Attrition: Evidence from a Laboratory Experiment on Market Exit.

08-01 Oprea, R., Porter, D., Hibbert, C., Hanson, R. and Tila, D. Can Manipulators Mislead Prediction Market Observers? 


Recommended