This work is licensed under the Creative Commons Attribution 4.0 International licence. You are free
to copy, distribute, and adapt the work, as long as you attribute the work to Statistics NZ and abide by
the other licence terms. Please note that you may not use any departmental or governmental
emblem, logo, or coat of arms in any way that infringes any provision of the Flags, Emblems, and
Names Protection Act 1981. Use the wording 'Statistics New Zealand' in your attribution, not the
Statistics NZ logo.
Liability
The opinions, findings, recommendations, and conclusions expressed in this paper are those of the
authors. They do not represent those of Statistics NZ, which takes no responsibility for any omissions
or errors in the information in this paper.
Citation
Bentley, A (2016, May). Household-group inflation: methods to combine expenditure patterns. Paper
presented at Meeting of the Group of Experts on Consumer Price Indices, Geneva, Switzerland
2
Abstract
Household living-costs price indexes (HLPIs) will provide greater insight into the inflation experiences for groups of New Zealand households (beneficiaries, superannuitants, Māori, and income/expenditure quintiles). In this paper, we discuss results from an empirical investigation of different weighting methods and outline our approach to user engagement.
We found that within-group variation in inflation experiences means that it matters how we decide to aggregate household expenditure patterns. Under our conceptual aim of price indexes to reflect changes in the purchasing power of income, we addressed the question: What matters most – the inflation experience for the group as a whole or for a ‘typical’ household within each group?
Equally weighted household-specific expenditure shares (‘democratic’ weights) are compared with aggregate household expenditure (‘plutocratic’ weights). We discuss the interplay between weighting methods and the choice between using income or expenditure to best proxy households’ standard-of-living.
1. Introduction
This paper is in two parts. The first section will introduce New Zealand’s household living-costs price indexes (HLPIs), new measures of inflation for groups of households. We explain the need for additional measures, describe the conceptual approach and methods that will be used, and outline our approach to user engagement. An overview of the historical and international context of population-group measures of consumer price change provides orientation for the remainder of the paper.
The second section focuses on how to combine expenditure patterns. The HLPIs will use equally weighted household-specific expenditure shares (‘democratic’ weights). We explain why we chose this approach after public consultation.
We discuss results from an empirical investigation of different weighting methods by revisiting a feasibility study prepared for the 2013 CPI Advisory Committee (Bentley, 2013). Using data collected over a four-year period (2008–12), equally weighted household-specific expenditure shares are compared with aggregate household expenditure (‘plutocratic’ weights).
We conclude by looking at what we can learn about measuring household standard-of-living by comparing differences in expenditure patterns between weighting methods, for income and expenditure quintiles. These differences also provide insights into consumer luxuries and necessities.
1.1 Background
The consumers price index (CPI) measures the change in prices of goods and services acquired by New Zealand-resident private households. It is an aggregate measure that represents the price change experienced on average by households. This makes it well suited for use as a national barometer of inflation. The methods are aligned with the CPI’s principal use as a macroeconomic indicator for monetary policy purposes. Yet, hidden behind all averages is a distribution. The distribution of inflation means that the CPI does not necessarily align well with inflation experienced by different demographic groups.
3
To better meet this information need, new measures of inflation are being developed for groups of households, called household living-costs price indexes (HLPIs). These will provide greater insight into the inflation experienced by 13 different household groups:
• Beneficiaries
• Māori
• Income quintiles (five groups)
• Expenditure quintiles (five groups)
• Superannuitants.
The conceptual design of the HLPIs differ from the CPI in a couple of important ways.
1. The treatment of owner-occupied housing and interest payments will better align with individual household experience. We will use the ‘payment’ approach.
2. The aggregation method used will better reflect the inflation experienced by a ‘typical’ household within each group. We will use equally weighted household-specific expenditure shares (‘democratic’ weights).
1.2 Public consultation
The decision to create the HLPIs was a response to the 2013 CPI Advisory Committee recommendations and associated submissions from public consultation in 2014 (Statistics NZ, 2014a). The committee, a customer group set up to advise on the CPI, reconfirmed the CPI’s principal use is to inform monetary policy-setting, and acknowledged that its design is a compromise between this principal use and other uses, such as adjusting a range of public and private payments.
It was in this light that the committee recommended we provide extra indexes to reflect changes in the purchasing power of incomes for different demographic groups (Statistics NZ, 2013).
Figure 1
Timeline of public consultation
In October and November 2015 we conducted additional public consultation to ask customers their views on a number of technical decisions that will feed into the development of the HLPIs (Statistics NZ, 2015).
We’re due to start publishing the quarterly HLPIs later this year.
1.3 Design outline
For any group, there are two basic ingredients for measuring inflation:
1. Commodity-level price change
2. Expenditure patterns to aggregate price change.
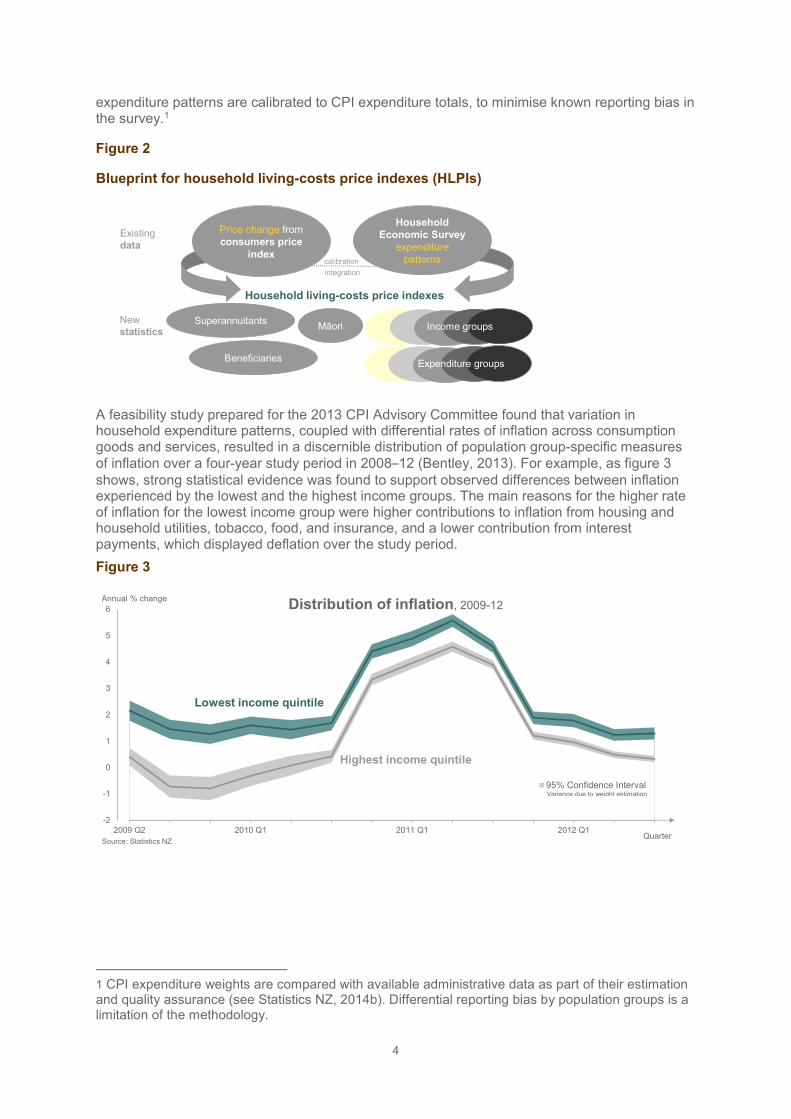
The approach to calculating the HLPIs will be to use population-group-specific expenditure patterns from the Household Economic Survey (HES) to weight the lowest-level price indexes in the CPI basket of goods and services (see figure 2). The basket comprises about 700 commodities and is designed to be a representative sample of consumer spending. The HES
Feasibility study published Historical review published NZAE conference paper Quarterly publication
Apr 2013 Jul 2015 Jul/Aug 2016
May 2013 Feb 2014 Aug 2014 Oct/Nov 2015 Mar 2016
Public submissions Public consultation on recommendations Public consultation on HLPIs
2013 CPI Advisory Committee Meeting Decision to publish HLPIs Decisions following consultation
(Bentley, 2014)(Bentley, 2013) (Bentley, 2015)
4
expenditure patterns are calibrated to CPI expenditure totals, to minimise known reporting bias in the survey.1
Figure 2
Blueprint for household living-costs price indexes (HLPIs)
A feasibility study prepared for the 2013 CPI Advisory Committee found that variation in household expenditure patterns, coupled with differential rates of inflation across consumption goods and services, resulted in a discernible distribution of population group-specific measures of inflation over a four-year study period in 2008–12 (Bentley, 2013). For example, as figure 3
shows, strong statistical evidence was found to support observed differences between inflation experienced by the lowest and the highest income groups. The main reasons for the higher rate of inflation for the lowest income group were higher contributions to inflation from housing and household utilities, tobacco, food, and insurance, and a lower contribution from interest payments, which displayed deflation over the study period.
Figure 3
1 CPI expenditure weights are compared with available administrative data as part of their estimation and quality assurance (see Statistics NZ, 2014b). Differential reporting bias by population groups is a limitation of the methodology.
Household
Economic Survey
expenditure
patterns
Price change from
consumers price
index
Superannuitants
Beneficiaries
Māori Income groups
Household living-costs price indexes
calibration
Existing
data
New
statistics
integration
Expenditure groups
Lowest income quintile
-2
-1
0
1
2
3
4
5
6
2009 Q2 2010 Q1 2011 Q1 2012 Q1
0
1
2
3
4
5
6
7
8
Annual % change
Quarter
Distribution of inflation, 2009-12
95% Confidence Interval
Highest income quintile
Variance due to weight estimation
Source: Statistics NZ
5
1.4 Payment conceptual approach
HLPIs will be constructed using a ‘payment’ conceptual approach. This approach is noted by the International Labour Organisation (ILO, 2003) as often being used, “when the primary purpose of the index is for the adjustment of compensation or income”. The 2013 CPI Advisory Committee recommended this approach for HLPIs.
The ‘payment’ approach tracks the price change for goods and services ‘paid for’, regardless of the timing of their acquisition or use. In contrast, the CPI uses an ‘acquisition’ approach, reflecting price changes for goods and services when they are acquired. The main practical difference between these approaches is on the measurement of housing, interest, and insurance. The acquisition-based CPI commodity-level price indicators can be translated to a payment approach with the following modifications2:
• including interest payments
• excluding net acquisition of owner-occupied housing
• using gross expenditure weights for insurance.
This treatment will align better with the inflation experiences of owner-occupier households. The exclusion of these in the CPI – which instead tracks the cost of purchasing new dwellings (excluding land) – is a design choice that aligns with the CPI’s principal use for monetary policy purposes. The inclusion of interest payments would introduce a circularity in the use of the Official Cash Rate as a monetary policy tool.
The HLPIs will include all interest payments. Interest rate changes will be quality-adjusted to maintain the purchasing power of the monetary amount of debt underlying these interest payments. Mortgage debt will be quality-adjusted using a market-value property price index (Quotable Value’s house price index) and other debt will be quality-adjusted using the CPI (as a broad measure of inflation).
These design decisions reflect the feedback we received from the public consultation on HLPIs (Statistics NZ, 2016).
1.5 Ancestry of household-group inflation measurement
Consideration of household-group inflation is as old as the CPI itself. It is closely related to questions about the purpose and construction of the headline measure of consumer price change. Bentley (2014) describes the evolution of CPI use in New Zealand, the implications for the reference population, coverage of goods and services, and the availability of household inflation measures for specific groups of households.
Over the 100-year history of the CPI3, the index has evolved from being a necessities index (initially limited to food and house rent) for wage determinations by the Arbitration Court, through being a wider measure of household inflation, to its present-day focus as a macroeconomic indicator for monetary policy targeting.
In 1948, an advisory committee for a revision to the CPI from 1949 recommended widening the scope so that the index was no longer restricted to necessities. In reality, it took until 1955 for sufficiently liberal thinking for private motoring and beer to be included in the CPI basket of goods and services, and a further 20 years for wine and spirits to be included. Both the 1978 and 1985 CPI advisory committees discussed having a special-purpose price index limited to ‘basics’ or
2 Conceptually, there are differences in the timing of ‘acquisition’ and ‘payment’ for other commodities (particularly services), but the differences are assumed to be small and short-lived (with differences in timing typically within quarters or between neighbouring quarters). 3 Regular national price collection began in 1914. Linking the Retail Prices Index to the CPI has created a 100-year consumer price-change time series, an achievement celebrated in 2014 with a series of special products (Statistics NZ, 2014c) and publication of The New Zealand CPI at 100: History and Interpretation (Forbes & Victorio).
6
‘necessities’, but rejected the notion due to the practical difficulties of classifying items as either necessities or luxuries.
Successive reviews of the CPI in the mid-20th century considered that the variation in expenditure patterns between New Zealand households was likely to be less than in some other countries. This view, combined with the lack of a comprehensive household budget survey, meant no formal attempts were made to construct group-specific indexes until 1975.
Since the first modern Household Economic Survey in 1973/74 (the then Household Survey) the construction of special indexes for particular household groups has been technically feasible. A beneficiaries price index was published in 1975, and Jackson (1978) considered indexes for several household groupings, including income, age, occupation, and family type. Jackson found the clearest pattern of differential rates of inflation was for households grouped by ‘income of head of household’. Expenditure weights for the beneficiaries price index were noticeably different from those used in the CPI for food and rent. Despite this, the 1978 and 1985 CPI advisory committees concluded that movements in the beneficiaries price index over its one-year life-span were not significantly different from those of the CPI. The index was discontinued in 1976.
A longer-lived household-group price index was the superannuitants price index, published in the mid–late 1990s and sorting superannuitants by home-ownership status. A faster rate of inflation
was found for renters than owner-occupiers, the latter more closely tracking the CPI. This index was discontinued in 1999 when interest payments were removed from the CPI (making the CPI more suitable as an inflation target and less amenable to household-group-specific measures).
In the recent past, CPI advisory committees have recommended special consumer price indexes for particular groups of households. The 1997 committee stated that the extent to which the CPI represents the expenditure patterns of different socio-economic groups should be considered. The 2004 and 2013 committees explicitly recommended producing supplementary indexes for different population groups, such as government transfer recipients (including superannuitants), income groups, wage and salary earners, and (by the 2013 committee) ethnic groups.
1.6 Growing international interest in distribution of inflation
Internationally, the scope and coverage of CPIs varies. Calculating and publishing CPIs for subpopulations also varies across countries. Some national statistical agencies produce official CPI estimates for household-groups, while research on this topic has been undertaken in many countries that do not have official estimates. The current publication practices in selected countries are summarised in table 1.
The International Labour Organisation’s (2003) Resolution Concerning Consumer Price Indices provides the following advice:
Significant differences in the expenditure patterns and/or price movements between specific population groups or regions may exist, and care should be taken to ensure that they are represented in the index. Separate indices for these population groups or regions may be computed if there is sufficient demand to justify the additional cost.
There appears to be a growing international interest in data and statistics about the distribution of household income, consumption, and wealth. The Organisation for Economic Co-operation and Development’s (OECD’s) How’s Life? measures of well-being4 and Framework for Statistics on the Distribution of Household Income, Consumption and Wealth (OECD, 2013) provide insightful guidance on these topics. The Report by the Commission on the Measurement of Economic Performance and Social Progress (Stiglitz, Sen, & Fitoussi, 2009), which has been helping to shape the development of economic statistics internationally, highlighted the importance of understanding the distributional aspects of inflation:
4 See, for example, OECD, 2011.
7
A point of particular relevance from a welfare perspective is the question about whose price index is evaluated. Often, conceptual discussions about price indices are conducted as if there were a single representative consumer. Statistical agencies calculate the increase in prices by looking at the costs of an average bundle of goods. However, different people buy different bundles of goods (eg poor people spend more on food and less on entertainment) and they may buy their goods and services in different types of stores (which sell ‘similar’ products at very different prices). When all prices move together, having different indices for different people may not make much of a difference. But recently, with soaring oil and food prices, these differences may have become more marked and people at the bottom of the income distribution may have seen real incomes fall by much more than those at the top of the income distribution.
Table 1
Availability of household-group price indexes in selected countries
Country Household-group consumer price indexes*
New Zealand Household living-costs price indexes (HLPIs) from mid-2016
Australia Five analytical living-cost indexes (ALCIs):
1. Employee
2. Self-funded retiree
3. Age pensioner
4. Other government transfer recipient
5. Pensioner and beneficiary (combining groups 3 and 4)
Canada None5
Japan Income quintiles
Retired elderly households
For head of household:
• age group
• occupation
• tenure
United Kingdom Four consumer price indexes (with different methods and/or coverage)
Retail prices index (RPI) pensioner indexes
United States of America Three consumer price indexes6:
1. CPI – U (urban consumers)
2. CPI – W (wage earners and clerical workers)
3. CPI – E (aged 62 years and older)
* Current known official publications. Regional indexes are excluded.
The Australian Bureau of Statistics (ABS) has been publishing household-group inflation measures for the past 15 years. Initially, these were published annually, but in response to growing interest they have been published quarterly since 2009 (ABS, 2011). The most recent Australian Household Expenditure Survey had an increased sample size to improve the precision of commodity weighting for the pensioner and beneficiary living-cost index (ABS, 2012).
The Statistics Bureau of Japan has published a CPI for ‘retired elderly households’ since August 2011 (Maruyama, 2011), in addition to their suite of subpopulation indexes.
In the United Kingdom, there are separate indexes conceptually suited to different purposes – the Consumer Prices Index (CPI) and Retail Prices Index (RPI). These indexes and their variants
5 An analytical study was undertaken for low-income households and senior citizens for the period 1993–97 (Taktek, 1998). 6 See Stewart (2008).
8
have different coverage and methods.7 A recent study (Flower & Wales, 2014) provides inflation estimates for households in different positions of the income and expenditure distributions, for households with and without children, and for retired and non-retired households. The study provides new insights into earlier studies such as those by Ley (2005) and Levell and Oldfield (2011). A review of consumer price indexes (Johnson, 2015) recommended that the UK’s Office for National Statistics develop analytical inflation indexes for a range of household types. The report notes “the idea that there is one measure of inflation which tells us how much costs are changing for all different households is clearly absurd”.
1.7 Sensitivity to level household-group specific weighting is applied
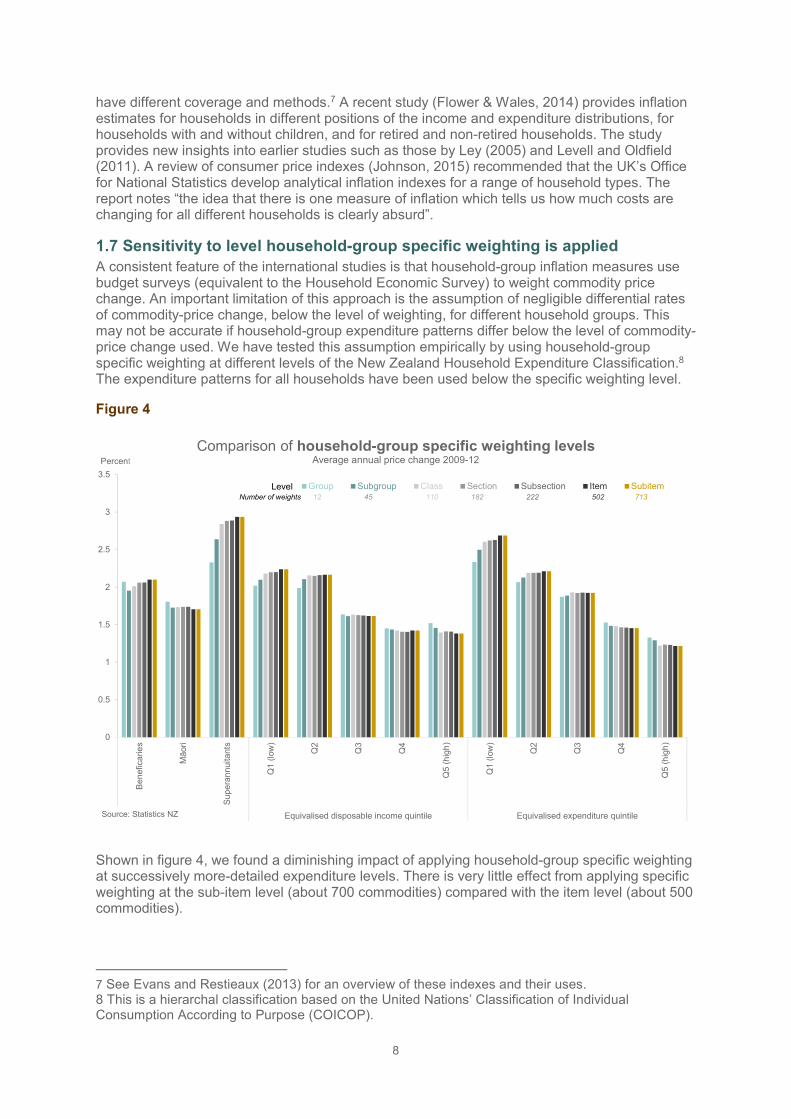
A consistent feature of the international studies is that household-group inflation measures use budget surveys (equivalent to the Household Economic Survey) to weight commodity price change. An important limitation of this approach is the assumption of negligible differential rates of commodity-price change, below the level of weighting, for different household groups. This may not be accurate if household-group expenditure patterns differ below the level of commodity-price change used. We have tested this assumption empirically by using household-group specific weighting at different levels of the New Zealand Household Expenditure Classification.8 The expenditure patterns for all households have been used below the specific weighting level.
Figure 4
Shown in figure 4, we found a diminishing impact of applying household-group specific weighting at successively more-detailed expenditure levels. There is very little effect from applying specific weighting at the sub-item level (about 700 commodities) compared with the item level (about 500 commodities).
7 See Evans and Restieaux (2013) for an overview of these indexes and their uses. 8 This is a hierarchal classification based on the United Nations’ Classification of Individual Consumption According to Purpose (COICOP).
0
0.5
1
1.5
2
2.5
3
3.5
Beneficarie
s
Māori
Supera
nnuitants
Q1 (
low
)
Q2
Q3
Q4
Q5 (
hig
h)
Q1 (
low
)
Q2
Q3
Q4
Q5 (
hig
h)
Equivalised disposable income quintile Equivalised expenditure quintile
Percent
Comparison of household-group specific weighting levelsAverage annual price change 2009-12
Group Subgroup Class Section Subsection Item SubitemNumber of weights 12 45 110 182 222 502 713
Level
Source: Statistics NZ
9
This analysis provides some reassurance that the impact of missing household-group-specific measures of commodity-price change is likely to be small. Nevertheless, to minimise the effect of this potentially wrong assumption on the HLPIs, we intend to apply the group-specific weights to price changes for the 700 sub-item level commodities. We will also further tailor the approach by using group-specific store-type and regional expenditure weighting.
2. Aggregation approach
2.1 Aggregation of household inflation
This section considers how to aggregate household expenditure patterns. We discuss conceptually appropriate approaches to aggregation depending on the use of the price indexes, and the practical implications of the preferred option.
The weighting methods used for the CPI involve calculating expenditure patterns from aggregate household expenditure – that is, calculating total expenditure on each commodity in the CPI
basket for the CPI reference population (all private New Zealand-resident households). Weighting proportions are derived from the aggregates. Effectively, this treats the whole of New Zealand as a single ‘super-household’, which is consistent with the household sector defined in the institutional sectors of the System of National Accounts 2008 (Intersecretariat Working Group on National Accounts, 2008). The method is conceptually appropriate to the CPI’s principal use as a macroeconomic indicator for monetary policy purposes.
An important consequence of the household-sector weighting method, used in the CPI, is that the expenditure weights do not necessarily represent a ‘typical’ household well. In fact, a consequence of the method is that higher-expenditure households have a greater influence on the aggregate weights. In effect, households’ expenditure patterns are weighted according to their position on the expenditure distribution.9 This feature has led to the method being commonly referred to in the CPI literature as ‘plutocratic’ weighting.
For HLPIs, the inflation of a ‘typical’ household within household groups may be of more interest than the inflation of the group treated as a whole. Inflation of a ‘typical’ household within a group can be estimated by calculating expenditure proportions for each household and then taking a simple unweighted average of these proportions.10 In the literature, this is often referred to as ‘democratic’ weighting.11
Table 2 provides a summary of the weighting approaches that may be appropriate for different purposes. It is worth noting that the HLPIs will be on a ‘payment’ conceptual approach, suitable for adjustment of monetary payments (see section 1.4 for details).
The calibration of household expenditure to CPI weights, described in the design outline (section 1.3), would be applied at a micro-level for each household, for the household weighting approach. This step minimises known reporting bias in the Household Economic Survey. It would only be required once under the household-sector weighting approach.
9 At What Price? Conceptualising and Measuring Cost-of-Living and Price Indexes (Schultze & Mackie, 2002) references calculations for the United States CPI that the household ‘represented’ by the plutocratic CPI is around the 75th percentile of the income distribution. 10 Unweighted for the population. Estimation from the Household Economic Survey will clearly require the use of sampling weights. 11 We agree with Astin and Leyland (2015) that the use of the terms ‘plutocratic’ and ‘democratic’ could be deemed emotive. In this paper, we have instead adopted the terminology ‘household-sector weighted’ and ‘household weighted’.
10
Table 2
Choice between weighting methods
Household-sector weighted (‘plutocratic’)
Household weighted (‘democratic’)
Summary of approach
Inflation experienced by the group treated as a single ‘super-household’
Inflation experienced by a ‘typical‘ household within the group
Use May be conceptually appropriate for:
• macroeconomic measurement
• deflation of (aggregate) nominal expenditure
May be conceptually appropriate for:
• measuring changes in real median incomes
• indexation of monetary payments12
Practical implementation
Most expenditure estimates are readily available from CPI weights. The Household Economic Survey can be used to allocate expenditure to population groups
Requires micro-level calibration of household expenditure, prior to aggregation of household-specific expenditure shares. This will use the CPI and Household Economic Survey in a more data-intensive way
At What Price? Conceptualizing and Measuring Cost-of-Living and Price Indexes (Schultze & Mackie, 2002)) describes which weighting approach may be appropriate for which purpose:
There are uses for the CPI or its components in which plutocratic weighting is called for – the component indexes of the CPI are used in deflating current dollar consumer expenditures as part of producing measures of real gross domestic product (GDP). And it is probable that a plutocratic index would come closer than a democratic one to the weights appropriate for indexing the tax system. But for most purposes a democratic index would be preferable. For analysis of economic welfare – e.g., measuring changes in real median incomes – a democratic index would clearly be superior. And that is equally true for the index used to determine cost-of-living allowances in social security and other public transfer programs.
More recently, in the United Kingdom the Royal Statistical Society (Diggle, 2015) gave its support for household group measures of inflation, using a payment approach, aggregated using democratic weights:
We fully support Paul Johnson's recommendation that the ONS [Office for National Statistics] should produce regular inflation indices for different household groups. However, we believe these should be based, to the extent possible, on actual household spending. We also believe this suggestion needs to be taken to its logical conclusion by combining the inflation indices to produce a ‘democratically weighted’ overall index that is published monthly. Such a ‘household inflation index’ (HII) would then be suitable for general uprating purposes as well as tracking the real growth in household income.
We have not found any previous New Zealand research into the impact of using household-weighted expenditure to aggregate household inflation indexes.13 However, we note that the 1991 CPI Advisory Committee recommended that the then-Department of Statistics investigate the feasibility of using such weights (New Zealand Government, 1991).
12 Where the aim of indexation is to maintain the purchasing power for the ‘average member’ of the group receiving payments. 13 Bentley (2015) uses the same underlying research as presented in this paper.
11
2.2 Empirical investigation of different aggregation methods
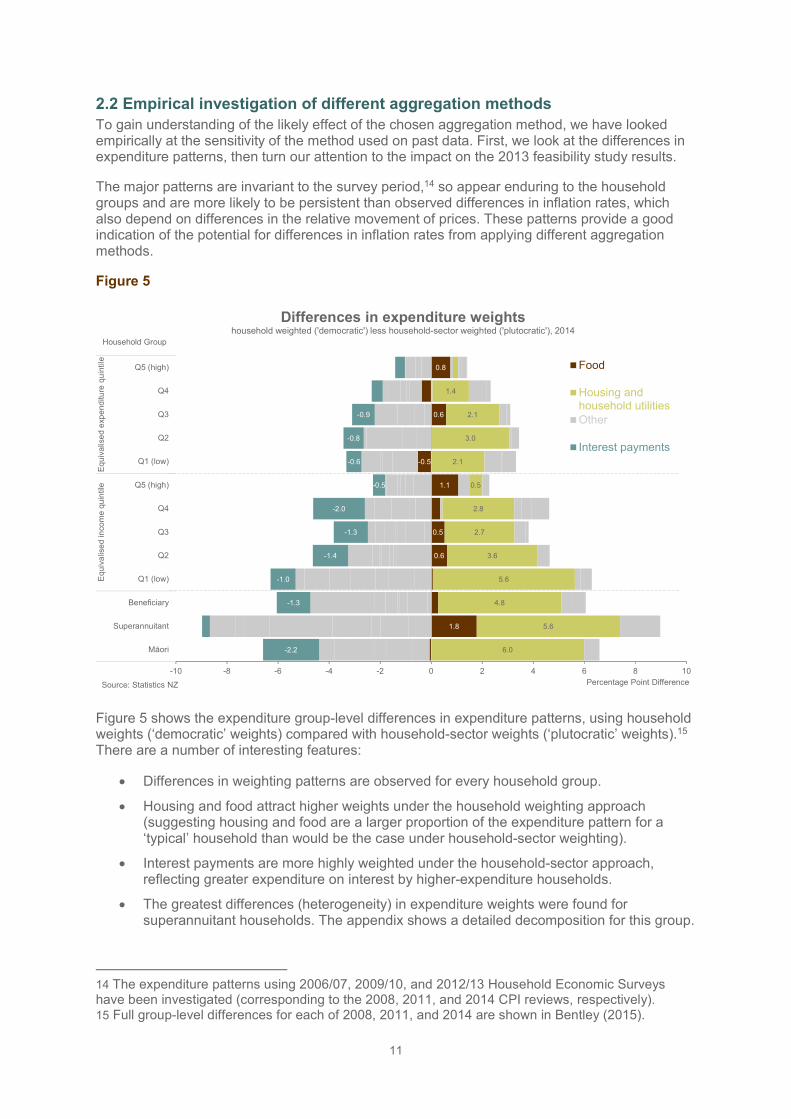
To gain understanding of the likely effect of the chosen aggregation method, we have looked empirically at the sensitivity of the method used on past data. First, we look at the differences in expenditure patterns, then turn our attention to the impact on the 2013 feasibility study results.
The major patterns are invariant to the survey period,14 so appear enduring to the household groups and are more likely to be persistent than observed differences in inflation rates, which also depend on differences in the relative movement of prices. These patterns provide a good indication of the potential for differences in inflation rates from applying different aggregation methods.
Figure 5
Figure 5 shows the expenditure group-level differences in expenditure patterns, using household weights (‘democratic’ weights) compared with household-sector weights (‘plutocratic’ weights).15 There are a number of interesting features:
• Differences in weighting patterns are observed for every household group.
• Housing and food attract higher weights under the household weighting approach (suggesting housing and food are a larger proportion of the expenditure pattern for a ‘typical’ household than would be the case under household-sector weighting).
• Interest payments are more highly weighted under the household-sector approach, reflecting greater expenditure on interest by higher-expenditure households.
• The greatest differences (heterogeneity) in expenditure weights were found for superannuitant households. The appendix shows a detailed decomposition for this group.
14 The expenditure patterns using 2006/07, 2009/10, and 2012/13 Household Economic Surveys have been investigated (corresponding to the 2008, 2011, and 2014 CPI reviews, respectively). 15 Full group-level differences for each of 2008, 2011, and 2014 are shown in Bentley (2015).
1.8
0.6
0.5
1.1
-0.5
0.6
0.8
6.0
5.6
4.8
5.6
3.6
2.7
2.8
0.5
2.1
3.0
2.1
1.4
-2.2
-1.3
-1.0
-1.4
-1.3
-2.0
-0.5
-0.6
-0.8
-0.9
-10 -8 -6 -4 -2 0 2 4 6 8 10
Māori
Superannuitant
Beneficiary
Q1 (low)
Q2
Q3
Q4
Q5 (high)
Q1 (low)
Q2
Q3
Q4
Q5 (high)
Equiv
alis
ed in
co
me q
uin
tile
Eq
uiv
alis
ed e
xp
end
itu
re q
uin
tile
Percentage Point Difference
Household Group
Differences in expenditure weightshousehold weighted ('democratic') less household-sector weighted ('plutocratic'), 2014
Food
Housing andhousehold utilities
Other
Interest payments
Source: Statistics NZ
12
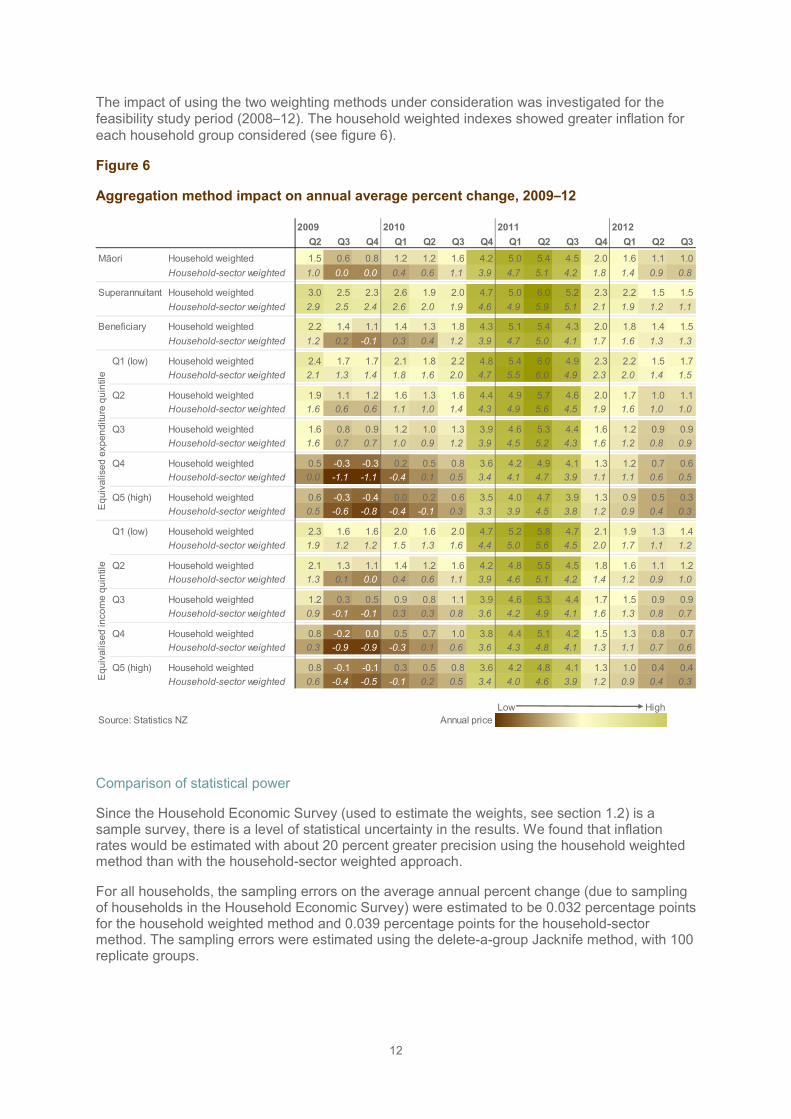
The impact of using the two weighting methods under consideration was investigated for the feasibility study period (2008–12). The household weighted indexes showed greater inflation for
each household group considered (see figure 6).
Figure 6
Aggregation method impact on annual average percent change, 2009–12
Comparison of statistical power
Since the Household Economic Survey (used to estimate the weights, see section 1.2) is a sample survey, there is a level of statistical uncertainty in the results. We found that inflation rates would be estimated with about 20 percent greater precision using the household weighted method than with the household-sector weighted approach.
For all households, the sampling errors on the average annual percent change (due to sampling of households in the Household Economic Survey) were estimated to be 0.032 percentage points for the household weighted method and 0.039 percentage points for the household-sector method. The sampling errors were estimated using the delete-a-group Jacknife method, with 100 replicate groups.
Decomposing the reasons for the differences (figure 7) shows that housing and interest payments contributed to higher inflation for the household weighted indexes (interest had deflation over the period, but lower weights under the household weighted method). A more detailed decomposition is shown in Bentley (2015).
Figure 7
2.3 Implications for using income or expenditure to understand household standard-of-living
International studies suggest total household expenditure may be a better way to classify households with lower economic standard-of-living than using household income – if the ultimate aim of the classification is to proxy economic standard-of-living. Total expenditure may be preferable because households may fund some of their expenditure by decreasing their assets or increasing their liabilities.
The OECD Framework for Statistics on the Distribution of Household Income, Consumption and Wealth (OECD, 2013) gives theoretical and practical arguments for considering consumption (which is largely akin to expenditure) rather than income:
It is the consumption of goods and services along with other inputs such as time that ultimately satisfies a household’s needs and wants. Because of this, consumption is a more important determinant of economic well-being than income alone … because consumption expenditures fluctuate less than incomes, they can be considered a better proxy of living standards. This view is supported in a number of studies … which find stronger relationships between consumption and subjective well-being than between income and subjective well-being.
0.08 0.07 0.07 0.03 0.04-0.03
0.16
0.190.15
0.19
0.17
0.110.10 0.08 0.15
0.100.07
0.08 0.03
0.19
0.30
0.13
0.31
0.13 0.22
0.12
0.09
0.14
0.07
0.180.10
-0.3
-0.2
-0.1
0
0.1
0.2
0.3
0.4
0.5
0.6
0.7
Mā
ori
Sup
era
nnu
ita
nt
Be
ne
ficia
ry
Q1 (
low
)
Q2
Q3
Q4
Q5 (
hig
h)
Q1 (
low
)
Q2
Q3
Q4
Q5 (
hig
h)
Equivalised income quintile Equivalised expenditure quintile
Percentage point contributionto annual percent change
Decomposition of aggregation differenceshousehold weighted ('democratic') less household-sector weighted ('plutocratic')
June 2008 quarter - September 2012 quarter
Food
Housing and household utilities
Other
Interest
Source: Statistics NZ
14
The framework cites the findings from a number of studies of the collection of income and expenditure data in household surveys. These have found better reporting of expenditure by households with lower levels of resources, which tend to under-report their income. The opposite pattern is found for higher-expenditure households, which tend to report better-quality income information than expenditure data.
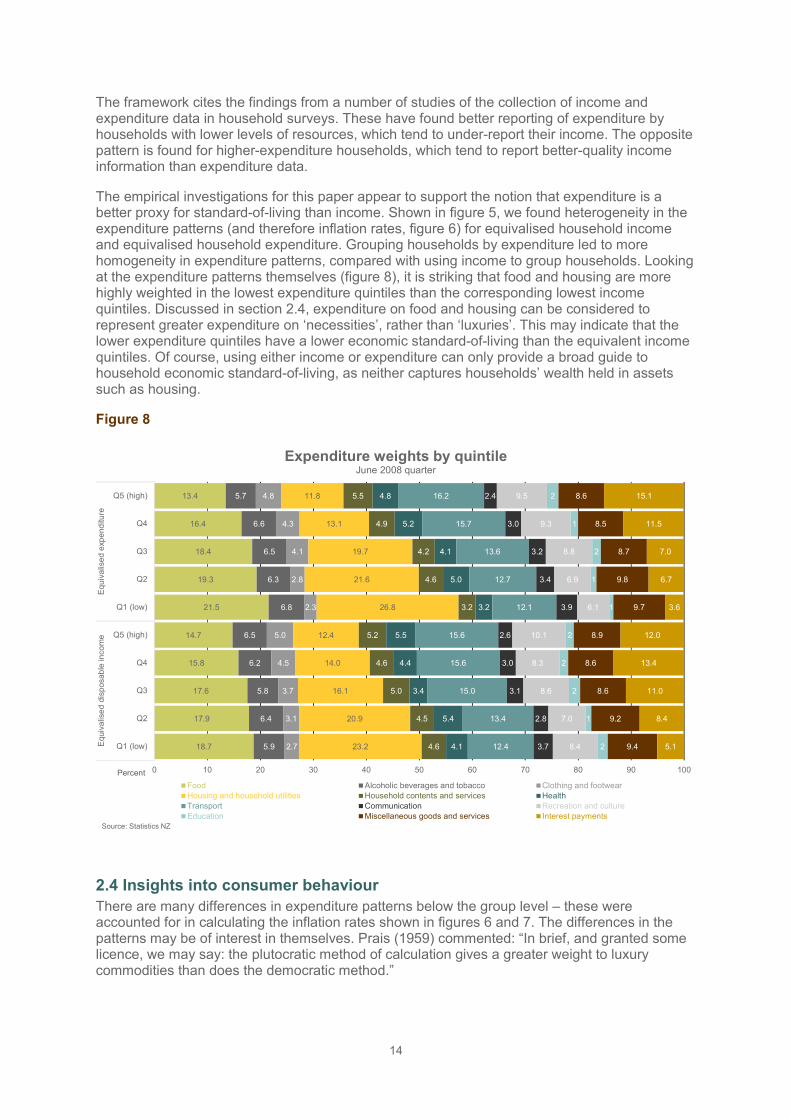
The empirical investigations for this paper appear to support the notion that expenditure is a better proxy for standard-of-living than income. Shown in figure 5, we found heterogeneity in the expenditure patterns (and therefore inflation rates, figure 6) for equivalised household income and equivalised household expenditure. Grouping households by expenditure led to more homogeneity in expenditure patterns, compared with using income to group households. Looking at the expenditure patterns themselves (figure 8), it is striking that food and housing are more highly weighted in the lowest expenditure quintiles than the corresponding lowest income quintiles. Discussed in section 2.4, expenditure on food and housing can be considered to represent greater expenditure on ‘necessities’, rather than ‘luxuries’. This may indicate that the lower expenditure quintiles have a lower economic standard-of-living than the equivalent income quintiles. Of course, using either income or expenditure can only provide a broad guide to household economic standard-of-living, as neither captures households’ wealth held in assets such as housing.
Figure 8
2.4 Insights into consumer behaviour
There are many differences in expenditure patterns below the group level – these were accounted for in calculating the inflation rates shown in figures 6 and 7. The differences in the patterns may be of interest in themselves. Prais (1959) commented: “In brief, and granted some licence, we may say: the plutocratic method of calculation gives a greater weight to luxury commodities than does the democratic method.”
18.7
17.9
17.6
15.8
14.7
21.5
19.3
18.4
16.4
13.4
5.9
6.4
5.8
6.2
6.5
6.8
6.3
6.5
6.6
5.7
2.7
3.1
3.7
4.5
5.0
2.3
2.8
4.1
4.3
4.8
23.2
20.9
16.1
14.0
12.4
26.8
21.6
19.7
13.1
11.8
4.6
4.5
5.0
4.6
5.2
3.2
4.6
4.2
4.9
5.5
4.1
5.4
3.4
4.4
5.5
3.2
5.0
4.1
5.2
4.8
12.4
13.4
15.0
15.6
15.6
12.1
12.7
13.6
15.7
16.2
3.7
2.8
3.1
3.0
2.6
3.9
3.4
3.2
3.0
2.4
8.4
7.0
8.6
8.3
10.1
6.1
6.9
8.8
9.3
9.5
2
1
2
2
2
1
1
2
1
2
9.4
9.2
8.6
8.6
8.9
9.7
9.8
8.7
8.5
8.6
5.1
8.4
11.0
13.4
12.0
3.6
6.7
7.0
11.5
15.1
0 10 20 30 40 50 60 70 80 90 100
Q1 (low)
Q2
Q3
Q4
Q5 (high)
Q1 (low)
Q2
Q3
Q4
Q5 (high)
Equiv
alis
ed d
isp
osab
le in
co
me
Eq
uiv
alis
ed e
xp
end
itu
re
Percent
Expenditure weights by quintile June 2008 quarter
Food Alcoholic beverages and tobacco Clothing and footwear
Housing and household utilities Household contents and services Health
Transport Communication Recreation and culture
Education Miscellaneous goods and services Interest payments
Source: Statistics NZ
15
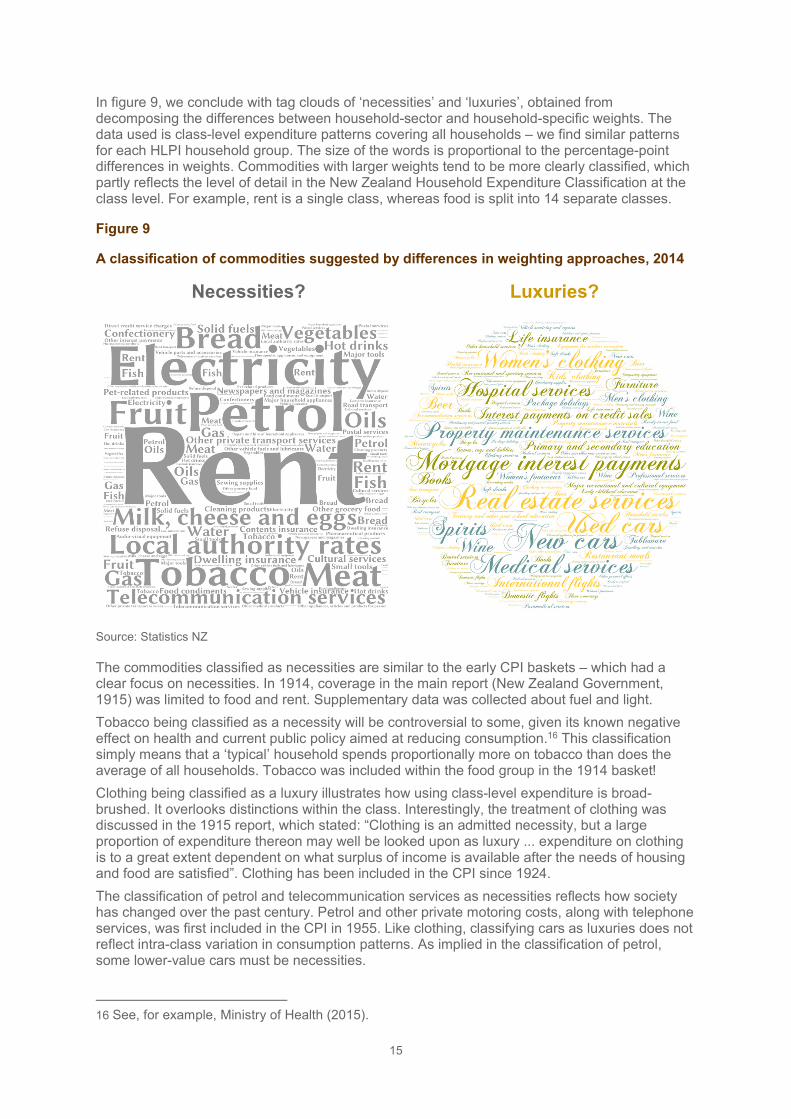
In figure 9, we conclude with tag clouds of ‘necessities’ and ‘luxuries’, obtained from decomposing the differences between household-sector and household-specific weights. The data used is class-level expenditure patterns covering all households – we find similar patterns for each HLPI household group. The size of the words is proportional to the percentage-point differences in weights. Commodities with larger weights tend to be more clearly classified, which partly reflects the level of detail in the New Zealand Household Expenditure Classification at the class level. For example, rent is a single class, whereas food is split into 14 separate classes.
Figure 9
A classification of commodities suggested by differences in weighting approaches, 2014
Necessities? Luxuries?
Source: Statistics NZ
The commodities classified as necessities are similar to the early CPI baskets – which had a clear focus on necessities. In 1914, coverage in the main report (New Zealand Government, 1915) was limited to food and rent. Supplementary data was collected about fuel and light.
Tobacco being classified as a necessity will be controversial to some, given its known negative effect on health and current public policy aimed at reducing consumption.16 This classification simply means that a ‘typical’ household spends proportionally more on tobacco than does the average of all households. Tobacco was included within the food group in the 1914 basket!
Clothing being classified as a luxury illustrates how using class-level expenditure is broad-brushed. It overlooks distinctions within the class. Interestingly, the treatment of clothing was discussed in the 1915 report, which stated: “Clothing is an admitted necessity, but a large proportion of expenditure thereon may well be looked upon as luxury ... expenditure on clothing is to a great extent dependent on what surplus of income is available after the needs of housing and food are satisfied”. Clothing has been included in the CPI since 1924.
The classification of petrol and telecommunication services as necessities reflects how society has changed over the past century. Petrol and other private motoring costs, along with telephone services, was first included in the CPI in 1955. Like clothing, classifying cars as luxuries does not reflect intra-class variation in consumption patterns. As implied in the classification of petrol, some lower-value cars must be necessities.
16 See, for example, Ministry of Health (2015).
16
2.5 Decisions following public consultation
In October and November 2015, we undertook a public consultation on the design of the HLPIs (Statistics NZ, 2015) and asked future customers of the HLPIs whether they thought it was more important to understand the inflation experience of households overall, or of a ‘typical’ household within each group. The majority of submissions specified they are most interested in a ‘typical’ household. Based on this, we’ve decided to use equally weighted household-specific expenditure shares (‘democratic’ weights) when calculating the expenditure weights for the HLPIs.
We also asked customers how they would use income group price indexes. The most common suggested use is to compare the inflation experience of the different groups. In particular, to understand how inflation for the lower two groups compares with the higher-income groups. Most customers were interested in income as a proxy for understanding standard-of-living, but also noted consistency with other income studies as being important. We received diverse views on the relative importance of income, expenditure, or joint income and expenditure quintiles.
We decided to use equivalised17 disposable (or net) income – that is, income available after income tax. We’ll also publish five additional indexes using expenditure rather than income quintiles. This is in response to several submissions suggesting a need for both income and expenditure group indexes.
Household living-costs price indexes – decisions after public consultation (Statistics NZ, 2016) presents all the decisions we made following the consultation.
3. Concluding remarks and future direction The substantive issue considered in this paper is how to aggregate household inflation. This seemingly trivial matter has been found to be of practical significance. Within-group variation in inflation experiences means that it matters how we aggregate household expenditure patterns. Comparing differences between these approaches gives insights into consumer luxuries and necessities.
The HLPIs will use equally weighted household-specific expenditure shares (‘democratic’ weights). We explained why this approach was chosen following public consultation. We discussed results from an empirical investigation of different weighting methods by revisiting a feasibility study prepared for the 2013 CPI Advisory Committee (Bentley, 2013). Using data collected over a four-year period (2008–12), equally weighted household-specific expenditure shares were compared with aggregate household expenditure (‘plutocratic’ weights).
“Beauty is in the eye of the beholder” the saying goes. The value of official statistics is determined by their use, no matter how well designed. To this end it was important that we took a customer-centric approach to the design of the HLPIs. The information need was highlighted by the 2013 CPI Advisory Committee, a customer group set up to advise on the CPI. The decision to create HLPIs was a response to the committee’s recommendations.
Public consultations in 2014 and 2015 helped define the household-groups and the technical design of the indexes. We’ve designed the indexes to best meet customer needs, notably the conceptual aim of their design is to reflect changes in the purchasing power of income. The ‘payment’ conceptual approach will be used and this materially affects the methods for treating owner-occupied housing. The chosen aggregation method, using equally weighted household-specific expenditure shares, will align with understanding the inflation experience of a ‘typical’ household in each population group.
17 Equivalisation adjusts household income/expenditure to account for differences in household composition to aid comparisons across households. We will use the modified OECD scale to equivalise household income/expenditure.
17
An important aspect of the public consultation process is that we now have a highly engaged customer community awaiting regular publication of the new indexes. HLPIs are due to begin quarterly publication later this year. Looking further ahead, the indexes will undergo regular reviews and continuous improvement to ensure they stay relevant and meet the quality needed.
References
Astin, J, & Leyland, J (2015). Towards a household inflation index. Available from www.statsusernet.org.uk Australian Bureau of Statistics (2011, March). Analytical living cost indexes for selected Australian household types. Available from www.abs.gov.au Australian Bureau of Statistics (2012). Household expenditure survey and survey of income and housing, User guide, Australia 2009–10. Available from www.abs.gov.au Bentley, A (2013). Consumer price change for subpopulations. In consumers price index advisory committee 2013 discussion paper. Available from www.stats.govt.nz Bentley, A (2014). Special consumer price indices for particular groups of households. In Forbes, S, & Victorio, A (Eds) The New Zealand CPI at 100: History and interpretation. Wellington: Victoria University Press. Bentley, A (2015). New measures of inflation for groups of households. Paper presented at New Zealand Association of Economists conference, Wellington, New Zealand. Available from www.stats.govt.nz Diggle, PJ (2015). Letter from President of the Royal Statistical Society to the National Statistician regarding Paul Johnson’s Review of Consumer Price Statistics. Available from www.statisticsauthority.gov.uk Evans, B, & Restieaux, A (2013, October). Users and uses of consumer price inflation statistics. Office for National Statistics. Available from www.ons.gov.uk Flower, T, & Wales, P (2014). Variation in the inflation experience of UK households: 2003–2014.
Available from www.ons.gov.uk International Labour Organisation (2004). Consumer price index manual: Theory and practice. Available from www.ilo.org International Labour Organisation (2003). Resolution concerning consumer price indices. Adopted at the Seventeenth International Conference of Labour Statisticians. Available from www.ilo.org Intersecretariat Working Group on National Accounts (2008). System of National Accounts 2008. European Communities, International Monetary Fund, Organisation for Economic Co-operation and Development, United Nations, & World Bank. Available from http://unstats.un.org Jackson, LF (1978). Household income and expenditure effects in inflation. New Zealand Economic Papers. Vol. 12. Johnson, P (2015). UK consumer price statistics: A review. UK Statistics Authority. Available from www.statisticsauthority.gov.uk Levell, P, & Oldfield, Z (2011). The spending patterns and inflation experience of low-income households over the past decade, Institute for Fiscal Studies Commentary C119. Available from www.ifs.org.uk
18
Ley, E (2005). Whose inflation? A characterization of the CPI plutocratic gap. Oxford Economic Papers. 47 (4) pp. 634‐46.
Maruyama, A (2011). The index for retired elderly households. International Working Group on Price Indices. Available from www.ottawagroup.org Ministry of Health (2015). Tobacco control. Available from www.health.govt.nz New Zealand Government (1915, November). Report on the cost of living in New Zealand, 1891–1914. Wellington: Government Printer. New Zealand Government (1991, November). Report of the consumers price index revision advisory committee. AJHR G.28A. Organisation for Economic Co-operation and Development (2011). How's life? Measuring well-being. Available from http://unstats.un.org Organisation for Economic Co-operation and Development (2013). OECD framework for statistics on the distribution of household income, consumption and wealth. Available from www.oecd.org Prais, S. (1959): Whose Cost of Living?, Review of Economic Studies, 26, 126–134. Schultze, CL, & Mackie, C (Eds). (2002). At what price? Conceptualising and measuring cost-of-living and price indexes. Washington, DC: National Academy Press. Statistics New Zealand (2013). Report of the consumers price index advisory committee 2013. Available from www.stats.govt.nz Statistics New Zealand (2014a). Decision on 2013 CPI Advisory Committee recommendations. Available from www.stats.govt.nz Statistics New Zealand (2014b). Consumers Price Index Review: 2014. Available from www.stats.govt.nz Statistics New Zealand (2014c). 100 years of CPI. Available from www.stats.govt.nz Statistics New Zealand (2015). Household living-costs price indexes – public consultation. Available from www.stats.govt.nz Statistics New Zealand (2016). Household living-costs price indexes – decisions after public consultation. Available from www.stats.govt.nz Stewart, KJ (2008). The experimental consumer price index for elderly Americans (CPI-E): 1982–2007. Bureau of Labor Statistics. Available from www.bls.gov Stiglitz, JE, Sen, A, & Fitoussi, J (2009). Report by the Commission on the Measurement of Economic Performance and Social Progress. Available from www.stiglitz-sen-fitoussi.fr Taktek, N (1998, June). Comparative study of analytical consumer price indexes for different subgroups of the reference population. Available from www.statcan.gc.ca
19
Appendix: Detailed decomposition of differences in expenditure weights for superannuitant households
0 1 2 3 4 5 6 7 8
Electricity
Petrol
Local authority rates
Medical services
Rent
Telecommunication services
Meat and poultry
Bread and cereals
Property maintenance services
Milk, cheese and eggs
Vehicle insurance
Package holidays
Women's clothing
International flights
Wine
Cultural services
Cigarettes and tobacco
Health insurance
Vegetables
Confectionery, nuts and snacks
Other private transport services
Beer
Ready-to-eat food
Newspapers and magazines
Restaurant meals
New cars
Fruit
Vehicle servicing and repairs
Other appliances
Dwelling insurance
Dental services
Comparison of weighting methodsSuperannuitant households


![Guiding focus group discussions [manual] · Baseline Household Level Questionnaire (CCAFS Household Baseline Survey 2010-12, ... class and age. In focus group discussions farmers](https://static.documents.pub/doc/80x56/5f4d59d4f0cfab39f828da03/guiding-focus-group-discussions-manual-baseline-household-level-questionnaire.jpg)


