18
BACKGROUND PAPER FOR THE WORLD DEVELOPMENT REPORT 2013 Household Income Generation Strategies Katia Covarrubias Benjamin Davis Aminata Bakouan Stefania Di Giuseppe
BACKGROUND PAPER FOR THE
WORLD DEVELOPMENT REPORT 2013
Household Income Generation Strategies
Katia Covarrubias
Benjamin Davis
Aminata Bakouan
Stefania Di Giuseppe

The findings, interpretations, and conclusions expressed in this paper are entirely those of the
authors. They do not necessarily represent the views of the World Development Report 2013
team, the World Bank and its affiliated organizations, or those of the Executive Directors of the
World Bank or the governments they represent.

- 1 -
Section 1: Introduction
This document presents results of a descriptive analysis of income generating activities of 19
countries based on the Rural Income Generating Activities (RIGA) database. The RIGA
database has mostly produced analysis using the rural sample of these countries’ nationally
representative living standards surveys. Our study pools rural and urban households to illustrate
the characteristics and dynamics of household income generating strategies at the national level
similar to Davis et al (2010).1 The URIGA database is a compendium of this national data
Database
Table 1 describes the full set of surveys in the URIGA database, showing the country, name of
the survey, year collected, number of overall observations as well as by urban/rural, and lastly,
the level of per capita GDP in PPP 2005 US dollars. This database is comprised of 36surveys
representing 19 countries. Section 2 presents our cross-sectional analysis which uses the most
recent year of survey data for each country. For most surveys we have more than one point in
time and for five countries namely Indonesia, Nicaragua, Nepal, Tajikistan, and Vietnam we have
panel data. We exploit the longitudinal aspect of the database undertaking an analysis of income
dynamics, presented in Section 3.
Definitions
Total household income is measured following the RIGA project methodology2 which constructs
net annual aggregates of income using a standardized approach. Income is disaggregated into 7
main categories which include agricultural wages, non-agricultural wages, crop activities,
livestock activities, self employment (household nonfarm enterprises), transfers and other non-
labor sources. Wages and self employment income are disaggregated even further by industry
following the classifications specified in the International Standard Industrial Classification of
All Economic Activities.3 Ten industry groups are created that include (1) agriculture, fishing
and forestry; (2) mining; (3) manufacturing; (4) electricity & utilities; (5) construction; (6)
commerce; (7) transport, storage and communication; (8) finance, insurance and real estate; (9)
services; and (10) other.
In this report, the aforementioned income activities are categorized into the following additional
aggregations which are presented in Davis et al (2010)1: agricultural (crop, livestock and
agricultural wages); non-agricultural (non-agricultural wages, self employment, transfer and
other); on-farm (crop and livestock); nonfarm (non-agricultural wages, self employment); and
off-farm (joining agricultural wages with the non-agricultural aggregation).
In addition, for the analysis of nonfarm activities, we also aggregate certain industry groups as
follows: (1) manufacturing and construction; (2) utilities, transport, storage, communication,
1 Davis, Benjamin and Paul Winters, Gero Carletto, Katia Covarrubias, Esteban J. Quiñones, Alberto Zezza, and
Kostas Stamoulis. 2010. “A Cross-country Comparison of Rural Income Generating Activities.” World Development
38(1): 48-63 2 See http://www.fao.org/fileadmin/user_upload/riga/pdf/ai197e00.pdf.
3 See http://unstats.un.org/unsd/cr/registry/regcst.asp?Cl=27&Lg=1.

- 2 -
finance, insurance, real estate and services; (3) agricultural, fishing, forestry and mining, and
leave commerce and other category as separate industries.
Table 1 Survey included in the analysis
Countries Survey Name Year
collected
Number of Observations Per Capita
GDP, PPP
2005 USD Total Rural Urban
Eastern Europe
Albania Living Standards Measurement Study 2005 3 640 1 640 2 000 6 107
Albania Living Standards Measurement Study 2002 3 599 1 640 1 959 5 259
Bulgaria Integrated Household Survey 2001 2 633 877 1 756 7 664
Bulgaria Integrated Household Survey 1995 2 468 824 1 664 6 851
Africa
Ghana Living Standards Survey Round Five 2005 8 564 4 979 3 585 1 208
Ghana Living Standards Survey Round Three 1998 5 998 3 799 2 199 1 033
Ghana Living Standards Survey Round Two 1992 4 523 2 945 1 578 937
Kenya Household Integrated Budget Survey 2005 13 158 8 475 4 683 1 346
Madagascar Enquête Permanente Auprès des Ménages 2001 5 080 1 979 3 101 929
Madagascar Enquête Permanente Auprès des Ménages 1993-1994 4 505 2 653 1 852 917
Malawi Integrated Household Survey-2 2004-2005 11 280 9 840 1 440 646
Nigeria Living Standards Survey 2004 19 158 14 512 4 545 1 702
Tanzania National Panel Survey, Wave 1 2009 3 255 2 055 1 200 1 237
Latin America
Bolivia Encuesta de Hogares 2005 4 086 1 751 2 335 3 772
Guatemala Encuesta de Condiciones de Vida 2006 13 693 7 878 5 808 4 176
Guatemala Encuesta de Condiciones de Vida 2000 7 276 3 852 3 424 3 960
Ecuador Estudio de Condiciones de Vida 1995 5 810 2 532 3 278 5 664
Ecuador Estudio de Condiciones de Vida 1998 5 801 2 535 3 266 5 866
Nicaragua Encuesta de Medición de Niveles de Vida 2005 6 864 3 400 3 464 2 336
Nicaragua Encuesta de Medición de Niveles de Vida 2001 4 191 1 839 2 352 2 169
Nicaragua Encuesta de Medición de Niveles de Vida 1998 4 236 1 963 2 273 1 982
Panama Encuesta de Niveles de Vida 2003 6 363 2 945 3 418 8 240
Panama Encuesta de Niveles de Vida 1997 4 945 2 496 2 449 7 528
Asia
Bangladesh Household Income-Expenditure Survey 2005 10 080 6 400 3 680 1 165
Bangladesh Household Income-Expenditure Survey 2000 7 440 5 040 2 400 970
Indonesia Family Life Survey- Wave 3 2000 10 435 5 410 5 025 2 623
Indonesia Family Life Survey- Wave 1 1993 7 216 3 786 3 430 2 396
Nepal Living Standards Survey III 2003 5 071 3 655 1 416 919
Nepal Living Standards Survey I 1996 3 370 2 655 715 829
Pakistan Integrated Household Survey 2001 15 927 9 978 5 949 1 843
Pakistan Integrated Household Survey 1991 4 792 2 396 2 396 1 656
Tajikistan Living Standards Survey 2007 4 860 3 150 1 710 1 674
Tajikistan Living Standards Survey 2003 4 156 2 640 1 520 1 250
Vietnam Living Standards Survey 2002 29 380 22 621 6 909 1 784
Vietnam Living Standards Survey 1997-1998 6 002 4 272 1 730 1 469
Vietnam Living Standards Survey 1992 4 800 3 840 960 1 005

- 3 -
Section 2: Cross Sectional Work
Using the cross-sectional sample of recent year surveys, Table 2 presents detailed statistics on the
household level of participation in the range of income generating activities described above,
while Table 3 presents the composition and shares of income of activities. Both tables illustrate
trends across levels of development, with countries ordered by per capita GDP.
Overall, all countries tend to have high levels of participation in on-farm activities regardless of
the GDP per capita level. A slight negative trend is observed with increasing per capita GDP
(PCGDP). The lowest participation rates are in Indonesia and Bolivia, respectively 34.4% and
38.6 percent. Conversely, involvement in nonfarm activities rises with PCGDP with wealthier
countries demonstrating higher levels of participation in the nonfarm sector than poorer countries.
Participation in the nonfarm sector ranges from 40-45 percent (Nigeria, Malawi, Madagascar) to
nearly 90 percent (Bolivia).
While participation in agricultural activities is similar in on-farm participation in its inverse
relationship with per capita GDP, involvement in non-agricultural activities is only weakly
positively related to GDP levels. The lowest participation level in the non-agricultural sector is
in Nigeria (45.2 percent) at the middle of the PCGDP distribution. Nearly all the countries with
PCGDP higher than Nigeria’s register participation rates above 90 percent; the ones with PCGDP
below Nigeria’s tend to be below 90 percent, and yet all are over 70 percent which is still
considerable relative to participation levels in nonfarm activities. The differences are likely
driven by involvement in transfer income originating either from public sources or private
remittances.
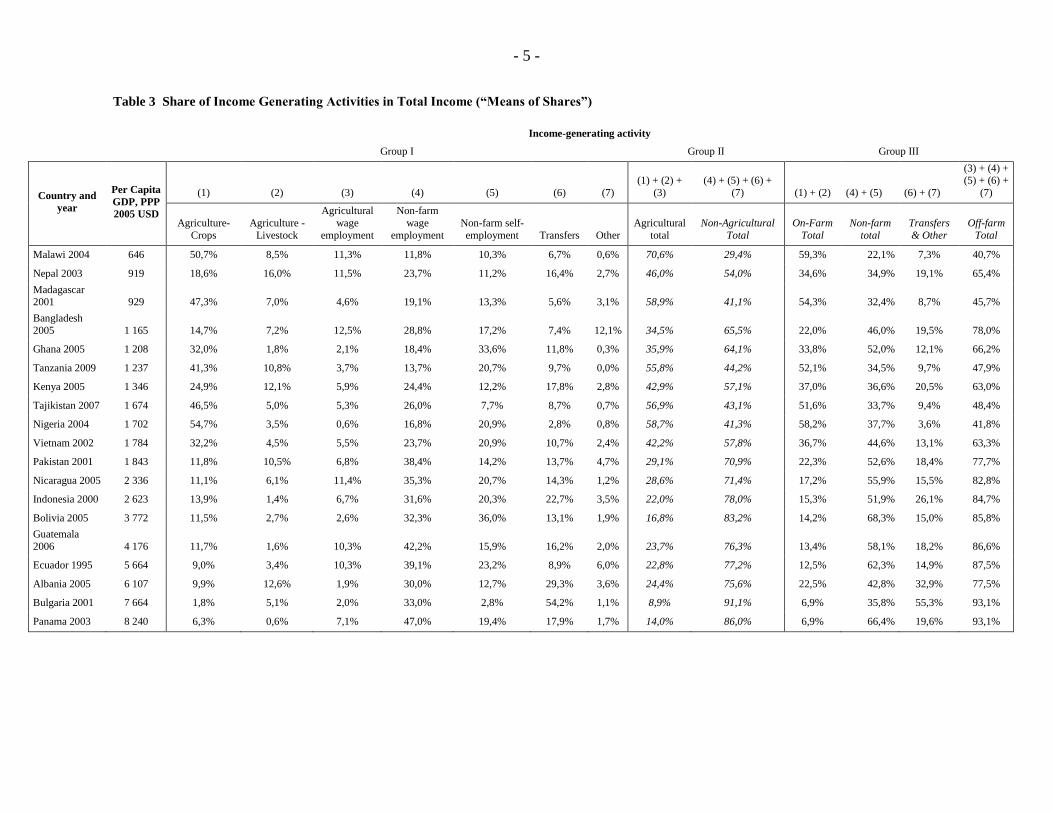
Despite high levels of participation across GDP levels, the shares of income originating from on-
farm and agricultural activities drop with increasing PCGDP. Conversely, nonfarm, off-farm and
non-agricultural income are generally positively related to the level of development, driven
largely by a greater share of income from nonfarm wage employment. Moreover, a greater share
of income is derived from transfers among wealthier countries than poorer countries. This last
trend could be due to greater resources in the government (translated into more public transfers)
or greater extended-family wealth (resulting in greater remittances income).

- 4 -
Table 2 Participation in Income Generating Activities
Income-generating activity
Group I Group II Group III
Country and
year
Per Capita
GDP, PPP
2005 USD
(1) (2) (3) (4) (5) (6) (7) (1)+(2)+(3) (4)+(5)+(6)+(7) (1) + (2) (4) + (5) (6) + (7)
(3) + (4) + (5)
+ (6) + (7)
Agriculture-Crops
Agriculture – Livestock
Agricultural
wage employment
Non-farm wage employment
Non-farm self-employment Transfers Other
Agricultural total
Non-Agricultural Total
On-Farm Total
Non-farm total
Transfers & Other Off-farm Total
Malawi 2004 646 90,1% 59,2% 51,6% 20,5% 30,5% 86,3% 8,8% 93,0% 93,7% 91,0% 45,9% 87,6% 97,1%
Nepal 2003 919 88,2% 79,9% 34,8% 38,7% 23,7% 37,3% 28,4% 93,0% 83,7% 91,3% 54,3% 54,4% 91,7%
Madagascar
2001 929 68,6% 31,4% 8,9% 24,9% 22,9% 21,9% 41,3% 74,3% 73,9% 71,2% 42,2% 54,3% 77,4%
Bangladesh 2005 1 165 74,8% 63,9% 22,8% 43,3% 27,4% 37,3% 57,5% 75,2% 91,9% 71,2% 64,0% 72,9% 96,5%
Ghana 2005 1 208 60,0% 28,8% 3,3% 25,7% 45,5% 36,0% 4,2% 63,0% 78,5% 62,2% 61,7% 38,3% 79,7%
Tanzania 2009 1 237 80,9% 50,9% 17,1% 23,6% 40,6% 51,9% 1,0% 84,1% 81,0% 83,7% 54,0% 52,3% 84,6%
Kenya 2005 1 346 71,9% 62,1% 10,6% 35,2% 24,0% 49,9% 14,4% 76,8% 78,0% 75,1% 51,5% 54,7% 81,8%
Tajikistan
2007 1 674 89,8% 58,1% 21,3% 49,9% 16,4% 45,6% 2,7% 90,8% 81,6% 90,7% 61,4% 47,4% 88,6%
Nigeria 2004 1 702 59,7% 26,3% 0,9% 18,1% 25,9% 7,0% 3,1% 61,7% 45,2% 61,5% 40,2% 9,4% 45,8%
Vietnam 2002 1 784 78,7% 67,5% 11,2% 38,7% 40,1% 83,4% 25,3% 78,8% 95,7% 83,1% 64,4% 86,5% 96,4%
Pakistan 2001 1 843 40,1% 49,8% 15,1% 56,0% 21,5% 31,5% 14,7% 56,4% 83,6% 52,4% 67,2% 40,4% 88,5%
Nicaragua
2005 2 336 58,2% 38,5% 22,8% 56,2% 48,7% 44,2% 8,9% 69,2% 87,2% 65,1% 77,8% 48,4% 93,2%
Indonesia 2000 2 623 33,8% 6,8% 13,4% 44,8% 36,6% 85,5% 15,9% 42,1% 94,2% 34,4% 66,5% 87,2% 95,0%
Bolivia 2005 3 772 37,1% 20,6% 3,9% 44,0% 64,2% 29,4% 9,5% 40,6% 96,8% 38,6% 89,6% 35,1% 98,2%
Guatemala
2006 4 176 55,0% 25,3% 18,6% 63,2% 37,6% 63,4% 7,4% 59,4% 93,8% 55,6% 77,7% 65,9% 97,3%
Ecuador 1995 5 664 37,5% 46,3% 19,1% 58,2% 48,1% 32,3% 33,9% 58,6% 92,8% 54,7% 78,0% 54,6% 96,7%
Albania 2005 6 107 58,0% 49,2% 3,4% 43,4% 17,1% 71,8% 21,2% 59,2% 94,2% 58,7% 55,7% 73,5% 95,2%
Bulgaria 2001 7 664 38,3% 30,2% 3,7% 45,4% 4,2% 85,8% 9,3% 44,7% 96,5% 43,6% 47,8% 86,8% 97,0%
Panama 2003 8 240 44,9% 29,5% 12,9% 62,6% 44,6% 66,3% 14,9% 50,6% 96,9% 48,2% 83,9% 69,7% 98,6%
- 5 -
Table 3 Share of Income Generating Activities in Total Income (“Means of Shares”)
Income-generating activity
Group I Group II Group III
Country and
year
Per Capita
GDP, PPP
2005 USD
(1) (2) (3) (4) (5) (6) (7)
(1) + (2) +
(3)
(4) + (5) + (6) +
(7) (1) + (2) (4) + (5) (6) + (7)
(3) + (4) + (5) + (6) +
(7)
Agriculture-
Crops
Agriculture -
Livestock
Agricultural
wage
employment
Non-farm
wage
employment
Non-farm self-
employment Transfers Other
Agricultural
total
Non-Agricultural
Total
On-Farm
Total
Non-farm
total
Transfers
& Other
Off-farm
Total
Malawi 2004 646 50,7% 8,5% 11,3% 11,8% 10,3% 6,7% 0,6% 70,6% 29,4% 59,3% 22,1% 7,3% 40,7%
Nepal 2003 919 18,6% 16,0% 11,5% 23,7% 11,2% 16,4% 2,7% 46,0% 54,0% 34,6% 34,9% 19,1% 65,4%
Madagascar 2001 929 47,3% 7,0% 4,6% 19,1% 13,3% 5,6% 3,1% 58,9% 41,1% 54,3% 32,4% 8,7% 45,7%
Bangladesh
2005 1 165 14,7% 7,2% 12,5% 28,8% 17,2% 7,4% 12,1% 34,5% 65,5% 22,0% 46,0% 19,5% 78,0%
Ghana 2005 1 208 32,0% 1,8% 2,1% 18,4% 33,6% 11,8% 0,3% 35,9% 64,1% 33,8% 52,0% 12,1% 66,2%
Tanzania 2009 1 237 41,3% 10,8% 3,7% 13,7% 20,7% 9,7% 0,0% 55,8% 44,2% 52,1% 34,5% 9,7% 47,9%
Kenya 2005 1 346 24,9% 12,1% 5,9% 24,4% 12,2% 17,8% 2,8% 42,9% 57,1% 37,0% 36,6% 20,5% 63,0%
Tajikistan 2007 1 674 46,5% 5,0% 5,3% 26,0% 7,7% 8,7% 0,7% 56,9% 43,1% 51,6% 33,7% 9,4% 48,4%
Nigeria 2004 1 702 54,7% 3,5% 0,6% 16,8% 20,9% 2,8% 0,8% 58,7% 41,3% 58,2% 37,7% 3,6% 41,8%
Vietnam 2002 1 784 32,2% 4,5% 5,5% 23,7% 20,9% 10,7% 2,4% 42,2% 57,8% 36,7% 44,6% 13,1% 63,3%
Pakistan 2001 1 843 11,8% 10,5% 6,8% 38,4% 14,2% 13,7% 4,7% 29,1% 70,9% 22,3% 52,6% 18,4% 77,7%
Nicaragua 2005 2 336 11,1% 6,1% 11,4% 35,3% 20,7% 14,3% 1,2% 28,6% 71,4% 17,2% 55,9% 15,5% 82,8%
Indonesia 2000 2 623 13,9% 1,4% 6,7% 31,6% 20,3% 22,7% 3,5% 22,0% 78,0% 15,3% 51,9% 26,1% 84,7%
Bolivia 2005 3 772 11,5% 2,7% 2,6% 32,3% 36,0% 13,1% 1,9% 16,8% 83,2% 14,2% 68,3% 15,0% 85,8%
Guatemala
2006 4 176 11,7% 1,6% 10,3% 42,2% 15,9% 16,2% 2,0% 23,7% 76,3% 13,4% 58,1% 18,2% 86,6%
Ecuador 1995 5 664 9,0% 3,4% 10,3% 39,1% 23,2% 8,9% 6,0% 22,8% 77,2% 12,5% 62,3% 14,9% 87,5%
Albania 2005 6 107 9,9% 12,6% 1,9% 30,0% 12,7% 29,3% 3,6% 24,4% 75,6% 22,5% 42,8% 32,9% 77,5%
Bulgaria 2001 7 664 1,8% 5,1% 2,0% 33,0% 2,8% 54,2% 1,1% 8,9% 91,1% 6,9% 35,8% 55,3% 93,1%
Panama 2003 8 240 6,3% 0,6% 7,1% 47,0% 19,4% 17,9% 1,7% 14,0% 86,0% 6,9% 66,4% 19,6% 93,1%

- 6 -
The positive relationship between the share of income from non-agricultural activities and GDP
per capita can be observed in Figure 1. This figure also conveys the nonlinear, U-shaped
relationship between participation in the non-agricultural sector and PCGDP.
Figure 1 Share of and participation in non-agricultural income activities, by per capita GDP
Figure 2 Composition of total non-farm, non-agricultural and self employment income, by sector
ALB 05
BNG 05
BOL 05
BUL 01
ECU 95
GHA 05
GUA 06IND 00
KEN 05
MAD 01
MAL 04
NEP 03
NIC 05
NIG 04
PAK 01
PAN 03
TAJ 07TZA 09
VNM 02
20
40
60
80
10
0
Sha
re o
f In
com
e f
rom
Non
-ag
ricultura
l S
ou
rces
6.5 7 7.5 8 8.5 9Log Per Capita GDP (PPP, Constant 2005 $)
Notes: 1. Non-agricultural income is comprised of income earned from non-agricultural wages, self employment, transfers and other income. 2. Fitted curve fits the quadratic prediction of the income shares on per capita GDP.
Share of Non-agricultural Income by Per Capita GDP
ALB 05
BNG 05
BOL 05 BUL 01
ECU 95
GHA 05
GUA 06IND 00
KEN 05
MAD 01
MAL 04
NEP 03
NIC 05
NIG 04
PAK 01
PAN 03
TAJ 07TZA 09
VNM 02
40
60
80
10
0
Pa
rtic
ipa
tio
n R
ate
(%
)6.5 7 7.5 8 8.5 9
Log Per Capita GDP (PPP, Constant 2005 $)
Notes: 1. Non-agricultural activities are comprised of from non-agricultural wage employment, self employment, transfers and other non labor activities. 2. Fitted curve fits the quadratic prediction of the participation shares on per capita GDP.
Participation in Non-agricultural Activities by Per Capita GDP
020
40
60
80
100
Share
s o
f In
com
e (
%)
MAL
04
NEP 0
3
MAD 0
1
BNG 0
5
GHA 0
5
TZA 09
KEN
05
TAJ 07
NIG
04
VNM
02
PAK
01
NIC
05
BOL
05
GUA 0
6
ALB
05
BUL
01
PAN
03
Notes: 1. Surveys sorted by increasing per capita GDP. 2. Ecuador and Indonesia omitted due to lack of detail on industry classification.
Composition of total non-farm employment income by sector
Commerce Manufacturing and Construction
Services: Utilities, Finances, Services, Transport, Storage, Communication
Other: Agricultural and Fishing, mining, other
020
40
60
80
100
Share
s o
f In
com
e (
%)
MAL
04
NEP 0
3
MAD 0
1
BNG 0
5
GHA 0
5
TZA 09
KEN
05
TAJ 07
NIG
04
VNM
02
PAK
01
NIC
05
BOL
05
GUA 0
6
ALB
05
BUL
01
PAN
03
Notes: 1. Surveys sorted by increasing per capita GDP. 2. Ecuador and Indonesia omitted due to lack of detail on industry classification.
Composition of non-agricultural wage income by sector
Commerce Manufacturing and Construction
Services: Utilities, Finances, Services, Transport, Storage, Communication
Other: Agricultural and Fishing, mining, other
020
40
60
80
100
Share
s o
f In
com
e (
%)
MAL
04
NEP 0
3
MAD 0
1
BNG 0
5
TZA 09
KEN
05
TAJ 07
NIG
04
VNM
02
PAK
01
NIC
05
BOL
05
GUA 0
6
ALB
05
PAN
03
Notes: 1. Surveys sorted by increasing per capita GDP. 2. Ecuador and Indonesia omitted due to lack of detail on industry classification. 3. Ghana omitted due to negative income in several industries (Electricity & utilities, construction, transport/storage/communication, finance and services. 4. Bulgaria omitted due to negative income in services and transport/storage/communication.
Composition of self employment income by sector
Commerce Manufacturing and Construction
Services: Utilities, Finances, Services, Transport, Storage, Communication
Other: Agricultural and Fishing, mining, other

- 7 -
Figure 2 shows the sector composition of nonfarm income, non-agricultural wage labor and self-
employment. Services tend to represent the largest share of income from wage employment,
followed by manufacturing and construction. With respect to self-employment, the share of
income from commerce activities is far above the other three industry groups in most countries,
regardless of the level of GDP per capita, reaching almost 68% of self-employment income in
Bangladesh.
Figure 3 presents the percent of households participating in on-farm activities, nonfarm activities
and agricultural wage activities, as well as fitted quadratic curves for the poorest, middle and
richest expenditure quintiles. Looking at on-farm activities, we see that across countries,
participation shares decrease with increasing GDP per capita. The trend is the same within
countries, where poorer households tend to participate more in on-farm activities than their richer
counterparts.
As for participation in agricultural wages, a negative correlation with the level of development is
observed. The same is also true amongst households where the poorer are more involved in
agricultural wage activities than the richest quintile. However the level of agricultural wage
participation among households in the bottom quintile diverges from the negative trend of the
other quintiles, increasing at the highest levels of PCGDP. Could this be due to the presence of
larger, commercial farms that rely more on hired labor?
Figure 3 Percent of households participating in main income generating activities, by first, third and fifth
expenditure quintiles
ALB 05
BNG 05
BOL 05
BUL 01
ECU 95
GHA 05
GUA 06
IND 00
KEN 05MAD 01
MAL 04 NEP 03
NIC 05NIG 04
PAK 01
PAN 03
TAJ 07
TZA 09 VNM 02
020
40
60
80
100
Part
icip
ation R
ate
(%
)
6.5 7 7.5 8 8.5 9Log Per Capita GDP (PPP, Constant 2005 $)
Average Participation Quintile 1
Quintile 3 Quintile 5
Note: Fitted curve is the quadratic prediction of the income shares on per capita GDP.
by increasing per capita GDP and over expenditure quintiles
Participation in On-farm Activities
ALB 05
BNG 05
BOL 05 BUL 01
ECU 95
GHA 05
GUA 06
IND 00KEN 05MAD 01
MAL 04
NEP 03
NIC 05
NIG 04
PAK 01PAN 03
TAJ 07TZA 09
VNM 02
020
40
60
80
100
Part
icip
ation R
ate
(%
)
6.5 7 7.5 8 8.5 9Log Per Capita GDP (PPP, Constant 2005 $)
Average Participation Quintile 1
Quintile 3 Quintile 5
Note: Fitted curve is the quadratic prediction of the income shares on per capita GDP.
by increasing per capita GDP and over expenditure quintiles
Participation in Agricultural Wage Activities
ALB 05
BNG 05
BOL 05
BUL 01
ECU 95
GHA 05
GUA 06
IND 00
KEN 05
MAD 01MAL 04
NEP 03
NIC 05
NIG 04
PAK 01
PAN 03
TAJ 07
TZA 09
VNM 02
020
40
60
80
100
Part
icip
ation R
ate
(%
)
6.5 7 7.5 8 8.5 9Log Per Capita GDP (PPP, Constant 2005 $)
Average Participation Quintile 1
Quintile 3 Quintile 5
Note: Fitted curve is the quadratic prediction of the income shares on per capita GDP.
by increasing per capita GDP and over expenditure quintiles
Participation in Non-farm Activities

- 8 -
The positive relationship between participation in nonfarm activities and PCGDP observed in
Table 2 is reconfirmed in Figure 3 across household expenditure quintiles, though the non-
linearity of the trend is revealed under this breakdown. Whereas the middle/third quintile
increases considerable with PCGDP, the top/fifth quintile tends to make a smaller increase and
decreases slightly at the top of the PCGDP distribution. The quadratic curve also demonstrates
that the middle and top quintiles tend to converge at high GDP levels. Conversely, although
participation among the bottom quintile increases, halfway through the PCGDP distribution
participation in nonfarm activities levels off and declines at the highest levels of PCGDP.
Figure 4 presents share of total income from the four main income generating activities by
expenditure quintile. In most of the countries, the share of income from on-farm activities
decreases while share of non-farm activities increases with increasing household wealth.
Moreover, the relative importance of agriculture and the on-farm sector for poorer countries is
also witnessed. At the bottom of the PCGDP distribution, little to moderate differences are
observed between the bottom and top quintiles in the share of on-farm income. These differences
are greater among wealthier countries. By comparison, the importance of nonfarm income
sources across quintiles reveals that large differences exist in the share earned from nonfarm
sources between the poorest and wealthiest households within countries, regardless of a country’s
PCGDP level.
Figure 4 Percent of total income from main income generating activities, by expenditure quintile
Household diversification of income sources is frequent across countries in the sample as shown
in Table 4 which presents the share of households with specialized versus diversified income
portfolios. Specialization is defined as earning 75 percent of total income from one income
activity. Households are classified as diversified if no single income activity earns them 75
percent of total household income. Table 4 reveals that diversification is an important income
strategy across most countries regardless of the level of development, with a majority of
households falling under this category instead of being specialized in any given income activity.
Specialization is not unimportant, however, with significant shares of households earning at least
75 percent of total income from on-farm sources and non-agricultural wages. Specialization in
the on-farm sector is more common among the bottom half of the PCGDP distribution.
020
40
60
80
100
Share
s o
f In
com
e (
%)
MAL
04
NEP 0
3
MAD 0
1
BNG 0
5
GHA 0
5
TZA 0
9
KEN
05
TAJ 07
NIG
04
VNM
02
PAK
01
NIC
05
IND 0
0
BOL
05
GUA 0
6
ECU 9
5
ALB
05
BUL
01
PAN
03
1 2 3 4 5 1 2 3 4 5 1 2 3 4 5 1 2 3 4 5 1 2 3 4 5 1 2 3 4 5 1 2 3 4 5 1 2 3 4 5 1 2 3 4 5 1 2 3 4 5 1 2 3 4 5 1 2 3 4 5 1 2 3 4 5 1 2 3 4 5 1 2 3 4 5 1 2 3 4 5 1 2 3 4 5 1 2 3 4 5 1 2 3 4 5
Note: Expenditure quintiles move from poorer to richer
by expenditure quintiles
Share of total income from main income generating activities
On farm Activities Agricultural Wages
Transfers and Other Non-Labour Sources Non-farm Activities

- 9 -
Meanwhile specialization in non-agricultural wages is more prevalent among the top half of the
PCGDP distribution.
Table 4 Percent of households with diversified and specialized income generating activities
Per Capita
GDP, PPP 2005
USD
Diverse
Income
Portfolio
Principal Household Income Source (>=75% of Total
Income)
Ag Wage
Nonag
Wage Self Emp Transfers Other Farm
Malawi 2004 646 36,2% 3,1% 8,3% 4,7% 1,1% 0,1% 46,5%
Nepal 2003 919 49,4% 3,7% 15,0% 7,1% 7,1% 0,5% 17,2%
Madagascar 2001 929 3,6% 4,2% 19,4% 12,3% 4,3% 1,0% 55,2%
Bangladesh 2005 1 165 49,4% 6,5% 20,3% 11,0% 2,8% 1,5% 8,4%
Ghana 2005 1 208 21,6% 1,4% 15,0% 27,0% 7,4% 0,1% 27,6%
Tanzania 2009 1 237 32,9% 0,8% 9,3% 12,1% 3,7% 0,0% 41,2%
Kenya 2005 1 346 33,0% 3,6% 18,7% 8,2% 8,0% 1,0% 27,6%
Tajikistan 2007 1 674 48,9% 0,5% 11,0% 0,6% 2,9% 0,3% 35,8%
Nigeria 2004 1 702 18,8% 0,4% 13,4% 16,1% 1,7% 0,3% 49,3%
Vietnam 2002 1 784 48,1% 2,4% 11,8% 10,1% 1,8% 0,3% 25,5%
Pakistan 2001 1 843 32,7% 4,0% 28,1% 9,5% 7,9% 1,6% 16,1%
Nicaragua 2005 2 336 42,8% 6,6% 23,5% 10,2% 5,6% 0,2% 11,1%
Indonesia 2000 2 623 37,5% 4,0% 23,8% 12,7% 12,0% 1,1% 9,0%
Bolivia 2005 3 772 37,2% 2,0% 25,0% 24,7% 7,4% 1,1% 2,8%
Guatemala 2006 4 176 43,6% 5,3% 31,1% 7,5% 6,8% 0,7% 5,0%
Ecuador 1995 5 664 36,5% 6,1% 29,6% 14,9% 4,3% 1,5% 7,1%
Albania 2005 6 107 42,1% 0,9% 21,0% 10,1% 14,7% 0,5% 10,7%
Bulgaria 2001 7 664 30,7% 0,8% 23,7% 2,5% 40,7% 0,2% 1,4%
Panama 2003 8 240 35,6% 4,2% 38,0% 10,2% 9,8% 0,4% 1,8%
Figure 5 plots the average level of diversification and specialization in on-farm and non-
agricultural wages, including fitted quadratic curves for the bottom, middle and top expenditure
quintiles. The relatively-flat curves in the first graph reveal that diversification does not depend
either on the level of development nor on household wealth. As for on-farm specialization, the
share of participating households decreases when GDP per capita increases and is more frequent
among poorer households. In this figure, we observe yet again a convergence of the middle
quintile towards the level of on-farm specialization among top quintile households. However,
unlike the trend of the bottom quintile in figure 3c, the trend of the poorest quintile is also
towards that of the middle and top quintiles at the highest levels of PCGDP. As for non-
agricultural wage employment, a slight positive correlation is observed across all three quintiles
showing participation to this category increases with level of economic development. In this
figure, convergence of the middle and top quintiles is also observed, suggesting that at high levels
of national income, the non-agricultural sector offers the possibility for specialization for the top
60 percent of households. However, the trend for the bottom quintile is relatively flat from the

- 10 -
middle to high levels of PCGDP, indicating that widespread specialization in non-agricultural
activities is not a possibility for the poorest segments of the population.
Figure 5 Share of diversified, on-farm, and non-agricultural wage specializing households, by per capital
GDP
To better understand the correlation between wealth and diversification, Figure 6 shows the share
of households with diversified or on-farm specialized income portfolio by expenditure quintile.
Yet again, there is no clear pattern linking household wealth to diversification. For instance, in
countries like Malawi diversification decreases with more wealth; while in others like Nigeria,
diversification increases with wealth, and yet in others there is no correlation between wealth and
diversification, with the latter case being the most usual. The positive relationship between non-
farm specialization and wealth is evident, though with higher quintiles more often specializing in
wage or self employment activities.
ALB 05
BNG 05
BOL 05
BUL 01
ECU 95
GHA 05
GUA 06
IND 00
KEN 05
MAD 01
MAL 04
NEP 03
NIC 05
NIG 04
PAK 01PAN 03
TAJ 07
TZA 09
VNM 02
020
40
60
80
100
Share
of D
ivers
ifie
d H
ousehold
s (
%)
6.5 7 7.5 8 8.5 9Log Per Capita GDP (PPP, Constant 2005 $)
Average Specialization Quintile 1
Quintile 3 Quintile 5
Notes: 1. Fitted curve is the quadratic prediction of the share of diversified households on per capita GDP. 2. Surveys sorted by increasing per capita GDP.
Diversification by per capita GDP
ALB 05BNG 05
BOL 05 BUL 01
ECU 95
GHA 05
GUA 06IND 00
KEN 05
MAD 01
MAL 04
NEP 03
NIC 05
NIG 04
PAK 01
PAN 03
TAJ 07
TZA 09
VNM 02
020
40
60
80
100
Share
of S
pecia
lized h
ousehold
s (
%)
6.5 7 7.5 8 8.5 9Log Per Capita GDP (PPP, Constant 2005 $)
Average Specialization Quintile 1
Quintile 3 Quintile 5
Notes: 1. Fitted curve is the quadratic prediction of the share of diversified households on per capita GDP. 2. Surveys sorted by increasing per capita GDP.
On-farm Specialization by per Capita GDP
ALB 05BNG 05
BOL 05 BUL 01
ECU 95
GHA 05
GUA 06
IND 00KEN 05MAD 01
MAL 04
NEP 03
NIC 05
NIG 04
PAK 01
PAN 03
TAJ 07TZA 09VNM 02
020
40
60
80
100
Share
of S
pecia
lized H
ousehold
s (
%)
6.5 7 7.5 8 8.5 9Log Per Capita GDP (PPP, Constant 2005 $)
Average Specialization Quintile 1
Quintile 3 Quintile 5
Notes: 1. Fitted curve is the quadratic prediction of the share of diversified households on per capita GDP. 2. Surveys sorted by increasing per capita GDP.
Non-Agricultural Wage Specialization by Per Capita GDP

- 11 -
Figure 6. Percent of households with diversified or specialized income portfolio, by expenditure quintile
Despite high levels of diversification across our sample of countries, households continue to be
involved in agricultural activities and produce a high share of the overall total agricultural
production as shown on Figure 7a. Although a clear relationship with PCGDP is not observed,
countries at higher levels of development attribute a greater share of the value of total agricultural
production to diversified households; on-farm specialized households in those countries generate
only a marginal share of the total value of production. At lower levels of PCGDP, a larger share
of the value of production can be attributed to on-farm specializers, although diversified
households still generate a non-negligible share of production. In two cases, namely Madagascar
and Nigeria, agricultural production is almost entirely produced by on-farm specializers as such
breaking from observed trends. This could be due to the low level of diversification in those
countries at 3.6 and 18.8 percent, the lowest among countries in this study.
Figure 7b shows a similar graph with the total value of marketed agricultural production to
diversified versus on-farm specialized households. The trends are largely similar to Figure 7a,
whereby diversified households at higher levels of PCGDP are responsible for a greater share of
marketed output while on-farm specialized households generating a greater value of marketed
output for households at the bottom of the PCGDP distribution. In Nigeria, diversified
households appear to not market any production; on-farm specializers can be attributed for nearly
the entire value of marketed agricultural production. In Madagascar, although diversified
households did not generate a significant share of agricultural production in Figure 7a, a more
notable share can be attributed to this group with respect to marketed output.
020
40
60
80
100
Share
(%
)
MAL
04
NEP 0
3
MAD 0
1
BNG 0
5
GHA 0
5
TZA 0
9
KEN
05
TAJ 07
NIG
04
VNM
02
PAK
01
NIC
05
IND 0
0
BOL
05
GUA 0
6
ECU 9
5
ALB
05
BUL
01
PAN
03
1 2 3 4 5 1 2 3 4 5 1 2 3 4 5 1 2 3 4 5 1 2 3 4 5 1 2 3 4 5 1 2 3 4 5 1 2 3 4 5 1 2 3 4 5 1 2 3 4 5 1 2 3 4 5 1 2 3 4 5 1 2 3 4 5 1 2 3 4 5 1 2 3 4 5 1 2 3 4 5 1 2 3 4 5 1 2 3 4 5 1 2 3 4 5
Notes: 1. Surveys sorted by increasing per capita GDP. 2. Remainder of each column up to 100 percent represents specialization in agricultural wage employment, transfers and other non-labor activities.
income portfolios, by expenditure quintiles
Share of households with diversified, on-farm or non-farm specialized
Diversified Specialized in On-farm Activities Specialized in Non-farm Activities

- 12 -
Figure 7a Percent value of total agricultural production, by diversified and on-farm specializing households
Figure 7b Percent value of total marketed agricultural production, by diversified and on-farm specializing
households
020
40
60
80
100
Perc
ent (%
)
MAL
04
NEP 0
3
MAD 0
1
BNG 0
5
GHA 0
5
TZA 09
KEN
05
TAJ 07
NIG
04
VNM
02
PAK
01
NIC
05
IND 0
0
BOL
05
GUA 0
6
ECU 9
5
ALB
05
BUL
01
PAN
03
Notes: 1. Remainder of column represents households specializing in transfers or other nonlabour activities
2. Surveys sorted by increasing per capita GDP
by diversified and on-farm specializing households
Percent of value of total agricultural production
Diversified Specialized in On-farm Activities
020
40
60
80
100
Perc
ent (%
)
MAL
04
NEP 0
3
MAD 0
1
BNG 0
5
GHA 0
5
TZA 09
KEN
05
TAJ 07
NIG
04
VNM
02
PAK
01
NIC
05
IND 0
0
BOL
05
GUA 0
6
ECU 9
5
ALB
05
BUL
01
PAN
03
Notes: 1. Remainder of column represents households specializing in transfers or other nonlabour activities
2. Surveys sorted by increasing per capita GDP
by diversified and on-farm specializing households
Percent of value of total marketed agricultural production
Diversified Specialized in On-farm Activities
- 13 -
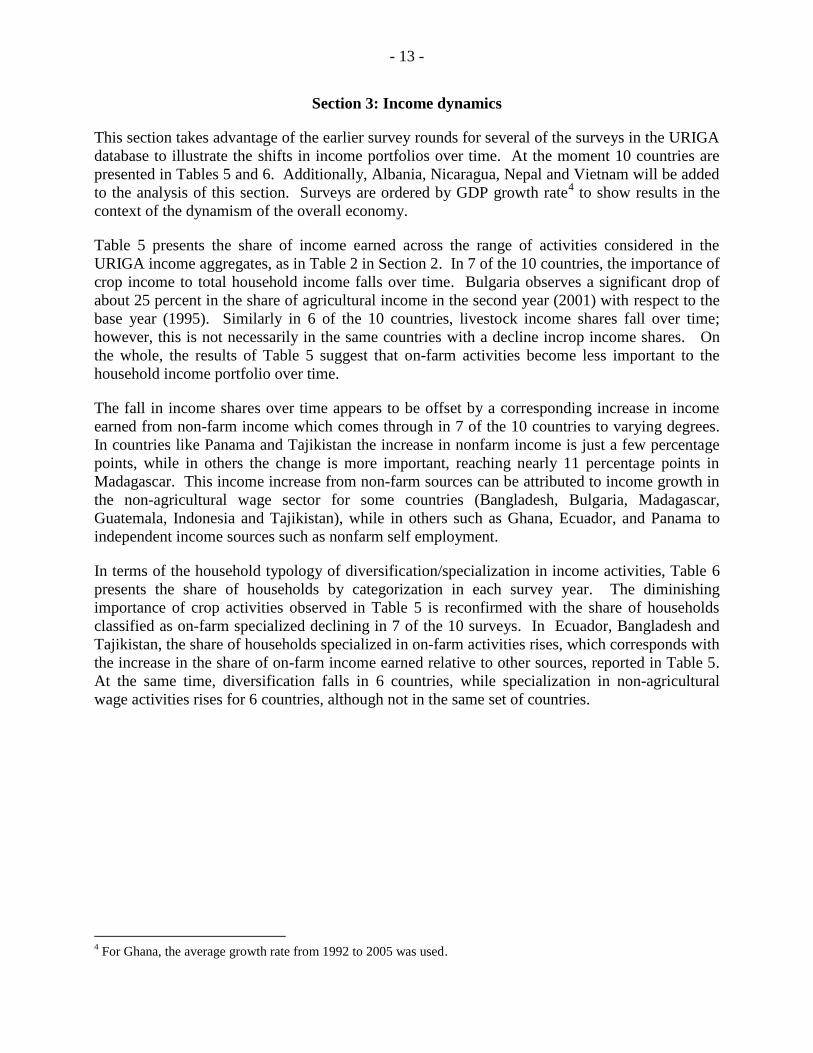
Section 3: Income dynamics
This section takes advantage of the earlier survey rounds for several of the surveys in the URIGA
database to illustrate the shifts in income portfolios over time. At the moment 10 countries are
presented in Tables 5 and 6. Additionally, Albania, Nicaragua, Nepal and Vietnam will be added
to the analysis of this section. Surveys are ordered by GDP growth rate4 to show results in the
context of the dynamism of the overall economy.
Table 5 presents the share of income earned across the range of activities considered in the
URIGA income aggregates, as in Table 2 in Section 2. In 7 of the 10 countries, the importance of
crop income to total household income falls over time. Bulgaria observes a significant drop of
about 25 percent in the share of agricultural income in the second year (2001) with respect to the
base year (1995). Similarly in 6 of the 10 countries, livestock income shares fall over time;
however, this is not necessarily in the same countries with a decline incrop income shares. On
the whole, the results of Table 5 suggest that on-farm activities become less important to the
household income portfolio over time.
The fall in income shares over time appears to be offset by a corresponding increase in income
earned from non-farm income which comes through in 7 of the 10 countries to varying degrees.
In countries like Panama and Tajikistan the increase in nonfarm income is just a few percentage
points, while in others the change is more important, reaching nearly 11 percentage points in
Madagascar. This income increase from non-farm sources can be attributed to income growth in
the non-agricultural wage sector for some countries (Bangladesh, Bulgaria, Madagascar,
Guatemala, Indonesia and Tajikistan), while in others such as Ghana, Ecuador, and Panama to
independent income sources such as nonfarm self employment.
In terms of the household typology of diversification/specialization in income activities, Table 6
presents the share of households by categorization in each survey year. The diminishing
importance of crop activities observed in Table 5 is reconfirmed with the share of households
classified as on-farm specialized declining in 7 of the 10 surveys. In Ecuador, Bangladesh and
Tajikistan, the share of households specialized in on-farm activities rises, which corresponds with
the increase in the share of on-farm income earned relative to other sources, reported in Table 5.
At the same time, diversification falls in 6 countries, while specialization in non-agricultural
wage activities rises for 6 countries, although not in the same set of countries.
4 For Ghana, the average growth rate from 1992 to 2005 was used.

- 14 -
Table 5
Income-generating activity
Group I
(1) (2) (3) (4) (5) (6) (7)
Number of
observation
s
Per Capita
GDP, PPP
2005 USD
GDP
growth
rate
Agriculture-
Crops
Agriculture -
Livestock
Agricultural
wage
employment
Non-farm
wage
employment
Non-farm
self-
employment Transfers Other
Madagascar 1993 4,467 917
1.31%
38.91% 9.00% 4.72% 20.49% 16.05% 8.77% 2.05%
2001 5,047 929 32.82% 4.99% 4.68% 30.38% 16.70% 7.62% 2.82%
Ecuador 1995 5,732 5,568
3.56%
9.92% 4.01% 10.92% 36.86% 23.13% 8.64% 6.52%
1998 5,801 5,766 9.56% 5.68% 11.27% 34.42% 25.92% 5.73% 7.43%
Guatemala 2000 7,266 3,960
5.45%
18.54% 1.72% 13.23% 33.60% 15.88% 15.78% 1.26%
2006 13,682 4,176 13.62% 1.84% 12.32% 38.42% 15.86% 16.68% 1.27%
Panama 1997 4,938 7,528
9.46%
9.23% 4.29% 7.18% 44.76% 14.39% 18.15% 1.99%
2003 6,348 8,240 8.13% 1.14% 10.23% 41.20% 20.83% 16.83% 1.64%
Indonesia 1993 7,168 2,396
9.48%
23.51% 4.54% 4.45% 18.83% 24.51% 18.23% 5.94%
2000 10,407 2,623 14.30% 1.43% 6.39% 31.46% 20.31% 22.41% 3.70%
Pakistan 1991 4,799 1,656
11.30%
10.82% 11.78% 4.08% 40.15% 28.03% 4.29% 0.85%
2001 15,788 1,843 13.25% 8.19% 6.33% 38.91% 14.00% 13.86% 5.46%
Bulgaria 1995 2,466 6,851
11.87%
13.02% 8.34% 13.21% 24.32% 2.34% 37.05% 1.72%
2001 2,624 7,664 1.77% 5.13% 1.95% 33.05% 2.79% 54.22% 1.09%
Ghana
1992 4,552 937 48.13% 1.83% 2.04% 16.14% 23.35% 7.91% 0.59%
1998 5,998 1,033 13.59% 43.95% 3.73% 1.46% 13.74% 24.94% 11.62% 0.57%
2005 8,564 1,208
35.05% 2.04% 1.83% 17.17% 32.45% 11.12% 0.33%
Bangladesh 2000 7,440 970
20.06%
10.78% 1.72% 14.44% 27.92% 19.56% 12.42% 13.17%
2005 10,069 1,165 13.48% 6.48% 12.03% 30.13% 17.04% 8.07% 12.76%
Tajikistan 2003 4,148 1,250
33.89%
25.66% 13.79% 11.35% 23.48% 1.61% 23.73% 0.38%
2007 4,855 1,674 49.04% 8.72% 4.09% 25.60% 1.83% 9.85% 0.87%

- 15 -
Table 5 (continued)
Group II Group III
(1) + (2) + (3)
(4) + (5) + (6)
+ (7) (1) + (2) (4) + (5) (6) + (7)
(3) + (4) + (5) +
(6) + (7)
Number of
observations
Per Capita
GDP, PPP
2005 USD
GDP
growth rate Agricultural
total
Non-
Agricultural
Total
On-Farm
Total
Non-farm
total
Transfers &
Other Off-farm Total
Madagascar 1993 4,467 917
1.31%
52.6% 47.37% 47.92% 36.55% 10.82% 52.08%
2001 5,047 929 42.5% 57.5% 37.8% 47.1% 10.44% 62.19%
Ecuador 1995 5,732 5,568
3.56%
24.9% 75.15% 13.94% 59.99% 15.15% 86.06%
1998 5,801 5,766 26.5% 73.5% 15.2% 60.3% 13.15% 84.76%
Guatemala 2000 7,266 3,960
5.45%
33.5% 66.51% 20.26% 49.48% 17.03% 79.74%
2006 13,682 4,176 27.8% 72.2% 15.5% 54.3% 17.95% 84.54%
Panama 1997 4,938 7,528
9.46%
20.7% 79.29% 13.52% 59.15% 20.14% 86.48%
2003 6,348 8,240 19.5% 80.5% 9.3% 62.0% 18.47% 90.72%
Indonesia 1993 7,168 2,396
9.48%
32.5% 67.50% 28.05% 43.34% 24.17% 71.95%
2000 10,407 2,623 22.1% 77.9% 15.7% 51.8% 26.11% 84.27%
Pakistan 1991 4,799 1,656
11.30%
26.7% 73.32% 22.60% 68.18% 5.14% 77.40%
2001 15,788 1,843 27.8% 72.2% 21.4% 52.9% 19.32% 78.57%
Bulgaria 1995 2,466 6,851
11.87%
34.6% 65.43% 21.36% 26.66% 38.77% 78.64%
2001 2,624 7,664 8.9% 91.1% 6.9% 35.8% 55.31% 93.10%
Ghana
1992 4,552 937
13.59%
52.0% 48.0% 50.0% 39.5% 8.5% 50.0%
1998 5,998 1,033 49.1% 50.9% 47.7% 38.7% 12.2% 52.3%
2005 8,564 1,208 38.9% 61.1% 37.1% 49.6% 11.5% 62.9%
Bangladesh 2000 7,440 970
20.06%
26.9% 73.06% 12.49% 47.48% 25.59% 87.51%
2005 10,069 1,165 32.0% 68.0% 20.0% 47.2% 20.83% 80.04%
Tajikistan 2003 4,148 1,250
33.89%
50.8% 49.20% 39.45% 25.09% 24.11% 60.55%
2007 4,855 1,674 61.9% 38.1% 57.8% 27.4% 10.72% 42.24%

- 16 -
Table 6
Per Capita
GDP, PPP 2005
USD
GDP Growth
Rate
Diverse Income
Portfolio
Principal Household Income Source (>=75% of Total Income)
Number of
observations Ag Wage
Nonag
Wage
Self
Emp Transfers Other Farm
Madagascar 1993 4,467 917
1.31%
31.01% 1.07% 14.06% 11.24% 2.96% 0.40% 39.27%
2001 5,047 929 3.27% 4.42% 31.33% 15.89% 6.00% 1.07% 38.02%
Ecuador 1995 5,732 5,568
3.56%
37.19% 6.51% 27.48% 15.18% 4.05% 1.62% 7.97%
1998 5,801 5,766 28.51% 7.17% 26.21% 18.18% 2.65% 5.58% 11.69%
Guatemala 2000 7,266 3,960
5.45%
46.94% 5.93% 24.04% 8.40% 5.44% 0.26% 8.99%
2006 13,682 4,176 45.72% 6.36% 27.41% 7.58% 6.92% 0.34% 5.67%
Panama 1997 4,938 7,528
9.46%
38.14% 4.03% 37.63% 5.78% 8.55% 0.59% 5.29%
2003 6,348 8,240 38.26% 6.32% 32.61% 10.84% 8.98% 0.36% 2.63%
Indonesia 1993 7,168 2,396
9.48%
22.34% 3.50% 15.40% 19.31% 13.31% 3.49% 22.66%
2000 10,407 2,623 37.70% 3.83% 23.59% 12.73% 11.68% 1.11% 9.35%
Pakistan 1991 4,799 1,656
11.30%
19.62% 2.11% 32.89% 22.31% 1.75% 0.17% 21.15%
2001 15,788 1,843 30.70% 4.05% 29.75% 9.99% 8.55% 2.22% 14.73%
Bulgaria 1995 2,466 6,851
11.87%
49.64% 6.65% 14.88% 1.87% 21.33% 0.20% 5.43%
2001 2,624 7,664 30.72% 0.84% 23.70% 2.52% 40.66% 0.15% 1.41%
Ghana
1992 4,552 937
13.59%
22.33% 1.32% 11.96% 17.52% 4.45% 0.18% 42.24%
1998 5,998 1,033 23.71% 0.81% 10.19% 19.10% 6.13% 0.17% 39.89%
2005 8,564 1,208 21.78% 1.24% 13.85% 25.68% 6.90% 0.06% 30.50%
Bangladesh 2000 7,440 970
20.06%
48.49% 7.89% 19.08% 13.39% 4.76% 1.95% 4.45%
2005 10,069 1,165 46.66% 6.66% 22.20% 11.50% 3.34% 2.04% 7.61%
Tajikistan 2003 4,148 1,250
33.89%
47.44% 6.32% 14.73% 0.96% 11.91% 0.12% 21.55%
2007 4,855 1,674 46.63% 0.43% 11.08% 0.64% 3.21% 0.27% 37.73%


